Embed Size (px)
Citation preview

UNIVERSITY OF VAASA
FACULTY OF TECHNOLOGY
ELECTRICAL AND ENERGY ENGINEERING
Toni Hyytinen
HYBRID POWER GENERATION CONCEPT FOR SMALL GRIDS
Master’s Thesis for the degree of Master of Science in Technology submitted forinspection, Vaasa, 10.04.2013.
Supervisor Professor Timo Vekara
Instructor Niklas Wägar
Evaluator Professor Kimmo Kauhaniemi

2
PREFACE
This thesis is made for Wärtsilä Finland Oy with the intention of investigating in the
feasibility of adding renewable power generation to combustion engine power plants
and making it a profitable hybrid power system.
I would like to thank my instructor Mr. Niklas Wägar for finding this subject for me and
for supporting me throughout all my time working in Wärtsilä. The thesis subject could
not have been more interesting, due to my savour for renewable energy technique and
the incremental focus in it nowadays. My gratitude for Mr. Jyrki Leino as well for help-
ing me simulate the results and Professor Timo Vekara for the supervision of this thesis.
I found working in Wärtsilä very pleasant but meanwhile comfortably challenging.
I would also like to thank my family and friends for all the support I received during my
time as a student in University of Vaasa.
Vaasa, 10.04.2013
Toni Hyytinen

3
TABLE OF CONTENTS
PREFACE 2
SYMBOLS AND ABBREVIATIONS 5
ABSTRACT 7
TIIVISTELMÄ 8
1 INTRODUCTION 9
2 WÄRTSILÄ POWER PLANTS 112.1 Composition of power plant 112.2 Engine types 13
2.2.1 Gas engines 152.2.2 Liquid fuel engines 15
2.3 Driving the engine 152.4 Advantages of combustion engines 17
2.4.1 Fast start-up 182.4.2 Inertia and its contribution to the system 19
2.5 Modularization 20
3 CHALLENGES WITH POWER GENERATION ON ISLANDS 223.1 Power on islands 223.2 Switching from oil to gas 233.3 Power quality 24
3.3.1 Voltage issues 253.3.2 Frequency variations 253.3.3 Reactive power 263.3.4 Grid codes for wind and solar power 27
4 HYBRID POWER PLANTS 294.1 Wind power 29
4.1.1 Different wind power turbines 304.1.2 Wind power production 31
4.2 Solar power 334.2.1 Photovoltaics 344.2.2 Concentrating solar power 36
4.3 Structure of hybrid power plant 374.4 Electrical components for hybrid power plant 37
4.4.1 Inverters 384.4.2 AC, DC or AC/DC bus 394.4.3 Other components 40
4.5 Control and automation system 434.6 Energy storage systems 44
4.6.1 Batteries 454.6.2 Thermal storage 47

4
4.6.3 Flywheels 48
5 WÄRTSILÄ HYBRID GENERATION CONCEPTS 495.1 Choosing the hybrid concept 49
5.1.1 Optimal Wärtsilä power plant setup 495.1.2 Choosing between solar and wind power 515.1.3 Ideal share of renewable energy 52
5.2 Power plant own consumption 535.2.1 Preheating of engine and fuel tank 545.2.2 Radiator cooling and ventilation 545.2.3 Electricity for automation and cooling 55
5.3 Storage system 55
6 CONCEPT EXAMPLES 576.1 Calculations with PLEXOS® 57
6.1.1 Features in PLEXOS® 586.1.2 Inputs 596.1.3 Short term run 61
6.2 Results 636.2.1 Payback time 676.2.2 Ideal set-up 71
6.3 CSP trough system for minimising own consumption 736.3.1 Calculations of energy consumption and investment in a CSP system 766.3.2 Results 76
7 DISCUSSION 78
8 SUMMARY 81
LIST OF REFERENCES 84
APPENDICES 91Appendix 1. Wind speed data for one week in Aruba. 91Appendix 2. Monthly average solar power generation data in MW with
15 min intervals. 96

5
SYMBOLS AND ABBREVIATIONS
Symbols
A
Cp
D
HI
I0
IL
J
Thermal voltage timing completion factorAir density
Angular speedArea
Heat capacityThermal diffusivity
Inertia constantCurrent
Saturation currentLight current
InertiaP
RS
U
Power
Series resistanceOutput voltage
V Speed
Abbreviations
AC
AVRBOS
CAPEXCRO
CSPDFIG
Alternative current
Automatic voltage regulationBalance of system
Capital expendituresCrude oil
Concentrated solar powerDouble-fed induction generator
DCEMC
Direct currentElectromagnetic compatibility
6
FITFWE
GTOHFO
HVAC
Feed-in tariffFuel-water emulsion
Gate turn-off thyristorHeavy fuel oil
High voltage alternative currentIGBT
LBFLFO
LNG
Insulated gate-bipolar transistor
Liquid bio fuelLight fuel oil
Liquefied natural gasMPPT Maximum power point trackerOPEX
PLCPMSG
PVPWM
SVCTHD
VARVSC
WISEWOIS
WTG
Operational expenditures
Programmable logic controllerPermanent magnet synchronous generator
PhotovoltaicPulse width modulation
Static VAR compensatorTotal harmonic distortion
Volt ampere reactiveVoltage source controller
Wärtsilä Information System EnvironmentWärtsilä Operator Interface System
Wind turbine generator

7
UNIVERSITY OF VAASAFaculty of technologyAuthor: Toni HyytinenTopic of the Thesis: Hybrid power generation concept for small gridsSupervisor: Professor Timo VekaraInstructor: Niklas WägarEvaluator: Professor Kimmo KauhaniemiDegree: Master of Science in TechnologyMajor of Subject: Electrical EngineeringYear of Entering the University: 2006Year of Completing the Thesis: 2013 Pages: 97
ABSTRACT
The increasing power consumption and the targets of emissions reduction in the worldhas lead to further investigations in utilizing renewable energy sources. However, fluc-tuations in the power generation with renewables occur. Therefore, it is important thatthe power supply for the grid is reliable in order to avoid shortage of supply.
The aim of this thesis is to study the feasibility of constructing a hybrid power plantconsisting of solar and wind power combined with liquid or gas fuelled combustion en-gines for a small grid. Due to the restriction of small grids, islands and off-grid sites,especially industrial sites, create a perfect location for this hybrid power generationconcept. Also, the good weather conditions on islands, especially in the sun-belt areaincrease the profitability of investing in hybrid power plants. The own consumption ofexisting power plants is also studied and by adding a CSP system that generates hot wa-ter for engine and fuel tank pre-heating, especially for power plants in stand-by modelocating in sunny areas, the efficiency is improved.
The fast starting and load following combustion engines are perfectly fitting togetherwith the fluctuating renewable power generation and thus the stored fuel will work asstorage system, responding to power demand very fast.
The main results of this thesis origins from the simulations of the hybrid power plantwith both liquid fuel combustion engines and solar and wind power. The proper share ofrenewable power generation and power generated by engines at a particular time areshown. Payback time calculations for ideal hybrid power generation concepts and forthe CSP system for minimizing own consumption are made as well. The results showthat hybrid power plants on islands and off-grid solutions are extremely cost-effective,with a payback time of only six years. Thus, investment in hybrid power plants is rec-ommended.
KEYWORDS: Hybrid power plant, renewable energy, island power generation system
8
VAASAN YLIOPISTOTeknillinen tiedekuntaTekijä: Toni HyytinenDiplomityön nimi: Hybrid power generation concept for small gridsValvoja: Professori Timo VekaraOhjaaja: Niklas WägarTarkastaja: Professori Kimmo KauhaniemiTutkinto: Diplomi-insinööriOppiaine: SähkötekniikkaOpintojen aloitusvuosi: 2006Diplomityön valmistumisvuosi: 2013 Sivumäärä: 97
TIIVISTELMÄ
Lisääntyneen sähköntarpeen ja tiukkojen päästövaatimusten takia on uusiutuvien ener-giamuotojen hyödyntämistä tutkittu yhä enenevissä määrin. Uusiutuvien energiajärjes-telmien sähköntuotannon heilahtelut saattavat aiheuttavaa vajauksen kuorman sähkön-saantiin, sekä mahdollisesti ongelmia sähkön laadussa. Tämän takia on erittäin tärkeääpitää tehontuotto luotettavana, varsinkin saarekkeina toimivissa järjestelmissä.
Tämän työn tarkoituksena on tarkastella mahdollisuuksia rakentaa pienverkkoon hybri-divoimalaitos, joka koostuu aurinkopaneeleista ja tuuliturbiineista yhdistettynä neste- taikaasukäyttöisiin polttomoottoreihin. Työn rajoittaminen pienverkkoihin tuo esiin mah-dolliset sijoituskohteet hybridivoimalaitokselle saarilla tai saarekejärjestelmissä, esi-merkiksi kaivosalueilla. Myös hyvät sääolosuhteet saarilla, varsinkin päiväntasaajanalueella lisäävät kannattavuutta sijoittaa hybridivoimalaitokseen. Olemassa olevienvoimalaitosten omaa kulutusta on myös tutkittu, ja lisäämällä aurinkokeräinjärjestelmäjoka tuottaa kuumaa vettä moottoreiden sekä polttoainesäiliöiden esilämmitykseen, pa-rantaa varsinkin aurinkoisilla alueilla sijaitsevien valmiustilassa olevien voimalaitostenhyötysuhdetta entisestään.
Nopeasti käynnistyvät ja hyvin kuorman muutoksiin reagoivat polttomoottorit sopivaterinomaisesti käytettäväksi uusiutuvien energiajärjestelmien kanssa, jolloin varastossaoleva polttoaine toimii energiavarastona, vastaten uusiutuvien aiheuttamien sähkön tuo-tannon vaihteluihin erittäin nopeasti.
Työn tärkeimmät tulokset tulevat ideaalisen hybridivoimalaitoksen simuloinneista. Au-rinko- ja tuulivoiman sopiva suhde nestekäyttöisten polttomoottoreiden rinnalle jamoottoreiden tehontuotto tiettynä ajanhetkenä on esitetty. Myös hybridivoimalaitoksenuusiutuvien energiajärjestelmien sekä omaa kulutusta vähentävän aurinkokeräinjärjes-telmän takaisinmaksuajat on laskettu. Tulokseksi saatu vajaan kuuden vuoden takaisin-maksuaika osoittaa että hybridivoimalat ovat erittäin kustannustehokkaita, varsinkinsaarilla tai saarekkeina toimivissa järjestelmissä. Täten hybridivoimaloihin sijoittamistavoidaan pitää suositeltavana.
AVAINSANAT: Hybridivoimalaitos, uusiutuva energia, saarekejärjestelmä

9
1 INTRODUCTION
Energy consumption in the world has grown year by year and is still increasing. Mean-
while, the human race has understood the importance of cutting down pollutions and
therefore the utilization of renewable energy sources is improving in emission reduc-
tion. The power supply of renewable energy sources can though be lacking at some
moments. Due to that, the Wärtsilä hybrid power generation concept includes combus-
tion engines to improve the reliability and also an amount of renewable generation to
cut down the emissions and increase the use of advantageous energy. Especially on is-
lands the usage of renewable energy sources should be utilized not only because of
good weather conditions, but also because of the increasing fuel costs and an expensive
interconnection to mainland trough an electricity cable connection.
This thesis studies the profitability of Wärtsilä hybrid power generation concepts. Both
solar and wind power are considered in a proper share with liquid or gas fuelled en-
gines. The study not only shows an ideal share of renewable energy for reducing the
emissions, but also the profitability in decreasing a part of the power plants own con-
sumption by adding renewables that generate e.g. warm water for engine and fuel tank
pre-heating for power plants in stand-by mode. The importance of Wärtsilä combustion
engine is shown especially in the true flexibility. In power plants the engines can oper-
ate in base load, stand-by or peak load mode, as well as on back-up power basis.
For island energy operators, one of the main challenges is to switch to an environmen-
tally sustainable energy production while ensuring a reliable, safe and economically vi-
able production of electricity (EurElectric 2012). A perfect location for concepts like
this is on islands, and due to the fact that most of the isolated small grid customers are
from the sun-belt countries, the weather conditions and restricted grid size (less than
300 MW) support renewable power generation. Thus, the solar power has shown to be
an efficient and suitable option, together with wind power. Therefore, the major empha-
sis in this thesis is made upon solar power, both concentrated solar power (CSP) mainly
for engine preheating systems and photovoltaics (PV), as well as wind power.

10
The first chapter of this thesis deals with the Wärtsilä power plant. A general overview
through the composition, different kinds of combustion engines, starting, operation, and
finally some technical aspects are discussed. Chapter 3 presents challenges with power
generation on islands as well as power quality issues. Chapter 4 gives a review of hy-
brid power plants’ structure and different components. Also, wind and solar power gen-
eration and different storage systems are presented. The 5th chapter deals with the main
subject, the hybrid power generation concept with Wärtsilä combustion engines. The
optimal base-load power plant and the ideal amount of renewable energy are calculated,
with the emphasis in keeping the costs in minimum and the grid reliable. Also, calcula-
tions of a possible energy storage system will be made. A review of power plants’ own
electricity consumption and minimization of it by utilising renewable energy sources is
done as well. Chapter 6 presents calculations and concept examples for some ideal hy-
brid concepts. The payback times with different share of renewable penetration besides
combustion engine power output at four different locations are calculated.
The aim of this thesis is to calculate and design the ideal share of renewable energy in a
hybrid power plant combined with Wärtsilä combustion engines for off-grid or small
grid (10–300 MW) solutions. The payback times for different set-ups and scenarios are
calculated as well. Also, calculations for minimization of the power plant’s own con-
sumption with renewable energy and thus making it more efficient, are presented. This
thesis is limited to small power plants (less than 100 MW) and does not consider the
influence of subsidies, such as feed-in tariffs (FIT) or others.

11
2 WÄRTSILÄ POWER PLANTS
Wärtsilä power plants is a leading global supplier of highly efficient and modern power
plants. With multi-engine and multi-fuel solutions and different load applications it can
supply power on a range of 1 MW to over 500 MW, despite the location. Long-term op-
eration and maintenance agreements are available for every customer. Effective, flexible
and sustainable power systems are what Wärtsilä is producing nowadays.
The flexibility can be honoured due to the multiple operating modes, such as for exam-
ple:
Rapid load following at all times,
Peaking during high demand periods,
System balancing (fast frequency regulation), and
Fast grid black start in case of power system black out.
Experience is highly valuated in the eyes of a customer. Wärtsilä has provided almost
49 GW of installed capacity in 169 countries until 2011. (Wärtsilä 2012a)
2.1 Composition of power plant
The Wärtsilä combustion engine power plant consists of several medium speed (500 -
1000 rpm) gas or liquid fuel engines installed in parallel. Wärtsilä also provides other
power plants, e.g. for oil and gas industries, floating power plants and pumping applica-
tions.
Figure 1 shows a typical single line diagram with the voltage levels of a Wärtsilä power
plant. The generating sets are coupled to the medium voltage switchgear, whose AC
voltage level is 1 - 35 kV. The low voltage (400 V) switchgear is connected via a trans-
former to the medium voltage switchgear. If necessary there is also a high voltage
switchgear for high voltage grid connections, coupled to the medium voltage bus bar via
a transformer.

12
Figure 1. Wärtsilä power plant voltage levels. (Wägar 2012)
The maximum amount of generators coupled in parallel depends on the short circuit
current of the switchgear. For example, this system with a voltage level of 13.8 kV and
a frequency of 60 Hz, has a short circuit current of 50 kA. (Wägar 2012)
The automation system of the power plant can be divided into three main categories:
control, protection and supervision. Controls for the power plant are:
Engine fuel control (speed and active power),
Generator excitation control (voltage and reactive power), and
Process control.
Protection is supervising that the system is working properly. The breaker will trip and
shut down the engine if the protection finds something abnormal. Supervision, on the
other hand, gives operators information about the protection systems and the control
status. Basically it supervises the whole plant status.

13
The operational flexibility can be described by the different automation functions. It
supports reliably in all different kinds of operating modes. Thanks to the intelligent con-
trollers, the solution provides an automatic, seamless transfer between the operating
modes, e.g. true kW and power factor control, load sharing for both active and reactive
power, for island mode operation and droop mode as backup. The automation in Wärt-
silä power plants are based on the following blocks:
WOIS, the operator’s workstation for process displays, controls, alarms etc.,
WISE, the workstation for logbooks and electronic documentation,
PLC, the process control system of the plant equipment, and
UNIC, the engine embedded control system of the engine and protection.
Remote control of the system and viewing the information from WOIS and WISE is al-
so possible for the customer and technical support. All the functions have been devel-
oped and are continuously under development to be as easy and clear as possible for the
user. (Wärtsilä 2012b)
2.2 Engine types
Wärtsilä’s engine portfolio for power plants consists of medium speed, four-stroke en-
gines. Wärtsilä’s engines can be operated on a broad variety of fuels: heavy fuel oil,
light fuel oil, crude oil, emulsified fuels, bio-oil, biodiesel, natural gas, and associated
gas. In a power plant the power output range can be from 1 MW to over 500 MW, larger
power plants consisting of more than 20 engines. The single engine power output lies
between 1 MW and 23 MW. The model name of a Wärtsilä engine expresses the num-
ber of cylinders and the cylinder bore in centimetres and the letters for the type of fuel
usage, i.e. a Wärtsilä 20V34SG is a 20 cylinder gas engine with a cylinder bore of
340 mm. Engines with the amount of cylinders from 6 to 9 have the cylinders arranged
in-line, while engines with more than 9 cylinders are of the V-type.

14
Figure 2 illustrates different Wärtsilä combustion engine models. You may also find the
possible power output range of power plants with the different types of engines. They
are divided into three groups depending on the fuel type. Gas engines use gaseous fuel
of different quality. Liquid fuel engines may use a variety of different fuels, such as
Light fuel oil (LFO), Heavy fuel oil (HFO), Crude oil (CRO), Fuel-water emulsion
(FWE) or Liquid bio fuel (LBF). The dual-fuel engines, however, as the name says,
may be used with either gaseous or liquid fuel. They have two different injection sys-
tems and the fuel type can be changed automatically and instantaneously at any load.
They can also be driven in fuel sharing mode, meaning simultaneously with both gase-
ous fuel and liquid fuel. (Wärtsilä 2012b)
Figure 2. Output power range of the different Wärtsilä combustion engines in a
power plant. (Wärtsilä 2012b)

15
2.2.1 Gas engines
The Wärtsilä SG engines are spark-ignited lean-burn otto cycle engines that run on gas-
eous fuel. The gaseous fuels can be divided according to quality. Liquefied natural gas
(LNG) is the commercial pipeline gas. Other gaseous fuels are: biogas, associated gas
and coal bed natural gas. These gases are not of as good quality as LNG. In SG engines
the gas is mixed with air before the inlet valves. The gas-air mixture is then also fed into
a small prechamber, besides the cylinder. The gas-air mixture in the prechamber is first
ignited and the flames from its nozzle ignite the fuel in the cylinder. The efficiency in
gas engines can be up to 48 %.
2.2.2 Liquid fuel engines
The liquid fuel engines run on many different fuel types as mentioned in Section 2.2.
The most common are LFO and HFO. After the engine is started with air the fuel is in-
jected to the cylinder at a high pressure by camshaft-operated pumps and the fuel is in-
stantly ignited. The liquid fuel engines have been developed and are being developed all
the time to be as efficient as possible. For example the “miller timing” reduces the work
of compression and the temperature in the engine, which makes it more efficient and
less polluting. (Wärtsilä 2012b)
2.3 Driving the engine
Before starting a Wärtsilä engine it should be preheated into 70 degrees in Celsius with
hot water, if the fastest start-up time is desired. A preheated engine can be loaded ac-
cording to the nominal loading performance, without straining the engine and hereby
keeping its lifetime normal. The preheating of an engine requires a lot of power espe-
cially when several engines have to be preheated.
When starting the Wärtsilä engine, compressed air is injected directly into the cylinders.
That will rotate the engine and start it. Also, a pneumatically driven starting motor can
be used in some cases. The start-up times depend not only on the fuel type, but also on

16
the engine size. After the pre-start-up procedures are done, the engine is rotated and ac-
celerated to 5 % of the nominal speed. The fuel injection is activated after 5 seconds and
the engine accelerates to its nominal speed. When the engine has reached its nominal
speed, the generator is synchronized to the grid, and the loading of the engine can be
started. When loading the engine, it has to be made gradually to keep the engine parts,
especially the pistons without strain. Stepwise load application is also possible, but the
load step has to be limited. Excessive load steps lead to a big drop in frequency. The
maximum frequency drop allowed by the engine is 10 %, which however is unaccepta-
ble in most electricity grids.
The Wärtsilä combustion engine using gaseous fuel is able to drive a minimum load as
low as 30 % of its maximum power output. The liquid fuelled combustion engine, how-
ever, is able to drive a minimum load of 10 % of its maximum power output, although
only 60 - 70 % of the time. Another thing worth mentioning is that the Wärtsilä engine
power plants usually consist of several engine sets, which mean that depending on the
load, only the optimal amount of engines are generating power. (Nyman 2008: 17 - 18)
Figure 3 shows the differences in the efficiency of one or several Wärtsilä combustion
engines using gaseous fuel and a gas turbine depending on the power plant total power
output. It is also worth notifying from the figure that the total efficiency increases with
several generating sets compared to just one.

17
Figure 3. Electrical efficiency for combustion engines and a gas turbine. (Wägar,
Östman,Wideskog, Linde 2012)
2.4 Advantages of combustion engines
The aspects of combustion engines often cited are that they are polluting, of old tech-
nology, slow etc. But actually according to researches it has been found out that a com-
bustion engine has good flexibility, high efficiency and when connected to the grid,
makes the power production more reliable. It also has a very fast start-up as well as stop
and relatively low equipment costs.
Beneath some of the benefits of both gas and liquid fuel engines are listed:
Excellent plant availability and reduced need for backup capacity due to multi-
unit installation,
High part-load efficiency,
Net plant electrical efficiency of 44 - 48 %,
Fast start-up, 5 minutes from hot standby to full plant load, and
Maintenance schedule independent of the number of starts or stops. (Wärtsilä
2012b)
18
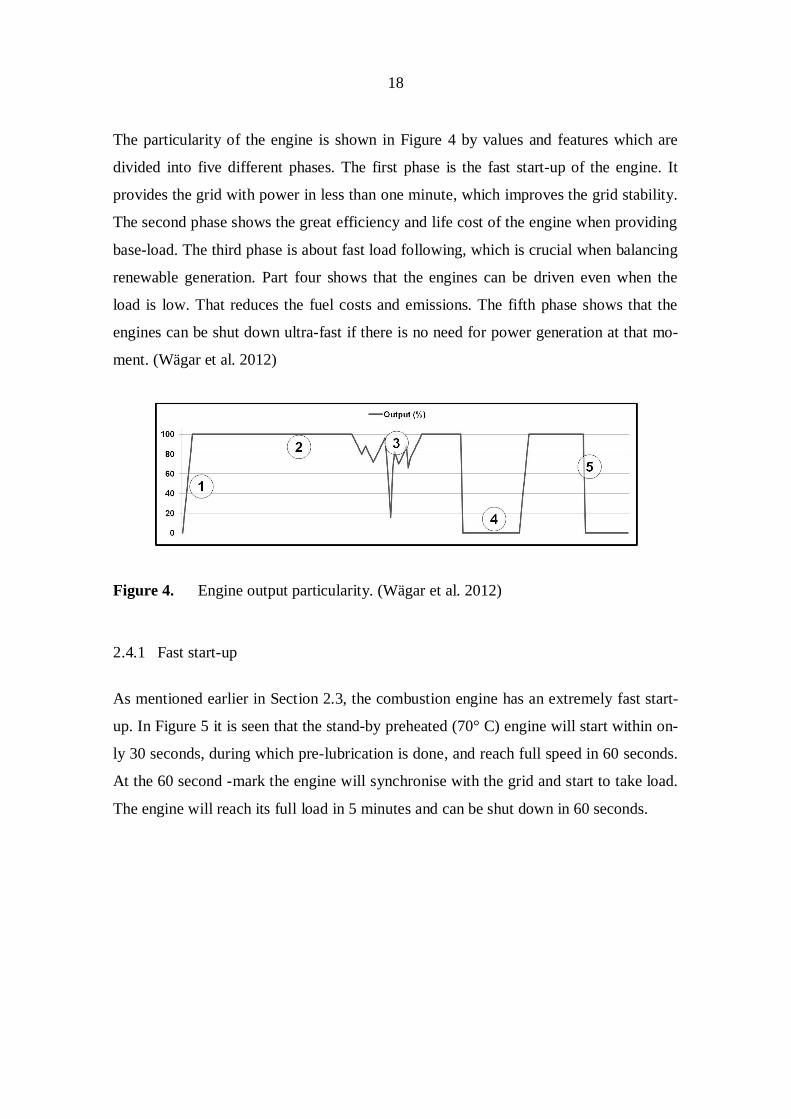
The particularity of the engine is shown in Figure 4 by values and features which are
divided into five different phases. The first phase is the fast start-up of the engine. It
provides the grid with power in less than one minute, which improves the grid stability.
The second phase shows the great efficiency and life cost of the engine when providing
base-load. The third phase is about fast load following, which is crucial when balancing
renewable generation. Part four shows that the engines can be driven even when the
load is low. That reduces the fuel costs and emissions. The fifth phase shows that the
engines can be shut down ultra-fast if there is no need for power generation at that mo-
ment. (Wägar et al. 2012)
Figure 4. Engine output particularity. (Wägar et al. 2012)
2.4.1 Fast start-up
As mentioned earlier in Section 2.3, the combustion engine has an extremely fast start-
up. In Figure 5 it is seen that the stand-by preheated (70° C) engine will start within on-
ly 30 seconds, during which pre-lubrication is done, and reach full speed in 60 seconds.
At the 60 second -mark the engine will synchronise with the grid and start to take load.
The engine will reach its full load in 5 minutes and can be shut down in 60 seconds.

19
Figure 5. Start-up, loading and unloading time of a Wärtsilä combustion engine.
(Wägar et al. 2012)
2.4.2 Inertia and its contribution to the system
When speaking of inertia and its contribution to the power demand in the grid, it is men-
tioned as an important part of keeping the frequency on an allowed level. The stored
energy, in the rotational mass of large spinning machines, gets released to the grid when
a disturbance occurs or power is needed. (Leslie Bryans & Alan Kennedy 2007)
The inertia constant, H, can be given by the formula
= , (1)
where J and m represents the engine’s inertia and angular speed, and P is the power of
the engine. (Ackermann 2005)

20
Comparing to a gas turbine, the inertia is relatively low for a combustion engine. Ac-
cording to a study, increasing the share of combustion engines does reduce the inertia,
which could lead to a faster frequency drop. However, because of the speed of the en-
gines under study, this is compensated by the speed of primary response of these en-
gines. It is considered as an extreme advantage of the combustion engines, since the fre-
quency droop coverage and the fast reaction to the power demand are key parts of grid
stability. Figure 6 presents a simulated situation of a frequency drop and the coverage
with different share of combustion engines in a high wind power system. You may see
that the frequency recovery is faster with a larger share of engines, and it also does not
fall as low as in a system with a smaller share of engines. (KEMA 2012: 34)
Figure 6. The frequency drops in a system with different share of engines and high
wind penetration during a trip. (KEMA 2012: 26)
2.5 Modularization
When constructing a Wärtsilä power plant nowadays, it is much easier than decades
ago, since it is made of prefabricated modules which are mounted together at the power
plant site. The module portfolio consists of several module types for every option. Rap-
id installation time is one of the main advantages of modularization, which means a re-

21
duction in overall cost of the assembly for the customer. Prefabrication also ensures
high quality products, easier shipping in containers and a more accurate price at sales
stage. The modules are most often installed around the engines, inside the power house.
However, modules can be installed outside also, e.g. at fuel process. Figure 7 illustrates
the gas engine modularization blocks with mounted generating sets. The easiness of
mounting these modules can be noticed of the organised setup, instead of building eve-
rything from scratch at the site. (Wärtsilä 2012b)
Figure 7. Wärtsilä modularisation blocks with full generating sets mounted. (Wärt-
silä 2012b)

22
3 CHALLENGES WITH POWER GENERATION ON ISLANDS
The electricity demand in the world is increasing and meanwhile pollution should be
decreased. On islands the biggest challenge is definitely the transportation of fuel and
also the small land area available for big storage tanks. Therefore, utilizing local renew-
able energy sources in a larger extent would be a great leap forward in solving the prob-
lems. The sun is radiating energy to the surface of the earth every day. Windy days also
create an opportunity to harvest energy for usage. Besides, power plants based on re-
newables are practically free of pollution during the operation time. The islands re-
viewed in this Chapter are mainly located in Europe.
3.1 Power on islands
Emission reduction on islands is a challenge, because islands often produce most of the
power with liquid fossil fuels. The Industrial Emissions Directive’s (IED) requirements
of reducing emissions will make it difficult and costly for the islands. The challenge is
to make the energy production less polluting, while keeping the grids safe and reliable.
The target for RES 2020 is set to reduce 20 % of the greenhouse gases meanwhile add-
ing 20 % renewable energy. Installing renewable energy sources on islands is more
challenging than on mainland grids. Some of the challenges are:
Relative plant size (a 3 MW power plant produces 3 % in a 100 MW grid),
Sufficient back-up power needed,
Storage, and
Frequency and voltage regulation.
Due to increasing energy consumption, increasing fuel price, long distances and re-
quired space for fuel storage, the renewable energy production has become a good
choice for islands. By combining with flexible generation, smart grids and switching old
oil power plants to newer and more efficient ones or to gas power plants, the require-
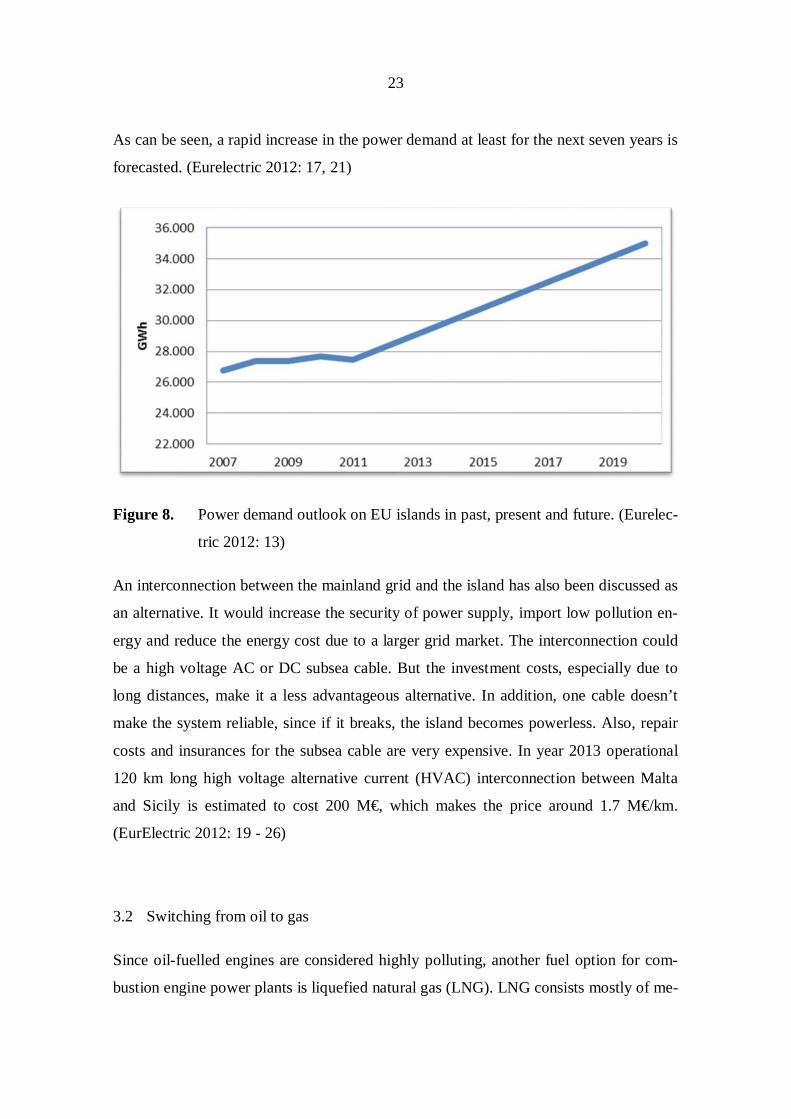
ments can be achieved. In Figure 8 the power demand outlook on EU islands is shown.
23
As can be seen, a rapid increase in the power demand at least for the next seven years is
forecasted. (Eurelectric 2012: 17, 21)
Figure 8. Power demand outlook on EU islands in past, present and future. (Eurelec-
tric 2012: 13)
An interconnection between the mainland grid and the island has also been discussed as
an alternative. It would increase the security of power supply, import low pollution en-
ergy and reduce the energy cost due to a larger grid market. The interconnection could
be a high voltage AC or DC subsea cable. But the investment costs, especially due to
long distances, make it a less advantageous alternative. In addition, one cable doesn’t
make the system reliable, since if it breaks, the island becomes powerless. Also, repair
costs and insurances for the subsea cable are very expensive. In year 2013 operational
120 km long high voltage alternative current (HVAC) interconnection between Malta
and Sicily is estimated to cost 200 M€, which makes the price around 1.7 M€/km.
(EurElectric 2012: 19 - 26)
3.2 Switching from oil to gas
Since oil-fuelled engines are considered highly polluting, another fuel option for com-
bustion engine power plants is liquefied natural gas (LNG). LNG consists mostly of me-

24
thane that has been liquefied by cooling it down to -163 degrees in Celsius. Since me-
thane has the lowest carbon ratio (75 % of weight) of all fossil fuels, it is considered as
a good replacement for oil. The carbon ratio for heavy fuel is around 87 % of its weight.
When natural gas is liquefied it takes only 1/600 of space compared to it in gaseous
form. The space-saving method simplifies transportation a lot and therefore makes it an
even better fuel for power generation. When allowing it to warm, it evaporates and re-
turns into gaseous form. A major problem with switching oil power plants to natural gas
on small islands is the space required for storage tanks and also the difficulties in trans-
portation of small amounts. Moreover, the high cost of LNG re-liquefaction facilities,
has made it inefficient to build them due to the small power generation. Therefore, other
options are seemed as better choices for small power demand on islands, e.g. renewable
energy. Even though the overall role of oil is decreasing, several islands are still plan-
ning or constructing new diesel-fuelled generation units to either increase overall gener-
ation capacity or to replace ageing plants with more fuel-efficient and less polluting en-
gines. Also, diesel is considered by many as an important back-up fuel for balancing
renewable energy generation. (EurElectric 2012: 19 - 26)
3.3 Power quality
The power quality is to be considered affected when connecting renewable energy
sources to the grid. The grid-connected systems have to provide so-called ancillary ser-
vices like stabilising the grid voltage, providing reactive power, active filtering of har-
monics or fault ride-through in case of voltage dips. All of the inverters must be able to
provide reactive power if the grid voltage needs stabilization. The five major issues ac-
cording to Mohod & Aware (2006) are:
Voltage fluctuation on grid,
Switching operation of wind turbine on grid,
Voltage dips on grid,
Reactive power, and
Harmonics.

25
Injection of wind power in the grid affects the voltage quality. In the IEC61400-21 the
power quality of wind is defined as: active and reactive power capabilities and control,
response to voltage dips and emission of voltage and flicker. Operation of the start-up at
cut-in wind speed and rated wind speed may cause significant voltage variations. The
wind turbines with frequency converters can either supply or consume reactive power
according to needs. (Ackermann 2005: 160 - 165)
3.3.1 Voltage issues
Voltage issues, such as voltage fluctuations and flicker can be caused by wind turbines,
but normally it is changes in the load that induce the voltage fluctuations. Another prob-
lem is the voltage dips. They are defined as a temporary reduction of the voltage to a
value less than 90 % of the nominal voltage, followed by a voltage recovery after 10 ms
to 1 min.
The total harmonic distortion (THD) should be according to EN50160 less than 8 % of
the voltage. Thyristor-based converters often emit harmonic currents that may influence
the harmonic voltages. However, such converters are not used much in wind turbines
these days. (Ackermann 2005: 91 - 93)
3.3.2 Frequency variations
The frequency variations occur when there is an imbalance between the production and
consumption. If there is a sudden disturbance in the balance, such as loss of a generation
set or a large load change, fast activated reserves have to take part in the frequency con-
trol. The frequency control is usually managed by conventional power plants, but in off-
grid solutions, these distributed generation power plants have to take care of it. The fre-
quency control is divided into three phases. In the first phase the rotating masses, iner-
tia, will contribute rapidly to the frequency deviation. If the deviation exceeds, control-
lers will be activated. In this second phase, so called primary frequency control, the
power input has to be changed to obtain the frequency at a demanded level. When the
power balance is restored, the frequency will be returned to its nominal value. That is
the third phase, even known as secondary frequency control. (Ackermann 2005: 146)
26
A large number of distributed generation (DG) units in the grid will make frequency
control more difficult. To avoid large frequency deviations, DG units will have to con-
tribute to frequency control. In order to contribute to the frequency control, the DG
units should be able to increase their power output when needed. (Morren, de Haan &
Ferreira 2005)
The mechanical energy in variable-speed wind turbines is not released when the grid
frequency drops, because they are decoupled by power electronic converters. Therefore,
the energy stored in the rotating mass will not be released when the frequency in the
grid drops. In practice, it is much more likely that the frequency decreases than increas-
es. (Ackermann 2005: 907)
3.3.3 Reactive power
PV generators and some types of wind generators use power converters. The reactive
capability of converters differ from those of synchronous machines because they are
normally not power-limited, as synchronous machines are, but limited by internal volt-
age, temperature, and current constraints. Unlike double-fed or full-converter wind tur-
bine generators, induction-based wind generators without converters are unable to
properly control reactive power. When talking about renewable energy systems and re-
active power issues, there is no actual issue, meaning that renewable energy systems are
good ancillary for providing or consuming reactive power. It is though economically to
provide the reactive power in the grid with external static and dynamic devices such as
static VAR compensator (SVC) and STATCOM devices.
Large wind or solar power installations can have negative effects regarding power quali-
ty, especially when they constitute a high percentage of total power produced, but even
when the penetration levels are around 10 %. The most commonly reported problem
associated with high PV penetration on distribution feeders is steady-state voltage prob-
lems. The steady-state voltage problems are situations when the voltage level is much
higher or lower than the nominal voltage, typically over 10 %. Severity depends on the
feeder characteristics and location of the PV generation along the feeder. The impact is
typically reduced as the distance to the renewable power source shortens. There are
27
couple hardware solutions for diminishing the impact. They can broadly be divided into
two groups: reactive power control and energy storage.
Nowadays utilities use reactive power control primarily for power factor correction. But
this technology also plays an important role in controlling voltage levels. Volt ampere
reactive (VAR) devices inject energy to smooth the swings in supply and thus keep the
voltage at an acceptable level. The inverters that connect PV systems to the grid can
function as controllers, because they can consume or provide reactive power quickly.
Also, battery energy storage systems can be used to provide voltage smoothing, when
equipped with the right controls. Battery charging is not sensitive to voltage intermit-
tency and once the batteries are charged, they provide a good and fast power source.
Battery storage can be located at the substation or distributed along the feeder. An addi-
tional benefit is that it can instantaneously provide power to minimize service interrup-
tions. (Abi-Samra 2012)
It should be noted that that both PV plants and converter-based wind power plants are
technically capable of providing reactive capability at full output. The difference is that
this kind of requirement is new to the solar industry compared to the wind industry. (El-
lis, Nelson, Von Engeln, Walling, McDowell, Casey, Seymour, Peter, Barker and Kirby
2012)
3.3.4 Grid codes for wind and solar power
Interconnection standards for wind power generation, known as “grid codes” are rela-
tively mature in Europe compared to standards in North America. Standards vary across
transmission operators, but there are intensions in standardising them. Power factor de-
sign requirements are expressed as a Q vs. P capability curve. These charts specify reac-
tive power requirements across the full operating range of active power, not only at full
output. The power factor design requirements at full output vary between unity and 0.9
under or overexcited at the point of connection. Most grid codes recognize that reactive
power capability depends on voltage conditions and include specifications to that im-
pact.

28
Interconnection requirements for solar PV systems installed at medium voltage (10 kV
to 100 kV) were recently put into effect in Germany. The power factor design criterion
is +/-0.95 at full output, which requires inverters to be oversized or de-rated. This stand-
ard also requires dynamic reactive power support during voltage excursions. (Ellis et al.
2012)

29
4 HYBRID POWER PLANTS
As mentioned earlier the utilization of non-polluting energy from the sun and wind is
nowadays of high interest. The so called hybrid generation concepts consist of two or
more power generation systems utilizing different energy sources. Often it is solar pow-
er or wind power combined with a secondary generation system. It is extremely im-
portant to ensure the power supply in an off-grid power generation system. Because of
the unpredictability of the weather conditions, the renewable generation systems alone
are halting. Due to this, combustion engines, gas turbines or fuel cells as a secondary
generation, besides solar or wind power will ensure the continuous power delivery.
(Hyytinen 2012)
Unfortunately, negative aspects of renewable energy, due to its high cost, withdraw
governments’ barriers and lack of subsidies that eventually brake down the development
of renewable energy technology. However, increased fuel costs and the approach of sav-
ing the environment will hopefully increase the use of renewable energy sources in the
near future. (Bloomberg, Heidell, Bernstein, Sugandha, Tuladhar and King 2013)
4.1 Wind power
Wind energy has been utilized for a long time. Nowadays wind energy systems are in-
creasing rapidly all over the world. The fast development of wind technology has made
it profitable, but in the meantime also complex. One has to understand the aerodynamics
and the newest techniques to develop it to an even more efficient non-polluting energy
production. The largest wind turbines generate power up to 8 MW, but somewhat
smaller ones are more common.
There are a couple different kinds of wind turbines. In early 1990’s the standard instal-
lations were fixed-speed turbines. Within the past years, the variable-speed turbines
have become the dominant type among the installed wind turbines. The advantages of
the variable-speed wind turbines are improved power quality, increased energy capture
and reduced mechanical stress. There are some disadvantages though, such as, losses in

30
power electronics and the increased equipment cost due to more complex structures.
(Ackermann 2005)
In Figure 9 the structure of a horizontal-axis wind turbine is shown. The different parts
in a wind turbine are numbered and listed, starting from the blades, ending to the tower.
Beside of these there are a lot of other parts mounted up in the wind turbine, such as
converter and brakes.
Figure 9. A wind turbine structure, with all the different components listed. (Alter-
native Energy News 2012)
4.1.1 Different wind power turbines
Wind turbines can be classified into two different categories depending on their axis
orientation. The axis can be either vertically or horizontally oriented. The more popular
turbine is the horizontal-axis wind turbine, which typically has three blades. There are
four different types of wind turbine generator technologies (WTG):

31
Fixed speed WTG,
Limited variable-speed WTG,
Variable-speed WTG with double fed induction generator (DFIG), and
Variable-speed WTG with front-end converter system.
The variable speed WTGs are more common for bigger turbines nowadays, due to the
fact that they are aerodynamically more efficient and have lower mechanical stress and
lower voltage fluctuations. The variable speed WTG with permanent magnet synchro-
nous generator (PMSG) and front-end converter system can be seen as the most effi-
cient WTG nowadays, since it is smaller and lighter than the one with a DFIG and it al-
so does not require slip-rings. Another benefit is the fact that it does not need a gearbox.
If a large amount of wind power is installed within small perimeter, the wind variability
can have a significant impact on the voltage profiles. The variable-speed WTGs do not
provide the system with inertia, since there is a converter installed between the wind
turbine and the grid. That can lead to frequency instabilities. The DFIG’s may also
“crow-bar” during a fault and can consume large amounts of reactive power, which can
disrupt the stability of the grid. (Kundur 2012)
4.1.2 Wind power production
The energy in the wind is actually created by the temperature changes on the surface
made by the sun. An ideal equation for the power of wind is
= , (2)
where is the air density, A is the area the air mass flows through and V is the wind
speed.

32
As can be calculated from the wind power formula, an increase of 10 % in wind speed
will result in a 30 % increase in the available power. However, according to disc theory
the maximum power that can be obtained from the wind without any power losses from
harnessing the wind is 59 %. This is the so called Betz limit, which was discovered by
Betz in 1926.
Wind turbines have so called cut-in and cut-out speeds. The cut-in speed is the wind
speed at which the turbine starts rotating and thus generating power. Normally the cut-
in speed is around 4 m/s. The cut-off speed is the wind speed at which the turbine stops
rotating. The cut-off speed is a precaution measure for protecting the wind turbine, e.g.
during a storm. The cut-off speed is typically around 25 m/s. In figure 10 the power
curve for a 2 MW wind turbine is shown. Besides the cut-in and cut-off speeds shown in
the figure below, one may see the average and rated wind speeds and their different
power outputs. (Ackermann 2005: 33 - 36)
Figure 10. Wind power curve in changing wind speed. (Partnership for renewables
2010)
33
When choosing the size of the wind turbine, bigger wind turbines are more efficient, but
bigger is not always better. The local lifting equipment might not have enough height
for building big wind turbines, since only the diameter of a 5 MW wind turbine is over
100 m and adding the hub height of approximately 90 m gives a total height of 140 m.
Therefore, installing a larger amount of smaller wind turbines would produce the same
amount of power and also harvest the wind power on a larger area. However, smaller
wind turbines have a smaller inertia, which affects the power smoothing negatively.
(Cardenas, Pena, Perez, Clare, Asher & Vargas 2006: 1132)
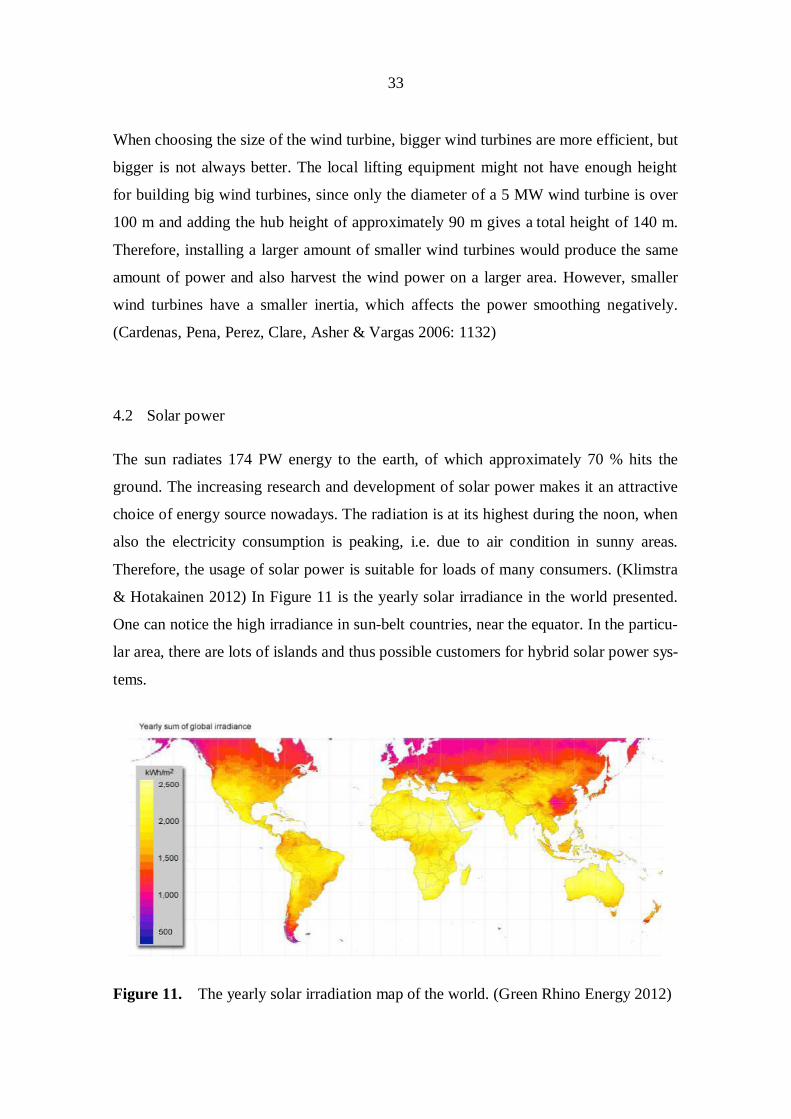
4.2 Solar power
The sun radiates 174 PW energy to the earth, of which approximately 70 % hits the
ground. The increasing research and development of solar power makes it an attractive
choice of energy source nowadays. The radiation is at its highest during the noon, when
also the electricity consumption is peaking, i.e. due to air condition in sunny areas.
Therefore, the usage of solar power is suitable for loads of many consumers. (Klimstra
& Hotakainen 2012) In Figure 11 is the yearly solar irradiance in the world presented.
One can notice the high irradiance in sun-belt countries, near the equator. In the particu-
lar area, there are lots of islands and thus possible customers for hybrid solar power sys-
tems.
Figure 11. The yearly solar irradiation map of the world. (Green Rhino Energy 2012)
34
In grid-connected solar power systems the feed-in tariffs are the most cost effective pol-
icy instrument. The payback time of grid-connected PV systems decreases from decades
to just a couple few years with the help of FITs. Nevertheless, in stand-alone systems
the use of solar energy is already worthwhile, especially in the sun-belt countries. (Eu-
ropean Photovoltaic Industry Association 2012)
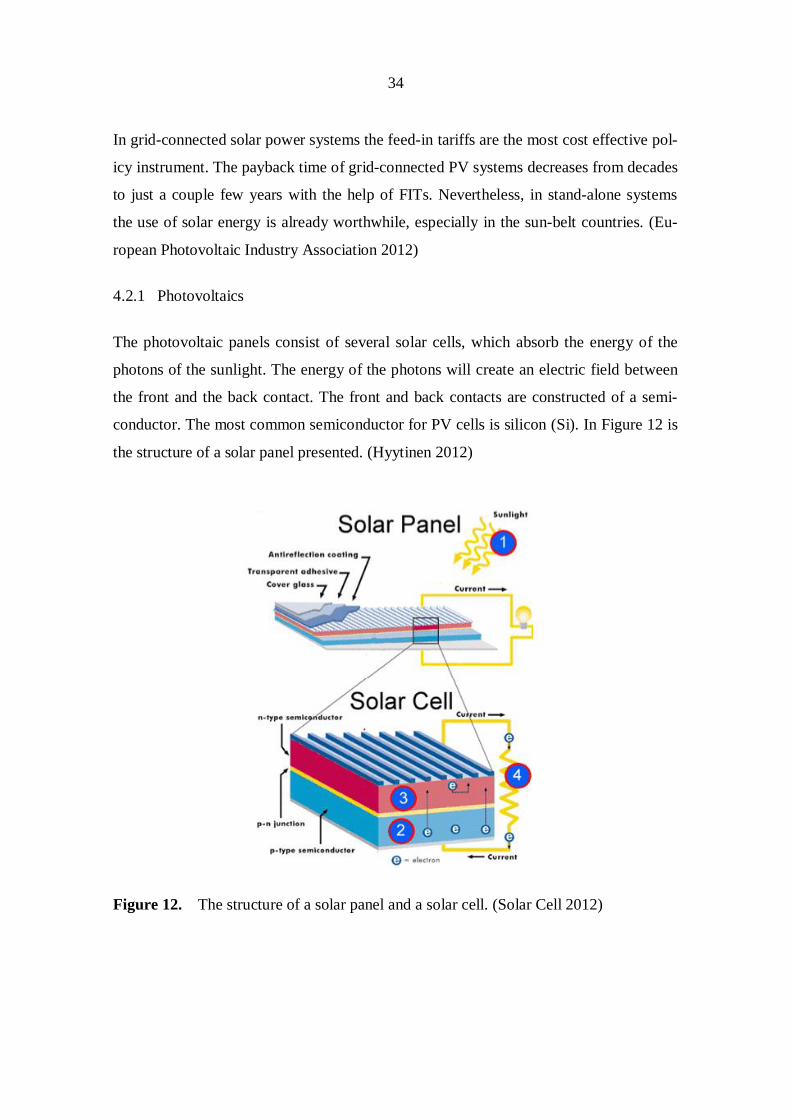
4.2.1 Photovoltaics
The photovoltaic panels consist of several solar cells, which absorb the energy of the
photons of the sunlight. The energy of the photons will create an electric field between
the front and the back contact. The front and back contacts are constructed of a semi-
conductor. The most common semiconductor for PV cells is silicon (Si). In Figure 12 is
the structure of a solar panel presented. (Hyytinen 2012)
Figure 12. The structure of a solar panel and a solar cell. (Solar Cell 2012)

35
Load current in a PV cell is
= ( ) 1 , (3)
where IL is the light current of the PV cell (in amperes), I0 is the saturation current, I is
the current of the load, U is the PV output voltage (in volts), RS is the series resistance
of the PV cell (in ohms), and is the thermal voltage timing completion factor of the
cell (in volts). (Hyytinen 2012)
Due to significant improvements in technology, cheaper raw materials, highly competi-
tive market and manufacturing scale, the price of photovoltaic panels has decreased to
an affordable level. As can be seen in Figure 13 the price of photovoltaic panels has de-
creased steadily for the past 7 years, meanwhile the price of crude oil has raised signifi-
cantly. According to this the use of PV panels is nowadays an even more interesting
choice for new power generation systems. (Solar Frontier K.K. 2012)
Figure 13. Oil and PV module price change for the past 30 years. (Solar Frontier K.K.
2012)
36
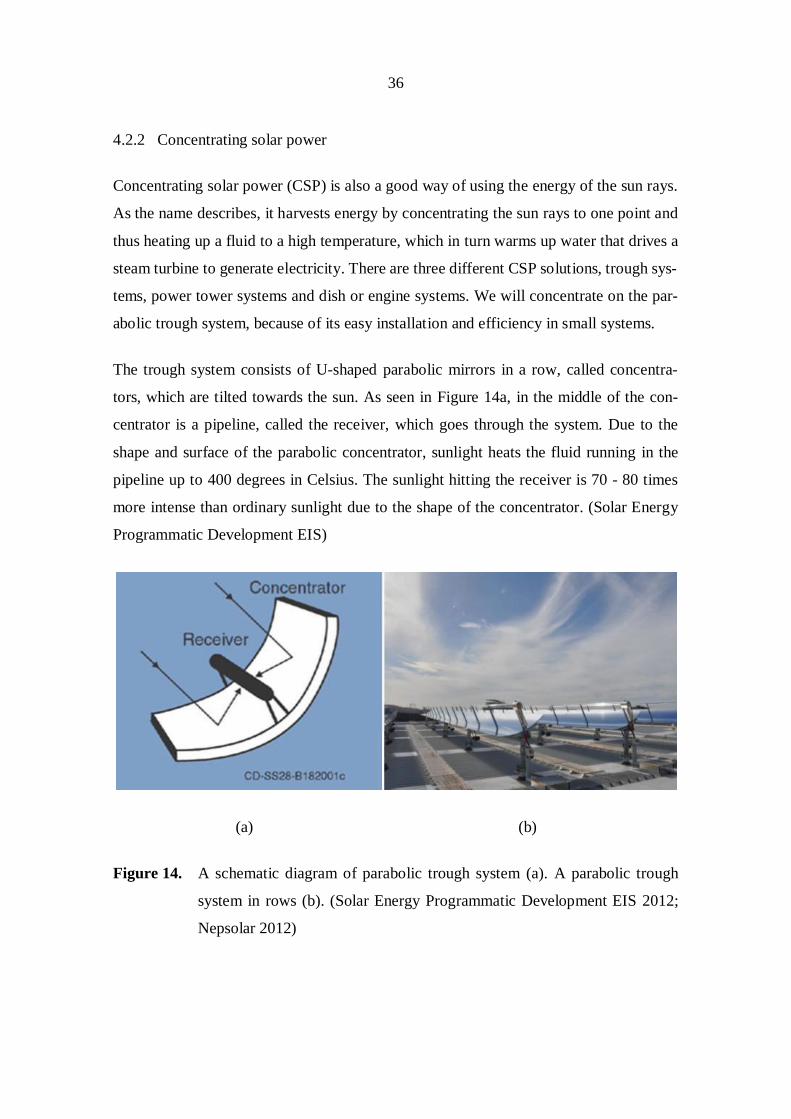
4.2.2 Concentrating solar power
Concentrating solar power (CSP) is also a good way of using the energy of the sun rays.
As the name describes, it harvests energy by concentrating the sun rays to one point and
thus heating up a fluid to a high temperature, which in turn warms up water that drives a
steam turbine to generate electricity. There are three different CSP solutions, trough sys-
tems, power tower systems and dish or engine systems. We will concentrate on the par-
abolic trough system, because of its easy installation and efficiency in small systems.
The trough system consists of U-shaped parabolic mirrors in a row, called concentra-
tors, which are tilted towards the sun. As seen in Figure 14a, in the middle of the con-
centrator is a pipeline, called the receiver, which goes through the system. Due to the
shape and surface of the parabolic concentrator, sunlight heats the fluid running in the
pipeline up to 400 degrees in Celsius. The sunlight hitting the receiver is 70 - 80 times
more intense than ordinary sunlight due to the shape of the concentrator. (Solar Energy
Programmatic Development EIS)
(a) (b)
Figure 14. A schematic diagram of parabolic trough system (a). A parabolic trough
system in rows (b). (Solar Energy Programmatic Development EIS 2012;
Nepsolar 2012)

37
4.3 Structure of hybrid power plant
The structure of a hybrid power plant varies, depending on the combustion engines, and
the other power generating units. In Figure 15 a typical hybrid power plant with wind
turbines, PV’s and diesel engines is shown. It is also backed-up with a storage system.
The challenge in designing the system lies besides the proper amount of power genera-
tion for the load, also in the function inside of the power plant, i.e. decisions whether
constructing the majority of system with an AC or a DC bus, and also the optimal con-
trolling between the power generation units has to be in order.
Figure 15. Hybrid power plant structure with PV, wind turbines, diesel engines and
storage. (Wind energy (Beijing) co LTD 2010)
4.4 Electrical components for hybrid power plant
Besides the power generating units, there are a lot of components in a hybrid power
plant. The most significant is the inverter, representing 5 to 25 % of the total cost of a
PV system. Other components are cables, fuses and automation and telecommunication
components.

38
4.4.1 Inverters
The inverters are the second most significant part in a PV system. The PV panels are the
most important and most expensive as well. Inverters represent 5 - 10 % of the whole
PV system cost in a commercial scale on-grid system and 15 - 25 % of a residential off-
grid system. The function of the inverter is to convert DC power to AC power through
the use of power electronics circuitry. The transistor based bridge in the inverter is usu-
ally made of semiconductor switches, such as mosfets or insulated-gate bipolar transis-
tors (IGBT). They are operated in either a conducting or blocking state, which is
switched on and off at high switching frequency (2 - 20 kHz). The result with a help of
a filter will be sinusoidal AC at the frequency of 50 or 60 Hz. The controller is one of
the key components in an inverter. It implements the algorithms that control the power
semiconductors and also provides maximum power point tracking. The maximum pow-
er point tracker is reviewed more deeply in Section 4.4.3. The inverter has switches on
both DC and AC side for disconnecting it safely from the grid. The inverters have also
over-current protection devices on both sides. These are often shown as fuses but might
also be accomplished with circuit breakers.
For grid-tied systems the inverters have to regulate the AC power that flows into the
grid and meet the requirements of different grid standards, depending on the country.
Off-grid inverters on the other hand have a slightly different function. They have to reg-
ulate the AC voltage that is supplied to the local load, which needs a fast dynamic re-
sponse to keep the system reliable in operation, since the voltage might fluctuate from
- 30 % to + 25 % of the nominal voltage. The inverter also needs to be capable of
providing a quick motor inrush current which requires lots of power for a short period
of time, meanwhile being efficient at marginal power levels. The off-grid inverter is of-
ten integrated with a charge controller, whose function is to control the power flowing
to and from a storage system. The inverter must also comply with electric safety codes
and also regulations regarding electromagnetic compatibility (EMC). The most im-
portant characteristic of the PV inverter is its efficiency. It is normally inefficient at low
power levels, increases and reaches a peak in the middle of the power range, and then
drops at higher power levels. The efficiency also varies at different DC voltage levels.
39
Another important characteristic is the ratings of the inverters enclosure. There are dif-
ferent ratings, depending on where the inverter is installed. For inverters installed out-
doors, there are some enclosure ratings, such as NEMA 3R/4 or IP65.
When choosing proper-sized inverters to a system the power rating of the inverter
should not be lower than the possible power obtained from the PV array, or the inverter
will “clip” the power and supply will be lost. It is normal though that PV nameplate DC
will not be reached and therefore a factor 1.2 is used when sizing the inverter, meaning
if the PV nameplate DC power is 12 kW a 10 kW AC power inverter is sufficient.
(Luque & Hegedus 2011: 855 - 859, 969 - 974)
4.4.2 AC, DC or AC/DC bus
When choosing between AC and DC bus, there are several things that have to be con-
sidered, such as the distances between the generating units and the power plant, the in-
vestment cost, load type and size, the voltage levels etc. According to (Gabler &
Wiemken 1998) the AC bus configuration is comparable in performance to a conven-
tional AC/DC bus system. Here it is shown that if maximum power point tracking is in-
cluded in both systems, the AC bus system requires about 10 to 18 % more electricity
from the engine-driven generator. In contrast, the DC bus system requires at most 2 to 3
% more electricity from the engine-driven generator.
The impedance of the cables has a bigger influence in power losses when operating with
alternative current in comparison with direct current. This is due to the reactance, which
does not have effect on the direct current. Using direct current makes it also possible to
locate the generating system further from the power station, because the voltage drop is
lower than for alternative current. Furthermore, the strain of the components is bigger
when using alternative current, because of its pulsating waveform. (Hiekka 2012)
The major challenge in designing the DC distribution is the choosing of the compo-
nents, such as switches, bus bars and enclosures for different currents. The peak current
and the short circuit current have to be carefully calculated when designing the DC sys-

40
tem, so that the circuit breakers or load components do not get damaged, when faults
occur. Also the location and surroundings of the system have to be designed wisely, in
order to avoid damage on humans, if accidents occur. (Hiekka 2012)
Depending whether using half or full bridge inverters, the DC voltage amplitude has to
be at a certain level if for example AC voltage of 400 V is demanded. Here, when using
a half bridge inverter the DC voltage has to be at least 800 V and with the full bridge
inverter, at least 565 V. If AC voltage of 400 V is demanded and using a half bridged
inverter, the distribution has to be unipolar, since the bipolar only supports up to DC
voltage 750 V. The unipolar distribution is accomplished with one phase (2 lines) when
the bipolar requires two-phase wiring (3 lines). (Voutilainen 2007: 23)
The conventional AC/DC bus system offers some advantages compared to either AC or
DC bus systems. It can satisfy AC loads directly, unlike a DC bus system. Although, the
DC bus for bigger PV systems with battery storage is more efficient. (Ross 2004)
4.4.3 Other components
The balance of system (BOS) includes all the wiring, fuses, combiners, grounding con-
nectors, switchgear etc. These components have to be made of durable material, since
they have to tolerate harsh weather conditions that would cause e.g. corrosion. All BOS
have to be rated for correct voltage and current class and the wires also for special des-
ignations to be sustainable enough.
The frequency converter is a very important component in a wind power plant. It con-
sists of a rectifier for converting the AC power to DC power on the generator side, en-
ergy storage (capacitor bank) in the middle and finally on the grid side an inverter
which converts the DC power to AC power. The function of the frequency converter is
as the name tells, to change the supplied AC voltage and frequency to desired level.
There are different converter topologies, but the most widely used three-phase frequen-
cy converter is a so called back-to-back converter. The back-to-back converter is a bidi-
rectional converter consisting of two pulse width modulated (PWM) voltage source con-

41
trollers (VSC) and converters. The capacitor bank in between the two inverters allows
decoupling of the control in order to not affect the other side when controlling the other.
The rectifier has to be chosen depending on the generator. A diode rectifier can only be
used together with a synchronous generator, while gate turn-off thyristor (GTO) and
IGBT rectifiers have to be used with variable speed induction generators. The IGBTs
have developed fast and are a better choice.
Soft starters are power electrical devices that reduce the in-rush currents when connect-
ing the fixed-speed wind turbine to the grid. Without a soft-starter the in-rush current
can be up to 8 times higher than the rated current, and may therefore affect disturbances
in the grid. It contains two thyristors, whose firing angles are adjusted during the grid
connection. After the in-rush the thyristors are bypassed in order to minimize power
losses. The wind power plants have also capacitor banks, which are used for supplying
reactive power to the induction generator in order not to absorb too much reactive pow-
er from the grid. The capacitor banks can also be disconnected depending on the reac-
tive power demand of the generator. (Ackermann 2005: 72 - 75)
In PV systems the charging procedure is much more complex than in conventional bat-
tery chargers, since the current varies according to the solar insolation, also known as
irradiance (Wh/m2). The charge controllers with a maximum power point tracker
(MPPT) are the most effective in these cases, since it measures the current, voltage or
power from the PV generators and derives the voltage to be optimum for the battery
system or the load.
The MPPT is an electronic device integrated in the converter for obtaining the maxi-
mum efficiency from the PV. It measures the voltage and the current that the panels
generate and calculates the maximum point at which the current and voltage generates
the highest power. It also acts as a breaker and cuts the connection if too big differences
in between them are detected. The MPPT is also very useful when charging batteries,
since it detects the optimal voltage level which should be used for the most efficient
charging. Simulations and tests show that the charging time is significantly shorter
compared to systems without a MPPT.

42
Figure 16 shows how the MPPT affects the power obtained from PV panels. There are
three different lines for three different irradiance peaks (W/m2) and the maximum power
change depends on the voltage level that is used. (Messenger & Ventre, 2010)
Figure 16. Power as a function of voltage with three different irradiances for a PV
array connected to a MPPT. (Messenger & Ventre 2010)
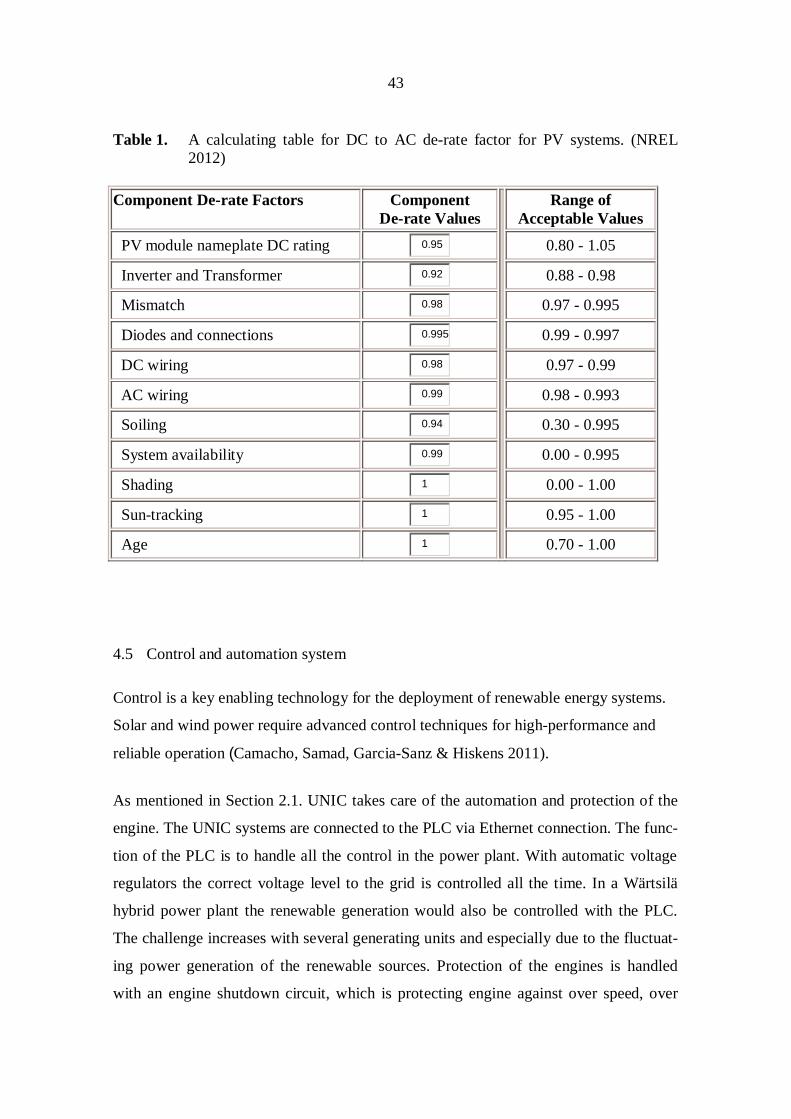
The DC to AC de-rate factor for a PV system, in other words the power losses, can be
calculated with a calculating tool on the Internet. Table 1 presents the different compo-
nents that have to be taken into consideration when calculating the power losses. There
are also suggested ranges of acceptable values for each of the component. The most af-
fecting components are PV nameplate efficiency, inverter and transformer, soiling and
aging. Shading is the most important of course, but since the possibility that it is cloudy
is already taken into consideration in the insolation at the site, it is not needed to take
into account in the DC to AC de-rate factor calculations.
43
Table 1. A calculating table for DC to AC de-rate factor for PV systems. (NREL2012)
Component De-rate Factors Component De-rate Values
Range ofAcceptable Values
PV module nameplate DC rating 0.80 - 1.05
Inverter and Transformer 0.88 - 0.98
Mismatch 0.97 - 0.995
Diodes and connections 0.99 - 0.997
DC wiring 0.97 - 0.99
AC wiring 0.98 - 0.993
Soiling 0.30 - 0.995
System availability 0.00 - 0.995
Shading 0.00 - 1.00
Sun-tracking 0.95 - 1.00
Age 0.70 - 1.00
4.5 Control and automation system
Control is a key enabling technology for the deployment of renewable energy systems.
Solar and wind power require advanced control techniques for high-performance and
reliable operation (Camacho, Samad, Garcia-Sanz & Hiskens 2011).
As mentioned in Section 2.1. UNIC takes care of the automation and protection of the
engine. The UNIC systems are connected to the PLC via Ethernet connection. The func-
tion of the PLC is to handle all the control in the power plant. With automatic voltage
regulators the correct voltage level to the grid is controlled all the time. In a Wärtsilä
hybrid power plant the renewable generation would also be controlled with the PLC.
The challenge increases with several generating units and especially due to the fluctuat-
ing power generation of the renewable sources. Protection of the engines is handled
with an engine shutdown circuit, which is protecting engine against over speed, over
0.95
0.92
0.98
0.995
0.98
0.99
0.94
0.99
1
1
1

44
current etc. Protection relays handle the generator and switchgear protection. The dif-
ferent components for the automation and connections for telecommunication are shown
in Figure 17.
Figure 17. The advanced automation and its connections starting from engine embed-
ded UNIC systems connected trough PLC modules and ending with Wärt-
silä Operator Interface System. (Wägar 2012)
4.6 Energy storage systems
Finding an economical and effective storage system for islands is still a major challenge
for the power sector. The renewable power generation is not reliable in load following.
Therefore, a storage system would solve this problem by storing excessive energy when
the power demand is lower. Storage options come in different sizes and types, pumped
hydro for larger energy storage and batteries or flywheels for small projects under
100 MW. Besides the small generation in our case, the pumped hydro is not often feasi-
ble for small islands, due to need of fresh water and large land area. (EurElectric 2012)
45
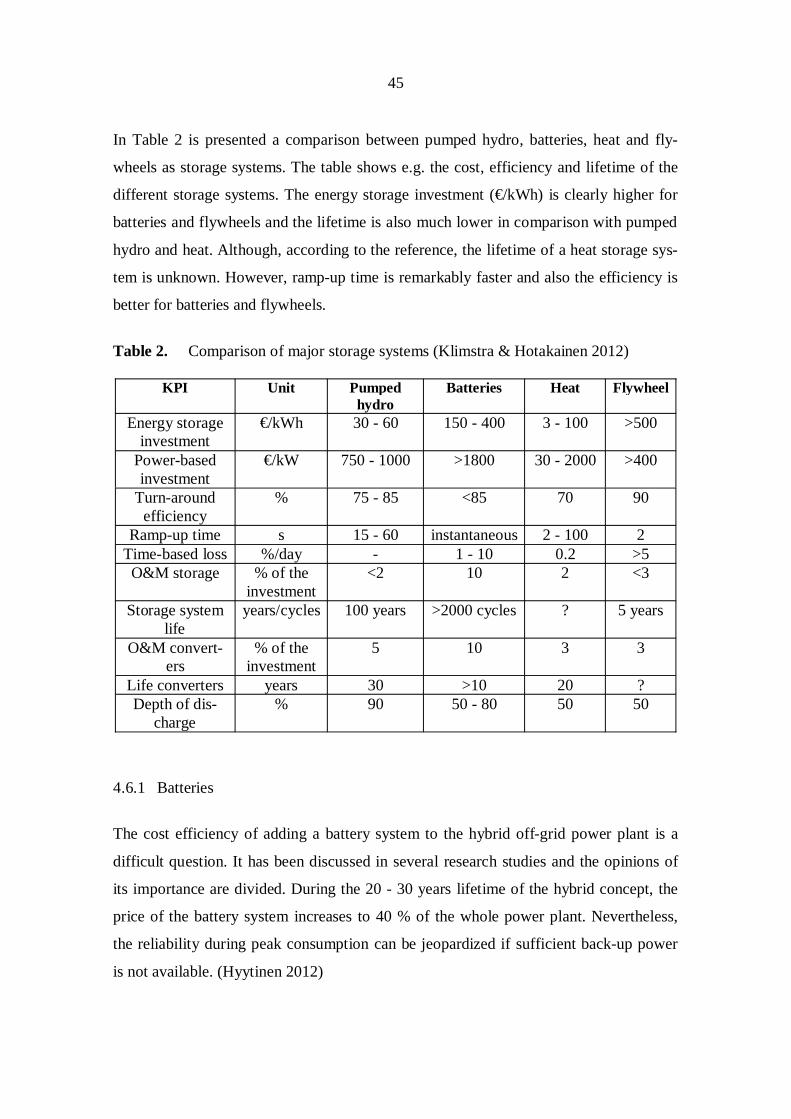
In Table 2 is presented a comparison between pumped hydro, batteries, heat and fly-
wheels as storage systems. The table shows e.g. the cost, efficiency and lifetime of the
different storage systems. The energy storage investment (€/kWh) is clearly higher for
batteries and flywheels and the lifetime is also much lower in comparison with pumped
hydro and heat. Although, according to the reference, the lifetime of a heat storage sys-
tem is unknown. However, ramp-up time is remarkably faster and also the efficiency is
better for batteries and flywheels.
Table 2. Comparison of major storage systems (Klimstra & Hotakainen 2012)
KPI Unit Pumpedhydro
Batteries Heat Flywheel
Energy storageinvestment
€/kWh 30 - 60 150 - 400 3 - 100 >500
Power-basedinvestment
€/kW 750 - 1000 >1800 30 - 2000 >400
Turn-aroundefficiency
% 75 - 85 <85 70 90
Ramp-up time s 15 - 60 instantaneous 2 - 100 2Time-based loss %/day - 1 - 10 0.2 >5O&M storage % of the
investment<2 10 2 <3
Storage systemlife
years/cycles 100 years >2000 cycles ? 5 years
O&M convert-ers
% of theinvestment
5 10 3 3
Life converters years 30 >10 20 ?Depth of dis-
charge% 90 50 - 80 50 50
4.6.1 Batteries
The cost efficiency of adding a battery system to the hybrid off-grid power plant is a
difficult question. It has been discussed in several research studies and the opinions of
its importance are divided. During the 20 - 30 years lifetime of the hybrid concept, the
price of the battery system increases to 40 % of the whole power plant. Nevertheless,
the reliability during peak consumption can be jeopardized if sufficient back-up power
is not available. (Hyytinen 2012)

46
Batteries are consumed when they have less than 80 % of the rated capacity left. Even
though the batteries can be used until 50 % of the rated capacity remains, it needs to be
notified, that the power available from the battery will be reduced. Especially in hybrid
systems the solar fraction decreases with reduced battery capacity. Also the aging bat-
teries affect on safety, due to dangerous situations of battery breakdowns e.g. short cir-
cuit caused by corrosion.
If battery storage system is added to the power plant, lead-acid batteries are economical-
ly the best option, especially for larger systems, even though their lifetime is short. Lith-
ium-ion batteries are best suited to autonomous power systems due to their technical
parameters. Lithium-ion batteries are very expensive and thus their advantage may not
be economically worthy yet. When planning the system, adding extra investment in bat-
tery function will lead to long-term savings, especially in case of frequent full charging
and deep discharging protection. (Luque & Hegedus 2011)
Figure 18 shows a line diagram of a battery system connection. Batteries can be coupled
in series to provide a higher voltage. When batteries are coupled in parallel the current I
equals in this case to I1 + I2.
Figure 18. Line diagram of a battery storage system. (Hiekka 2012)
47
4.6.2 Thermal storage
When designing thermal storage systems, one has to know several important thermal
properties of different materials. The most consequential is the heat capacity Cp, which
signifies the amount of heat that can be stored by a material. But one cannot choose the
correct material without considering the other important properties, e.g. thermal conduc-
tivity, k, and thermal diffusivity, D. The thermal conductivity is a measurement of the
temperature gradient through a material and the thermal diffusivity the speed of the heat
transfer trough a material. There are also differences in cost and performance whether
using a liquid or solid material. Solid material offers advantages such as, no concern
about high-pressure containment, no energy input requirement for convection or cooling
and lower system and operation costs. According to a study made by Sorrel et al. (2009)
the best material for a thermal storage system at the moment is bulk graphite. It has the
best overall performance for systems operating in less than 600 degrees in Celsius. (Sor-
rel, Palmer, Bowen & Nakaruk 2009)
Adding of a thermal storage system will only be profitable with CSP systems, since they
generate heat directly from the sun energy and do not convert it to electricity before
storing, unlike PV and wind power systems. Discussing the cost efficiency of storage
system, only with high renewable penetration it will benefit, because of the reduced
need of conventional high cost generation. (Hossein, Madaeni, Sioshansi & Denholm
2012)
In Cyprus a 50 MW parabolic trough system with a thermal storage is under construc-
tion. The thermal storage system is charged within 6 hours to full charge during sum-
mer, with hot fluid that the parabolic through system warms with sunlight. The thermal
storage system can feed the load with electricity for 7.5 hours, if fully charged. Through
a steam turbine the efficiency will be 38 - 39 % and the net electricity power output
39 MW in storage mode. Total investment cost for the 50 MW power plant is estimated
to 360 M€. (EurElectric 2012: 35)

48
4.6.3 Flywheels
Flywheels are briefly reviewed in this thesis, because at the moment they are not con-
sidered suitable, since the goal is to utilise the generating sets with their stored fuel and
possible battery system for a fast back-up and thus the flywheel would not be needed
due to its capabilities and high cost.
The flywheel storage system stores mechanical energy in a spinning rotor, which is
connected to an engine or generator. When the switch is off, the kinetic energy is re-
leased back to the engine and it will work as a generator. Flywheels are divided to low-
speed and high-speed flywheels. Low-speed flywheels have a speed of less than
10000 rpm, while high-speed flywheels rotate with the speed of over 10000 rpm. In
power industry the more common model is the low-speed flywheel. The advantage of
flywheels is their capability to regulate the voltage ultra-fast. But then again because the
generator is synchronised to the grid frequency, the flywheels are only used for varying
the frequency, which limits the advantages of the flywheel. (EurElectric 2012: 35;
Veszpremi & Schmidt 2007)

49
5 WÄRTSILÄ HYBRID GENERATION CONCEPTS
The goal of this thesis is to find an ideal share of renewable energy for small off-grid
power plants (5 - 100 MW) or small grids (10 - 300 MW). The hybrid power plant will
consist of several gas or liquid fuel combustion engines and a proper amount of either
solar or wind power. These small off-grid power plants may be located on islands and
due to good weather conditions to utilize renewable energy, this hybrid power genera-
tion concept study is made to be suitable for customers on islands in the sun-belt coun-
tries.
5.1 Choosing the hybrid concept
As mentioned in Chapter 3 the different renewable energy options all seem as good
choices and there is no right or wrong solution, rather a chance to utilize the most effi-
cient electricity production method for each individual location. Due to restricted land
area in most of the cases, there are great opportunities to solve this problem by design-
ing the power plant site thoroughly and thus finding space for the renewable energy sys-
tem. That would most likely shorten the distances between the generation systems, and
therefore making savings in cable costs. Also, using a DC-bus would make savings in
cable costs.
5.1.1 Optimal Wärtsilä power plant setup
When selecting the optimal Wärtsilä combustion engine power plant for this hybrid
concept, it is important to know what kind of a power plant is needed. In these kinds of
cases it is normally a flexible base-load power plant, but it could also be a reserve or
peak load power plant. Most important is the magnitude of the base-load and the peaks,
but also the type of the load. There can be critical loads, which need to be kept running,
or perhaps there is a huge variation in the load. In most of the cases and especially in
off-grid solutions the adequate power supply is important. In cases where load shedding
is possible, some arrangements can be made in critical situations. The selection of the

50
optimal power plant is affected a lot by the customer needs and the possibilities in han-
dling the load.
When choosing the amount of engines for a power plant the load magnitude and type
has to be known as mentioned above. What also has to be taken into consideration is
that there will always have to be at least n + 1 amount of engines, where n is the optimal
amount, since one engine might be under maintenance or suddenly trip. With this in-
formation the optimal engine and amount of engines can be chosen.
Due to our restricted power plant size, less than 100 MW in this hybrid concept study,
the optimal engine would be the 20V34SG gas engine or the 20V32 diesel engine be-
cause of the appropriate power supply. The 20V34SG generates power of 9730 kW and
the 20V32 generates 8924 kW. Also, the 20V32DF dual fuel is a good option if there is
no natural gas infrastructure yet on the site, but plans of building one later. The bigger
the engine is the better efficiency it has. But in general, the more engines there are, the
more reliable the power plant gets. If there are four engines and one trip, 25 % of the
power supply is lost. But if there are eight engines with a smaller power generation and
one trip, only 12.5 % of the supply is lost. Therefore, the 18V46 diesel engine and the
18V50SG gas engine are considered too big units for this concept, since their power
generation are 17 MW and respectively 18 MW. The smaller engines are also easier to
transport and to install. Table 3 presents the units and their power generation. It shows
also the amount of engines to reach power generation of 100 MW, which gives a per-
spective of an ideal engine for this concept. (Wärtsilä 2012a)
Table 3. Comparison of suitable Wärtsilä combustion engines for this concept.
Unit Power (kW) Number of units to generate 100 MW
20V32 8924 12
20V34SG 9730 11
18V46 17080 6
18V50SG 18320 6
51
5.1.2 Choosing between solar and wind power
The question whether utilising solar or wind power is mainly depending on the weather
conditions at the site, but also on the available land area, the local lifting craft and pos-
sibilities in general to build a renewable energy generation system. E.g. if the adequate
weather conditions are better for utilising wind power than solar power and there is not
enough free land area for required amount of solar power, the solution would be to in-
vest in wind power. On the other hand, if the terrain is not suitable for erecting wind
turbines, solar power could be better. There is also the option to invest in both solar and
wind power. Wind is more comparable to a base-load power source because it can usu-
ally generate power 24 hours a day. Solar, on the other hand, generates power only dur-
ing the daytime hours, making it a perfect peak power source.
We do not consider one source better than the other, though; in fact, it means they com-
plement each other quite well. Depending on the location, the best solution might be to
invest in both of them to minimize the loss of power supply, since seasonal variations in
power supply from renewable sources occurs. It is more likely that in areas with much
sun and wind (islands in the sun-belt region) either it is windy or sunny, and at least
some of the renewable energy is available. (Khurshid 2011)
Good weather forecasting is important in improving renewable energy delivery to the
grid. Also, when planning the system, weather forecasts are important in order to de-
termine whether investing in solar or wind power. Of course the investment and opera-
tion & maintenance costs of the system play a big role when designing the optimal hy-
brid concept. Therefore, some calculations in Chapter 6 based on the costs of producing
electricity with either wind or solar power are presented.
The available land area is also a critical factor to be taken into account when determin-
ing which renewable source to utilize. According to Denholm, Hand, Jackson and Ong
(2009) typical wind turbine spacing in wind farms is placing the towers at the distance
of 5 to 10 turbine diameters apart, depending on local conditions. In addition to that,
every wind turbine needs a “footprint” area, which is around 1000 m2.

52
Calculations of wind power plants total power production divided by total land area in
tens of wind projects in United States of America was 2 - 5 W/m2, depending on the
project. The solar radiation on the surface of the earth in sunny areas during a year is
around 6 kWh/m2/day, which would generate a power of 250 W/m2. Due to an efficien-
cy of approximately 15 % for the PV system, the actual output will be 37.5 W/m2. That
is ten times more than for the wind turbines per square meter in average. So if the only
issue with equal good weather conditions is the free land area, the PV array will gener-
ate more power than the wind turbines. What has to be taken into consideration is that
the land area between the wind turbines is free for other use, e.g. for planting and also,
that the investment cost for power generated with PV per square meter is much higher
than with wind. (Denholm et al. 2009; Keffer 2010, Solar Electricity Handbook Website
2013; Klimstra & Hotakainen 2012: 62 - 64)
5.1.3 Ideal share of renewable energy
As mentioned earlier, the weather forecasting or actually the historical data of wind
speed and solar irradiation is an important part of improving energy delivery to the grid.
It is also beneficial when determining the amount of renewable power of the whole
power generation system at the planning stage. If the weather conditions are seasonally
poor, the combustion engines will have to provide the whole power demand if there is
no storage system, therefore investing in a too big share of renewable energy will be
inefficient at some point.
The solar power supports perfectly the high peak during the day, if it is not unfortunate-
ly cloudy. Wind power again, is harder to predict and it can blow during day or night,
but if it is a windy site, the wind power is a good renewable resource to utilize. Adding
of renewable generation will decrease the need of base load, and since Wärtsilä combus-
tion engines are working as rapid starting intermediate load providers in these small off-
grid solutions, they fit in a hybrid system combined with renewable power generation
very well. So, in these cases if the location is sunny and windy, the ideal amount could
be 10 - 30 % of both solar and wind, and adjustments in the percentage of one or the
other according to weather conditions and site possibilities is considered.
53
If the combustion engine power supply is not calculated to cover the whole peak power
demand and the renewable share grows to a much larger share of the peak power gener-
ation, the electricity supply might not meet the demand at certain times due to bad
weather. Also, there will be a lower amount of spinning reserves for frequency control-
ling. Then more money must be invested in back-up power, if high reliability is essen-
tial.
5.2 Power plant own consumption
When operating a power plant there are always parasitic loads e.g. electricity consuming
auxiliaries and functions, which are however necessary in order to keep the plant
running. Even though the power plant is in stand-by operation, it still has some
electricity consumption. Therefore, utilising the energy of the renewable sources for
minimising the own consumption might be a cost reduction possibility for the power
plant that is of great value. Different solutions are considered and the payback time is
calculated.
The biggest differences in power plants’ own consumption are the ambient temperature,
having an impact on the electricity need for cooling and ventilation, and also the size of
the engine. In following, the different consuming parts in a Wärtsilä power plant are
presented.
Figure 19 shows the own consumption for different power plants, calculated with Perf
Pro program. Perf Pro is an internal Wärtsilä tool used for performance calculations. It
can use the estimated parasitic loads to get more accurate performance figures. A power
plant consisting of ten 20V32 generating sets will consume around 2.6 % of the
produced power at the ambient temperature of 35 degrees in Celcius, but only 2.25 % at
the ambient temperature of 25 degrees in Celsius. Another big difference that can be
seen is the consumption depending on the fuel type the engine is running on, due to no
need of fuel heating, treatment or pumping in gas-driven engines. There can also be
seen the different consuming parts and their share of the whole consumption in
percentage. (Lindvall 2012)

54
Figure 19. Own consumption in percentage for different engines at ambient tempera-
tures of 25 and 35 degrees in Celcius. (Lindvall 2012)
5.2.1 Preheating of engine and fuel tank
The Wärtsilä combustion engines need to be in hot pre-heated mode to have a rapid
start-up time of 1 minute. As an example, the continuous heating power required to
keep a Wärtsilä 20V32 at 70 degrees in Celsius is 27 kW. If there are six 20V32 en-
gines, the continuous electricity power demand only for preheating is 162 kW. Also
HFO needs to be heated before pumping it into the engines, in order to get it enough
liquid, due to its thickening in standard ambient temperature. The power required for
pre-heating of the day fuel tank for a power plant of this size is around 57 kW.
5.2.2 Radiator cooling and ventilation
Radiators are electrically working fans where the engine coolant is cooled by a forced
air flow. The radiator cooling system has no water consumption, therefore the power
plant can be located anywhere. The drawbacks of radiator cooling is the slightly higher

55
investment cost and power consumption compared to other cooling methods, although it
is far more efficient than years ago, since it is connected through a frequency converter.
The efficiency of electric motor is depending on the load, which should also be taken
into consideration when calculating efficiencies.
The air condition consumes some electricity, especially in locations with higher ambient
temperature. The heat losses from the engines, cables etc. also need to be ventilated or
cooled in buildings, which increase the load on aircondition and ventilation units.
5.2.3 Electricity for automation and cooling
All Wärtsilä power plants have a DC back-up system for the automation and protection
of the power plant. The batteries of DC system are charged continuously and therefore
they consume some power all the time.
The lights of the power plant are also a consuming part, which is very seldom calculat-
ed. It is though understandable that the total power loss due to lighting is not a very high
percentage of the whole consumption, but things like brightness outside, which is de-
pendent of the time of year and location, affects this minor consumption.
Other electricity consuming parts in a power plant are fuel tank pumps for unloading the
fuel, starting air system compressors, and for liquid fuel systems the electrically driven
pumps which are used to transfer the fuel from the tanks to the engines and to increase
the pressure before fuel injection. (Lindvall 2012)
5.3 Storage system
The necessity of a storage system is discussed and clearly a negative aspect in investing
in it is the high cost and low lifetime. When running several combustion engines with
renewable generation, the high part load efficiency and fast start-up and stop will regu-
late the power generation according to the load demand, thus making the fuel in the fuel
tank as the energy storage system. Also, since combustion engines generate a high per-
centage of the total power, there is enough inertia for support of power quality. For min-
56
imising own consumption in hot stand-by power plants with a CSP system, the adding
of a thermal storage would guarantee the hot pre-heating mode during night time.
If a customer necessarily wants a battery storage system, Lithium Ferro Phosphate
(LFP) batteries are considered suitable for this kind of back-up system for Wärtsilä
power plants. When there are peak loads or possibly a blackout, the proper sized battery
system, 2 MWh for hybrid power plant concepts at this size, can provide power to the
load for the first 10 minutes, until the combustion engines are started and are fully run-
ning. As mentioned in Section 2.4.1 the Wärtsilä combustion engine will start in 30 se-
conds and generate full power in just 5 minutes in preheated mode. (Wärtsilä 2012c)

57
6 CONCEPT EXAMPLES
For determining the optimal hybrid power plant and the share of solar and wind power,
we chose to use PLEXOS® power system optimizer software, due to its special features
in solving all the details of engine start-ups, fuel intake, fuel costs etc. The use of
PLEXOS® makes it easy to compare several hybrid power generation concepts with dif-
ferent share of renewable generation.
These hybrid power generation concepts are made to be suitable for customers in Carib-
bean and other islands in the sun-belt region. Also, industrial and rural areas in the Mid-
dle East, with a lot of sun, are in the focus of Wärtsilä. Therefore, the weather data for
the calculations are taken from Aruba from the past 5 years. The weather conditions are
then scaled to fit the other possible locations with less wind or sun.
6.1 Calculations with PLEXOS®
The size of hybrid power plant in this thesis was determined to be 10 - 100 MW. There-
fore, we chose eleven 20V32 diesel combustion engines for this simulation. The supply
would have to cover the whole load, if the weather conditions were very bad and the
renewable power generation at zero. The peak load in this simulation is scaled to
97.9 MW. We chose to exclude the simulations with the gas engine since the difference
in results would not be that divergent. Moreover, the liquid fuel engine is mostly used in
these areas.
Jyrki Leino, Senior Power System Analyst working for Wärtsilä helped me to simulate
these scenarios with PLEXOS®.
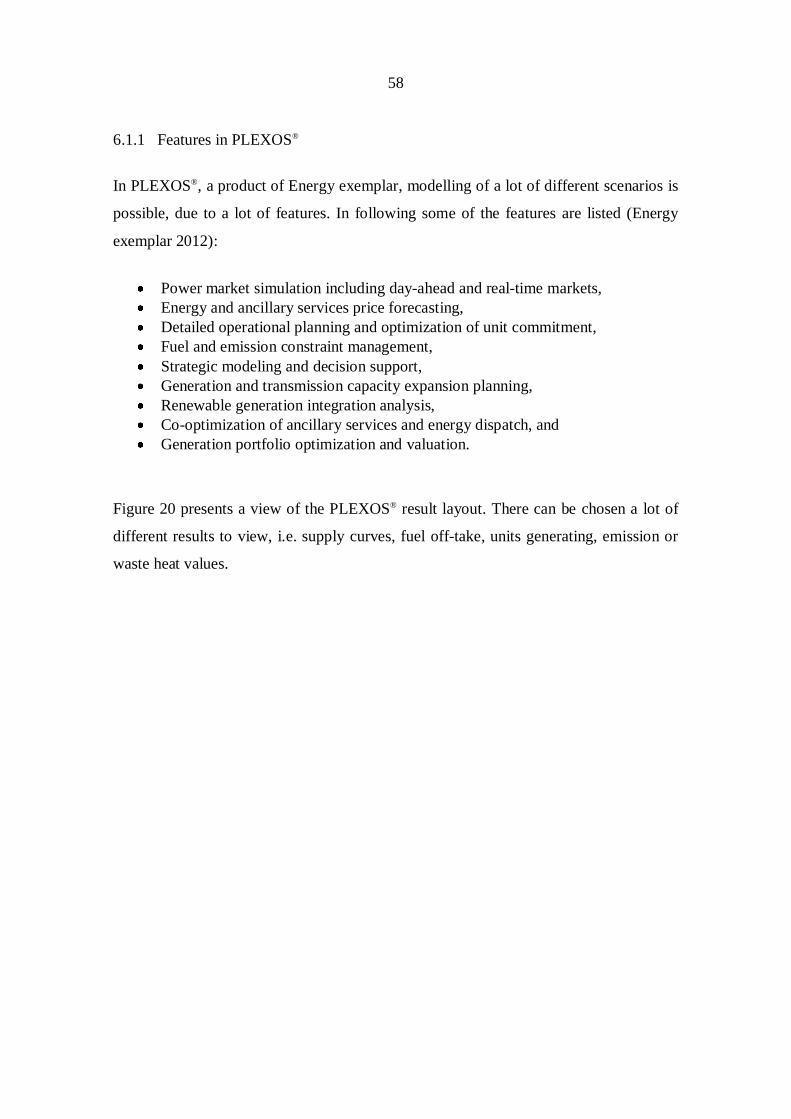
58
6.1.1 Features in PLEXOS®
In PLEXOS®, a product of Energy exemplar, modelling of a lot of different scenarios is
possible, due to a lot of features. In following some of the features are listed (Energy
exemplar 2012):
Power market simulation including day-ahead and real-time markets,Energy and ancillary services price forecasting,Detailed operational planning and optimization of unit commitment,Fuel and emission constraint management,Strategic modeling and decision support,Generation and transmission capacity expansion planning,Renewable generation integration analysis,Co-optimization of ancillary services and energy dispatch, andGeneration portfolio optimization and valuation.
Figure 20 presents a view of the PLEXOS® result layout. There can be chosen a lot of
different results to view, i.e. supply curves, fuel off-take, units generating, emission or
waste heat values.

59
Figure 20. Screenshot of PLEXOS® power system optimizer programme.
6.1.2 Inputs
First wind and solar data from Aruba, an appropriate country for this concept, was col-
lected and the power generation was also determined with the help of equations, factors
and given results. In Aruba the average wind speed was 7.6 m/s and the average solar
radiation 6 kWh/m2/day. (National Oceanic and Atmospheric Administration; Solar
Electricity Handbook Website 2013) For this simulation 2 MW wind turbines were cho-
sen, due to its suitability for hybrid concepts of this size. The cut-in speed and genera-
tion at a particular wind speed was calculated with a typical wind speed formula for
2 MW wind turbines. Then by using PLEXOS® software the combustion engine set with
different renewable penetration was simulated.

60
Two different types of hybrid power plant operations were chosen according to the load.
The first one is mainly for regular customers on islands in the sun-belt region and the
second one is for industrial sites where the load is more or less constant during a day.
These two different operation types are recognized from the results as fluctuating load
and stable load.
The cost of a PV system is typically given in price-per-peak-watt. Peak watt is defined
as the power at standard test conditions (solar radiance 1000 W/m2 and temperature
25 degrees in Celsius). PV system cost includes both module and BOS costs. The mod-
ules represent only 40 - 60 % of total PV system cost. The installation cost may vary
significantly depending on the location due to site preparation, assembly labour and
permit costs. (PVresource 2012)
Investment cost for wind power and PV production was found with several references.
For wind power the investment cost was estimated to be 1100 - 1800 €/kW installed ca-
pacity, including connection costs, for example frequency converters. For PV the cost
was estimated to 2000 - 3000 €/kW installed capacity, including BOS. Therefore we
chose the average cost and used 2500 €/kW for solar and 1500 €/kW for wind in the
calculations. Fuel costs, which will function as OPEX in the simulation, for a Wärtsilä
20V32 liquid fuel combustion engine is calculated to 13 €/GJ, which gives around
47 €/MWh generated energy. The fuel price was taken from an internal report and the
newest fuel price (02/13) for HFO in Caribbean area was 496 €/ton. The investment and
fuel costs can also easily be changed for the future, where most likely these costs are
changing a lot, especially the PV investment cost. Other O&M costs were calculated to
be more or less the same for the renewable systems as for the combustion engines. The
O&M costs are also not that high in comparison with investment and fuel costs, so they
could be ignored. (Nitsch, Pregger, Scholz & Naegler 2010; National renewable energy
laboratory 2012c; MacDonald 2010).

61
6.1.3 Short term run
In PLEXOS® power system optimiser software the values are given in Excel and there is
a profile made for each value. Then by giving multiples for these profiles, the inputs
will change and the output results as well, when simulating with PLEXOS®. For the
combustion engine profiles Wärtsilä has values which have been in use in previous cas-
es and that made this simulation a whole lot easier.
For both stable and fluctuating load four different “locations” were chosen. The differ-
ent locations were determined by choosing two rating factors for both. For solar 100 %
and 75 % of the peak radiation and for wind 100 % and 70 % of the peak wind speed
were chosen. In other words, the solar and wind values were scaled down to 75 % and
70 % from the peak to simulate locations with worse weather condition. This combined
with the yearly wind and solar data gave a capacity factor of 29 % and 20 % for wind
and respectively a capacity factor of 23 % and 18 % for solar. Capacity factor is the ra-
tio of a generation system’s actual output during a period, to the energy it would pro-
duce at full capacity during same period. According to National renewable energy la-
boratory (NREL 2012b) these are typical capacity factors for wind and solar power in
the suitable areas for our hybrid concept.
After determining the capacity factors, different scenarios for these locations were cal-
culated with 0 MW, 10 MW and 30 MW wind penetration, and the same for solar. All
the scenarios were combined and altogether 72 different scenarios were simulated. Pay-
back time results for only 64 combinations are shown due to the pointlessness of show-
ing scenarios with zero penetration of renewables.
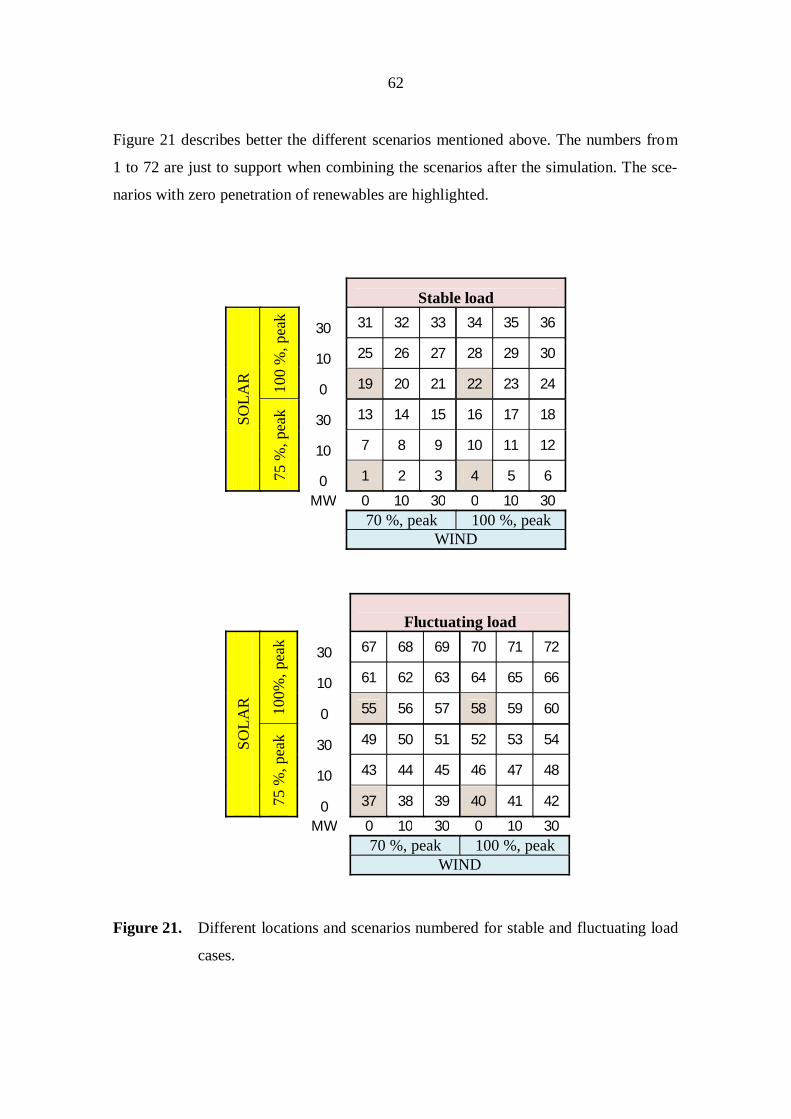
62
Figure 21 describes better the different scenarios mentioned above. The numbers from
1 to 72 are just to support when combining the scenarios after the simulation. The sce-
narios with zero penetration of renewables are highlighted.
Stable load
SOLA
R 100
%,p
eak
30 31 32 33 34 35 36
10 25 26 27 28 29 30
0 19 20 21 22 23 24
75%
,pea
k 30 13 14 15 16 17 18
10 7 8 9 10 11 12
0 1 2 3 4 5 6
MW 0 10 30 0 10 3070 %, peak 100 %, peak
WIND
Fluctuating load
SOLA
R 100%
,pea
k
30 67 68 69 70 71 72
10 61 62 63 64 65 66
0 55 56 57 58 59 60
75%
,pea
k 30 49 50 51 52 53 54
10 43 44 45 46 47 48
0 37 38 39 40 41 42
MW 0 10 30 0 10 3070 %, peak 100 %, peak
WIND
Figure 21. Different locations and scenarios numbered for stable and fluctuating load
cases.

63
6.2 Results
The simulations with PLEXOS® software gave a lot of different results. In this chapter
the most interesting supply and engine performance curves are shown. Also, the pay-
back times for different scenarios and the optimal power generation set-up are present-
ed.
Figure 22 presents the supply curves for solar, wind and 20V32 engines during a day. It
can be noticed that during noon the solar produces its peak and the engine generation
decrease. Due to peak consumption during noon, the drop of the engine generation is
not so big, just around half of the solar peak production. On Y-axis the power genera-
tion in megawatts and time on X-axis presented.
In hourly observations the wind or solar power generation are not zero. Thus, the
amount engines could be less, for savings in investment cost. At the same time on mi-
nute level there can be shortages in power supply and power delivery to the grid has to
be ensured during all time. Therefore, without a fast responding storage system or load
shedding the peak power demand has to be covered solely with combustion engines.
Figure 22. Power supply curves during a day for solar, wind and the 20V32 engines
with a fluctuating load and wind speed and solar radiation at 100 %.
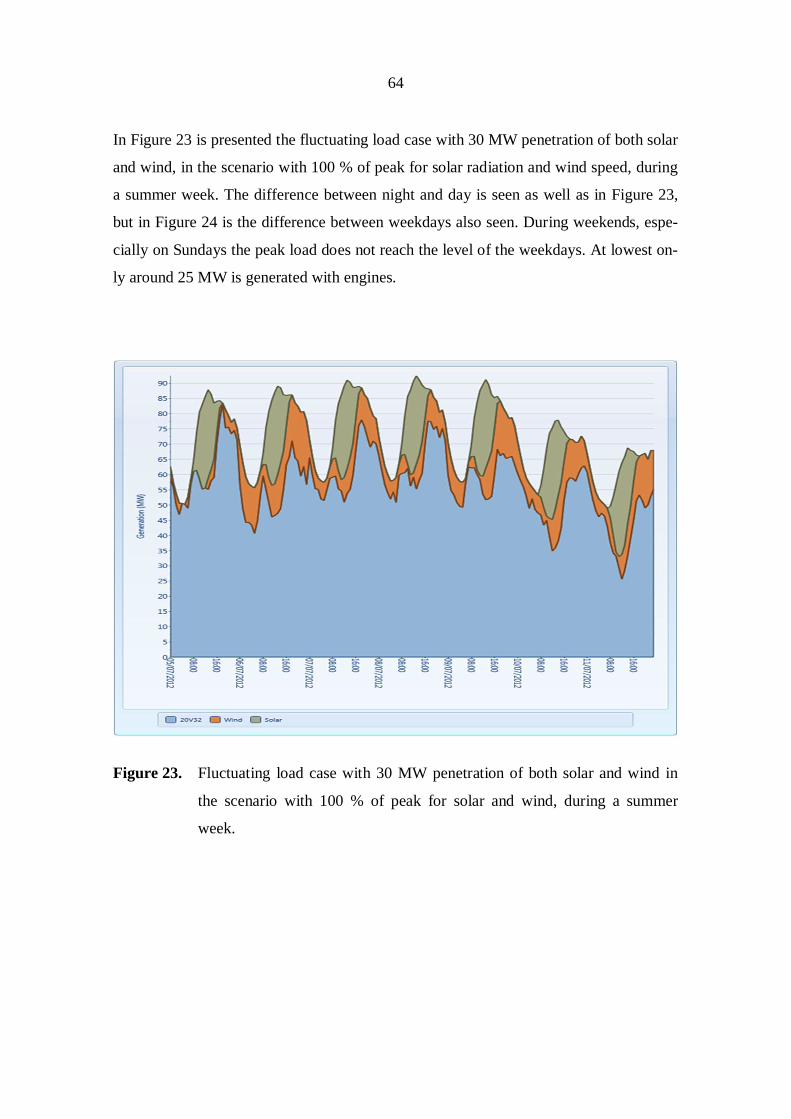
64
In Figure 23 is presented the fluctuating load case with 30 MW penetration of both solar
and wind, in the scenario with 100 % of peak for solar radiation and wind speed, during
a summer week. The difference between night and day is seen as well as in Figure 23,
but in Figure 24 is the difference between weekdays also seen. During weekends, espe-
cially on Sundays the peak load does not reach the level of the weekdays. At lowest on-
ly around 25 MW is generated with engines.
Figure 23. Fluctuating load case with 30 MW penetration of both solar and wind in
the scenario with 100 % of peak for solar and wind, during a summer
week.

65
Figure 24 shows the supply curve for the stable load case, with wind and solar penetra-
tion of 30 MW in the scenario with 100 % of peak for solar radiation and wind speed.
An interesting thing seen in Figure 24 is a couple drops in the middle of the week where
the power demand cannot be supported. Apparently due to poor weather conditions
when solar and wind did not generate at all power. Since, the peak demand was set to
100 MW and the engines only generate 97.9 MW, there is undersupply of a couple
MWs.
Figure 24. Stable load case with 30 MW penetration of both solar and wind in the
scenario with 100 % of peak for solar and wind, during a summer week.

66
A very interesting feature that can only be determined in advance by using the PLEX-
OS® software is shown in Figure 25. Depending of e.g. the load, fuel cost and start-up
cost, the optimal amount engines running at a particular time can be determined. This is
a situation with a fluctuating load, where the solar radiation is 100 % and the wind
speed 70 %, and both solar and wind penetration 10 MW. The lack of power supply
from the renewable sources will make all the engines run, in order to provide the cus-
tomer power demand. Another thing worth mentioning is that the use of a storage sys-
tem in our hybrid concept is unnecessary, since the fuel tanks combined with fast re-
sponding combustion engines work as a storage system. It can also be noticed that dur-
ing summer months the amount engines running is lower, due to better generation from
the renewable energy sources, especially solar.
Figure 25. Number of units generating during a year with a fluctuating load. On Y-
axis is the amount of units generating and on X-axis is time presented.

67
6.2.1 Payback time
Payback time refers to the time it takes for an investment to return the sum of the origi-
nal investment. The time is usually measured in years, depending on the investment
type. (Williams 2012)
The simplified payback time was calculated by subtracting the yearly winnings in re-
duction of fuel consumption from the investment cost of renewable power generation
system. The interest rate was not taken into account when calculating the simplified
payback time. Variety in time is quite large as can be seen in Figure 26. The suitability
of the renewable power generation for fluctuating load is seen with clearly lower pay-
back time from scenario 33 to 64 on X-axis. Altogether the payback times for these
simulations are relatively short. With high fuel price and good weather conditions the
money invested in renewable generation is gained easily during the systems lifetime of
20 - 30 years.
Figure 26. The simplified payback time for all simulated scenarios and locations pre-
sented. Payback time in years is shown on the Y-axis and on the X-axis are
the numbers 1 – 64 shown to indicate the different scenarios at different
locations as mentioned in Section 6.1.3.
0
5
10
15
20
25
30
35
40
45
1 3 5 7 9 1113 1517 1921 2325 27 2931 3335 3739 4143 4547 4951 5355 5759 61 63
Payb
ack
time
(yea
r)
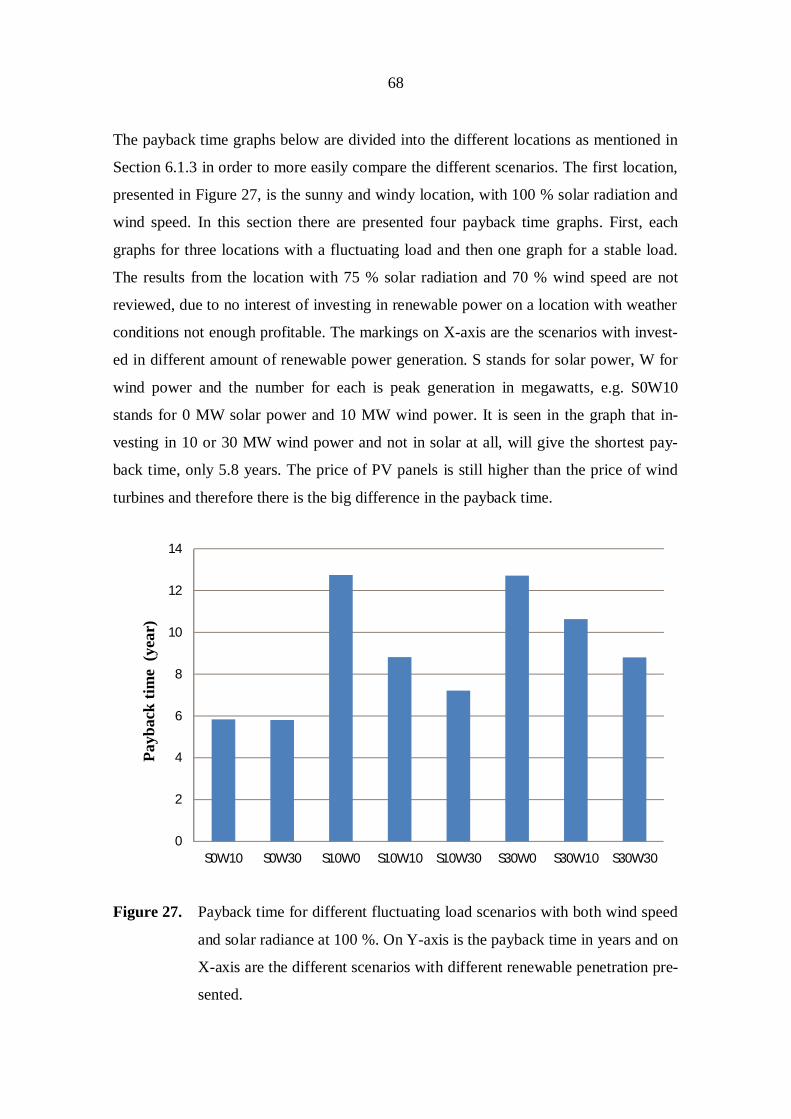
68
The payback time graphs below are divided into the different locations as mentioned in
Section 6.1.3 in order to more easily compare the different scenarios. The first location,
presented in Figure 27, is the sunny and windy location, with 100 % solar radiation and
wind speed. In this section there are presented four payback time graphs. First, each
graphs for three locations with a fluctuating load and then one graph for a stable load.
The results from the location with 75 % solar radiation and 70 % wind speed are not
reviewed, due to no interest of investing in renewable power on a location with weather
conditions not enough profitable. The markings on X-axis are the scenarios with invest-
ed in different amount of renewable power generation. S stands for solar power, W for
wind power and the number for each is peak generation in megawatts, e.g. S0W10
stands for 0 MW solar power and 10 MW wind power. It is seen in the graph that in-
vesting in 10 or 30 MW wind power and not in solar at all, will give the shortest pay-
back time, only 5.8 years. The price of PV panels is still higher than the price of wind
turbines and therefore there is the big difference in the payback time.
Figure 27. Payback time for different fluctuating load scenarios with both wind speed
and solar radiance at 100 %. On Y-axis is the payback time in years and on
X-axis are the different scenarios with different renewable penetration pre-
sented.
0
2
4
6
8
10
12
14
S0W10 S0W30 S10W0 S10W10 S10W30 S30W0 S30W10 S30W30
Payb
ack
time
(yea
r)

69
When the wind speed is reduced to 70 % but solar radiation is at 100 % the payback
times do not differ so much. Still, investing in wind is more economical than investing
in solar. If investing in both, due to daily and seasonal shortages, the scenario with
10 MW solar power and 30 MW wind power would have a relatively low payback time,
9.5 years. Results for these scenarios with different penetration in megawatts of solar
power and wind power are shown in Figure 28.
Figure 28. Payback time for different fluctuating load scenarios with 100 % solar ra-
diation and 70 % wind speed. On Y-axis is the payback time in years and
on X-axis are the different scenarios with different renewable penetration
presented.
0
2
4
6
8
10
12
14
S0W10 S0W30 S10W0 S10W10 S10W30 S30W0 S30W10 S30W30
Payb
ack
time
(yea
r)

70
Figure 29 shows the biggest differences in the payback time, 17 years versus 5.8 years.
The windy but not so sunny location, 75 % solar radiation and 100 % wind speed, clear-
ly points out the benefit of investing in wind power.
Figure 29. Payback time for different fluctuating load scenarios with 75 % solar radi-
ation and 100 % wind speed. On Y-axis is the payback time in years and
on X-axis are the different scenarios with different renewable penetration
presented.
For stable load cases it was assumed that the power plants are located in areas with
more sun and less wind i.e. on industrial or rural sites. Therefore, the payback time was
calculated with 100 % solar radiation. It is also most likely that they are not located at
coast and therefore, due to long distances with high cable cost and power losses, the
wind power was excluded from these graphs. A huge drop in payback time from 22.3 to
15.2 years for 10 MW respectively 30 MW installed solar power is seen in Figure 30.
0
2
4
6
8
10
12
14
16
18
S0W10 S0W30 S10W0 S10W10 S10W30 S30W0 S30W10 S30W30
Payb
ack
time
(yea
r)

71
Figure 30. Payback time for different stable load scenarios with 100 % solar radia-
tion. On Y-axis is the payback time in years and on X-axis are the different
scenarios with different renewable penetration presented.
6.2.2 Ideal set-up
The ideal set-up is difficult to determine. According to payback time, the best set-up for
fluctuating load cases would be 10 or 30 MW wind and no PV at all, even if the weather
conditions are sunny, but not so windy (solar radiation 100 % of peak and wind speed
70 % of peak). But when taking into account the declining price of PV panels, the inter-
est to invest in them arises, especially in the sunny locations. Besides, there might not
be possibilities for erecting wind turbines. In that case solar power is the renewable
generation to invest in. If investing in wind, the larger amount, 30 MW, is still a better
choice than 10 MW, due to lower payback time and less money spent on assembly in
proportion to the power generated. If investing in both wind and solar power, 10 MW
solar power would be sufficient with today’s investment cost according to the results. It
would have been interesting to simulate with a larger amount of renewable generation
0
5
10
15
20
25
S10W0 S30W0
Payb
ack
time
(yea
r)

72
and see at what point the investment in excessive renewable power would be worthless,
due to lower power demand than power supply.
Taking a look again at the payback times, depending on how much the customer is will-
ing to invest, and also the weather conditions and possibilities at the site, the ideal set-
up could be 30 MW wind power and 10 MW solar power, besides 97.9 MW engine
power output. Totally, the power plant generates 137.9 MW at peak if the power de-
mand arises. This set-up at the location with solar radiation and the wind speed at 100 %
of the peak, gives a payback time of 7.2 years, and with the wind speed reduced to 70 %
a payback time of 9.5 years. In Figure 31 are the ideal set-up of power generation and
the peak generation percentages shown.
Figure 31. Ideal set-up of power generation for a fluctuating load, with different share
of power generated by the engines, solar and wind.
For stable load the set-up is a bit different as mentioned in Section 6.2.1. When looking
at the payback time graph, investing in 30 MW solar power instead of 10 MW will
shorten the payback time from 22.3 years to 15.2 years. The peak power generation
71 %
7 %
22 %
Engine
Solar
Wind

73
would be 127.9 MW, but due to stable load, the peak is still 100 MW but the power
generated with the combustion engines is decreased to 70 % of total at peak solar radia-
tion times. With the maximal power output the share would be 77 % engine power and
23 % solar power. This set-up from the scenario with 100 % solar radiation is presented
in Figure 32.
Figure 32. Ideal set-up of power generation for a stable load, with different share of
power generated by the engines and solar.
6.3 CSP trough system for minimising own consumption
According to Cabeza, Sóle, Castell, Oró and Gil (2012) the efficiency from solar to
electricity is only 15 - 20 % in existing solar thermal power plants, when again the
thermal storage efficiency is up to 97 % at a temperature of 400 degrees in Celsius. Due
to that we choose to not convert the energy of the sunrays directly to electricity, but in-
stead using it to heat up a fluid and use that for heating of the engines and the fuel day
tank. Together they consume at least 2/3 of the whole own consumption. The suitability
of the CSP and thermal storage system for reducing own consumption in stand-by pow-
77 %
23 %
Engine
Solar

74
er plants is the reason why we only take that concept into consideration. Also, there is a
necessity of a storage system for this concept. Since, the power plant might not be run-
ning during night, then pre-heating is needed at that time and there is no power genera-
tion from the CSP. The storage system will decrease the price of the CSP system, since
a thermal storage system is a lot cheaper than a conventional battery storage system.
One advantage thermal collectors have unlike photovoltaic cells, is that thermal collec-
tors absorb radiation from the entire solar spectrum. Therefore, solar thermal plants can
utilize both the direct and diffuse solar radiation. (Cooper 2008)
The thermal storage is a key component if dispatchability is required. As can be seen in
Figure 33 the thermal storage lengthens the power supply, and for how long time de-
pends of the size of the thermal storage. The benefit of collecting diffuse radiation with
CSP is also seen in the figure.
Figure 33. Comparison of power generation between PV, CSP and thermal storage
during a day. (The Energy Industry Times 2013)

75
Figure 34 presents a simple closed system for pre-heating of the engines and the fuel
day tank. The parabolic trough system heats the fluid up to 220 degrees in Celsius and it
circulates between the troughs, buffer storage, and the object that is heated, in our case
it would be the engines.
Figure 34. CSP troughs in a closed system for industrial process heating. (Nep solar
2012)
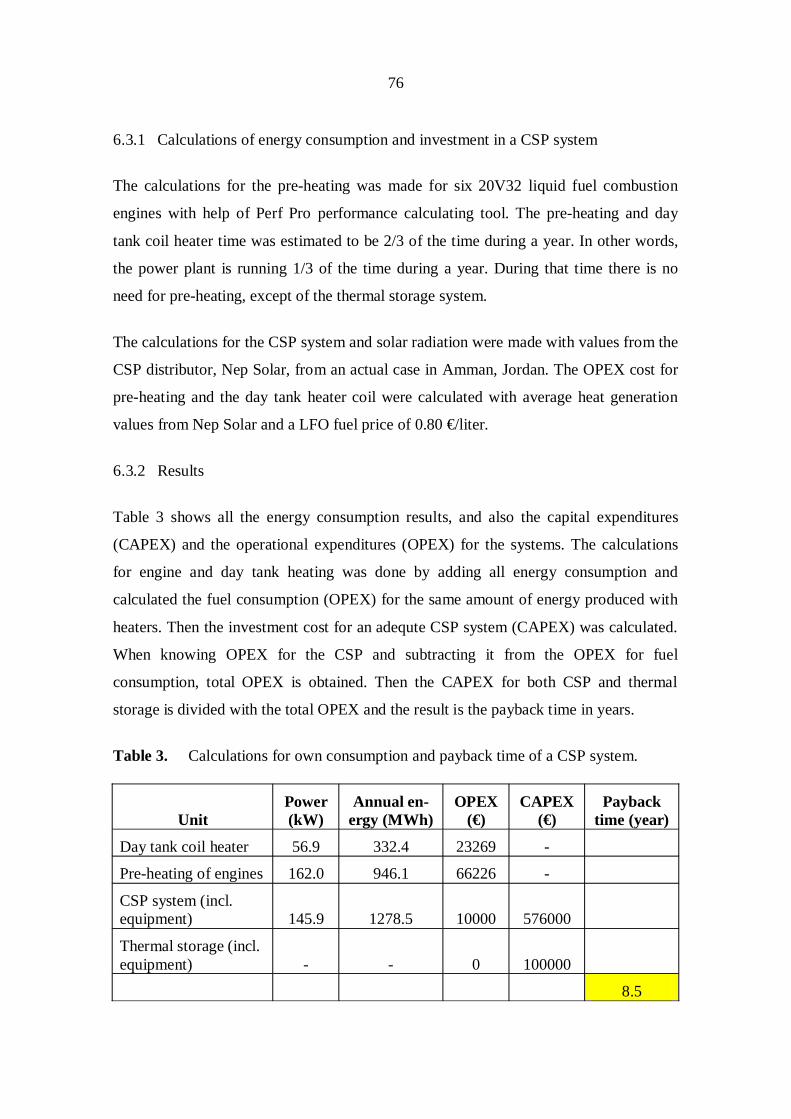
76
6.3.1 Calculations of energy consumption and investment in a CSP system
The calculations for the pre-heating was made for six 20V32 liquid fuel combustion
engines with help of Perf Pro performance calculating tool. The pre-heating and day
tank coil heater time was estimated to be 2/3 of the time during a year. In other words,
the power plant is running 1/3 of the time during a year. During that time there is no
need for pre-heating, except of the thermal storage system.
The calculations for the CSP system and solar radiation were made with values from the
CSP distributor, Nep Solar, from an actual case in Amman, Jordan. The OPEX cost for
pre-heating and the day tank heater coil were calculated with average heat generation
values from Nep Solar and a LFO fuel price of 0.80 €/liter.
6.3.2 Results
Table 3 shows all the energy consumption results, and also the capital expenditures
(CAPEX) and the operational expenditures (OPEX) for the systems. The calculations
for engine and day tank heating was done by adding all energy consumption and
calculated the fuel consumption (OPEX) for the same amount of energy produced with
heaters. Then the investment cost for an adequte CSP system (CAPEX) was calculated.
When knowing OPEX for the CSP and subtracting it from the OPEX for fuel
consumption, total OPEX is obtained. Then the CAPEX for both CSP and thermal
storage is divided with the total OPEX and the result is the payback time in years.
Table 3. Calculations for own consumption and payback time of a CSP system.
UnitPower(kW)
Annual en-ergy (MWh)
OPEX(€)
CAPEX(€)
Paybacktime (year)
Day tank coil heater 56.9 332.4 23269 -
Pre-heating of engines 162.0 946.1 66226 -
CSP system (incl.equipment) 145.9 1278.5 10000 576000
Thermal storage (incl.equipment) - - 0 100000
8.5

77
The area, which the CSP system generating continuous power of 145.9 kW will require,
is approximately 3600 m2, and that is a quite large area to find on a power plant site that
is already constructed. Nevertheless, there can be found free space on i.e. rooftops of the
buildings. A Wärtsilä power plant site has plenty of buildings where space on rooftops
is available, block transformer, engine auxiliary transformer, common auxiliary trans-
former shelter, fuel treatment house etc.
The payback time of 8.5 years seems as a decent investment, since the lifetime for a
combustion engine power plant and a CSP system is around 30 years. One thing that has
to be taken into account is the declining electricity spot-price during night. If the power
plant is in stand-by mode often during night, the benefits of applying the CSP system
will not be that high. Another thing is that most of the stand-by power plants are
running more than 1/3 of the time during a year, which likewise lowers the profitability
of the CSP system.
The average power production of the CSP during a year is 145.9 kW, which means that
on a summer day the power generation will be much higher and especially if the engines
are running, there will be a lot of excessive energy from the CSP system. Utilizing that
energy in something else to lower the own consumption will increase the efficiency
additionally.

78
7 DISCUSSION
A general trend is that fuel price is increasing while PV panel price is decreasing.
Therefore, we calculated also the payback time to have a look into the future. The HFO
fuel price is increased with 100 % being 1000 €/ton, since it has increased with 400 %
during the last 12 years, and the PV investment cost decreased with 100 % to
1250 €/kW. The cost for wind power in this calculation was remained the same,
1500 €/kW. As can be seen in Figure 35 the payback time curve is not so fluctuating as
it is with the current price level. Also, the payback time for 10 MW solar and 30 MW
wind is reduced from 7.2 years to 3 years, which is as a significant change. This situa-
tion is highly possible in the future, and if it takes place, investing in renewable power
generation in sun-belt countries with good weather condition is highly recommended.
Payback time calculations for Figure 35 are done with solar radiation and wind speed at
100 % of the peak, where the average wind speed is 7.6 m/s and the average solar radia-
tion 6 kWh/m2/day.
Figure 35. Payback time for different fluctuating load scenarios in the future, with
both wind speed and solar radiation at 100 %. On Y-axis is the payback
time in years and on X-axis are the different scenarios with different re-
newable penetration presented.
0
1
2
3
4
5
6
S0W10 S0W30 S10W0 S10W10 S10W30 S30W0 S30W10 S30W30
Payb
ack
time
(yea
r)

79
Subsidies aimed at reducing emissions can take on different forms, ranging from sup-
port for research and development, investment tax credits and price support mecha-
nisms, such as the feed-in tariffs (Wilke 2011; 7). As mentioned earlier the FITs and
other government subsidies were not taken into account in the calculations, due to a
range of different and continuously changing subsidies depending on the country.
Therefore, it should be taken into account when comparing payback times, since with
the current investment costs the subsidies are pivotal for investment in renewable power
generation.
When grid-parity, that moment when renewables produce electricity at same price as
purchased from the grid, is reached the renewable market might grow very fast in case
of low technical and legal obstacles (Breyer, Görig and Schmid 2011). However, also
subsidies will be cut off at that same moment.
Due to possible locations on islands, high fuel and transportation costs, and also possi-
ble problems with regular fuel transport or space for larger storage tanks will most like-
ly altogether affect positively the interest of investing in renewable power generation.
Hurtado, Gostales, de Lara, Moreno, Carrasco, Galván, Sancez and Franquelo (2002:
3326) stated already 10 years ago that hybrid power plants were “highly cost-effective”.
Consequently, hybrid power plants should be extremely cost-effective today. Therefore,
the problem does not lie in the economical profitability of renewable power generation,
but rather in the short list of reference projects and lack of marketing of hybrid con-
cepts.
The optimal hybrid concept is hard to define, despite numerous completed projects; the
optimal hybrid concept is still case-specific. Nevertheless, studies of hybrid concept
feasibility draw general lines in what is a must when designing a reliable and profitable
hybrid power plant. With this knowledge the hybrid power plant should reach a relative-
ly high efficiency and low payback time, if properly constructed.
For Wärtsilä the market situation for hybrid power plants is not either the best at the
moment. Customers may have already enough power generation to meet the power de-
80
mand and the payback time of 6 - 8 years is with this kind of huge investment still too
long for developing countries. Nevertheless, a lot of the existing power generation is old
and in need of being replaced or upgraded. Also, the power demand is increasing and
hence, investment in hybrid power plants utilizing renewable energy instead of conven-
tional power generation could be an option, due to minimization of fuel costs and emis-
sions.
The minimization of own consumption is hard to estimate exactly by making calcula-
tions. Therefore, it could be studied further by making a pilot project at a site. Also, the
minimization with a CSP system is only an option in the sunny locations. Hereby, a
study of minimization of own consumption with the use of other systems could be wor-
thy for Wärtsilä.

81
8 SUMMARY
The aim of this thesis was to calculate and design the ideal share of renewable energy in
a hybrid power plant combined with Wärtsilä combustion engines for off-grid or small
grid (10 - 300 MW) solutions. Also, minimization of the power plant’s own consump-
tion, especially pre-heating of the engines and fuel tanks with renewable energy was
calculated.
First, the Wärtsilä power plant set-up was reviewed. The different combustion engines
and their performances, starting and running, power plant automation and the different
operating modes of the power plant were presented. Thereafter, a look of the challenges
with power generation on islands and the affection of power quality when using renew-
able power generation were done. When there are long distances between the mainland
grid and islands, savings could be made by adding power generation directly on the is-
land, instead of installing a costly interconnection cable. Of power quality affections,
voltage issues, such as fluctuation and dips, are considered mostly harmful when con-
necting renewable energy sources to the grid. Also, harmonic and frequency variations
occur.
When constructing a hybrid power plant with renewable energy sources, not only the
site and appropriate power generating systems are important, but also the management
of generating sets and power quality, as well as the weather forecasting. Due to fluctua-
tions in power generation with renewable energy sources, the fast starting combustion
engines fit brilliantly together in a hybrid power generation concept with wind and solar
power generating systems. Furthermore, adding of storage system was discussed and it
would additionally increase the reliability of the power supply. On the other hand, the
high cost and short lifetime makes it still a non-profitable solution that could be step-
wise implemented to the power plant in the future when its technology has improved.
Moreover, with the fast starting and load following combustion engine the stored fuel
will work as storage system, responding to the power demand very fast.
The suitable combustion engines for a hybrid power generation concept at this size were
also studied and due to the small size of the power plant (less than 100 MW) the optimal

82
engine would be the 20V32 liquid fuel engine, the 20V34SG gas engine or the
20V32DF dual fuel engine, capable of using both liquid and gaseous fuels. These en-
gines generate a maximum power of around 9 to 10 MW. The bigger combustion en-
gines are not as suitable, due to their high power generation, which leads to less units in
a power plant and thus the power supply is affected more during a possible trip of an
engine. Besides, the smaller combustion engines are easier to transport and install at a
site, which is especially considerable if the power plant is constructed on an island.
The minimization of own consumption, especially the pre-heating of the engines and
fuel tanks, in existing Wärtsilä power plants with a concentrated solar power (CSP) sys-
tem and thermal storage was reviewed. The CSP system fits in this concept well due to
the efficiency of not converting the hot water to electricity, but utilizing it directly in the
pre-heating, which is the biggest energy consumer in a stand-by power plant. Some cal-
culations of the power plants’ energy consumption and the payback time of the CSP
system showed that if the power plant is located in a sunny area and is in pre-heated
stand-by mode approximately 2/3 of the time during a year, the profitability would be
great and the payback time is only 8.5 years.
In the economical view, renewable power generation systems, such as wind turbines
and PV arrays are cost-effective nowadays. In this thesis some payback time calcula-
tions of hybrid power generation concepts were done, with the focus of savings in fuel
costs when adding an amount of 10 - 40 % renewable penetration to a Wärtsilä power
plant, using HFO as fuel. The simulations were made for two different kinds of power
plants. One with a fluctuating load, which simulates a normal power demand on an is-
land, and another one with a steady base load, mostly for power plants on industrial
sites. The simulation results showed that a payback time of 5.8 years at lowest and an
average of 8 years was possible to reach with the adding of solar and wind power if the
weather conditions at site are suitable. The interest rate was not taken into account when
calculating the payback time. However, with increasing fuel costs and decreasing elec-
trical component costs, such as PV panels, the investing in renewables in near future is
highly recommended. Especially on islands the fuel shipping and storing generates
83
higher costs and possible issues. Therefore, a lot of possible customers for this hybrid
concept are located on islands in the sun-belt countries with good weather conditions.
In this thesis the solar, wind and load data were simulated to fit each possible location
separately. Due to this, all possible hybrid concepts have to be thoroughly planned and
structured for all the different locations. Feed-in tariffs (FIT) and other subsidies were
not taken into account in the calculations, and with their impact the payback times and
thus the profitability of investing in a hybrid power plant would increase additionally.
The marketing of the profitability of these hybrid power generation concepts is a neces-
sity, because in the end, it is always the attractiveness of the product from the custom-
er’s point of view that is the key to successful business.
84
LIST OF REFERENCES
Abi-Samra, Nicholas (2012). Renewables challenge transmission and distribution para-
digms. [online]. [cited: 12.12.2012]. Available from Internet: <URL:
http://www.fierceenergy.com/story/renewables-challenge-transmission-and-
distribution-paradigms/2012-11-13#ixzz2EkK2a4id>.
Ackermann, Thomas (2005). Wind Power in Power Systems. West Sussex, England:
John Wiley & Sons Ltd. 691 p.
Alternative Energy News (2012). [online]. [cited: 20.11.2012]. Available from Internet:
<URL: http://www.alternative-energy-news.info/technology/wind-power/wind-
turbines/>.
Bloomberg, Scott, James Heidell, Paul Bernstein, Dr. Sugandha, D. Tuladhar and Mike
King (2013). Impacts of renewable energy subsidies/incentives on costs of achiev-
ing renewables goals. [online]. [cited: 8.2.2013]. <http://www.nera.com/nera-
files/PUB_Renewable_Energy_Subsidies_Incentives_1212.pdf>.
Breyer, Ch., M. Görig and J. Schmid (2011). Fuel-parity: Impact of photovoltaics on
global fossil fuel fired power plant business, 26. Symposium photovoltaische so-
larenergie, March 2011, Bad staffelstein, Germany.
Bryans, Leslie and Alan Kennedy (2007). System Role of Generation, power point
presentation. [online]. [cited: 8.10.2012]. Available from Internet: <URL:
www.soni.ltd.uk>.
Cabeza, Luisa, Christian Sóle, Albert Castell, Eduard Oró and Antoni Gil (2012) Re-
view of solar thermal storage techniques and associated heat transfer technologies.
Proceedings of the IEEE, volume: 100 issue: 2, February 2012, 525 – 538.
85
Camacho, Eduardo, F. Tariq Samad, Mario Garcia-Sanz and Ian Hiskens (2011). Con-
trol for Renewable Energy and Smart Grids. [online]. [cited: 11.10.2012]. Available
from Internet: <URL:http://tc1.ieeecss.org/sites/ieeecss.org/files/documents/IoCT-
Part1-06RESG.pdf>.
Cardenas, R., R. Pena, M. Perez, J. Clare, G. Asher and F. Vargas (2006). Vector con-
trol of front-end converters for variable-speed wind-diesel systems. IEEE Transac-
tions on Industrial Electronics 53:4, 1127 – 1136.
Cooper, Thomas (2008). Design of a 200 kW solar thermal power plant for use in On-
tario, bachelor thesis, 2008, Canada. 57 p.
Denholm, Paul, Maureen Hand, Maddalena Jackson, and Sean Ong (2009). Land-use
requirements of modern wind power plants in the United States, Technical Report
NREL, August 2009.
Ellis, Abraham, Robert Nelson, Edi Von Engeln, Reigh Walling, Jason McDowell, Leo
Casey, Eric Seymour, William Peter, Chris Barker, and Brendan Kirby (2012). Re-
active Power Interconnection Requirements for PV and Wind Plants – Recommen-
dations to NERC, California, USA. [online]. [cited: 17.12.2012]. Available from In-
ternet: <URL: http://renew-ne.org/wp-content/uploads/2012/05/Reactive-Power-
Interconnection-Requirements.pdf>.
Energy Exemplar. Official homepage of energy exemplar. [online]. [cited: 7.2.2013].
Available from Internet: <URL: http://www.energyexemplar.com/>.
Eurelectric (2012). EU islands: Towards a sustainable energy future, Eurelectric report,
June 2012, Malta. 62 p.
European Photovoltaic Industry Association (2012). [online]. [cited: 17.10.2012].
Available from Internet: <URL: http://www.epia.org/solar-pv/faq.html>.
86
Gabler, H. and E. Wiemken (1998). Modelling of stand-alone PV-hybrid systems and
comparison of system concepts, proceedings of 2nd world conference on photovol-
taic solar energy conversion, 6-10 July, 1998, Vienna, Austria.
Green Rhino Energy (2012). [online]. [cited: 29.10.2012]. Available from Internet:
<URL: http://www.greenrhinoenergy.com/solar/radiation/empiricalevidence.php>.
Hiekka, Toni (2012). Pienjännitteinen sähkönjakelukojeisto tasajännitekuormille. Dip-
lomityö, Vaasan Yliopisto, sähkötekniikan koulutusohjelma. 93 p.
Hossein Madaeni, Seyed, Ramteen Sioshansi and Paul Denholm (2012). How thermal
energy storage enhances the economic viability of concentrating solar power. USA.
Hurtado, S., G. Gostales, A. de Lara, N. Moreno, J.M. Carrasco, E. Galván, J.A. Sancez
and L.G. Franquelo (2002). A new power stabilization control system based on
making use of mechanical inertia of a variable-speed wind-turbine for standalone
wind-diesel applications. IEEE 2002 28th Annual Conference of the Industrial Elec-
tronics Society, November 5 – 8 2002, Sevilla, Spain.
Hyytinen, Toni (2012). Aurinkosähkön hybridisovellukset. Sähkötekniikan seminaari,
Vaasan Yliopisto, sähkötekniikan koulutusohjelma. 28 p.
Keffer, David (2010). Strategies for sustainable energy, lecture 5. production part I,
College of Engineering, Yonsei University, South Korea.
KEMA (2012). Frequency stability contribution of Wartsila combustion engines,
KEMA report, March 2012, Netherlands.
Khursid, Hasan, Fatima Kaniz and Md Mahmood Sohel (2011). Feasibility of hybrid
power generation over wind and solar standalone system, the 5th international pow-
er enigneering and optimization conference, 6-7 June, Malaysia.

87
Klimstra, Jacob and Markus Hotakainen (2012). Smart power generation, Avain
publishers Helsinki, 2012, Finland. 194 p.
Kujipers, Wim, Gerben Dekker and Richard de Groot (2012). Impact of high wind pen-
etration on an island power supply system, 11th wind integration workshop, 13-15
November, Lisbon, Portugal.
Kundur, Prabha (2012). Power system stability and control, October 2012, Västerås,
Sweden.
Luque, Antonio and Steven Hegedus (2011). Handbook of Photovoltaic Science and
Engineering, Spain and USA, John Wiley & Sons Inc. 1132 p.
MacDonald, Mott (2010). UK electricity generation costs update. [online]. [cited:
4.2.2012]. Available from Internet:
<URL:http://www.decc.gov.uk/assets/decc/statistics/projections/71-uk-electricity-
generation-costsupdate-.pdf>.
Morren, J., S.W.H. de Haan and J.A. Ferreira (2005). Contribution of DG units to pri-
mary frequency control. 2005 International Conference on Future Power Systems,
November 16 - 18, 2005, Amsterdam, The Netherlands.
National Oceanic and Atmospheric Administration. Official homepage of National
Oceanic and Atmospheric Administration. [online]. [cited: 4.2.2012]. Available
from Internet: <URL: http://www.noaa.gov/>.
National Renewable Energy Laboratory (2012a). Calculator for overall DC to AC derate
Factor [online]. [cited: 3.1.2013]. Available from Internet:
<URL:http://rredc.nrel.gov/solar/calculators/PVWATTS/version1/derate.cgi>.
National Renewable Energy Laboratory (2012b). Utility-scale energy technology capac-
ity factors [online]. [cited: 11.2.2013]. Available from Internet:
<URL:http://www.nrel.gov/analysis/tech_cap_factor.html>.

88
National Renewable Energy Laboratory (2012c). Photovoltaic (PV) pricing trends: his-
torical, recent, and near-term projections [online]. [cited: 5.2.2013]. Available from
Internet: <URL:http://www.nrel.gov/docs/fy13osti/56776.pdf>.
NEP Solar (2012). Technical fact sheet for NEP Solar concentrating process heat collec-
tors. Zurich, Switzerland.
Nitsch, Joachim, Thomas Pregger, Yvonne Scholz and Tobias Naegler. (2010). Lang-
fristszenarien und Strategien für den Ausbau der erneuerbaren energien in
Deutschland bei berücksichtigung der entwicklung in Europa und global, leitstudie
2010. [online]. [cited: 5.2.2013]. Available from Internet: <URL:
http://www.bmu.de/files/pdfs/allgemein/application/pdf/leitstudie2010_bf.pdf>.
Partnership for renewables (2010). [online]. [cited: 19.11.2012]. Available from Inter-
net: <URL: http://www.pfr.co.uk/rushymead/15/Wind-Power/119/Capacity-
Factor/>.
PVresources (2012). [online]. [cited: 14.2.2013]. Available from Internet:
<URL:http://www.pvresources.com/Economics.aspx>.
Ross, Michael (2004). Comparison of AC, DC, and AC/DC bus configurations for PV
hybrid systems. [online]. [cited: 12.2.2013]. Available from Internet: <URL:
http://www.rerinfo.ca/documents/trBusCompare.pdf>.
Solar Electricity Handbook Website (2013). [online]. [cited: 4.2.2013]. Available from
Internet: <URL: http://solarelectricityhandbook.com/solar-irradiance.html>.
Solar Energy Development Programmatic EIS (2012). Concentrating solar power csp
techniques. [online]. [cited: 17.10.2012]. Available from Internet: <URL:
http://solareis.anl.gov/guide/solar/csp/index.cfm>.
Solar cell (2013). [online]. [cited: 27.2.2013]. Available from Internet:
<http://www.solarcell.net.in/wp-content/uploads/2011/09/solar_cell.gif>.
89
Solar Frontier K.K. (2012). Raising mine profitability with solar-diesel hybrid technol-
ogy, September 2012, Tokyo, Japan.
Sorrel, C, T. Palmer, L. Bowen and A. Nakaruk (2009). Solar-thermal energy conver-
sion and storage: Conductive heat transfer using bulk graphite. IEEE international
conference on applied superconductivity and electromagnetic devices, September
25-27, 2009, Chengdu, China.
The Energy Industry Times (2013). Solar export from North Africa to Europe: no long-
er a mirage. Volume 5 No 12, February 2013, p14.
Veszpremi, K and I. Schmidt (2007). Flywheel energy storage drive for wind turbines.
PEDS ´07. 7th International Conference on Power Electronics and Drive Systems,
November 27 – 30, 2007, Bangkok, Thailand.
Voutilainen, Vesa (2007). Tasasähköjakelun käyttöpotentiaalin määrittäminen. Diplo-
mityö, LTY, Sähkötekniikan koulutusohjelma, Sähkötekniikan osasto. 117 p.
Wilke, Marie (2011). Feed-in tariffs for renewable energy and WTO subsidy rules.
[online]. [cited: 25.2.2013]. Available from Internet: <URL:
http://ictsd.org/downloads/2011/11/feed-in-tariffs-for-renewable-energy-and-wto-
subsidy-rules.pdf>.
Williams, J.R. et al. (2012). Financial and managerial accounting. Mcgraw Hill.
1117 p.
Wind energy (Beijing) co LTD (2010). [online]. [cited: 25.2.2013]. Available from In-
ternet: <URL:
http://upload.ecvv.com/upload/Product/200801/C200826111457597973_WIND_DI
ESEL_HYBRID_SYSTEM.gif>.
Wägar, Niklas (2012). Power plant electrical & automation system - gas plants, power
point presentation.

90
Wägar, Niklas, Mats Östman, Mikael Wideskog and Eirik Linde (2012). Smart Power
Generation with flexible Gas Engine concepts, Power-gen Europe confer-
ence&exhibition, June 2012, Cologne, Germany.
Wärtsilä (2012a). Power plants product catalogue, 2nd edition. 99 p.
Wärtsilä (2012b). Wärtsilä official internet home page. [online]. Available from Inter-
net: <URL: http://www.wartsila.com>.
Wärtsilä (2012c). General Energy Storage System. Internal document. 54 p.
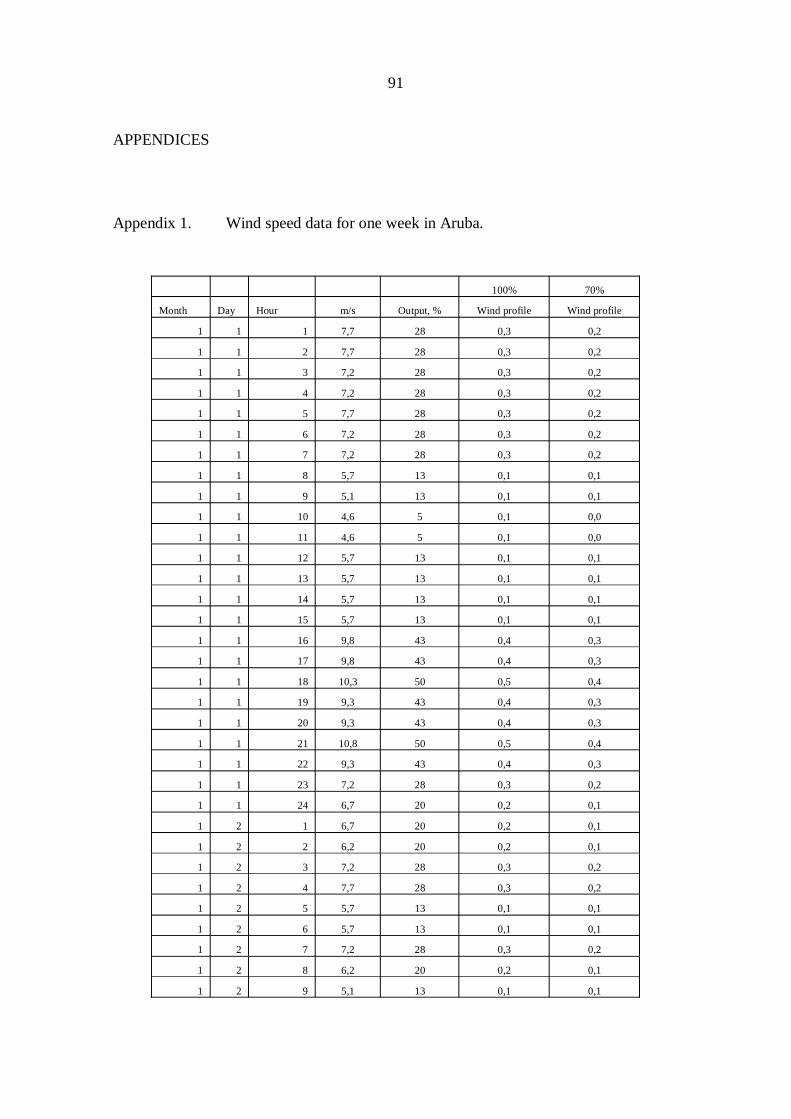
91
APPENDICES
Appendix 1. Wind speed data for one week in Aruba.
100% 70%
Month Day Hour m/s Output, % Wind profile Wind profile
1 1 1 7,7 28 0,3 0,2
1 1 2 7,7 28 0,3 0,2
1 1 3 7,2 28 0,3 0,2
1 1 4 7,2 28 0,3 0,2
1 1 5 7,7 28 0,3 0,2
1 1 6 7,2 28 0,3 0,2
1 1 7 7,2 28 0,3 0,2
1 1 8 5,7 13 0,1 0,1
1 1 9 5,1 13 0,1 0,1
1 1 10 4,6 5 0,1 0,0
1 1 11 4,6 5 0,1 0,0
1 1 12 5,7 13 0,1 0,1
1 1 13 5,7 13 0,1 0,1
1 1 14 5,7 13 0,1 0,1
1 1 15 5,7 13 0,1 0,1
1 1 16 9,8 43 0,4 0,3
1 1 17 9,8 43 0,4 0,3
1 1 18 10,3 50 0,5 0,4
1 1 19 9,3 43 0,4 0,3
1 1 20 9,3 43 0,4 0,3
1 1 21 10,8 50 0,5 0,4
1 1 22 9,3 43 0,4 0,3
1 1 23 7,2 28 0,3 0,2
1 1 24 6,7 20 0,2 0,1
1 2 1 6,7 20 0,2 0,1
1 2 2 6,2 20 0,2 0,1
1 2 3 7,2 28 0,3 0,2
1 2 4 7,7 28 0,3 0,2
1 2 5 5,7 13 0,1 0,1
1 2 6 5,7 13 0,1 0,1
1 2 7 7,2 28 0,3 0,2
1 2 8 6,2 20 0,2 0,1
1 2 9 5,1 13 0,1 0,1
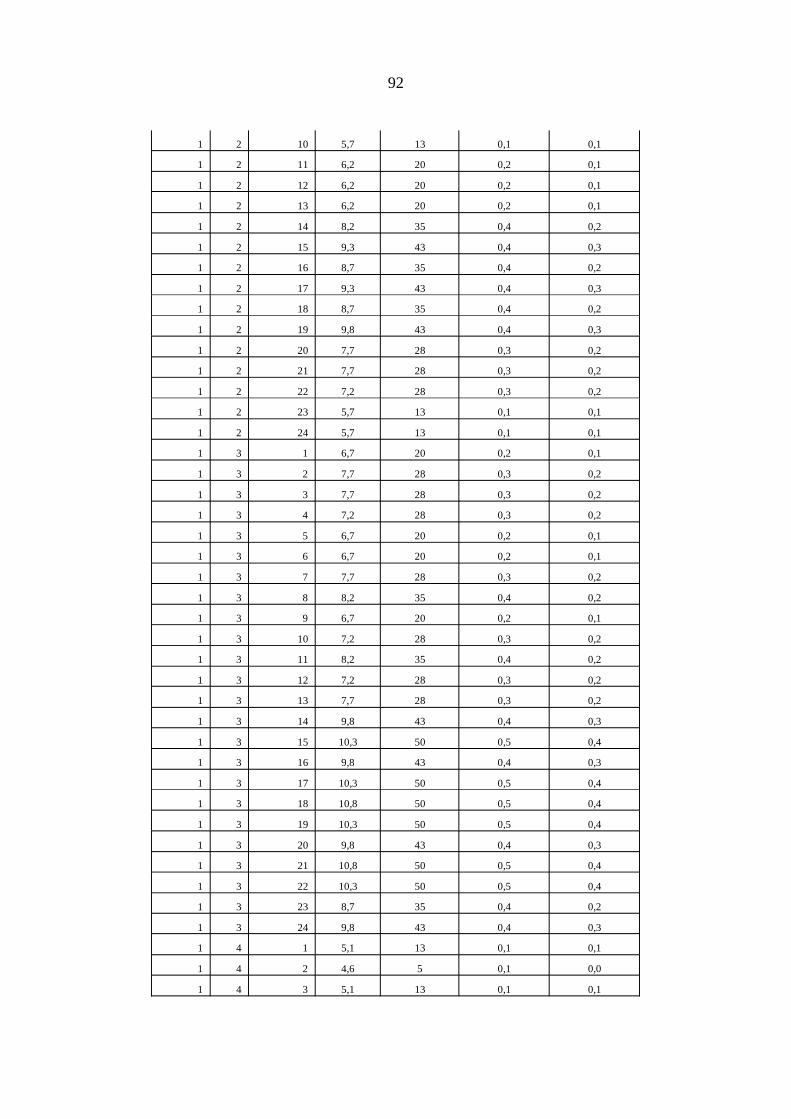
92
1 2 10 5,7 13 0,1 0,1
1 2 11 6,2 20 0,2 0,1
1 2 12 6,2 20 0,2 0,1
1 2 13 6,2 20 0,2 0,1
1 2 14 8,2 35 0,4 0,2
1 2 15 9,3 43 0,4 0,3
1 2 16 8,7 35 0,4 0,2
1 2 17 9,3 43 0,4 0,3
1 2 18 8,7 35 0,4 0,2
1 2 19 9,8 43 0,4 0,3
1 2 20 7,7 28 0,3 0,2
1 2 21 7,7 28 0,3 0,2
1 2 22 7,2 28 0,3 0,2
1 2 23 5,7 13 0,1 0,1
1 2 24 5,7 13 0,1 0,1
1 3 1 6,7 20 0,2 0,1
1 3 2 7,7 28 0,3 0,2
1 3 3 7,7 28 0,3 0,2
1 3 4 7,2 28 0,3 0,2
1 3 5 6,7 20 0,2 0,1
1 3 6 6,7 20 0,2 0,1
1 3 7 7,7 28 0,3 0,2
1 3 8 8,2 35 0,4 0,2
1 3 9 6,7 20 0,2 0,1
1 3 10 7,2 28 0,3 0,2
1 3 11 8,2 35 0,4 0,2
1 3 12 7,2 28 0,3 0,2
1 3 13 7,7 28 0,3 0,2
1 3 14 9,8 43 0,4 0,3
1 3 15 10,3 50 0,5 0,4
1 3 16 9,8 43 0,4 0,3
1 3 17 10,3 50 0,5 0,4
1 3 18 10,8 50 0,5 0,4
1 3 19 10,3 50 0,5 0,4
1 3 20 9,8 43 0,4 0,3
1 3 21 10,8 50 0,5 0,4
1 3 22 10,3 50 0,5 0,4
1 3 23 8,7 35 0,4 0,2
1 3 24 9,8 43 0,4 0,3
1 4 1 5,1 13 0,1 0,1
1 4 2 4,6 5 0,1 0,0
1 4 3 5,1 13 0,1 0,1
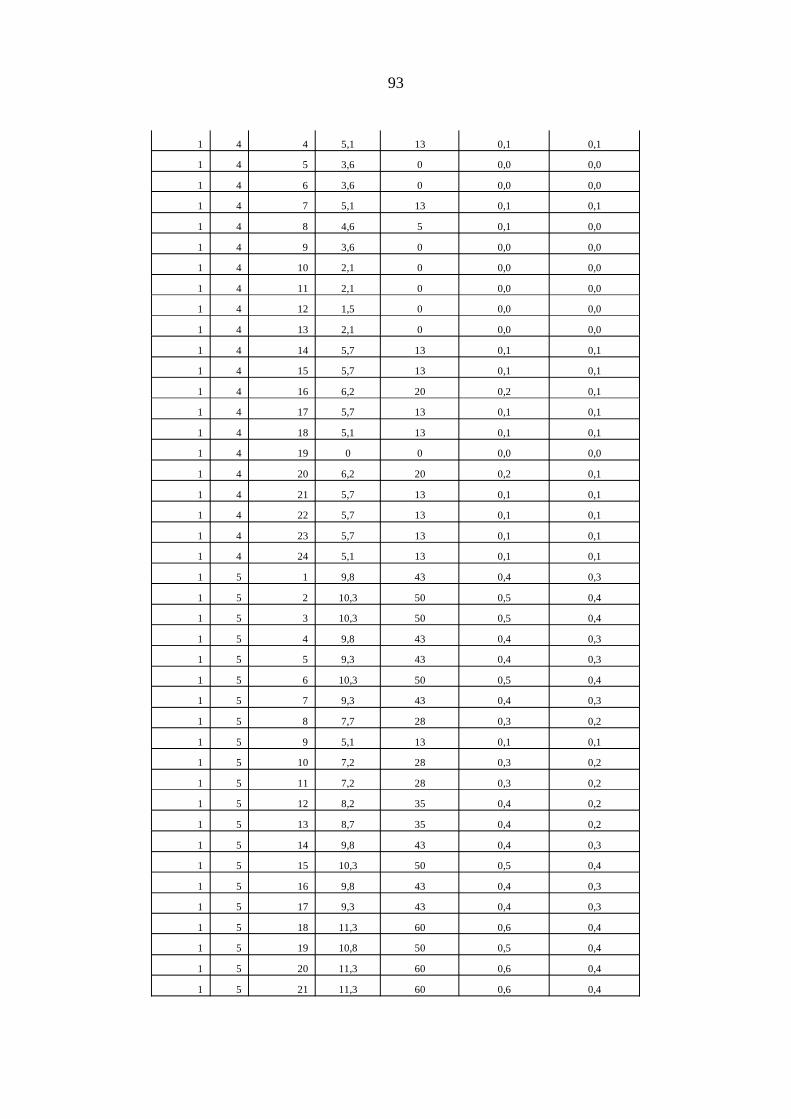
93
1 4 4 5,1 13 0,1 0,1
1 4 5 3,6 0 0,0 0,0
1 4 6 3,6 0 0,0 0,0
1 4 7 5,1 13 0,1 0,1
1 4 8 4,6 5 0,1 0,0
1 4 9 3,6 0 0,0 0,0
1 4 10 2,1 0 0,0 0,0
1 4 11 2,1 0 0,0 0,0
1 4 12 1,5 0 0,0 0,0
1 4 13 2,1 0 0,0 0,0
1 4 14 5,7 13 0,1 0,1
1 4 15 5,7 13 0,1 0,1
1 4 16 6,2 20 0,2 0,1
1 4 17 5,7 13 0,1 0,1
1 4 18 5,1 13 0,1 0,1
1 4 19 0 0 0,0 0,0
1 4 20 6,2 20 0,2 0,1
1 4 21 5,7 13 0,1 0,1
1 4 22 5,7 13 0,1 0,1
1 4 23 5,7 13 0,1 0,1
1 4 24 5,1 13 0,1 0,1
1 5 1 9,8 43 0,4 0,3
1 5 2 10,3 50 0,5 0,4
1 5 3 10,3 50 0,5 0,4
1 5 4 9,8 43 0,4 0,3
1 5 5 9,3 43 0,4 0,3
1 5 6 10,3 50 0,5 0,4
1 5 7 9,3 43 0,4 0,3
1 5 8 7,7 28 0,3 0,2
1 5 9 5,1 13 0,1 0,1
1 5 10 7,2 28 0,3 0,2
1 5 11 7,2 28 0,3 0,2
1 5 12 8,2 35 0,4 0,2
1 5 13 8,7 35 0,4 0,2
1 5 14 9,8 43 0,4 0,3
1 5 15 10,3 50 0,5 0,4
1 5 16 9,8 43 0,4 0,3
1 5 17 9,3 43 0,4 0,3
1 5 18 11,3 60 0,6 0,4
1 5 19 10,8 50 0,5 0,4
1 5 20 11,3 60 0,6 0,4
1 5 21 11,3 60 0,6 0,4

94
1 5 22 12,9 70 0,7 0,5
1 5 23 11,3 60 0,6 0,4
1 5 24 12,3 70 0,7 0,5
1 6 1 6,2 20 0,2 0,1
1 6 2 6,2 20 0,2 0,1
1 6 3 6,7 20 0,2 0,1
1 6 4 5,1 13 0,1 0,1
1 6 5 6,7 20 0,2 0,1
1 6 6 6,2 20 0,2 0,1
1 6 7 5,7 13 0,1 0,1
1 6 8 5,1 13 0,1 0,1
1 6 9 6,2 20 0,2 0,1
1 6 10 6,7 20 0,2 0,1
1 6 11 6,2 20 0,2 0,1
1 6 12 5,1 13 0,1 0,1
1 6 13 7,2 28 0,3 0,2
1 6 14 7,7 28 0,3 0,2
1 6 15 8,2 35 0,4 0,2
1 6 16 8,7 35 0,4 0,2
1 6 17 8,7 35 0,4 0,2
1 6 18 8,2 35 0,4 0,2
1 6 19 8,2 35 0,4 0,2
1 6 20 8,7 35 0,4 0,2
1 6 21 9,3 43 0,4 0,3
1 6 22 9,3 43 0,4 0,3
1 6 23 7,7 28 0,3 0,2
1 6 24 7,7 28 0,3 0,2
1 7 1 6,2 20 0,2 0,1
1 7 2 6,7 20 0,2 0,1
1 7 3 6,7 20 0,2 0,1
1 7 4 6,2 20 0,2 0,1
1 7 5 6,7 20 0,2 0,1
1 7 6 5,1 13 0,1 0,1
1 7 7 7,2 28 0,3 0,2
1 7 8 5,7 13 0,1 0,1
1 7 9 6,7 20 0,2 0,1
1 7 10 6,2 20 0,2 0,1
1 7 11 4,6 5 0,1 0,0
1 7 12 5,1 13 0,1 0,1
1 7 13 4,6 5 0,1 0,0
1 7 14 7,2 28 0,3 0,2
1 7 15 7,2 28 0,3 0,2

95
1 7 16 8,7 35 0,4 0,2
1 7 17 7,7 28 0,3 0,2
1 7 18 7,7 28 0,3 0,2
1 7 19 8,2 35 0,4 0,2
1 7 20 8,2 35 0,4 0,2
1 7 21 7,7 28 0,3 0,2
1 7 22 7,7 28 0,3 0,2
1 7 23 6,7 20 0,2 0,1
1 7 24 6,7 20 0,2 0,1

96
Appendix 2. Monthly average solar power generation data in MW with 15 min in-
tervals.
15min Jan Feb Mar Apr May Jun Jul Aug Sep Oct Nov Dec
1 0 0 0 0 0 0 0 0 0 0 0 02 0 0 0 0 0 0 0 0 0 0 0 03 0 0 0 0 0 0 0 0 0 0 0 04 0 0 0 0 0 0 0 0 0 0 0 05 0 0 0 0 0 0 0 0 0 0 0 06 0 0 0 0 0 0 0 0 0 0 0 07 0 0 0 0 0 0 0 0 0 0 0 08 0 0 0 0 0 0 0 0 0 0 0 09 0 0 0 0 0 0 0 0 0 0 0 0
10 0 0 0 0 0 0 0 0 0 0 0 011 0 0 0 0 0 0 0 0 0 0 0 012 0 0 0 0 0 0 0 0 0 0 0 013 0 0 0 0 0 0 0 0 0 0 0 014 0 0 0 0 0 0 0 0 0 0 0 015 0 0 0 0 0 1 0 0 0 0 0 016 0 0 0 0 0 7 3 0 0 0 0 017 0 0 0 0 3 21 14 0 0 0 0 018 0 0 0 1 18 47 37 3 0 0 0 019 0 0 0 1 64 112 88 11 0 0 0 020 0 0 0 3 130 215 170 22 0 0 0 021 0 0 0 25 293 396 319 81 2 0 0 022 0 0 3 108 495 594 513 199 12 0 0 023 0 0 5 270 725 878 764 365 35 0 0 024 0 0 9 486 1 099 1 194 1 020 576 112 0 0 025 0 0 45 813 1 565 1 648 1 399 923 296 10 2 026 0 0 161 1 204 2 119 2 119 1 939 1 381 602 68 8 127 0 0 359 1 734 2 725 2 703 2 576 1 923 981 251 34 128 0 0 682 2 290 3 388 3 385 3 140 2 522 1 479 525 81 229 0 12 1 141 2 918 4 142 4 134 3 822 3 211 2 173 1 039 229 2130 0 138 1 708 3 641 4 887 4 887 4 553 3 953 2 879 1 655 389 4831 0 371 2 334 4 373 5 672 5 623 5 287 4 727 3 659 2 359 577 12632 0 628 2 983 5 046 6 379 6 405 5 967 5 457 4 507 3 094 919 23433 63 1 203 3 586 5 878 7 101 7 118 6 666 6 205 5 364 4 029 1 225 36934 165 1 817 4 476 6 784 7 796 7 824 7 432 6 906 6 285 4 925 1 748 62935 295 2 473 5 396 7 403 8 501 8 506 8 024 7 612 7 059 5 868 2 236 90436 451 3 190 6 319 8 107 9 103 9 072 8 691 8 289 7 927 6 763 2 868 1 21837 899 4 064 7 177 8 770 9 744 9 655 9 343 8 893 8 646 7 579 3 504 1 57138 1 350 4 934 8 032 9 384 10 373 10 194 9 948 9 378 9 324 8 358 4 165 1 88339 1 855 5 772 8 791 10 028 10 899 10 598 10 376 10 081 9 832 9 046 4 766 2 19440 2 354 6 547 9 480 10 578 11 420 11 028 11 012 10 538 10 258 9 653 5 294 2 58441 3 027 7 240 10 085 11 095 11 795 11 430 11 250 11 047 10 667 10 233 5 830 3 04842 3 746 7 778 10 441 11 396 12 144 11 832 11 722 11 400 11 109 10 789 6 178 3 47843 4 359 8 346 10 966 11 738 12 451 12 113 11 843 11 836 11 463 11 250 6 664 3 87844 4 851 8 783 11 200 12 076 12 686 12 314 12 206 12 001 11 757 11 638 7 036 4 09145 5 250 9 151 11 458 12 326 12 901 12 523 12 416 12 282 12 096 12 008 7 401 4 23046 5 564 9 430 11 739 12 506 13 111 12 674 12 557 12 354 12 147 12 257 7 623 4 31047 5 740 9 621 11 885 12 535 13 085 12 751 12 607 12 549 12 296 12 514 7 802 4 37248 5 917 9 752 11 834 12 625 13 160 12 816 12 767 12 292 12 388 12 582 7 958 4 33649 5 972 9 852 11 992 12 686 13 070 12 877 12 675 12 742 12 452 12 484 7 926 4 25450 6 043 9 885 11 988 12 760 13 177 12 954 12 689 12 652 12 448 12 427 7 878 4 14251 5 991 9 836 12 037 12 747 13 104 12 887 12 714 12 621 12 372 12 327 7 723 4 13252 6 060 9 707 11 917 12 559 12 978 12 814 12 487 12 633 12 175 12 055 7 402 3 76553 5 928 9 524 11 812 12 449 12 679 12 580 12 161 12 452 11 958 11 794 7 056 3 60954 5 907 9 275 11 685 12 291 12 474 12 421 12 008 12 091 11 602 11 435 6 556 3 40755 5 742 9 043 11 506 12 086 12 240 12 228 11 728 11 843 11 391 11 033 6 100 3 28456 5 502 8 683 11 126 11 616 11 952 11 963 11 379 11 737 11 117 10 570 5 598 2 89157 5 143 8 135 10 854 11 293 11 670 11 719 10 926 11 392 10 740 10 098 4 977 2 480

97
58 4 893 7 826 10 464 10 718 11 303 11 288 10 647 11 037 10 266 9 584 4 364 2 22359 4 530 7 153 9 917 10 152 10 934 10 831 10 216 10 561 9 729 8 982 3 712 1 91460 4 083 6 620 9 346 9 687 10 478 10 426 9 633 9 977 9 286 8 357 3 101 1 59761 3 565 6 059 8 726 9 032 10 009 9 982 9 310 9 537 8 721 7 681 2 508 1 23962 3 109 5 375 7 973 8 426 9 465 9 521 8 783 8 921 8 065 6 902 1 966 90363 2 455 4 721 7 273 7 847 8 928 8 937 8 273 8 334 7 453 6 091 1 532 57464 1 901 3 958 6 504 7 120 8 349 8 378 7 571 7 634 6 828 5 286 1 092 34565 1 413 3 297 5 833 6 359 7 650 7 780 7 067 7 233 6 144 4 443 770 25266 896 2 573 4 916 5 563 6 917 7 139 6 806 6 619 5 307 3 564 499 28567 496 1 864 4 285 4 809 6 185 6 354 6 018 5 947 4 574 2 698 286 28568 199 1 280 3 609 4 104 5 466 5 628 5 527 5 279 3 830 1 884 217 28569 49 775 2 774 3 359 4 698 4 903 4 598 4 607 3 073 1 216 217 28570 20 373 2 135 2 733 4 017 4 198 4 061 3 871 2 424 672 0 4371 5 135 1 510 2 073 3 267 3 550 3 392 3 110 1 897 292 33 072 0 38 1 008 1 591 2 678 2 925 2 816 2 504 1 404 187 0 073 0 14 516 1 145 2 044 2 375 2 276 2 002 954 187 0 074 0 1 204 772 1 560 1 911 1 818 1 575 595 0 0 075 0 0 49 496 1 170 1 516 1 376 1 146 321 0 0 076 0 0 12 261 813 1 092 1 069 794 136 14 0 077 0 0 0 119 554 783 772 534 54 0 0 078 0 0 0 46 352 546 563 340 0 0 0 079 0 0 0 14 186 351 374 152 0 0 2 080 0 0 0 0 84 200 220 59 0 0 1 081 0 0 0 0 30 89 102 23 0 0 0 082 0 0 0 0 10 36 45 0 0 0 0 083 0 0 0 0 0 13 16 0 0 0 0 084 0 0 0 0 0 0 0 0 0 0 0 085 0 0 0 0 0 0 0 0 0 0 0 086 0 0 0 0 0 0 0 0 0 0 0 087 0 0 0 0 0 0 0 0 0 0 0 088 0 0 0 0 0 0 0 0 0 0 0 089 0 0 0 0 0 0 0 0 0 0 0 090 0 0 0 0 0 0 0 0 0 0 0 091 0 0 0 0 0 0 0 0 0 0 0 092 0 0 0 0 0 0 0 0 0 0 0 093 0 0 0 0 0 0 0 0 0 0 0 094 0 0 0 0 0 0 0 0 0 0 0 095 0 0 0 0 0 0 0 0 0 0 0 096 0 0 0 0 0 0 0 0 0 0 0 0