Embed Size (px)
Citation preview

i
University of the Witwatersrand
Faculty of Engineering & the Built Environment
School of Mechanical, Industrial & Aeronautical Engineering
A study towards the development of the Laser Shock Peening technology for an Eskom Power Station Low
Pressure steam turbine blade application.
To also compare the impact of Laser Shock Peening without Coating against Shot Peening treatment on
12%Cr steel
By
KHANYISILE ROSE KUVEYA (Student Number: 594354)
A dissertation submitted to the Faculty of Engineering and the Built Environment,
University of the Witwatersrand, in fulfilment of the requirements for the degree of
Master of Science in Engineering, under the supervision of Professor Claudia
Polese.

ii
DECLARATION
I, Khanyisile Rose Kuveya declare that this thesis is my own, unaided work, except
where otherwise acknowledged. It is being submitted for the degree of Master of
Science in Engineering at the University of the Witwatersrand, Johannesburg. It has
not been submitted before for any degree or examination at any other university.
Signed this 14th August 2018
Khanyisile Rose Kuveya

iii
ABSTRACT
The root section of a turbine blade is the most critical part as it forms the structural
bond of the turbine blade to the shaft. If not maintained correctly the blade could fail
catastrophically due to high and low cycle fatigue, stress corrosion cracking as well
as corrosion fatigue. The sources of loading on the blades vary from normal
operation, excitation of natural frequencies during transient occasions and
overloads during statutory testing. Different surface modification technologies can
be put in place to improve blades in-service performance. The present study is
aimed at comparing previous results achieved from Shot Peening (SP) of an
equivalent turbine blade to those achieved by Laser Shock Peening without coating
(LSPwC).The SP data which is used for comparison is from the work and study
done to optimise the SP of a 12Cr steel steam turbine blade. It is expected that
LSPwC processing of the blade will result in a reduction in mean surface roughness
(Ra), and deeper compressive residual stresses than the conventional SP
processing. The focus of this investigation is also to determine the effects of LSPwC
laser and processing parameters, such as laser intensity, laser spot size, coverage,
water layer, and possibly laser wavelength on the X12CrNiMo12 high strength steel
target material.
Segments of an ex-service turbine blade, 20x20mm by 10mm thickness, processed
at the CSIR National Laser Centre under various LSPwC parameters were
analysed as follows: composition properties confirmed by spark tests; surface
integrity assessed by SEM and 3D roughness mapping; microstructure; residual
stress measurements by laboratory X-ray Diffraction. The experimental results
helped in optimizing the LSPwC parameters for the X12CrNiMo12, before applying
LSPwC to the more complex geometry of the blade root. This study then allowed
for the determination of which peening process is most suited for turbine
components.

iv
ACKNOWLEDGEMENTS
I would first like to thank my thesis supervisor Professor Claudia Polese of the
School of Mechanical, Industrial and Aeronautical Engineering at the University of
the Witwatersrand for her patience, motivation, enthusiasm, continued support and
guidance. Her door was always open when I ran into challenges with my research
and she encouraged me to take part in an international conference, which is
something I will be forever grateful.
I would like express my sincere gratitude and appreciation to the industry
consultants Dr Mark Newby of the Eskom Research and Testing Department and
Dr Daniel Glaser of the CSIR for their encouragement, immense knowledge and
assisting me with the experimental work that was crucial for my dissertation.
I would also like to acknowledge the following people, Mr Mitchell Leering
(University of the Witwatersrand) for technical drawing support. Mr Tshepo Thage,
Mr Basil Potgieter, Mr William Mtambo for technical support in lab experiments and
sample preparation. In addition, Eskom SOC Ltd for the financial assistance.
Finally yet importantly, I would like to thank my family for cheering me on this
exciting journey and for their never-ending great support.

v
TABLE OF CONTENTS
DECLARATION ....................................................................................... II
ABSTRACT ........................................................................................... III
ACKNOWLEDGEMENTS .......................................................................... IV
TABLE OF CONTENTS ............................................................................. V
CHAPTER 1 INTRODUCTION ..................................................................... 1
CHAPTER 2 LITERATURE REVIEW ............................................................ 5
Laser Shock Peening Evolution ............................................................................. 5
Steam Turbine Blades ........................................................................................... 6
Residual Stress Surface Treatments ..................................................................... 8
Shot Peening Theory ........................................................................................... 11
Laser Shock Peening Theory ............................................................................... 13
General Comparison between Laser Shock Peening and Shot Peening ............. 19
Optimising Laser Shock Peening Parameters ...................................................... 22
Laser Systems Used for Laser Shock Peening .................................................... 28
Methods Used to Measure Residual Stress ......................................................... 31
Laser Shock Peening Simulation ......................................................................... 37
CHAPTER 3 PROBLEM STATEMENT DEFINITION & RESEARCH METHODOLOGY ................................................................................... 40
Problem Definition and Objectives / Research Questions .................................... 40
Initial Determination of LSPwC Parameters ......................................................... 43
Turbine Sample Preparation ................................................................................ 46
CHAPTER 4 RESEARCH RESULTS AND DISCUSSION ................................ 76
Results of the Almen Strip Initial Process ............................................................ 76

vi
Results of the Turbine Blade Samples ................................................................. 80
LSPwC Residual Stress Profile ............................................................................ 83
Surface Characterization LSPwC vs SP .............................................................. 87
CHAPTER 5 CONCLUSION ..................................................................... 92
CHAPTER 6 RESEARCH COLLABORATION .............................................. 94
CHAPTER 7 RECOMMENDATIONS AND FUTURE WORK ............................. 95
CHAPTER 8 REFERENCES ..................................................................... 96
APPENDIX A: LIST OF DRAWINGS ........................................................ 100
Drawing of the LP Turbine Blade ....................................................................... 101
Drawing of the Turbine Sample .......................................................................... 102
APPENDIX B: OTHER SAMPLE BASELINE RESULTS ................................. 103
The Initial Hardness Test Report ....................................................................... 103
APPENDIX C: RELEVANT DOCUMENTATION FROM THE 6TH ICLPRP ........ 107
Application and Approval of Scholarship for 6th ICLPRP .................................... 109

1
CHAPTER 1 INTRODUCTION
Turbines in power stations are designed to convert the thermal energy of steam, from
the boiler, into mechanical energy to drive the generator and exciter in order to produce
electricity. As the turbine extracts work from the steam, the steam’s pressure
decreases along the different stages of the turbine with the high-pressure turbine
extracting work of the high-pressure steam in its initial phase and the low-pressure
turbine extracting work of the steam exhausting out from the intermediate pressure
turbine at a lower pressure.
The turbine blades and rotor are designed using martensitic, chromium-molybdenum,
steel, which has good corrosion and fatigue resistance properties for high temperature
and high-pressure applications. A typical operating environment for a power station
turbine on a unit generating 600MW is as follows; the high-pressure steam entering
the turbine from the boiler has a pressure and temperature of 16.4MPa and 535°C and
it rotates the turbo-generator at a speed of 3000rpm at 50Hz. The steam reaches the
low-pressure blades with a pressure and temperature of 390kPa and 250°C
respectively. The diagram in Figure 1-1 shows the setup and the steam flow on most
power station turbine trains.

2
Figure 1-1: A typical power plant turbine steam flow diagram (Matimba, 2007)
With the high quality, and sound engineering applied to turbine blade and configuration
design to enable the turbine components to operate in these extreme conditions;
turbine blades still experience fretting fatigue which occurs in the blade and disk
attachment region; the Low-pressure (LP) blade roots are susceptible to stress
corrosion cracking. Turbine blades operate in the wet steam region and are prone to
impingement of steam, condensate and chemical residue carryover, which can trigger
fatigue cracks. The blade-root attachment serrations are also prone to crack formation
due to the centrifugal loading and oscillatory vibrations.
The power generation industry, in South Africa, has recorded a large number of LP
turbine blade damage and failures due to high and low cycle fatigue cracking
(Booysen, et al., 2015). In January 2003, a catastrophic failure occurred at one of the
power stations, which resulted in a fire; severe plant damage, which amounted to R1.5
billion in repairs; and a loss of production as the unit, was down for six months. Over
the years, studies have been done in the industry to optimise the fatigue life of these
blades.

3
Shot Peening (SP) is a surface treatment currently used in the power generation
industry to increase fatigue strength by inducing compressive stresses in the surface
to improve fatigue performance by reducing crack initiation and propagation.
Laser Shock Peening (LSP) is an advanced metallic surface treatment technique that
can induce significant compressive residual stresses into a component. The
compressive stress counteracts the effects of operational tensile stresses, resulting in
much improved fatigue strength of the treated component and its resistance to stress
corrosion cracking (Ding & Ye, 2006).
The appealing feature of LSP is its ability to impart residual stresses deep into the
material surface. For turbine efficiency and balance, it is also important that the surface
finish does not affect the steam flow. It has been proven (Hammersley, et al., 2000)
that LSP incorporating a protective coating causes no relevant surface change to the
material surface and thus is a suitable candidate for treating steam turbine blades.
LSP offers potential performance enhancements compared to conventional SP even
though both surface treatments result in a plastically deformed layer. The yield
strength of the surface is increased due to the strain hardening effect. Compressive
residual stresses, in the surface, form as a result of the plastically deformed surface
and the elastically deformed sub-surface layers. Another one of the advantages LSP
has over SP is its ability to produce compressive residual stresses of similar magnitude
with minimum work hardening (Peyre, et al., 2000).
However, the use of protective coatings may be challenging to implement depending
on the component geometry or access for laser processing optics. Therefore, Laser
Shock Peening without a protective coating (LSPwC) is a more highly attractive
process. This study focuses on the Low-pressure (LP) turbine blades due to the high
number indications found on their roots; and crack failures that occur at South African
power stations.
An initial study exploring the use of LSPwC for applications to turbine steel applications
revealed the presence of a surface tensile residual stress in the first few microns of
the surface (Rossouw & Stumpf, 2015).These tensile stresses are as a result of the
melting and rapid solidification of the impacted area since there is no protective coating
(Ding & Ye, 2006).

4
In the following chapter, Chapter 2, the existing literature is reviewed to achieve an
understanding and appreciation of SP and LSP related work done before and currently
being studied. This to enable the work, presented here, to add value in improving the
current method used in increasing the fatigue resistance of the power station’s LP
turbine blades.

5
CHAPTER 2 LITERATURE REVIEW
LASER SHOCK PEENING EVOLUTION
In the earlier studies, it was discovered that the laser-induced shock waves, improved the
yield strength of aluminium without compromising the material ultimate tensile strength.
The technique was then used to enhance fatigue-cracking resistance of materials in the
aeronautical industry, such as aluminium and titanium alloys (Ocana, et al., 2005).
In 1947 Battelle Columbus Laboratories, Ohio (BCL) developed the neodymium-doped
glass (Nd-glass) laser. More than 500J per pulse were generated at a repetition rate of 1
cycle per 8 minutes and were 150ft long.
Later, BCL, sponsored by Wagner Laser Technologies (WLT), invented a glass laser that
generated 100J with a repetition rate of 1 cycle per second (1Hz) which was of the
dimension size of 4 x 6 ft. In 1965 (Hill, et al., 2003), BCL began developing the laser for
LSP. However, due to its unreliability, high repetition rate, and high average power laser,
the process was not ready for commercialisation.
Over the subsequent years, Lawrence Livermore National Laboratory (LLNL) developed
the Nd-glass laser system that delivered average pulse energy of 25 to 100J; repetition
rates up 10Hz; and an average power level near 1kW.
The Metal Improvement Company (MIC) developed the technology that led to the
commercialization of the LSP process (Hill, et al., 2003). Their first full production was in
May 2001, where MIC received a contract to treat a critical rotating titanium turbine
component for an aerospace company. According to (Hill, et al., 2003), the first commercial
application of LSP was in 1997 at GE Aircraft Engines, on a fan blade of a military aircraft
turbine. The process was used to treat the leading edges of the fan blade to alleviate the
foreign object damage.
Both continuous and pulsed lasers have been studied for the use in LSP process (Banas
& Lawrence , 1990).

6
STEAM TURBINE BLADES
One of the most expensive and time-consuming activities of a power plant overhaul is the
maintenance of the steam turbine; it actually is the critical path in most instances when
planning a shut down. Thus, it is important to ensure that turbine work is meticulously well
planned and unforeseen failures are prevented.
Turbine blades are typically manufactured from martensitic stainless steel, since these
steels possess a combination of properties that makes them ideal to use in power station
operating conditions and environment (Rajasekhar, 2015). The properties include high
strength, adequate ductility, toughness and decent corrosion resistance. In this study, the
turbine blade samples had to be heat treated after the various machining processes.
The turbine operates at high frequencies approximately 3000rpm. At these speeds, the
blade roots experience centrifugal loading of rotating turbine and oscillatory loading due to
the impinging steam pressure. Forced vibrations on blades are due to variations in steam
forces and shock due to discontinuous steam flow and torsional vibrations of the rotor
(Bovid, 2017); these forces acting together with the natural frequencies of the blades leads
to fatigue cracks and possible failure. Turbine blades also experience thermal cycles that
create surface cracking and contribute to vibration problems with rotors.
Low-pressure turbine blades are the most susceptible to failures because they rotate at
high speeds in a wet steam-filled environment. For this reason, they are a priority when it
comes to turbine centreline maintenance. A failure on load while turbine is running, is a
risk to personnel safety and possible fatality may occur and equipment damage resulting
to loss of production. Known failure mechanisms are pitting, mechanical damage, e.g.
chipping due to foreign matter, and excessive erosion due to the collision with the water
droplets and corrosion (Bongart, 2012). Cracks are formed due to the stress concentration
resulting from the erosion and corrosion on the blades.
The turbine blade root is the most fatigue cracking prone area of component. This is due
to its geometry combined with the stress loading during turbine operation. There are
various designs used for blade fastening as depicted in Figure 2-1. The root design, circled
in red, is the one to be used as part of the study presented here. This root attachment is
for the blade that was used for this research.

7
Figure 2-1: The different designs of steam turbine blade fastenings or roots (Bovid, 2017)
Industries are currently constraining the crack initiation from the turbine root by introducing
residual compressive surface stress in the crack prone areas using Shot Peening (SP)
(Pant, 2013).The deep residual stresses allow the blade to experience a greater range of
steam and foreign particle impingement damage before becoming initiation points for
cracks.
In the following section 2.3, different methods used to inhibit cracks and prolong the fatigue
life of material, are explored. The element that these methods have in common is that they
impart, in a controlled manner, compressive residual stresses on the surface and sub-
surface of the material to prevent crack initiation and propagation.

8
RESIDUAL STRESS SURFACE TREATMENTS
Known surface treatments that improve service life of components such as fatigue and
impart residual stresses on the components will be discussed in this section.
It is known that failure of components is usually initiated from the surface or the sub-
surface of the components (Fu, et al., 2012). Some treatments are used to improve the
fatigue, corrosion and wear resistance of the metal, by treating the surface and the sub-
surface of the components. Mechanical property improvement is attributed to the presence
of the compressive residual stress as well as the high-density collection of dislocations
(Ding & Ye, 2006).
Laser Shock Peening (LSP) has been investigated to improve a metallic material’s fatigue
strength, strengthening of thin sections; fretting fatigue life, stress corrosion cracking
resistance (Singh, et al., 2011); controlling development and growth of surface cracks; and
hardness. However, for thin sections, a split laser pulse should be used as the material
tends to bend as a result of the re-distribution of residual stresses after the LSP process.
The spilt pulse must impact on both sides of the section in order to balance the internal
forces.Other advantages that the LSP has over conventional methods are that there is an
absence of contact during the process; its ability to treat complex surfaces; and the fact
that it is highly controllable and can be repeated as required.
Other conventional surface modifying treatments include; cold rolling; shot peening; water
jet peening; and low plasticity burnishing (Banas & Lawrence , 1990). These treatments
also improve the fatigue life of components.
Water jet peening uses water droplets that are sprayed at high pressures to achieve
residual stresses on the surface layer of a workpiece; as depicted in Figure 2-2 and
enhance its fatigue life. The surface pressure generated from the droplets impinging onto
the surface produces peak loads, exceeding the yield strength of the material.
The process results are influenced by the following parameters: nozzle geometry, water
jet pressure, standoff distance and peening duration (Srivastava, et al., 2017). Compared
to shot peening, the surface finish on the workpiece after the treatment is smooth. Water
pressure, in the range of 20 to 400 MPa, is used to deliver the desirable results.

9
Figure 2-2: The setup of a water jet peening process illustrating how the work piece is
affected (Hashimoto, et al., 2013)
Low Plasticity Burnishing (LPB) involves plastically deforming the surface of the work piece
by a smooth free rolling ball. The ball is supported in a spherical hydrostatic bearing. It can
be used for different material, such as titanium, steel, nickel and aluminium (Mohammadi,
et al., 2014). The tool path is controlled by CNC positioning to ensure maximum
compression with minimum cold working. It creates deep, greater than 1mm (Prevey &
Cammet, 2004), stable surface compressive residual stresses; and eliminates or reduces
the surface tensile stresses with negligible cold work hardening. The residual stresses are
created by Hertzian loading. Figure 2-3 is an illustration of the setup of the process.

10
Figure 2-3: A typical setup of the LPB process (Glenn, 2002)
The amount of force applied when using this method has to be carefully controlled; if
excessive force is applied, spalling becomes apparent due to sub-surface cracks initiated
by the process. Insufficient force will only cause the surface to deform elastically unlike
other burnishing methods that have a limitation in their inability to be applied on complex
geometries and whose effects are unpredictable in mechanical components; the LPB tool
can be moved in any direction along the surface by using multi-axis CNC machinery. LPB
parameters that must be controlled to achieve optimal performance of the process are ball
diameter, burnishing force, ball speed, number of tool passes and the initial roughness of
the workpiece.
In this study, the focus was on SP and LSP.

11
SHOT PEENING THEORY
Instead of a laser beam striking against the metal surface, as the case with LSP, metal or
small sphere shaped glass or ceramic balls of about 0.05mm to 1mm are used to make
small indentations on the metal surface upon impact; this spherical media is called shot.
The shot must be harder than the target material to achieve the desired residual stresses.
The indentations form because of the surface layer of the material yielding in tension.
Below the surface layer, there is a region of cold-worked material as the compressed
grains attempt to restore the original shape of the surface. To achieve a uniform area of
compressive stress, the indentations must overlap. The combination of the highly shocked
and compressed underlying material and the thin layer resulting from overlapped
indentations form a very hard and strong surface that is resistant to crack initiation and
propagation. The resulting surface is also resistant to corrosion (Ding and Ye, 2006). In
order to avoid distortion of the treated sample, both sides are simultaneously peened
(Menig, 2002).
One of the key parameters in a SP process is intensity. An Almen strip is used to measure
the intensity of the blast stream. The stresses created by the SP operation deform the strip
and produce an arc height which is the standard of measurement for SP (Leghorn, 1957).
The Almen strip is used in conjunction with an Almen gauge, which is used to measure the
arc height, and it is usually fixed onto an Almen block, to keep the strip in place during the
process. How the measurement works is that the Almen strip, made of a sheet of metal
and manufactured according to strict specifications, is shot peened on one side. As it
begins to deform, due to the compressive residual stresses imparted to it, it forms an arc
on the peened side. The arc height increases with increase in peening exposure.
Another key parameter is coverage, which is defined as the percentage of the surface
indented and is a function of the angle of the shot blast stream relative to the surface of
the workpiece. Factors such as number of impacts, also known as shot flow, exposure
time, the size and chemistry of the shot, and the work piece properties affect the coverage
density. The percentage coverage is monitored visually. Overlapping passes helps to
improve the coverage. It is important to get an alignment of the axis of the shot stream
with the axis of the Almen strip. These two parameters, have a great effect on the fatigue

12
life of the workpiece, for example, incomplete coverage can reduce the fatigue life of the
work piece.
Air blast systems and centrifugal blast wheels are common methods used to propel the
shot media. In the air blast systems, the media is directed into the path of high-pressure
air and accelerated onto the workpiece through a nozzle. In the case of the centrifugal
blast wheel, the media is introduced in the centre of the high-speed rotating wheel and
pushed, by centrifugal force of the spinning paddles, to the workpiece.
Shot peening is a cost-effective treatment that is used to strengthen metal components. A
common and well-established cold-working and fatigue-strengthening process has been
used for many years.
13
LASER SHOCK PEENING THEORY
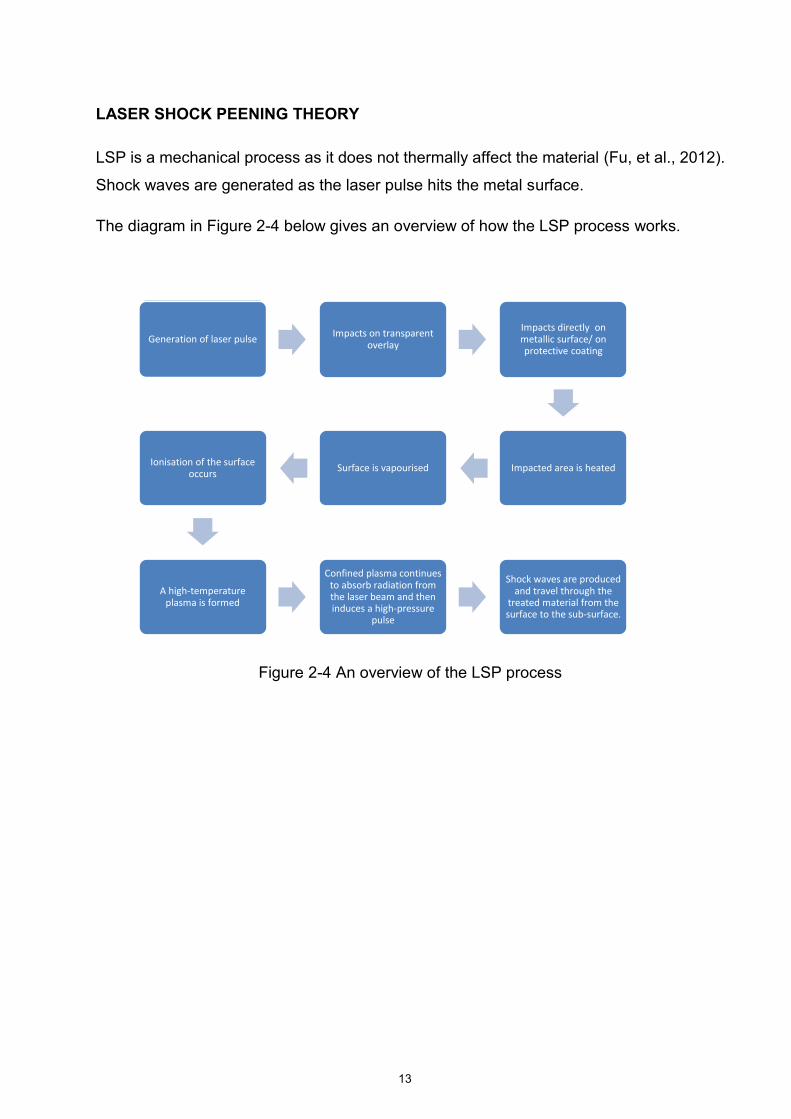
LSP is a mechanical process as it does not thermally affect the material (Fu, et al., 2012).
Shock waves are generated as the laser pulse hits the metal surface.
The diagram in Figure 2-4 below gives an overview of how the LSP process works.
Figure 2-4 An overview of the LSP process
Generation of laser pulseImpacts on transparent
overlay
Impacts directly on metallic surface/ on protective coating
Impacted area is heatedSurface is vapourisedIonisation of the surface
occurs
A high-temperature plasma is formed
Confined plasma continues to absorb radiation from the laser beam and then induces a high-pressure
pulse
Shock waves are produced and travel through the
treated material from the surface to the sub-surface.

14
The following diagram in Figure 2-5 shows a typical LSP setup in a laboratory and the
apparatus required.
Figure 2-5 A typical LSP setup (Peyre, 1995 )
Strong laser pulses are irradiated onto material in water. These pulses exceed the ablation
threshold value, thus converting the surface layer of the material to high-pressure plasma.
The inertia of the water hinders plasma expansion, and focuses the laser energy onto a
small area. As a result, the plasma pressure reaches 10 to 100 fold Giga Pascals. This
pressure generates shock waves that propagate within the material. The shock waves
cause plastic deformation and compressive residual stresses are generated in the surface
layer of the material due to the restraint exerted by the surrounding un-deformed parts of
the material. By continuously irradiating the material and moving the laser pulses,
produces uniform compressive residual stresses (Singh, et al., 2011).
Material is known to behave differently under various strain-rates. In this report LSP is the
object that will be applying the loading and the strain-rate imparted by it is typically 106/s
(Singh et al., 2011). This strain-rate is relatively high and is thus categorised as a shock
wave or impact loading. Two types of waves are known to be formed by LSP as it impacts
on a material surface; namely elastic and plastic waves. Their speed is given by the
following equations 2.1 derived from the stress wave propagation theory.

15
2/12/1
)21(3;
2111
EVEV plasticelastic Equations 2-1
When the loading pressure is removed, a release wave is generated and travels in the
same direction as the other two waves. Its travelling speed is the same as the elastic wave.
The release wave is always tensile as the loading is compressive.
The elastic wave travels through the material and bounces back once it reaches the
boundary. As the different waves travel through the material, they interact with each other,
leaving behind residual stresses within the material.
As the laser pressure is being applied onto the surface layer of the material, the pressure
wave forces that layer to expand beyond its elastic limit into plastic deformation. Its
expansion is normal in direction to the applied pressure. The layer below the surface layer
also expands, but within the elastic limit. This expansion is experienced further deep inside
the material, although the magnitude of the expansion reduces according to the
attenuation formulation (Singh et al., 2011). The expansion then reaches a level where it
is elastic. When the plastically deformed layers attempt to return to their original state they
are subjected to compressive stresses and the layers below contain tensile stresses in
order to maintain equilibrium inside the material.
It is found that by applying a transparent coating, also known as an overlay, the magnitude
of the shock wave intensity is increased by up to two orders of magnitude as compared to
the vacuum generated plasmas (Montross, et al., 2002). The transparent layer prevents
the plasma from expanding away from the surface and is instead direct the energy into the
material. Compared to the results achieved with the direct ablation method, the magnitude
and duration of the of the plasma peak pressure are increased by a factor of 10 and 3
respectively when using the transparent overlay. The peak pressure is a function of the
incident laser power density and the properties of the transparent overlay (Banas &
Lawrence , 1990) (Bovid, 2017).

16
Overlays known to be used for a typical Nd: glass laser of 1064nm wavelength are water,
quartz, and glass. Other types of uncommonly used material for overlays are acrylic,
Perspex, silicon rubber, K9 glass and Pb glass (Hong, et al., 1998).
A study was done by (Hong, et al., 1998) using the different overlay materials with an Nd:
glass laser on a 2024-T62 aluminium alloy and it was noted that using an overlay of high
acoustic impedance increases the peak pressure and the duration of the pressure.
The surface of the metal can also be coated with a thin opaque film such as black paint.
This coat is the sacrificial layer that is damaged, by heat, as it absorbs energy from the
laser beam. The energy absorbed is converted into high-pressure plasma. This plasma is
around 10 000°C in temperature (Ding & Ye, 2006). As the plasma continues to be heated,
vaporized and ionised, it transmits energy into the material in form of shock waves. The
film not only protects the metal’s surface from laser ablation and melting, but it is found to
also increase the shock wave intensity by enhancing the plasma and as a result increase
the magnitude of the residual stress left in the metal. According to (Peyre, et al., 1998),
the properties and pressure of the plasma can be characterised by the coating used. By
using the constraining characteristics and some of the impedance mismatch effects of the
coating to increase the magnitude of the stresses, lasers of lower power densities can be
used.
It has been discovered that different coatings absorb different quantities of the laser
energy. This plays a role when selecting the type of coating for a certain application and
laser systems available. Various materials are used to perform this function of absorbent
coating, are metal coating, such as aluminium, zinc, copper, commercially available flat
black paint and organic coatings. The flat black paint has been used and is the most
practical and effective according to (Montross, et al., 2001). According to (Banas &
Lawrence , 1990) the coating should have a low heat of vaporization, to enhance the
absorption of the laser radiation and reduce the processing time of the laser.
The overlay is usually placed over the sacrificial coating and the most practical and widely
used overlay is a thin layer of flowing water, from a nozzle.
Plastic deformation occurs as the shock waves propagate in the material. The generated
compressive stress is in the direction of the shock wave. This shock wave plastically

17
deforms the material to a depth where the peak pressure no longer surpasses the
material’s Hugoniot Elastic Limit (HEL).
The deformation is due to the pressure of the shock wave exceeding the dynamic yield
strength of the metal. The relationship between the pressure (𝑃𝑠𝑤), density of the material
(𝜌0) and its elastic wave sound (𝑐) has been derived to the following equation 2-2.
𝑃𝑠𝑤 = 𝜌0𝑐2 Equation 2-2
The HEL defines the elastic limit stress and the direction in which the shock wave
propagates.
𝐻𝐸𝐿 =1−𝜐
1−2𝜐𝜎𝑦
𝑑𝑦𝑛 Equation 2-3
where υ is Poisson′s ratio and σydyn
is the dynamic yield strength at high strain rates
No plastic deformation occurs when the peak dynamic stress is below the HEL. Only when
the dynamic stress is in the range of 1 and 2 HEL does plastic strain occur with an elastic
reverse strain (Peyre & Fabbro, 1995). The strain then is saturated and plastic strain
occurs. Maximum surface plastic strain is achieved by treating the material in the 2 to 2.5
HEL range as no further plastic deformation occurs at HELs greater than 2.
The viscous energy is dissipated by the dampening mechanism, and the inelastic process
dissipates the plastically dissipated energy. Residual stress saturation happens because
of the magnitude of the yield strength of the treated material.
As the laser pulse irradiates the metal surface, or the absorbent coating protecting the
metal surface, the affected surface material vaporizes and plasma is formed. The diffusion
of the thermal heat energy into the material is limited to a few microns so as to maintain
the protection of the metal by ensuring short deposition times is kept. The generated
plasma absorbs the laser energy throughout the deposition period.
The plasma is confined between the metal surface and the transparent overlay. As the
plasma continues to be heated, it hydro-dynamically expands creating high amplitude,
short duration pressure pulse. A certain amount of the generated energy is transmitted as
a shock wave into the material.

18
A commonly used laser system is the Q-switched laser system based on a neodymium-
doped glass or yttrium aluminium garnet (YAG) crystal lasing rod operating near infrared
at a wavelength of 1064 nm and a pulse duration of 10 – 100ns (Montross, et al., 2002).
The difference between Q-switched laser and continuously generated laser beams (from
helium-neon or carbon dioxide lasers) are that the laser pulse reverberates through the
lasing medium until the laser pulse exceeds a threshold and leaves the laser. GigaWatt
beams of 1 to 100+ Joules and pulses less than 100ns in length are generated. Carbon
dioxide lasers can only generate about kilowatt beams.
Typical features of laser systems that are used for LSP are that they have an energy output
in the range of 10 – 500J/pulse and pulse lengths of less than 100ns.
One of the limiting factors of water as an overlay is a phenomenon known as the dielectric
breakdown. Dielectric breakdown is when the plasma absorbs the incident laser pulse
preventing some of the energy from generating a shock wave into the material. This can
be overcome by increasing the wavelength, for example, from 532 to 1064nm to increase
the dielectric breakdown threshold from 6 to 10GW/cm2.
The LSP process using a water overlay is characterised by the sequence reported in the
following.
The laser-impacted area undergoes rapid uniaxial compression, in the direction of the
shock wave, and the surface layer is stretched as a result of the expanding plasma.
After the laser pulse is removed, the surrounding material responds to the deformation and
creates a compressive residual stress field, while the unaffected layers are in a tensile
state.
The scaling law showing the relationship between the laser parameter and the overlay is
expressed in equation 2-4 by (Fabbro, et al., 1990):
𝑃(𝐺𝑃𝑎) = 0.01√∝
2∝ +3√𝑍(𝑔 𝑐𝑚2𝑠2⁄ )√𝐼0(𝐺𝑊 𝑐𝑚2⁄ ) Equation 2-4

19
where
o 𝑃 = peak plasma pressure
o 𝐼0 = laser power density
o 𝛼 = efficiency of the interaction
o 𝑍 = reduced shock impedance between the material and the
overlay
GENERAL COMPARISON BETWEEN LASER SHOCK PEENING AND SHOT PEENING
Laser Shock Peening (LSP) is an upcoming metallic surface treatment technique (Ivetic,
2010). It induces residual compressive stresses on the component. The compressive
stress counteracts the effects of existing tensile stresses as a result improving the fatigue
strength of the treated surface.
LSP is also becoming an industrial treatment to improve the cracking resistance of turbine
blades (Peyre, 1999). LSP generates the same amplitude of compressive residual
stresses as shot peening; however, the work-hardening effects are less.
The treatment modifies the state of the metal’s surface in terms of microstructural,
mechanical and morphological. By introducing a sacrificial layer and immersing the work
piece in water, thermal damage is avoided and only mechanical loadings are imparted
onto the surface. Some of the experimental parameters required to deliver a desirable
residual stress field (Singh et al., 2011) with this treatment are spot shape, pressure pulse
duration and shape, number of shots at the same location, sequence of the locations,
amount of overlap, and component thickness.
As compared to LSP, Shot Peening (SP) is a more established process for increasing the
fatigue failure resistance on metal components, such as turbine blades. The affected depth
of the laser peened sample is greater than that of the shot peened one as it is also proven
and stated in (Sano, et al., 2006) (Clauer, 1996) (Gomez-Rosas, et al., 2005). LSP is
definitely more advanced in that it imparts the stresses to depths more than 1mm into the
surface (Singh et al., 2011) versus the 0.77mm reached by shot peening (Brent et al.,
2000).
20
The SP process leaves an undesirable surface finish on the material as it imparts the
residual stress within the surface. It is said to produce anything between 10% to 50% cold
work; whereas LSP only produces as little as 1% to 2% cold work (Brent et al., 2000) in
the material due to less deformation cycles required in achieving the desired results.
Other advantages of LSP include the ability to treat complex geometry, the high
controllability and repeatability (Singh et al., 2011) of the process.
SP limitations observed are the undesirable surface finish it leaves when trying to achieve
deeper residual stresses. It is also not ideal for high cycle fatigue components, such as
turbine fan blades. SP produces much rougher surfaces with large mean and peak
roughness values. These features are not suitable for wear or fatigue improvement
applications. Another limitation is that because of the shallowness of the compressive
residual stressed layer from SP which usually does not exceed 0.25mm in depth in soft
metals, whereas the LSP compressive layer is usually deeper than 1mm (Ding and Ye,
2006). There is a risk of further reducing the depth of the stresses when attempting to
remove the roughened surface. For wear applications, where the potential stress raiser
must be eliminated, the surface is required to be of a smooth finish to prevent crack-
initiation sites; this practice inadvertently removes a significant amount of the
compressively stressed layer. The residual compressive stressed layer generated from
LSP, is four times deeper than the layer generated from conventional SP. The LSP process
has reduced micro structural damage and there is better control in applying the process.
The process is not as rough as the one from SP, and thus can be used for more
applications such as treating thin sections.
An attempt to increase the depth to which the residual stresses are imparted by increasing
the number of shots or intensity of the shots using SP will only cause degradation of the
surface (Clauer, 1996); whereas an increase in the LSP intensity will achieve compressive
residual stresses in deeper levels. A study done by (Masse & Barreau, 1995) demonstrates
that an increase in LSP intensity for a 0.55% carbon steel increased the depth to which
the residual stresses were imparted.
SP limitations also include the semi-quantitative method used to determine the intensity of
the SP as it does not ensure the uniformity of the residual stresses across the material.

21
The duration of the induced peak pressure is ten to twenty times longer than that produced
by the LSP process.
LSP can access areas such as small fillets and notches that are potential crack initiation
sites, whereas SP cannot treat such areas. The other appealing attribute of LSP, is its
reliability and ability to be controlled by computer resulting on precise control of the
irradiation position .and that it can be applied locally and on more complex geometries
(Sakino et al., 2015).
Microstructural changes
LSP is a mechanical process that affects the metals’ microstructure, improving its
hardness, tensile and fatigue strengths. These have been investigated in literature, using
TEM, SEM, and X-ray diffraction analysis. The changes resulting from the LSP process
are connected to the LSP process parameters as well as the heat treatment condition of
the alloys.
The density of the dislocations is noted to increase after the LSP treatment. LSP improves
the hardness of under aged material and not do much on the hardness of peak-aged
material (Montross, et al., 2002). In (Ocana, et al., 2005) the microstructural changes in
the sub-surface of the AISI 304 steel, are also attributed to the increase in dislocation
density. A study done by (Lee, 2008) showed an increment in micro-hardness of 40.9%
for high carbon steel for pulse duration of 10ns.
Shot peened samples are expected to show a very dense and large array of persistent slip
bands as compared to laser shocked peened samples. The shot peened samples also
display strain-induced ' martensitic needles. Results from X-ray diffractrograms showed
no ' transformation in the LSP treated specimen, whereas these were very prevalent in
the grains of the SP treated specimen (Peyre, 1999).

22
OPTIMISING LASER SHOCK PEENING PARAMETERS
Laser properties, which are optimised to achieve improved mechanical properties and
microstructures of the metal alloys to be treated, are:
o Laser density (I0)
o Laser spot size (D)
o Laser duration (τ)
According to (Hong & Chengye, 1998), the better LSP results were achieved for a
laser power density in the range of [64(𝜎𝑌𝑑𝑦𝑛
)2
𝑀𝑍𝐴⁄ ] and [64(𝜎𝑈
𝑑𝑦𝑛)
2
𝑀𝑍𝐴⁄ ]; where
o A is the absorption coefficient of the surface coating
o M is the transmission coefficient of the transparent overlay
o Z is the reduced shock impedance between the metal and the transparent
overlay
Other parameters are discussed in this chapter and the effects they have on the LSP
treated material.
Impact of single vs multiple shots on material
Maximum residual stress increases with the number of laser impacts, however beyond a
certain threshold the number of impacts ceases to have an effect on the residual stress
magnitude.
Compressive residual stresses can be generated deeper in the material by continuously
shooting the material with multiple laser shocks on the same spot. For example, it was
observed for a 0.55% carbon steel as the number of shots increased from one to three,
the depth of the compressive residual stresses increased from 0.9 to 1.8mm. (Clauer,
1996) also confirmed that for certain materials, the plastically affected depth is directly
proportional to the number of impacts on the same spot. In the study a 0.55%, carbon steel
was used and the results were that as the number of shots was increased from one to
three, so too did the affected depth increase from 0.9mm to 1.8mm. The same was found
in the studies done by (Peyre, et al., 1996) on three aluminium alloys (7075, cast A356,
Al12Si). Both studies also showed that even though the depth of the residual stresses

23
increased with the number of impacts, the magnitude of the residual stresses decreased
with increasing number of shots. For the material 7075, the magnitude of the surface
residual compressive stress increased with the number of shots.
For multiple shot loadings, a coating needs to have good adhesive properties for it to fulfil
its purpose throughout the process. And to enable repeatability, the coating material has
to be thick enough.
Impact of the different spot shapes
In a study done by (Ballard, et al., 1991), spot size does have an impact on the residual
stress. As the spot size increases the surface stress gradually increases; then it starts to
reach saturation by remaining constant at a certain point. Increasing spot size influences
the depth to which plastic deformation occurs, but only to a certain point.
The beam can be manipulated to suit the application, as a square profile gives a dense
uniform packing of the laser spots. Previous studies have tested the impacts of using
different laser spot profiles. A square profile resulted in dense uniformly packed laser
spots.
In one of Clauer’s (Clauer, 1996) investigations it was found that the fatigue life of the
2024-T351 samples, treated with a solid laser spot, was 40 times longer than those
samples that were not treated with LSP; and the samples treated with annular laser spots
had a life which was 3 times longer than the untreated samples.
Impact of laser spot size
The laser spot size diameter is restricted by the power density and the available laser
power (Montross, et al., 2002). The manner in which the shock wave travelled in the
material was influenced by the spot size. In (Fabbro, et al., 1998) it was observed that the
smaller diameter shock wave extended like a sphere, resulting in an attenuation rate of 1
𝑟2;
and the larger diameter behaved more like a planar front giving an attenuation rate of 1
𝑟.
The planar front allows the shock wave to travel deeper into the material as compared to
the wave front from the smaller diameter. From (Peyre, et al., 1998) a larger spot size

24
produces residual stresses deeper in the material as compared to the smaller size,
however, they do not have an impact on the magnitude of the surface residual stresses. A
common range of spot sizes used in literature is from a few hundred micrometres to 10mm
(Ding & Ye, 2006)
Impact of the laser power intensity
The amplitude of the surface stress increases with the magnitude of the laser-induced
peak pressure; this is as a result of peak pressures varying linearly with the incident power
density (Ding & Ye, 2006). The converse has also been proven that as the laser power
density decrease so too does the peak pressures this is in the results achieved in (Clauer
& Holbrook, 1981). Due to optical breakdown of the overlay and the reflection of the laser
light by the plasma, the magnitude of the peak pressure reaches its threshold when these
factors come into play. As the incident power density exceeds a certain threshold, the
residual stresses decreased at the surface due to the surface release waves.
There are two types of temporal laser pulses produced by a laser system, a Gaussian
pulse shape and a short rise time (SRT) pulse shape. (Devaux, et al., 1993) The use of
the SRT laser was found to reduce the effects of breakdown and achieve higher pressure
on the surface. It was also observed that the breakdown threshold was dependant on the
rise time of the laser pulse in different confining mediums. Ding & Ye, 2006, have stated
that the duration of the pressure pulse is controlled by the duration of the laser pulse. There
has been studies done to optimise this so as not to purchase overly expensive lasers in
the vain of getting better laser output.
Impact of overlapping the laser spots
A method of overlapping laser spots has been investigated and found to be successful in
laser peening larger areas and large components. It has also been proven that overlapping
laser shocks increase the compressive residual stresses imparted into the material and
carefully controlled for the treatment of large areas (Hu & Yao, 2008). The power density

25
required for the processes and the limited laser power availability have made it challenging
to achieve desirable area covered per pulse on larger components.
The coverage ratio used is defined as the quotient between the overlapping area and the
spot size for to peening processes made in succession (Prevey & Cammet, 2002).
Increase in coverage ratio increases the plastically affected depth. The overlapping
method has shown to have a positive impact on the treated material in terms of imparting
a uniform distribution of compressive residual stresses on the treated regions; this in the
absence of tensile residual stresses.
In order to reduce time, cost and complexities involved with the LSP process, (Mannava,
et al., 1997) patented a process that uses a low power laser beam of magnitude 3-10
Joules and circular laser spot sizes of 1mm in diameter on a titanium alloy. This makes
the invention suitable for commercial production lines as the setup costs may be less due
to the cheaper lasers required.
Wavelengths that are commonly used and easily produced
The near infrared wavelength (1064nm) has a modest absorption coefficient in water
overlays. It also sufficient interaction with the surface of the treated metal and has a high
dielectric breakdown threshold. The green (532nm) wavelength has the lowest absorption
in water.
Fast-firing Q-switched Nd:glass and yttrium aluminium garnet (YAG) crystal-lasing rod
lasers at Lawrence Livermore National Laboratory (LLNL) were developed to deliver 200
J pulses with 20 ns pulse lengths at 10Hz pulse rates. This is 20 times faster than current
available laser systems. They have a wavelength of 1.064µm.
LSP without overlay
The generated plasma absorbs the laser energy and rapidly expands away from surface.
This affects the amount of energy converted from the laser into a pressure pulse. As a
result, the compressive residual stresses, of lower magnitudes, are induced in the material.
According to (Montross, et al., 2002) a Hadfield steel sample treated with LSP without an

26
overlay resulted in residual stresses that were slightly compressive, even at high laser
power density of 2.4 TW/cm2.
LSP processing conditions and material properties influence the depth to which the
residual stresses are achieved. Depths achieved thus far from the process are said to be
more than 1mm. Experimental data has also shown that residual stresses imparted by
LSP are much deeper than those imparted by conventional SP (Montross, et al., 2002).
According to (Singh, et al., 2011) the depths achieved by LSP are four times deeper than
those achieved by SP.
Laser Shock Peening without Coating
Laser Shock Peening without Coating (LSPwC) involves LSP conditions, but without the
sacrificial layer or surface preparation. This method has been used, in Japanese nuclear
power plants (NPPs) to prevent stress corrosion since 1999 (Sano, 2008), and it is used
as a preventative maintenance treatment on boiling water reactors.
Coated samples have given high compressive stresses in the surface, whereas the
uncoated samples had high tensile stress present (Peyre, et al., 1998) on the treated
areas. This is as a result of the surface melting during the process. The surface also
vaporises and gives rise to re-solidified droplets and craters adding to the roughness of
the surface. However, studies in the NPPs have optimised the LSPwC parameters to
enable using this method to achieve compressive residual stresses on the material and
reduce the undesirable effects such severe surface ablation.
Experiments conducted using LSPwC have been able to improve fatigue strength of steel,
aluminium and titanium alloys. Results from a study done on a bare 2024-T62 aluminium
surface, found that a laser pulse with 30 ns was the most effective to shock the surface
and produce compressive residual stresses without melting the surface.
In another study done by (Sano, et al., 2008), a compact Q-switched Nd: YAG laser was
used and the original wavelength was halved to water-penetrable green (532nm). Although
the laser pulse energy decreased to about 100mJ, compressive residual stresses were
achieved on the surface by increasing the number of laser shots per unit area.

27
This method has been considered to be a simpler process as it can effectively assist in
reducing processing costs of either coating or painting and has better accessibility for hard
to reach areas as compared to LSP. LSPwC is an attractive treatment to use in power
station application due to its practicality and potential in reducing shutdown costs and
repair time.
It is an attractive alternative to use as it works on lasers which are commercially-available
such as Q-switched and frequency-doubled Nd:YAG, according to (Sano, et al., 2006). It
also has the potential of being remotely operated for onsite applications.

28
LASER SYSTEMS USED FOR LASER SHOCK PEENING
The requirements of an effective laser system for metal components are that it has to have
an average power level from several hundred watts to kilowatts. The pulse energy output
has to be of about 100J or more. A pulse duration of between 30ns to 100ns, and a high
repetition rate of the laser pulse and a practical laser wavelength for example 1.064µm.
The solid-state laser of the crystal type is referred to in this review as it offers a combination
of high pulse energy an selectable pulse duration suitable for the LSP process. Though it
does have its limitations, such as its ability to generate a limited Joules per pulse (Brent et
al., 2000), it’s the only type available for the experiment. A more suitable, but expensive
type of laser would be the solid-state glass laser as it is capable of generating high average
power at high energy. Factors that also influence the selection of the laser system are cost,
efficiency, reliability, and maintenance and part replacements.
This chapter looks at typical properties that a laser used for LSP should have.
Properties of Lasers
The most commonly used active ion for solid-state laser, such as the ones used in the LSP
process, is the trivalent neodymium (Nd3+). It can to emit coherent light with many types of
crystal and glass hosts as compared to other ions. It can work as a pulsed or a continuous-
wave laser. Glass and yttrium aluminium garnet (YAG) are the most commonly used solid
hosts for this ion.
When the Nd3+ is doped in YAG, the Nd: YAG crystal produces a wavelength of 1.064µm.
The positive attributes of the YAG crystal is their good thermal conductivity and thus
desirable for high-repetition rate (of up to 100Hz) laser operation (Semwal & Bhatt, 2013).
The Nd:YAG (Neodymium-doped yttrium aluminium garnet Y3Al5O12:Nd3+ is colourless
and of good optical quality. It is also optically isotropic and has a high thermal conductivity
of 0.14 W/cm-K.

29
YAG is non-hygroscopic, melts at 1970°C; has a Knoop hardness of 1215, making it very
durable. The characteristics of its structure favour a narrow fluorescent linewidth, resulting
in high gain and low threshold for laser operation. The YAG lasers are limited by crystal
growth capabilities to small laser rods, and thus limiting the energy and power output
abilities of the laser.
Figure 2-6: Schematic diagram of a typical laser showing the three major parts
(Lakkasuo, 2010)
Figure 2-6 shows the major parts of a laser. The parts and their functions are as follows:An
external energy source, also known as the pump source, provides energy to the laser
system. Energy sources that have been used include electrical discharges, flash lamps,
arc lamp and chemical reactions. In the case of Nd: YAG the source is light focused from
a xenon flash lamp or diode laser.
A gain or laser medium determines the wavelength of operation of the laser. Media with
wide spectra allow for tuning of the laser frequency. The pump source excites the gain
medium and it in turn produces a population inversion. Spontaneous and stimulated
emission of photons takes place in the gain medium. In the case of the Nd: YAG laser, the
gain medium is solids of either crystals or glasses. These host materials are usually doped
with an impurity such as chromium, neodymium, erbium or titanium ions.

30
Two or more mirrors usually form an optical resonator. These mirrors are coated to
enhance their reflective properties. In a basic setup of two parallel mirrors, the optical
resonator would be placed around the gain medium. One would be a high reflector and
the other would partially reflect the light as it has to allow a certain amount of light to leave
the cavity to produce the output beam. They also provide feedback of the light that is
produced by spontaneous emission, back into the medium. The reflected light is then
amplified by stimulated emission. This process occurs hundreds of times before the light
exists the cavity.
Laser power density and wavelength
Since the incident laser power density influences the plasma pressure, an increase in the
incident laser power density also results in the increase in magnitude of the surface
residual stresses.
A study was done to compare the effects of the two temporal shapes using water as the
confining medium. (Peyre, et al., 1996) found that the laser-induced pressure was a
function of the laser power density. The study found that the breakdown threshold of the
laser power density was much higher when using the SRT as compared to the one reached
by the Gaussian pulse.

31
METHODS USED TO MEASURE RESIDUAL STRESS
The methods covered in this chapter focus on measurement of residual stresses on
the surface and subsurface of treated metallic materials.
Residual stress is defined as “that which remains in a body that is stationary and at
equilibrium with its surroundings. It can be very detrimental to the performance of a
material or the life of a component. Alternatively, beneficial residual stresses can be
introduced deliberately.” (Withers & Bhadeshia, 2001). Part of this study, is to explore
intentionally inducing compressive residual stresses into the surface and sub-surface
of a material to enhance its properties and performance in service. This is done by
using plasma energy, created from a laser interacting directly with the surface, to
create shock waves near the interaction.
In order to predict and quantify the existence of the residual stresses, reliable methods
are used in industry.
There exist non-destructive and destructive methods in literature that are used to
measure the residual stresses imparted by the LSP treatment on a metal surface. This
chapter outlines the different methods that exist.
The diffraction methods
This section introduces some of the different diffraction methods that exist. These are
non-destructive methods and are thus repeatable. They use the distance between the
crystallographic planes as a strain gauge. The measured magnitude of the residual
stress corresponds to the difference in the spacing caused by the deformation
X-ray diffraction sin2ψ method
The X-ray diffraction technique ( also known as XRD, sin2Ψ) is used in some of the
literature to estimate the surface and subsurface residual stresses (Scheepers, 2005)
on the treated specimen. X-ray different method is the one used and of interest as it
was the most practical method available for the experimental work

32
A typical XRD machine consists of an X-ray tube, a sample holder and an X-ray
detector. In a cathode ray tube, a filament is heated to produce electrons. These
electrons are accelerated toward a target by applying a voltage and bombarding the
target material with electrons. The X-ray spectra is generated when the electrons, of
the tube, have sufficient energy to dislodge inner shell electrons of the target material
(Dutrow, 2016). Foils or crystal monochrometers are used to filter the X-rays to
produce monochromatic rays required for diffraction. In this study, the target material
used is copper with CuKα radiation of 1.5418�̇�. The rays are then made parallel and
directed onto the sample. The reflected X-rays are collected and recorded by the
detector that rotates together with the sample.
The principle is based on the interaction of the monochromatic X-rays with a crystalline
sample, which in this study is the metal. The X-rays are produced by a cathode ray
tube, then filtered to make a monochromatic radiation; and are made parallel (known
as being collimated) before being directed toward the sample. As the rays impinge on
the material, some of them are diffracted and others are transmitted. When interaction
of the crystalline sample and the incident rays of the X-rays, generates a constructive
interference; a peak in intensity occurs satisfying the conditions stipulated in Bragg’s
law, i.e. 𝑛𝜆 = 2𝑑{ℎ𝑘𝑙} sin 𝜃; where λ is the incident wave length; dhkl is the lattice plane
spacing; and θ is the incident glancing angle (Ida, 2013) (Peyre, et al., 2000). The
families of lattice planes diffract the x-ray beams at certain angles; and these are
detected together with their intensities; by the detectors. All possible diffracted ray
directions of the lattice are attained when scanning the sample through the range of
2𝜃 angles. The diffraction peaks are then converted to d-spacings. The spacing of the
sample microstructure is used as an atomic strain gauge. The strain is calculated using
equation 2-5
𝜀 =𝑑{ℎ𝑘𝑙}−𝑑0{ℎ𝑘𝑙}
𝑑0{ℎ𝑘𝑙} Equation 2-5
where the d0 is the unstrained lattice parameter.

33
Figure 2-7: Diagram illustrating the calculation of the diffraction method
Figure 2-8: Setup of the diffractometer
The setup of the diffractometer is such that the sample rotates in the path of the
collimated X-ray beam. A goniometer is used to maintain the angle and rotate the head
containing the X-ray tube as illustrated in Figure 2-8.

34
Table 1 below gives examples of the parameters used in a XRD process.
Table 1: An example of the XRD parameters used on the different types of metal
lattices
Phase Anticathode Filter Acquisition
time (s) Bragg
nm
hkl
planes
Number
of 2
Bragg
FCC-
BCC- '
Mn
Cr
Cr
V
50
50
0.229
0.2102
(311)
(211)
11
11
152.3
156
Neutron diffraction
Neutron diffraction detects the elastic deformations within a polycrystalline material
that cause change in the spacing of the lattice planes from the stress-free value. A
detector moves around the sample to locate the positions of high intensity diffracted
beams.
Synchrotrons
Synchrotrons are hard X-rays with intense beams of high energy X-rays that can
penetrate deeper, reaching depths of 1-2mm, into the material (Ding & Ye, 2006). They
are capable of providing high spatial resolution.
Material layer removal method
This is a semi-destructive method, as it cannot be repeated on the specimen. It is
mostly used on simple test pieces of a sample. Layers, of the treated surface, are
gradually removed and a series of curvature measurements are taken as the layers
are removed. Back calculations are required to relate the curvature of the plate to the
residual stresses and to deduce the original stress distribution in the plate. The
curvature is as a result of unbalanced stresses in the material as the residual stresses
from the treated side are being removed. The original stress distribution of the layer

35
being removed and the elastic properties of the remaining material, influence the
curvature. This method can be used in conjunction with X-ray diffraction.
A similar method known as the crack compliance method, measures the gradual
relaxation of the stress that is in close proximity of an indication. Strain gauge
interferometry is used to monitor the relaxation of the stresses (Withers & Bhadeshia,
2001). The stress field depth normal to the crack can then be related to the depth as
the depth of the slot is progressively increased.
Hole drilling or Incremental hole strain gauge rosette method
The hole drilling method is cheap and is one of the most widely used techniques. It is
used to determine depth and magnitude of the residual stress. It is used to measure
residual stresses at the surface and sub-surface of the material. As the stressed
material is removed, the material left behind reaches an equilibrium state.
A shallow blind hole, of about 1 – 3 mm in diameter, is drilled, using a precision milling
guide, in increments into the treated surface between a rosette of strain gauges or
using other methods such as moire interferometry or holography (Withers &
Bhadeshia, 2001). The gauges are wired and connected to a multichannel static strain
indicator (Vishay, 2010) (Gomez-Rosas, et al., 2005).The drilling of the hole, causes
changes to occur in the stress distribution. The stress distribution also varies with
depth. These changes are recorded by the strain gauge rosette, as they measure the
relieved surface strains. From the data that is collected, the residual stress can then
be back-calculated as a function of depth. The principal residual stresses and their
angular orientation are calculated using the following equation 2-6:
𝜎 = (𝜎𝑚𝑎𝑥 + 𝜎𝑚𝑖𝑛)�̅� + (𝜎𝑚𝑎𝑥 − 𝜎𝑚𝑖𝑛)�̅� cos 2𝛽 Equation 2-6
where �̅� and �̅� are hole drilling constants and 𝛽 is the angle from the x-axis to the
direction of maximum principal stress 𝜎𝑚𝑎𝑥 (Withers & Bhadeshia, 2001). The
constants are determined by experimental calibration.
The readings become unreliable just below the portion where the diameter of the hole
is equivalent to the drilled depth.

36
Curvature Interferometry
The curvature method comprises inducing stresses into the specimen by progressively
removing from or adding layers onto it. These actions cause the specimen to curve
because of the relaxation or the addition of the residual stresses. The residual stresses
either increase or decrease in magnitude, as the layers are progressively added or
removed depending on the technique used. The variation in the stresses is a function
of the thickness. The methods used to measure curvature include profilometry, strain
gauges, video, or laser scanning.

37
LASER SHOCK PEENING SIMULATION
The LSP method requires expensive equipment for setup, and is also used on
expensive material. There is a need to predict and foresee the behaviour, of the
specimen, before the process. And also to be able to better plan the parameters that
would suit the application. This will prevent costly rework and will optimise laser setup
time. For this to happen, a series of simulations can be run in order to predict the
required or most suitable solution for a given scenario. LSP parameters can be
optimised by making use of numerical simulation.
There have been developments made in predicting the behaviour of a laser shock
peened specimen, using the Finite Element Method (FEM). The first attempts were by
Braised and Brockman (Montross et al., 2002) in predicting the residual stresses
generated by laser shock waves. The challenges faced were the inability to correlate
the theory with the results from the experiments due to the stresses in the centre of
the spot being affected by the release wave. It was observed that tensile residual
stresses were present as a result of this and restricted the modelling of it due to its
complexity.
Successful experiments conducted by (Ding et al., 2006) where the predicted residual
stresses at the rest part of the surface matched with the results from the experiment.
Single and multiple impacts of the LSP process were simulated to analyse the
distribution of the residual stresses and the depth in the 35CD4 30 HRC steel alloy.
Results from the single impact were used to compare with the FEM results for the
impact of the changing of the laser diameter spot has on residual stress field.
However, according to (Fang, et al., 2013), research done FEM simulation has not
extensively covered the effects of LSP on exotic material such as titanium alloy and
also the effects of two-sided LSP. Until now, studies have focussed more on the
improvements regarding fatigue and wear resistance from LSP treatments on steels
and aluminium alloys.
An eigenstrain approach to the modelling of LSP generated residual stresses has been
developed. This model represents the plastic strain introduced onto the work piece by
the process (Achintha and Nowell, 2011). The basis of this is on the physical changes
that the work piece experiences as its being shocked. The theory states that the top
38
layer material, surrounding the treated area, forces the plastically deformed treated
area into a compressive state as it relaxes; resulting in a residual stress field on the
surface layers. The response of the work piece, to the process, is of an elastic nature
once the plastic deformations are stabilised. The distribution of the residual stresses
is determined as the static elastic response of the work piece; and the plastic strains
are integrated as an initial an eigenstrain.
The advantage of this is approach is that less computational time is required for the
active phase of the model.
The software models used
Software used to predict residual stress fields numerically is ABAQUS (Fang et al.,
2012), ANSYS and LS-DYNA, whereby the simulation describes the residual stress
field created by the pressure pulse induced by LSP. Fang et al, used the simulation to
also analyse the residual stress field of a LSP treated Ti-6Al-4V (TC4) alloy blade
which was treated on the single and simultaneous two-sided treatment with a round
laser spot. They also experimented with the effects of varying the major laser
parameters such as laser power density, spot size, pulse width, and the number of
impacts. The Johnson-Cook (JC) model was used to represent the high strain rate
phenomenon. Explicit FEM is implemented for the analysis of the dynamic responses
of the material. This method simulates the residual stresses in the material during the
application of LSP. The high speed and intensity of the shock wave warrants the use
of explicit algorithms (Hua et al., 2009).
In order to achieve a stable deformation using the simulation, the explicit-to-implicit
method is used to proficiently release the elastic strain energy. Hua et al (Hua et al.,
2009), demonstrate with a step by step procedure on how to determine the residual
stress field in the target using ANSYS and LS-DYNA. The former is used for the static
analysis, whist the latter for the dynamic analysis, although ANSYS could perform both
explicit and implicit analysis. In the developed FEA models used, transient and static
analyses can be done on LSP treated material, with results that are in agreement with
those achieved from experiments.

39
Although the LSP simulation is not part of the study, it can be used in later studies in
better predicting the behaviour of the turbine blade material to LSPwC. This would be
advantageous, as it will reduce wastage of limited material. The literature above gives
an appreciation of the developments made in LSP modelling.

40
CHAPTER 3 PROBLEM STATEMENT DEFINITION & RESEARCH METHODOLOGY
PROBLEM DEFINITION AND OBJECTIVES / RESEARCH QUESTIONS
One of the high risk components in South African power stations are LP steam turbine
blade. This is due to the catastrophic failure that may occur as a result of a damaged
blade; as was the case in an incident in 2011 at one of the power stations. There was
severe plant damage and fortunately no fatalities. The repair costs amounted to
approximately R 3 billion. The lead-time to procure new blades for replacement is 18
months, and this has a great impact on the station’s downtime thus straining the power
grid. To mitigate these risks, it is imperative that the integrity of the turbine components
is sound for the turbine to operate safely. There are maintenance strategies in place
to alleviate unknown conditions of the components.
In power stations, SP is the only technology currently used to enhance the life and
mechanical performance of steam turbine blades and rotors. However, due to the over
peening required to achieve complete coverage there is increased surface roughness
and also a limited depth of residual stress of approximately only 300 microns that can
be achieved with this conventional method.
In previous studies most of the LSP work done was on materials such as aluminium
alloys, and titanium alloys. Only a few studies covered LSPwC on steam turbine
blades such as the one used in South African power generation industries. Exploring
and optimising the LSPwC technology in the South African context will have benefits
in terms of superior performance of critical components and human capital
development.
The purpose of this research is to confirm the achievement of compressive residual
stresses on the surface of the high strength steel material treated with LSPwC.
Investigating and optimising the LSPwC parameters and processes will enable its
application to the power stations’ high value components such as turbine blades and
rotors. Mobile models and equipment can be designed and built to enable on site blade
treatments in order to reduce machine downtime, turbine blade mishandling,
transportation costs and extend the turbine component life.

41
Exploring this technology will help achieve higher magnitude and deeper levels of
compressive residual stresses, resulting in better performance in terms of high cycle
fatigue and stress corrosion cracking. This technology will be easier to apply on
complex shapes as compared to SP.
LSPwC technology is relatively new in SA, whereas the SP technology is well
established especially for the use on crack retardation on steam turbine blades.
It is from the findings in (Rossouw & Stumpf, 2015) that this study was done to achieve
the following objectives:
To compare the results of LSPwC to those achieved from conventional SP on
a LP turbine blade; since SP is currently the conventional treatment used in the
power industry.
To optimize the laser parameters to achieve the desired compressive residual
stresses on the surface of a material treated with LSPwC.
To analyse the changes in the surface and sub-surface residual stresses, the
residual stress distribution, hardness distribution and the resulting surface
roughness of the treated samples.

42
In this chapter, the experimental methodology followed is described in detail, highlighting
the rationale used for conducting the experiments and tests in the respective fashion. And
the succeeding chapters provide more detail on the individual process steps.
Almen steel strips were used to obtain preliminary results for the most effective laser
parameters. Residual stress measurements were taken across the surfaces of the Almen
samples to map out the profile, using X-ray diffraction (XRD). The laser parameters that
were varied, namely the power intensity, coverage, and the spot size to see the effect they
had on the samples.
A number of samples were machined from the same turbine blade. This was to ensure
that the SP and LSPwC results are comparable as the material and its conditions do affect
the hardness after treatment (Clauer & Holbrook, 1981). Twenty of these were then treated
with LSPwC using the shortlisted parameter combination from the Almen strip preliminary
investigation.
The resulting material properties that the study analysed were the surface finish, residual
stress, and the surface hardness.
The measurements were done using the following method: the residual stress distribution
was measured over the sample material thickness, the hardness of the samples was
measured before and after the LSPwC treatment, and the surface roughness was
measured before and after the LSPwC treatment. The effects that the LSPwC treatment
had on the samples are observed.
The residual stresses were measured using the XRD equipment and the stress profile was
obtained by XRD and successive electro-polishing layer removal; and later surface
roughness measurements were done for comparison with SP. The roughness
measurements were done using the “Hommel Tester T8000” .The SP results are taken
from previous work done by (Newby, 2012), where the SP coverage was 200% on a 5mm
thick sample.
The methodology followed, for narrowing down the parameters, is as follows:
i. Investigation of the effect of power intensity by fixing the spot size diameter to
0.6mm and the coverage to 60 spots/mm2

43
ii. Surface XRD measurements were done on these samples to select the optimal
power intensity.
iii. The power intensity was then fixed and the spot size and coverage were
respectively varied to observe the effects they had on the surface residual stress.
The turbine samples were also analysed for a possible oxide layer build-up on the surface,
since it is known that due to the surface being uncoated; the heating caused by the plasma
encourages the surrounding oxygen to diffuse into the surface layer. The oxide layer was
measured using a 20kV bulk analysis on a scanning electron microscope (Semwal & Bhatt,
2013).
INITIAL DETERMINATION OF LSPWC PARAMETERS
Spring steel Almen strips were used in the preliminary phase, to determine and shortlist
the suitable combination of parameters that would give compressive residual stresses on
the surface. The strips were not used for their conventional use, but instead to get a trend
in the parameter combinations used. The point at which the strips bent is where the optimal
laser conditions were met. This approached was to save the turbine blade samples for the
actual study.
The treated strips aided in determining the points at which saturation of the applied laser
parameters; power intensity, spot size and coverage, occur. Fifty-four different parameter
combinations, highlighted in Table 3-1, were investigated. The results are displayed and
analysed in section 0 of the dissertation.
Table 3-1: The LSPwC parameters used on the Almen strips
LSP Parameters Parameter Values Tested
Number of pulses per mm2
(Np) 2.5 5 10 20 40 60
Power Intensity (GW/cm2) 3 5 7

44
Spot Size (mm) 0.6 0.8 1
Figure 3-1. Some of the Almen strips that were used to obtain the LSPwC parameter
trends

45
Figure 3-2. An LSPwC-treated Almen strip using different parameter combinations
The photographs in Figure 3-1 shows the type of Almen strips used in the experiment. In
Figure 3-2 an illustration of how the strips were treated using the different combinations
the LSP parameters, namely number of pulses per mm2, power intensity and spot sizes.
a
c
b

46
TURBINE SAMPLE PREPARATION
An ex-service turbine blade, shown in Figure 3-3, was sourced from the power station for
the research study. It had to be a blade that had the same mechanical properties and
characteristics as the blade used in the previous study done by (Newby, 2012).
Figure 3-3. The original LP turbine blade before machining
The turbine blade was machined to samples that had the same dimensions as the previous
study. First drawings were done to map out areas on the turbine blade that will provide
suitable sample sizes, the objective was to use as much of the turbine blade material with
minimal waste since optimisation of the LSPwC parameters had to be done to shortlist
them. The detailed drawing of the blade mapping and the sample can be found in the
Appendix A.
Description of material and sample preparation
The samples are from an ex-service X12CrNiMo12 last stage LP Turbine blade. They were
machined and polished into samples of dimensions 20 x 20 x 10mm. These dimensions
were used to ensure consistency of the stress loading during LSPwC, which would then
be comparable to the shot peened samples. The blade had the following dimensions listed
in Table 3-2. The blade material was from a power station where it is widely used in high
temperature and high-pressure application. Its properties, namely good creep and
corrosion resistance; and toughness and good creep rupture strength make it ideal to use
in an environment consisting of steam and condensate. Its properties are highlighted in
Table 3-3 and Table 3-4 below.

47
Table 3-2. LP Turbine blade dimensions
Property Dimension (mm)
Blade length 656
Root length
Blade tip width
Blade root width
142
152
213
Blade tip thickness
Blade root thickness
10
70
Table 3-3. Mechanical properties of X12CrNiMo12 (Wegst, 2004)
Property Value
Tensile strength – 𝑅𝑚[𝑀𝑃𝑎] 950
Yield strength - 𝑅𝑝0.2 [𝑀𝑃𝑎] 800
Density - 𝜌 [𝑔/𝑐𝑚3] 7.7

48
Table 3-4. Chemical composition % grade X12CrNiMoN12 (Wegst, 2004)
Element C Si Mn Ni P S Cr Mo V
Percentage
composition
0.08 -
0.15
max
0.35
0.50 -
0.90
2.00
–
3.00
max
0.025
max
0.020
11.0 -
12.5
1.50 -
2.00
0.25 -
0.40
The blade samples, seen in Figure 3-4, were used to help optimize the experiment setup
on the laser parameters for that specific material in order to get the optimal laser
parameters, such as the spot size, power intensity and coverage, for future work to be
performed on the blade’s root.
Figure 3-4. Photographs of the blade before and after machining
Thickness measurements, of each sample, were taken before the LSPwC treatment to set
a baseline for the samples. The resulting measurements are captured on a spreadsheet
in appendix. XRD measurements were done on all samples to measure any pre-existing
residual stresses.
High compressive residual stresses were found on the surfaces due to the manufacturing
and the machining process. Typical stress values ranged from 100 MPa and above. This
was rectified by the heat treatment process, prescribed and done by the Eskom Research,

49
Testing and Development Department (RT&D); and suitable for this material. The overview
of the heat treatment cycle is as follows and is depicted in Figure 3-5 below. The legends
on the right are the two thermocouple readings used to keep track of the oven
temperatures.
The samples were heated in an oven from a room temperature of 27°C to 30°C in
3 hours.
Further tempering was applied to the samples by reaching a temperature of 530°C
in 2 hours. The soaking times were kept short, to a maximum of 30 minutes, to
maintain the physical properties of the samples.
The samples are then quenched in air, to 526°C in 3 hours and cooled further to
62°C over 22 hours. This was to prevent quench cracking and distortion.
The temperature of samples was raised to 673°C in 2 hours and cooled to 77°C
over 16 hours.
Again the samples were heated from 77°C to 670°C over 2 hours and gradually
cooled to 415°C in 1 12⁄ hours; and further cooled to room temperature in 1 1
2⁄
hours.

50
Figure 3-5 The stress relieving cycle used before treating the samples
Electro-polishing was done on the surface to be processed with LSPwC to remove the
residual stress effects of the final machining. Finally, hardness tests followed to ensure
that the material properties, namely the yield stress, were not affected by the heat
treatment cycle, and to compare hardness’s before and after the treatment.
9
530
526
62
673
115
674
415
0
100
200
300
400
500
600
700
800
12:00:00 AM12:00:00 PM12:00:00 AM12:00:00 PM12:00:00 AM12:00:00 PM12:00:00 AM
Tem
pe
ratu
re [
⁰C]
Time [Hours]
Turbine Samples Heat Treatment Cycle
A.1TK(degC)
A.2TK(degC)

51
Figure 3-6: Sample before and after electro-polishing its surface
After the LSPwC treatment, the turbine blade samples underwent another round of
residual stress measurements using the XRD.
In order to determine the depth profile of the residual stresses, electro-polishing was used
to progressively remove thin layers from the surface and a recording taken of the stresses
present on the new surface after the removal of each layer. The stress distribution was
then analysed using an analytical technique which takes into account the stress relaxation
that occurs as the layers are being removed, as well as the depth of penetration, taken by
x-rays, into the stress gradient (Gregory, et al., 1996).
Some of the samples were then taken for surface finish measurements and hardness test
in order to compare with the results from the SP treated samples from the previous study.
The samples in Figure 3-6, shows the product of a successful electropolishing process.
Before electro-polishing After electro-polishing

52
The machining of the blade took place at the Eskom RT&D mechanical workshop in
Rosherville. The middle section, of the blade, is where the samples were machined out off
in order to get the required sample dimension.
First a universal milling machine, pictured below in Figure 3-7 was used to get rough cuts
from the blade. This machine operates at 230 rpm with tungsten-coated tips to cut into the
metal and its specification is detailed in Table 3-5 below.
Figure 3-7: The milling machine used for preparing the samples

53
Table 3-5: Specification of the Machine IAP 3X - Pearl
Parameter Specification
Power consumption 12kW at 50Hz
Voltage 3x400VAC
Table dimensions 1300 x 300mm
Movement X axis – 1100mm
Y axis – 400mm
Z axis – 500mm
Spindle taper SK50
To remove the root from the rest of the blade, an electrical discharge machining (EDM),
wire cutter was used. The consumable material used on this machine was a 0.25mm-
diameter wire composed of CuZn37. A FANUC Series 31i- WA CNC machine controlled
this. The principle, which the EDM works on, is one that uses electrical discharge to
acquire the desired shape. A series of rapidly recurring current, seen as sparks, is
discharged across a dielectric fluid and between the tool-electrode and the workpiece
electrode. As this happens, material is removed from the sample. A typical setup of this
process is illustrated in the Figure 3-8 below.

54
Figure 3-8: Schematic illustration of the EDM process (Kumar & Khan, 2015)

55
A band saw, depicted in Figure 3-9, with a specification outlined in Table 3-6 was then
used to cut the curved portion of the LP turbine blade.
Figure 3-9: The band saw used to machine turbine blade

56
Table 3-6: Specification of the SH7656 Cosen Semi-automatic heavy-duty bandsaw
Parameter Specification
Blade speed 28m/min
Blade size (LxWxT) 6665 x 54 x 1.6mm
Blade motor 7.5kW
Hydraulic motor 1.5kW
Coolant motor 0.1875kW
The samples were then filed on the edges, with a belt sander Figure 3-10; to remove the
edges (burrs) effectively machining the samples to approximately 11mm thickness.
A sanding machine
Figure 3-11 was selected to achieve the final 10mm thick samples with the desired smooth
surface. They were then demagnetised using a demagnetising base table Figure 3-12, to
remove the magnetic field to prevent contamination of the sample surface during LSP
experiments. The test pieces were then polished further down to approximately 9mm
thickness.

57
Figure 3-10: Belt sander used to remove the burr from the samples
Figure 3-11: Sanding machine used to achieve the final 10mm thickness dimension as
well as a smooth surface finish
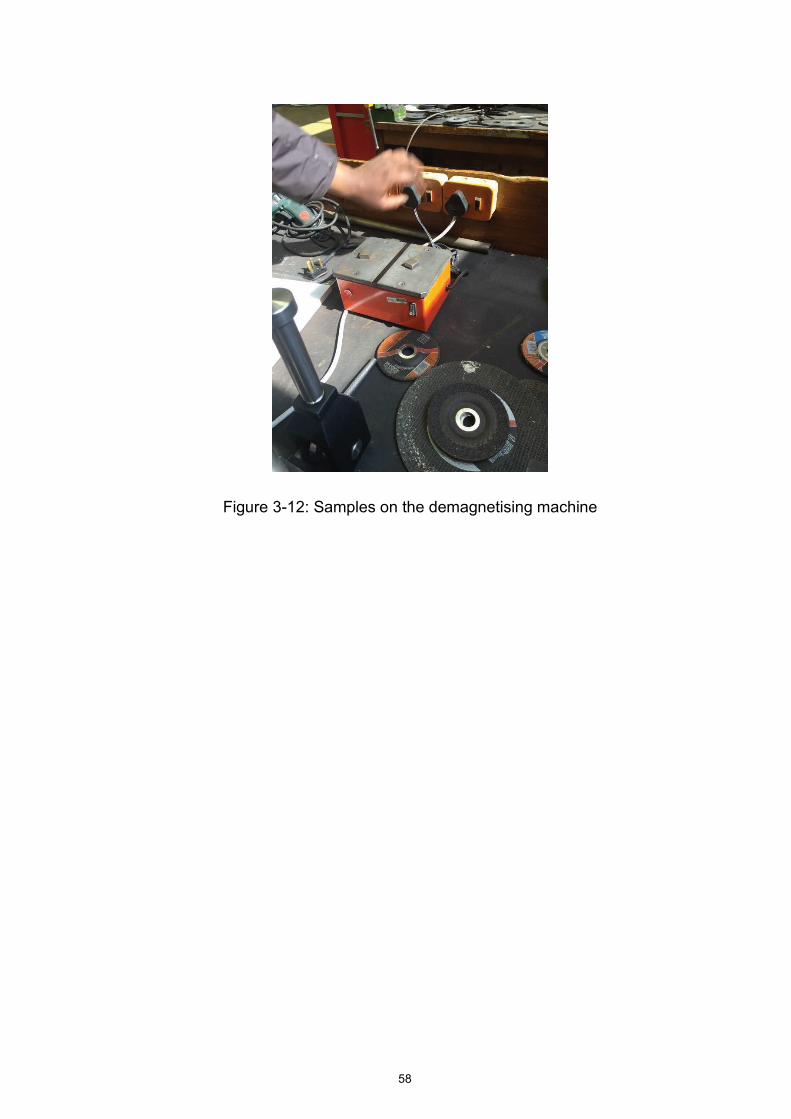
58
Figure 3-12: Samples on the demagnetising machine

59
Fi
gure
3-1
3: T
he p
ictu
res
show
ing
the
stag
es o
f LP
turb
ine
blad
e sa
mpl
es

60
Figure 3-13 shows the outcome of the different machining stages.
Sample depth measurements
The depth of the samples was also base-lined to keep track of the amount of material
removed in the mechanical- and electro-polishing processes. The initial mechanical
electro-polishing used an 800 and 1200 grit paper to clean the surfaces; from this about
10µm of the surface of each sample was removed. The electro-polishing process that
followed was to prepare the surfaces of the samples for the baseline residual stress
measurements; and the second electro-polishing process was to measure the depth to
which the LSPwC treatment had affected the samples residual stresses.
For the depth measurements, a “Mitutoyo” micrometre was used; in conjunction with a
laser-depth measuring device setup by the Engineering Senior Consultant at the Eskom
RT&D laboratory, as seen in
Figure 3-14 and Figure 3-15. The micrometre is a non-digital and has a ratchet stop and a
range of 0-25mm with 0.001mm graduation.
.
Figure 3-14: Micrometre used to confirm measured thickness of samples

61
Figure 3-15: The setup of the digital-laser sample thickness measuring device

62
Laser Shock Peening setup
The experimental apparatus and LSPwC were located and done at the CSIR National
Laser Centre in Pretoria. The layout of the system and the mounting of the sample is seen
in
Figure 3-16, Figure 3-17 and
Figure 3-18. Figure 3-19 is an illustration of the turbine LSPwC-treated sample.
Figure 3-16: Laser Peening chamber at the CSIR National Laser Centre

63
Figure 3-17: A turbine sample being treated with LSPwC
Figure 3-18: The clamping device used to hold the samples on position on the moving
stage
CNC controlled moving stage
Treated sample without coating
Incoming laser making contact
with the surface
Water nozzle controlling the
confining medium

64
Figure 3-19: Illustration showing the treated and untreated areas of the turbine sample
For the present study, a commercial Nd:YAG laser operating at a wavelength of 1064nm,
repetition rate of 10Hz and a pulse energy of 1J was used.The samples were clamped
onto an automated table, which translates in the XY direction and is controlled by CNC
controller software. The programmed travel pattern of the table is depicted in Figure 3-20.
The laser beam is directed onto the sample through a curtain of deionized water as the
confinement medium. To ensure a laminar and uniform overlay, the water was supplied at
a low pressure and a large flow rate. The water film was 0.1mm deep in order to hold back
the expansion of the plasma (Sakino et al., 2015).
Figure 3-20. The travel pattern of the laser beam on the sample
LSPwC treated
region
Untreated region
65
Parameters for the experiment were calculated as follows and following the same
expressions used by (Sano, et al., 2006):
The laser pulse energy 𝐸𝑝 , is tuned using an attenuator
The laser spot diameter 𝐷, is influenced by varying the distance between the lens
and the sample
Laser pulse density 𝑁𝑝 , is the factor of the table driving speed in the horizontal
direction of the sample and the step size in the vertical direction
Coverage 𝐶𝑣 is expressed as 𝐶𝑣 = 𝐴𝑝𝑁𝑝
o Where 𝐴𝑝 is the beam spot area and is equal to 𝜋𝐷2/4
o The peak power density is calculated as 𝐺 = 𝐸𝑝/(𝐴𝑝𝜏); with 𝜏 being the
duration of the laser pulse in full width at half maximum (FWHM). For the
experiment, this is set at ns.

66
Shot Peening setup
The Shot Peening facility used is one where most of the power stations in South Africa,
treat their turbine blades. Dr Mark Newby in “Optimisation of Shot Peening for 12Cr Steel
in Steam Turbine Blade Applications” (2012) did this portion of the study. Only the final
residual stress results from that study are used for comparison purposes in this study.
The process that was used in (Newby, 2012) is described as follows: four nozzles were
used to peen the surfaces of the samples, due to the complexity of the samples, the
nozzles were reconfigured to access the other parts of the sample’s geometry. The
standoff distance of the nozzles from the blade was 228.6mm (9”) and the angle of impact
was 75° by an 8mm diameter nozzle. The shot type S-170 and intensity Almen 8A to 12A.
The samples were exposed to a peening coverage of 200%. To prevent bending, the
samples were simultaneously shot peened on both sides. The turntable, on which the
samples were mounted, had a rotation speed of 10rpm for 12 minutes in order to achieve
a coverage of 200%. An illustration of the setup is in the picture in
Figure 3-21.

67
Figure 3-21. Setup extracted from (Newby, 2012) depicting how the sample is placed
inside the shot peening chamber.
Shot media nozzles at a standoff
distance of 228.6mm and impact
angle of 75°
Treated turbine blade
Turntable
Clamping device to keep sample
steady during the process

68
Residual stress measurement
There are two sets, of residual stress measurement results used in this report; one set is
from the SP experimental analysis conducted by Dr Mark Newby (referred to in the section
above 3.3.4) and the other set of results are from the LSPwC experimental analysis done
as part of this study. The setup of the XRD equipment and the electropolisher is similar to
that described in the SP study (Newby, 2012).
Measurements of the residual stress depth are achieved by destructively removing layers
of the treated surface and performing X-ray diffraction on each layer removed.
In this investigation, the “PROTO iXRD COMBO” system, shown in Figure 3-22 was used
to conduct the residual stress measurements. The X-ray source was a Cr-Kα tube with a
wavelength of 2.291Å and an apeture of 1mm. It was the reflections off the {211} plane
which were measured by the XRD system.
Figure 3-22: The ProtoiXRD COMBO used for measuring the residual stresses

69
Figure 3-23: A sample of the feedback from the XRD detectors
Figure 3-24: Sample mounted in the XRD machine
The use of the electro-polisher for surface preparation is that it does not leave a deformed
and stressed layer like other methods such mechanical grinding and polishing do. An
electro-polisher is also known as electrochemical polishing or electrolytic polishing and is
mainly used to polish, passivate, and de-burr metal parts. The electrolytes are usually
concentrated acid solutions with high viscosity, such as perchloric acid, orthophosphoric
acid, sulphuric acid, acetic acid, ethanol and water (Newby, 2012).

70
Figure 3-25: Sample on the electro-polishing machine
When doing layer removal, there were incidents of a matt surface finish instead of a shiny
finish, as the solution had a tendency of overheating. This was evidence of surface residual
stress relieving taking place during results. This phenomenon is also in (Newby, 2012) .
The way in which the electro-polishing machine works is that, the side of sample that is to
be polished is in contact with a temperature-controlled electrolyte and functions as the
anode; it connects to the positive terminal of a DC power supply. Attached to the cathode
is the negative terminal. Current passes from the anode, where metal on the surface is
oxidized, and dissolved in the electrolyte, to the cathode. At the cathode, a reduction
reaction occurs and a thin layer of the material is removed by the dissolution of the surface.

71
Baseline measurements of the samples were done to record the existing stresses in the
samples. Electro-polishing was initially done to prepare the surfaces for residual stress
measurements the settings of the electro-polisher are highlighted in Table 3-7 below:
Table 3-7: The set of parameters used for electro-polishing the turbine samples
Parameter settings Values Material steel Electrolyte A2 Area 1cm2 Work Polishing Only Flowrate 14rpm Voltage 30 V
Electrolyte A2 was used as per recommendation from the supplier as it is the most suitable
for steel material.
Surface roughness measurement
The Hommel Tester T8000 profilometer, seen in Figure 3-26, was used to measure the
surface roughness of the untreated samples and the LSPwC and SP treated samples for
comparison for this study. This apparatus is PC-based and consists of an evaluation unit,
printer, keyboard, mouse and measuring electronics for data logging and controls for
peripherics. The software used on the PC is TURBO WAVE. This machine is located at
the University of Johannesburg’s Metallurgy laboratory.
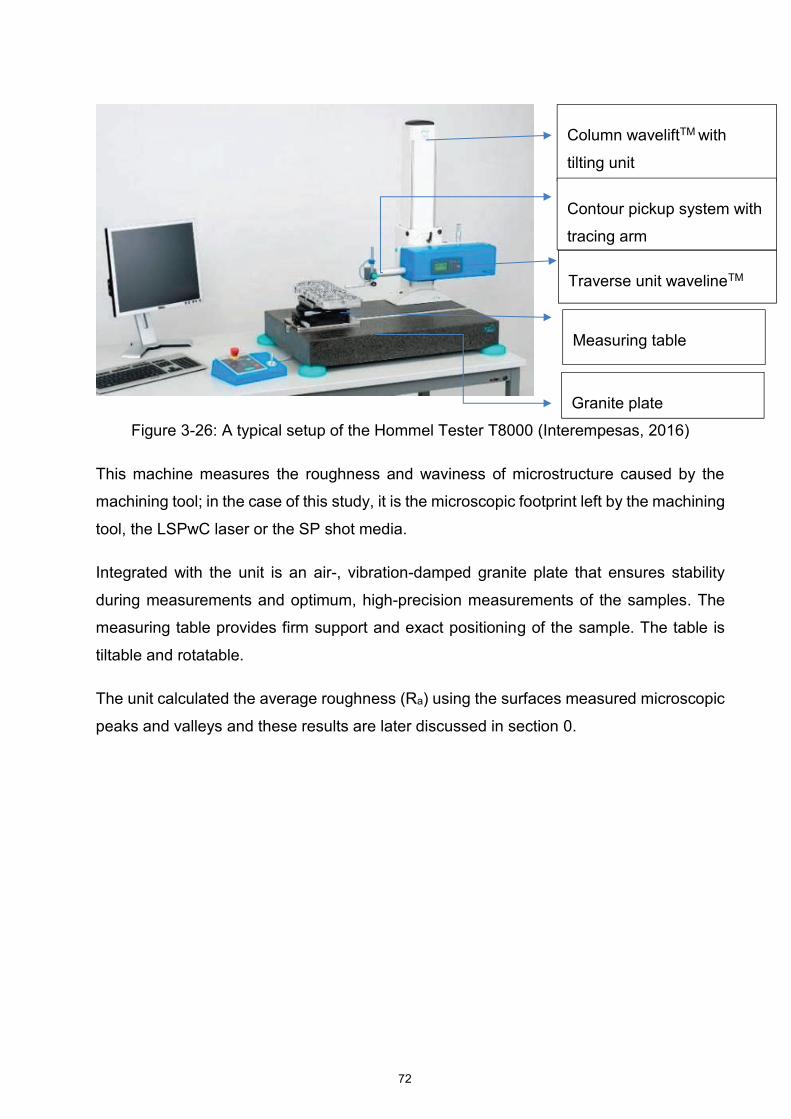
72
Figure 3-26: A typical setup of the Hommel Tester T8000 (Interempesas, 2016)
This machine measures the roughness and waviness of microstructure caused by the
machining tool; in the case of this study, it is the microscopic footprint left by the machining
tool, the LSPwC laser or the SP shot media.
Integrated with the unit is an air-, vibration-damped granite plate that ensures stability
during measurements and optimum, high-precision measurements of the samples. The
measuring table provides firm support and exact positioning of the sample. The table is
tiltable and rotatable.
The unit calculated the average roughness (Ra) using the surfaces measured microscopic
peaks and valleys and these results are later discussed in section 0.
Column waveliftTM with
tilting unit
Contour pickup system with
tracing arm
Traverse unit wavelineTM
Measuring table
Granite plate

73
Surface hardness and oxide layer measurement
The surface hardness, for this study, was measured using the EMCOTEST DuraScan
micro hardness tester Figure 3-27, located at the Eskom Research, Testing and
Development Department in Rosherville, Johannesburg.
Figure 3-27: Illustration of the micro hardness tester setup with the sample

74
The EMCO Test DuraScan is a micro Vickers hardness tester and was purchased from
the IMP Innovative Solutions Company. It measures micro- and low load hardness with a
closed loop-load cell technology.
The machine was set to measure Vickers hardness according to EN ISO 6507, ASTM E-
92,384 using a test load of 10kg. Three diagonal points were measured across the sample
as illustrated in Figure 3-28 below.
Figure 3-28: An illustration of how the tester measured the hardness of the sample.
Direction of
scan
Test point 1
Test point 2
Test point 3

75
Figure 3-29: Graph of the measured hardness values of the turbine samples
The graph in Figure 3-29 shows that samples responded to the heat treatment in a similar
manner.
324
325
326
327
328
329
330
1 2 3
Har
dn
ess
Val
ues
(H
V 1
0)
Test Points on Samples
Average Hardness of Samples after Heat Treatment

76
CHAPTER 4 RESEARCH RESULTS AND DISCUSSION
RESULTS OF THE ALMEN STRIP INITIAL PROCESS
The combination of the parameters stipulated in Table 3-1, were used to determine and
shortlist the suitable combination of parameters that would give compressive stresses at
the surface. The treated strips aided in determining the points at which saturation of the
applied laser parameters; irradiance and coverage, occur.
The selected optimal parameter combinations from the Almen strips were used on the
turbine blade samples.
The effects of coverage, power intensity, and spot size, are depicted in the following
graphs Figure 4-1, Figure 4-2, and Figure 4-3. The compressive residual stresses are
labelled as “Stress 1” and “Stress 2” There are two components to the residual stress: 𝜎ℶis
the residual stress which is in the direction of travel of the table; and the 𝜎𝑛 is the residual
stress which is in the normal direction.
Figure 4-1. Stress results of parameter 7 GW/cm2 and spot size 0.6mm
-200
-150
-100
-50
0
50
100
150
200
0 10 20 30 40 50 60 70
Res
idu
al S
tres
s (M
Pa)
Coverage (spots/mm2)

77
The coverage trend in Figure 4-1 shows that both principal residual (surface) stresses
become more compressive as the coverage increases from 20 spots/mm2. Another
phenomenon that is seen in these results is the increasing split between the two stresses.
At higher coverages, the divergence was great. The trend then shows that the most
suitable coverage in the range is, in this case, at 60 spots/mm2.
Figure 4-2. Stress results showing the power effect from the Almen strips - constant
coverage 60 spots/ mm2; constant spot size 0.6mm2
The trend in Figure 4-2 is of the effect of varying the power intensity. As the power intensity
of the laser increased, so too does the magnitude of the compressive residual stresses,
and with an increase in directionality.
-200
-150
-100
-50
0
50
100
150
0 2 4 6 8
Res
idu
al S
tres
s (M
Pa)
Power Intensity (GW/cm²)
Stress 1
Stress 2

78
Figure 4-3. Stress 1 results showing the spot size effect from the Almen strips -
constant power intensity 7GW/cm2; varying coverage
Figure 4-4. Stress 2 results showing the spot size effect from the Almen strips - constant
power intensity 7GW/cm2; varying coverage
In
-50
0
50
100
150
200
0 10 20 30 40 50 60 70
Res
idu
al S
tres
s (M
Pa)
Number of pulses (Np) spots/mm2
S1_7Gw_1mm
S1_&GW_0.8mm
S1_7GW_0.6mm
-200
-150
-100
-50
0
50
100
150
0 10 20 30 40 50 60 70
Res
idu
al S
tres
s (M
Pa)
Number of pulses (Np) spots/ mm2
S2_7GW_1mm
S2_7GW_0.8mm
S2_7GW_0.6mm

79
Figure 4-3 and 4, the trend for both stresses shows that as the spot size is increased from
0.6mm to 1mm, the residual stress tends to become more tensile. For the treatment of
the turbine blade samples, the spot size of 0.6mm is selected.
Based on the trends in the data from the Almen strip tests the twenty turbine blade samples
were treated as shown Table 4-1 below:
Table 4-1. Matrix for treatment of turbine blade samples
STEP 1 STEP 2 STEP 3
Power Intensity effect Coverage effect Spot size effect
Fix spot diameter to
0.6mm
Fix coverage to 60
spots/mm2
Vary power intensity from
4,5,6 and 7 GW/cm2
Fix spot diameter to
0.6mm
Fix power intensity at
optimal point from Step 1
Vary coverage from 20 to
80 spots/mm2
Fix power intensity
Select constant coverage
at optimal from Step 2
Vary spot size from 0.6 to
1.2 mm

80
RESULTS OF THE TURBINE BLADE SAMPLES
The residual stresses, for both principal stresses, Stress 1 and Stress 2, were found to be
in comparable specifically for the combinations depicted in Figure 4-5, 4-6 and Figure 4-7.
These are the desired results as they prove that compressive stresses can be achieved
on the surface after a LSPwC treatment. In optimising the three laser parameters, power
intensity, coverage and spot size, consistent surface compressive residual stresses in the
region of – 500 to -750 MPa for “Stress 2” were achieved.
By increasing power intensity, the magnitude of the compressive residual stress also
increased, as depicted in Figure 4-5. An increase in power intensity means an increase in
the induced plasma pressure pulse on the material surface, although saturation starts to
occur above 6 GW/cm2. This is attributed to the laser-induced dielectric breakdown of the
water overlay that reduces the amount of power density from generating a shock wave
into the material, and is instead absorbed by the water (Montross, et al., 2002).
Figure 4-5. The residual stresses for the power intensity effect, where the coverage and
spot size are fixed at 60 spots/mm2 and 0.6mm respectively
-800
-700
-600
-500
-400
-300
-200
-100
0
0 2 4 6 8
Res
idu
al S
tres
s (M
Pa)
Power Intensity (GW/cm2)
Stress 1
Stress 2

81
Figure 4-6. The residual stresses for coverage effect, where the power intensity and spot
size are fixed at 6GW/cm2 and 0.6mm respectively
Figure 4-7. The residual stresses for spot size effects, with constant power intensity of
6GW/cm2 and Cv of 16.96
-800
-700
-600
-500
-400
-300
-200
-100
0
0 20 40 60 80 100
Res
idu
al S
tres
s (M
Pa)
Np (spots per mm2)
Stress 1
Stress 2
-700
-600
-500
-400
-300
-200
-100
0
0 0.2 0.4 0.6 0.8 1 1.2 1.4
Res
idu
al S
tres
s (M
Pa)
Spot Size (mm)
Stress 1
Stress 2

82
In (Ding & Ye, 2006) it is mentioned that optimising the coverage ratio, does give improved
residual stress results. The trend seen in Figure 4-6 shows the evidence of the benefits
achieved from increasing the coverage; the more laser shots per area, the more
compressive the residual stress becomes for the given power intensity and spot size.
Figure 4-7 shows that by decreasing the spot size the compressive residual stresses were
enhanced. For this activity, the Cv, defined as (Np) x (spot area), with Np being the spots
per mm2, was fixed at 16.96 together with the power intensity that was fixed at 6GW/cm2.
Based on the trends shown in the data from the treated turbine blade samples the optimal
parameters were selected as shown in Table 4-2. This parameter combination gave a
better set of results as compared to the other combinations.
Table 4-2. Optimal parameters for Turbine Blade Samples
Power Intensity 6 GW/cm2
Coverage 40 spots/mm2
Spot Size 0.6 mm

83
LSPWC RESIDUAL STRESS PROFILE
Successive residual stress measurements were taken across the surface, of the treated
samples, in the X and Y directions as depicted on a selected sample in Figure 4-8 below.
The methods used to measure the residual stresses are the X-ray diffraction method in
conjunction with the material layer removal method described in sections 0 and 0
respectively.
Figure 4-8. The X- and Y-direction planes on an LSPwC-treated sample
(x, y) = (0, 0)

84
Figure 4-9. The residual stress surface profile across of the LSPwC-treated sample -
6GW/cm2, 0.6mm spot size and 20 spots/mm2, in the X-plane (scan direction)
The residual stress profile is seen in Figure 4-9 to be in the tensile range on the outlying
untreated area. The compressive stresses are constant within the treated area, and are
relatively uniform. There is also no sharp transition from compressive residual stresses to
tensile stresses at the edge of the treated area (treated area is shaded in pink). The even
distribution of the compressive residual stress across the treated surface area is what is
desired from the experiment, as it proves that the selected spot coverage ratio is optimal.
The gradual transition of the residual stress profile from treated to untreated region is
indicative of the absence of spallation or delamination of the material.

85
Figure 4-10. Corrected in-depth profile of the residual stresses after LSPwC- 6GW/cm2,
0.6mm spot size and 20 spots/mm2
Figure 4-10 gives a clear illustration of compressive residual stresses achieved from the
surface to the subsurface, of up to about 0.6mm. This is achieved with a spot size of
0.6mm; a coverage of 20 spots/mm2 and a power intensity of 6 GW/cm2. The coverage is
directly related to the number of impacts per spot (Rossouw & Stumpf, 2015). Increasing
the spot coverage will result in deeper compressive residual stresses. This is because of
more plastic deformation taking place within the material (Ding & Ye, 2006).
The graph depicted in Figure 4-10 also shows the shallow depth of the shock wave
penetration. The experiment did not achieve the 1mm indicated in previous studies done
by (Ding & Ye, 2006), (Peyre, et al., 1998), and (Singh, et al., 2011). The absence of the
coating in the LSPwC process has compromised the material’s ability to absorb more
energy, from the plasma, into the sub-surface. Direct ablation can only achieve plasma
pressure of tenths of a GPa (Ding & Ye, 2006), whereas with a coating plasma pressures
up to 5-10 MPa (Devaux, et al., 1993) could have been achieved.
The presence of the residual tensile stresses confirms that they are formed to ensure
equilibrium in the material exists. According to (Gregory, et al., 1996) materials treated to
increase their fatigue resistance should have a treated area large enough to move the
tensile stresses outside of the fatigue-critical area. It was also observed that when the spot
-900
-800
-700
-600
-500
-400
-300
-200
-100
0
100
200
0 0.2 0.4 0.6 0.8 1 1.2St
ress
(M
Pa)
Depth (mm)
0 deg
45 deg
90 deg
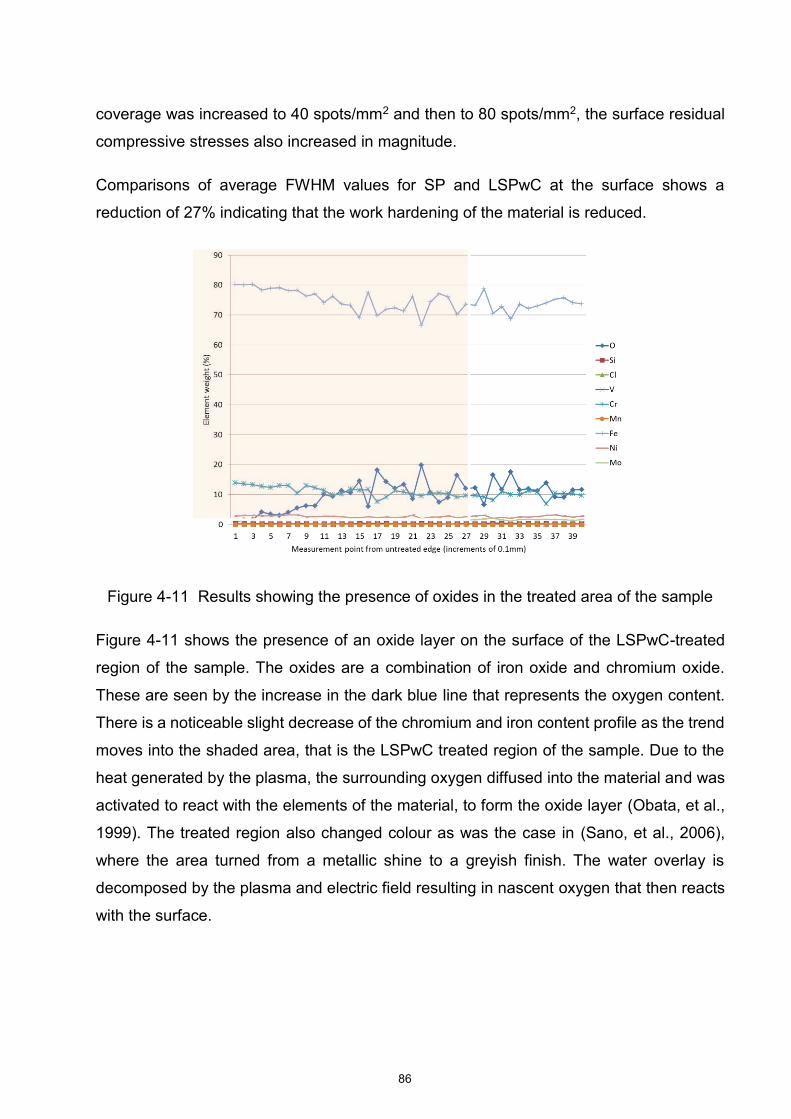
86
coverage was increased to 40 spots/mm2 and then to 80 spots/mm2, the surface residual
compressive stresses also increased in magnitude.
Comparisons of average FWHM values for SP and LSPwC at the surface shows a
reduction of 27% indicating that the work hardening of the material is reduced.
Figure 4-11 Results showing the presence of oxides in the treated area of the sample
Figure 4-11 shows the presence of an oxide layer on the surface of the LSPwC-treated
region of the sample. The oxides are a combination of iron oxide and chromium oxide.
These are seen by the increase in the dark blue line that represents the oxygen content.
There is a noticeable slight decrease of the chromium and iron content profile as the trend
moves into the shaded area, that is the LSPwC treated region of the sample. Due to the
heat generated by the plasma, the surrounding oxygen diffused into the material and was
activated to react with the elements of the material, to form the oxide layer (Obata, et al.,
1999). The treated region also changed colour as was the case in (Sano, et al., 2006),
where the area turned from a metallic shine to a greyish finish. The water overlay is
decomposed by the plasma and electric field resulting in nascent oxygen that then reacts
with the surface.

87
SURFACE CHARACTERIZATION LSPWC VS SP
This section is the discussion of the changes in surface characterisation, making a
comparison on how the two treatments, SP and LSPwC, affect the material.
Surface roughness comparison
The surface roughness (where multiple scans where taken across the step direction) of
the LSPwC is much less than that of the shot peened sample as seen on Figure 4-12. This
is expected according to (Ivetic & Ristori, 2010), and also considering that it is metal or
small sphere shaped glass/ceramic balls making small indentations on the metal surfaces
as opposed to a laser beam. Unfortunately with the direct ablation method the surface is
left with re-solidified droplets and craters (Ding & Ye, 2006) as a result of the laser ablation
and melting. This is also characterised by undesirable tensile stresses being present
For wear applications, the surface is required to be of a smooth finish; so if the surface
has to be polished after SP treatment, the process inadvertently removes a significant
amount of the compressively stressed layer. The LSPwC also has an advantage over SP
as it imparts compressive stresses to greater depths than SP (Sano, et al., 2006).

88
Figure 4-12. Surface roughness comparison; LSPwC -6GW/cm2, 0.6mm spot size and
20 spots/mm2; SP- 200% coverage
Figure 4-13 Depth residual stress profile comparison
0
0.5
1
1.5
2
2.5
3
3.5
Electropolished Basematerial
LSP without Coating Shot Peened
Ra
(mic
ron
s)
Treatment on Sample

89
Sub-surface depth residual stress profile
The residual compressive stress layer generated from LSP is expected to reach greater
depth than the depth achieved from conventional SP. Compared to SP, LSPwC in the
sample shown in
Figure 4-13, proves that the experimental results concur with what has been proven in
literature (Montross, et al., 2002) (Singh, et al., 2011).

90
Surface hardness
The hardness tests done for comparison between the LSPwC and SP treated samples
were done using a bigger machine, EMCO Test M4C 750 G3R-E due to the resulting
surface roughness. Two spots were measured along the diagonal of the samples. The
LSPwC-treated sample, KK02, hardness measurement was achieved using the Brinell
scale setting and the SP-treated sample used a Rockwell setting.
The results used to compare the hardness measurements after the treatments are
shown in Table 4-3 below:
Table 4-3 The hardness results showing the different values of LSPwC and SP
Treated Sample Hardness measured Approximate equivalent Vickers hardness
LSPwC (KK02) 332 and 340 HB 350 HV
SP 35.2 and 34.1 HRC 335 HV
The results show an increase in the hardness for both treatments indicating that there is
indeed an increase in dislocation densities as in the literature. And this is the expected
result of having the LSPwC showing better hardness than the SP.
The surface hardness of the untreated specimen was expected to increase by 8% after
the LSPwC treatment. On average, the hardness increment of the SP- and LSPwC-treated
samples are by 2.13% and 6.28% respectively. The positive of this is that it is evident that
the residual stresses induced in the samples are compressive and not tensile. However,
the figures are quite low as compared to the results in the experiment conducted by (Lim
et al., 2012) where the average hardness increased as follows for the respective laser
intensity: 43% at 5 GW/cm2, 53% at 10 GW/cm2, and 51% at 15 GW/cm2. The attributing
factor for these low figures could be a result of the absence of a protective coating on the
samples. This means that the SP and LSPwC samples would be more prone to wear than
samples treated with LSP.

91
This means that the surface hardness of the material will increase with increasing laser
pulse density; and is restricted by the properties of the material used for coating.

92
CHAPTER 5 CONCLUSION
The experimental results clearly showed the benefits that LSPwC has over conventional
SP; in terms of the greater depth profile of residual stresses achieved (Clauer, 1996)
(Singh, et al., 2011), reduced work hardening and the surface roughness after treatment.
The process of using the Almen strips to find the optimal LSPwC parameters combination
proved to be profitable as it spared the blade material to be used more for comparing the
outcome of LSPwC with SP, instead of wasting the blade material doing trial and error
experiments as it was the only blade available for the experiment.
The LSPwC processing of the blade resulted in a reduction in mean surface roughness
(Ra), and deeper compressive residual stresses than the conventional SP processing. In
particular, the effects of LSPwC laser processing parameters, such as laser intensity, laser
spot size and coverage, on the X12CrNiMo12 high strength steel base material of the
turbine blade were also determined.
Compressive residual stresses were achieved for LSPwC. Regarding the parameters for
the application on X12CrNiMo12, the most effective power intensity was 6 GW/cm2. The
investigation also revealed that for a certain combination of power intensity and coverage,
reducing the spot size increases the compressive residual stress. On some of the samples,
the optimal parameters achieved both principal stresses in compression. The residual
stress depth profile on these samples showed a significant improvement compared to SP
in terms of maximum depth. The average compressive stressed layer achieved by LSPwC
is 0.6mm, which is not the desired 1mm as stated in (Ding & Ye, 2006) (Singh, et al., 2011).
The coating material enhances the amount of energy absorbed in the material (Ding & Ye,
2006) (Peyre, et al., 1998) so due to the uncoated approach used in this study, some of
the energy was not absorbed and this contributed to the compressive stresses being
imparted to levels less than the desired 1mm.
The investigation confirmed the reduction in final mean surface roughness of an LSPwC
surface versus the surface treated with SP, which is ideal in minimising crack initiation
sites on the surface. However, if they were to be compared to coated samples treated with

93
LSP, the surface roughness would be worse than these due to the melting of the material
forming small droplets on the surface (Clauer, 1996).
The microhardness did increase, this shows that dislocations were induced into the
material and this part of the changes expected from the LSP treatment. The hardness on
the SP treated samples is approximately 5% less than LSPwC treated samples, as
expected.
The surface finish of the LSPwC samples was less rough than those surfaces treated by
SP, as it is mentioned in literature that is due to impact that the shot media has on the
surface versus the lesser. However, the LSPwC surface finish is not as it would be
expected of LSP due to the melting of the surface as no protective coating was used. The
melting is one of the disadvantages mentioned in (Peyre, et al., 1998); however, there are
ways of minimizing this by optimising the coverage of the laser. There was an oxide layer
which is expected as discussed in (Obata, et al., 1999) and (Sano, et al., 2006). This is
because of the interaction of the generated plasma, the oxygen in the water film and the
material.
The parameters of the laser were optimized to achieve the desired compressive residual
stresses in the surface of the X12CrNiMoN12 using LSPwC. The optimal LSPwC
parameter combination for this material is a power density of 6GW/cm2; a coverage of 40
spots/mm; and a laser spot size of 0.6mm. Through the investigation, it was identified that
the spot size is critical in increasing the compressive residual stresses on the LSPwC-
treated surface; and that 6 GW/cm2 is the most effective power intensity with the laser
system used. The previous study (Rossouw & Stumpf, 2015), using the same LSP system,
found surface tensile residual stresses for LSPwC. Through rigorous examination of the
influence of parameters, successful achievement of compressive residual stress was
achieved.

94
CHAPTER 6 RESEARCH COLLABORATION
This research forms part of a collaboration involving Eskom, the CSIR NLC (Council for
Scientific and Industrial Research National Laser Center) and the University of the
Witwatersrand. The objectives of the collaboration are as follows:
To identify a fit sacrificial overlay for a suitable overlap strategy;
To identify LSP parameter configuration by optimising the residual stress profiles
and surface roughness;
To quantify the materials’ response to LSP through fatigue and stress corrosion
testing on coupons;
To achieve the desired performance from successfully treated 3D fir-tree geometry
components;
And to further develop LSP on hidden surface-applications
The benefits of this collaboration are to enhance the life of some of the critical high value
components of the power utility for instance the turbine blades and rotors, using LSP. This
also includes saving costs by reducing premature material replacement as a result of crack
alleviation. The other added benefit of the collaboration is to contribute towards developing
local expertise and knowledge in the Country.

95
CHAPTER 7 RECOMMENDATIONS AND FUTURE WORK
The study focused on the effect of processing parameters on the surface residual stress
state, with the aim of achieving surface compressive residual stresses. The effect of
parameter variation on the depth of compressive residual stress has not been quantified.
Also to apply the LSP technology on the root of the LP turbine blade need to be
investigates, since this has a more complex geometry than the blade, and it is the area of
the blade that experiences stress-related cracking.
Investigating and optimising the LSPwC parameters will enable its application to the power
stations’ high value components such as turbine blades and rotors. Exploring this
technology will help achieve higher magnitude and deeper levels of compressive residual
stresses, resulting in better performance in terms of high cycle fatigue and stress corrosion
cracking. In the preparation of the sample, the impact of the grinding and machining on
the distribution of residual stress field on the material needs to be considered.
Future work should also research the simulation LSPwC treatment on the material
X12CrNiMo12 used in this paper.

96
CHAPTER 8 REFERENCES
1. Achintha, M. Nowell, D. (2011). Eigen strain modelling of residual stresses generated by laser shock peening. Journal of Materials Processing Technology. 211(6). 1091-1101.
2. Ballard, P. Fournier, P.J. Fabbro, R. Frelat, J. (1991). Residual stresses induced by laser-shocks. Le Journal de Physique IV.01 (C3). C3-487 - C3-494.
3. Banas, G. Lawrence, F. V. (1990). Shot Peening versus Laser Shock Peening. University of Illinois. Illinois.
4. Booysen, C., Heyns, P.S., Hindley, M.P., Scheepers, R. (2015). Fatigue life assessment of a low-pressure steam turbine blade during transient resonant conditions using a probabilistic approach. International Journal of Fatigue. 73. 17-26.
5. Basic X-ray Powder Diffraction (XRPD). Retrieved from http://xray.tamu.edu/pdf/notes/intro2xrd.pdf.
6. Bovid, S. (2017). Laser Peening. McGraw-Hill Education. Dublin. 7. Brent, D.C. Hackel, L.A. Daly, J. Harrison, J. (2000). High Power Laser for Peening of
Metals Enabling Production Technology. Materials and Manufacturing Processes. 15(1).81-96.
8. Clauer, A.H. (1996). Laser Shock Peening for Fatigue Resistance. Dublin. The Metal Society of AIME.
9. Clauer, A. H.; Holbrook, J. H. (1981). Effects of Laser Induced Shock Waves. Shock Waves and High- Strainrate Phenomena in Metal.Plenum Publishing Corporation. New York. 675-703.
10. Devaux, D. Fabbro, R. Tollier, L. Bartnicki, E. (1993). Generation of shock waves by laser‐induced plasma in confined geometry. Journal of Applied Physics.74 (4). 2268-2273.
11. Ding, K. Ye, L. (2006). Laser Shock Peening, Performance and Process Simulation. Florida Woodhead Publishing and Maney Publishing.
12. Eskom. (2007). Operating Manual Turbine- Matimba Power Station. Lephalale. 13. Fabbro, R. Fournier, J. Ballard, P. Devaux, D. Virmont, J. (1990). Physical study of laser‐
produced plasma in confined geometry. Journal of Applied Physics.68 (2). 775-784. 14. Fabbro, R. Peyre, P. Berthe, L. Scherpereel, X. (1998). Physics and applications of
laser-shock processing. Journal of Laser Applications.10 (6). 265-279. 15. Fang, Y. W. Li, Y. H. He, W. F. Li, P. Y. (2013). Effects of laser shock processing with
different parameters and ways on residual stresses of a TC4 alloy blade. Materials Science & Engineering A.559. 683-692.
16. Fu, Y. Zhang, X. Fu-Zhen, X. Zhengdong, W. Shan-Tung, T. (2012). Simulation of the elasto-plastic response and residual stresses near metal surface due to laser shock processing. From Failure to Better Design, Manufacture and Construction. 169-178.
17. Gomez-Rosas, G. Rubio-Gonzalez, C. Ocana, J. L. Molpeceres, C. Porro, J. A. Chi-Moreno, W. Morales, M. (2005). High-level compressive residual stresses produced in aluminium alloys by laser shock processing. Applied Surface Science. 252(4). 883-887.
18. Gregory, J.K. Rack, H.J. Eylon, D. Minerals, Metals Materials Society Meeting. (1996). Surface performance of titanium: proceedings of a Symposium on Surface Performance of Titanium sponsored by the Titanium Committee of TMS, held at the 1996 Fall TMS Meeting in Cincinnati, Ohio, October 7-9, 1996.Minerals, Metals & Materials Society.
19. Hammersley, G. Hackel, L. Harris, F. (2000). Surface Prestressing to Improve Fatigue Strength of Components by Laser Shot Peening. Optics and Lasers in Engineering, 34(4-6), 327-337.
97
20. Hill, M. R. DeWald, A. T. Demma, A. G. Hackel, L. A. Chen, H. Dane, C. B. Specht, R. C. Harris, F. B. (2003). Recent Developments in Laser Peening Technology. Advanced Materials and Processes 4.
21. Hong, X. Wang, S. Guo, D. Wu, H. Wang, J. Dai, Y. Xia, X. Xie, Y. (1998). Confining medium and absorptive overlay: their effects on a laser-induced shock wave. Optics and Lasers in Engineering.29 (7). 447-455.
22. Hong, Z. Chengye, Y. (1998). Laser shock processing of 2024-T62 aluminium. Materials Science and Engineering: A.257 (2). 322-327.
23. Hua, D. Yun, W. Lan, C. (2009). Laser shock forming of aluminium sheet: Finite element analysis and experimental study. Applied Surface Science. 256. 1703-1707.
24. Hu, Y. X.; Yao, Z. Q. (2008). Fem simulation of residual stresses induced by laser shock with overlapping laser spots. Acta Metallurgica Sinica.21 (2). 125-132.
25. Interempesas (2016). CNC Surface Roughness Profilometers. Retrieved from http://www.interempresas.net .
26. Glenn, J.H. (2002). Low-Plasticity Burnishing: Fatigue life and resistance to damage are increased at relatively low cost. Retrieved from https://www.techbriefs.com/component/content/article/tb/techbriefs/manufacturing-prototyping/6899 .
27. Hashimoto, T., Osawa Y., Itoh, S., Mochizuki, M., Nishimoto, K., (2013). Long-Term Stability of Residual Stress Improvement by Water Jet Peening Considering Working Processes. Journal of Pressure Vessel Technology. 135(3). 031601-031601-8.
28. Ivetic, G. (2010). Laser Shock Peening, Process and Current Applications. Presentations, Italy.
29. Ivetic, G. Ristori, V. (2010). Experimental campaign on Laser Shock Peening for thin Al specimen hole treatment. Presentations, Madrid.
30. Kumar, A. Khan, S. (2015, April 1). Presentation on Electric discharge machining. Retrieved from https://www.slideshare.net/AlokYadav29/edm .
31. Lakkasuo S. (2010, January 12). Retrieved from https://commons.wikimedia.org/wiki/File:Lasercons.svg .
32. Lee, D. (2008). Feasibility study on laser micro welding and laser shock peening using femtosecond laser pulses. Ann Arbor, University of Michigan.
33. Leghorn, G. (1957). The Story of Shot Peening. American Society of Naval Engineers.69 (4). 653-666.
34. Lim, H. Lee, M. Kim, P. Jeong, S. (2012). Laser shock peening of AISI 304 stainless steel for the application to seawater desalination pump components. Desalination and Water Treatment. 33(1-3). 255-260.
35. Srivastava, M., Tripathi, R., Hloch, S., Rajput, A., Khublani, D., Chattopadhyaya, S., Dixit A. R., Foldyna, J. Adamčík, P., Klich, J. (2018). Surface Treatment of AISI 304 Using Pulsating Water Jet Peening. Applications of Fluid Dynamics. 135(3).535-548.
36. Masse, J.E. Barreau, G. (1995). Surface Modification by Laser Induced Shock Waves. Surface Engineering. 11(2). 131-132.
37. Menig, R. Schulze, V. Vohringer, O. (2002). Comparison of Surface Characteristics and Thermal Residual Stress Relaxation of Laser Peened and Shot Peened AISI 4140. Institut fur Werkstoffkunde I, Universitat Karlsruhe. 2002065. 498-504.
38. Mohammadi, F., Sedaghati, R., Bonakdar, A. (2014). Finite element analysis and design optimization of low plasticity burnishing process. The International Journal of Advanced Manufacturing Technology. 70(5). 1337-1354.
39. Montross, C. S. Florea, V. Swain, M. V. (2001). The influence of coatings on subsurface mechanical properties of laser peened 2011-T3 aluminium. Journal of Materials Science.36 (7). 1801-1807.
40. Montross, C.S. Wei, T. Ye, L. Clark, G. Mai, Y. (2002). Laser shock processing and its effect on microstructure and properties of metal alloys: A review. International Journal of Fatigue.24 (10). 1021-1036.
98
41. Newby, M. (2012). Optimisation of Shot Peening for 12Cr Steel in Steam Turbine Blade Applications (doctoral dissertation). University of Plymouth.
42. Obata, M. Sano, Y. Mukai, N. Yoda, M. Shima, S. Kanno, M. (1999, May). Effect of Laser Peening on Residual Stress and Stress Corrosion Cracking for type 304 Stainless Steel. Paper presented at the 7th International Conference on Shot Peening. Warsaw, Poland.
43. Ocana, J. L. Morales, M. Molpeceres, C. Porro, J. A. (2005). Laser Shock Processing as a Method for Surface Properties Modification of Metallic Materials. 9th International Conference for Shot Peening.
44. Pant, B.K. Sundar, R. Kumar, H. Kaul, R. Pavan, A.H.V. Ranganathan, K. Bindra, K.S. Oak, S.M. Kukreja, and L.M. Prakash, R.V. Kamaraj, M. (2013). Studies towards development of laser peening technology for martensitic stainless steel and titanium alloys for steam turbine applications. Materials Science and Engineering: A.587. 352-358.
45. Peyre, P. Berthe, L. Scherpereel, X. Fabbro, R. Bartnicki, E. (1998). Experimental study of laser-driven shock waves in stainless steels. Journal of Applied Physics.84 (11). 5985-5992.
46. Peyre, P. Fabbro, R. (1995). Laser shock processing: A review of the physics and applications. Optical and Quantum Electronics.27. 1213-1229.
47. Peyre, P. Fabbro, R.Merrien, P. Lieurade, H.P. (1996). Laser shock processing of aluminium alloys. Application to high cycle fatigue behaviour. Materials Science and Engineering: A.210 (1-2). 102-113.
48. Peyre, P. Scherpereel, X. Berthe, L. Carboni, C. Fabbro, R. Beranger, G. Lemaitre, C. (2000). Surface modifications induced in 316L steel by laser peening and shot peening. Influence on pitting corrosion resistance. Materials Science and Engineering: A. 280(2). 294-302.
49. Prevey, P.S. Cammet, J.T. (2002). Restoring Fatigue Performance of Corrosion Damaged AA7075-T6 and Fretting in 4340 Steel with Low Plasticity Burnishing. Cincinnati. Lambda Research Cincinnati.
50. Prevey, P.; Cammet, J. T. (2004). The Influence of Surface Enhancement by Low Plasticity Burnishing on the Corrosion Fatigue Performance of AA7075-T6. International Journal of Fatigue. 26(9). 975-982
51. Ren, X.D. Zhang, Y.K. Zhang, T. Jiang, D.W. Yongzhuo, H.F. Jiang, Y.F. Chen, K.M. (2010). Comparison of the simulation and experimental fatigue crack behaviours in the nanoseconds laser shocked aluminium alloy. Materials & Design.32. 1138-1143.
52. Rajasekhar, A., (2015), Heat Treatment Methods Applied to AISI 431 Martensitic Stainless Steels. International Journal of Scientific & Engineering Research.6 (4). 547-553.
53. Rossouw, H. Stumpf, W. (2015). A preliminary approach to the influence of Laser Transformation Hardening and Laser Shock Peening on the residual stress and hardness of 26NiCrMoV14-5 rotor disc steel used at Hendrina Power Station. University of Pretoria; Faculty of Engineering, Built Environment & IT; Department of Materials Science and Metallurgical Engineering. Pretoria
54. Sakino, Y. Yoshikawa, K. Sano, Y. Sumiya, R. Kim, Y. (2015). A basic study for application of laser peening to large-scale steel structure. Welding International.30 (1).1-8.
55. Sano, Y. Masaki, K. Ochi, Y. Altenberger, I. Scholtes, B. (2006). Laser Peening without Coating as a Surface Technology. Journal of Laser Micro/Nanoengineering.1 (3). 161-166.
56. Sano, Y. Mukai, N. Obata, M. (2008). Laser Peening without coating: Process, effect and applications. Japan. Toshiba Corporation, 8 Shinsugita-cho Isogo-ku Yokohama 235-8523.
57. Semwal, K. Bhatt, S.C. (2013). Study of Nd3+ ion as a Dopant in YAG and Glass Laser. International Journal of Physics.1 (1). 15-21.

99
58. Singh, G. Grandhi, R.V. Stargel, D.S. (2011).Modelling and Parameter Design of a Laser Shock Peening Process. International Journal for Computational Methods in Engineering Science and Mechanics. 12. 233-253.
59. Vishay, P.G. (2010, May) Measurement of Residual Stresses by the Hole-Drilling Strain Gage Method. Retrieved from www.micro-measurements.com
60. Von Dem Bongart, G. (2012). Matla Unit 3 LP blade arc band report incl NDT. Matla.Eskom. CSD/MAT/12/034.
61. Withers, P.J. Bhadeshia, H.K. (2001). Residual Stress Part 1 - Measurement techniques. Materials Science and Technology.17 (4). 355-365.

100
APPENDIX A: LIST OF DRAWINGS

101
DR
A WIN
G O
F TH
E LP
TU
RB
INE
BLA
DE
Fi
gure
A-1
: A d
raw
ing
of th
e LP
turb
ine
blad
e illu
stra
ting
how
it w
as m
appe
d be
fore
mac
hini
ng

102
DRAWING OF THE TURBINE SAMPLE
Figure A-2: Drawing of the samples required for the experimental work

103
APPENDIX B: OTHER SAMPLE BASELINE RESULTS
THE INITIAL HARDNESS TEST REPORT
Figure B-1: Sample of the hardness test report

104
Table B-1: Baseline thickness measurements of the prepared turbine samples after the
heat treatment process
Sample base line thickness after heat treatment
Sample Initial condition After HT and mech
After HT and electropolish
KK00 9.987 9.894 9.89
KK01 9.956 9.905 9.872
KK02 9.995 9.9 9.874
KK03 9.978 9.917 9.902
KK04 10.004 9.911 9.928
KK05 9.969 9.913 9.894
KK06 9.977 9.916 9.906
KK07 9.98 9.928 9.9
KK08 9.957 9.893 9.876
KK09 9.989 9.925 9.897
KK10 9.953 9.862 9.853
KK11 9.985 9.92 9.907
KK12 9.988 9.926 9.914
KK13 9.973 9.937 9.914
KK14 9.982 9.912 9.887
KK15 9.993 9.938 9.923
KK16 9.968 9.842 9.832
KK17 9.971 9.918 9.899
KK18 9.976 9.942 9.924
KK19 9.986 9.934 9.916
KK20 9.97 9.928 9.914
KK21 9.978 9.922 9.907
KK22 9.982 9.922 9.9
KK23 9.96 9.96 9.944
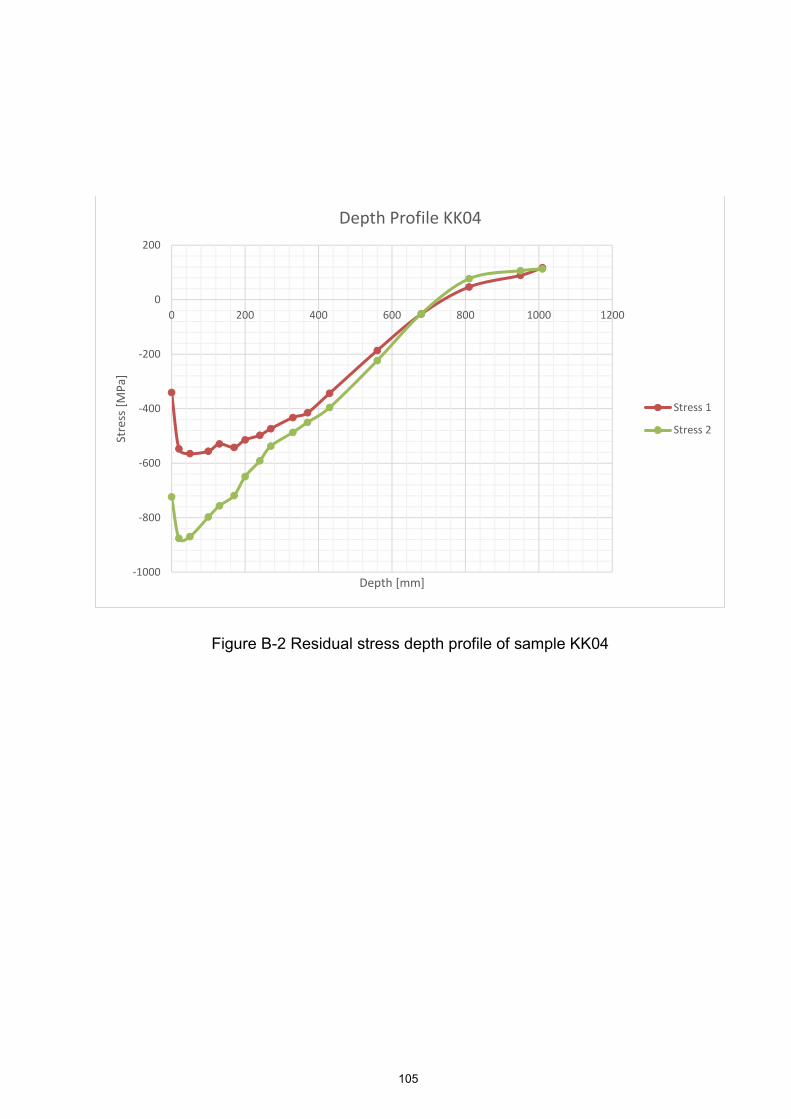
105
Figure B-2 Residual stress depth profile of sample KK04
-1000
-800
-600
-400
-200
0
200
0 200 400 600 800 1000 1200
Stre
ss [
MP
a]
Depth [mm]
Depth Profile KK04
Stress 1
Stress 2

106
Figure B-3: Examples of the residual stress measurements of sample KK04 for Principle
Stress 2 showing the measured values and the corrected values.

107
APPENDIX C: RELEVANT DOCUMENTATION FROM THE 6TH ICLPRP
A list of documents submitted for peer review and presentation at the 6th International
Conference on Laser Peening and Related Phenomena in South Africa, 6-11 November
2016. I applied for the full scholarship to enable me to take part in the conference.

108
Figure C-1 Approved abstract submitted to the 6th International Conference on Laser
Peening and Related Phenomena (6th ICLPRP)

109
APPLICATION AND APPROVAL OF SCHOLARSHIP FOR 6TH ICLPRP
Figure C-2 A copy of the application to take part in 6th ICLPRP

110
Figure C-3 Email confirming scholarship to partake in the 6th ICLPRP
111
Figure C-4 The official letter confirming approval of scholarship