Embed Size (px)
Citation preview
University of Technology, Sydney
Faculty of Engineering and IT
STUDY OF DRAG TORQUE IN A TWO-SPEED DUAL CLUTCH TRANSMISSION ELECTRIC
VEHICLE POWERTRAIN SYSTEM
A thesis submitted for the degree of
Doctor of Philosophy
Xingxing Zhou
(September 2014)
II
CERTIFICATE OF ORIGINAL AUTHORSHIP
I certify that the work in this thesis has not previously been submitted for a degree nor
has it been submitted as part of requirements for a degree except as fully acknowledged
within the text.
I also certify that the thesis has been written by me. Any help that I have received in my
research work and the preparation of the thesis itself has been acknowledged. In
addition, I certify that all information sources and literature used are indicated in the
thesis.
Signature of Student:
XINGXING ZHOU
Date:
ACKNOWLEDGEMENTS
My thesis could not have come to fruition without the assistance of many contributors. I
would like to thank my principal supervisor Professor Nong Zhang. He supported me
with great direction, advices and any other helps in my research. His knowledge, hard-
working and research attitude fostered my development in various aspects. I would like
to thank my co-supervisor Dr. Paul. David Walker. He provided me with great guidance
during my whole candidature period. He is the most brilliant and helpful co-supervisor
to me. I would also press my gratitude to A/Prof Jinchen Ji and Dr. Zhen Luo who often
offered their time discussing research issues in my thesis. I would like thank Chris
Chapman and Holger Roser for their technical support in building test rig and doing
experiments.
I would like to thank my colleagues, Bo Zhu, Jiageng Ruan, Yu Wang, Fei Ding,
Sangzhi Zhu, Tianxiao Zhang, Yiqiang Wang, Guangzhogn Xu, Nga Hoang, Jin Zhao,
Lifu Wang, Robert W. Heal, Li Sun, Erbo Chen, Di Cao for their support.
I also wish to gratefully acknowledge the consistent financial support of the following
agents: China Scholarship Council (CSC), and University of Technology, Sydney
(UTS).
Finally, I would like to thank all my family for standing with me through all these years
as well.
IV
TABLE OF CONTENTS
CERTIFICATE OF ORIGINAL AUTHORSHIP ........................................................... II
ACKNOWLEDGEMENTS ............................................................................................ III
TABLE OF CONTENTS ................................................................................................ IV
LIST OF FIGURES ........................................................................................................ IX
LIST OF TABLES ........................................................................................................ XII
NOMENCLATURE ..................................................................................................... XIII
ABSTRACT .............................................................................................................. XVIII
Chapter 1 INTRODUCTION ............................................................................................ 1
1.1 Introduction ............................................................................................................. 1
1.2 Project statement ..................................................................................................... 4
1.3 Project objectives .................................................................................................... 4
1.4 Outline of this thesis ................................................................................................ 5
Chapter 1: Introduction .............................................................................................. 5
Chapter 2: Background information and literature review ........................................ 6
Chapter 3: Electric vehicle powertrain system model ............................................... 6
Chapter 4: Two-speed DCT design gear ratio and shift schedule ............................ 6
Chapter 5: Dual clutch transmission drag torque modelling and analysis ................ 6
Chapter 6: Experiments on UTS powertrain test rig on drag torque ......................... 7
Chapter 7: Numerical and experimental study of DCT thermal behaviour ............... 7
Chapter 8: Design and optimisation of EV powertrain system ................................. 7
Chapter 9: Thesis conclusions and recommendations ............................................... 7
1.5 List of publications .................................................................................................. 8
1.5.1 Journal papers ................................................................................................... 8
1.5.2 Conference papers............................................................................................. 8
Chapter 2 BACKGROUND INFORMATION AND LITERATURE REVIEW ........... 10
V
2.1 Introduction ........................................................................................................... 10
2.2 Background information ........................................................................................ 10
2.2.1 Powertrains ..................................................................................................... 10
2.2.2 Engine/Motor .................................................................................................. 11
2.2.3 Dual clutch transmissions ............................................................................... 11
2.2.4 Synchroniser ................................................................................................... 12
2.2.5 Drag torque ..................................................................................................... 13
2.2.6 Control systems............................................................................................... 14
2.3 DCT literature review ............................................................................................ 14
2.3.1 DCT applications ............................................................................................ 14
2.3.2 Comparison transmissions technology ........................................................... 15
2.3.3 General DCT design and layout...................................................................... 17
2.3.4 Hydro-mechanical vs. electro-mechanical clutch control ............................... 18
2.3.5 Wet and dry clutches....................................................................................... 18
2.3.6 Lubricant technology ...................................................................................... 20
2.3.7 Modelling, simulations, and analysis of DCT ................................................ 20
2.3.8 Clutch control methods and actuation in the DCT ......................................... 22
2.3.9 Synchronisers and synchroniser actuation ...................................................... 23
2.4 Drag torque literature review................................................................................. 24
2.4.1 Meshing losses ................................................................................................ 25
2.4.2 Bearing losses ................................................................................................. 28
2.4.3 Windage power losses .................................................................................... 28
2.4.4 Churning losses ............................................................................................... 30
2.4.5 Clutch shear .................................................................................................... 31
2.4.6 Concentric shaft shear ..................................................................................... 32
2.5 Pure EV literature review ...................................................................................... 32
2.5 Conclusions ........................................................................................................... 36
Chapter 3 ELECTRIC VEHICLE POWERTRAIN SYSTEM MODELLING .............. 37
3.1 Introduction ........................................................................................................... 37
3.2 Electric vehicle model ........................................................................................... 37
3.2.1 Driver .............................................................................................................. 38
VI
3.2.2 Vehicle control unit ........................................................................................ 39
3.2.3 Electric machine ............................................................................................. 40
3.2.4 Battery ............................................................................................................. 41
3.2.5 Transmission ................................................................................................... 42
3.2.6 Vehicle ............................................................................................................ 43
3.3 Simulation results and analysis ............................................................................. 44
3.4 Conclusions ........................................................................................................... 46
Chapter 4 TWO-SPEED DCT GEAR RATIOS DESIGN AND SHIFT SCHEDULE .. 47
4.1 Introduction ........................................................................................................... 47
4.2 Boundary transmission gear ratios range .............................................................. 48
4.3 Auto-search method for optimal gear ratios and shift schedule construction ....... 51
4.4 Simulations and analysis ....................................................................................... 56
4.5 Conclusions ........................................................................................................... 60
Chapter 5 DCT DRAG TORQUE MODELLING AND ANALYSIS ........................... 62
5.1 Introduction ........................................................................................................... 62
5.2 Drag Torque caused by disengaged wet clutches .................................................. 64
5.2.1 Surface tension model ..................................................................................... 66
5.2.2 New shrinking model ...................................................................................... 68
5.2.3 Simulation results and analysis ....................................................................... 74
5.3 Drag torques caused by gears ................................................................................ 83
5.3.1 Gear mesh ....................................................................................................... 84
5.3.2 Gear windage and churning ............................................................................ 86
5.4 Bearing model ....................................................................................................... 88
5.5 Concentric shaft drag torque ................................................................................. 89
5.6 DCT entire drag torque model ............................................................................... 90
5.6.1 Drag torque engaged with the 1st gear ............................................................ 91
5.6.2 Drag torque engaged with the 2nd gear ........................................................... 93
5.7 Conclusions ........................................................................................................... 94
Chapter 6 EXPERIMENTS ON UTS POWERTRAIN TEST RIG ON DRAG TORQUE ......................................................................................................................................... 95
VII
6.1 Introduction ........................................................................................................... 95
6.2 Test rigs of powertrain system at UTS .................................................................. 95
6.2.1 Original UTS powertrain test rigs ................................................................... 96
6.2.2 New UTS powertrain test rigs schematic ....................................................... 97
6.3 Instrumentation and data acquisition ................................................................... 105
6.4 Test operation ...................................................................................................... 106
6.5 Results and analysis ............................................................................................. 107
6.6 Conclusions ......................................................................................................... 115
Chapter 7 NUMERICAL AND EXPERIMENTAL STUDY OF DCT THERMAL BEHAVIOUR ............................................................................................................... 116
7.1 Introduction ......................................................................................................... 116
7.2 Theoretical analysis of power losses and heat dissipation in a two-speed DCT . 119
7.2.1 Power losses analysis .................................................................................... 120
7.2.2 Heat dissipation............................................................................................. 121
7.2.3 DCT temperature rise model......................................................................... 123
7.3 Experimental apparatus ....................................................................................... 124
7.3.1 Test facility and hardware............................................................................. 124
7.3.2 Instrumentation and data acquisition ............................................................ 126
7.3.3 Test operation ............................................................................................... 127
7.4 Results and analysis ............................................................................................. 127
7.5 Conclusions ......................................................................................................... 136
Chapter 8 DESIGN AND OPTIMISATION OF EV POWERTRAIN SYSTEM ........ 138
8.1 Introduction ......................................................................................................... 138
8.2 Two-speed EV powertrain system modelling and design ................................... 140
8.2.1 Configuration of two-speed EV powertrain system ..................................... 140
8.2.2 Modelling of the pure EV powertrain system ............................................... 141
8.2.3 Electric motors selection ............................................................................... 142
8.2.4 Gear ratio design ........................................................................................... 142
8.2.5 Multi-plate wet clutch design ....................................................................... 145
8.2.6 Drag torque model application ..................................................................... 147
8.2.7 Shift schedule design .................................................................................... 147
VIII
8.3 Genetic algorithm optimisation of EV powertrain system .................................. 149
8.3.1 Design variables ............................................................................................ 151
8.3.2 Constraints .................................................................................................... 151
8.3.3 Objective function......................................................................................... 151
8.4 Simulation results and analysis ........................................................................... 152
8.6 Conclusions ......................................................................................................... 159
Chapter 9 THESIS CONCLUSIONS AND RECOMMENDATIONS ........................ 160
9.1 Summary of thesis ............................................................................................... 160
9.2 Summary of contributions and findings .............................................................. 162
9.2.1 Key contributions .......................................................................................... 162
9.2.2 Main findings on drag torque and its applications ........................................ 164
9.3 Further research ................................................................................................... 166
9.4 Conclusions ......................................................................................................... 167
REFERENCES .............................................................................................................. 168
IX
LIST OF FIGURES
Figure 1-1 Global transmission sales (Millions) [2] ......................................................... 2 Figure 1-2 Global DCT production from 2011-2017 (Millions) [2] ................................. 2 Figure 2-1 Schematic of general DCT powertrain .......................................................... 10 Figure 2-2 Dual countershaft DCT, where C means clutches, B means bearing, G means
a gear pair, and S means synchronisers. ....................................................... 17 Figure 3-1 Electric vehicle system .................................................................................. 38 Figure 3-2 Driver schematic............................................................................................ 39 Figure 3-3 Motor efficiency map .................................................................................... 40 Figure 3-4 Two-speed EV shift schedule ........................................................................ 43 Figure 3-5 Single NEDC cycle trace ............................................................................... 45 Figure 3-6 Single UDDS cycle trace ............................................................................... 45 Figure 4-1 Efficiency map for the 1st gear (G1=9) ......................................................... 52 Figure 4-2 Efficiency map for the 2nd gear (G2=6) ........................................................ 52 Figure 4-3 Output torque overlap area (G1=9, G2=6) .................................................... 53 Figure 4-4 EM work efficiency line (throttle angle 60%)............................................... 53 Figure 4-5 EM work efficiency lines with throttle angle change from 10% to 100% .... 54 Figure 4-6 Single NEDC cycle trace ............................................................................... 57 Figure 4-7 Average motor efficiency for different gear ratios and shift schedule via
NEDC cycle test ........................................... Error! Bookmark not defined. Figure 4-8 Driving range via NEDC cycle ..................................................................... 58 Figure 4-9 Optimised gear shift schedule (G1=8.45, G2=5.36) ..................................... 59 Figure 4-10 Ordinary gear shift schedule....................................................................... 59 Figure 5-1 Schematic of two-speed DCT powertrain system ......................................... 63 Figure 5-2 General relationship between drag torque and angular velocity ................... 64 Figure 5-3 Schematic of an open wet clutch ................................................................... 66 Figure 5-4 Schematic of partial fluid film in a wet clutch .............................................. 67 Figure 5-5 Relationship of ideal and actual required flow rate ....................................... 73 Figure 5-6 Relationship of equivalent radius verse angular velocity (the 1st model) ..... 75 Figure 5-7 Relationship of drag torque verse angular velocity (the 1st model) .............. 76 Figure 5-8 Relationship of equivalent radius verse angular velocity (the 2nd model) .... 77 Figure 5-9 Relationship of drag torque and angular velocity (the 2nd model) with
clearance 0.20 mm........................................................................................ 77 Figure 5-10 Drag torque at various clearance: 0.15 mm, 0.2 mm, 0.25 mm. ................. 78 Figure 5-11 Drag torque at various flow rates ................................................................ 80 Figure 5-12 Drag torque with (5%) and without considering grooves effect ................. 81 Figure 5-13 Drag torque at various temperature (oC): 40, 60, 80, 100. .......................... 82 Figure 5-14 Drag torque at various number and size of clutch plates ............................ 83 Figure 5-15 Schematic of the two-speed DCT powertrain system ................................. 91 Figure 6-1 Original UTS powertrain test rigs: A) Engine; B) AT transmission; C)
Propeller shaft; D) Final Drive; E) Drive shaft; F) Wheels; G) Groups of
X
flywheels; H) Wheels; I) Rear drive shaft; J) dynamometer; K) Rear final drive; L) Dynamometer shaft; M) Dynamometer ........................................ 96
Figure 6-2 Modified two-speed DCT powertrain test rig schematic .............................. 98 Figure 6-3 Modified test rig of two-speed DCT powertrain A) DCT; B) Electric Motor;
C) Motor Controller; D) Groups of flywheels; E) dynamometer; F) High Voltage Power Supply. ................................................................................. 98
Figure 6-4 Original six-speed DCT gearbox parts .......................................................... 99 Figure 6-5 Six-speed DCT DQ250[132]: 1) Oil Cooler, 2) Gearshift Mechanism, 3) Oil
Pump, 4) Control Unit, 5) Reverse Gear haft, 6) Input Shaft (G2, G4 and G6), 7) Input Shaft (G1, G3, G5 and Reverse), 8) Wet Dual Clutch ......... 100
Figure 6-6 Exterior appearance of six-speed DCT in original condition ...................... 101 Figure 6-7 Inner appearance six-speed DCT in original condition ............................... 101 Figure 6-8 dual clutch transmission, original one (a), and modified one (b) ................ 101 Figure 6-9 Original hydraulic system (the 2nd and the 3rd gears) .................................. 102 Figure 6-10 Modified hydraulic system (the 2nd and the 3rd gears) .............................. 103 Figure 6-11 Eddy-current dynameter and its characteristic curve ................................ 104 Figure 6-12 DSPACE (MicroAutoBox (a), RapidPro (b)) ........................................... 104 Figure 6-13 Wireless torque sensor (a) and its data receipt box and power source (b) 105 Figure 6-14 Control panel in dSPACE ......................................................................... 106 Figure 6-15 Schematic test rig system .......................................................................... 106 Figure 6-16 Comparison of DCT efficiency between simulation and test results with
input torque 60 Nm .................................................................................... 108 Figure 6-17 Comparison of DCT efficiency between simulation and test results with
input speed 3000 rpm ................................................................................. 110 Figure 6-18 Individual drag torque power loss from simulation result with input torque
60 Nm. ........................................................................................................ 111 Figure 6-19 Percentage of individual drag torque power loss from simulation results
with input torque 60 Nm. ........................................................................... 113 Figure 6-20 Individual drag torque power loss from the simulation result with input
speed 3000 rpm. ......................................................................................... 114 Figure 7-1 Schematic of a two-speed DCT powertrain system .................................... 119 Figure 7-2 Temperature sensor calibration ................................................................... 126 Figure 7-3 Test and simulation results for thermal rise ................................................ 128 Figure 7-4 Relationship of power losses and predicted stable temperature for DCT, and
test results ................................................................................................... 130 Figure 7-5 Simulation results from the drag torque model, the 1st gear with input torque
23 N.m, and the 2nd gear with input torque 40 N.m. .................................. 131 Figure 7-6 DCT thermal rise at different input speed ................................................... 133 Figure 7-7 Simulations on DCT thermal rise behaviour at different environment
temperatures ............................................................................................... 133 Figure 7-8 Relationship between input speed and power losses (the 1st and the 2nd gear,
50 N.m)....................................................................................................... 134
XI
Figure 7-9 Relationship between input torque and power losses (the 1st and the 2nd gear, 3500 rpm) ................................................................................................... 135
Figure 8-1 Schematic of two-speed EV drivetrain system equipped wet DCT with the same radius of the clutches......................................................................... 141
Figure 8-2 Shift schedule for two-speed DCT .............................................................. 149 Figure 8-3 Genetic algorithm optimisation strategy ..................................................... 150 Figure 8-4 US06 driving cycle chart ............................................................................. 152 Figure 8-5 Efficiency of powertrain system (a) combined DCT and Motor efficiency (b)
efficiency of motor (b) efficiency of DCT ................................................. 154 Figure 8-6 Simulation results for (a) the 1st gear ratio, (b) the 2nd gear ratio................ 156 Figure 8-7 Simulation results for adjust value of shift line ........................................... 157 Figure 8-8 Simulation results for (a) clutch outer radius, and (b) number of frictional
surface ........................................................................................................ 158
LIST OF TABLES
Table 2-1 Characteristic of EV, HEV and FCV .............................................................. 33 Table 4-1 Comparing two-speed EVs simulation results ................................................ 60 Table 5-1 Clutch plates parameters ................................................................................. 74 Table 5-2 Dual clutch transmission fluid (DCTF) properties ......................................... 74 Table 5-3 clutch package parameters with the same torque capacity ............................. 83 Table 6-1 Main specifications for UTS powertrain test rig ............................................ 99 Table 6-2 DCT clutch plates geometric parameters ...................................................... 104 Table 6-3 Dual clutch transmission fluid (DCTF) properties and test conditions ........ 104 Table 7-1 DCT clutch plates geometric parameters. ..................................................... 125 Table 7-2 DCT gears geometrical data ......................................................................... 125 Table 7-3 DCT bearings information (mm) .................................................................. 125 Table 7-4 Dual clutch transmission fluid (DCTF) properties and test conditions ........ 126 Table 8-1 Vehicle parameters ....................................................................................... 142 Table 8-2 Vehicle performance requirements ............................................................... 142 Table 8-3 Electric motors’ parameters .......................................................................... 142 Table 8-4 Bounded gear ratios ...................................................................................... 145
NOMENCLATURE
Global abbreviations used in this thesis
DCT = dual clutch transmission MT = manual transmission AMT = automated manual transmission CVT = continuously variable transmission EV = electric vehicle HEV = hybrid electric vehicle EM = electric machine Chapter 3 Notation
TCU = transmission control unit VCU = vehicle control unit DCT = dual clutch transmission mV = vehicle mass (kg) α = vehicle acceleration (m/s2) rt = tyre radius (m) TEM = electric machine torque (N.m) γ = gear ratio TV = vehicle torque (N.m) CR = coefficient of rolling resistance g = gravity (m/s2) φ = road incline (Rad) CD = drag coefficient ρ = air density (kg/m3) AV = vehicle frontal area( m2) VV = vehicle speed (m/s) PR = vehicle resisting power (W) ωV = vehicle rotational speed (rad/s)
Chapter 5 Notation
A = arrangement constant for gearing b = face width in contact (mm) C1 = clutch 1 C2 = clutch 2 D = outside diameter of the gear (mm) d = diameter (mm) E = efficiency of DCT F = total face width (mm)
XIV
F = applied load (N) f = turbulent flow coefficients f = bearing dip factor f = gear dip factor f = mesh coefficient of friction f = bearing load empirical factor Hs = sliding ratio at the start of approach action Ht = sliding ratio at the end of recess action h = tangential line velocity modifying exponent h = clutch plate’s clearance (mm) h = length of concentric shaft (mm) j = viscosity modifying exponent K = load intensity (N/mm2) L = length of the gear (mm) M = mesh mechanical advantage M = transverse tooth module N = number of frictional surface n = pinion rotational speed (rpm) n = motor speed (rpm) P = power losses caused by bearings drag torque (KW) P = power losses caused by concentric shaft drag torque (KW) P = load independent power loss (KW) P = speed independent power loss (KW) P = power losses caused by gear churning (KW) P = power losses caused by wet clutch plates drag torque (KW) P = power losses caused by gear meshing drag torque (KW) P = individual gear windage and churning loss (KW) P = total power losses in DCT (KW) P = oil seal power losses (KW) Q = flow rate (m3/s) T = pinion torque (N.m) T = drag torque caused by bearings (N.m) T ( , ) = drag torque caused by bearing (1) and (2) (N.m) T = drag torque caused by wet clutch packs (N.m) T = drag torque caused by churning (N.m) T = drag torque caused by concentric shafts viscous shear resistance (N.m) T _ _ = output torque of the outer concentric shaft (N.m) T _ _ = output torque of the inner concentric shaft (N.m) T _ = final output torque from DCT (N.m) T = drag torque caused by gear pairs meshing (N.m) T _ = drag torque caused by 1st gear pair meshing (N.m) T = motor output torque (N.m) V = pitch line velocity (m/s) V = velocity for oil seal (rpm) R _ = outer radius of the inner shaft (mm) R _ = inner radius of the outer shaft (mm) R = roughness factor
XV
R = gear outside radius (mm) R = gear operating pitch radius (mm) R = pinion outside radius (mm) R = pinion operating pitch radius (mm) r = gear ratio r = mean radius (mm) r = outer radius of the clutch (mm) r = 1st gear ratio r = 2nd gear ratio z = number of pinion teeth z = number of gear teeth α = transverse operating pressure angle (o) β = generated helix angle (o) β = operating helix angle (o) μ = viscosity of the oil ((Ns/m2)) ν = kinematic oil viscosity (m2/s) ρ = density of oil (kg/m3) ω = output speed of the electric motor (rpm) ∆ω = relative speed between two concentric shafts (rpm) ∆ω = relative speed within clutch 1 (rpm) ∆ω = relative speed within clutch 2 (rpm)
∇p = pressure difference between the input and output of clutch pair (pa)
Chapter 7 Notation
A = surface area of transmission case (m2) A = oil-side surface area of transmission case (m2) c = specific heat of oil (J/kg.K) c = the average specific heat of transmission (J/kg.K) h = height of gearbox housing (m) G = grashoff number k = heat transmission coefficient (W/m2K) m = mass of oil P = power losses caused by bearings drag torque (kW) P = power losses caused by concentric shaft drag torque (kW) P = power losses caused by gear churning (kW) P = power losses caused by wet clutch plates drag torque (kW) P = power losses caused by gear meshing drag torque (kW) P = total power losses in DCT (kW) Q = quantity of heat dissipated by the transmission case (J) Q = overall quantity of DCT heat (J) Q = quantity of heat absorbed by oil (J) Q = quantity of heat absorbed by DCT structure (J) R = Reynold’s number T = oil temperature (Kelvin)
XVI
T = environment temperature (Kelvin) T = the primary temperature (Kelvin) T = temperature of housing wall (Kelvin) α = oil-side heat transfer coefficient (W/m2K) α = air-side heat conduction (W/m2K) α = convection part(W/m2K) α = radiation part (W/m2K) α = heat transfer coefficient due to free convection (W/m2K) α = heat transfer coefficient due to forced convection (W/m2K) λ = coefficient of thermal conduction of housing (W/mK) δ = mean housing wall thickness (m) ε = emission ratio η∗ = temperature ratio ν = impingement velocity (m/s) ∆T = increased temperature caused by absorbing heat (Kelvin)
Chapter 8 Notation
AV = vehicle frontal area( m2) CD = drag coefficient CR = coefficient of rolling resistance E = efficiency of DCT E = efficiency of motor f = objective function g = gravity (m.s2) mV = vehicle mass (kg) N = number of surfaces of clutch plates PR = vehicle resisting power (W) P = power losses caused by bearings drag torque (KW) P = power losses caused by concentric shaft drag torque (KW) P = power losses caused by gear churning (KW) P = power losses caused by wet clutch plates drag torque (KW) P = power losses caused by gear meshing drag torque (KW) P = total power losses in DCT (KW) p = clutch plates maximum permissible pressure (MPa) rt = tyre radius (m) r = inner radius of clutch plates (m) r = outer radius of clutch plates (m) TEM = electric machine torque (N.m) TV = vehicle torque (N.m) T = maximum torque transmitted by clutch (N.m) VV = vehicle speed (m/s) V = final shift speed point (km/h) V = index of original shift point (km/h) γ = gear ratio γ = the 1st gear ratio

XVII
γ = the 2nd gear ratio α = vehicle acceleration (m/s2) μ = dynamic viscosity (N/m2) φ = road incline (Rad) ω = vehicle rotational speed (rad/s) ρ = air density (kg/m3)
ABSTRACT
Pure electric vehicles are widely looked as a potential avenue to reduce fossil fuel
consumption and emission in the long term in the transportation section. Pure electric
vehicles currently being used in the market are mainly equipped with single speed
transmissions, with tradeoffs between dynamic (such as climbing ability, top speed, and
acceleration) and economic performance (drive range). The employment of two-speed
dual clutch transmission (DCT) in electric vehicles is likely to improve average motor
efficiency and range, and even can reduce the required motor size. In order to
comprehensively improve the electric vehicle powertrain system efficiency, it is
necessary to fully consider the proposed two-speed transmission drag torque, including
its influences and potential applications.
The focus of this thesis is on studying the drag torque within two-speed dual clutch
transmissions. Different source of drag torque in the DCT are theoretically analysed and
modelled, including torsional resistance caused by viscous shear caused between wet
clutch plates and concentrically aligned shafts, gear mesh friction and windage, oil
churning, and bearing losses. Then experimental works are carried out on UTS electric
vehicle powertrain system test rig. Outcomes of experimentation on drag torque confirm
that simulation results agree well with the test data. Then, based on the drag torque
study, the thermal behaviour of the transmission is analysed via both theoretical and
experimental investigation. Finally, integrated optimal design of electric vehicle
powertrain system equipped with two-speed DCT is performed, considering drag torque,
shift schedule, electric motor selection, gear ratio design and wet clutch design.
1
Chapter 1 INTRODUCTION
1.1 Introduction
In recent years there has been significant attention drawn towards reducing fossil fuel
consumption and emissions in automotive industry. Improvement of the overall energy
efficiency of existing technologies is one of the most important subjects for developing
new vehicle technologies. As a consequence of this, the development of commercially
viable hybrid electric vehicles (HEVs) for using in the short to mid term, and pure
electric vehicles (EVs) and fuel cell vehicles (FCVs) in the long term is one of the major
contributions in automotive industry to solve related issues[1]. Pure EVs currently being
used in the market are mainly equipped with single speed transmissions, with tradeoffs
between dynamic (such as climbing ability, top speed, and acceleration) and economic
performance (drive range). Nowadays, more and more EV researchers and designers are
paying attention to application of multiple speed transmissions instead of traditional
single speed transmissions, expecting to improve the EV performance. The usage of
multi-speed transmissions for electric vehicles is likely to improve average motor
efficiency and range capacity, or even can reduce the required motor size.
In terms of transmission, for several decades the transmissions market sector was
dominated by manual transmission (MT) and planetary automatic transmissions (AT) in
a competitive environment, where the business necessity was driven by cost control and
the utilisation of existing installed vehicle capacity. Although some technology
innovation unavoidably moved the transmission forward, the pace of development was
relatively slow. In recent years, regulations to reduce both noxious gas emissions and
greenhouse gas emissions, energy crisis and consumers demand on drive performance
2
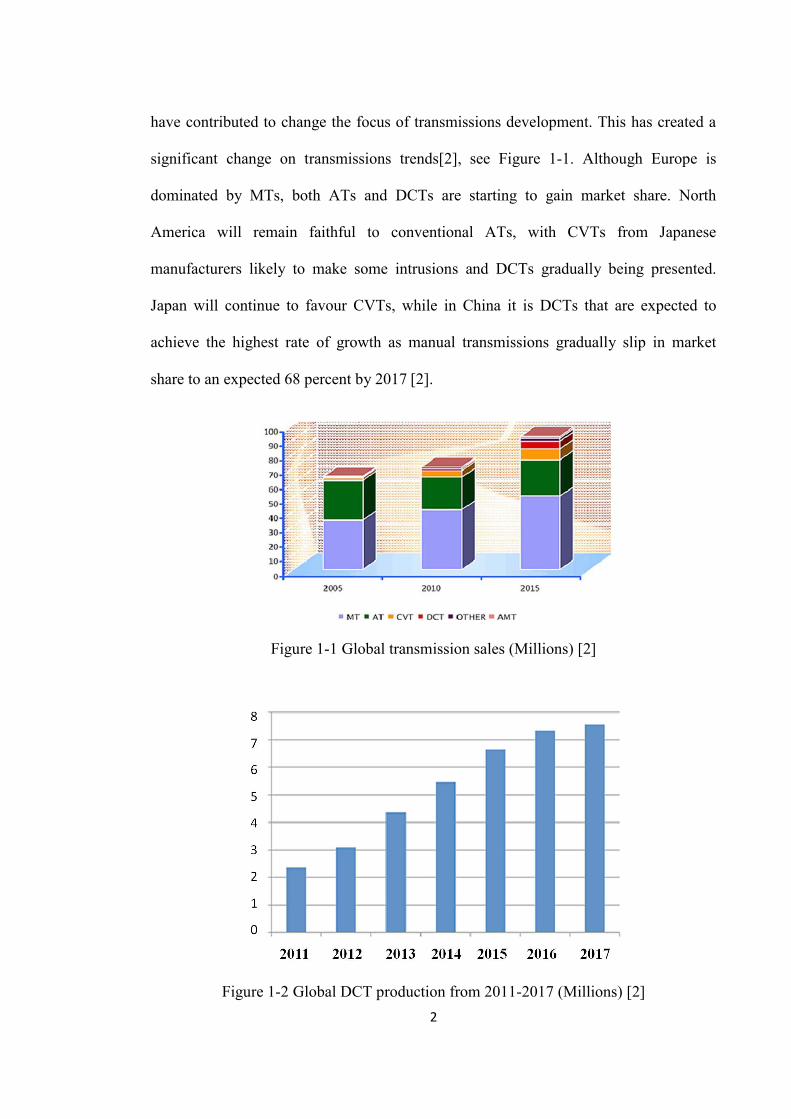
have contributed to change the focus of transmissions development. This has created a
significant change on transmissions trends[2], see Figure 1-1. Although Europe is
dominated by MTs, both ATs and DCTs are starting to gain market share. North
America will remain faithful to conventional ATs, with CVTs from Japanese
manufacturers likely to make some intrusions and DCTs gradually being presented.
Japan will continue to favour CVTs, while in China it is DCTs that are expected to
achieve the highest rate of growth as manual transmissions gradually slip in market
share to an expected 68 percent by 2017 [2].
Figure 1-1 Global transmission sales (Millions) [2]
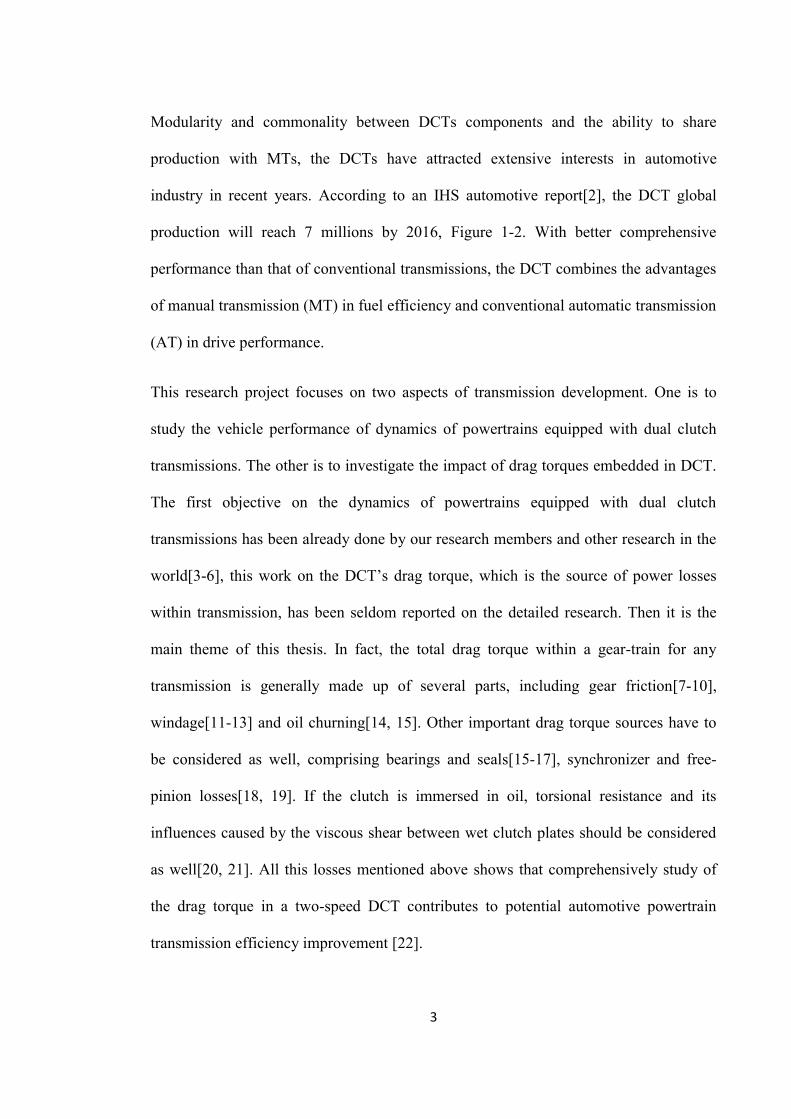
Figure 1-2 Global DCT production from 2011-2017 (Millions) [2]
3
Modularity and commonality between DCTs components and the ability to share
production with MTs, the DCTs have attracted extensive interests in automotive
industry in recent years. According to an IHS automotive report[2], the DCT global
production will reach 7 millions by 2016, Figure 1-2. With better comprehensive
performance than that of conventional transmissions, the DCT combines the advantages
of manual transmission (MT) in fuel efficiency and conventional automatic transmission
(AT) in drive performance.
This research project focuses on two aspects of transmission development. One is to
study the vehicle performance of dynamics of powertrains equipped with dual clutch
transmissions. The other is to investigate the impact of drag torques embedded in DCT.
The first objective on the dynamics of powertrains equipped with dual clutch
transmissions has been already done by our research members and other research in the
world[3-6], this work on the DCT’s drag torque, which is the source of power losses
within transmission, has been seldom reported on the detailed research. Then it is the
main theme of this thesis. In fact, the total drag torque within a gear-train for any
transmission is generally made up of several parts, including gear friction[7-10],
windage[11-13] and oil churning[14, 15]. Other important drag torque sources have to
be considered as well, comprising bearings and seals[15-17], synchronizer and free-
pinion losses[18, 19]. If the clutch is immersed in oil, torsional resistance and its
influences caused by the viscous shear between wet clutch plates should be considered
as well[20, 21]. All this losses mentioned above shows that comprehensively study of
the drag torque in a two-speed DCT contributes to potential automotive powertrain
transmission efficiency improvement [22].
4
This thesis contributes significant knowledge to the engineering community through the
investigation of the individual components power losses within DCT, and application of
drag torque into transmission thermal behaviour analysis and integrated design selection
of motor and transmission for EV. The three most significant and novel aspects of this
research are: (1) theoretical and experimental investigation of drag torque in a two-
speed DCT, (2) theoretical and experimental investigation of thermal behaviour of a
DCT via applying a the proposed drag torque model, and (3) combined design and
selection of motor and transmission for EV powertrain system considering drag torque
influences. These are the major features of original research, and many other findings
and original research outcomes are detailed in both chapter conclusions and the
summaries of the thesis.
1.2 Project statement
This work studies the drag torque in a two-speed dual clutch transmission of a pure
electric vehicle, including numerical and experimental investigations, and its application
on thermal behaviour analysis and pure electric vehicle powertrain system design and
optimisation.
1.3 Project objectives
This thesis is focused on the investigation into drag torque within a dual clutch
transmission. The main objectives of this project are:
(1) Model the sources of power losses, i.e. drag torque, for a two-speed DCT, and
conduct simulations.
(2) Experimental investigation of the developed drag torque model.
5
(3) Application of drag torque model into DCT thermal behaviour analysis and conduct
experimental investigation as well.
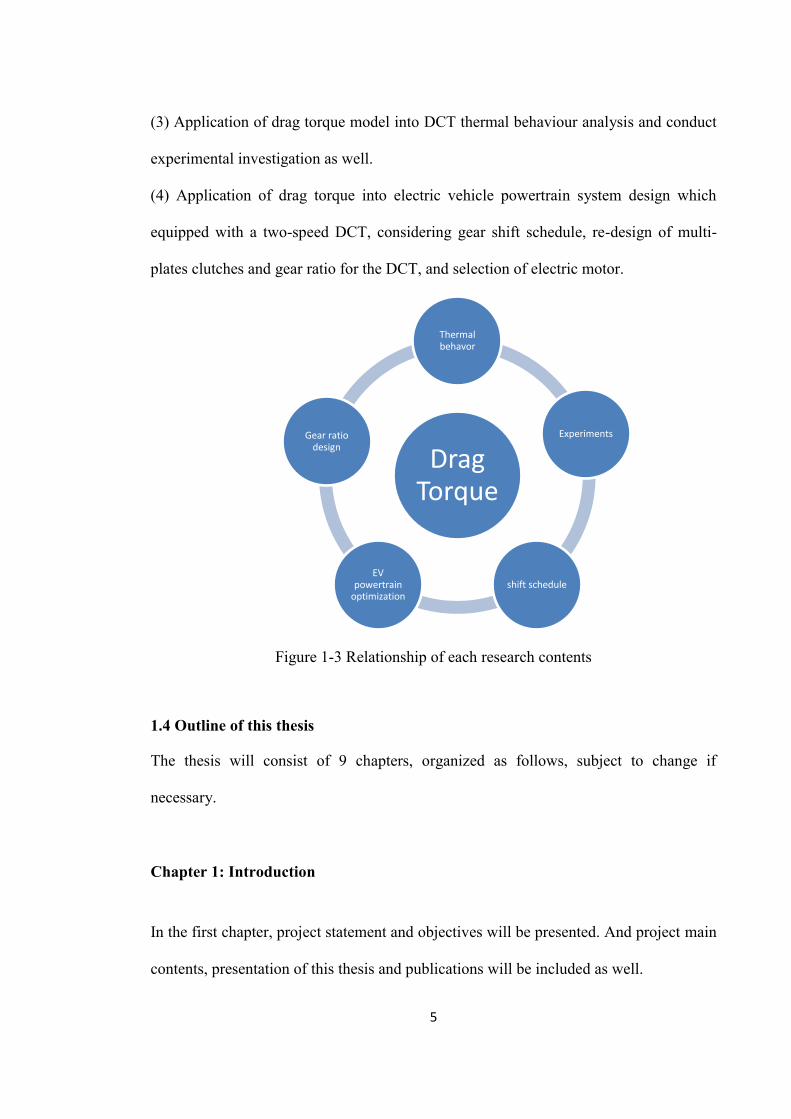
(4) Application of drag torque into electric vehicle powertrain system design which
equipped with a two-speed DCT, considering gear shift schedule, re-design of multi-
plates clutches and gear ratio for the DCT, and selection of electric motor.
Figure 1-3 Relationship of each research contents
1.4 Outline of this thesis
The thesis will consist of 9 chapters, organized as follows, subject to change if
necessary.
Chapter 1: Introduction
In the first chapter, project statement and objectives will be presented. And project main
contents, presentation of this thesis and publications will be included as well.
Drag Torque
Thermal behavor
Experiments
shift schedule EV
powertrain optimization
Gear ratio design
6
Chapter 2: Background information and literature review
Background information regarding powertrain system equipped DCT and literature
review on drag torque of dual clutch transmission will be provided and discussed in this
chapter.
Chapter 3: Electric vehicle powertrain system model
The details of the electric vehicle model developed or used for this project will be
introduced in this chapter, including battery, electric motor, general transmission,
vehicle model and excluding the drag torque model.
Chapter 4: Two-speed DCT design gear ratio and shift schedule
Gear ratio design and shift schedule for two speed dual clutch transmission equipped in
electric vehicle methods will be discussed.
Chapter 5: Dual clutch transmission drag torque modelling and analysis
Different parts of drag torque within dual clutch transmission is modelled and analysed
in this chapter, considering disengaged wet clutch drag torque, power losses caused by
gear meshing, bearing losses, and gear windage and churning loses.
7
Chapter 6: Experiments on UTS powertrain test rig on drag torque
In this chapter, in order to verify the developed drag torque for dual clutch transmission,
experimentation is conducted. Describing the experimental apparatus used in this
research will be detailed and presented in this chapter, including motor/generator
characters, dual clutch transmission, wheels etc. And the results from both simulation
and test will be compared and analysed.
Chapter 7: Numerical and experimental study of DCT thermal behaviour
In this chapter, via application the developed drag torque model, numerical and
experimental investigation of DCT thermal behaviour is discussed.
Chapter 8: Design and optimisation of EV powertrain system
In this chapter, application of drag torque into two-speed pure EV powertrain system
design and optimisation will be presented, using genetic algorithm to acceleration
optimisation process. The design factors considered here include electric motors
selection, transmission gear ratios boundary, shift schedule design, multi-plates wet
clutch design etc.
Chapter 9: Thesis conclusions and recommendations
In this chapter, the contributions of this thesis will be summarized and whole research
contents will be concluded. Discussion and further development recommendations will
be presented.
8
1.5 List of publications
Several papers have been published or accepted in both international conferences and
journals. Some of the contents are included in this thesis.
1.5.1 Journal papers
1. X.X. Zhou, Paul. D. Walker, N. Zhang, B. Zhu, “A numerical study of the impact of wet clutch drag torque on the performance of two-speed electric vehicle”, Accepted by International Journal. of Vehicle Performance, 2014. (Accepted)
2. X.X. Zhou, Paul. D. Walker, N. Zhang, B. Zhu, “Numerical and Experimental Investigation of Drag Torque in a Two-speed Dual Clutch Transmission”, Mechanism and Machine Theory, Vol.79, pp. 46-63, 2014, DOI: 10.1016/j.mechmachtheory.2014.04.007. (Chapter 5 and Chapter 6)
3. X.X. Zhou, Paul. D. Walker, N. Zhang, B. Zhu, “Experimental and numerical study of thermal behaviour of a dual clutch transmission”, Feb. 2014. (Submitted to Proceedings of the IMechE, Part D: Journal of Automobile engineering) (Chapter 7)
4. Bo Zhu, Nong Zhang, Paul Walker, Wenzhang Zhan, Xingxing Zhou, “Two-Speed DCT Electric Powertrain Shifting Control and Rig Testing”, Advances in Mechanical Engineering, Vol. 2013(2013). DOI: http://dx.doi.org/10.1155/2013/323917
1.5.2 Conference papers
1. Xingxing Zhou, Paul Walker, Nong Zhang, B. Zhu, “Performance Improvement of a Two Speed EV through Combined Gear Ratio and Shift Schedule Optimisation”, 2013 SAE Technical Paper 2013-01-1477, 2013. DOI: 10.4271/2013-01-1477. (Chapter 3 and Chapter 4)
2. Xingxing Zhou, Paul Walker, Nong Zhang, Bo Zhu, Jiageng Ruan, “Study of Power Losses in a Two-Speed Dual Clutch Transmission”, 2014 SAE Technical Paper 2014-01-1799. (Chapter 6)
3. Xingxing ZHOU, Nong ZHANG and Paul D. WALKER, “Launch Control of a Dual Clutch Transmission Using a Detailed Hydraulic Component Model”, APVC2011 Asia Pacific Vibration Conference, APVC_240, Vol.4, pp.2001-2006 December, 2011.
9
4. Xingxing ZHOU, Paul Walker, Nong Zhang, Bo Zhu, Jiageng Ruan, “The influence of transmission ratios selection on electric vehicle motor performance”, ASME 2012 International Mechanical Engineering Congress and Exposition, Volume 3, pp. 289-296, Houston, Texas, USA, November 9–15, 2012. Doi: 10.1115/IMECE2012-85906. (Chapter 4)
5. Xingxing ZHOU, Paul Walker, Nong Zhang, Bo Zhu, Jiageng Ruan, “Simulation of Thermal Behaviour of a Two-speed Dual Clutch Transmission”, Asia-Pacific Congress for Computational Mechanics (APCOM2013), Paper No.:1797, Singapore, December 2013.
6. Bo Zhu, Nong Zhang, Paul Walker, Wenzhang Zhan, Wei Yueyuan, Nanji Ke, Xingxing Zhou, “Two Motor Two Speed Power-Train System Research of Pure Electric Vehicle”, 2013 SAE Technical Paper 2013-01-1480, doi:10.4271/2013-01-1480.
7. Bo Zhu, Paul. Walker, Nong Zhang, Wenzhang Zhan, Jiagen Ruan, Xingxing Zhou, Yueyuan Wei, “Study of Two Motor Multi-speed Electric Power-train System”, TMC2013 Conference, Suzhou, CHINA, April 2013 (Excellent Prize).
10
Chapter 2 BACKGROUND INFORMATION AND LITERATURE REVIEW
2.1 Introduction
This chapter briefly outlines the important characteristic of powertrains equipped with
dual clutch transmission including, its components, the transmission itself and drag
torques (which are relevant to the final thesis), Furthermore, it summarizes the current
research into drag torque, DCT, and pure electric vehicles.
2.2 Background information
In the background information section, major parts of the powertrain system are briefly
discussed, including the powertrains, Engine/Motor, dual clutch transmission, drag
torque, synchroniser and control system.
2.2.1 Powertrains
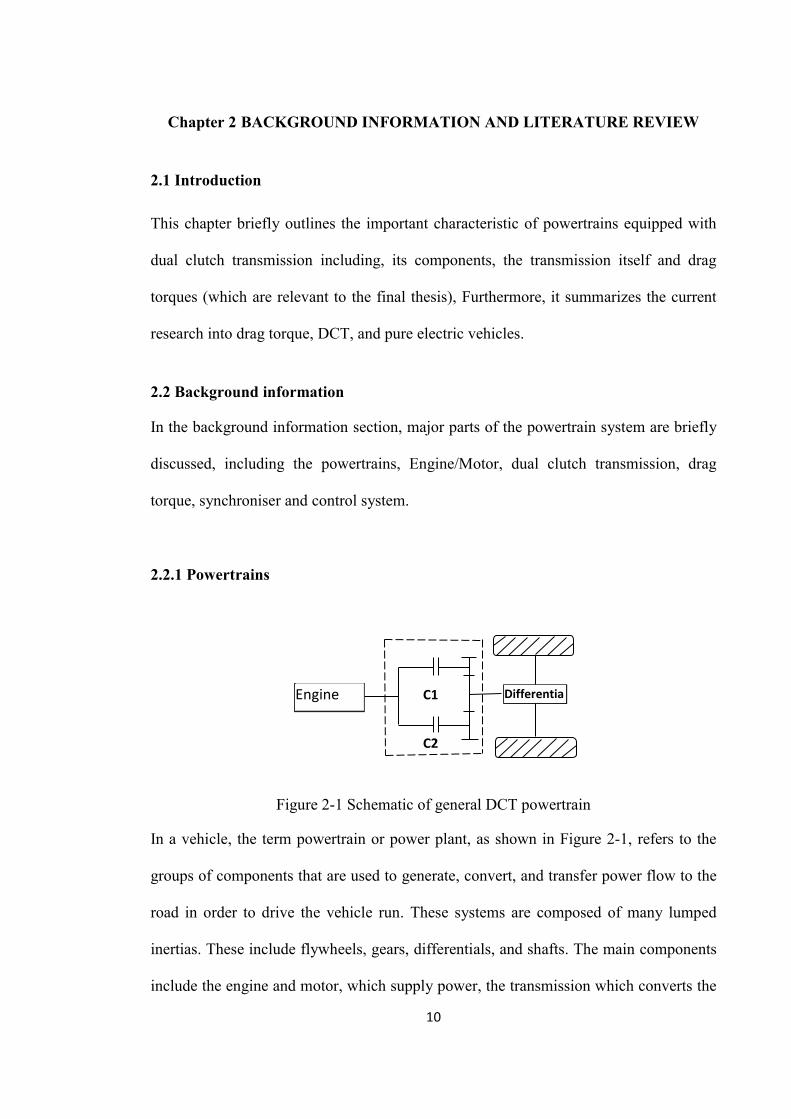
Figure 2-1 Schematic of general DCT powertrain
In a vehicle, the term powertrain or power plant, as shown in Figure 2-1, refers to the
groups of components that are used to generate, convert, and transfer power flow to the
road in order to drive the vehicle run. These systems are composed of many lumped
inertias. These include flywheels, gears, differentials, and shafts. The main components
include the engine and motor, which supply power, the transmission which converts the
Engine DifferentiaC1
C2
11
engine/motor torque and expected speed to meet the driving demands, and the drivetrain
that transfers the power flow to the road via the wheels and final differential.
2.2.2 Engine/Motor
The engine or motor with battery supplies power for the whole system. Different from
AT powertrains the engine or the motor is not set apart from transmission equipped with
the torque converter. Indeed, the engine/motor output shaft effectively drives the
transmission.
2.2.3 Dual clutch transmissions
The dual clutch transmission (DCT) was first invented by Frenchman Adolphe Kégresse
in the 1950s [23], but he did not develop a working model. The first actual DCTs were
used in Porsche racing cars in the 1980s, when there were enough compact computers
that could be used to control the transmissions: the Porsche Doppelkupplungsgetriebe
(PKD) (English: dual clutch gearbox) was used in the Porsche 956 race cars from
1983[24].
Up until 2001, the application of DCTs was perceived as unlikely to replace planetary
automatics (AT) due to limitations in the capacity to perform skip shifts[25]. However,
in 2005, Goetz etc [26] proposed a method whereby the skipped gear could be partially
engaged to successfully overcome the skip shift issue. This method enabled the
successful application of the DCT to powertrains which had previously appeared to be
impossible.
12
Until the improvement of clutch control in recent years, there had been little chance that
the DCT could be launched into mass production. By contrast, the Audi TT 3.2 Quattro
or VW Golf R32 owing to its improved clutch control were rapidly gaining acceptance
in Europe[27]. Furthermore, it was generally accepted [28] that the DCT technology
would be the predominant transmission technology over the next 10 years. With the
expansion into the Chinese automotive industry, companies such as BorgWarner began
to move into joint ventures with local car manufacturers, one example being China
Automobile Development United Investment Company, Ltd, or CDUI[29].
Compared with other transmissions, the distinctive aspects of the DCT powertrain are
the application of clutches and the arrangement of the gear train. The dual lay shaft
structure is generally the most popular types of dual clutch transmission[30]. The two
clutches have a common drum attached to the same input shaft from the engine/motor,
and the friction plates are independently connected to odd or even gears. For a full
transmission, the odd gears (1, 3, and 5) are driven through the first clutch (C1), while
the clutch C2 drives the even gears (2, 4, 6, and R). Thus the transmission can be looked
at as two half manual transmission, and, in this sense, shifting is realised through the
simultaneous shifting between these two half transmissions.
2.2.4 Synchroniser
In order to meet the requirement to change gears, synchroniser mechanism has been
widely used in some form or another. The mechanism of the synchroniser makes use of
the speed and torque variations during engagement to reach two objectives, 1) to
synchronise speeds between the rotating shafts and the target gear, and 2) to
13
mechanically interlock the gear to rotating shaft and transmitt torque through the
gearbox. In broader terms the synchroniser has changed only a little since its mechanism
first appeared. Further detailed description regarding the synchroniser can be found in
our research group’s recent work[18]. However, in this project, the synchroniser is not
considered. In the modified two-speed dual clutch transmission, the synchroniser is
blocked by the shaft and gears. Accordingly, it is not used for gear engagement.
2.2.5 Drag torque
The efficiency of propulsive systems is being increasingly booked upon as a feasible
way to reduce environmental impact. Even though the transmission gearbox efficiency
varies from 98% to 99% in the best designed applications, tthis can still equate to losses
in kW or even more.
Drag torque is the summation of all losses in transmissions. It is therefore critical to
develop a precise synchroniser design which can respond consistently with the actuation
in the DCT. Identification of the sources of drag torques within transmission is
beneficial to studying the impact of drag torque on shift dynamics and control. It will
provide insight into the performance of the transmission, including the shift response
and efficiency.
Generally, the mechanism for drag torque losses within the DCT include the following
parts, meshing losses, bearing losses, windage losses, churning losses, clutch drag, and
concentric shaft shear[31]. An in-depth investigative analysis of the drag torque model
along with its simulation follows.
14
2.2.6 Control systems
For a DCT, the transmission control unit (TCU) is a compact, high performance
hydraulic system composed of a number of valves and solenoids to actuate the
engagement and disengagement of clutches and synchronisers. According to Citing
Holmes[32], the hydraulic control solenoid should provide “fast, repeatable and stable
output pressure response. The system has low output pressure hysteresis and reduced
contamination sensitivity to varying source pressure in the pressure regulating range. ”
2.3 DCT literature review
In order to provide a broader understanding of the technological development
surrounding DCTS, this section mainly reviews different DCT designs. It also examines
the application of wet and dry clutches, actuation methods, and applications.
2.3.1 DCT applications
The DCT is applied quite widely. It is equipped in both super cars and compact (small)
cars. The application examples range from the Bugatti Veyron, with 1250 N.m of torque
equipped with wet clutches, to the Volkswagen range, Polo equipped with 250 N.m dry
clutches. The Chrysler ME 4-12 is also another typical case of the super car equipped
with the DCT, which is presented by Rolland et al. [33]. The applied peak torque to the
clutch is assumed to be 750 N.m; the DCT finishes shifts within approximate 200 ms
without loss of traction to the ground. Development requirements for the DCT generally
include clutches control for shifting, synchroniser control, lubrication techniques and
the overall control system.
15
The high efficiency of the DCT also makes it ideal for application to hybrid electric
vehicle (HEV) systems. One typical application example is for mild HEV systems such
as the ESG discussed by Wagner et al. [34], where a 10 kW electric motor is appied to
increase vehicle overall powertrain system efficiencies under different conditions,
including high demand and engine in low efficiency conditions. Alternative HEV
systems have been discussed by Joshi et al. [35] for a more complicated hybrid
powertrain system applying two electric motors with the DCT used to control the power
flow of the system. This kind of design is able to perform much wider operating modes
under hybrid operation. Wang et al [36] provided a hybrid powertrain for application in
buses, using various drive cycles to statistically optimise design. Comparisons indicate
improved efficiency and mobility compared to popular integrated starter/generator
designs.
2.3.2 Comparison transmissions technology
At the global level, there are competitors to the DCT. These are the automatic
transmission (AT), continuously variable transmission (CVT), manual transmissions
(MT) and automated manual transmissions (AMT).
Rudolph et al. [29] provide a comparative outline of MT, AT, and wet and dry DCT
mechanical efficiencies. It shows that there are minor improvements for the wet DCT
over the AT, as opposed to substantial improvements for the dry DCT. However, the
MT efficiency is higher than both the wet and dry DCT. Because the MT has fewer
components for control during shifts and no power hydraulic components, it is highly
dependent on driver’s behaviour. The AMT is viewed as having high efficiency but
16
poor comfort. As a consequence, the DCT fills the gap that separates high quality
shifting and good fuel efficiency through the adaptation of precision clutch shift control
with the elimination of a significant transient.
Matthes et al [37] cited wet clutch DCTs as having the least limitations in terms of
application, with the capacity to provide excellent responsiveness, and shift and launch
comfort. This equates to good ATs in addition to fuel efficiencies. Evaluating
transmissions similarly to [38], Matthes & Geunter [37] separates wet and dry DCTs,
with wet DCTs having higher comfort than AT, CVT, or dry DCTs but, at a cost to rider
comfort. By comparison, the dry DCT has better fuel efficiency, supported by [39].
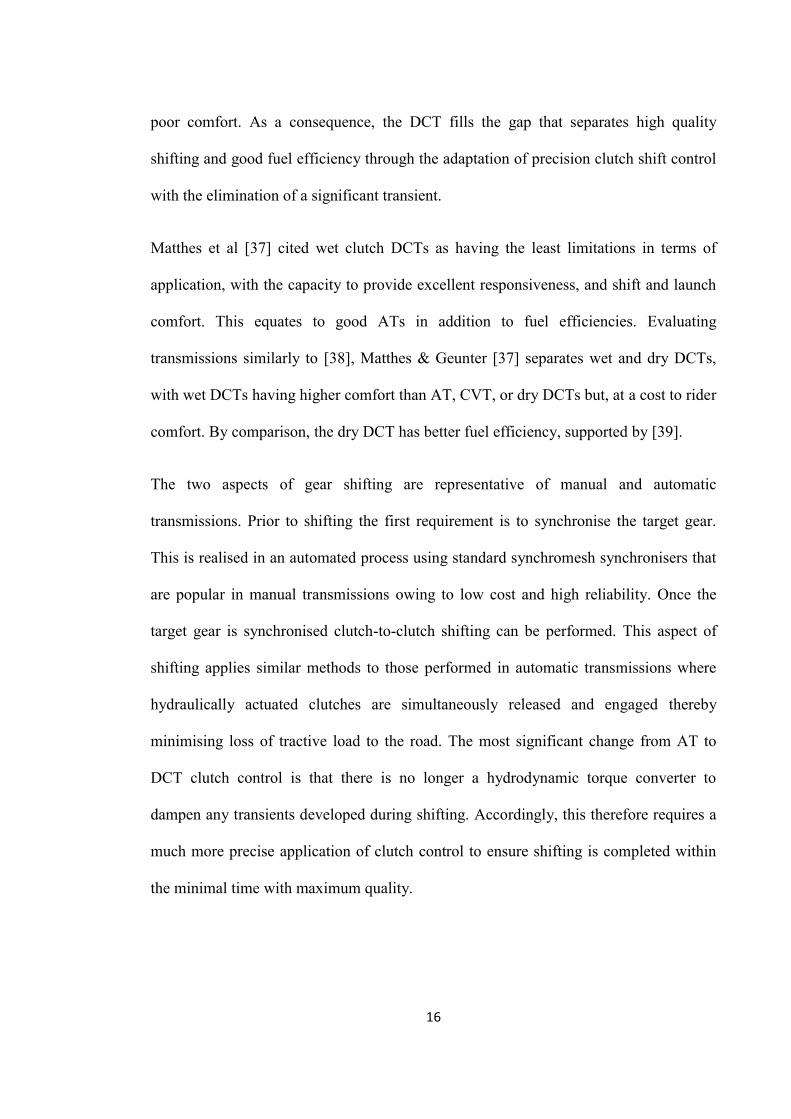
The two aspects of gear shifting are representative of manual and automatic
transmissions. Prior to shifting the first requirement is to synchronise the target gear.
This is realised in an automated process using standard synchromesh synchronisers that
are popular in manual transmissions owing to low cost and high reliability. Once the
target gear is synchronised clutch-to-clutch shifting can be performed. This aspect of
shifting applies similar methods to those performed in automatic transmissions where
hydraulically actuated clutches are simultaneously released and engaged thereby
minimising loss of tractive load to the road. The most significant change from AT to
DCT clutch control is that there is no longer a hydrodynamic torque converter to
dampen any transients developed during shifting. Accordingly, this therefore requires a
much more precise application of clutch control to ensure shifting is completed within
the minimal time with maximum quality.
17
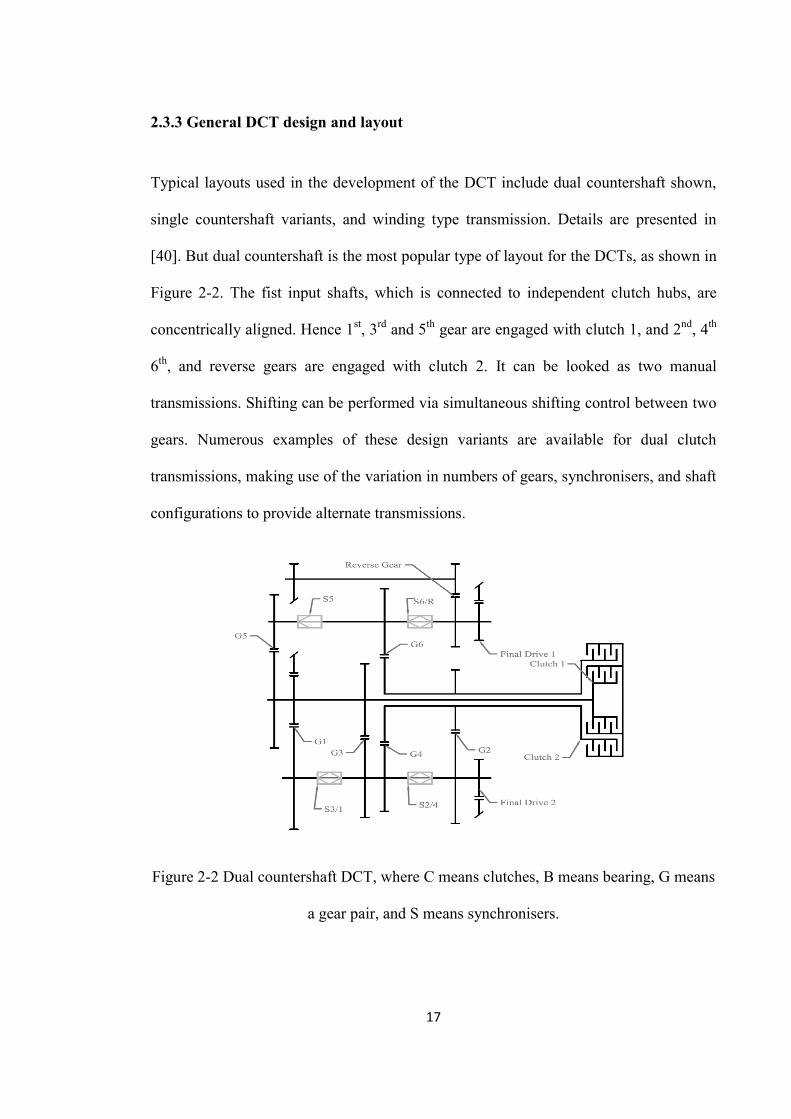
2.3.3 General DCT design and layout
Typical layouts used in the development of the DCT include dual countershaft shown,
single countershaft variants, and winding type transmission. Details are presented in
[40]. But dual countershaft is the most popular type of layout for the DCTs, as shown in
Figure 2-2. The fist input shafts, which is connected to independent clutch hubs, are
concentrically aligned. Hence 1st, 3rd and 5th gear are engaged with clutch 1, and 2nd, 4th
6th, and reverse gears are engaged with clutch 2. It can be looked as two manual
transmissions. Shifting can be performed via simultaneous shifting control between two
gears. Numerous examples of these design variants are available for dual clutch
transmissions, making use of the variation in numbers of gears, synchronisers, and shaft
configurations to provide alternate transmissions.
Figure 2-2 Dual countershaft DCT, where C means clutches, B means bearing, G means
a gear pair, and S means synchronisers.
18
2.3.4 Hydro-mechanical vs. electro-mechanical clutch control
With the application of removing the clutch control hydraulics from the dual clutch
transmission comes the design of electromechanical control of both clutch and
synchroniser to totally delete hydraulics from the transmission, which in turn maximises
the rise in powertrain system efficiency. Wagner [41] discusses the application of
traditional e-motors for both synchroniser and clutch control via the novel application of
lever mechanisms to synchroniser and clutch. On the contrary, Wheals, Turner &
Ramsay [42] apply well small linear actuators for the engagement of these two
mechanisms. It uses a lever arm to attain balanced force applying to the clutches. The
electromechanical actuator mentioned can be found in Turner, Ramsay & Clarke [43],
with results indicating an actuator mechanism that is able to provide force consistent
with synchroniser and clutch actuation requirements. These two methods have been
applied for dry DCT control in some form or another with relating parent companies.
Simulations conducted in [44], using electro mechanical actuators, indicate that these
actuators are sufficient for performing clutch-to-clutch shifting in a DCT, up-shift
taking 0.76 seconds and the downshifts 0.85 seconds.
2.3.5 Wet and dry clutches
A "wet" clutch is one that bathes the clutch components in lubricating fluid to reduce
friction and to dissipate heat. Early types of the DCT using multi-plate wet clutches to
conduct gear shifting as these were able to absorb the raised thermal load caused by the
extended shift time which is required for smooth gearshifts and launches. However, this
limited the ability of the DCT to improve fuel efficiencies as there were additional
19
components caused losses in the gearbox and added fluid pumping requirements. A
typical example of these requirements can be found in[45]. The elimination of the wet
clutch and associated hydraulic components can be looked as the most important
improvement that can be made to the DCTs’ efficiency. Although dry clutches have
substantial merits in terms of power efficiency, these clutches have limitations because
of limited torque capacity and extended slip times. These two disadvantages can be
harmful to the friction coefficient[39, 41]. According to Certez, Scherf, & Stutzer, [46],
the application of dry clutches in the DCT can make improvement of 2 – 3% in terms of
fuel efficiency, but the limitations to the frictional wear of the dry clutches make it is
only able to be used in lower torque required applications, with some size limitations in
terms of clutch envelope.
Berger [39] shows the capacity to absorb high frictional energy produced in constant
creeping, crawling, hill starts and hold, and during common launch as an important
issue in development of DCTs equipped with dry clutches. Owing to this, Berger
suggests that adaptive control can be used to overcome the issue of degradation of
friction surfaces. Ni, Lu & Zhang [47] investigate the impact of wear on DCT shift
performance, applying models for friction wear to the actuation system to develop
modified pressure shift profiles to compensate for increased wear. Research in [48]
demonstrates that single clutch launches and clutch-to-clutch shifting are both affected
significantly by wear and this leads to increases in the shift time in a nonlinear manner.
Qin et a. [49] suggests that the use of both clutches for launching can significantly
reduce clutch wear and increase clutch lifetime.
Rudolph, Schafer, & Damm [29] make a comparison between the two predominant
DCTs equipped by Volkswagen, the DQ-200, a dry clutch DCT; and the DQ-250, a wet
20
clutch. A great amount of detail is provided on comparing the control systems
developed between the two kinds of transmission systems. The essential difference
between both transmission systems is the higher efficiency of the DQ-200, at the cost of
torque capacity, with the DQ-250 capable of 100 Nm more torque load.
2.3.6 Lubricant technology
Lubrication plays an important role in any transmission, directly connecting the value of
the gearbox drag torque. This includes the features associated with wet clutches such as
friction stability, and gear and synchroniser lubricant requirements [50]. It is therefore
essential that lubrication meets the requirements associated with AT and MT systems.
In order to choose an appropriate lubrication type, it is necessary to consider the speed
of the gears. When the operating gear speeds are relatively high, the performance of jet-
lubrication is better than that of dip-lubrication. For the DCT, a special lubricant fluid
named dual clutch transmission fluid (DCTF) has been found to meet a broad range of
requirements with jet-lubrication [50].
2.3.7 Modelling, simulations, and analysis of DCT
Generally speaking, modelling of the DCT as part of a powertrain has been limited to
the level required to develop a reasonable control system and simulate the results. These
simulations are typically shifting or launch transient simulations demonstrating the
effectiveness of a particular control strategy. The choice of parameters and detail in the
model will reflect the reasonableness and accuracy of results.
21
The most popular technique is to develop a four-degree-of-freedom model using some
variation of finite elements. Major inertia elements are sought from the engine, clutch
drum and plates, transmission, and the vehicle. Each of these are connected by shaft
stiffness and dampers. This technique is adopted by [51, 52] for separate control
processes, and it produces a sufficient response in terms of representing the lower
natural frequencies.
Simulation by Liu et al. [51] use PID control of clutches result in torque peaks during
the inertia phase of shifting, and these are liable to be observed by the driver as surging.
Zhang [53] and Kulkarni [54] make use of predetermined pressure profiles, resulting in
a higher lockup response. This is reduced through the modification of these profiles. Lei,
Wang & Ge [55] provide a useful example on the use of the combined engine and clutch
control with feedback to improve shift quality. While in the linearised model of [52]
launch judder is evaluated through the modification of controller gain.
Alternatively, Goetz [26] (12DOF, 8DOF) develop more detailed dynamic models using
an increased number of elements. This, of course, alters powertrain responses during
shifting and generally reduces peak-to-peak vibrations. Extensive simulations
demonstrated the impact of different controller designs, with the application of
combined torque and inertia phase control, in conjunction with the engine control
minimising the transient response. However, a less detailed model by Xuexun [56] uses
two degrees of freedom, one for the engine and another for the vehicle. In this instance
with no compliance elements in the system it becomes impossible to demonstrate the
vehicle transient responses. As a result, the rigid body dynamics are presented instead.
22
The most important aspect of developing a model is being able to reproduce results that
reflect the powertrain system dynamics. For shift and launch transient control the lower
natural modes in the powertrain system must be present in the system response in order
to replicate vehicle shuffle and lower frequency vibrations. Only with such responses is
it then possible to demonstrate the vehicle responses observed from the driver. For
examples, some works used detailed discrete finite element, see [57, 58], or distributed
mass models, see [59].
2.3.8 Clutch control methods and actuation in the DCT
Clutch control requires consideration of the clutch modelling method, clutch control
strategies employed, and the practicalities required in the clutch control unit. Several
control methods have been applied to the DCTs. These range from basic open loop
methods through to fuzzy control techniques. To some degree the range of successful
different applications is largely limited by the detail in the dynamic modelling, which is
introduced in last section. Nevertheless, the detail regarding employed techniques can
adequately be assessed. Consideration of developing shift schedule is a component of
DCT control that requires enough attention. Yang et al. [60, 61] develop an intelligent
shift schedule in order to improve shift quality. Their simulations indicate that it can
reduce improper shifting during common driving especially in braking and improving
powertrain fuel economy.
23
2.3.9 Synchronisers and synchroniser actuation
The other important component for control in DCTs is the synchroniser mechanism,
which is essentially unchanged from the mechanism used in most manual transmissions.
The mechanism design utilises a cone clutch to synchronise target gear and shaft speeds
prior to the chamfers, or dog gear. This interlocks the gear to the shaft thereby
completing the process.
Review of general DCT control literature suggests that the assessment of actuation of
the synchroniser mechanism is somewhat under whelming. For example, Zhang [53]
and Kulkarni [54] simulate the engagement of the synchroniser as a power switch, i.e.,
‘on’ and the synchroniser is engaged, ‘off’ and it is released. The most significant
misunderstanding here is the lack of time delay to represent the delay between
command signal and completion of synchroniser engagement, a process that regularly
takes 100 ms as an average, see Lovas [62] for example. Further work eliminates the
actuation of the synchroniser. In Yang et al. [60, 61], fuzzy logic methods are deployed
to develop and intelligent shift schedule with synchroniser engagement 2 km/h before
the shift commences. Socin & Walters [63] provide an example where, a common
source of the different failure modes is the high drag torque. Walker et al. [64]
demonstrate that in wet clutch DCTs this drag torque peaks once the gear is
synchronised to the shaft. This is particularly undesirable for minimising engagement
times for the synchroniser. Perhaps the most significant aspect of synchroniser study for
the DCT is presented in Razzacki [65]. The primary considerations for the mechanism
revolve around developing a good understanding of the importance that synchronisation
and indexing torques play in the engagement process, and how these torques are
24
affected in the DCT. Additionally, it is important to consider how chamfer design is
influenced by drag torque and chamfer friction. Simulations presented in Walker et al.
[66] demonstrate the influence of drag torque on the synchroniser mechanism,
particularly when applied to wet clutch DCTs.
2.4 Drag torque literature review
The drag torque discussed in this thesis refers to the difference between torques
transmitted from the input of transmission to the output during driving (including during
gear shift) and is the source of power losses. The efficiency of powertrain systems is
increasingly being targeted as a means of reducing environmental impact. Even though
gearbox efficiency varies from 98% to 99% for the best designed high power
applications, this can still equate to losses in megawatts [67]. Within a general gearbox
there are power losses and the majority of these can be summarized in terms of four
types, (1) bearing losses, (2) meshing losses, (3) windage losses, (4) and churning losses.
Depending on the detailed application, the relative significance of these mechanisms
varies. For the total losses within a general gearbox, 40 percent come from meshing, 50
percent from bearings, and 10 percent from windage and churning losses [68].
As explained before, the DCT lubrication uses DCTF via spray-lubrication conditions
rather than using the MTF or ATF via dip-lubrication which is widely used in
conventional transmissions. In the spray-lubrication, a high-pressure amount of DCTF is
directed towards the gear mesh interface via a nozzle. Therefore, the oil churning losses
caused by the differential will not act as the main loss, even though there may be some
churning losses owing to jet-lubrication conditions. Besides this, clutch drag and
concentric shaft shear can be found within the DCT. Therefore, in this section, work
25
will be focused on a literature review on the following power losses, (1) meshing losses,
(2) bearing losses, (3) windage losses, (4) churning losses, (5) clutch shear, and (6)
concentric shaft shear.
2.4.1 Meshing losses
Meshing losses (also called friction losses) in gear teeth are dependent on both rolling
and sliding friction [10, 68, 69]. The friction coefficient model has become quite
popular for both helical gears and spur gears. Most of the work that has been done in
this field investigates the friction force variation in the line of engagement of a single
mesh. This variation should take into account the complex geometry and vector analysis
of contacting forces. However other modelling methods consider a much simpler
assessment of the meshing losses for the purposes of producing a more compact and
efficient model. These methods are more applicable to dual clutch transmission transient
simulations.
Early work conducted by Anderson et al. [69] suggests the numerical integration of
instantaneous rolling and sliding velocities along the path of engagement. It must be
divided into separate parts depending on the contact point of the meshing tooth. In this
method, the load shared by teeth are unified; and the line of engagement is divided into
shared and single tooth contact regions. Michlin [70] presents an example of vector
analysis of the contact of two meshing teeth. In this method, the line of engagement of
the mesh is divided into four parts relative to the pitch point. To account for vector
changes, the parameters equations are varied, and thus friction load at different stages
can be calculated. Methods similar to [10, 69] get quite cumbersome when modelling
26
the time dependent variation of losses over multiple gears for an extended period, but
these are more useful when studying the mesh itself.
Diab et al. [8] focuses on the assessment of the friction coefficient, and investigates the
accuracy of the preceding methods by using an appropriate friction coefficient to enable
the accurate calculation of the tooth friction force. Moreover, Diab et al. [7, 13] use a
numerical method, i.e., a discretized continuity equation applied to one dimensional air
flows. These are submitted to isentropic compression-expansion cycles including some
critical operating conditions. Added to this, experimental tests analyse the air-pumping
effect on high-speed spur and helical gear meshing, and on windage power losses. Their
most remarkable conclusion is that the air-lubricative mixture pumping phenomenon
can produce significant power losses, especially for high-speed gears. However, the
discussed models are based on several significant approximations and further research is
required in order to validate these approximations.
Xu et al. [10] review a number of the current friction models and identifies a flaw in
many friction models, that is to say, when the sliding velocity approaches zero at the
pitch point the friction coefficient approaches infinity. Though Electro-hydro dynamic
lubrication (EHL) is not practical in terms of computational requirements, it is identified
as the most suitable method for developing friction modes by [10]. But like all friction
models, this is limited by the parameters used in the simulation and experimentation. An
alternative friction model is described [71] and popularized in [15, 67]. This model is an
empirical correlation of fluid properties with gear rotational speed and load. But it
unfortunately also has the drawback of tending to infinity at pitch point as previously
discussed. An important part of both of these models is that both [10, 71] include rolling
and sliding speed. Nevertheless, just as in the description provided by Anderson, etc.,
27
[69, 70], this requires precise calculation of the tooth surface speed, including tooth
geometry and relative alignment. Therefore, this method is still too complex for this
model.
Li et al.[9, 72] studied the impact of design parameters and load on friction power losses
of helical and spur gear pairs via introducing an elasto hydrodynamic lubrication (EHL)
model. The variation of gear efficiency with the gear pressure and helix angle, number
of teeth (module), and major diameters is discussed. And the performance of the
variation of parameters on the gears functional requirements (comprise contact and
bending stress in terms of noise, tooth breakage and durability) are presented. Moreover,
they also explore a correction factors to account for the thermal effects.
Based on the available literature on gear tooth mesh, a constant friction coefficient will
be applied in the model to simplify this issue. It not only simplifies the computational of
the model but also maintains a reasonable degree of accuracy as well as there are
multiple contact points in the helical gear mesh teeth at any instant, thus an average loss
can be determined effectively. Such assumptions have been taken by Changenet et al.
[15], and Xu et al. [10] and these present a reasonable reference from which to estimate
the friction coefficient.
The issue then turns to identifying appropriate macro scale models of gear meshing
losses which can be computationally efficient. Changenet et al. [15] provides a primary
method for the evaluation of tooth meshing power losses, with an alternative equation
presented in British Standards Institute [19]. Both of the presented equations are
functions of input torque, friction, and gear geometry. Nevertheless, the gear geometry
is treated quiet differently in both of the cases. The model treated by Changenet et al.
28
[15] includes helix angle in the denominator and other geometry, for example module,
in the numerator. But this is reversed in the British Standards model. Thus the results
produced by the two models reveal substantial differences. Considering the strict
development required for manufacturer’s standards the BS/ISO model[19] will be
adopted here. Moreover, [74] has also investigated acceptability for numerical
modelling. Hence meshing power losses are determined, with the result divided by
rotational speed to meet the torque demand.
2.4.2 Bearing losses
Bearing power loss is defined as the loss of power in a machine caused by friction
between the shaft and the bearing. A series of bearing designs’ bearing losses have been
studied by Harris [16]. All of them are analysed via considering speed- and load-
dependent losses on individual bearings. This work is widely considered as the most
acceptable and advanced work, with a number of similar results being applied via some
other literature[15, 74]. According to a bearing manufacturer’s research, alternative
bearing models are described in literature[19] for bearings load in either radial or axial
direction or both. In order to keep this model independent from the manufacturer’s
research model, detailed information from Harris [16] will be employed in this thesis.
2.4.3 Windage power losses
Windage power losses (WPL) is defined as the power loss due to the drag experienced
by the gear when it is running in air or an air-oil mist. As previously mentioned, to
29
minimise the losses in the DCT, spray-type lubrication is generally adopted. This is
associated with windage drag losses and excludes churning losses from the model.
A review regarding windage power losses was conducted by Carol and Graham [12]. It
proposes to provide researchers and designers with the most comprehensive information
for the development of high efficiency transmission gearboxes. Meaningfully, it is noted
that the existing literature tends to use the same experimental apparatus to verify the
model as well as building the same model. Therefore, the results must be viewed with
some scepticism as it lacks independence in the verification of results.
Simulations conducted by Al-Shiba et al. [75] employs CDF techniques to the issue of
WPL to judge the ability to model this form of loss in effect. Even though it is feasible
to model the WPL with reasonable accuracy, there is an inclination to underestimate the
windage losses at high rotational speeds.
Anderson et al. [69] present a primary model for the windage of gear pairs under gear
geometry, speed, and viscosity to associate experimental data. Dawson [11] presents a
second empirical model based on experiments by measuring the deceleration of gears.
The relationship between windage losses and gears rotational speed, size, geometry and
the shape of gears enclosures is illustrated. Although results are collected for a varied
range of gear parameters, only air is used as the lubrication working fluid. Thus the
impact of oil-air mixture is unknown. Dawson [11] also notes that the formula presented
is only approximate as there is a lack of sufficient data from the experiments. But this
literature gives reasonably detailed information for comparing model results.
Diab et al.[7] provide two isolated models for the windage losses of gears in air-oil
mixtures. The first method is based on pi-theorem, as performed in the previous models
30
by [69, 76], considering a combination of viscosity, speed, and geometry in developing
a reasonably precise model. The second method applies fluid flow analysis to develop
equations for faces. It applies friction force generated on the “disc” face and teeth,
where fluid flow is deflected by the proceeding tooth onto the next tooth, generating a
resistance force. The advantage of this is the independence of the connection to
experimental equipment. Diab et al.[7] provides a good comparison of both of these two
methods by using a relatively smaller quantity of experiments than [76] for instance.
Nevertheless, as is suggested from [7], the independence of the second method from
experimental test data provides an increased degree of confidence.
2.4.4 Churning losses
Churning losses are defined as the loss of power in a transmission caused by churning
of the lubricant if the rotating components of the gearbox are immersed in an oil bath
(dip lubrication). Although the lubrication of DCT uses jet lubrication, there may be still
some churning losses existing in the gearbox. For the churning losses, there has been a
large body of work in dealing with Churning losses [7, 14, 69, 77].
Changenet et al. [7, 15, 78] presented a series of formula to research the variations of
gear churning losses varied with speed, gear geometries, lubricants, and immersion
depths. It shows that in low-medium speed, the tooth friction appears as the domain
sources of power losses, while in high speed, windage becomes an important source of
dissipation. They then apply thermal network methods and experimental tests to study
six speed manual gear box power losses. The comparison between calculations and
experimental results shows that their proposed model is reasonably good, especially at a
31
high temperature (near 100 oC). The thermal network methodology is suggested by its
industrial applications. The churning losses of a gear pair can be grouped into two
categories[79]. The first category is composed of drag losses connected with the
interaction of each individual gear to the surrounding medium. The second category of
churning losses is made up of losses due to the interaction of the gear pairs with the
surrounding medium (oil) at the interface of the gear mesh, with pocketing/ squeezing
losses acting as the dominant power loss. Detailed study regarding churning losses can
be found in Satya’s work [79].
2.4.5 Clutch shear
In the multi-plate wet clutch pack, a viscous shearing torque resulted from acceleration
will resist the direction of certain motions. When in low speed ranges, it is a relatively
simple problem which has demonstrated that the drag torque can be proved accurately
[80]. But it is not applicable to high speed, and an improved model with reasonable
accuracy at both low and high speeds is provided by Yuan et al.[81]. Yuan has
presented logic to comprehensively explain the phenomenon of reduced drag at high
speed, where a decreased effective radius results from the interaction of surface tension
of gears, centrifugal force and mass conservation. The centrifugal force pushes lubricant
out of the clutch plates and diminishes the effective contact area at high speed, and this
is countered by capillary action which draws the fluid again into centrifugal motion.
Therefore, the balancing of the two forces can be used to calculate an approximate
reduced outer radius.
32
Aphale et al.[82] also provide an alternative solution to the Naiver–Stokes equations
that are solved by [81], etc., and, like Yuan, assumes that the centrifugal forces play an
important role in the fluid flow in the clutches. However, at the same time, it is assumed
that viscous forces do not act as a significant role in the distribution of forces. These
results, albeit in limited form, are presented. Thus the method proposed by Yuan [81] is
going to be used for modelling the clutch drag.
2.4.6 Concentric shaft shear
Particular to the DCT is the arrangement of concentric shafts that connect the gears to
the clutches. The arrangement of rotating concentric shafts is presented in [83], as an
example of Couette flow, or simple shear flow. Further detailed information regarding
shear losses within concentric shaft can be sourced from the literature[83].
2.5 Pure EV literature review
As mentioned earlier, the amount of fossil fuel resources is not unlimited in our planet
but the oil consumption has risen dramatically. The transportation sector is the largest
energy sector. Consumption of oil by transportation risen dramatically in recent decades.
This growth has largely come from new demands for personal use vehicles equipped
with combustion engines. Moreover, several environmental problems[84], for instance,
the greenhouse effect, acid deposition, air pollution etc., closely correspond to
transportation emission. Hence, more and more governments and organisations have
developed tougher standards for fuel consumption and emissions.
Consequently, the development of commercially viable hybrid electric vehicles (HEVs)
for use in the short to mid-term, and pure electric vehicles (EVs) and fuel cell vehicles
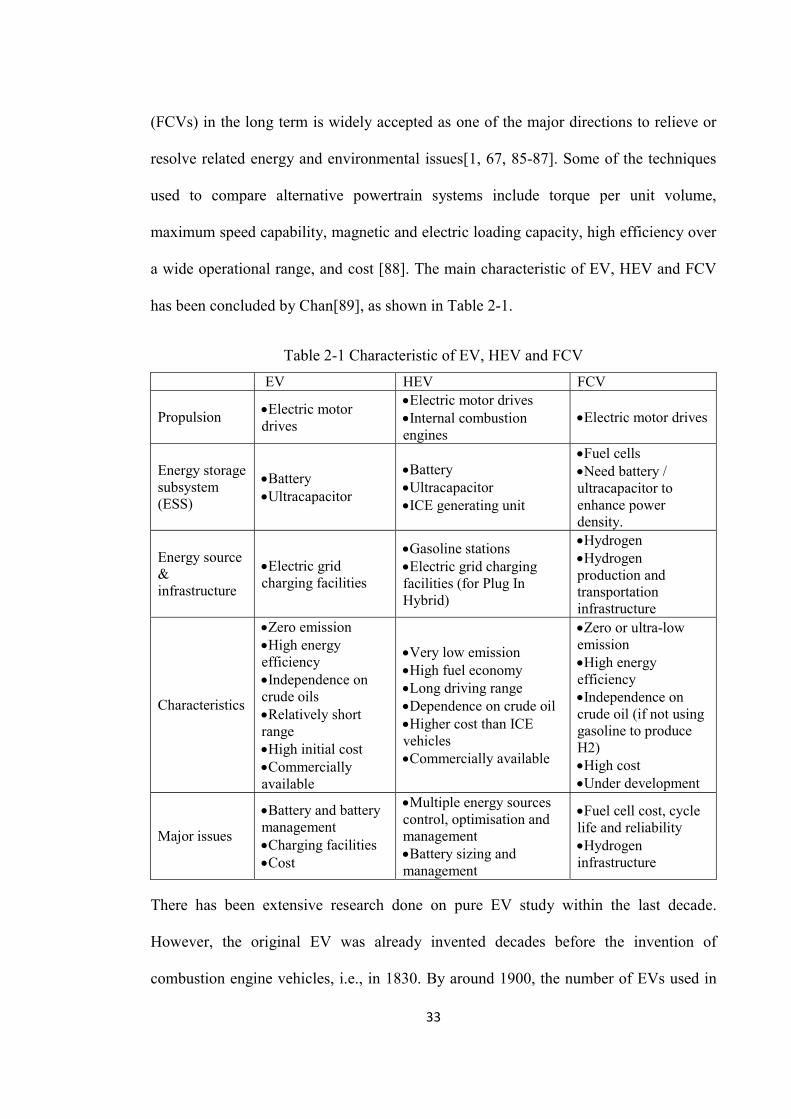
33
(FCVs) in the long term is widely accepted as one of the major directions to relieve or
resolve related energy and environmental issues[1, 67, 85-87]. Some of the techniques
used to compare alternative powertrain systems include torque per unit volume,
maximum speed capability, magnetic and electric loading capacity, high efficiency over
a wide operational range, and cost [88]. The main characteristic of EV, HEV and FCV
has been concluded by Chan[89], as shown in Table 2-1.
Table 2-1 Characteristic of EV, HEV and FCV EV HEV FCV
Propulsion Electric motor drives
Electric motor drives Internal combustion
engines Electric motor drives
Energy storage subsystem (ESS)
Battery Ultracapacitor
Battery Ultracapacitor ICE generating unit
Fuel cells Need battery /
ultracapacitor to enhance power density.
Energy source & infrastructure
Electric grid charging facilities
Gasoline stations Electric grid charging
facilities (for Plug In Hybrid)
Hydrogen Hydrogen
production and transportation infrastructure
Characteristics
Zero emission High energy
efficiency Independence on
crude oils Relatively short
range High initial cost Commercially
available
Very low emission High fuel economy Long driving range Dependence on crude oil Higher cost than ICE
vehicles Commercially available
Zero or ultra-low emission High energy
efficiency Independence on
crude oil (if not using gasoline to produce H2) High cost Under development
Major issues
Battery and battery management Charging facilities Cost
Multiple energy sources control, optimisation and management Battery sizing and
management
Fuel cell cost, cycle life and reliability Hydrogen
infrastructure
There has been extensive research done on pure EV study within the last decade.
However, the original EV was already invented decades before the invention of
combustion engine vehicles, i.e., in 1830. By around 1900, the number of EVs used in
34
the USA was almost twice as much as that of engine vehicles. Nevertheless, after only a
few years, the consumption of EVs decreased dramatically, and eventually, the sales
stopped compeltely. The reason why this phenomenon occurred was because the EVs
lacked attractive characteristics compared to vehicles equipped with combustion
engines, which had the advantage of acceleration ability and driving range per
charge[90]. Moreover, the decreased fuel prices at that time and mass production of
gasoline vehicles by Henry Ford increased the chance of the extinction of EVs in that
period.
However, environmental issues and the fossil fuel energy crisis have led researchers and
manufactures to devote increasing attention to a reconsideration of alternative vehicles,
such as the EVs. According to research objective, various methods can be applied to
modelling and optimising pure EVs, such as powertrain system component design[67,
91], topology analysis[30, 68, 92], batteries, energy management strategies and
analysis[1, 87, 93-97], the application of super-capacitors[98] and the drive control [99-
102] of EVs.
Nowadays, more and more EV researchers and designers are paying attention to the
application of multiple speed transmissions instead of traditional single speed
transmissions, and this is expected to improve the EV performance[4, 103, 104]. The
usage of multi-speed transmissions for electric vehicles is likely to improve average
motor efficiency and range capacity, or can even reduce the required motor size. There
are a number of multi-speed transmissions available for pure EVs, as shown by
Hoeijmakers[105] and Rudolph[29], indicating that DCTs have a higher fuel efficiency
than other automatic drives and this, in turn, makes them extremely suitable.
35
On the other hand, it is necessary to point out that the vehicle performance improvement
by using multi-gear transmissions for an electric vehicle is not as much as for an engine
driven vehicle and this is due to significantly different characteristics of these two
systems. In an engine driven system, the available output speed range of the engine is
normally much narrower than that of electric motor. The inertia of the motor is smaller
than that of engine as well, usually smaller than a quarter of engine. And the motor
speed is also more controllable than that of engine. Therefore, the number of gear ratios
for a pure EV is not the more the better, as it will increase the transmission manufacture
cost and the overall vehicle mass without contributing significantly to the overall
performance of the vehicle. Detailed performance, including drive range and
acceleration ability, and the difference between one-speed and two-speed EV is
provided in[106].
For a given demand power from the driver and vehicle speed, the instantaneous motor
torque is directly influenced by the transmission gear ratio selection and shifting
schedule. Some research has been done in relation to the EVs gear shift schedule
optimisation, such as [107], however, this research only focuses on gear shift schedule
optimisation with given gear ratios. The research does not consider the best use of gear
ratios to maximise EM efficiency. As a result, there is a lack of published work which
combines the gear shifting schedule and gear ratios optimisation to improve overall EV
performance.
In fact, the drivetrain system efficiency is not only directly affected by the transmission
gear shift schedule, but the transmission gear ratio election as well [22]. For any given
motor, the shift schedule and transmission gear ratio pair selection are closely linked,
and mutually affected. Therefore, in order to improve the EV performance, it is
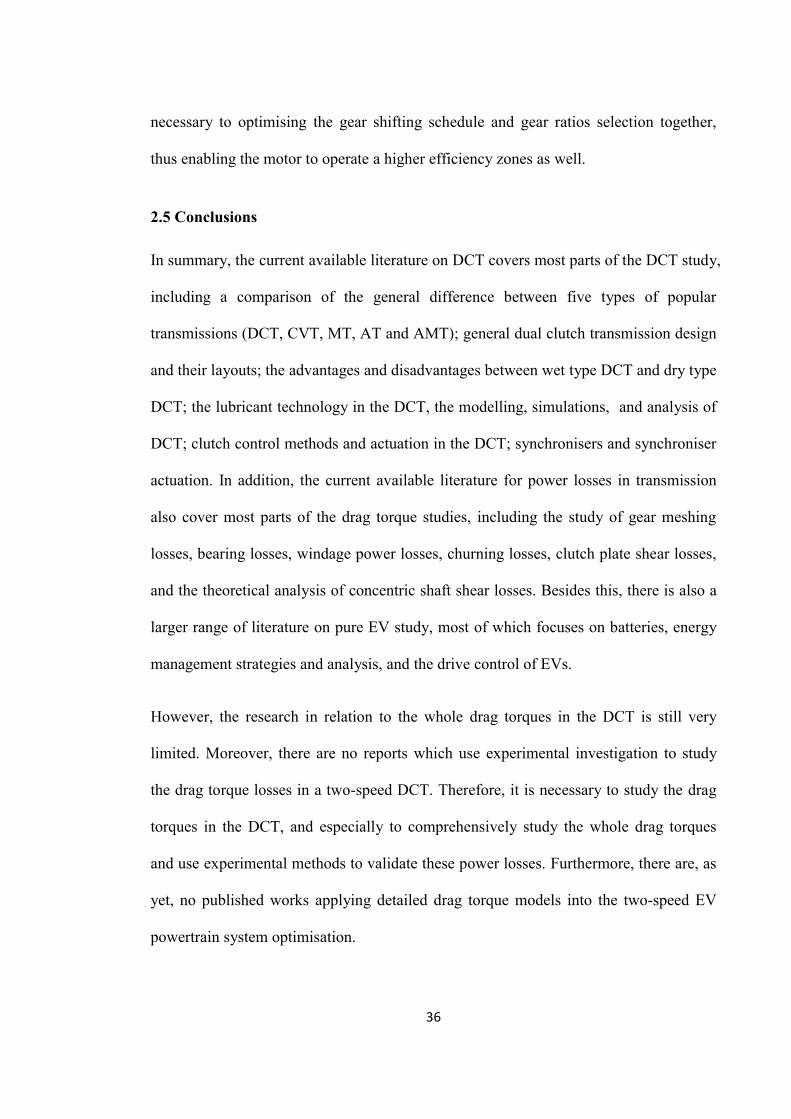
36
necessary to optimising the gear shifting schedule and gear ratios selection together,
thus enabling the motor to operate a higher efficiency zones as well.
2.5 Conclusions
In summary, the current available literature on DCT covers most parts of the DCT study,
including a comparison of the general difference between five types of popular
transmissions (DCT, CVT, MT, AT and AMT); general dual clutch transmission design
and their layouts; the advantages and disadvantages between wet type DCT and dry type
DCT; the lubricant technology in the DCT, the modelling, simulations, and analysis of
DCT; clutch control methods and actuation in the DCT; synchronisers and synchroniser
actuation. In addition, the current available literature for power losses in transmission
also cover most parts of the drag torque studies, including the study of gear meshing
losses, bearing losses, windage power losses, churning losses, clutch plate shear losses,
and the theoretical analysis of concentric shaft shear losses. Besides this, there is also a
larger range of literature on pure EV study, most of which focuses on batteries, energy
management strategies and analysis, and the drive control of EVs.
However, the research in relation to the whole drag torques in the DCT is still very
limited. Moreover, there are no reports which use experimental investigation to study
the drag torque losses in a two-speed DCT. Therefore, it is necessary to study the drag
torques in the DCT, and especially to comprehensively study the whole drag torques
and use experimental methods to validate these power losses. Furthermore, there are, as
yet, no published works applying detailed drag torque models into the two-speed EV
powertrain system optimisation.
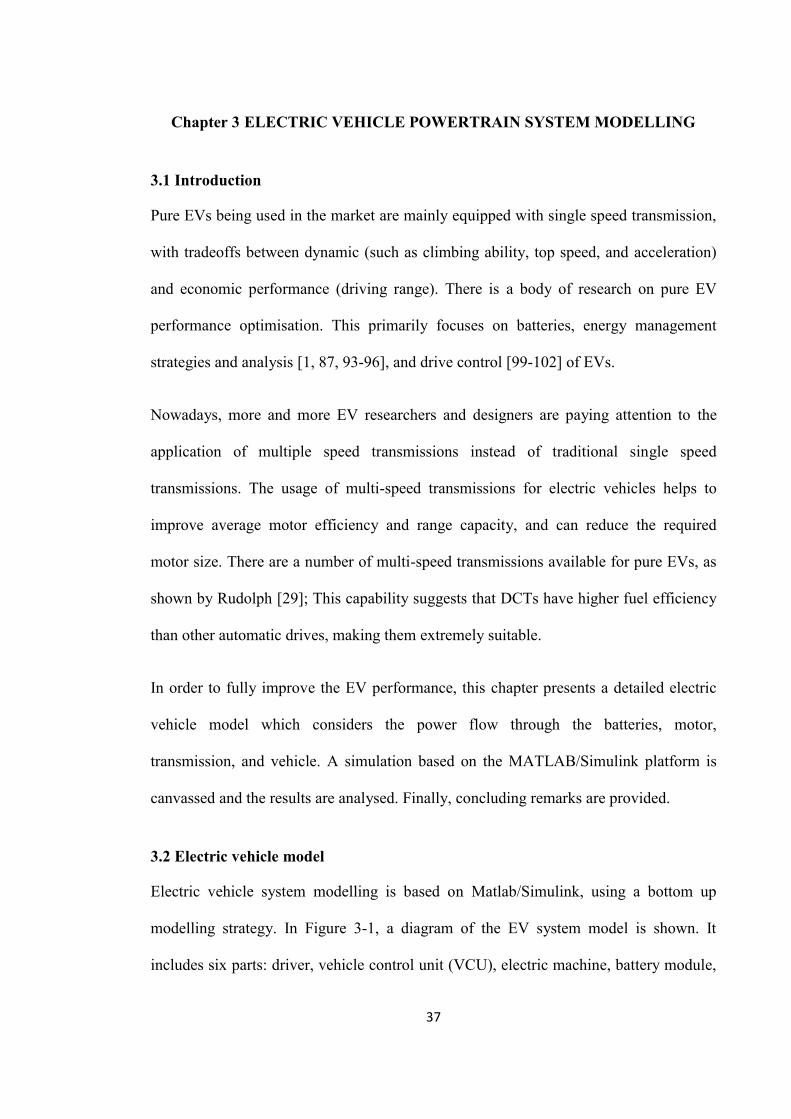
37
Chapter 3 ELECTRIC VEHICLE POWERTRAIN SYSTEM MODELLING
3.1 Introduction
Pure EVs being used in the market are mainly equipped with single speed transmission,
with tradeoffs between dynamic (such as climbing ability, top speed, and acceleration)
and economic performance (driving range). There is a body of research on pure EV
performance optimisation. This primarily focuses on batteries, energy management
strategies and analysis [1, 87, 93-96], and drive control [99-102] of EVs.
Nowadays, more and more EV researchers and designers are paying attention to the
application of multiple speed transmissions instead of traditional single speed
transmissions. The usage of multi-speed transmissions for electric vehicles helps to
improve average motor efficiency and range capacity, and can reduce the required
motor size. There are a number of multi-speed transmissions available for pure EVs, as
shown by Rudolph [29]; This capability suggests that DCTs have higher fuel efficiency
than other automatic drives, making them extremely suitable.
In order to fully improve the EV performance, this chapter presents a detailed electric
vehicle model which considers the power flow through the batteries, motor,
transmission, and vehicle. A simulation based on the MATLAB/Simulink platform is
canvassed and the results are analysed. Finally, concluding remarks are provided.
3.2 Electric vehicle model
Electric vehicle system modelling is based on Matlab/Simulink, using a bottom up
modelling strategy. In Figure 3-1, a diagram of the EV system model is shown. It
includes six parts: driver, vehicle control unit (VCU), electric machine, battery module,
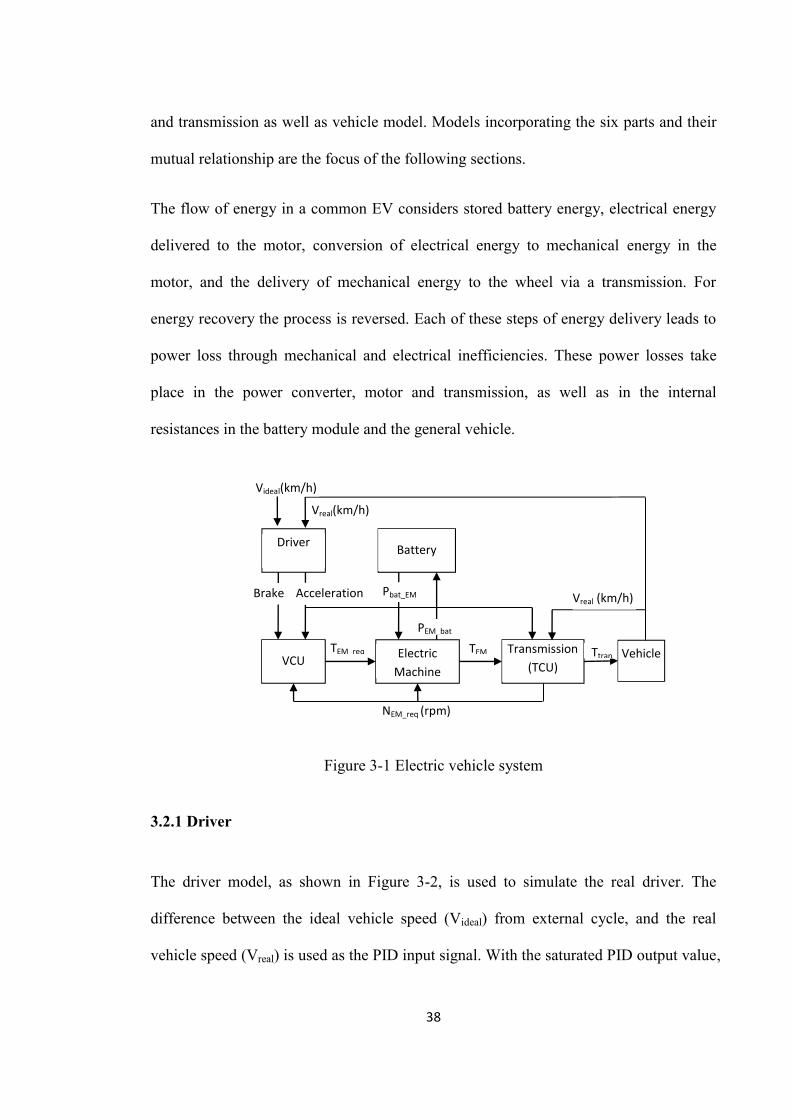
38
and transmission as well as vehicle model. Models incorporating the six parts and their
mutual relationship are the focus of the following sections.
The flow of energy in a common EV considers stored battery energy, electrical energy
delivered to the motor, conversion of electrical energy to mechanical energy in the
motor, and the delivery of mechanical energy to the wheel via a transmission. For
energy recovery the process is reversed. Each of these steps of energy delivery leads to
power loss through mechanical and electrical inefficiencies. These power losses take
place in the power converter, motor and transmission, as well as in the internal
resistances in the battery module and the general vehicle.
Figure 3-1 Electric vehicle system
3.2.1 Driver
The driver model, as shown in Figure 3-2, is used to simulate the real driver. The
difference between the ideal vehicle speed (Videal) from external cycle, and the real
vehicle speed (Vreal) is used as the PID input signal. With the saturated PID output value,
NEM_req (rpm)
Driver
VCU Electric Machine
Battery
Transmission (TCU)
Vehicle
Vreal (km/h)
Videal(km/h)
Vreal(km/h)
Brake Acceleration Pbat_EM
PEM_bat
TEM req TEM Ttran
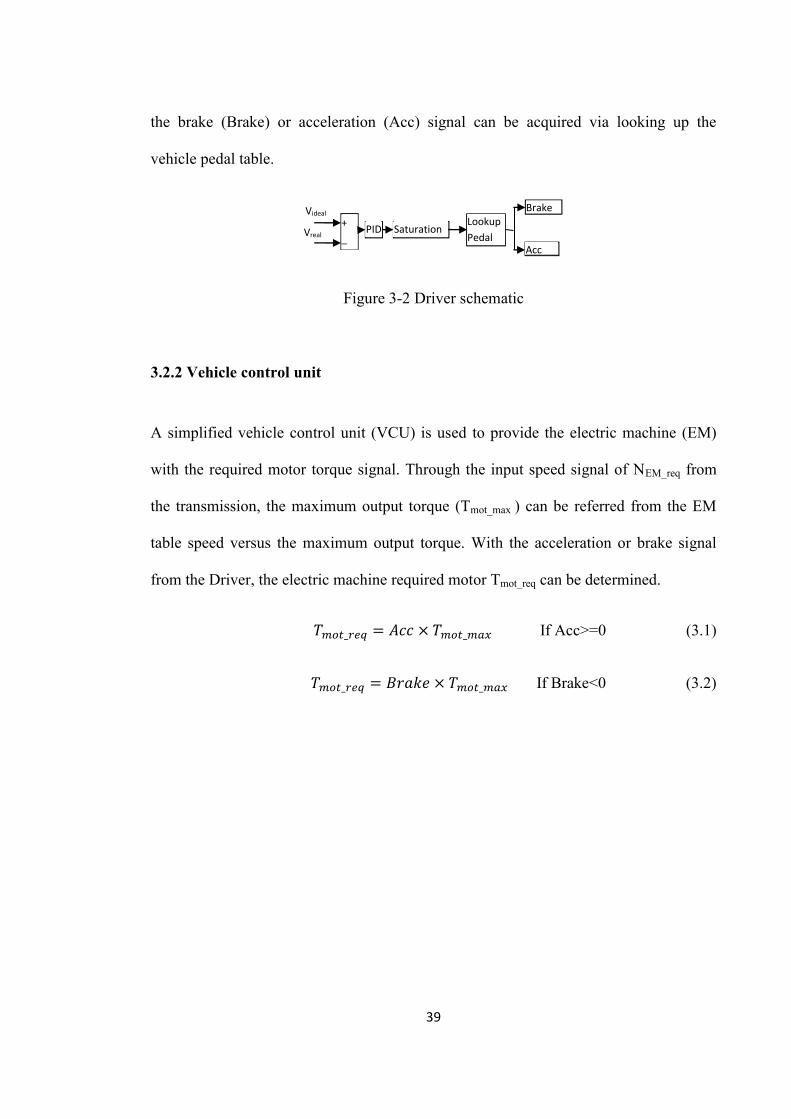
39
the brake (Brake) or acceleration (Acc) signal can be acquired via looking up the
vehicle pedal table.
Figure 3-2 Driver schematic
3.2.2 Vehicle control unit
A simplified vehicle control unit (VCU) is used to provide the electric machine (EM)
with the required motor torque signal. Through the input speed signal of NEM_req from
the transmission, the maximum output torque (Tmot_max ) can be referred from the EM
table speed versus the maximum output torque. With the acceleration or brake signal
from the Driver, the electric machine required motor Tmot_req can be determined.
𝑇 _ = 𝐴𝑐𝑐 × 𝑇 _ If Acc>=0 (3.1)
𝑇 _ = 𝐵𝑟𝑎𝑘𝑒 × 𝑇 _ If Brake<0 (3.2)
Videal Brake
Acc
+ _
PID Saturation Lookup Pedal Vreal
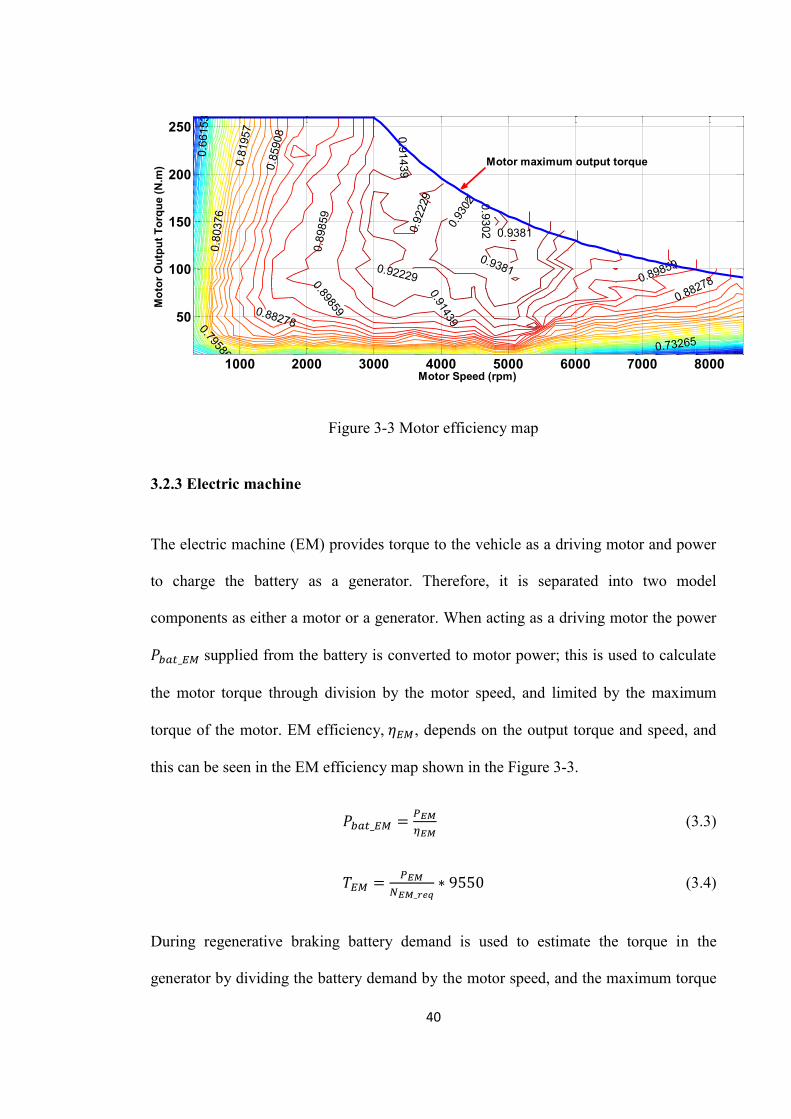
40
Figure 3-3 Motor efficiency map
3.2.3 Electric machine
The electric machine (EM) provides torque to the vehicle as a driving motor and power
to charge the battery as a generator. Therefore, it is separated into two model
components as either a motor or a generator. When acting as a driving motor the power
𝑃 _ supplied from the battery is converted to motor power; this is used to calculate
the motor torque through division by the motor speed, and limited by the maximum
torque of the motor. EM efficiency, 𝜂 , depends on the output torque and speed, and
this can be seen in the EM efficiency map shown in the Figure 3-3.
𝑃 _ = (3.3)
𝑇 =_
∗ 9550 (3.4)
During regenerative braking battery demand is used to estimate the torque in the
generator by dividing the battery demand by the motor speed, and the maximum torque
Motor Speed (rpm)
Mot
or O
utpu
t Tor
que
(N.m
)
0.92
229
0.93
02 0.9302 0.9381
0.93810.922290.898590.882780.79586 0.73265
0.66
153
0.81
957
0.85
908
0.89
859
0.91439
0.89859
0.882780.91439
0.80
376
1000 2000 3000 4000 5000 6000 7000 8000
50
100
150
200
250
Motor maximum output torque
41
is limited from the torque curve. The regenerator efficiency map is similar to Figure 3-3,
but the output torque is negative.
𝑃 = 0.3𝜂 𝑃 (3.5)
𝑃 = _ (3.6)
If the EM continues working with peak power for an extended period of time, it is
harmful to the EM. It is therefore necessary to reduce the EM working time in peak.
Thus rated power is forced to replace the peak power when operating in peak power
conditions for more than 30 seconds. If the EM operates at peak power and continues
for more than 30 seconds, it is forced to operate at rated power for 10 seconds. After
that, the EM will be able to return to peak power again.
3.2.4 Battery
Simulation of the battery considers calculation of discharge and charge requirements.
The battery pack is modelled on power supplied from the battery to EM Pbat_EM and
demand by EM PEM_bat as indicated in Figure 3-1.
The state of charge (SOC) calculation is an iterative process dependent on power
demand from the motor or power supplied from regenerative braking. Maximum
capacity is determined from the battery initial state (CAPMAX). And used capacity
(CAPUSED) is supply/demand from the motor/generator. The absolute SOC is defined as:
𝑆𝑂𝐶 = (3.7)
CAP = ∫ I dt (3.8)
42
The battery current (I) in the battery is calculated in the controller as:
𝐼 = _ (3.9)
VOUT is the voltage converted from battery.
3.2.5 Transmission
For these simulations a simple two speed transmission model is used. It is applied to
improve the operation of the electric motor in its higher efficiency region. The shift map
is both throttle angle and vehicle speed dependent. According to the optimised shift
map, from vehicle speed and throttle angle (brake and acceleration signal), the required
gear, G1 or G2, is selected. For this model only the overall gear ratio is provided and the
final drive ratio must be divided into the output ratios to determine the actual gear ratio.
Separate maps are required for up and down shifts and these are shown in Figure 3-4.
Shift logic for the two-speed transmission is described below:
(a) Via the throttle angle and gear shift schedule, two speeds for the up and
down shift can be achieved.
(b) Compare the actual vehicle with two shift speeds from (1).
(c) For up shift logic, if the actual vehicle speed is higher than the up shift speed,
i.e. it passes across the up shift line from zone two to zone three, the second
gear will be selected.
(d) Similarly, for the down shift logic, if the actual vehicle speed is lower than
the down shift speed, i.e., it passes across the downshift line from zone two
to zone one, then the first gear will be selected.
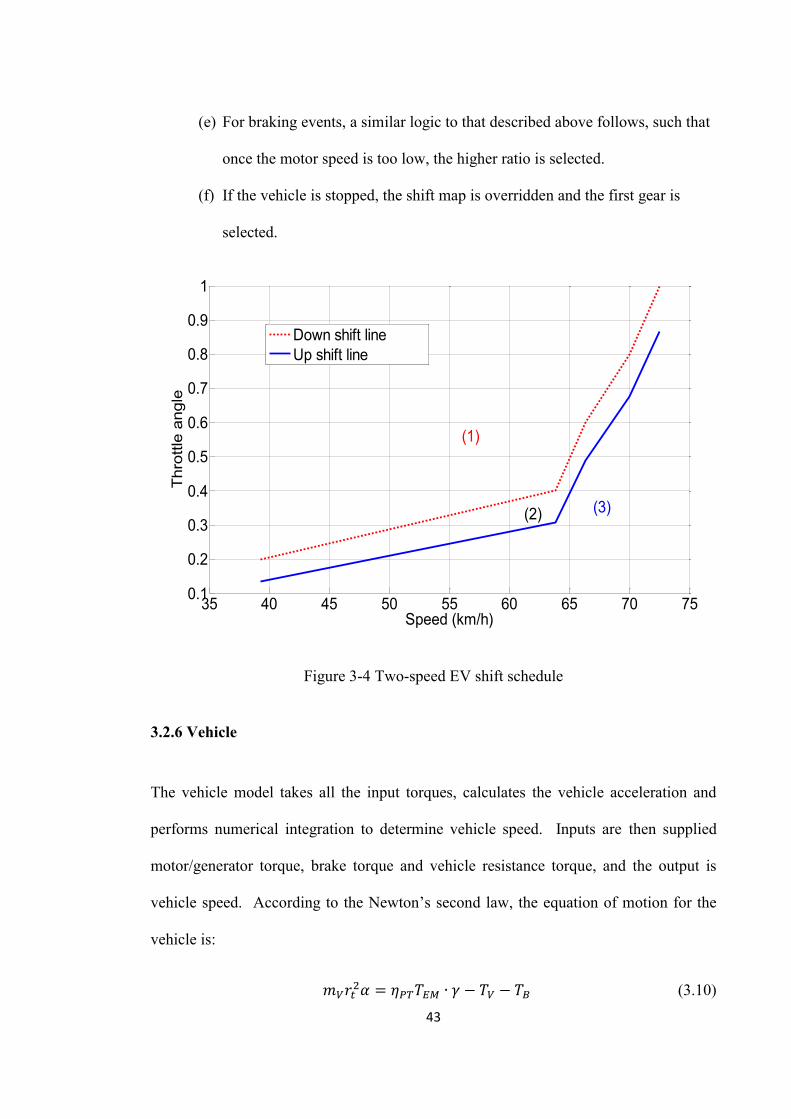
43
(e) For braking events, a similar logic to that described above follows, such that
once the motor speed is too low, the higher ratio is selected.
(f) If the vehicle is stopped, the shift map is overridden and the first gear is
selected.
Figure 3-4 Two-speed EV shift schedule
3.2.6 Vehicle
The vehicle model takes all the input torques, calculates the vehicle acceleration and
performs numerical integration to determine vehicle speed. Inputs are then supplied
motor/generator torque, brake torque and vehicle resistance torque, and the output is
vehicle speed. According to the Newton’s second law, the equation of motion for the
vehicle is:
𝑚 𝑟 𝛼 = 𝜂 𝑇 ∙ 𝛾 − 𝑇 − 𝑇 (3.10)
35 40 45 50 55 60 65 70 750.1
0.2
0.3
0.4
0.5
0.6
0.7
0.8
0.9
1
Speed (km/h)
Thr
ottle
ang
le
Down shift lineUp shift line
(3)
(1)
(2)
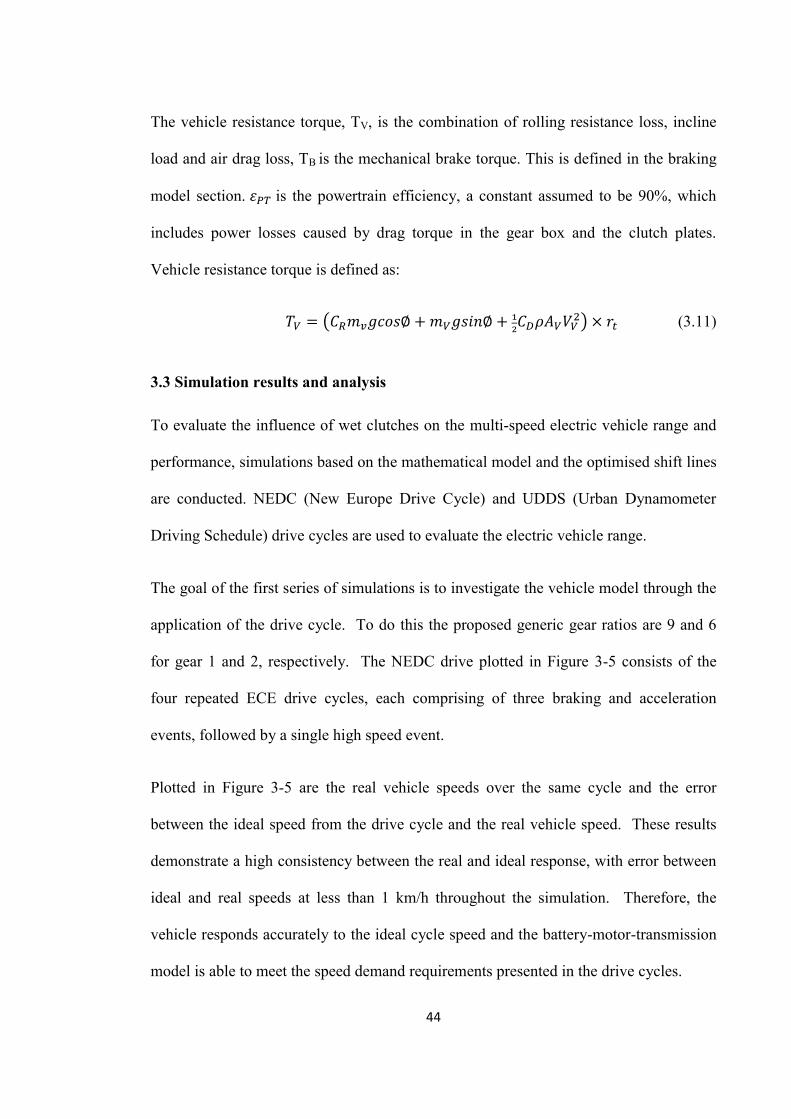
44
The vehicle resistance torque, TV, is the combination of rolling resistance loss, incline
load and air drag loss, TB is the mechanical brake torque. This is defined in the braking
model section. 𝜀 is the powertrain efficiency, a constant assumed to be 90%, which
includes power losses caused by drag torque in the gear box and the clutch plates.
Vehicle resistance torque is defined as:
𝑇 = 𝐶 𝑚 𝑔𝑐𝑜𝑠∅ + 𝑚 𝑔𝑠𝑖𝑛∅ + 𝐶 𝜌𝐴 𝑉 × 𝑟 (3.11)
3.3 Simulation results and analysis
To evaluate the influence of wet clutches on the multi-speed electric vehicle range and
performance, simulations based on the mathematical model and the optimised shift lines
are conducted. NEDC (New Europe Drive Cycle) and UDDS (Urban Dynamometer
Driving Schedule) drive cycles are used to evaluate the electric vehicle range.
The goal of the first series of simulations is to investigate the vehicle model through the
application of the drive cycle. To do this the proposed generic gear ratios are 9 and 6
for gear 1 and 2, respectively. The NEDC drive plotted in Figure 3-5 consists of the
four repeated ECE drive cycles, each comprising of three braking and acceleration
events, followed by a single high speed event.
Plotted in Figure 3-5 are the real vehicle speeds over the same cycle and the error
between the ideal speed from the drive cycle and the real vehicle speed. These results
demonstrate a high consistency between the real and ideal response, with error between
ideal and real speeds at less than 1 km/h throughout the simulation. Therefore, the
vehicle responds accurately to the ideal cycle speed and the battery-motor-transmission
model is able to meet the speed demand requirements presented in the drive cycles.
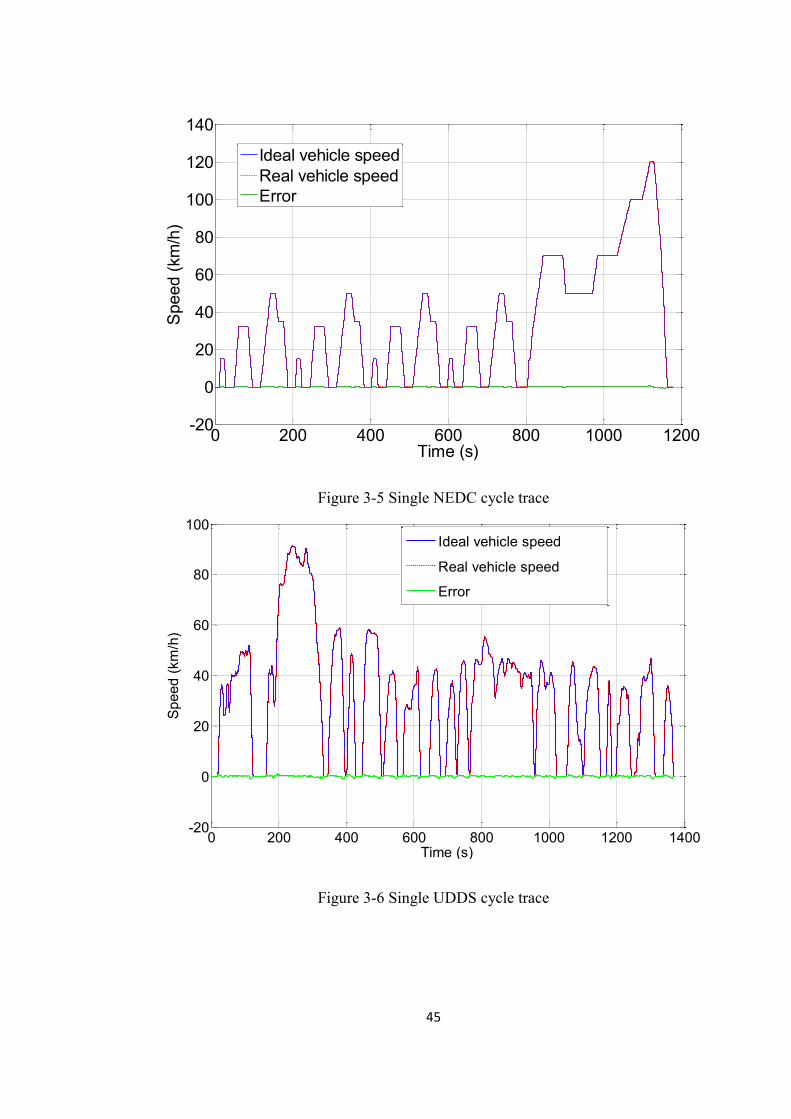
45
Figure 3-5 Single NEDC cycle trace
Figure 3-6 Single UDDS cycle trace
0 200 400 600 800 1000 1200-20
0
20
40
60
80
100
120
140
Time (s)
Spe
ed (k
m/h
)
Ideal vehicle speedReal vehicle speedError
0 200 400 600 800 1000 1200 1400-20
0
20
40
60
80
100
Time (s)
Spe
ed (k
m/h
)
Ideal vehicle speed
Real vehicle speed
Error
46
3.4 Conclusions
This chapter discusses an electric vehicle powertrain system model equipped with a
two-speed dual clutch transmission. It considers the battery, shift schedule, vehicle
control unit, transmission, vehicle, Electric Machine and the Driver.
Simulations based on the mathematical model and the optimised shift lines are
conducted. NEDC (New Europe Drive Cycle) and UDDS (Urban Dynamometer Driving
Schedule) drive cycles are used to evaluate the model performance. This chapter lays
the foundation for further study in chapter 4 and chapter 8.
47
Chapter 4 TWO-SPEED DCT GEAR RATIOS DESIGN AND SHIFT
SCHEDULE
4.1 Introduction
For conventional vehicles, in order to improve the energy efficiency, there are numerous
works on the transmission gear ratios boundary, and the shift schedule and control, e.g.
the research on the optimisation and analysis of AT[108, 109], DCT[3, 110-113], and
AMT[114, 115]. However, there are few reports which focus on applying transmission
in pure EVs.
As mentioned earlier, the usage of multi-speed transmissions for electric vehicles (EV)
helps to improve average motor efficiency, range capacity, and launch ability. Further, it
can even reduce the required motor size. Rudolph et al. Reference [116] shows that
there are a number of transmissions available for application to EVs for multi-speed
drives. The research also suggests that DCTs have higher fuel efficiency than other
automatic drives, and this makes them eminently suitable.
In order to study the influence of the transmission gear ratios and shift schedule on the
electric vehicle performance, a detailed electric vehicle model is built based on
MATLAB/Simulink. As discussed in Chapter 4, this considers power flow through the
batteries, motor, transmission, and vehicle. This vehicle model is matched to single and
two speed transmissions, and the vehicle performance is studied for a range of grade and
drive cycle considerations.
These simulations were conducted to evaluate the impact of transmission gear ratios and
shift schedule on EV performance. To study the impact of gears ratio on the EV,
48
numerical simulations were conducted using NEDC (New European Driving Cycle)
drive cycles, a constant speed (60 km/h, and 100 km/h) to evaluate vehicle range, and
acceleration ability. Simulations were also conducted to evaluate the acceleration and
range. Other detailed work and conclusions regarding this topic can be found in our
previous research work[117]. In this chapter, gear ratios boundary methods and an auto-
search method for optimal gear ratios and shift schedule will be presented. After that,
simulations and analysis will be conducted to validate the effectiveness of the proposed
methods. Finally, conclusions will be outlined.
4.2 Boundary transmission gear ratio range
The goal of vehicle transmissions is to supply maximum vehicle driving performance.
As concluded by Ehsani Mehrdad et al. [101], the vehicle transmission has to offer
ratios between engine/motor speed and vehicle wheel speed in order to enable the
vehicle to:
(1) Move under difficult conditions,
(2) Reach the required maximum speed, and
(3) Operate in the fuel-efficient ranges of the engine/motor performance map.
Therefore, it is necessary to bound permissible transmission ratios which meet the
requirements above. The maximum ratio required 𝛾 is fixed by the first condition.
The second condition gives the maximum road speed ratio. And the smallest
powertrain ratio 𝛾 is determined by the third condition.
For an EV equipped with two-speed transmission, the 1st gear ratio is mainly used to
meet the dynamic performances, such as acceleration and grade ability. And the 2nd gear
49
ratio is mainly used to enable the EM working in high efficiency zone with high
economic performance to reach the top speed requirements.
At low speed, the minimum value of the 1st gear ratio 𝛾 _ can be defined by the
requirement of the vehicle to achieve hill climbing capabilities. To evaluate the grade
ability the vehicle speed can be considered as constant speed, with no acceleration. In
this thesis, it is assumed that the vehicle speed is 15 km/h under grade ability. Thus,
according to reference [101], the minimum that the 1st gear ratio can be rearranged and
evaluated as:
𝛾 _ =( ( Φ Φ) )
(4.1)
Contradicting this requirement is the top speed achieved by the vehicle. The lowest
gear ratio can be defined by dividing a desired maximum vehicle speed by the linear
equivalent of the maximum motor speed:
𝛾 _ , =.
(4.2)
To confirm that the motor can provide the required torque at this speed, from equation
(4.3) it is assumed that there is no incline load and the rolling resistance torque is
divided by the maximum motor torque.
𝛾 _ , =∅ ×
, (4.3)
Additionally, considering the manufacturing effects and the shift quality, the gap
between the two gear ratios should not be too large. According to Lechner [118], the
50
ratio between adjacent gears should be in a certain range. Also considering the
manufacture size effects, the up limit of the 1st gear ratio is limited to 15.
Parts of simulation results
In order to meet drive dynamic requirements, several inequalities can be used to provide
a boundary for the range of the one-speed conventional transmission. It is assumed that
they are both using the same electric motor. In order to enable a top speed of EV at
higher than 105 km/h, the gear ratio should be smaller than 8.59. In order to enable a
climbing ability of more than 25 degrees, the gear ratio should be higher than 8.27.
Therefore, the range is between 8.27 and 8.59. A reasonable value of 8.47 is accordingly
chosen. In similar methods, to reach a climbing ability of more than 30 degrees, and the
top speed of more than 200 km/h, and considering transmission size affects, the two-
speed transmission range of the first gear ratio should be between 14.5-9.8, and the
second gear ratio should be between 2 and 4.51.
The results from simulation in a one-speed transmission vehicle show that the
acceleration time for 0-100 km/h is 13.44 seconds, and the acceleration time for 0-60
km/h is 5.57 seconds. In addition, the average motor efficiency is 75 percent via the
NEDC cycle test and the travel distance is only 128 km per charge.
The two-speed transmission vehicle shows that the acceleration time for 0-100 km/h is
12.91 seconds, and the acceleration time for 0-60 km/h is 4.5 seconds. The average
motor efficiency is 77 percent via the NEDC cycle test. The travel distance is 130 km
per charge.
51
4.3 Auto-search method for optimal gear ratios and shift schedule construction
Based on the bounded gear ratios range for the 1st and the 2nd presented in the last
section, the next step is to determine the global optimal solution. The goal of the
optimisation methodology is to maximise the EV’s drive, finding the longest drive
range which corresponds with the optimal shift schedule and gear ratios G1 and G2.
During simulation, G1 and G2 are dynamically changed within their ranges. For
convenience a generic gear ratio pair (G1=9, G2=6) is selected to describe the method.
With the possible gear ratios G1 and G2, the vertical and horizontal coordinate value of
the EM efficiency map shown in Figure 3-3 will be changed. The vertical value will be
divided by G1 and G2 respectively. This results in the torque at the transmission output.
The horizontal value will be multiplied by (2π/60)*3.6*Rt/G1, and (2π/60)*3.6*Rt/G2
respectively. This changes from revolutions per minute for EM to vehicle speed (km/h).
The new efficiency maps are shown in Figure 4-1 and Figure 4-2. If we combine Figure
4-1 and Figure 4-2, as shown in Figure 4-3, there exists an overlap area, expressed as
(B). The overlap area is where the output power is identical, with the same vehicle
speed and the same output torque. Either gear meets the drive requirements.
Accordingly, shift should be performed within the overlap area.
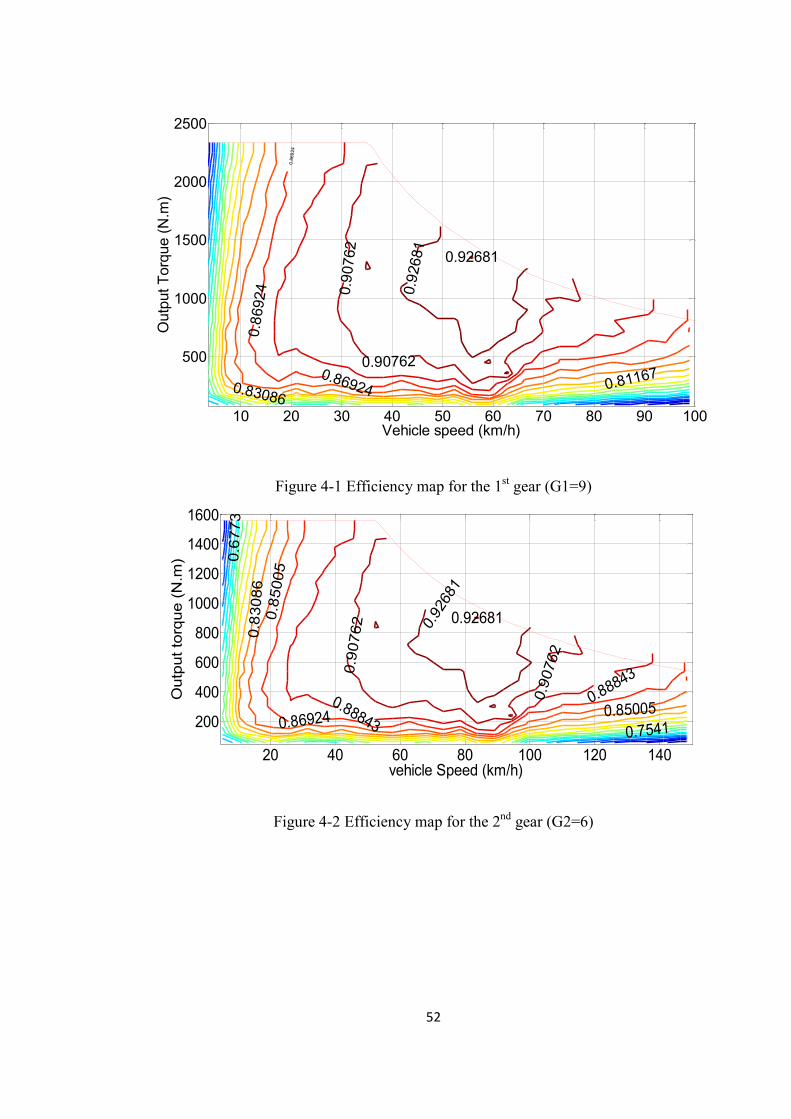
52
Figure 4-1 Efficiency map for the 1st gear (G1=9)
Figure 4-2 Efficiency map for the 2nd gear (G2=6)
10 20 30 40 50 60 70 80 90 100
500
1000
1500
2000
2500
Vehicle speed (km/h)
Out
put T
orqu
e (N
.m)
0.90
762
0.92
681
0.92681
0.907620.869240.83086
0.86
924
0.81167
0.86
924
20 40 60 80 100 120 140
200
400
600
800
1000
1200
1400
1600
vehicle Speed (km/h)
Out
put t
orqu
e (N
.m)
0.92
681
0.92681
0.90
762
0.88843
0.850050.7541
0.888430.86924
0.85
005
0.83
086
0.67
73
0.90
762
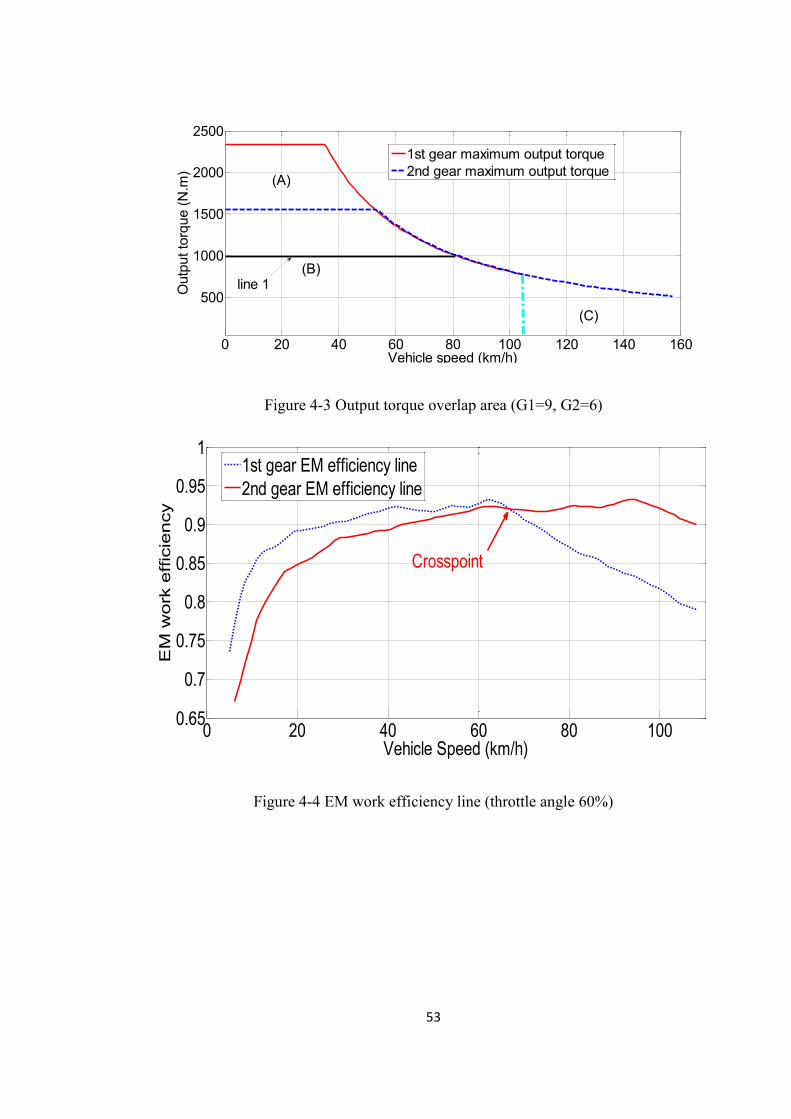
53
Figure 4-3 Output torque overlap area (G1=9, G2=6)
Figure 4-4 EM work efficiency line (throttle angle 60%)
0 20 40 60 80 100 120 140 160
500
1000
1500
2000
2500
Vehicle speed (km/h)
Out
put t
orqu
e (N
.m)
1st gear maximum output torque2nd gear maximum output torque(A)
(C)
(B)line 1
0 20 40 60 80 1000.65
0.7
0.75
0.8
0.85
0.9
0.95
1
Vehicle Speed (km/h)
EM
work
effic
iency
1st gear EM efficiency line2nd gear EM efficiency line
Crosspoint
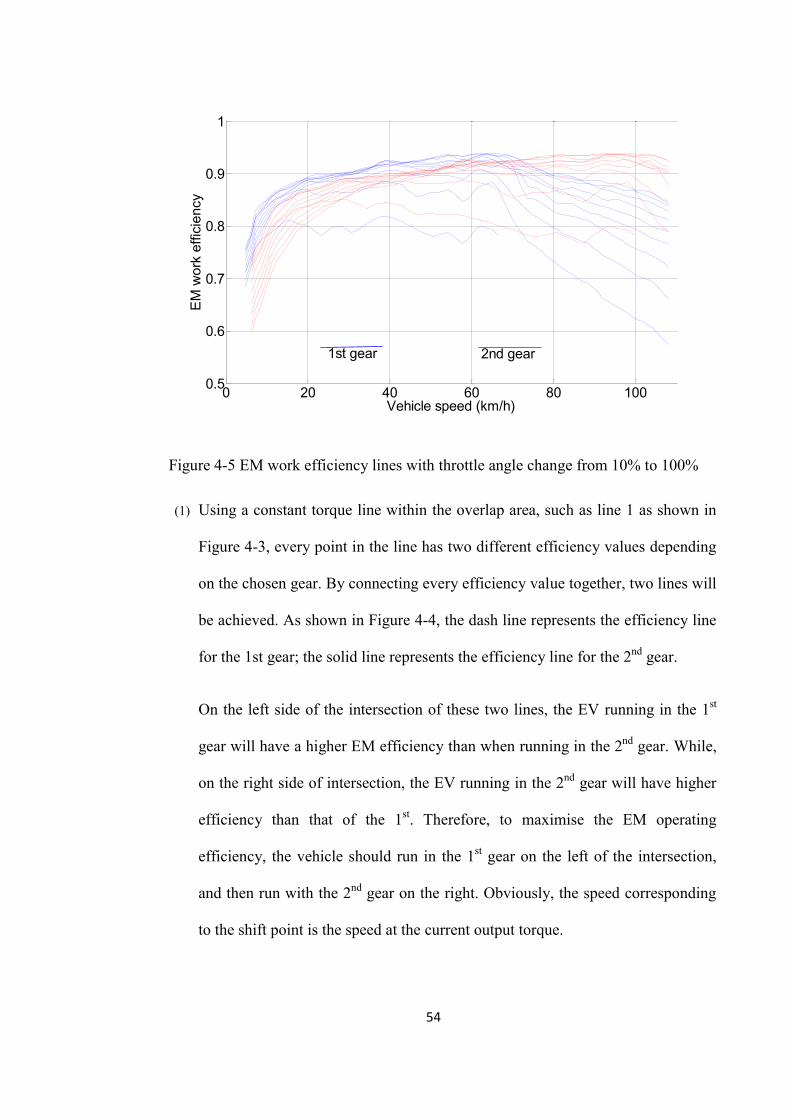
54
Figure 4-5 EM work efficiency lines with throttle angle change from 10% to 100%
(1) Using a constant torque line within the overlap area, such as line 1 as shown in
Figure 4-3, every point in the line has two different efficiency values depending
on the chosen gear. By connecting every efficiency value together, two lines will
be achieved. As shown in Figure 4-4, the dash line represents the efficiency line
for the 1st gear; the solid line represents the efficiency line for the 2nd gear.
On the left side of the intersection of these two lines, the EV running in the 1st
gear will have a higher EM efficiency than when running in the 2nd gear. While,
on the right side of intersection, the EV running in the 2nd gear will have higher
efficiency than that of the 1st. Therefore, to maximise the EM operating
efficiency, the vehicle should run in the 1st gear on the left of the intersection,
and then run with the 2nd gear on the right. Obviously, the speed corresponding
to the shift point is the speed at the current output torque.
0 20 40 60 80 1000.5
0.6
0.7
0.8
0.9
1
Vehicle speed (km/h)
EM
wor
k ef
ficie
ncy
1st gear 2nd gear
55
(2) Moreover, the EV percent throttle angle can be calculated as current output
torque divided by the maximum output torque for the 1st gear or the 2nd gear in a
particular speed. Therefore, every point in the torque line results into two
throttle angles for two gears respectively. For example, a throttle angle with
100% for the 2nd gear is the same as its maximum output torque line, as shown
in Figure 4-3, but the throttle angle for the 1st gear is smaller than 100% when
vehicle speed is smaller than 50 km/h, and it equals 100% when vehicle speed is
larger than 50 km/h.
(3) Therefore, in the overlap area, for a given throttle angle and vehicle the 2nd gear
will produce one intersection point for the downshift, at the same throttle angle
for the 1st gear, while one intersection will be produced for the up shift. It is
necessary to point out that the gear ratio of the 1st gear is assumed to be larger
than that of the 2nd gear. Hence, the maximum output torque for the 2nd gear is
smaller than that of the 1st gear. Therefore, when in the 2nd gear, the throttle
angle can change from zero to 100% in the overlap area, but for the 1st gear, the
throttle angle cannot reach 100% percent post shift.
(4) When the throttle angle for the 2nd gear is varied within the overlap area, as
shown in Figure 4-5, different efficiency lines can be achieved for the 1st and the
2nd gear respectively.
(5) Connecting the shift points achieved in step (4) produces two shift lines, as
shown in Figure 4-9, one for the up shift, and one for the down shift. These two
lines are the shift schedule for the current two gear ratios.
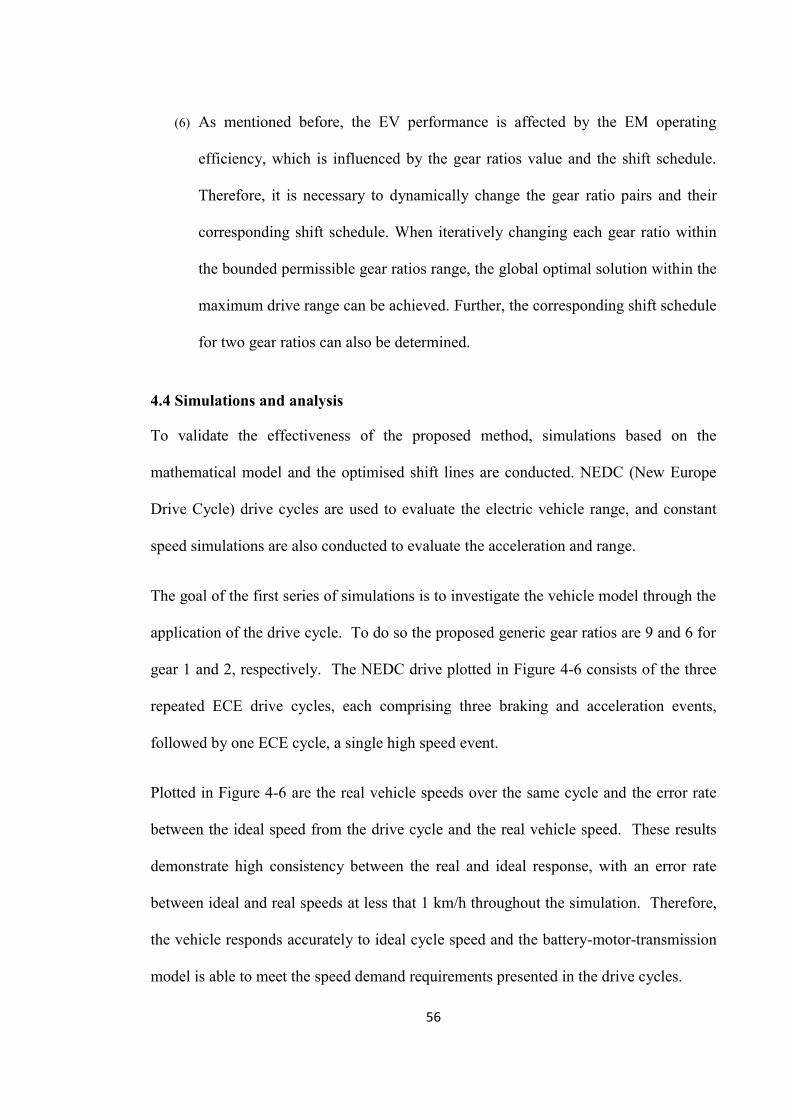
56
(6) As mentioned before, the EV performance is affected by the EM operating
efficiency, which is influenced by the gear ratios value and the shift schedule.
Therefore, it is necessary to dynamically change the gear ratio pairs and their
corresponding shift schedule. When iteratively changing each gear ratio within
the bounded permissible gear ratios range, the global optimal solution within the
maximum drive range can be achieved. Further, the corresponding shift schedule
for two gear ratios can also be determined.
4.4 Simulations and analysis
To validate the effectiveness of the proposed method, simulations based on the
mathematical model and the optimised shift lines are conducted. NEDC (New Europe
Drive Cycle) drive cycles are used to evaluate the electric vehicle range, and constant
speed simulations are also conducted to evaluate the acceleration and range.
The goal of the first series of simulations is to investigate the vehicle model through the
application of the drive cycle. To do so the proposed generic gear ratios are 9 and 6 for
gear 1 and 2, respectively. The NEDC drive plotted in Figure 4-6 consists of the three
repeated ECE drive cycles, each comprising three braking and acceleration events,
followed by one ECE cycle, a single high speed event.
Plotted in Figure 4-6 are the real vehicle speeds over the same cycle and the error rate
between the ideal speed from the drive cycle and the real vehicle speed. These results
demonstrate high consistency between the real and ideal response, with an error rate
between ideal and real speeds at less that 1 km/h throughout the simulation. Therefore,
the vehicle responds accurately to ideal cycle speed and the battery-motor-transmission
model is able to meet the speed demand requirements presented in the drive cycles.
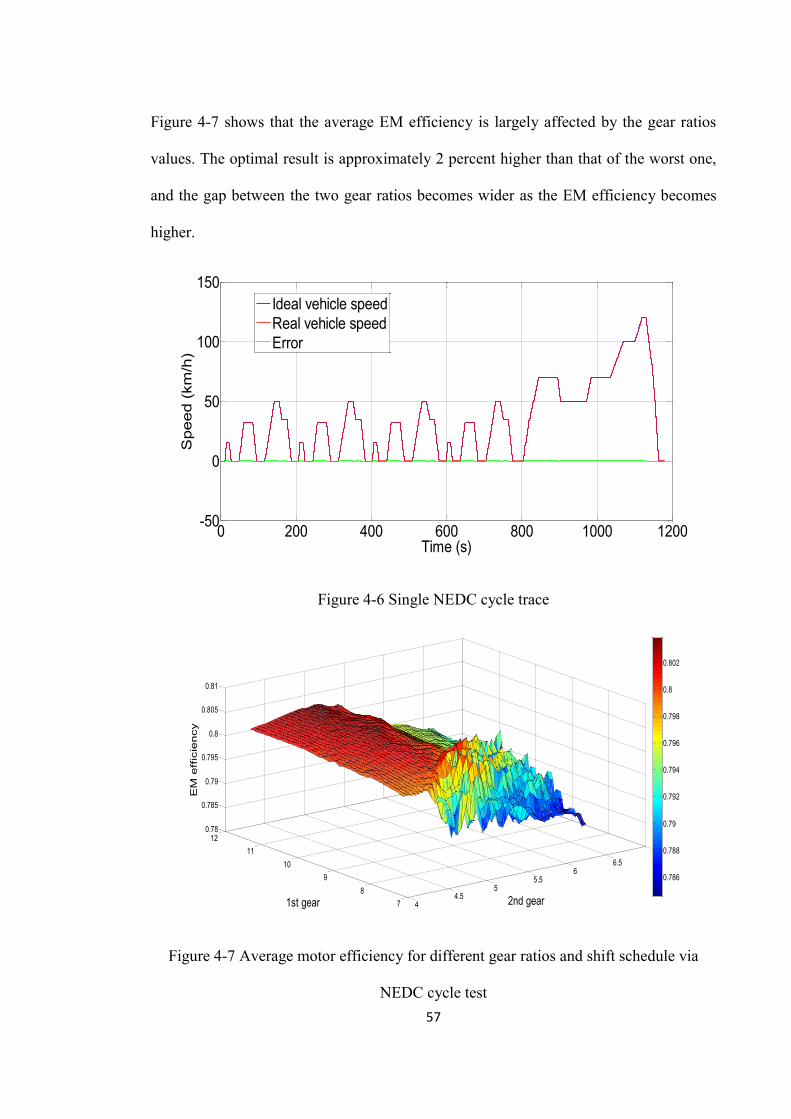
57
Figure 4-7 shows that the average EM efficiency is largely affected by the gear ratios
values. The optimal result is approximately 2 percent higher than that of the worst one,
and the gap between the two gear ratios becomes wider as the EM efficiency becomes
higher.
Figure 4-6 Single NEDC cycle trace
Figure 4-7 Average motor efficiency for different gear ratios and shift schedule via
NEDC cycle test
0 200 400 600 800 1000 1200-50
0
50
100
150
Time (s)
Spe
ed (
km/h
)
Ideal vehicle speedReal vehicle speedError
44.5
55.5
66.5
7
78
910
1112
0.78
0.785
0.79
0.795
0.8
0.805
0.81
2nd gear1st gear
EM
eff
icie
ncy
0.786
0.788
0.79
0.792
0.794
0.796
0.798
0.8
0.802
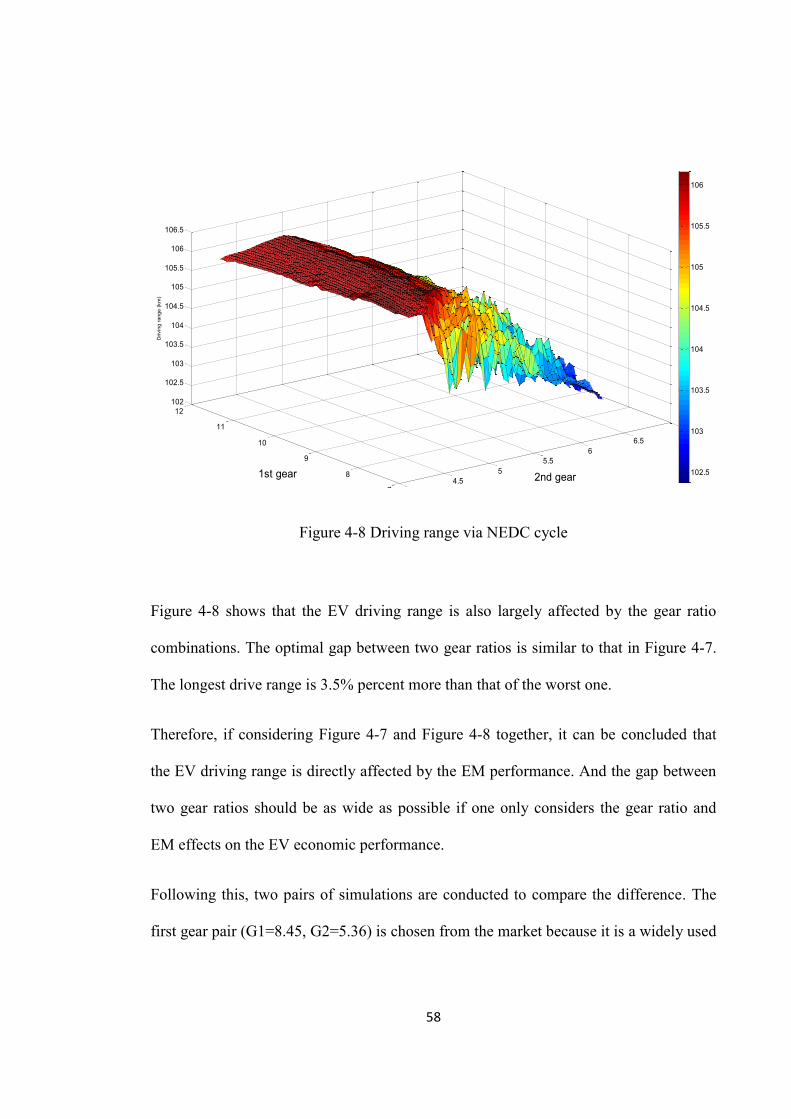
58
Figure 4-8 Driving range via NEDC cycle
Figure 4-8 shows that the EV driving range is also largely affected by the gear ratio
combinations. The optimal gap between two gear ratios is similar to that in Figure 4-7.
The longest drive range is 3.5% percent more than that of the worst one.
Therefore, if considering Figure 4-7 and Figure 4-8 together, it can be concluded that
the EV driving range is directly affected by the EM performance. And the gap between
two gear ratios should be as wide as possible if one only considers the gear ratio and
EM effects on the EV economic performance.
Following this, two pairs of simulations are conducted to compare the difference. The
first gear pair (G1=8.45, G2=5.36) is chosen from the market because it is a widely used
44.5
55.5
66.5
7
7
8
9
10
11
12102
102.5
103
103.5
104
104.5
105
105.5
106
106.5
2nd gear1st gear
Driv
ing
rang
e (k
m)
102.5
103
103.5
104
104.5
105
105.5
106
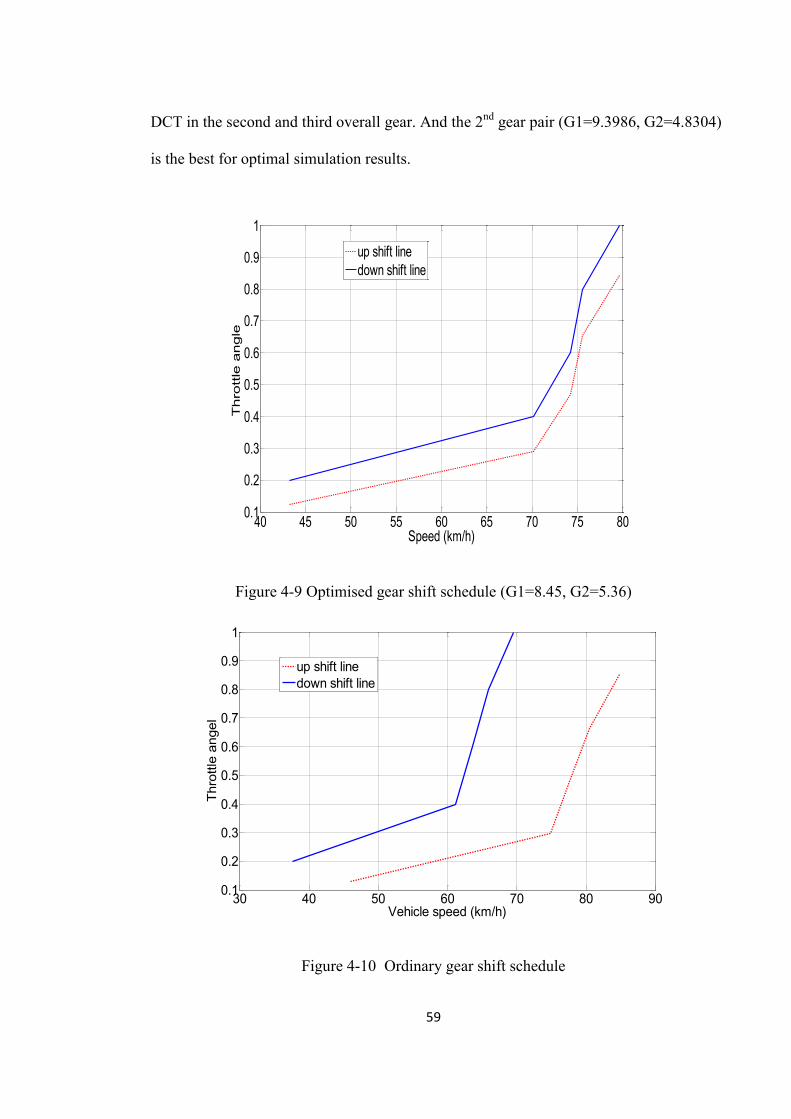
59
DCT in the second and third overall gear. And the 2nd gear pair (G1=9.3986, G2=4.8304)
is the best for optimal simulation results.
Figure 4-9 Optimised gear shift schedule (G1=8.45, G2=5.36)
Figure 4-10 Ordinary gear shift schedule
40 45 50 55 60 65 70 75 800.1
0.2
0.3
0.4
0.5
0.6
0.7
0.8
0.9
1
Speed (km/h)
Thro
ttle
angle
up shift linedown shift line
30 40 50 60 70 80 900.1
0.2
0.3
0.4
0.5
0.6
0.7
0.8
0.9
1
Vehicle speed (km/h)
Thro
ttle
ange
l
up shift linedown shift line
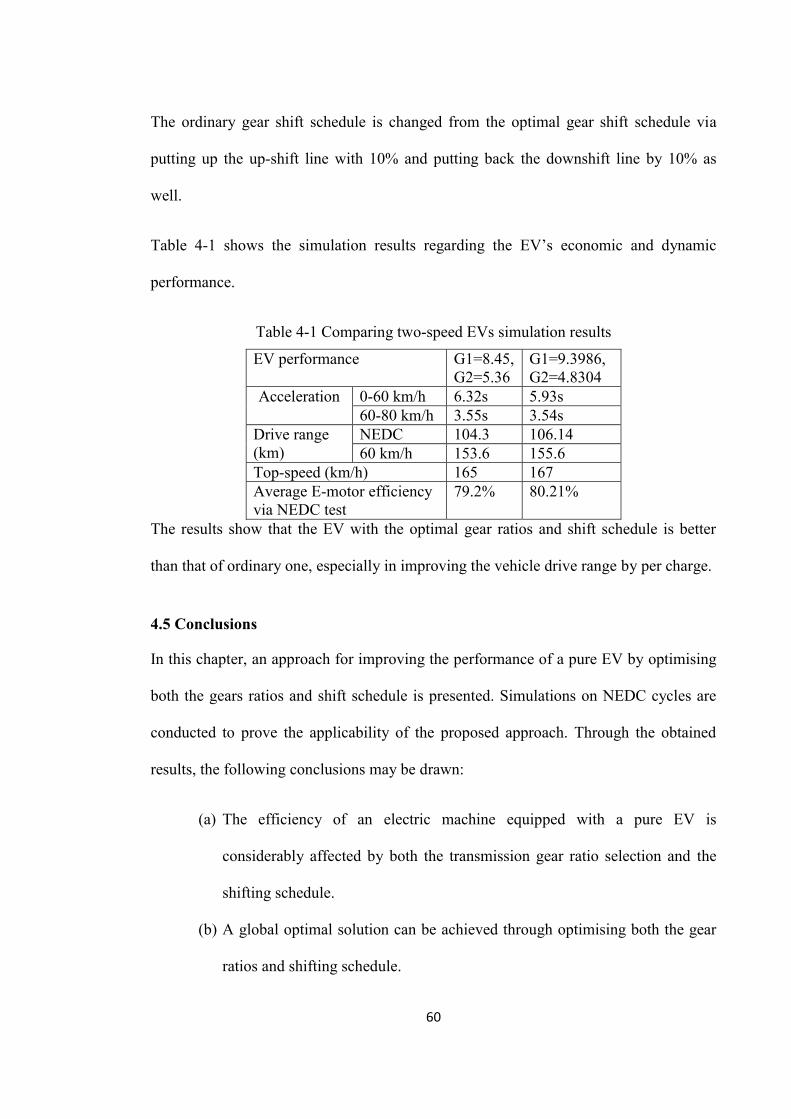
60
The ordinary gear shift schedule is changed from the optimal gear shift schedule via
putting up the up-shift line with 10% and putting back the downshift line by 10% as
well.
Table 4-1 shows the simulation results regarding the EV’s economic and dynamic
performance.
Table 4-1 Comparing two-speed EVs simulation results
EV performance G1=8.45, G2=5.36
G1=9.3986, G2=4.8304
Acceleration 0-60 km/h 6.32s 5.93s 60-80 km/h 3.55s 3.54s
Drive range (km)
NEDC 104.3 106.14 60 km/h 153.6 155.6
Top-speed (km/h) 165 167 Average E-motor efficiency via NEDC test
79.2% 80.21%
The results show that the EV with the optimal gear ratios and shift schedule is better
than that of ordinary one, especially in improving the vehicle drive range by per charge.
4.5 Conclusions
In this chapter, an approach for improving the performance of a pure EV by optimising
both the gears ratios and shift schedule is presented. Simulations on NEDC cycles are
conducted to prove the applicability of the proposed approach. Through the obtained
results, the following conclusions may be drawn:
(a) The efficiency of an electric machine equipped with a pure EV is
considerably affected by both the transmission gear ratio selection and the
shifting schedule.
(b) A global optimal solution can be achieved through optimising both the gear
ratios and shifting schedule.

61
(c) Applying the proposed approach to the design of two-speed transmission
gear ratios and shift schedules, the optimal overall EV economic
performance can be improved by more than 3.5% in comparison with the
worst case scenario, as shown in Figure 4-7.
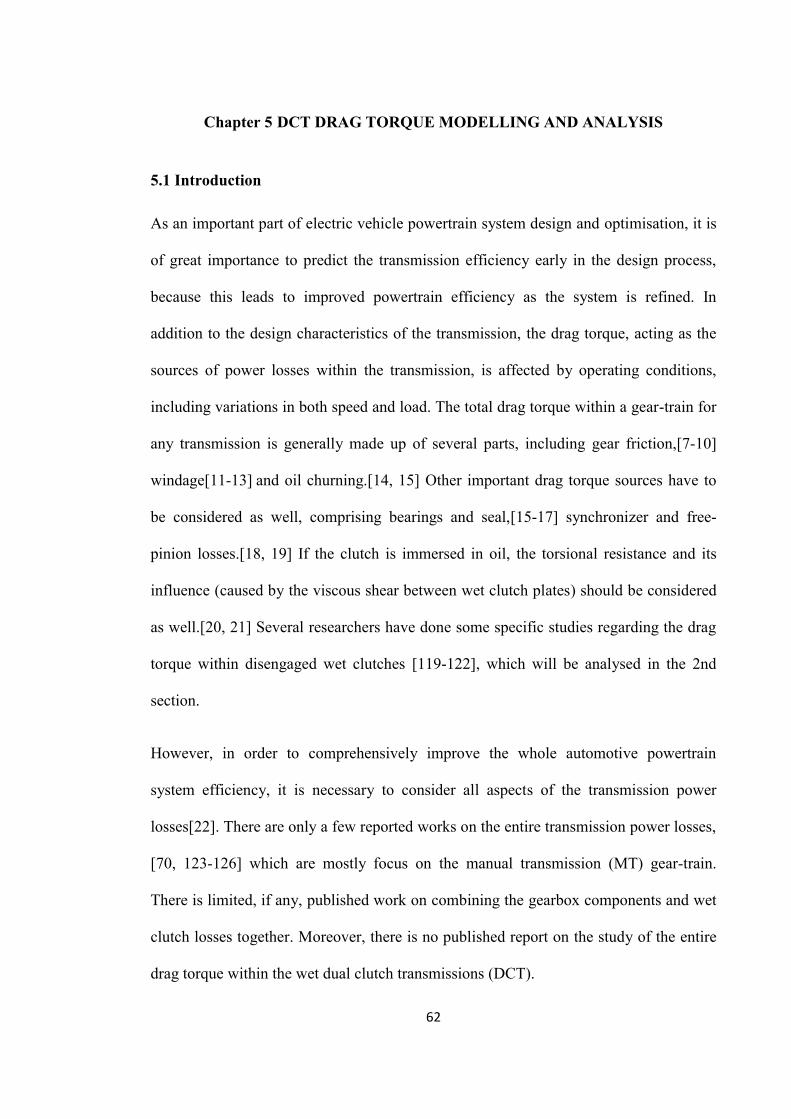
62
Chapter 5 DCT DRAG TORQUE MODELLING AND ANALYSIS
5.1 Introduction
As an important part of electric vehicle powertrain system design and optimisation, it is
of great importance to predict the transmission efficiency early in the design process,
because this leads to improved powertrain efficiency as the system is refined. In
addition to the design characteristics of the transmission, the drag torque, acting as the
sources of power losses within the transmission, is affected by operating conditions,
including variations in both speed and load. The total drag torque within a gear-train for
any transmission is generally made up of several parts, including gear friction,[7-10]
windage[11-13] and oil churning.[14, 15] Other important drag torque sources have to
be considered as well, comprising bearings and seal,[15-17] synchronizer and free-
pinion losses.[18, 19] If the clutch is immersed in oil, the torsional resistance and its
influence (caused by the viscous shear between wet clutch plates) should be considered
as well.[20, 21] Several researchers have done some specific studies regarding the drag
torque within disengaged wet clutches [119-122], which will be analysed in the 2nd
section.
However, in order to comprehensively improve the whole automotive powertrain
system efficiency, it is necessary to consider all aspects of the transmission power
losses[22]. There are only a few reported works on the entire transmission power losses,
[70, 123-126] which are mostly focus on the manual transmission (MT) gear-train.
There is limited, if any, published work on combining the gearbox components and wet
clutch losses together. Moreover, there is no published report on the study of the entire
drag torque within the wet dual clutch transmissions (DCT).
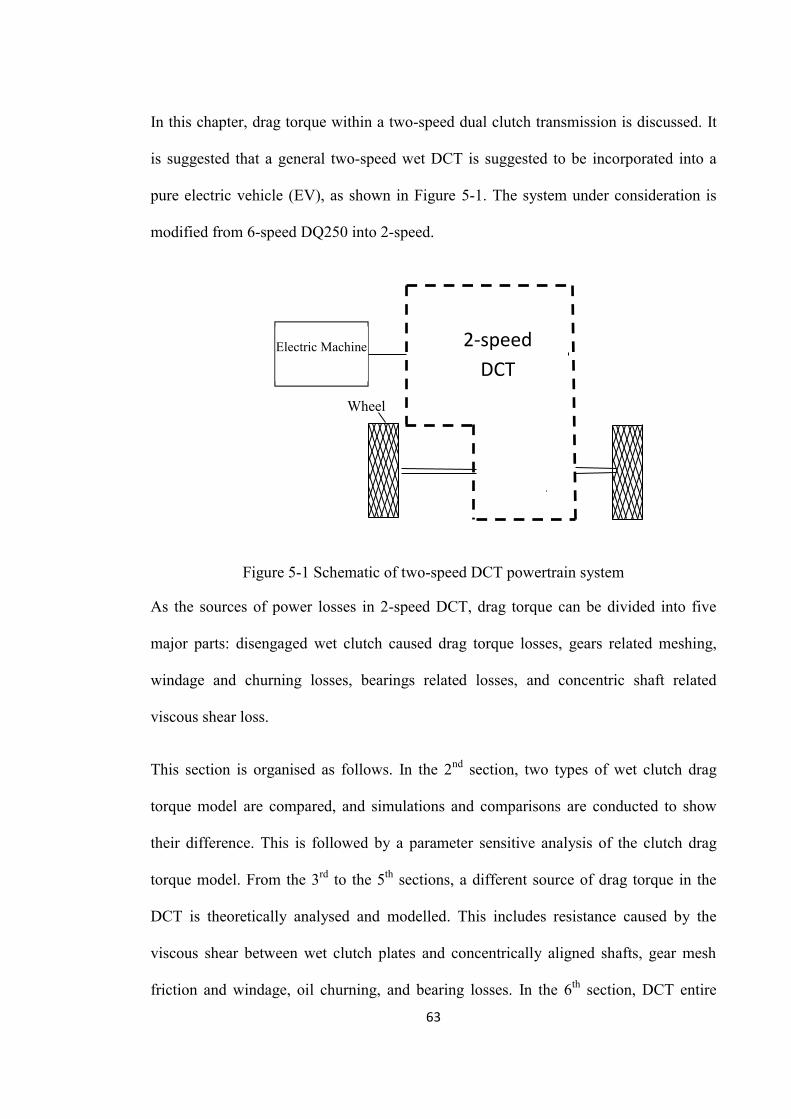
63
In this chapter, drag torque within a two-speed dual clutch transmission is discussed. It
is suggested that a general two-speed wet DCT is suggested to be incorporated into a
pure electric vehicle (EV), as shown in Figure 5-1. The system under consideration is
modified from 6-speed DQ250 into 2-speed.
Figure 5-1 Schematic of two-speed DCT powertrain system
As the sources of power losses in 2-speed DCT, drag torque can be divided into five
major parts: disengaged wet clutch caused drag torque losses, gears related meshing,
windage and churning losses, bearings related losses, and concentric shaft related
viscous shear loss.
This section is organised as follows. In the 2nd section, two types of wet clutch drag
torque model are compared, and simulations and comparisons are conducted to show
their difference. This is followed by a parameter sensitive analysis of the clutch drag
torque model. From the 3rd to the 5th sections, a different source of drag torque in the
DCT is theoretically analysed and modelled. This includes resistance caused by the
viscous shear between wet clutch plates and concentrically aligned shafts, gear mesh
friction and windage, oil churning, and bearing losses. In the 6th section, DCT entire
Electric Machine
Wheel
2-speed DCT
64
drag torque models will be presented. Finally, some significant conclusions drawn from
the study are summarised in the 5th section.
5.2 Drag Torque caused by disengaged wet clutches
The wet clutches usually have two main states: open (disengaged) and closed (engaged).
When the clutch is open and relative speed exists between the input and output clutch
plates, there is drag (hydrodynamic) torque caused by the shear stresses in the oil. The
general relationship between drag torque and angular velocity within input and output
clutches is shown in Figure 5-2. Generally, it is commonly accepted that the drag torque
grows until reaching the peak value with the increase of speed in the low speed range
[17, 20, 119]. After a certain speed, the drag torque will decrease gradually with the
speed continually increasing in the high speed range. This brings about a multi-phase
flow problem which has not been fully understood yet, as it is difficult to measuring the
shape of flow and the associated boundary conditions.
Figure 5-2 General relationship between drag torque and angular velocity
65
The theories for drag torque within wet multi-plate clutches have been discussed by
several authors. In 1984, the governing equations presented by Hashimoto[17] describe
the flow between adjacent flat rotating plates and this laid down a frame work for
subsequent clutch studies. Then Kato et al. [20] explained how oil film shrank between
two adjacent clutch plates as the result of centrifugal force. This study is widely
accepted and referred to. Kitabayashi et al.[80] provides a demonstration of the drag
torque which is accurate in the low speed ranges, but it is poor in terms of predicting
drag torque in the high speed range as it can only show the rising portion of a typical
drag torque curve in the low speed range when the clearance if full of oil film. It was
demonstrated by Yuan et al. [81, 120] using the commercial computational fluid
dynamics (CFD) code FLUENT. Then based on Navier-Stokes equations, Aphale et al.
drove a mathematical model and evaluated it with FLUENT and Experimets [82]. A
numerical study based on laminar flow to determine the intergral area was conducted
by Hu et al. [122], and experiments were employed to investigate it. Then Li et al. [127]
improved Hu’s drag torque model considering the shrinking film with equivalent radius.
As Yuan et al.[81] provides an improved model which has reasonable accuracy at both
low and high speeds primarily using CFD model verification, this drag torque model has
been chosen as one of the typical drag torque models. Another typical drag torque
model is the shrinking film model, which is conducted by Li et al. [127] and this is
based on analytical and experimental investigation.
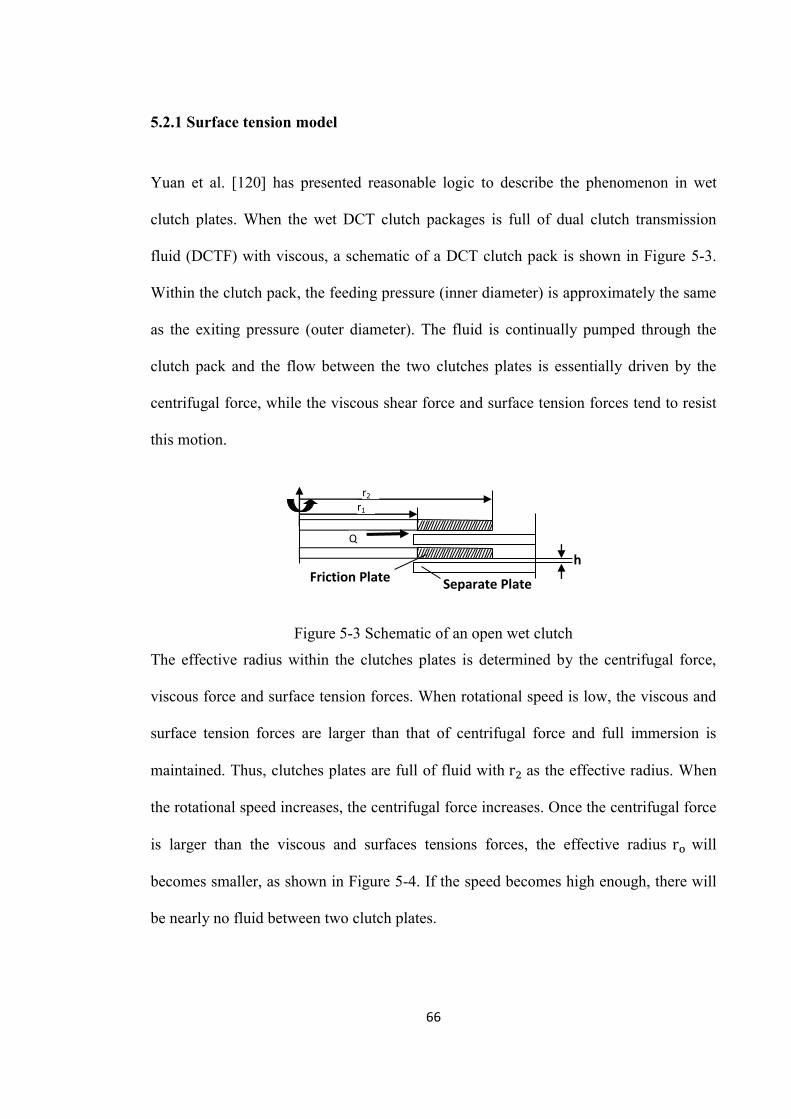
66
5.2.1 Surface tension model
Yuan et al. [120] has presented reasonable logic to describe the phenomenon in wet
clutch plates. When the wet DCT clutch packages is full of dual clutch transmission
fluid (DCTF) with viscous, a schematic of a DCT clutch pack is shown in Figure 5-3.
Within the clutch pack, the feeding pressure (inner diameter) is approximately the same
as the exiting pressure (outer diameter). The fluid is continually pumped through the
clutch pack and the flow between the two clutches plates is essentially driven by the
centrifugal force, while the viscous shear force and surface tension forces tend to resist
this motion.
Figure 5-3 Schematic of an open wet clutch
The effective radius within the clutches plates is determined by the centrifugal force,
viscous force and surface tension forces. When rotational speed is low, the viscous and
surface tension forces are larger than that of centrifugal force and full immersion is
maintained. Thus, clutches plates are full of fluid with r as the effective radius. When
the rotational speed increases, the centrifugal force increases. Once the centrifugal force
is larger than the viscous and surfaces tensions forces, the effective radius r will
becomes smaller, as shown in Figure 5-4. If the speed becomes high enough, there will
be nearly no fluid between two clutch plates.
h
Separate Plate Friction Plate
Q
r1 r2
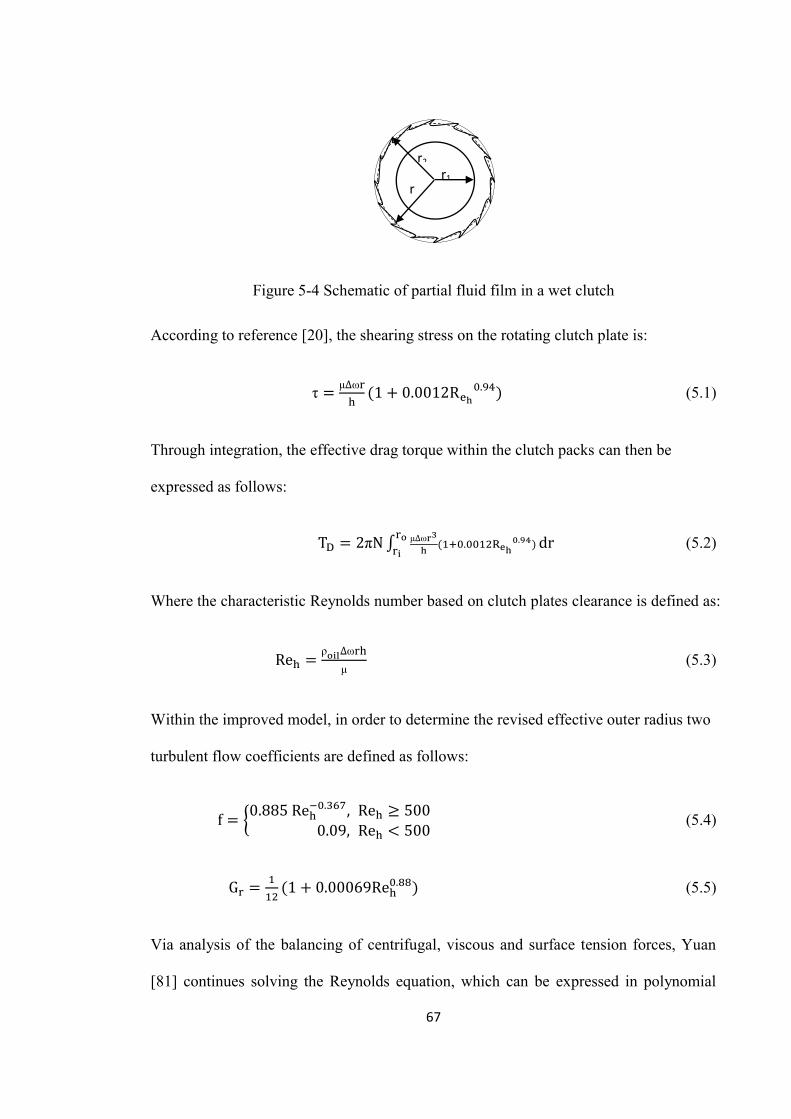
67
Figure 5-4 Schematic of partial fluid film in a wet clutch
According to reference [20], the shearing stress on the rotating clutch plate is:
τ = μ∆ω (1 + 0.0012R . ) (5.1)
Through integration, the effective drag torque within the clutch packs can then be
expressed as follows:
T = 2πN ∫ μ∆ω ( . . ) dr (5.2)
Where the characteristic Reynolds number based on clutch plates clearance is defined as:
Re = ρ ∆ωμ
(5.3)
Within the improved model, in order to determine the revised effective outer radius two
turbulent flow coefficients are defined as follows:
f = 0.885 Re . , Re ≥ 5000.09, Re < 500
(5.4)
G = (1 + 0.00069Re . ) (5.5)
Via analysis of the balancing of centrifugal, viscous and surface tension forces, Yuan
[81] continues solving the Reynolds equation, which can be expressed in polynomial
r1 r2
r
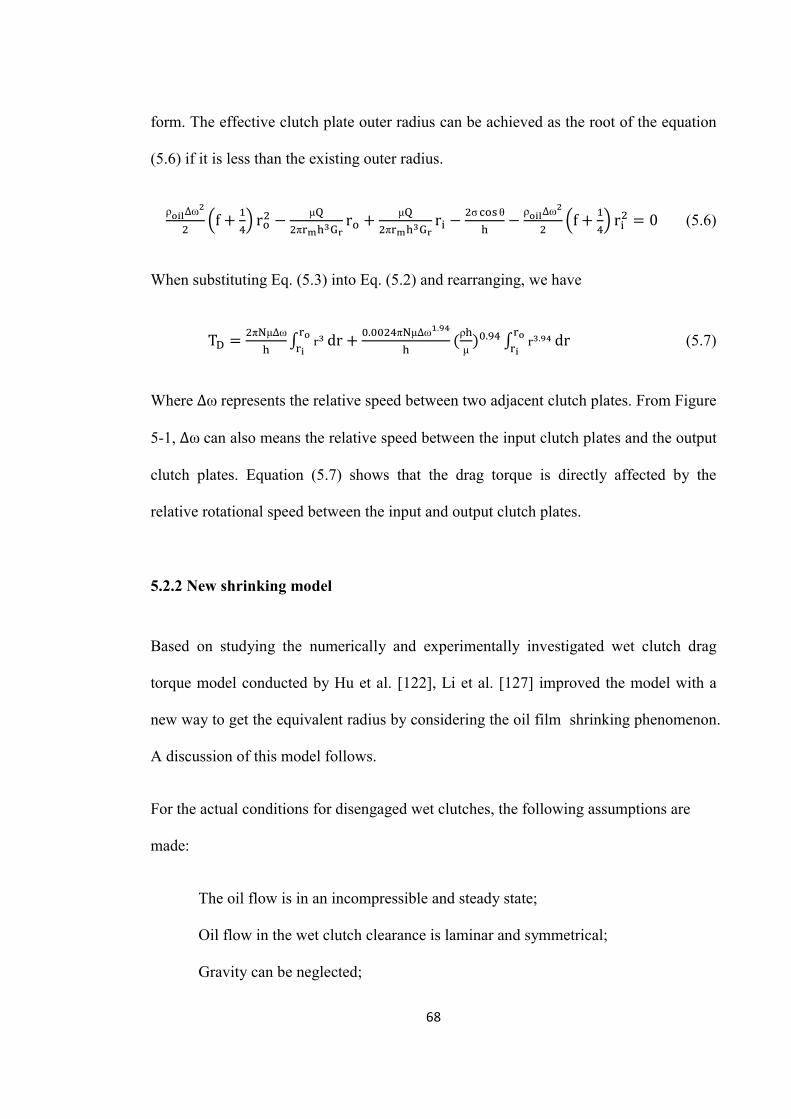
68
form. The effective clutch plate outer radius can be achieved as the root of the equation
(5.6) if it is less than the existing outer radius.
ρ ∆ω f + r − μπ
r + μπ
r − σ θ − ρ ∆ω f + r = 0 (5.6)
When substituting Eq. (5.3) into Eq. (5.2) and rearranging, we have
T = π μ∆ω ∫ dr + . π μ∆ω .(ρμ
) . ∫ . dr (5.7)
Where ∆ω represents the relative speed between two adjacent clutch plates. From Figure
5-1, ∆ω can also means the relative speed between the input clutch plates and the output
clutch plates. Equation (5.7) shows that the drag torque is directly affected by the
relative rotational speed between the input and output clutch plates.
5.2.2 New shrinking model
Based on studying the numerically and experimentally investigated wet clutch drag
torque model conducted by Hu et al. [122], Li et al. [127] improved the model with a
new way to get the equivalent radius by considering the oil film shrinking phenomenon.
A discussion of this model follows.
For the actual conditions for disengaged wet clutches, the following assumptions are
made:
The oil flow is in an incompressible and steady state;
Oil flow in the wet clutch clearance is laminar and symmetrical;
Gravity can be neglected;
69
Thus according to these assumptions, the oil flow has the following equations:
= 0, θ = 0, = 0, V (5.8)
According to the above assumptions, the Navier-Stokes equations in a cylindrical
coordinate system can be simplified as follows from Chang [128]:
ρ V − θ + = μ (5.9)
ρ V θ + θ = θ (5.10)
= 0 (5.11)
Where, ρ is the density of oil, μ is the viscosity of the oil, p is the pressure of the oil.
( , )( , )
θ( , ) ω,θ( , )
( ) ( )
(5.12)
If we name the left side of Eq. (5.9) and (5.10) as, M , M respectively, then
M = μ (5.13)
M = θ (5.14)
Integrating equation of Eq. (5.13) and Eq. (5.14), and considering the boundary
conditions mentioned in Eq. (5.12), then
V = ( ) (5.15)
70
Vθ = ω + − M hz (5.16)
As clutches clearances are quite small, thus
Vθ =≈ ω (5.17)
The average flow velocity along the radial direction V _ through the clutch plate’s
clearance can be calculated as follows:
V _ = ∫ V dz (5.18)
Substitute Eq. (5.15) into Eq. (5.18), then
V _ = − (5.19)
And the average flow velocity along the radial velocity can also be calculated as:
V _ =π
(5.20)
Compare Eq. (5.19) and Eq. (5.20), then
M = −π
(5.21)
Substitute Eq. (5.21) into Eq.(5.15), and the flow velocity along the radial direction is
V = −π
(z − zh) (5.22)
In addition, the continuous equation is:
(rV ) = 0 (5.23)
It is clear that Eq. (5.22) satisfies the continuous equation Eq. (5.23).
71
Substitute Eq. (5.17) and Eq. (5.22) into Eq. (5.9), then
ρ ( )π
r − (ω ) r + = μ (5.24)
Integrate both sides of Eq. (5.24) along the vertical (height) direction, and considering
the boundary conditions, and then the oil radial speed can be obtained as:
V =μ
(z − zh) + ρωμ
(zh − z ) + ρπ μ
(zh − 2z + 6z h − 5z h)
(5.25)
Q = ∫ ∫ V r dz dθπ (5.26)
Substitute Eq. (5.25) into Eq. (5.26) and rearrange, then
Q = − πμ
+ πρωμ
+ ρπμ
(5.27)
Then the radial oil pressure can be achieved via integrating Eq. (5.27) along the radial
direction which applies to with the boundary conditions:
p(r) = − μπ
ln r + ρω r − ρπ
r + C (5.28)
Eq. (5.28) shows that the radial oil pressure is affected by geometry parametersR , h, oil
parametersρ, μ, and flow rate, angular velocity, ω. And Eq. (5.28) can be viewed as
being made up of three parts; the first is caused by steady flow, the second caused by
centrifugal force, and the third one by flow inertia.
In most of the existing published works [17, 20, 21, 81, 82, 119, 120], the input and
output pressure is assumed to be approximately the same except Heyan Li[127], which
72
considers the pressure difference between the input and output of the friction pair as
follows:
p(r) − p(R ) = ∇p (5.29)
Substitute Eq. (5.28) into Eq. (5.29), when the clearance is full of oil film, i.e., r = R ,
and the required input flow rate can be obtained (one of the quadratic equation)
Q =μ
π( μπ
)ρ ω ρ ∇
πρ
π
(5.30)
Therefore Eq. (5.30) (another solution is negative, it cannot reach real conditions, hence
it is discarded here) can be used to calculate the required input flow rate to enable the
clearance to be full of oil film. It shows that the demanded input flow is influenced by
the angular speed of the clutches. A trending figure to show the needed flow rate can be
plotted by simulation. This appears at Figure 5-5.
As shown in Figure 5-5, the required input flow for full oil film between clutch plates
grows with an increase to the clutch plate’s speed. However, in the experiment, the
actual flow rate is constant. Therefore, the oil film will shrink when the flow rate can
not meet the required flow rate with an increase in the speed. Then define the required
flow rate asQ, the actual flow rate is Q , and the effective outer oil film radius as R .
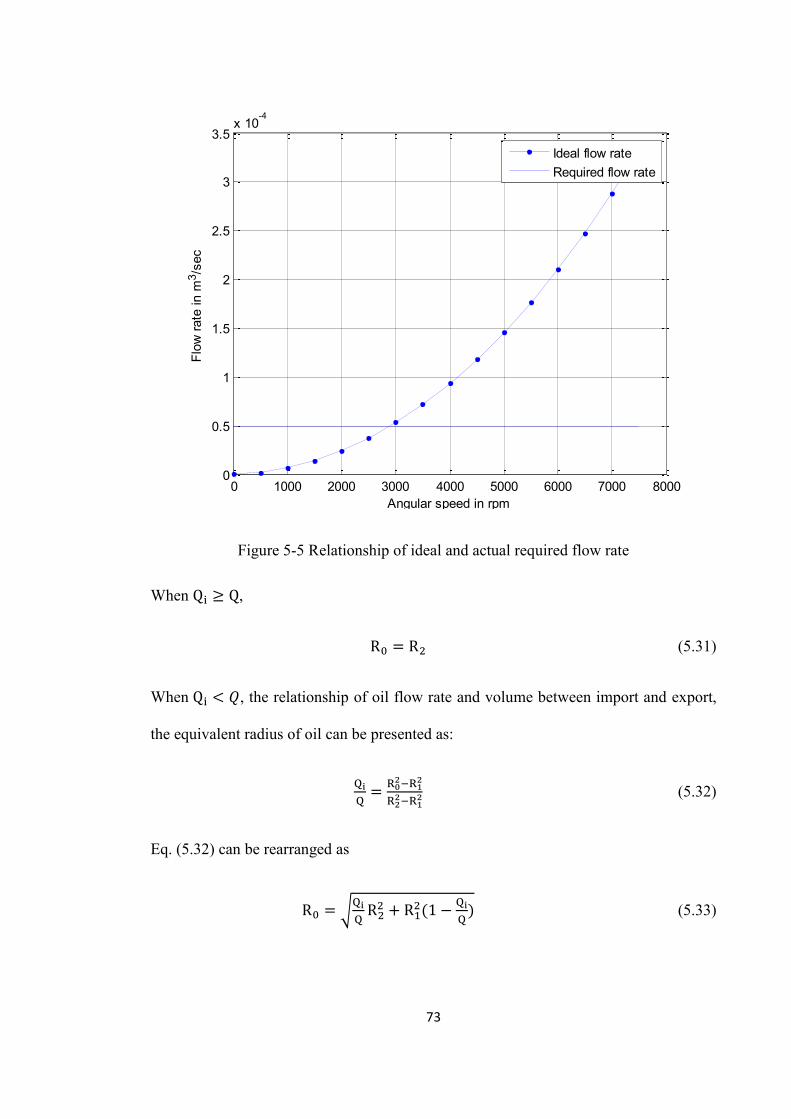
73
Figure 5-5 Relationship of ideal and actual required flow rate
When Q ≥ Q,
R = R (5.31)
When Q < 𝑄, the relationship of oil flow rate and volume between import and export,
the equivalent radius of oil can be presented as:
= (5.32)
Eq. (5.32) can be rearranged as
R = R + R (1 − ) (5.33)
0 1000 2000 3000 4000 5000 6000 7000 80000
0.5
1
1.5
2
2.5
3
3.5x 10
-4
Angular speed in rpm
Flow
rate
in m
3 /se
c
Ideal flow rateRequired flow rate
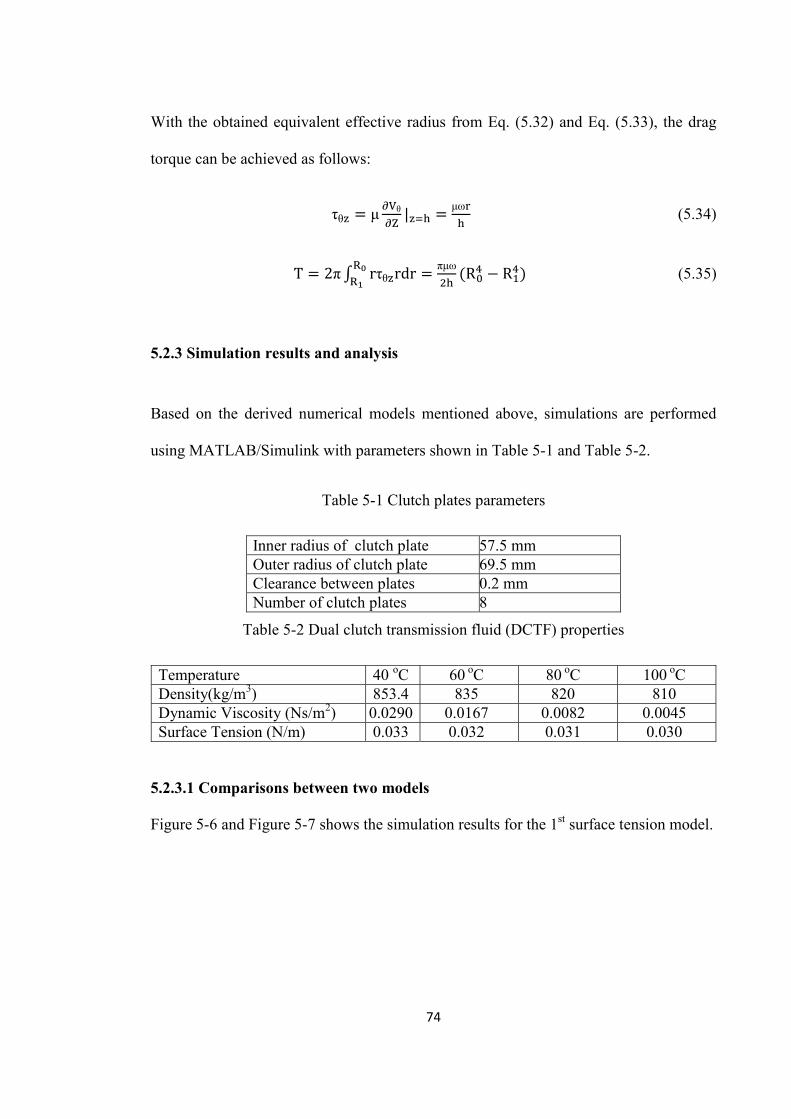
74
With the obtained equivalent effective radius from Eq. (5.32) and Eq. (5.33), the drag
torque can be achieved as follows:
τθ = μ θ | = μω (5.34)
T = 2π∫ rτθ rdr = πμω (R − R ) (5.35)
5.2.3 Simulation results and analysis
Based on the derived numerical models mentioned above, simulations are performed
using MATLAB/Simulink with parameters shown in Table 5-1 and Table 5-2.
Table 5-1 Clutch plates parameters
Inner radius of clutch plate 57.5 mm Outer radius of clutch plate 69.5 mm Clearance between plates 0.2 mm Number of clutch plates 8
Table 5-2 Dual clutch transmission fluid (DCTF) properties
Temperature 40 oC 60 oC 80 oC 100 oC Density(kg/m3) 853.4 835 820 810 Dynamic Viscosity (Ns/m2) 0.0290 0.0167 0.0082 0.0045 Surface Tension (N/m) 0.033 0.032 0.031 0.030
5.2.3.1 Comparisons between two models
Figure 5-6 and Figure 5-7 shows the simulation results for the 1st surface tension model.
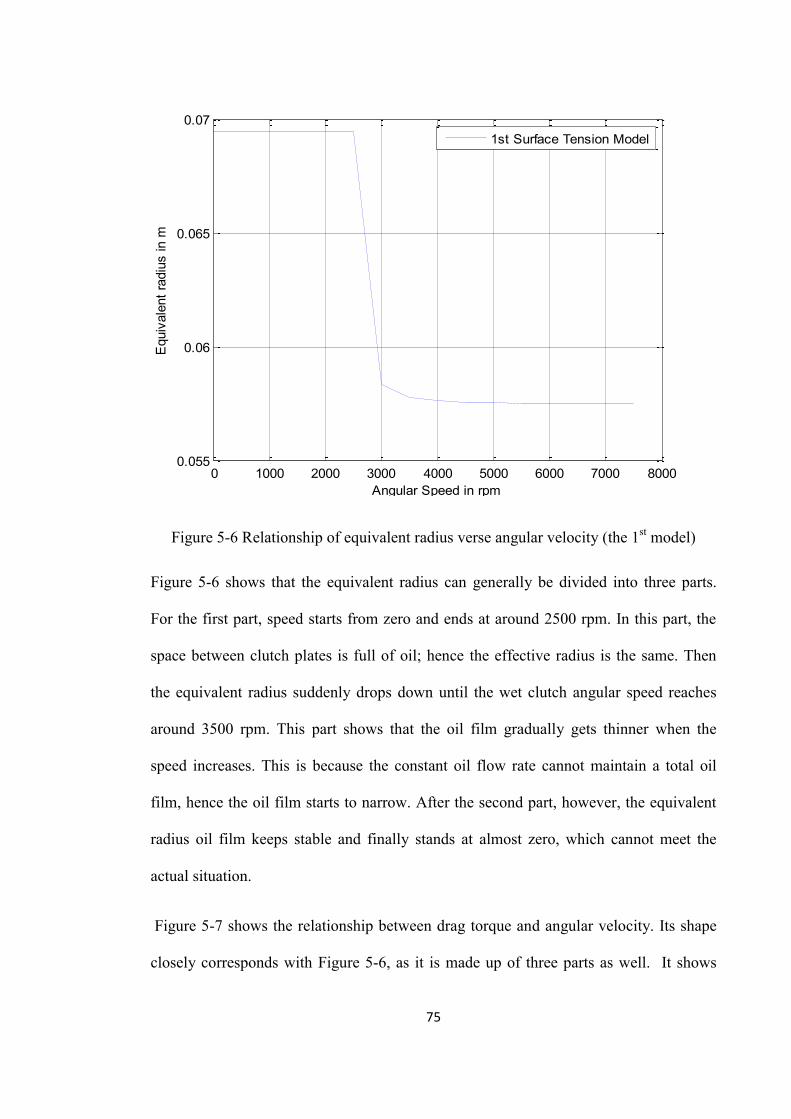
75
Figure 5-6 Relationship of equivalent radius verse angular velocity (the 1st model)
Figure 5-6 shows that the equivalent radius can generally be divided into three parts.
For the first part, speed starts from zero and ends at around 2500 rpm. In this part, the
space between clutch plates is full of oil; hence the effective radius is the same. Then
the equivalent radius suddenly drops down until the wet clutch angular speed reaches
around 3500 rpm. This part shows that the oil film gradually gets thinner when the
speed increases. This is because the constant oil flow rate cannot maintain a total oil
film, hence the oil film starts to narrow. After the second part, however, the equivalent
radius oil film keeps stable and finally stands at almost zero, which cannot meet the
actual situation.
Figure 5-7 shows the relationship between drag torque and angular velocity. Its shape
closely corresponds with Figure 5-6, as it is made up of three parts as well. It shows
0 1000 2000 3000 4000 5000 6000 7000 80000.055
0.06
0.065
0.07
Angular Speed in rpm
Equ
ival
ent r
adiu
s in
m
1st Surface Tension Model
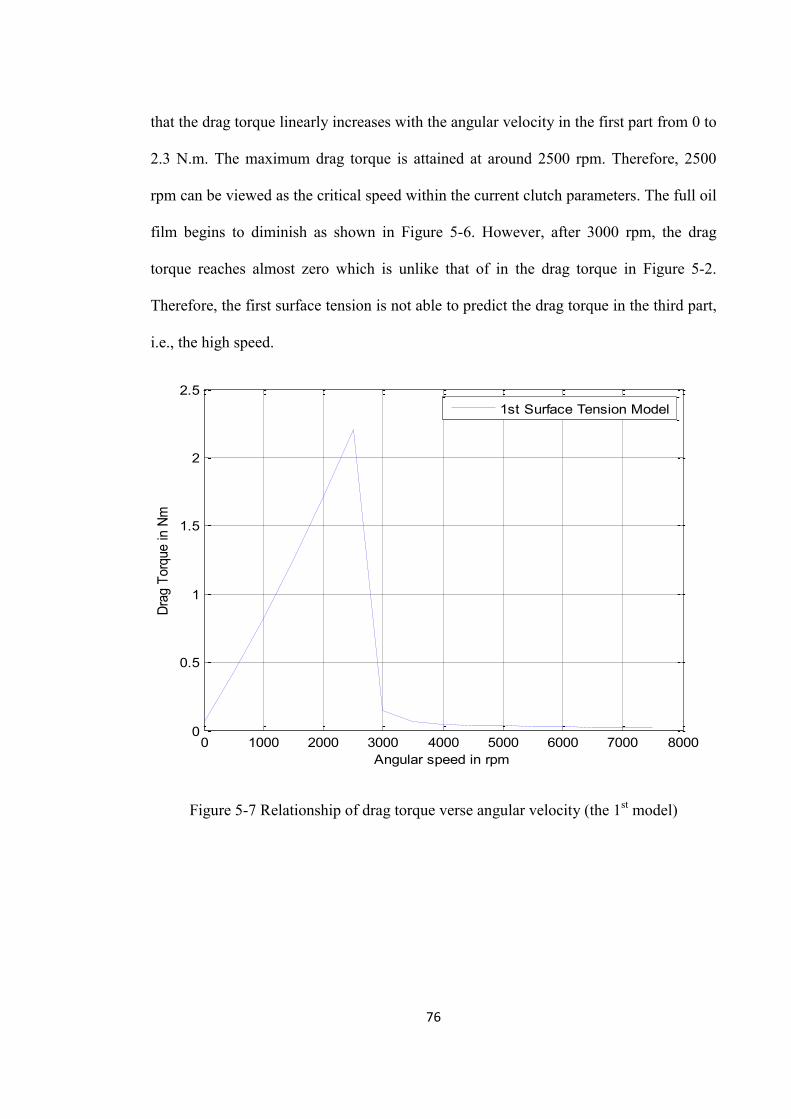
76
that the drag torque linearly increases with the angular velocity in the first part from 0 to
2.3 N.m. The maximum drag torque is attained at around 2500 rpm. Therefore, 2500
rpm can be viewed as the critical speed within the current clutch parameters. The full oil
film begins to diminish as shown in Figure 5-6. However, after 3000 rpm, the drag
torque reaches almost zero which is unlike that of in the drag torque in Figure 5-2.
Therefore, the first surface tension is not able to predict the drag torque in the third part,
i.e., the high speed.
Figure 5-7 Relationship of drag torque verse angular velocity (the 1st model)
0 1000 2000 3000 4000 5000 6000 7000 80000
0.5
1
1.5
2
2.5
Angular speed in rpm
Drag
Tor
que
in N
m
1st Surface Tension Model
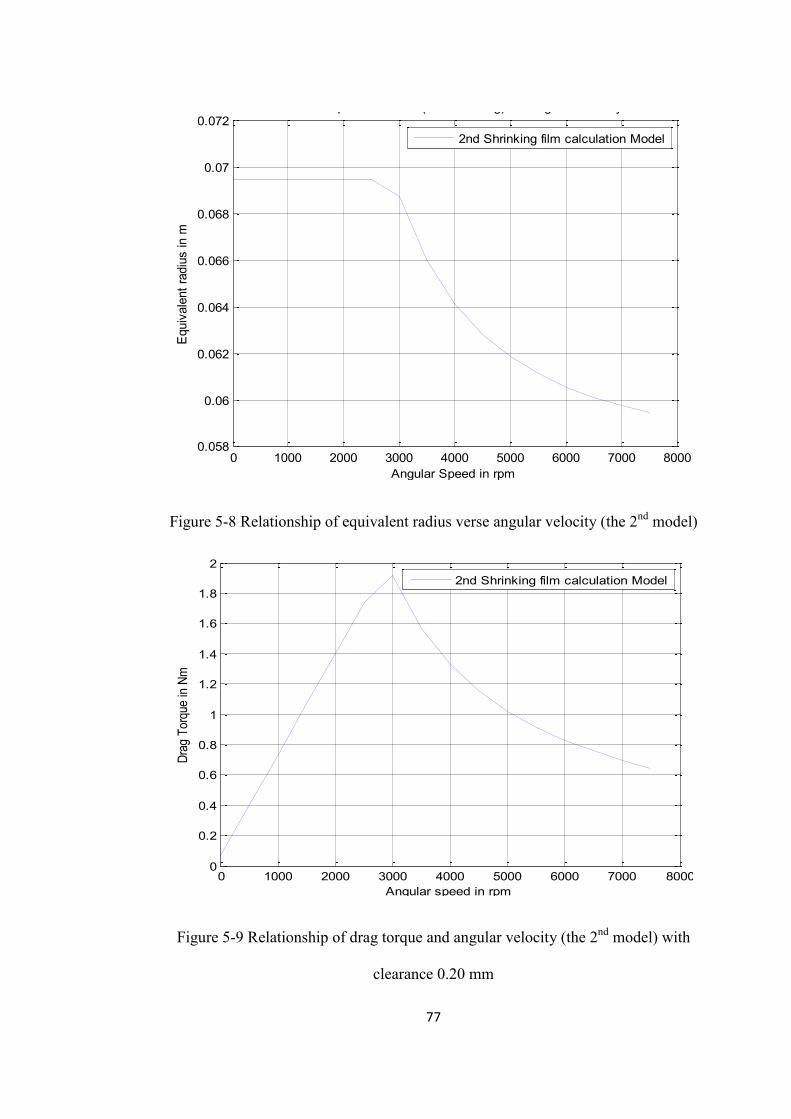
77
Figure 5-8 Relationship of equivalent radius verse angular velocity (the 2nd model)
Figure 5-9 Relationship of drag torque and angular velocity (the 2nd model) with
clearance 0.20 mm
0 1000 2000 3000 4000 5000 6000 7000 80000.058
0.06
0.062
0.064
0.066
0.068
0.07
0.072q ( g) g y
Angular Speed in rpm
Equi
vale
nt ra
dius
in m
2nd Shrinking film calculation Model
0 1000 2000 3000 4000 5000 6000 7000 80000
0.2
0.4
0.6
0.8
1
1.2
1.4
1.6
1.8
2g g y
Angular speed in rpm
Drag
Tor
que
in Nm
2nd Shrinking film calculation Model
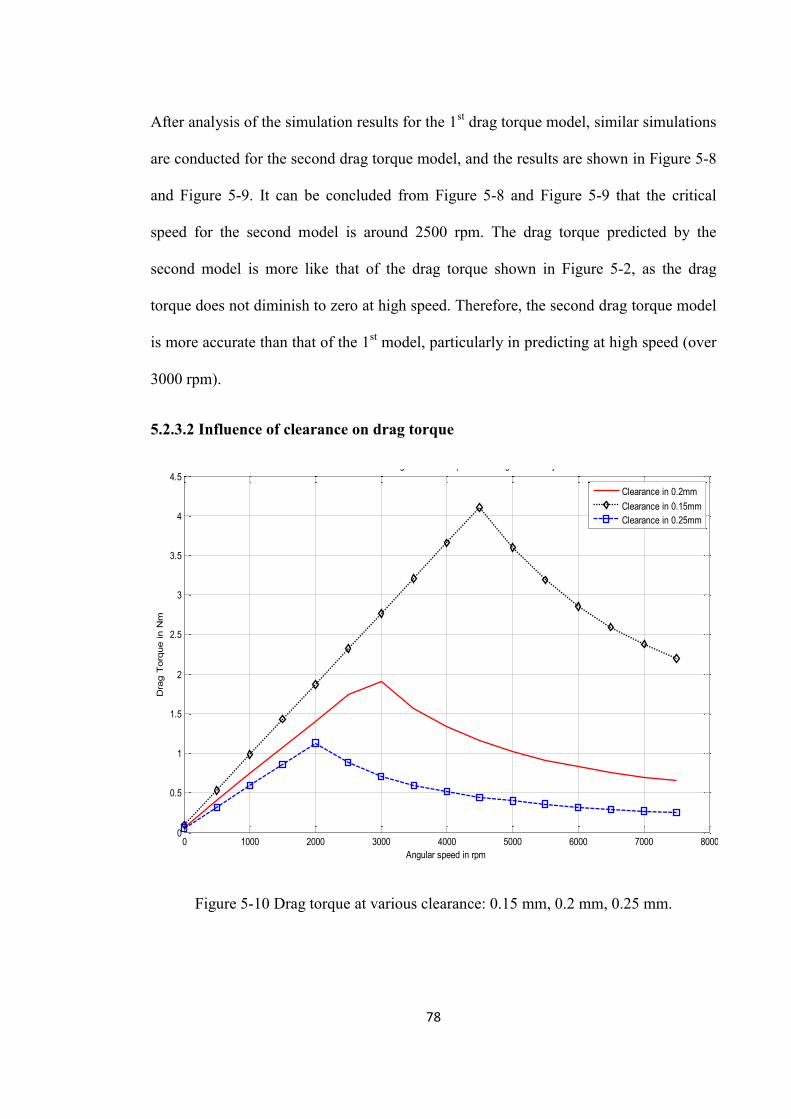
78
After analysis of the simulation results for the 1st drag torque model, similar simulations
are conducted for the second drag torque model, and the results are shown in Figure 5-8
and Figure 5-9. It can be concluded from Figure 5-8 and Figure 5-9 that the critical
speed for the second model is around 2500 rpm. The drag torque predicted by the
second model is more like that of the drag torque shown in Figure 5-2, as the drag
torque does not diminish to zero at high speed. Therefore, the second drag torque model
is more accurate than that of the 1st model, particularly in predicting at high speed (over
3000 rpm).
5.2.3.2 Influence of clearance on drag torque
Figure 5-10 Drag torque at various clearance: 0.15 mm, 0.2 mm, 0.25 mm.
0 1000 2000 3000 4000 5000 6000 7000 80000
0.5
1
1.5
2
2.5
3
3.5
4
4.5g p g y
Angular speed in rpm
Dra
g T
orqu
e in
Nm
Clearance in 0.2mmClearance in 0.15mmClearance in 0.25mm
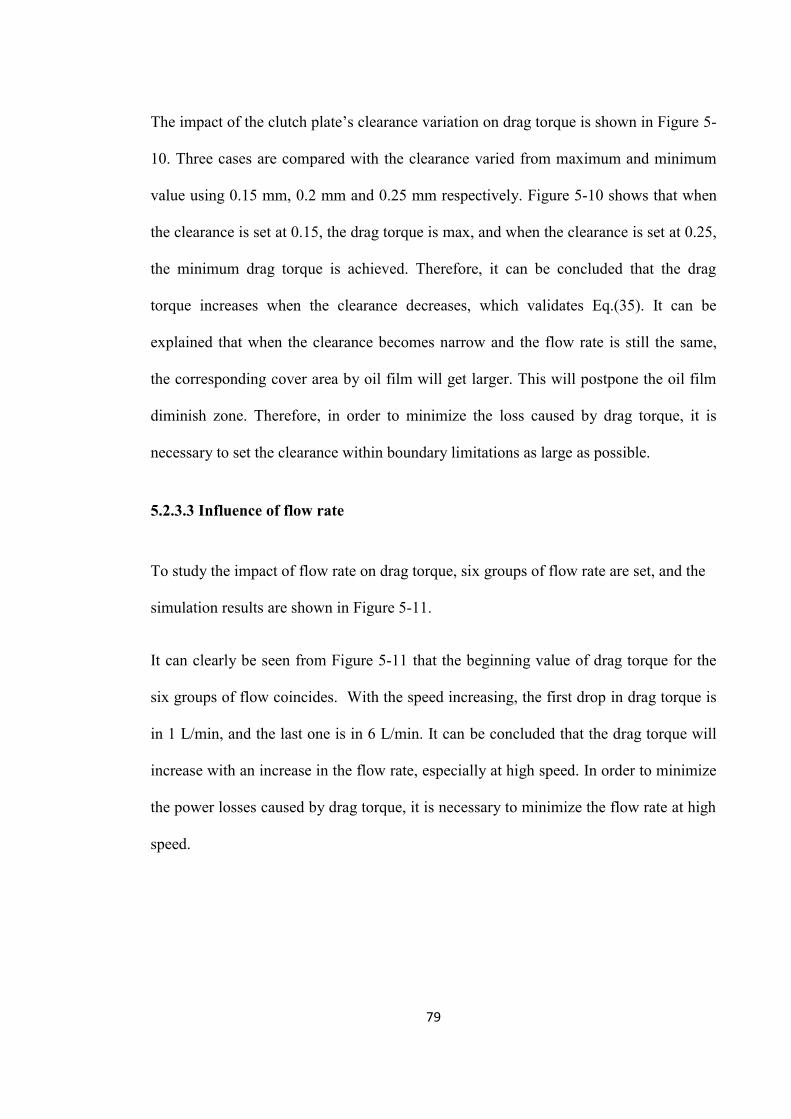
79
The impact of the clutch plate’s clearance variation on drag torque is shown in Figure 5-
10. Three cases are compared with the clearance varied from maximum and minimum
value using 0.15 mm, 0.2 mm and 0.25 mm respectively. Figure 5-10 shows that when
the clearance is set at 0.15, the drag torque is max, and when the clearance is set at 0.25,
the minimum drag torque is achieved. Therefore, it can be concluded that the drag
torque increases when the clearance decreases, which validates Eq.(35). It can be
explained that when the clearance becomes narrow and the flow rate is still the same,
the corresponding cover area by oil film will get larger. This will postpone the oil film
diminish zone. Therefore, in order to minimize the loss caused by drag torque, it is
necessary to set the clearance within boundary limitations as large as possible.
5.2.3.3 Influence of flow rate
To study the impact of flow rate on drag torque, six groups of flow rate are set, and the
simulation results are shown in Figure 5-11.
It can clearly be seen from Figure 5-11 that the beginning value of drag torque for the
six groups of flow coincides. With the speed increasing, the first drop in drag torque is
in 1 L/min, and the last one is in 6 L/min. It can be concluded that the drag torque will
increase with an increase in the flow rate, especially at high speed. In order to minimize
the power losses caused by drag torque, it is necessary to minimize the flow rate at high
speed.
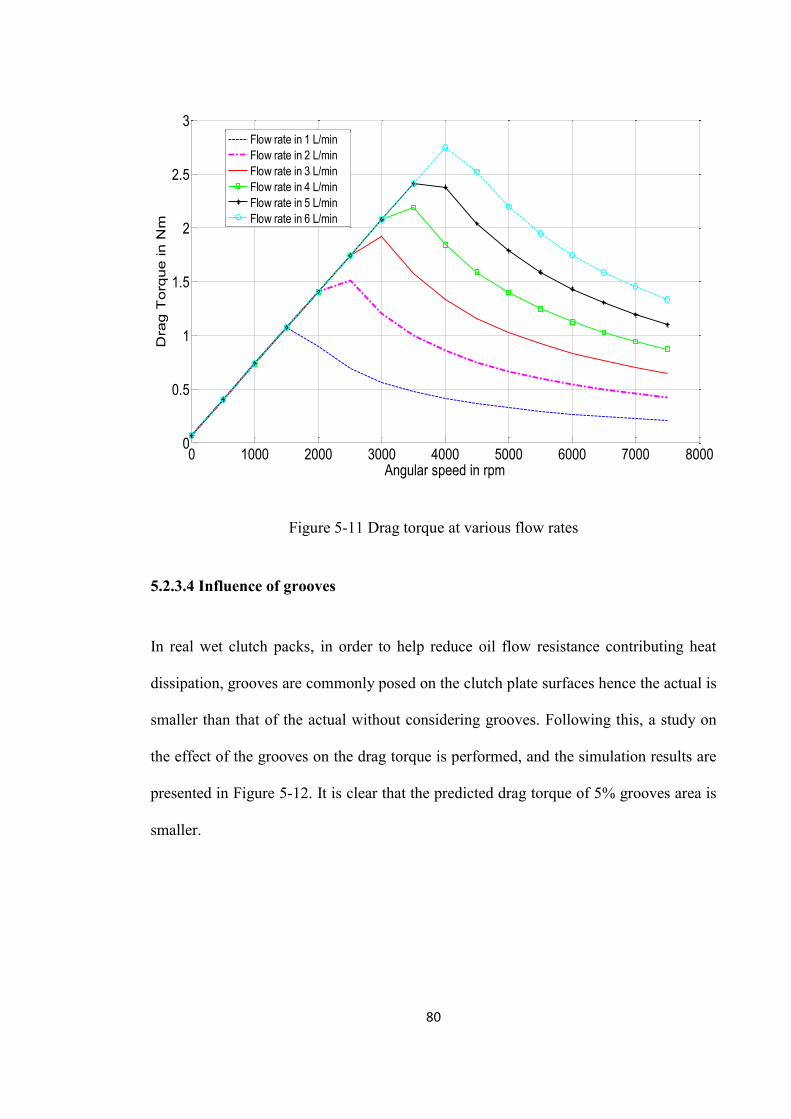
80
Figure 5-11 Drag torque at various flow rates
5.2.3.4 Influence of grooves
In real wet clutch packs, in order to help reduce oil flow resistance contributing heat
dissipation, grooves are commonly posed on the clutch plate surfaces hence the actual is
smaller than that of the actual without considering grooves. Following this, a study on
the effect of the grooves on the drag torque is performed, and the simulation results are
presented in Figure 5-12. It is clear that the predicted drag torque of 5% grooves area is
smaller.
0 1000 2000 3000 4000 5000 6000 7000 80000
0.5
1
1.5
2
2.5
3
Angular speed in rpm
Dra
g T
orq
ue in
Nm
Flow rate in 1 L/minFlow rate in 2 L/min Flow rate in 3 L/minFlow rate in 4 L/minFlow rate in 5 L/minFlow rate in 6 L/min
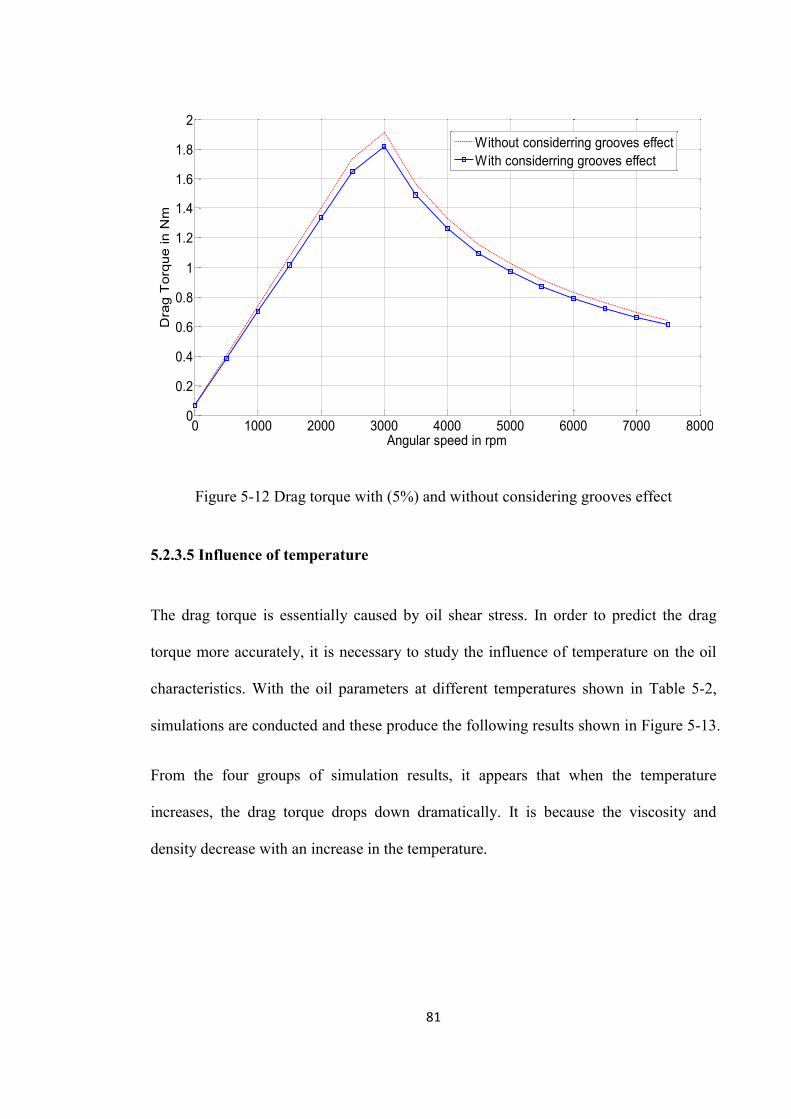
81
Figure 5-12 Drag torque with (5%) and without considering grooves effect
5.2.3.5 Influence of temperature
The drag torque is essentially caused by oil shear stress. In order to predict the drag
torque more accurately, it is necessary to study the influence of temperature on the oil
characteristics. With the oil parameters at different temperatures shown in Table 5-2,
simulations are conducted and these produce the following results shown in Figure 5-13.
From the four groups of simulation results, it appears that when the temperature
increases, the drag torque drops down dramatically. It is because the viscosity and
density decrease with an increase in the temperature.
0 1000 2000 3000 4000 5000 6000 7000 80000
0.2
0.4
0.6
0.8
1
1.2
1.4
1.6
1.8
2
Angular speed in rpm
Dra
g T
orqu
e in
Nm
Without considerring grooves effectWith considerring grooves effect
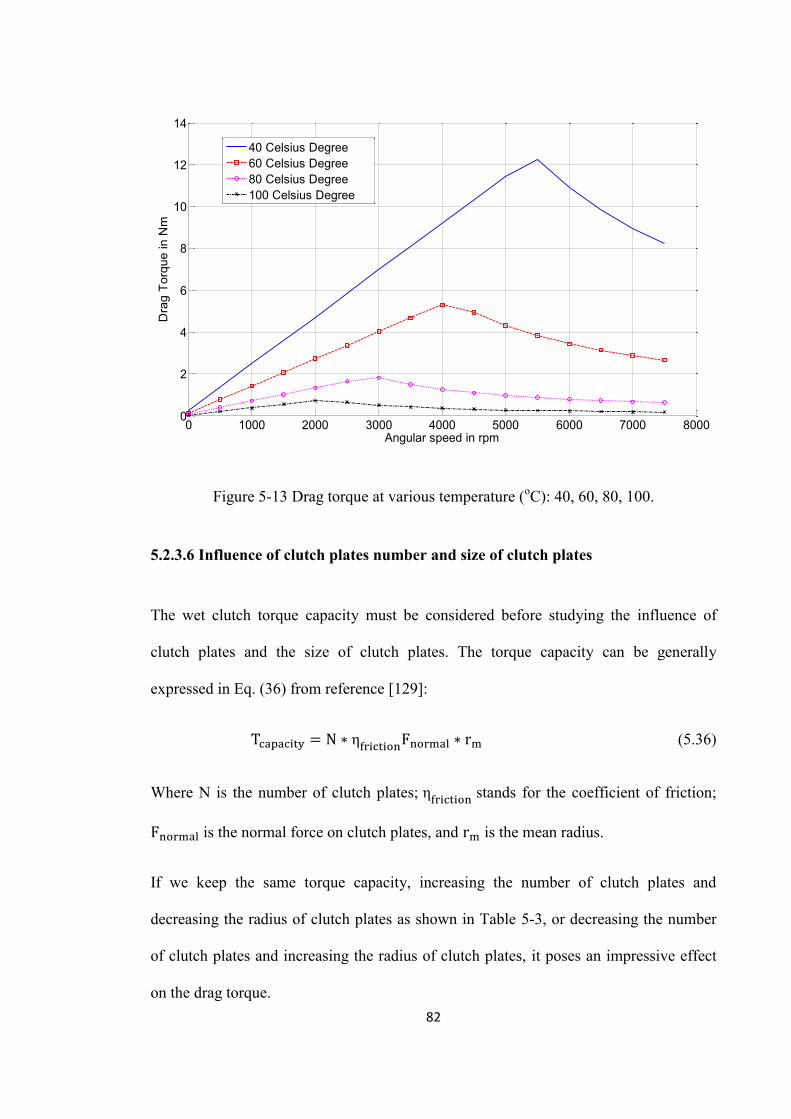
82
Figure 5-13 Drag torque at various temperature (oC): 40, 60, 80, 100.
5.2.3.6 Influence of clutch plates number and size of clutch plates
The wet clutch torque capacity must be considered before studying the influence of
clutch plates and the size of clutch plates. The torque capacity can be generally
expressed in Eq. (36) from reference [129]:
T = N ∗ η F ∗ r (5.36)
Where N is the number of clutch plates; η stands for the coefficient of friction;
F is the normal force on clutch plates, and r is the mean radius.
If we keep the same torque capacity, increasing the number of clutch plates and
decreasing the radius of clutch plates as shown in Table 5-3, or decreasing the number
of clutch plates and increasing the radius of clutch plates, it poses an impressive effect
on the drag torque.
0 1000 2000 3000 4000 5000 6000 7000 80000
2
4
6
8
10
12
14
Angular speed in rpm
Dra
g To
rque
in N
m
40 Celsius Degree60 Celsius Degree80 Celsius Degree100 Celsius Degree
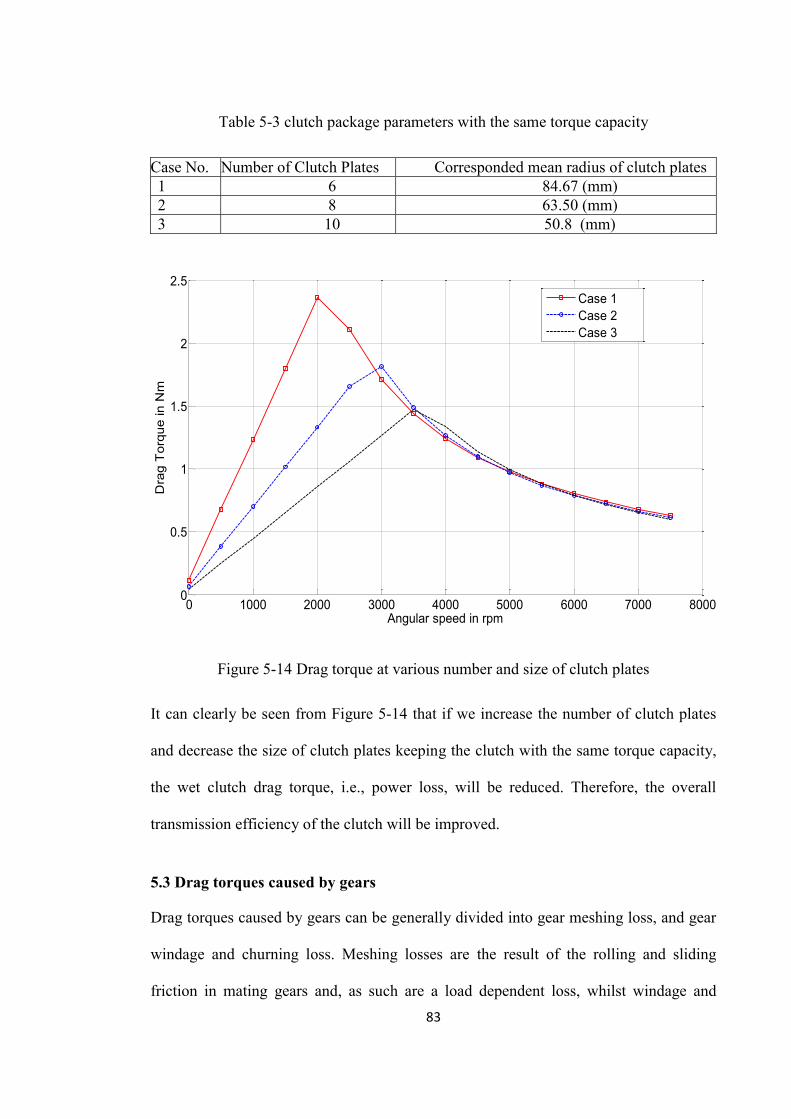
83
Table 5-3 clutch package parameters with the same torque capacity
Case No. Number of Clutch Plates Corresponded mean radius of clutch plates 1 6 84.67 (mm) 2 8 63.50 (mm) 3 10 50.8 (mm)
Figure 5-14 Drag torque at various number and size of clutch plates
It can clearly be seen from Figure 5-14 that if we increase the number of clutch plates
and decrease the size of clutch plates keeping the clutch with the same torque capacity,
the wet clutch drag torque, i.e., power loss, will be reduced. Therefore, the overall
transmission efficiency of the clutch will be improved.
5.3 Drag torques caused by gears
Drag torques caused by gears can be generally divided into gear meshing loss, and gear
windage and churning loss. Meshing losses are the result of the rolling and sliding
friction in mating gears and, as such are a load dependent loss, whilst windage and
0 1000 2000 3000 4000 5000 6000 7000 80000
0.5
1
1.5
2
2.5
Angular speed in rpm
Dra
g T
orqu
e in
Nm
Case 1Case 2Case 3
84
churning losses are generated from the gears rotating in fluids, and are therefore speed
dependent.
5.3.1 Gear mesh
The gear meshing losses in gear pairs are dependent on both rolling and sliding friction.
Methods for studying these losses reported in works [7, 8, 14] on theoretical analysis
and modelling the friction coefficient are divided into two methods. The majority of
works study the friction coefficient variation over the gears geometry and the contact
forces vector[9, 15], however this seems impractical for the purpose of wide application.
Other works[19] only consider the gear pair’s only which is more compact and therefore
applicable to general simulation and practical experiments. Consider the rigorous
development of British Standards[19]. The model presented in the standards is chosen
to calculate the gear meshing which causes drag torques, as shown below:
p = β (5.37)
Where p is meshing power loss, kw; f is mesh coefficient of friction; T is pinion
torque, N.m; n is pinion rotational speed, rpm; β is operating helix angle, degree; M
is mesh mechanical advantage. Meshing mechanical advantage can be calculated using
Eq. (5.38). This equation is a function of the sliding ratios. For external gears, the
sliding ratio at the start of approach action, Hs, is calculated using Eq.(5.39), and the
sliding ratio at the end of recess action, Ht, is obtained with Eq.(5.40).
85
M = ∝ ( ) (5.38)
where α is transverse operating pressure angle, degree; Hs is sliding ratio at start of
approach; Ht is sliding ratio at end of recess.
H = (μ + 1) ( − cos α ) . − sin α (5.39)
H = (μμ
) ( − cos α ) . − sin α (5.40)
where μ is gear ratio, which can be calculated by Eq. (5.41); R is gear outside radius,
mm; R is gear operating pitch radius, mm; R is pinion outside radius, mm; R is
pinion operating pitch radius, mm.
μ = (5.41)
where z is number of gear teeth; z is number of pinion teeth;
if the pitch line velocity, v, is 2m/s ≤ V ≤ 25 m/s and the load intensity (K-factor) is 1.4
N/mm2 <K≤ 14 N/mm2, then the gear meshing coefficient of friction, f , can be
expressed by Eq.(5.42). Outside these limits, values for f must be determined by
experience. K-factor can be calculated using Eq.(5.43). Exponents, j, g and h modify
viscosity, ν, K-factor and tangential line velocity, v, respectively.
f = γν
(5.42)
where ν is kinematic oil viscosity at operating sump temperature, cSt (mm2/s); K is K-
factor, N/mm2; C is a constant; V is tangential pitch line velocity, m/s.
86
K = ( )( )
(5.43)
where b is face width in contact, mm. Values to be used for exponents j, g and h and
constant C are as follows[19]: j=-0.223, g=-0.40, h=0.70, C = 3.239.
5.3.2 Gear windage and churning
As discussed before, research on gear windage had been done by Dawson[11] and
Diab[13] on larger high speed gears, and Eastwick[12] concludes that the effects of gear
windage loss in low and mid speed is not evident, while it will becomes gradually
prominent in high speed. For the churning loss, both Changenet[14] and the British
Standard[19] present a study for a general gear box. However, the formulas presents in
Changenet[14] assumed that all the gears are submerged in the fluids, and too many
parameters are required to be validated in order to get a reasonably practical
dimensionless drag torque coefficient C . Considering the rigours and universal nature
of standards models, the British Standard formulas are therefore adopted here.
As shown in the British Standards[19], a gear dip factor, f , must be considered before
one can obtain the gear windage and friction loss. This factor is based on the amount of
dip that the element has in the oil. When the gear or pinion does not dip in the oil,
f = 0 . When the gear dips fully into the oil, f = 1 . When the element is partly
submerged in the oil, one should linearly interpolate between 1 and 0. The primary dip
factor of the final gear is 0.21. When the speed increases, it will range from 0.21 to 0.1
according to the speed. The higher the speed, the smaller the dip factor becomes. The
power loss equation for the tooth surface is named as a roughness factor, R . Table 12.5
87
of reference[31] presents several values based on gear tooth size. Eq.(5.44) is a
reasonable approximation of the values from Dudley’s model.
R = 7.93 − . (5.44)
Where R is roughness factor, M is transverse tooth module, mm.
Gear windage and churning loss includes three kinds of loss. For those losses associated
with a smooth outside diameter, such as the outside diameter of a shaft, use Eq. (5.45).
For those losses associated with the smooth sides of a disc, such as the faces of a gear,
use Eq. (5.46). It should be pointed out that Eq. (5.29) includes both sides of the gear, so
do not double the value. For those losses associated with the tooth surfaces, such as the
outside diameter of a gear pinion, use Eq. (5.47).
For smooth outside diameters,
P = . γ . (5.45)
For smooth sides of discus
P = . γ . (5.46)
For tooth surfaces
P =. γ .
β (5.47)
Where P is power loss for each individual gear, kw; f is gear dip factor; D is outside
diameter of the gear, mm; A is arrangement constant, here set as 0.2; F is total face
88
width, mm; L is length of the gear, mm; is generated helix angle, degrees. For helix
angles less than 10o, use 10o in Eq. (5.47) [19].
For a common output shaft assembly, Eq. (5.45) would be used for the OD of the shaft
outside of the gear between the bearings, Eq. (5.46) for the smooth sides of the gear, and
Eq. (5.47) for the tooth surfaces. After calculating the individual gears for each shaft
assembly in a reducer, they must be added together for the total loss.
5.4 Bearing model
As an important part of the power losses in transmission, bearing losses have been
analysed by Harris[16] for a variety of bearing designs, considering both viscous
friction caused torque and applied load caused torque. This work is widely accepted as
the front-runner on the topic, with similar results being applied to other work[8, 15] In
addition, a similar bearing model is presented in reference[19], which is widely used in
the German gear industry. Hence, the equations from the work[19] are chosen and
presented below.
Load dependent bearing losses are:
P = f Fd (5.48)
Speed dependent losses are:
If γn < 2000
P = 1.6 ∗ 10 f d (5.49)
If γn ≥ 2000
89
P = 10 f (γn) / d (5.50)
Where P is no-load torque of the bearing, Nm; f is bearing dip factor. Factor f
adjusts the torque based on the amount that the bearing dips in the oil and varies from
f ( ) to f ( ). Use f ( ) if the rolling elements do not dip into the oil and f ( )
if the rolling elements are completely submerged in the oil, linearly interpolate between
f ( ) and f ( ). Values for the dip factor range can be found in reference[19].
5.5 Concentric shaft drag torque
As canvassed before, the DCT has two concentric arranged shafts which connect the
gears and clutches respectively. When one of the concentric shafts is running, the other
concentric one will run at a different speed due to the different engaged gear ratios.
Therefore, relative speed exists between two concentric shafts, which in turn cause
viscous shear resistance. This concentric shafts shear torque phenomenon has been
studied by Schlichting as presented in reference[130] and this serves as an example of
Couette flow. Accordingly, the drag torque caused by concentric shafts can be
expressed as:
T = 4πμh ∆ω (5.51)
where R , and R are the inner radius of the outer shaft and the out radius of the inner
shaft, respectively. ∆ω is the relative speed between two concentric shafts. The
concentric length is expressed with h. It is assumed here that the annual area is
lubricated with continuous flow.
90
5.6 DCT entire drag torque model
As discussed in the introduction of this chapter, it is recommended that a general two-
speed wet DCT should be incorporated in a pure electric vehicle (EV), as shown in
Figure 5-15. The system under consideration is modified from a 6-speed DCT (DQ250)
into a two-speed DCT. The two-speed DCT housing is made from an aluminium alloy
and the DCT is made up of two clutches, the inner clutch (C1) and the outer clutch (C2).
The two clutches have a common drum attached to the same input shaft from the
electric motor, and the friction plates are independently connected to the 1st or the 2nd
gear. C1, shown in green, connects the outer input shaft engaged with the 1st gear, and
C2, shown in red, connects the inner input shaft engaged with the 2nd gear. In order to
make the transmission control system simpler and save in manufacturing fees, there are
no synchronisers in this new type of two-speed DCT. Thus, the transmission can be
looked at as two clutched gear pairs, and, in this sense, shifting is realised through the
simultaneous shifting between these two halves of the transmission. For this special
layout, a vehicle equipped with a DCT not only changes speed smoothly with nearly no
power hole (identified by Goetz,[26]) but improves the EV efficiency as well.
The sources of power loss in a two-speed DCT, or drag torque, can be divided into five
major origins: gears related meshing, windage and churning losses, bearings and oil seal
related losses, concentric shaft related viscous shear loss, and disengaged wet clutch
caused drag torque losses, as shown in Eq. (5.52). For each individual power loss source,
the following formulae have been implemented in the simulation code.
P = P + ∑ P + ∑ P + P + P (5.52)
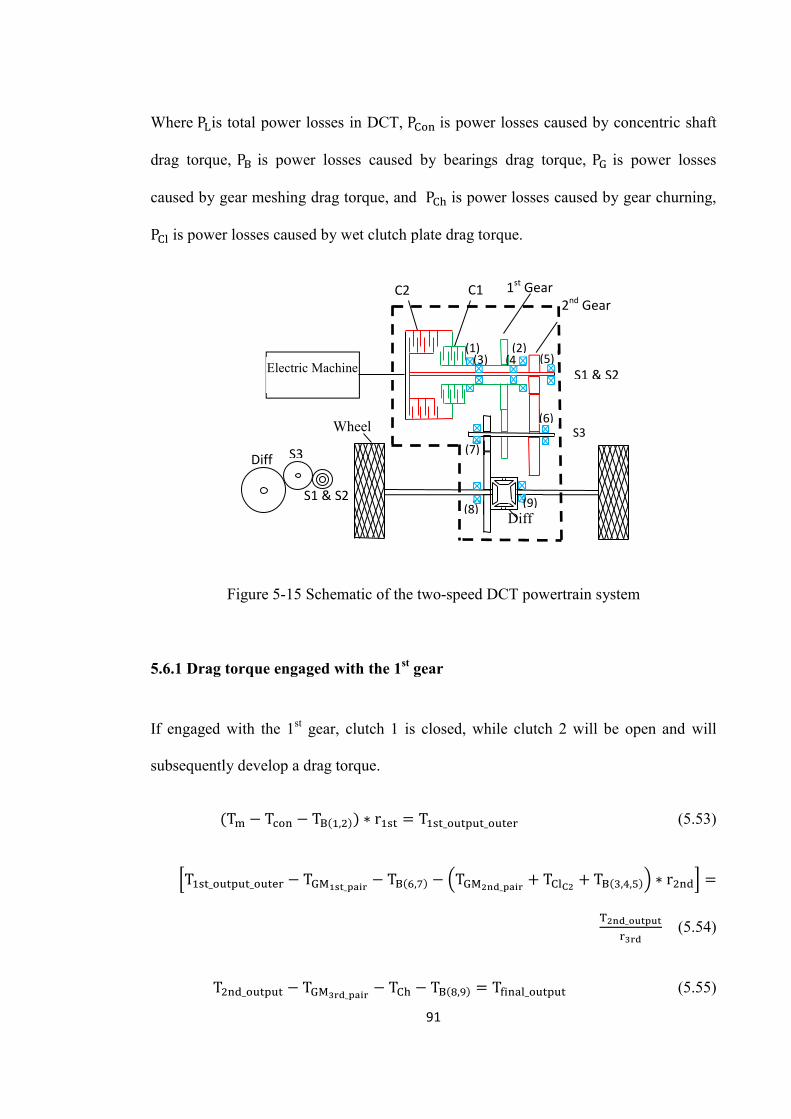
91
Where P is total power losses in DCT, P is power losses caused by concentric shaft
drag torque, P is power losses caused by bearings drag torque, P is power losses
caused by gear meshing drag torque, and P is power losses caused by gear churning,
P is power losses caused by wet clutch plate drag torque.
Figure 5-15 Schematic of the two-speed DCT powertrain system
5.6.1 Drag torque engaged with the 1st gear
If engaged with the 1st gear, clutch 1 is closed, while clutch 2 will be open and will
subsequently develop a drag torque.
(T − T − T ( , )) ∗ r = T _ _ (5.53)
T _ _ − T _ − T ( , ) − T _ + T + T ( , , ) ∗ r =
_ (5.54)
T _ − T _ − T − T ( , ) = T _ (5.55)
Diff
C1 1st Gear C2
S1 & S2
2nd Gear
S3
S1 & S2
S3
Diff
Electric Machine
Wheel
(1) (5) (4
(7)
(6)
(9) (8)
(2) 1)(3)
92
Where T is motor output torque; T is drag torque caused by concentric shafts
viscous shear resistance; T is drag torque caused by bearings; and r is gear
ratio, T _ _ represents the output torque of the outer concentric shaft. T is
drag torque caused by the gear pairs meshing, and T is the drag torque caused by wet
clutch packs. T is the drag torque caused by clutch churning losses. And the individual
power losses can be calculated in rotational speed multiplied by drag torque:
P = ∗ (5.56)
Power losses caused by concentric shaft raised shear resistance are:
P = ∗ (5.57)
The total power loss caused by bearings and gear friction is:
∑ P = T ( , ) ∗ n + T ( , , ) ∗ n + T ( , ) ∗ + T ( , ) ∗∗
/
9550 (5.58)
∑ P = T _ ∗ + T _ ∗ n + T _ ∗∗
/9550
(5.59)
The power losses resulting from gear windage and churning are:
P = ∗∗ ∗
(5.60)
The overall power loss caused by clutch package is:
P =∗ ∗
∗ (5.61)
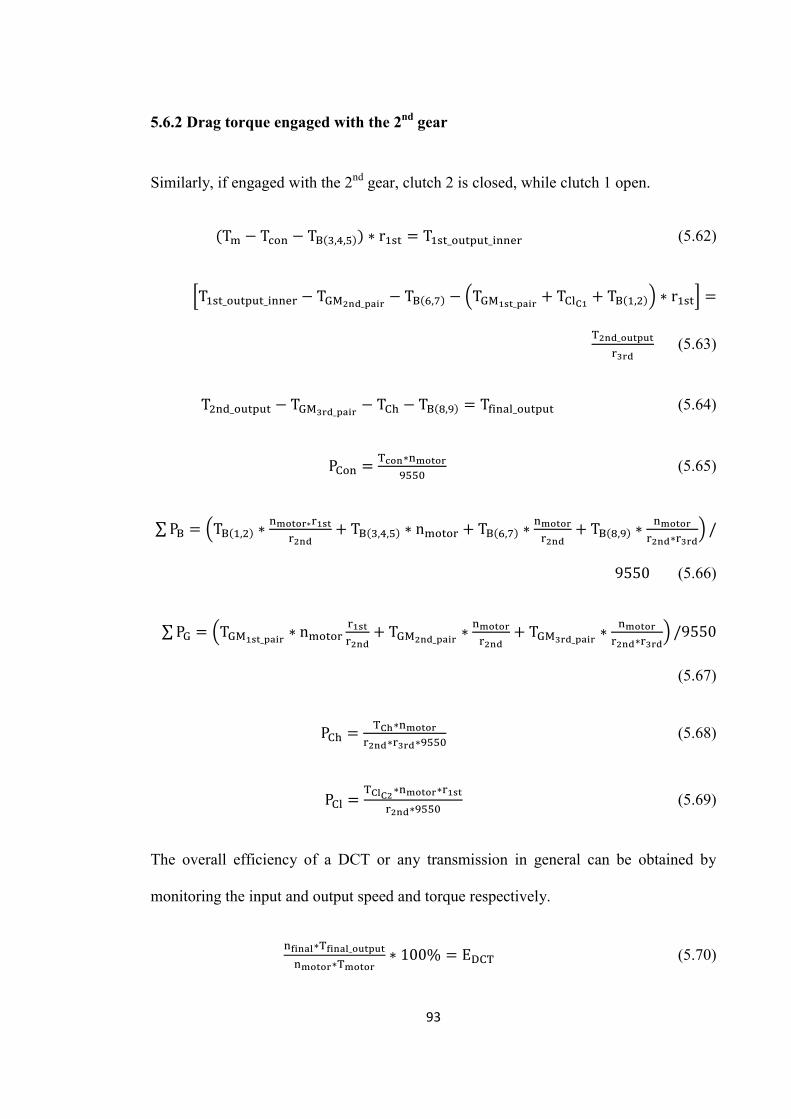
93
5.6.2 Drag torque engaged with the 2nd gear
Similarly, if engaged with the 2nd gear, clutch 2 is closed, while clutch 1 open.
(T − T − T ( , , )) ∗ r = T _ _ (5.62)
T _ _ − T _ − T ( , ) − T _ + T + T ( , ) ∗ r =
_ (5.63)
T _ − T _ − T − T ( , ) = T _ (5.64)
P = ∗ (5.65)
∑ P = T ( , ) ∗ ∗ + T ( , , ) ∗ n + T ( , ) ∗ + T ( , ) ∗∗
/
9550 (5.66)
∑ P = T _ ∗ n + T _ ∗ + T _ ∗∗
/9550
(5.67)
P = ∗∗ ∗
(5.68)
P =∗ ∗
∗ (5.69)
The overall efficiency of a DCT or any transmission in general can be obtained by
monitoring the input and output speed and torque respectively.
∗ _
∗∗ 100% = E (5.70)
94
5.7 Conclusions
Two reasonable analytical models to predict the multi-plate wet clutch drag torque are
chosen as typical ones from several existing analytical models. After theoretical analysis
of these two models is done, simulations and comparisons are conducted to show their
difference. The comparison between the two models indicates that the second model is
more likely to predict the disengaged wet clutch drag torque. Therefore, the second
model will be chosen for the future dual clutch transmission drag torque study. After
this, the influences of clutch plate clearance, flow rate, grooves area, temperature,
number and size of clutch plates on drag torque are presented. Additionally, possible
optimisation design direction is pointed out.
Finally, other parts of the drag torque within the entire dual clutch transmission are
developed, and these consider the gear meshing losses, gear windage and churning,
bearing and concentric shaft drag torque.
The following conclusions can also be made from this chapter:
1. The increase in clutch plate clearance will lead to a the reduction of drag torque.
2. The increase in flow rate will lead to an increase of drag torque.
3. The increase of area of grooves will lead to a decrease of drag torque.
4. The increase of temperature will leads to the decrease of drag torque.
5. To maintain the clutch with the same torque capacity, if we increase the number
of clutch plates and decrease the size of clutch plates, the total drag torque will
decrease and, hence improve the efficiency. During the design procedure, it is
necessary to increase the number of clutch plates and decrease the radius of the
clutch plates in order to reduce the drag torque losses.
95
Chapter 6 EXPERIMENTS ON UTS POWERTRAIN TEST RIG ON DRAG
TORQUE
6.1 Introduction
In order to get the most accurate value of the drag torques of DCT and verify the
proposed drag torque model introduced in the last chapter, experimental tests will be
conducted. In this chapter, the experimental set up and test methodology used to
measure powertrain transmission drag torque will be described in detail. The test rig
(i.e., the UTS electric vehicle powertrain system) is introduced, and instrumentation,
data acquisition measurements, and test procedures are presented. The results from the
simulation and test are then compared and discussed. Finally, a summary of the chapter
is presented.
6.2 Test rigs of powertrain system at UTS
The measurement of drag torque in this study can be performed with several changes to
the original UTS powertrain system test rig. In this section, test facility and hardware,
test instrumentation, data acquisition, and test operation will be briefly presented.
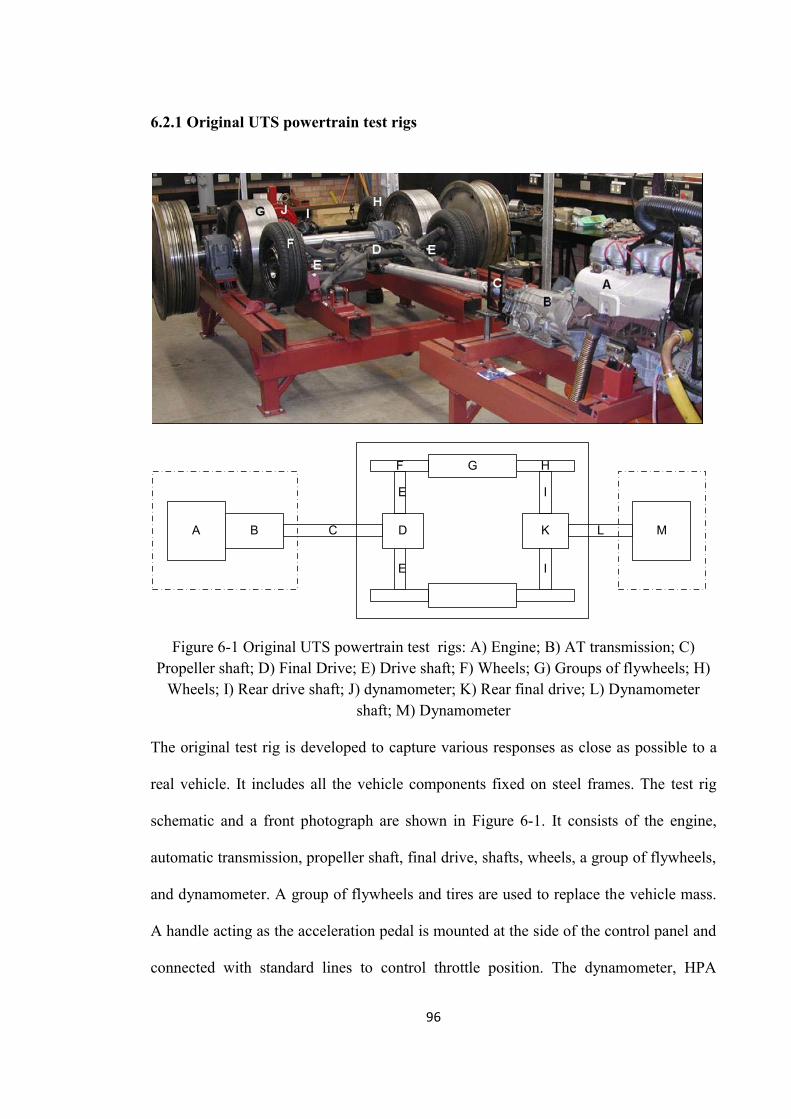
96
6.2.1 Original UTS powertrain test rigs
A B D
F G
C
H
K
I
I
L M
E
E
Figure 6-1 Original UTS powertrain test rigs: A) Engine; B) AT transmission; C) Propeller shaft; D) Final Drive; E) Drive shaft; F) Wheels; G) Groups of flywheels; H)
Wheels; I) Rear drive shaft; J) dynamometer; K) Rear final drive; L) Dynamometer shaft; M) Dynamometer
The original test rig is developed to capture various responses as close as possible to a
real vehicle. It includes all the vehicle components fixed on steel frames. The test rig
schematic and a front photograph are shown in Figure 6-1. It consists of the engine,
automatic transmission, propeller shaft, final drive, shafts, wheels, a group of flywheels,
and dynamometer. A group of flywheels and tires are used to replace the vehicle mass.
A handle acting as the acceleration pedal is mounted at the side of the control panel and
connected with standard lines to control throttle position. The dynamometer, HPA
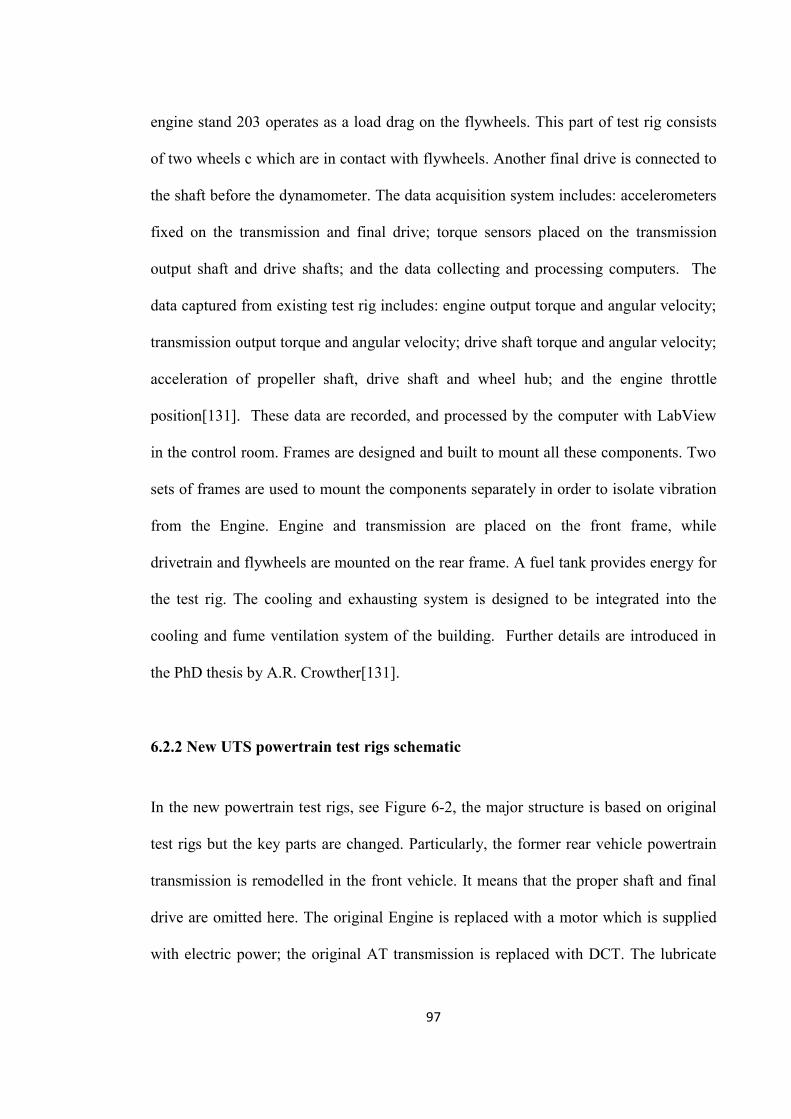
97
engine stand 203 operates as a load drag on the flywheels. This part of test rig consists
of two wheels c which are in contact with flywheels. Another final drive is connected to
the shaft before the dynamometer. The data acquisition system includes: accelerometers
fixed on the transmission and final drive; torque sensors placed on the transmission
output shaft and drive shafts; and the data collecting and processing computers. The
data captured from existing test rig includes: engine output torque and angular velocity;
transmission output torque and angular velocity; drive shaft torque and angular velocity;
acceleration of propeller shaft, drive shaft and wheel hub; and the engine throttle
position[131]. These data are recorded, and processed by the computer with LabView
in the control room. Frames are designed and built to mount all these components. Two
sets of frames are used to mount the components separately in order to isolate vibration
from the Engine. Engine and transmission are placed on the front frame, while
drivetrain and flywheels are mounted on the rear frame. A fuel tank provides energy for
the test rig. The cooling and exhausting system is designed to be integrated into the
cooling and fume ventilation system of the building. Further details are introduced in
the PhD thesis by A.R. Crowther[131].
6.2.2 New UTS powertrain test rigs schematic
In the new powertrain test rigs, see Figure 6-2, the major structure is based on original
test rigs but the key parts are changed. Particularly, the former rear vehicle powertrain
transmission is remodelled in the front vehicle. It means that the proper shaft and final
drive are omitted here. The original Engine is replaced with a motor which is supplied
with electric power; the original AT transmission is replaced with DCT. The lubricate
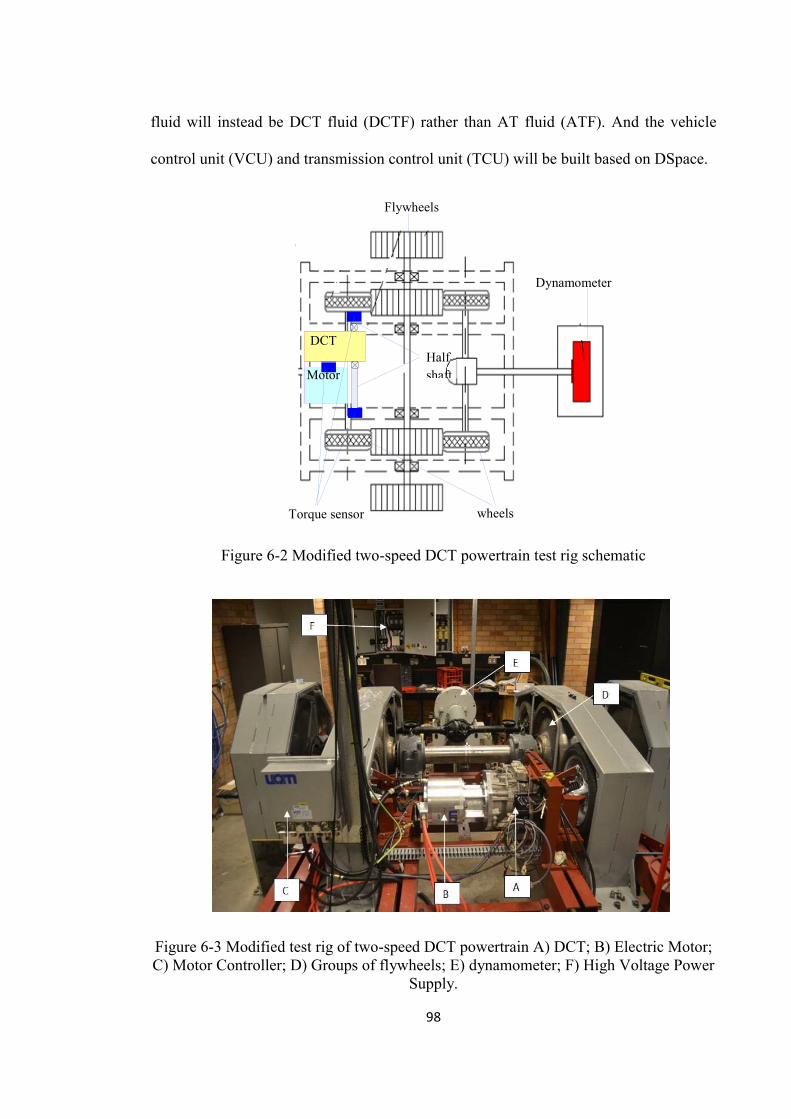
98
fluid will instead be DCT fluid (DCTF) rather than AT fluid (ATF). And the vehicle
control unit (VCU) and transmission control unit (TCU) will be built based on DSpace.
Figure 6-2 Modified two-speed DCT powertrain test rig schematic
Figure 6-3 Modified test rig of two-speed DCT powertrain A) DCT; B) Electric Motor; C) Motor Controller; D) Groups of flywheels; E) dynamometer; F) High Voltage Power
Supply.
Motor
DCT
Flywheels
Dynamometer
wheels Torque sensor
Half shaft
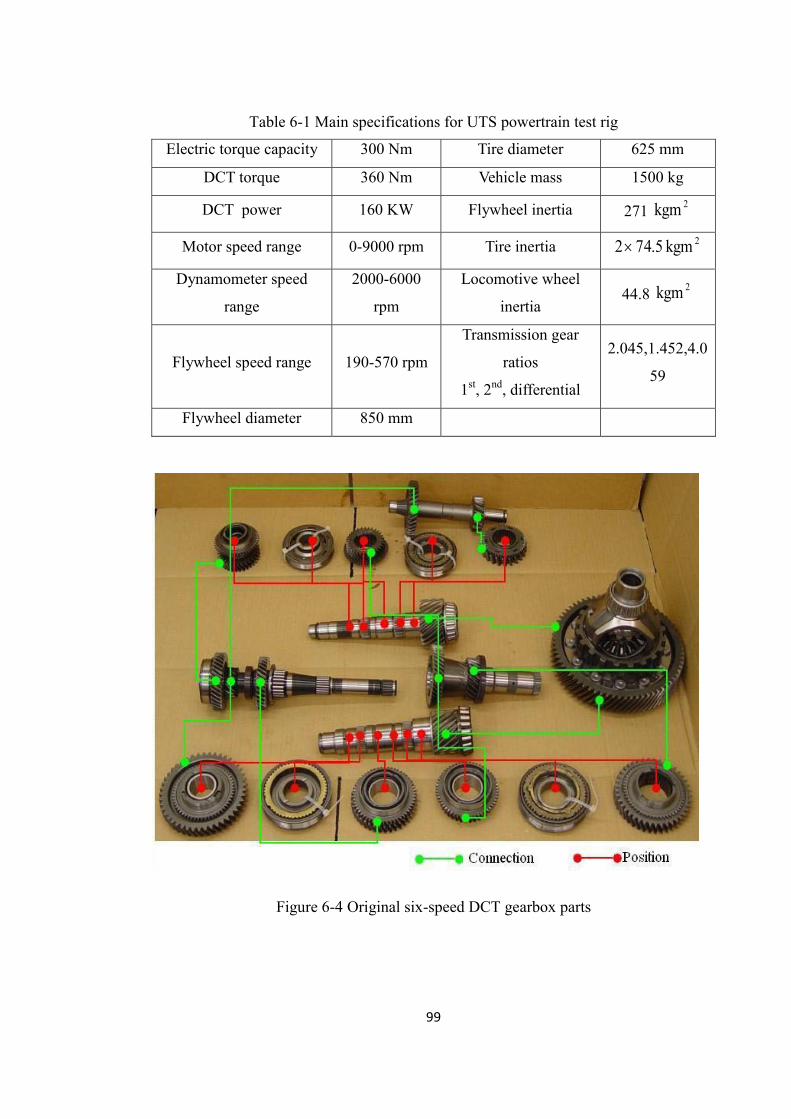
99
Table 6-1 Main specifications for UTS powertrain test rig
Electric torque capacity 300 Nm Tire diameter 625 mm
DCT torque 360 Nm Vehicle mass 1500 kg
DCT power 160 KW Flywheel inertia 271 2kgm
Motor speed range 0-9000 rpm Tire inertia 2kgm 5.742
Dynamometer speed
range
2000-6000
rpm
Locomotive wheel
inertia 44.8 2kgm
Flywheel speed range 190-570 rpm
Transmission gear
ratios
1st, 2nd, differential
2.045,1.452,4.0
59
Flywheel diameter 850 mm
Figure 6-4 Original six-speed DCT gearbox parts
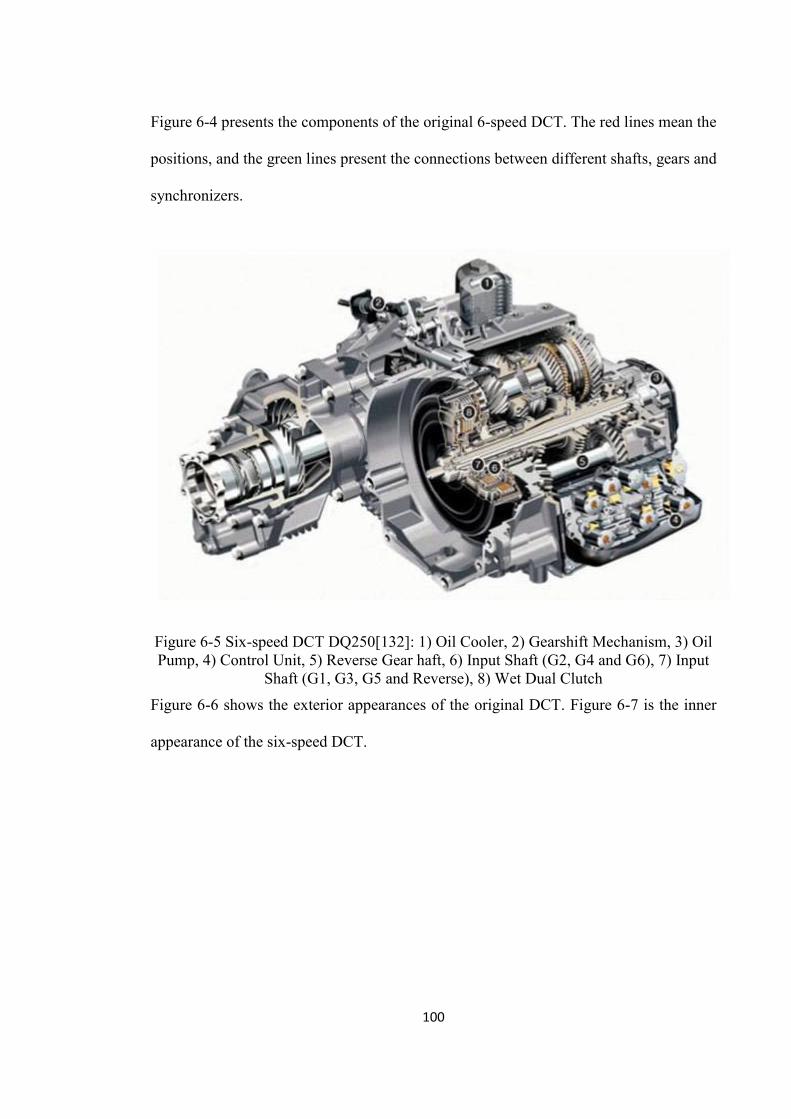
100
Figure 6-4 presents the components of the original 6-speed DCT. The red lines mean the
positions, and the green lines present the connections between different shafts, gears and
synchronizers.
Figure 6-5 Six-speed DCT DQ250[132]: 1) Oil Cooler, 2) Gearshift Mechanism, 3) Oil Pump, 4) Control Unit, 5) Reverse Gear haft, 6) Input Shaft (G2, G4 and G6), 7) Input
Shaft (G1, G3, G5 and Reverse), 8) Wet Dual Clutch
Figure 6-6 shows the exterior appearances of the original DCT. Figure 6-7 is the inner
appearance of the six-speed DCT.
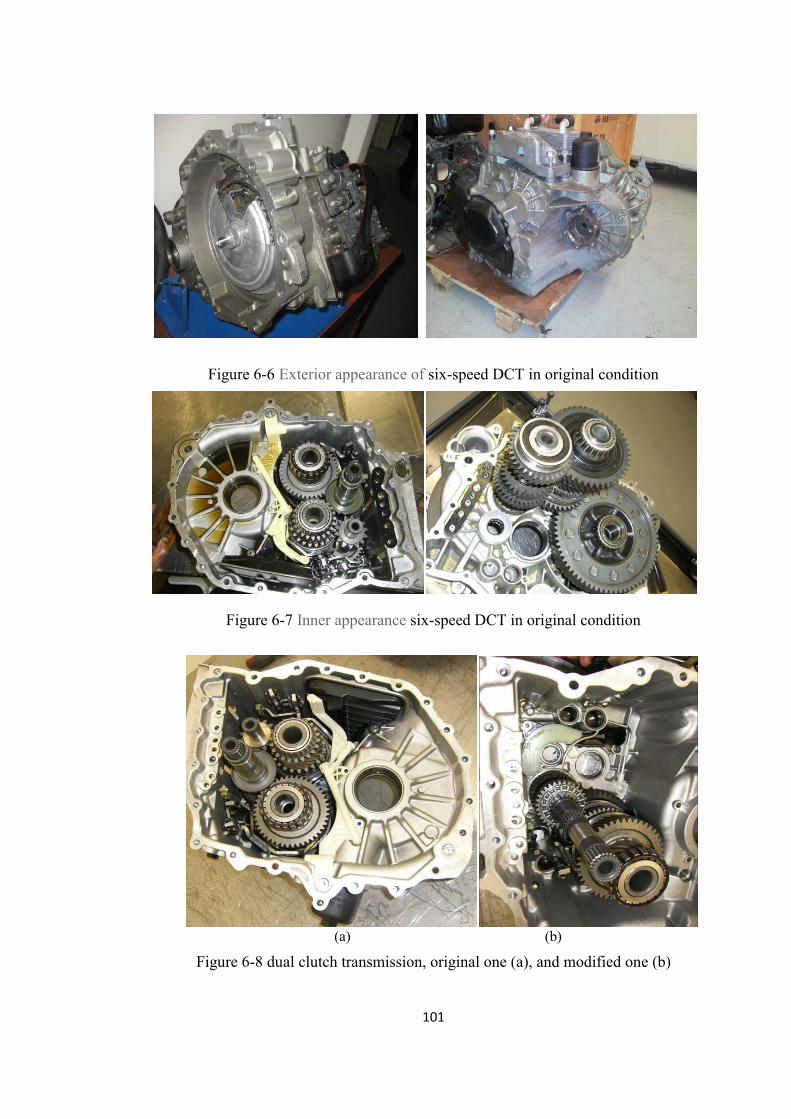
101
Figure 6-6 Exterior appearance of six-speed DCT in original condition
Figure 6-7 Inner appearance six-speed DCT in original condition
(a) (b)
Figure 6-8 dual clutch transmission, original one (a), and modified one (b)
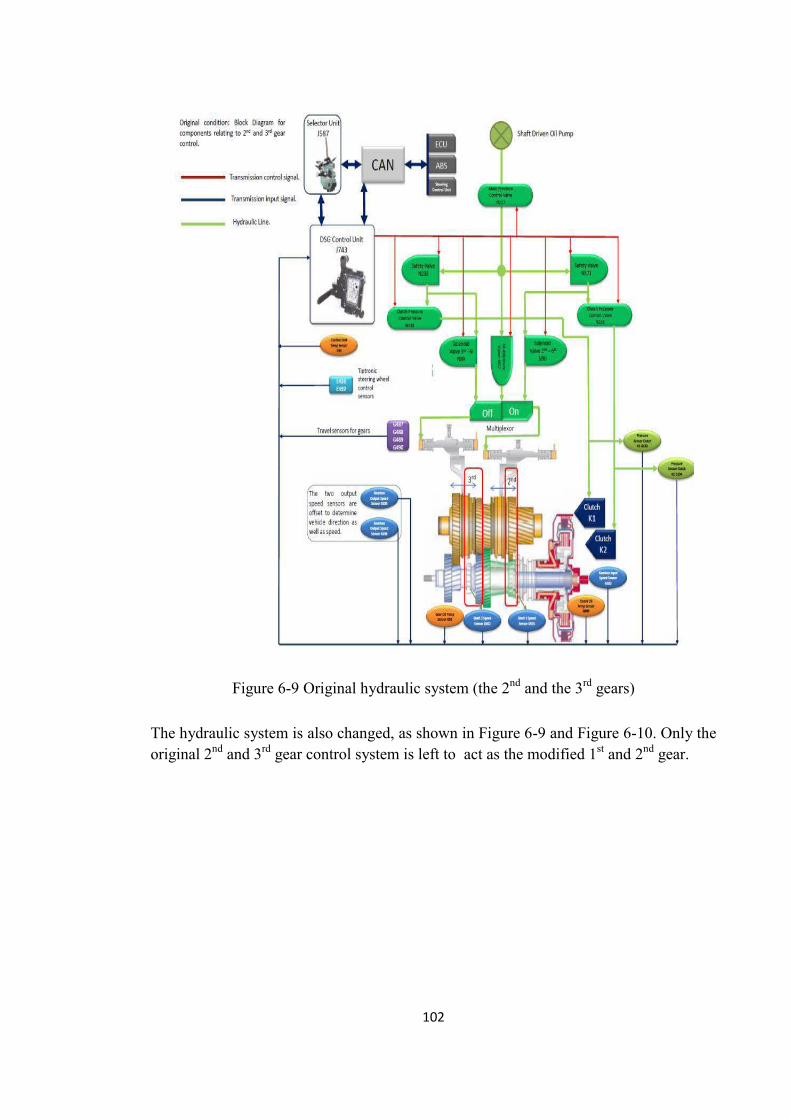
102
Figure 6-9 Original hydraulic system (the 2nd and the 3rd gears)
The hydraulic system is also changed, as shown in Figure 6-9 and Figure 6-10. Only the original 2nd and 3rd gear control system is left to act as the modified 1st and 2nd gear.
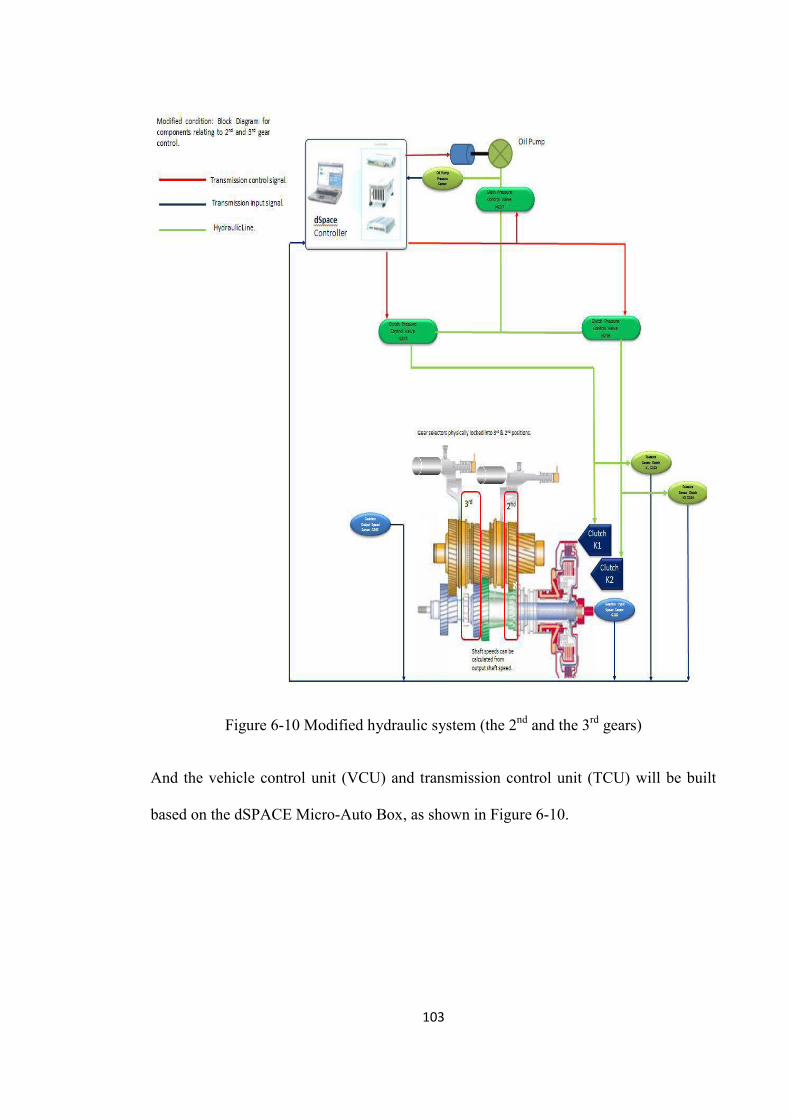
103
Figure 6-10 Modified hydraulic system (the 2nd and the 3rd gears)
And the vehicle control unit (VCU) and transmission control unit (TCU) will be built
based on the dSPACE Micro-Auto Box, as shown in Figure 6-10.
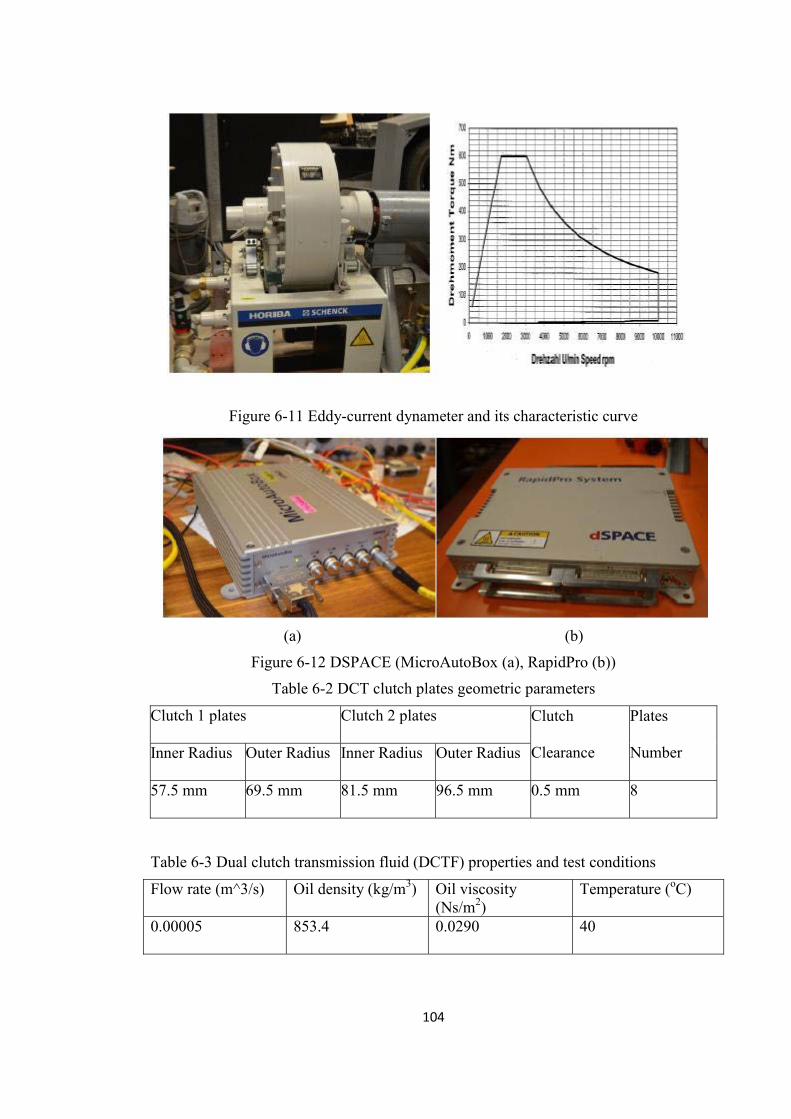
104
Figure 6-11 Eddy-current dynameter and its characteristic curve
(a) (b)
Figure 6-12 DSPACE (MicroAutoBox (a), RapidPro (b))
Table 6-2 DCT clutch plates geometric parameters
Clutch 1 plates Clutch 2 plates Clutch
Clearance
Plates
Number Inner Radius Outer Radius Inner Radius Outer Radius
57.5 mm 69.5 mm 81.5 mm 96.5 mm 0.5 mm 8
Table 6-3 Dual clutch transmission fluid (DCTF) properties and test conditions
Flow rate (m^3/s) Oil density (kg/m3) Oil viscosity (Ns/m2)
Temperature (oC)
0.00005 853.4 0.0290 40
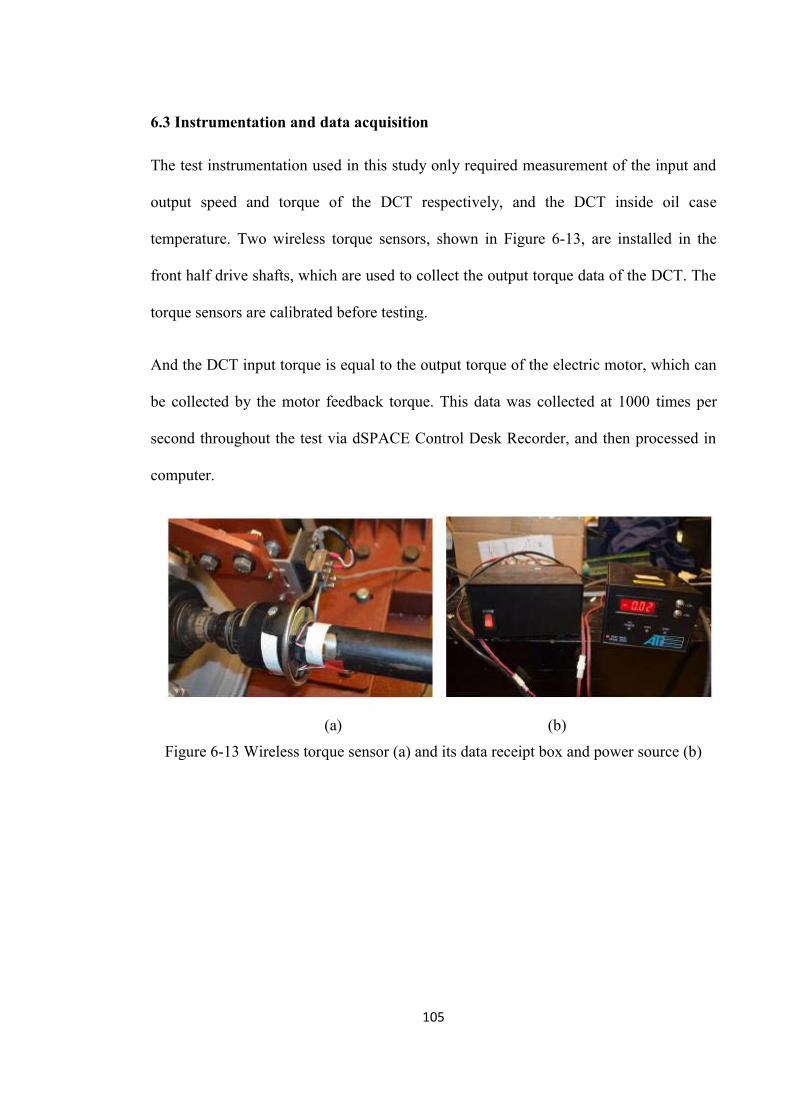
105
6.3 Instrumentation and data acquisition
The test instrumentation used in this study only required measurement of the input and
output speed and torque of the DCT respectively, and the DCT inside oil case
temperature. Two wireless torque sensors, shown in Figure 6-13, are installed in the
front half drive shafts, which are used to collect the output torque data of the DCT. The
torque sensors are calibrated before testing.
And the DCT input torque is equal to the output torque of the electric motor, which can
be collected by the motor feedback torque. This data was collected at 1000 times per
second throughout the test via dSPACE Control Desk Recorder, and then processed in
computer.
(a) (b)
Figure 6-13 Wireless torque sensor (a) and its data receipt box and power source (b)
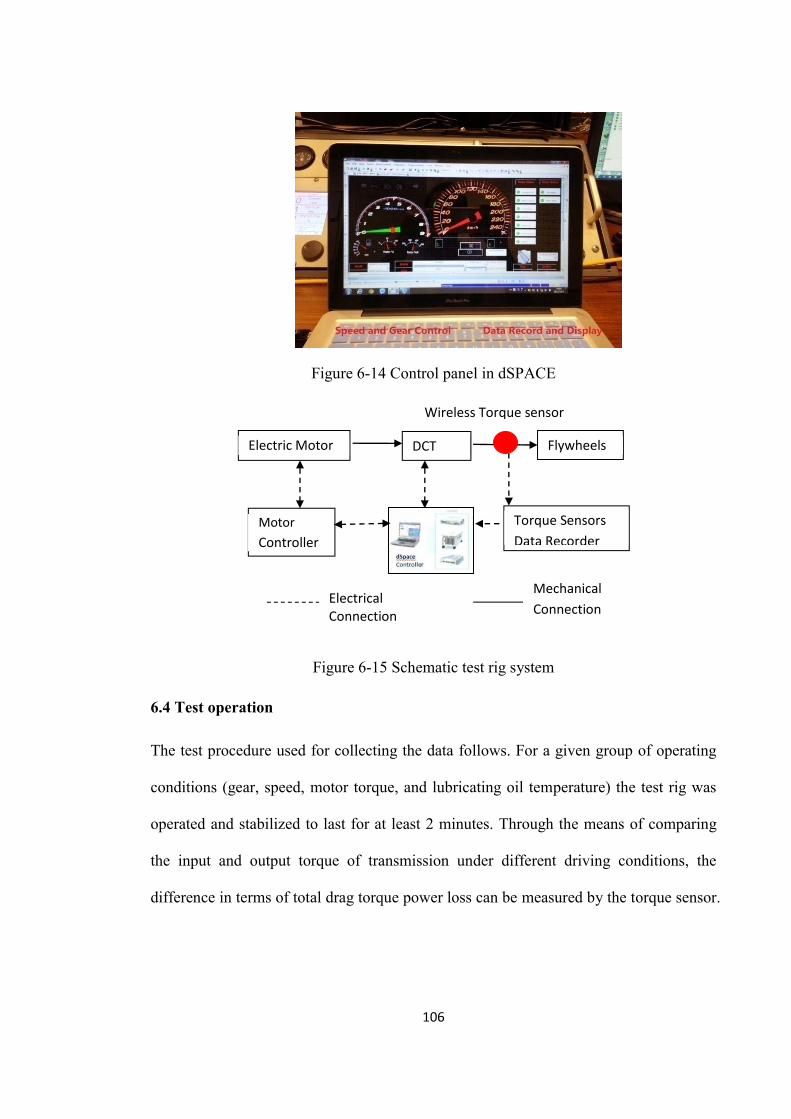
106
Figure 6-14 Control panel in dSPACE
Figure 6-15 Schematic test rig system
6.4 Test operation
The test procedure used for collecting the data follows. For a given group of operating
conditions (gear, speed, motor torque, and lubricating oil temperature) the test rig was
operated and stabilized to last for at least 2 minutes. Through the means of comparing
the input and output torque of transmission under different driving conditions, the
difference in terms of total drag torque power loss can be measured by the torque sensor.
Electric Motor
Wireless Torque sensor
DCT Flywheels
Motor Controller
Torque Sensors Data Recorder
Electrical Connection
Mechanical Connection
107
6.5 Results and analysis
In order to validate the proposed model under the conditions of Table 6-2 and Table 6-3,
simulation and experimental tests are made. The following content supplies the results
and analysis regarding experimental and simulation results.
Figure 6-16 and Figure 6-17 show the DCT efficiency for the 1st gear (a) and the 2nd
gear (b) from the simulation prediction and during testing using constant input torque
and constant input speed respectively. In Figure 6-16, constant input torque (60 Nm)
and various input speeds from the electric motor are set. The DCT average efficiency is
higher than 95% in both gears. And the efficiency in the 2nd gear shown in Figure 6-16
(b) is slightly higher than that of in the 1st gear shown in Figure 6-16 (a). Both
efficiencies decrease until they reach their bottom values respectively. After a certain
speed, i.e. critical speed, the drag torque will increase gradually with the speed
continually increasing at high speed. The predicted critical speeds for the 1st and the 2nd
gear are 2950 rpm and 2530 rpm respectively, which are very close to the speeds
obtained from test results. The differences between simulation and test results are
smaller, less than 0.5%. It appears that the simulation results are always a little higher
than the test results by 0.2% in efficiency. It is likely there are some other minor sources
affecting the test final results, such as the windage loss from the shaft and the 1st and the
2nd gear pairs by the oil-air mixture resistance.
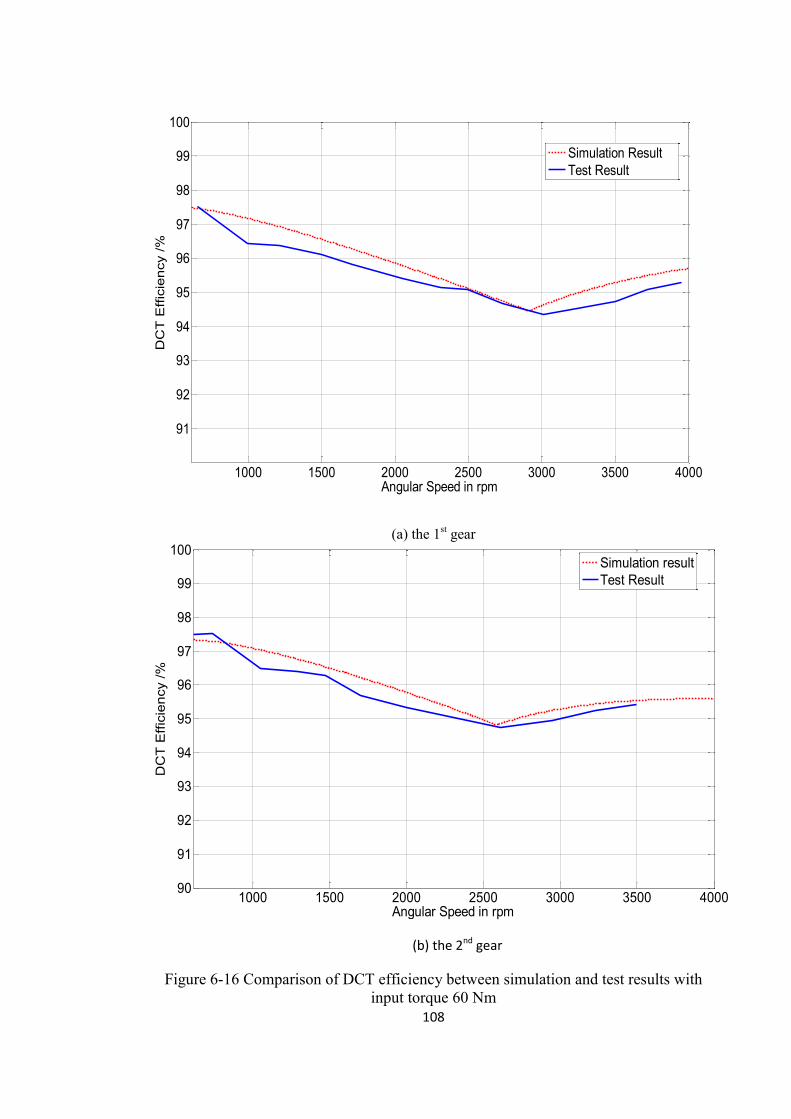
108
(a) the 1st gear
(b) the 2nd gear
Figure 6-16 Comparison of DCT efficiency between simulation and test results with input torque 60 Nm
1000 1500 2000 2500 3000 3500 4000
91
92
93
94
95
96
97
98
99
100
Angular Speed in rpm
DC
T E
ffici
ency
/%
Simulation ResultTest Result
1000 1500 2000 2500 3000 3500 400090
91
92
93
94
95
96
97
98
99
100
Angular Speed in rpm
DC
T E
ffici
ency
/%
Simulation resultTest Result
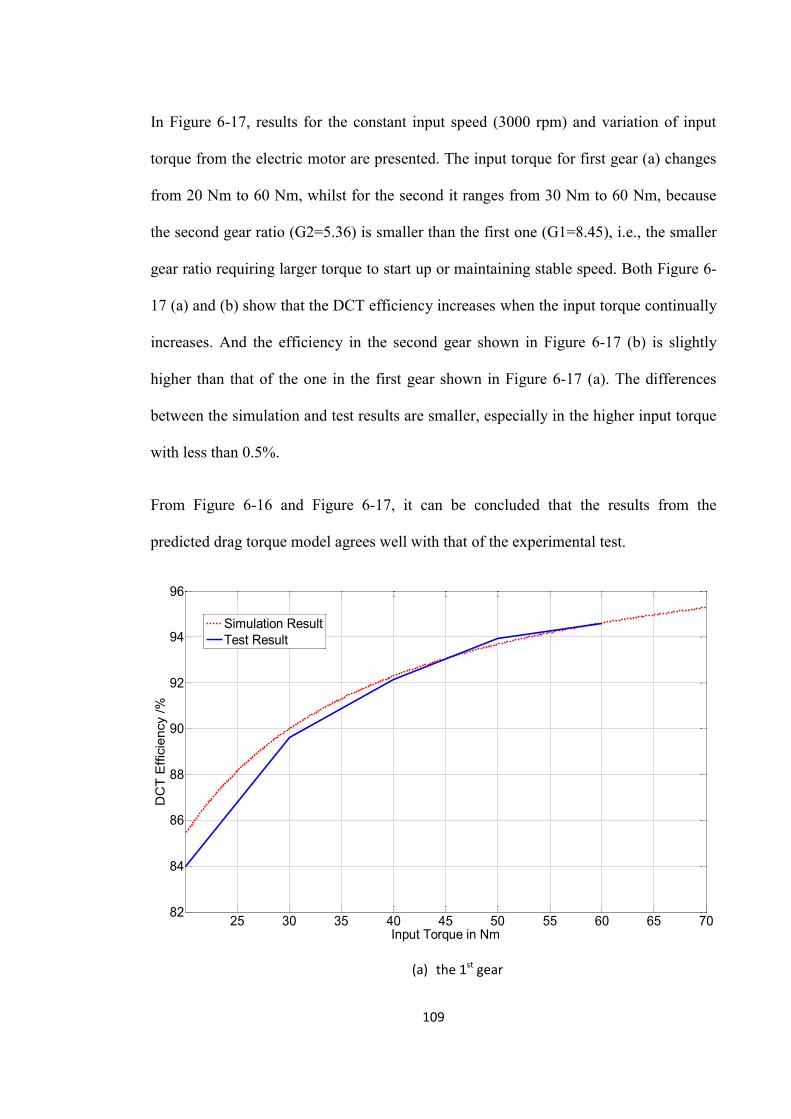
109
In Figure 6-17, results for the constant input speed (3000 rpm) and variation of input
torque from the electric motor are presented. The input torque for first gear (a) changes
from 20 Nm to 60 Nm, whilst for the second it ranges from 30 Nm to 60 Nm, because
the second gear ratio (G2=5.36) is smaller than the first one (G1=8.45), i.e., the smaller
gear ratio requiring larger torque to start up or maintaining stable speed. Both Figure 6-
17 (a) and (b) show that the DCT efficiency increases when the input torque continually
increases. And the efficiency in the second gear shown in Figure 6-17 (b) is slightly
higher than that of the one in the first gear shown in Figure 6-17 (a). The differences
between the simulation and test results are smaller, especially in the higher input torque
with less than 0.5%.
From Figure 6-16 and Figure 6-17, it can be concluded that the results from the
predicted drag torque model agrees well with that of the experimental test.
(a) the 1st gear
25 30 35 40 45 50 55 60 65 7082
84
86
88
90
92
94
96
Input Torque in Nm
DC
T E
ffici
ency
/%
Simulation ResultTest Result
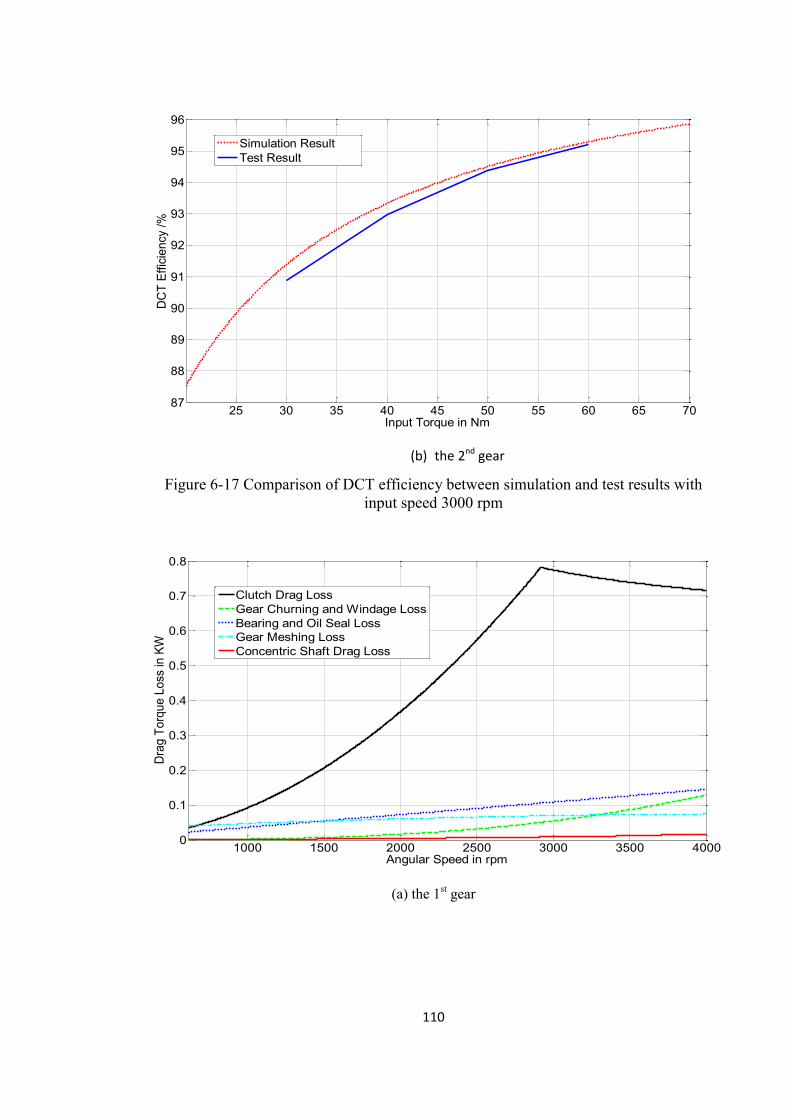
110
(b) the 2nd gear
Figure 6-17 Comparison of DCT efficiency between simulation and test results with input speed 3000 rpm
(a) the 1st gear
25 30 35 40 45 50 55 60 65 7087
88
89
90
91
92
93
94
95
96
Input Torque in Nm
DC
T Ef
ficie
ncy
/%
Simulation ResultTest Result
1000 1500 2000 2500 3000 3500 40000
0.1
0.2
0.3
0.4
0.5
0.6
0.7
0.8
Angular Speed in rpm
Drag
Tor
que
Loss
in K
W
Clutch Drag LossGear Churning and Windage LossBearing and Oil Seal LossGear Meshing LossConcentric Shaft Drag Loss
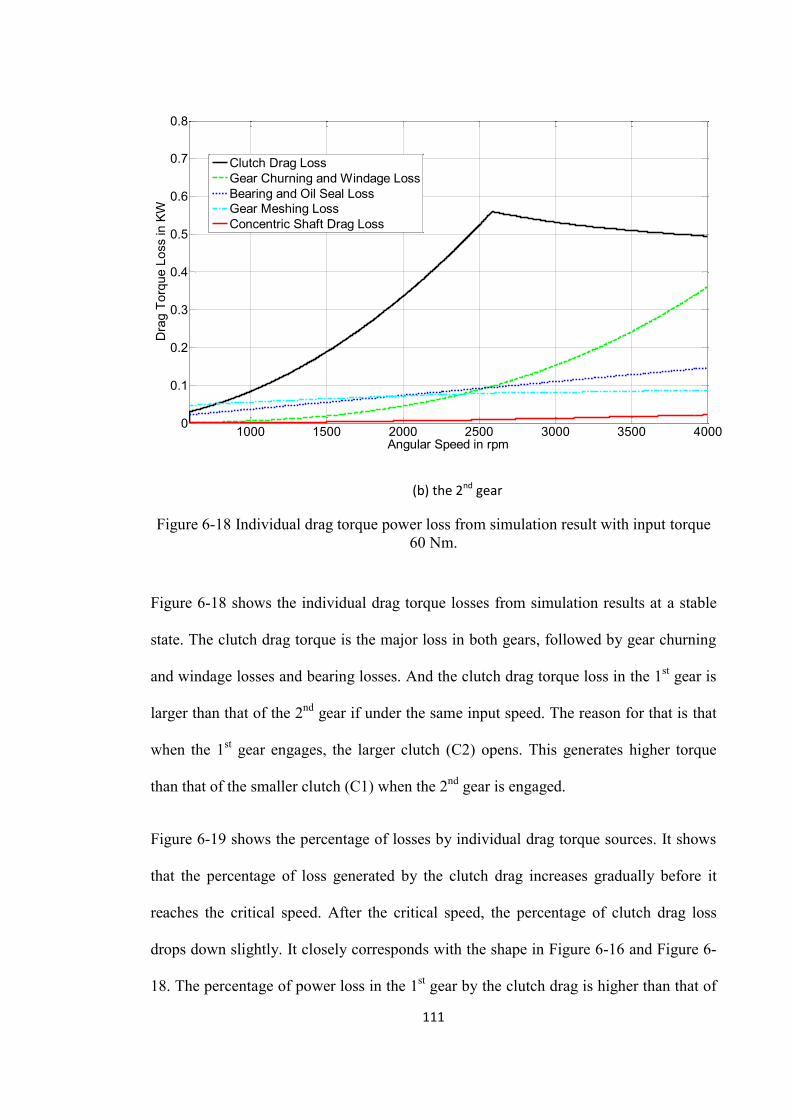
111
(b) the 2nd gear
Figure 6-18 Individual drag torque power loss from simulation result with input torque 60 Nm.
Figure 6-18 shows the individual drag torque losses from simulation results at a stable
state. The clutch drag torque is the major loss in both gears, followed by gear churning
and windage losses and bearing losses. And the clutch drag torque loss in the 1st gear is
larger than that of the 2nd gear if under the same input speed. The reason for that is that
when the 1st gear engages, the larger clutch (C2) opens. This generates higher torque
than that of the smaller clutch (C1) when the 2nd gear is engaged.
Figure 6-19 shows the percentage of losses by individual drag torque sources. It shows
that the percentage of loss generated by the clutch drag increases gradually before it
reaches the critical speed. After the critical speed, the percentage of clutch drag loss
drops down slightly. It closely corresponds with the shape in Figure 6-16 and Figure 6-
18. The percentage of power loss in the 1st gear by the clutch drag is higher than that of
1000 1500 2000 2500 3000 3500 40000
0.1
0.2
0.3
0.4
0.5
0.6
0.7
0.8
Angular Speed in rpm
Dra
g To
rque
Los
s in
KW
Clutch Drag LossGear Churning and Windage LossBearing and Oil Seal LossGear Meshing LossConcentric Shaft Drag Loss
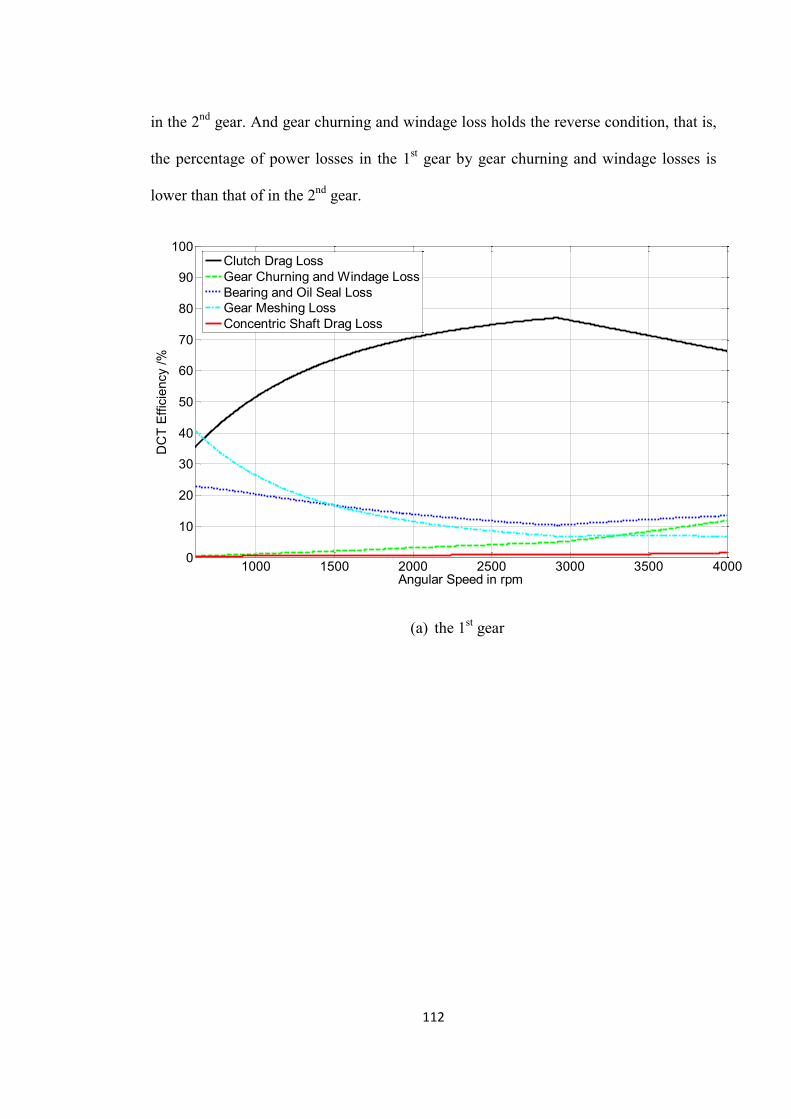
112
in the 2nd gear. And gear churning and windage loss holds the reverse condition, that is,
the percentage of power losses in the 1st gear by gear churning and windage losses is
lower than that of in the 2nd gear.
(a) the 1st gear
1000 1500 2000 2500 3000 3500 40000
10
20
30
40
50
60
70
80
90
100
Angular Speed in rpm
DC
T Ef
ficie
ncy
/%
Clutch Drag LossGear Churning and Windage LossBearing and Oil Seal LossGear Meshing LossConcentric Shaft Drag Loss
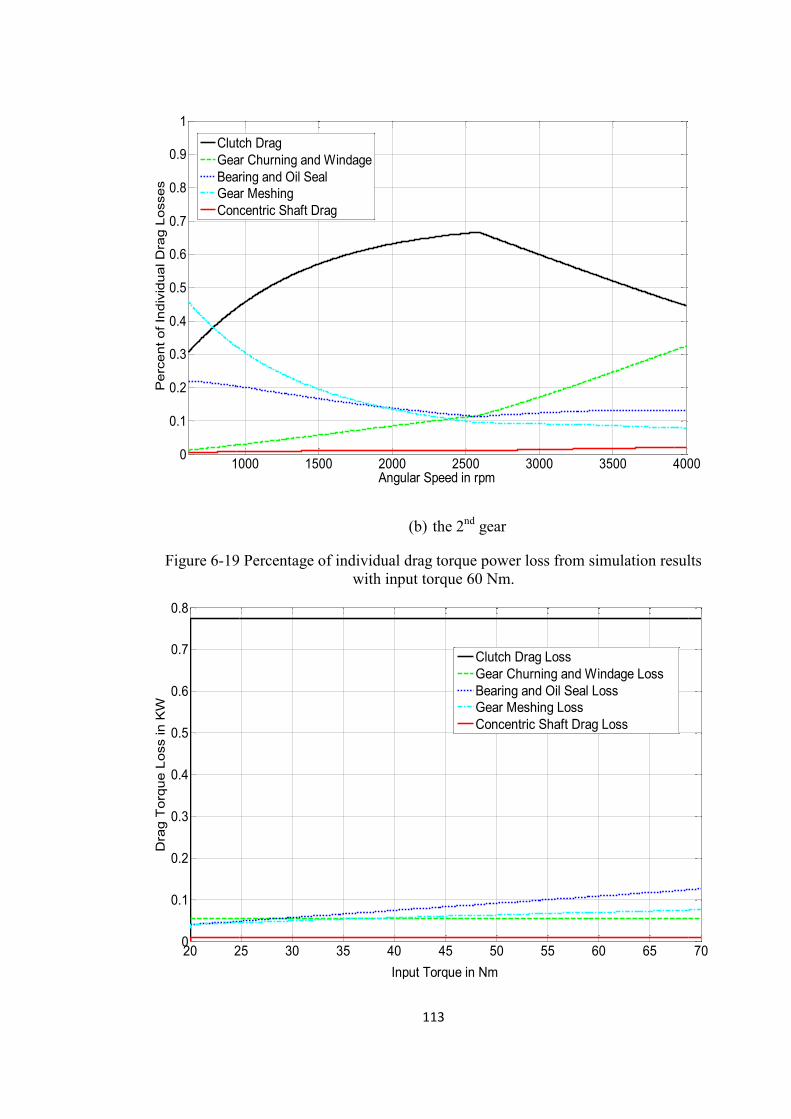
113
(b) the 2nd gear
Figure 6-19 Percentage of individual drag torque power loss from simulation results with input torque 60 Nm.
1000 1500 2000 2500 3000 3500 40000
0.1
0.2
0.3
0.4
0.5
0.6
0.7
0.8
0.9
1
Angular Speed in rpm
Per
cent
of I
ndiv
idua
l Dra
g Lo
sses
Clutch DragGear Churning and WindageBearing and Oil SealGear MeshingConcentric Shaft Drag
20 25 30 35 40 45 50 55 60 65 700
0.1
0.2
0.3
0.4
0.5
0.6
0.7
0.8
Input Torque in Nm
Dra
g T
orqu
e Lo
ss in
KW
Clutch Drag LossGear Churning and Windage LossBearing and Oil Seal LossGear Meshing LossConcentric Shaft Drag Loss
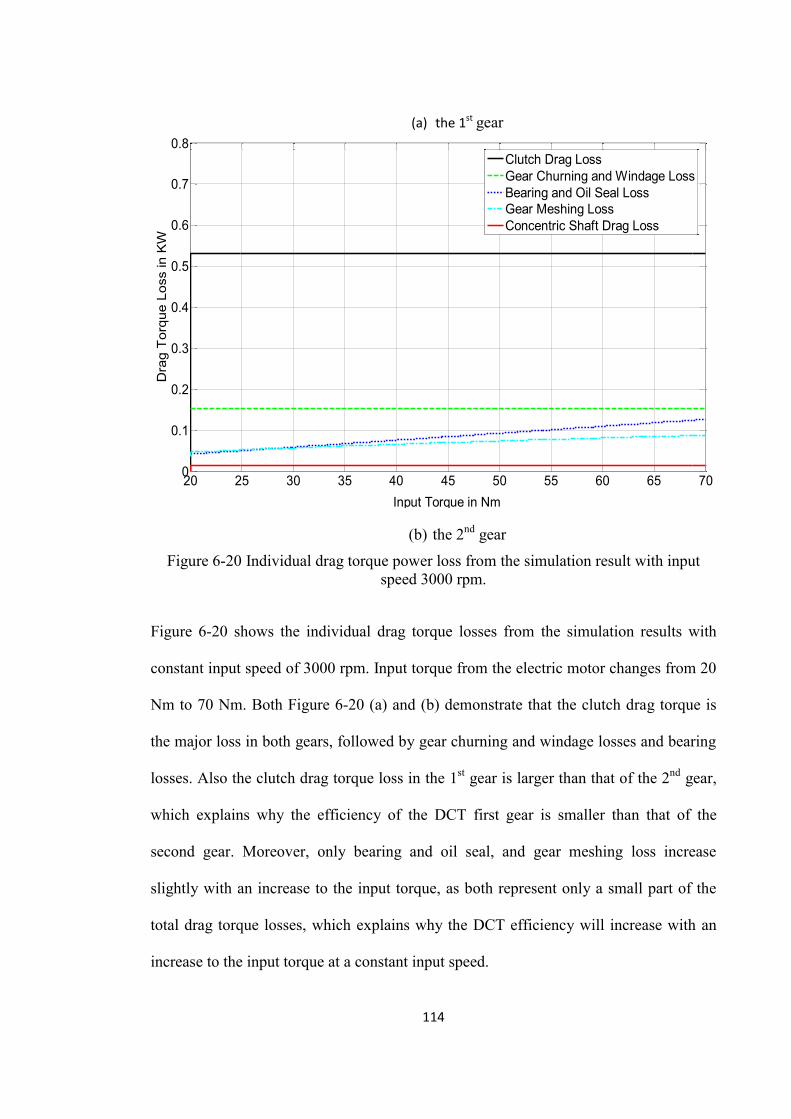
114
(a) the 1st gear
(b) the 2nd gear
Figure 6-20 Individual drag torque power loss from the simulation result with input speed 3000 rpm.
Figure 6-20 shows the individual drag torque losses from the simulation results with
constant input speed of 3000 rpm. Input torque from the electric motor changes from 20
Nm to 70 Nm. Both Figure 6-20 (a) and (b) demonstrate that the clutch drag torque is
the major loss in both gears, followed by gear churning and windage losses and bearing
losses. Also the clutch drag torque loss in the 1st gear is larger than that of the 2nd gear,
which explains why the efficiency of the DCT first gear is smaller than that of the
second gear. Moreover, only bearing and oil seal, and gear meshing loss increase
slightly with an increase to the input torque, as both represent only a small part of the
total drag torque losses, which explains why the DCT efficiency will increase with an
increase to the input torque at a constant input speed.
20 25 30 35 40 45 50 55 60 65 700
0.1
0.2
0.3
0.4
0.5
0.6
0.7
0.8
Input Torque in Nm
Dra
g T
orqu
e Lo
ss in
KW
Clutch Drag LossGear Churning and Windage LossBearing and Oil Seal LossGear Meshing LossConcentric Shaft Drag Loss
115
6.6 Conclusions
The purpose of this chapter is to discuss the experiments on drag torque performed on
the UTS powertrain test rig in order to investigate the theoretical study introduced in
last chapter.
The test results for DCT efficiency agree reasonabley accurately with the simulation
results, especially the critical speed prediction. The average error in DCT efficiency is
less than 0.5%. It can be concluded that the proposed model performs well in the
prediction of drag torques for the transmission, and this can be applied to assess the
efficiency of the transmission. Results demonstrate that (1) the mean two-speed DCT
efficiency can reach 95%. (2)And the efficiency of DCT grows when the input torque
increases, and decreases with the rise of input speed. Additionally, (3) the entire drag
torque is dominated by the viscous shear in the wet clutch pack followed by the
differential gear churning and windage losses. (4) Moreover, when the vehicle runs in
the 2nd gear, the drag torque generated by clutch shear stress is smaller than that of
running in the 1st gear at the same input speed. (5) The gear churning and windage
losses for the 2nd gear, however, are larger than that of those in the 1st gear.
This work can be looked as a reference for: future research on reducing drag torque,
applications of drag torque in two-speed or multi-speed electric vehicle powertrain
system efficiency optimisations and torque estimated shift control. With some slight
adjustments according to the detailed transmissions layout, this numerical method for
predicting the two-speed DCT drag torque can also be applied to other transmissions
equipped with wet clutch packages, as well as in standard manual transmission.
116
Chapter 7 NUMERICAL AND EXPERIMENTAL STUDY OF DCT THERMAL
BEHAVIOUR
7.1 Introduction
In recent years there has been considerable effort devoted to producing high energy
efficient vehicles and machines, not only for economic reasons, but also to contribute to
meet the requirement for emissions reduction. Improvement of the fuel energy
efficiency of existing technologies and reduction of greenhouse gas emissions are some
of the most important reasons for developing new vehicle technologies. Generally, in
conventional combustion vehicles, one-third of the fuel energy is used to overcome
friction in the powertrain system, including the engine, transmission, tires and brakes.
By making the best use of new technologies for friction or wear reduction in vehicles,
friction losses can be cut down by 18% in the short term (5-10 years) and by 61% in the
long term (15-25 years).Furthermore, the energy losses related to friction in a pure
electric vehicle (EV) are estimated to be only half those of a conventional combustion
vehicle[133].As a consequence, the development of commercially viable HEVs for
using in the short to medium term, and pure EVs and FCVs in the long term represent
the automotive industry’s major initiatives towards solving these related issues[1].
Pure EVs currently being used in the market are mainly equipped with single speed
transmissions, with the tradeoff being between dynamic (such as climbing ability, top
speed, and acceleration) and economic performance (drive range).Nowadays, more and
more EV researchers and designers are paying attention to the application of multiple
speed transmissions instead of traditional single speed transmissions, as these are
expected to improve the EV performance. The usage of multi-speed transmissions for
117
electric vehicles is able to improve average motor efficiency and range capacity. It can
even reduce the required motor size, as has been discussed in our previous work[103,
106, 134].
Computer calculations and simulations are now part of the design of new types of
transmissions processes, as prototype tests are more expensive and time consuming.
Thermal behaviour is not often considered in the preliminary design step as pointed out
by Lechner[22]. In fact, a thermal expansion of transmission cases, for example, can
change gear axes geometry positions, gears clearances, lubricant types and film
conditions, and as a consequence, dissipated heat during work. Furthermore, it is of
great importance to know the temperature of oil lubricated transmission systems, and
the quantity of required oil cooling. The prediction of thermal behaviour of a
transmission is beneficial to the evaluation of cooling and lubrication conditions.
Therefore, understanding the thermal behaviour of automotive transmissions is essential
for a number of design considerations, notably cooling system design, operational
behaviour and reliability. Further, it is necessary to develop effective models to predict
the transmissions thermal behaviour.
Transmission thermal behaviour is directly affected by the heat generated from
transmission power losses. Hence, it is important to study the sources of power losses in
a transmission as part of the model development. The total power losses within a gear-
train for any transmission are generally made up from several sources, including gear
friction[7-10],windage[11-13]and oil churning[14, 15]. Other important drag torque
sources have to be considered as well e.g. comprising bearings and seals[15-17],
synchronizer and free-pinion losses[18, 19]. There are only a few reported works on the
entire transmission power losses [70, 123-126], which mostly focus on the manual
118
transmission gearbox. These therefore do not include clutch losses in the transmission
models.
Some works [135-139] have been done considering the whole transmission system for
thermal analysis. However, these approaches mainly focus on manual or automatic
transmission. There is limited, if any, published work which combines the gearbox
components and wet clutch losses[140] in one study. In particular, there is no published
report on the study of thermal behaviour within a wet dual clutch transmission (DCT). If
the clutch is immersed in oil, torsional resistance and its influences caused by the
viscous shear between wet clutch plates should be considered as well[20, 21], as these
will significantly influence on the power losses and temperature as well.
This chapter performs research on wet dual clutch transmission thermal behaviour
together with power losses. Due to the particular structure of DCT, the power loss
components include wet clutches, concentric shaft, power losses caused by gear
meshing, gear windage, churning, bearing losses and oil seal losses. As temperature has
a significant impact on the characteristic of lubricate, in order to demonstrate the
effectiveness of the model, simulations and experimental investigation are conducted.
These are based on the presented drag torque model and developed heat dissipation
model and they use different assumed temperatures and power losses.
This chapter is organised as follows. In the 2nd section, after briefly discussing the
different source of power losses in the DCT, the thermal behaviour model will be
introduced and modelled. Then experimental aspects comprising the description of the
UTS test rig, and the power loss and thermal rise test procedures are presented and
discussed in the 3rd section. In the 4th section, results from three aspects will be
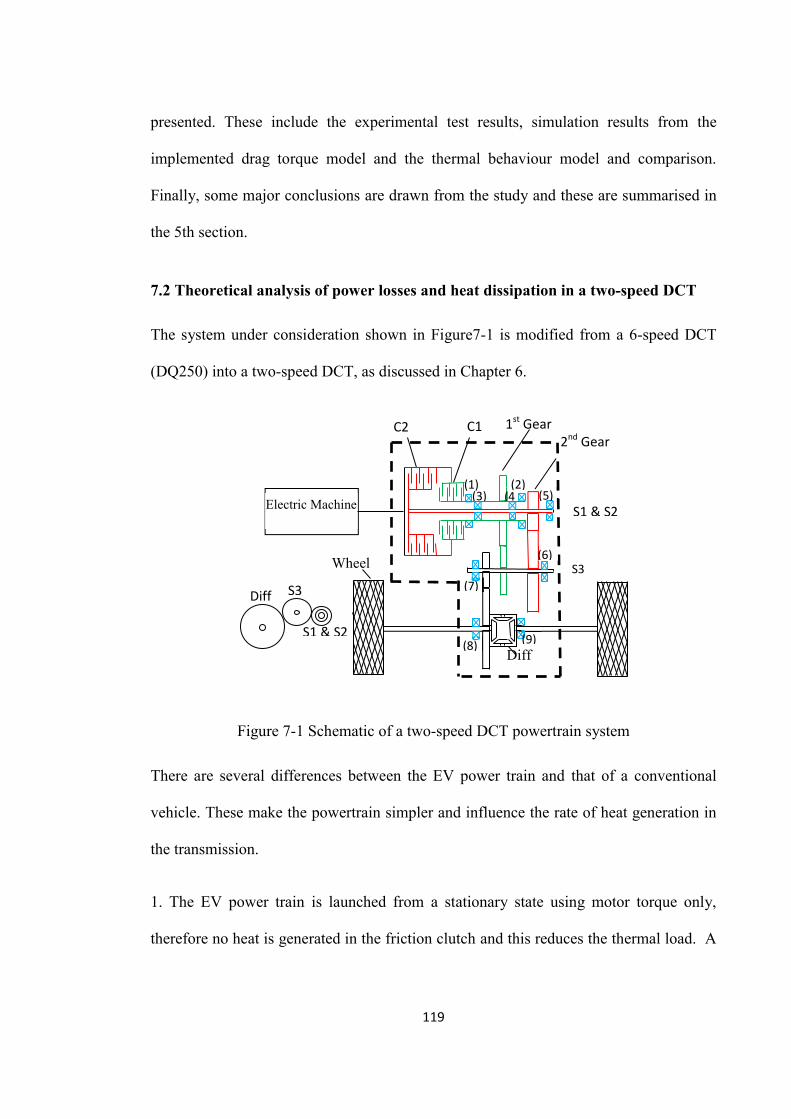
119
presented. These include the experimental test results, simulation results from the
implemented drag torque model and the thermal behaviour model and comparison.
Finally, some major conclusions are drawn from the study and these are summarised in
the 5th section.
7.2 Theoretical analysis of power losses and heat dissipation in a two-speed DCT
The system under consideration shown in Figure7-1 is modified from a 6-speed DCT
(DQ250) into a two-speed DCT, as discussed in Chapter 6.
Figure 7-1 Schematic of a two-speed DCT powertrain system
There are several differences between the EV power train and that of a conventional
vehicle. These make the powertrain simpler and influence the rate of heat generation in
the transmission.
1. The EV power train is launched from a stationary state using motor torque only,
therefore no heat is generated in the friction clutch and this reduces the thermal load. A
Diff
C1 1st Gear C2
S1 & S2
2nd Gear
S3
S1 & S2
S3
Diff
Electric Machine
Wheel
(1) (5) (4
(7)
(6)
(9) (8)
(2) 1)(3)
120
conventional DCT will use friction clutches to launch the vehicle thereby generating
considerable friction energy.
2. No synchronisers are used in the powertrain, so wet clutch drag will always
contribute to powertrain losses.
3. The wider operating region of an electric motor requires fewer gear pairs in the
transmission, in this case only two gears are used in the DCT. Therefore there are
significantly fewer gear changes in the transmission [103], and this also reduces
thermal load.
7.2.1 Power losses analysis
The sources of power loss in a two-speed DCT, or drag torque, can be divided into five
major origins: gears related meshing, windage and churning losses, bearings and oil seal
related losses, concentric shaft related viscous shear loss, and disengaged wet clutch
caused drag torque losses, as shown in Eq. (7.1). For each individual power loss source,
the following formulae have been implemented in the simulation code.
P = P + ∑ P + ∑ P + P + P (7.1)
Where P is total power losses in DCT, P is power losses caused by concentric shaft
drag torque, P is power losses caused by bearings drag torque, P is power losses
caused by gear meshing drag torque, P is power losses caused by gear churning, P is
power losses caused by wet clutch plates drag torque.
121
Other detailed numerical analysis regarding drag torque losses can be found in Chapter
5.
7.2.2 Heat dissipation
Given the rigorous development required for standards, the BS/ISO (2001) model is
adopted to analyse the transmission heat dissipation[19].
The quantity of heat, Q , dissipated through the dual clutch transmission case by
convection can be calculated by:
Q = kA (T − T ) (7.2)
where, k represents the heat transmission coefficient, which includes the internal heat
transfer between oil and case, and the heat conduction through the case wall and the
external heat transfer to the environment, usually surrounding air.T and T mean the
oil temperature and environment temperature respectively with unit of Kelvin.
=α
+ δλ
+α
(7.3)
The heat dissipation via the DCT case is determined by the larger value air-side, i.e.
external side, thermal resistance at the case surface. The front two terms in the above
equation can then be ignored. For high air velocities and thus good external heat transfer,
it will probably be necessary to also consider of the oil-side heat transfer. As a reference
value, oil-side heat transfer coefficient , 𝛼 = 200 𝑊/𝑚 𝐾 , can be assumed. But it
requires investigation and revision for different oil types. The heat conduction through
the transmission case should only be considered in special cases, such as in the case of
double-walled cases, cases with insulation and non-metallic cases. And the appropriate
122
coefficient of thermal conduction, λ , has to be expressed for the case material in
question.
The air-side heat conduction, α , includes a convection part,α , and a radiation
part,α , which performs as
α = α + α (7.4)
α = 0.23 ∗ 10 ε (7.5)
where the emission ratio, ε, is obtained as 0.05.
The convection part can be divided into two parts, free and forced convection.
According to the investigations by Funck [141], the following expressions can be
presented:
α = α (1 − ) + α η∗ (7.6)
where
η∗ = (7.7)
As this DCT case is without thermal finning, the free and forced convection can be
followed as:
For free convection (V ≤ 1.5m/s):
α = 18h ..
(7.8)
For forced convection (V > 1.5𝑚/𝑠):
α = . ( ∗) . (7.9)
123
Where
R ∗ = R +.
(7.10)
R = (7.11)
G = ( ) (7.12)
7.2.3 DCT temperature rise model
In the DCT, all of the power losses 𝑃 caused by friction and viscous shear will be
changed into heat. From Eq. (7.1), the overall quantity of DCT heat 𝑄 can be obtained
as:
Q = P t (7.13)
The generated heat is partially absorbed by oil 𝑄 and DCT structure𝑄 , and partially
dissipated by the transmission case𝑄 ,
Q = Q + Q + Q (7.14)
The heat absorbed by the lubricative oil and the DCT can be obtained using specific
heat equation, respectively.
Q = c m ∆T (7.15)
Q = c m ∆T (7.16)
Q = Q + c m ∆T + c m ∆T
124
Where c and c are the specific heat of oil and average transmission respectively,
and the m and m are the mass of oil and DCT. The increased temperature, ∆𝑇, is
caused by absorbing heat.
Combining Eq. (7.13) to Eq. (7.14), the increased temperature can be achieved;
therefore the rise of the temperature can be expressed as:
T = T + ∆T (7.17)
7.3 Experimental apparatus
In this section, test facility and hardware, test instrumentation, data acquisition, and test
operation will be briefly presented.
7.3.1 Test facility and hardware
The foundation test facilities used for this chapter are the same as that shown in Chapter
6, i.e., using the UTS powertrain system test rig. The new test rig is based on an electric
vehicle power train system, with a 330V DC drive permanent magnet motor which is
powered from AC high voltage electric power. The motor derived the wheels through
the modified two-speed DCT, and the transmission parameters are shown in Table 7-1.
A group of flywheels and tires are used to simulate the vehicle inertia. The
dynamometer, HPA engine stand 203, as shown in Figure 7-2, is used to apply load on
the flywheels. This part of the test rig consists of two wheels which make contact with
flywheels, and another final drive which is connected with the shaft before the
dynamometer. The DCT has a separate supply pump. The lubricate fluid will be DCTF
rather than ATF as shown in Table 7-2. And the vehicle control unit (VCU) and
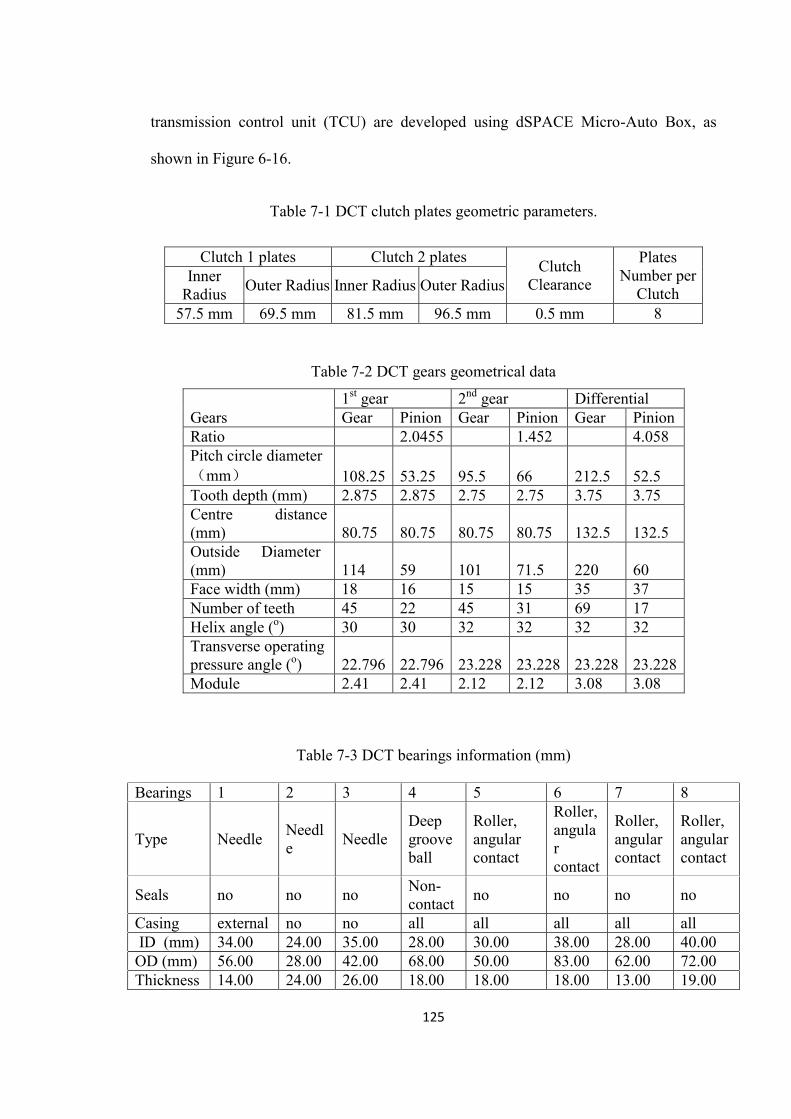
125
transmission control unit (TCU) are developed using dSPACE Micro-Auto Box, as
shown in Figure 6-16.
Table 7-1 DCT clutch plates geometric parameters.
Clutch 1 plates Clutch 2 plates Clutch Clearance
Plates Number per
Clutch Inner
Radius Outer Radius Inner Radius Outer Radius
57.5 mm 69.5 mm 81.5 mm 96.5 mm 0.5 mm 8
Table 7-2 DCT gears geometrical data
Gears 1st gear 2nd gear Differential Gear Pinion Gear Pinion Gear Pinion
Ratio 2.0455 1.452 4.058 Pitch circle diameter
mm 108.25 53.25 95.5 66 212.5 52.5 Tooth depth (mm) 2.875 2.875 2.75 2.75 3.75 3.75 Centre distance (mm) 80.75 80.75 80.75 80.75 132.5 132.5 Outside Diameter (mm) 114 59 101 71.5 220 60 Face width (mm) 18 16 15 15 35 37 Number of teeth 45 22 45 31 69 17 Helix angle (o) 30 30 32 32 32 32 Transverse operating pressure angle (o) 22.796 22.796 23.228 23.228 23.228 23.228 Module 2.41 2.41 2.12 2.12 3.08 3.08
Table 7-3 DCT bearings information (mm)
Bearings 1 2 3 4 5 6 7 8
Type Needle Needle Needle
Deep groove ball
Roller, angular contact
Roller, angular contact
Roller, angular contact
Roller, angular contact
Seals no no no Non- contact no no no no
Casing external no no all all all all all ID (mm) 34.00 24.00 35.00 28.00 30.00 38.00 28.00 40.00 OD (mm) 56.00 28.00 42.00 68.00 50.00 83.00 62.00 72.00 Thickness 14.00 24.00 26.00 18.00 18.00 18.00 13.00 19.00
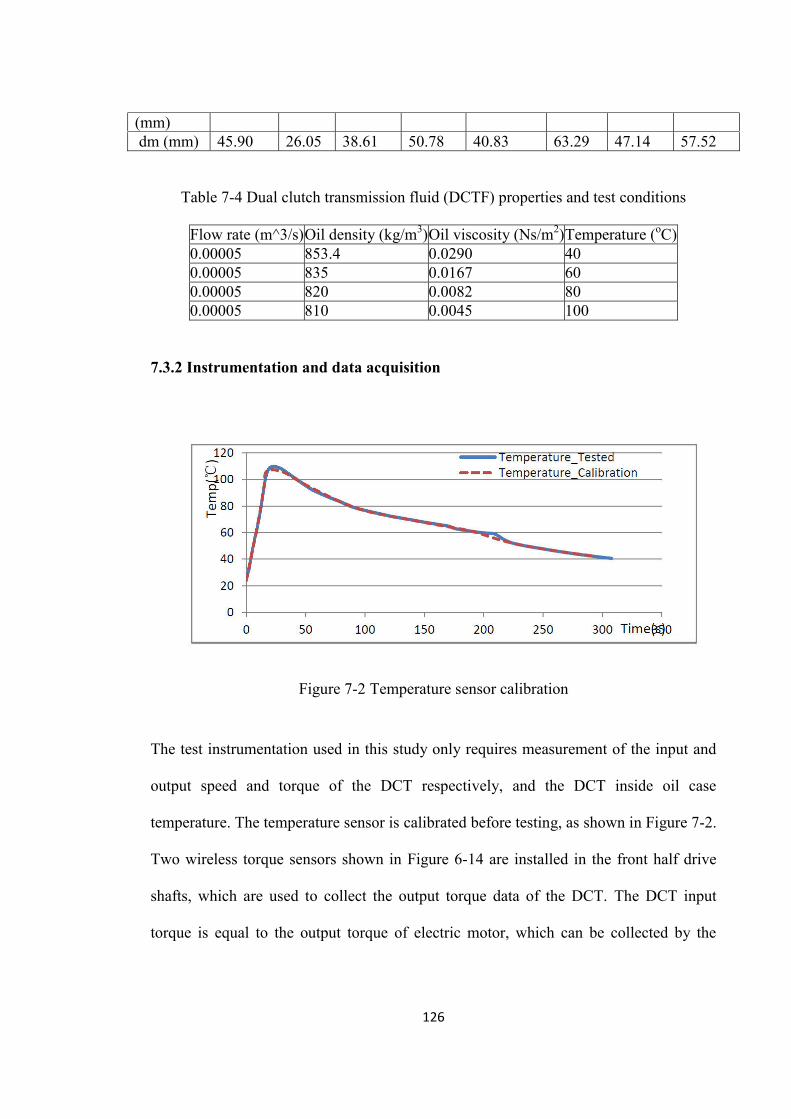
126
(mm) dm (mm) 45.90 26.05 38.61 50.78 40.83 63.29 47.14 57.52
Table 7-4 Dual clutch transmission fluid (DCTF) properties and test conditions
Flow rate (m^3/s) Oil density (kg/m3) Oil viscosity (Ns/m2) Temperature (oC) 0.00005 853.4 0.0290 40 0.00005 835 0.0167 60 0.00005 820 0.0082 80 0.00005 810 0.0045 100
7.3.2 Instrumentation and data acquisition
Figure 7-2 Temperature sensor calibration
The test instrumentation used in this study only requires measurement of the input and
output speed and torque of the DCT respectively, and the DCT inside oil case
temperature. The temperature sensor is calibrated before testing, as shown in Figure 7-2.
Two wireless torque sensors shown in Figure 6-14 are installed in the front half drive
shafts, which are used to collect the output torque data of the DCT. The DCT input
torque is equal to the output torque of electric motor, which can be collected by the
127
motor feedback torque. This data was collected at 1000 samples per second throughout
the test via the dSPACE Control Desk Recorder, and then processed in a computer.
7.3.3 Test operation
In order to also reach the two-speed DCT maximum speed design requirements, during
the temperature durability test, the vehicle speed should be able to reach over 70 km/h
when running in the 1st gear. And for the second speed, the vehicle speed should be
more than 120 km/h. The final temperature results should be obtained from stable status,
that is, the temperature will not continue to increase while the vehicle continues to run.
7.4 Results and analysis
After implementing the developed drag torque and thermal behaviour model via
simulation, and conducting the experimental test, results from the test and simulations
will be presented and analysed in this section.
In order to investigate the effectiveness of the proposed thermal behaviour model,
experimental tests are made on the UTS electric vehicle powertrain system test rig.
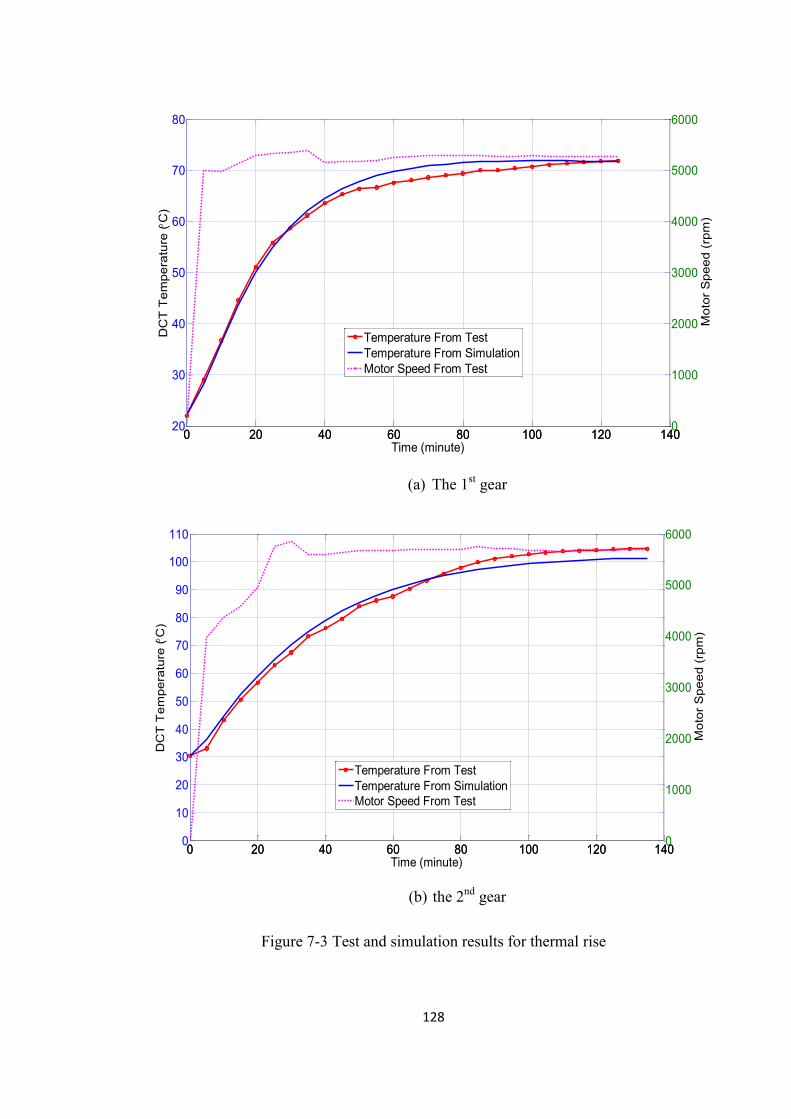
128
(a) The 1st gear
(b) the 2nd gear
Figure 7-3 Test and simulation results for thermal rise
0 20 40 60 80 100 120 14020
30
40
50
60
70
80
DC
T T
empe
ratu
re (
C)
Time (minute)
0 20 40 60 80 100 120 1400
1000
2000
3000
4000
5000
6000
Mot
or S
peed
(rp
m)
Temperature From TestTemperature From SimulationMotor Speed From Test
0 20 40 60 80 100 120 1400
10
20
30
40
50
60
70
80
90
100
110
DC
T T
empe
ratu
re (
C)
Time (minute)
0 20 40 60 80 100 120 1400
1000
2000
3000
4000
5000
6000
Mot
or S
peed
(rp
m)
Temperature From TestTemperature From SimulationMotor Speed From Test
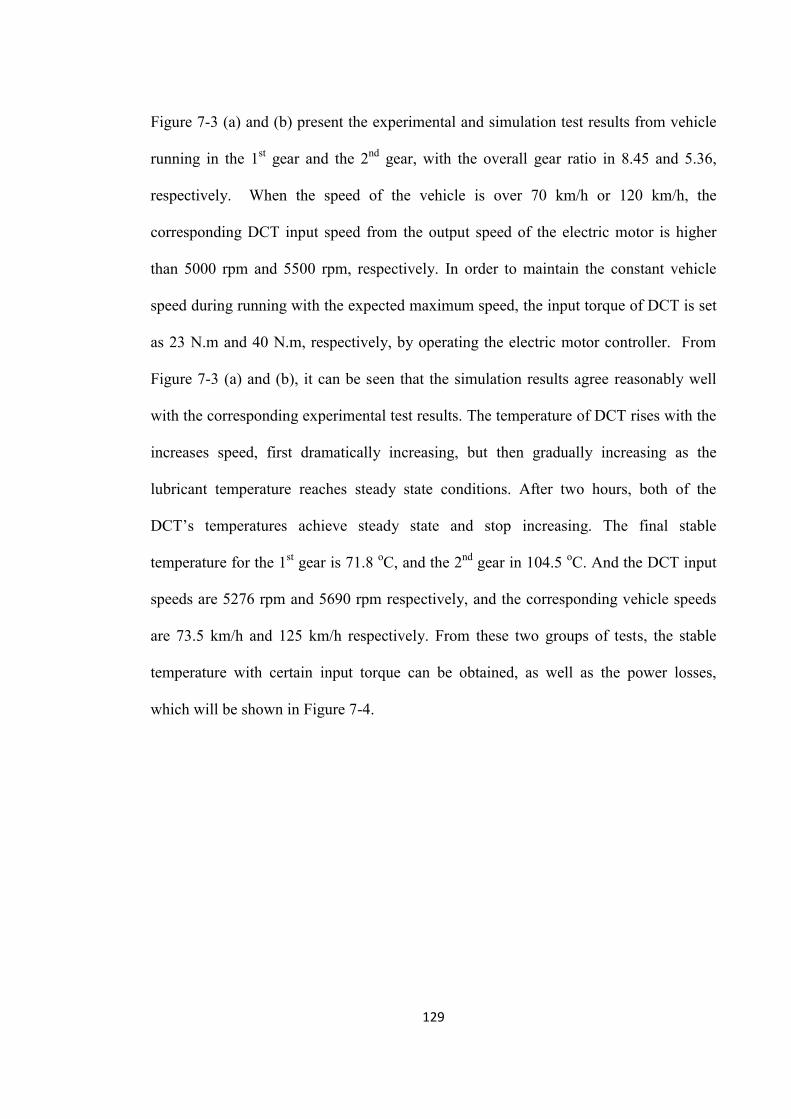
129
Figure 7-3 (a) and (b) present the experimental and simulation test results from vehicle
running in the 1st gear and the 2nd gear, with the overall gear ratio in 8.45 and 5.36,
respectively. When the speed of the vehicle is over 70 km/h or 120 km/h, the
corresponding DCT input speed from the output speed of the electric motor is higher
than 5000 rpm and 5500 rpm, respectively. In order to maintain the constant vehicle
speed during running with the expected maximum speed, the input torque of DCT is set
as 23 N.m and 40 N.m, respectively, by operating the electric motor controller. From
Figure 7-3 (a) and (b), it can be seen that the simulation results agree reasonably well
with the corresponding experimental test results. The temperature of DCT rises with the
increases speed, first dramatically increasing, but then gradually increasing as the
lubricant temperature reaches steady state conditions. After two hours, both of the
DCT’s temperatures achieve steady state and stop increasing. The final stable
temperature for the 1st gear is 71.8 oC, and the 2nd gear in 104.5 oC. And the DCT input
speeds are 5276 rpm and 5690 rpm respectively, and the corresponding vehicle speeds
are 73.5 km/h and 125 km/h respectively. From these two groups of tests, the stable
temperature with certain input torque can be obtained, as well as the power losses,
which will be shown in Figure 7-4.
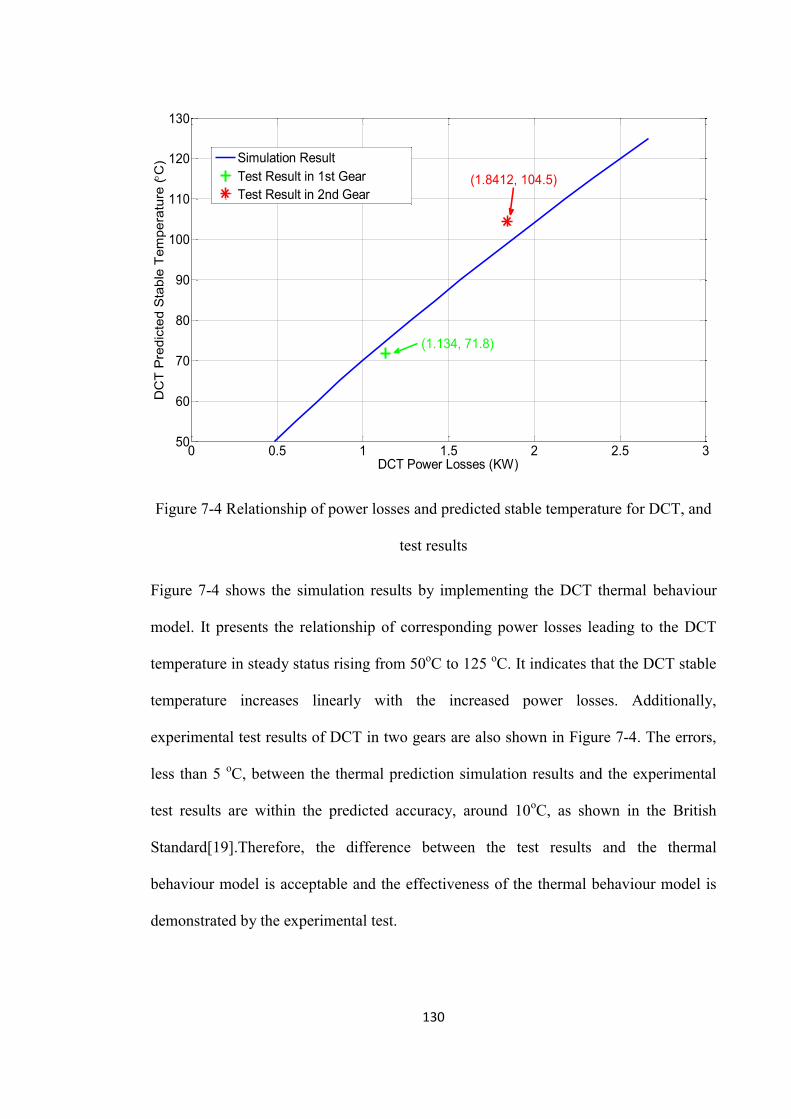
130
Figure 7-4 Relationship of power losses and predicted stable temperature for DCT, and
test results
Figure 7-4 shows the simulation results by implementing the DCT thermal behaviour
model. It presents the relationship of corresponding power losses leading to the DCT
temperature in steady status rising from 50oC to 125 oC. It indicates that the DCT stable
temperature increases linearly with the increased power losses. Additionally,
experimental test results of DCT in two gears are also shown in Figure 7-4. The errors,
less than 5 oC, between the thermal prediction simulation results and the experimental
test results are within the predicted accuracy, around 10oC, as shown in the British
Standard[19].Therefore, the difference between the test results and the thermal
behaviour model is acceptable and the effectiveness of the thermal behaviour model is
demonstrated by the experimental test.
0 0.5 1 1.5 2 2.5 350
60
70
80
90
100
110
120
130
DCT Power Losses (KW)
DC
T P
redi
cted
Sta
ble
Tem
pera
ture
( C
)
Simulation ResultTest Result in 1st GearTest Result in 2nd Gear
(1.8412, 104.5)
(1.134, 71.8)
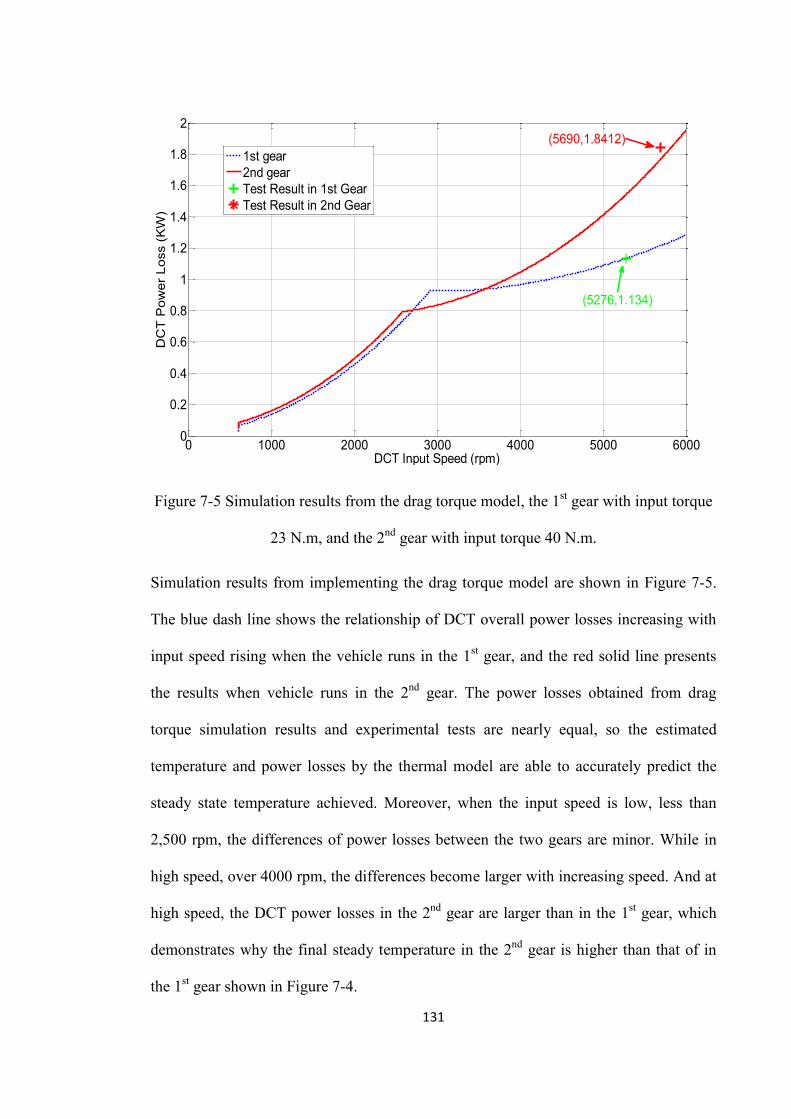
131
Figure 7-5 Simulation results from the drag torque model, the 1st gear with input torque
23 N.m, and the 2nd gear with input torque 40 N.m.
Simulation results from implementing the drag torque model are shown in Figure 7-5.
The blue dash line shows the relationship of DCT overall power losses increasing with
input speed rising when the vehicle runs in the 1st gear, and the red solid line presents
the results when vehicle runs in the 2nd gear. The power losses obtained from drag
torque simulation results and experimental tests are nearly equal, so the estimated
temperature and power losses by the thermal model are able to accurately predict the
steady state temperature achieved. Moreover, when the input speed is low, less than
2,500 rpm, the differences of power losses between the two gears are minor. While in
high speed, over 4000 rpm, the differences become larger with increasing speed. And at
high speed, the DCT power losses in the 2nd gear are larger than in the 1st gear, which
demonstrates why the final steady temperature in the 2nd gear is higher than that of in
the 1st gear shown in Figure 7-4.
0 1000 2000 3000 4000 5000 60000
0.2
0.4
0.6
0.8
1
1.2
1.4
1.6
1.8
2
DCT Input Speed (rpm)
DC
T P
ower
Los
s (K
W)
1st gear2nd gearTest Result in 1st GearTest Result in 2nd Gear
(5690,1.8412)
(5276,1.134)
132
Through the means of combining Figure 7-4 and Figure 7-5, different stable
temperatures can be estimated at different motor speeds, such as 2000 rpm, 3000 rpm,
etc. Simulation results for DCT thermal rise characteristics are shown in Figure 7-6 with
different input speeds as well. The environment temperature of both gears is set at 25 oC.
It can be seen that the higher the input speed, the acceleration of thermal rise is higher.
And the final stable temperature is influenced by the speed.
(a) the 1st gear
0 20 40 60 80 100 120 1400
10
20
30
40
50
60
70
80
90
DC
T Te
mpe
ratu
re (
C)
Time (minute)
0 20 40 60 80 100 120 1400
1000
2000
3000
4000
5000
6000
7000
Mot
or S
peed
(rpm
)
DCT temp 2000 rpmDCT temp 3000 rpmDCT temp 4000 rpmDCT temp 5000 rpmDCT temp 6000 rpmMotor Speed 2000 rpmMotor Speed 3000 rpmMotor Speed 4000 rpmMotor Speed 5000 rpmMotor Speed 6000 rpm
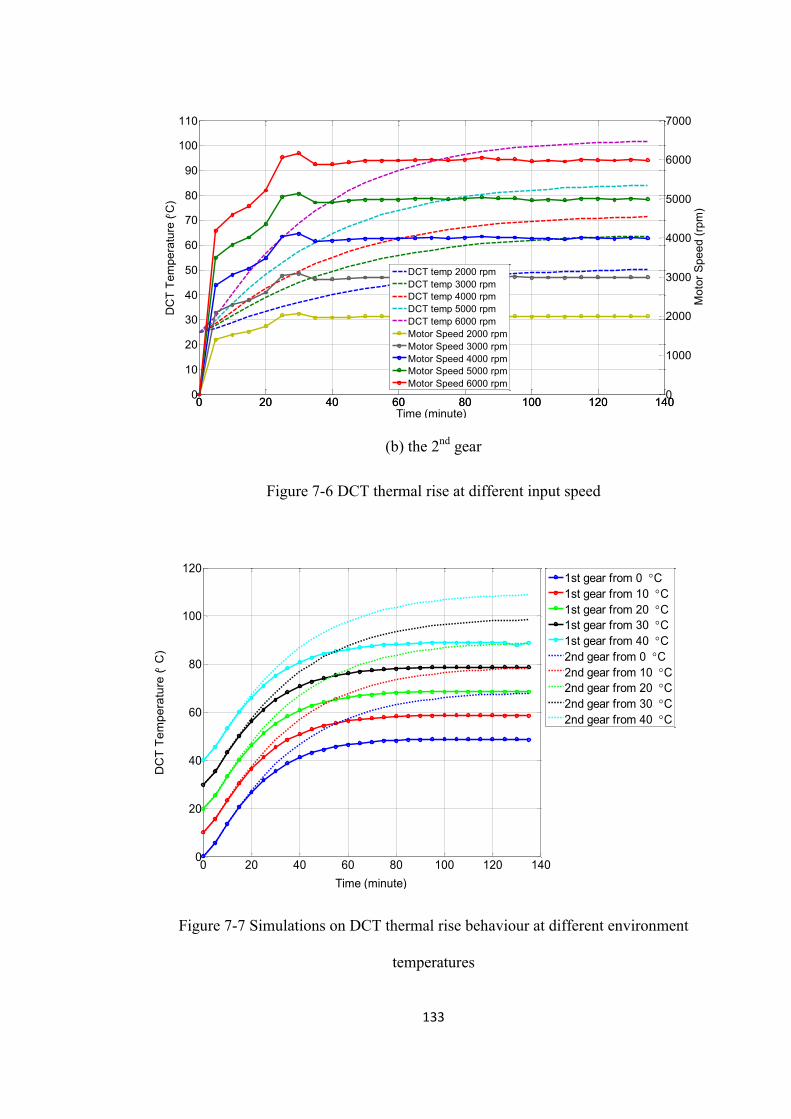
133
(b) the 2nd gear
Figure 7-6 DCT thermal rise at different input speed
Figure 7-7 Simulations on DCT thermal rise behaviour at different environment
temperatures
0 20 40 60 80 100 120 1400
10
20
30
40
50
60
70
80
90
100
110
DC
T Te
mpe
ratu
re (
C)
Time (minute)
0 20 40 60 80 100 120 1400
1000
2000
3000
4000
5000
6000
7000
Mot
or S
peed
(rpm
)
DCT temp 2000 rpmDCT temp 3000 rpmDCT temp 4000 rpmDCT temp 5000 rpmDCT temp 6000 rpmMotor Speed 2000 rpmMotor Speed 3000 rpmMotor Speed 4000 rpmMotor Speed 5000 rpmMotor Speed 6000 rpm
0 20 40 60 80 100 120 1400
20
40
60
80
100
120
Time (minute)
DC
T Te
mpe
ratu
re (
C)
1st gear from 0 C1st gear from 10 C1st gear from 20 C1st gear from 30 C1st gear from 40 C2nd gear from 0 C2nd gear from 10 C2nd gear from 20 C2nd gear from 30 C2nd gear from 40 C
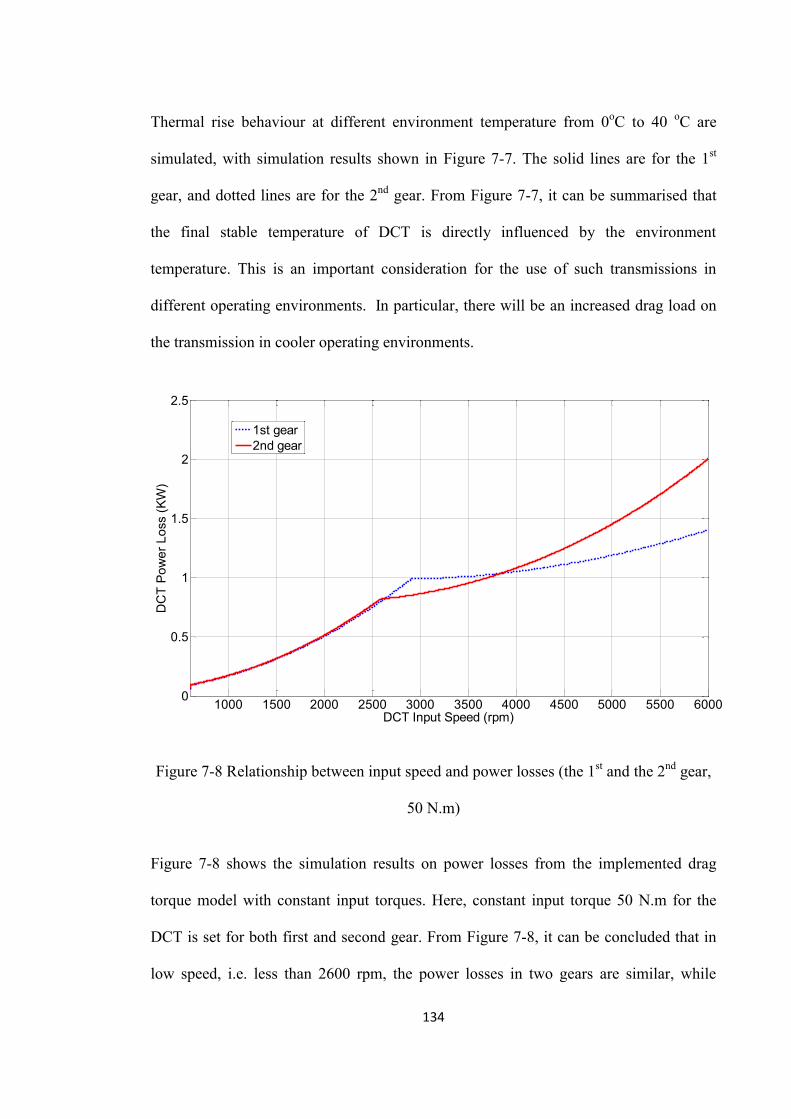
134
Thermal rise behaviour at different environment temperature from 0oC to 40 oC are
simulated, with simulation results shown in Figure 7-7. The solid lines are for the 1st
gear, and dotted lines are for the 2nd gear. From Figure 7-7, it can be summarised that
the final stable temperature of DCT is directly influenced by the environment
temperature. This is an important consideration for the use of such transmissions in
different operating environments. In particular, there will be an increased drag load on
the transmission in cooler operating environments.
Figure 7-8 Relationship between input speed and power losses (the 1st and the 2nd gear,
50 N.m)
Figure 7-8 shows the simulation results on power losses from the implemented drag
torque model with constant input torques. Here, constant input torque 50 N.m for the
DCT is set for both first and second gear. From Figure 7-8, it can be concluded that in
low speed, i.e. less than 2600 rpm, the power losses in two gears are similar, while
1000 1500 2000 2500 3000 3500 4000 4500 5000 5500 60000
0.5
1
1.5
2
2.5
DCT Input Speed (rpm)
DC
T Po
wer
Los
s (K
W)
1st gear2nd gear
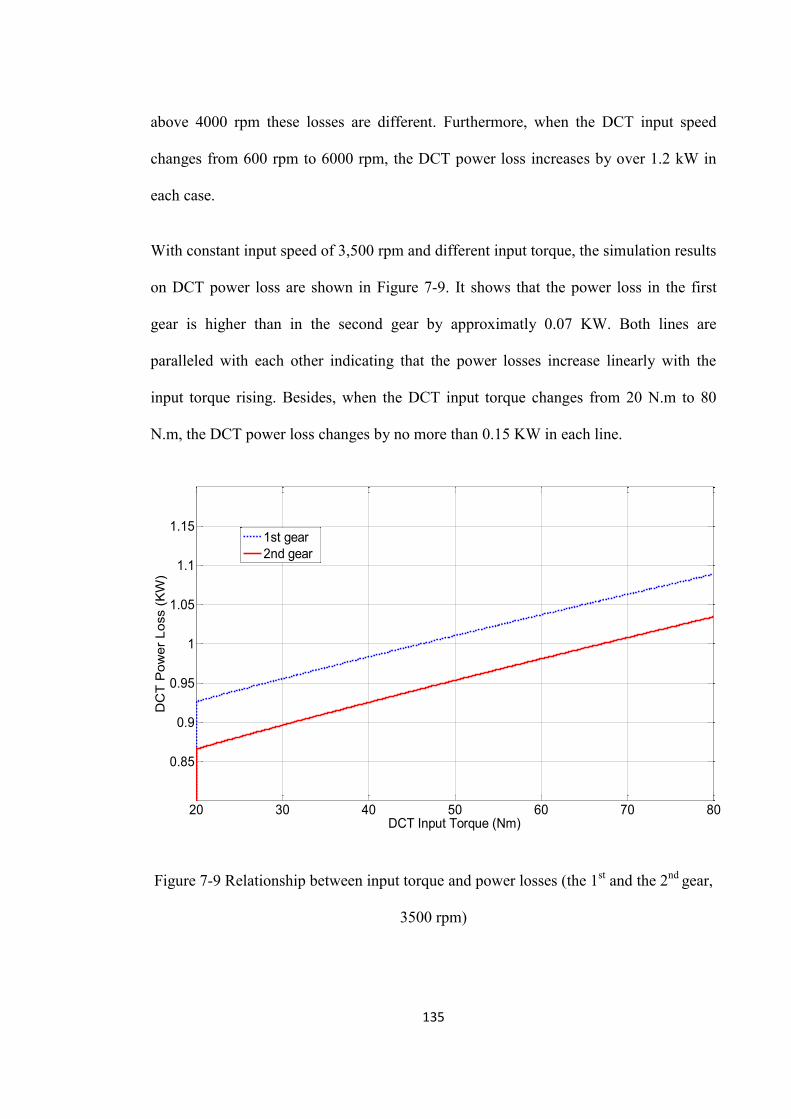
135
above 4000 rpm these losses are different. Furthermore, when the DCT input speed
changes from 600 rpm to 6000 rpm, the DCT power loss increases by over 1.2 kW in
each case.
With constant input speed of 3,500 rpm and different input torque, the simulation results
on DCT power loss are shown in Figure 7-9. It shows that the power loss in the first
gear is higher than in the second gear by approximatly 0.07 KW. Both lines are
paralleled with each other indicating that the power losses increase linearly with the
input torque rising. Besides, when the DCT input torque changes from 20 N.m to 80
N.m, the DCT power loss changes by no more than 0.15 KW in each line.
Figure 7-9 Relationship between input torque and power losses (the 1st and the 2nd gear,
3500 rpm)
20 30 40 50 60 70 80
0.85
0.9
0.95
1
1.05
1.1
1.15
DCT Input Torque (Nm)
DC
T P
ower
Los
s (K
W)
1st gear2nd gear
136
Through comparing Figure 7-8 and Figure 7-9, it can be summarised that the impact of
speed on DCT power loss is larger than that of torque, i.e. load. As all of the power
losses will be converted into heat, and dissipated, it can also be concluded that the
impact of speed on the thermal behaviour is higher than that by the load.
7.5 Conclusions
The purpose of this chapter is to develop a mathematical model of the thermal
behaviour of a prototype dual clutch transmission. This is achieved through the
integration of mathematical models of gear, bearing and clutch losses for the
transmission. These losses are defined as the sources of energy generation to heat the
lubricating oil. A thermal model of the lubricant and transmission case was also
developed to evaluate transmission heat rejection, thus achieving a balanced
heating/cooling model of the transmission. Experimental investigation of the
transmission thermal behaviour is conducted to validate the effectiveness of the
combined drag torque and thermal prediction models, with accurate steady state results
achieved.
Results from simulation and testing of transmission drag torque and thermal behaviour
resulted in the attainment of the following conclusions:
(a) This work reveals that the level of load applied to the transmission has a
minor effect in comparison to the speed dependent operation.
(b) With only a limited number of gear changes required by the transmission,
heat rejection through the casing is sufficient.
(c) The impact of gear churning and windage losses becomes more and more
significant with the speed increases, especially at high speed.
137
(d) Wet clutch drag loss is the most significant part of the DCT power losses.
(e) The final stable temperature of DCT is significantly influenced by the
environment temperature.
Thermal behaviour study in this work can contribute to the design of future transmission
prototypes and calculate its reliability thereby avoiding unnecessary failures. It could
help to accelerate product development and save funds. Future research includes
comparing power losses under different gears and operations, and using experiments to
investigate the proposed model. The limitation of this study is that it only partly
considers the steady state status of the thermal behaviour without considering the
transient performance of the power losses and the thermal behaviour during shifting.
138
Chapter 8 DESIGN AND OPTIMISATION OF EV POWERTRAIN SYSTEM
8.1 Introduction
Pure EVs being used in the market are mainly equipped with single speed transmission,
with the tradeoff being between dynamic (such as climbing ability, top speed, and
acceleration) and economic performance (driving range)[103]. There has been some
research done on pure EVs performance optimisation, most of which has focused on the
batteries, energy management strategies and analysis [1, 87, 93-96], and drive control
[99-102] of EVs.
Nowadays, more and more EV researchers and designers are paying attention to the
application of multiple speed transmissions instead of traditional single speed
transmissions as these are expected to improve the EV performance. The usage of multi-
speed transmissions for electric vehicles is likely to improve average motor efficiency
and range capacity and can even reduce the required motor size. There are a number of
multi-speed transmissions available for pure EVs, as shown by Rudolph [29]. These
indicate that DCTs have higher fuel efficiency than other automatic drives thereby
making them extremely suitable.
However, it is necessary to point out that the vehicle performance improvement by
using multi-gear transmissions for an electric vehicle is not as much as that of an engine
driven vehicle. This is due to the markedly different characteristics of the two systems.
In an engine driven system, the available output speed range of the engine is narrower
than that of an electric motor. The inertia of the motor is smaller than that of the engine
as well, being usually smaller than a quarter of engine. And the motor speed is also
more controllable than that of the engine. Therefore, the number of gear ratios for a pure
139
EV is not the more the better, as it will increase the transmission manufacturing cost and
the overall vehicle mass without contributing significantly to the overall performance of
the vehicle. Consequently, the detailed performance difference between the one-speed
and two-speed EV can understood from our research work [106].
For a given demand power from the driver and vehicle speed the instantaneous motor
torque is directly influenced by the transmission gear ratio selection and shifting
schedule. There are some references available on the EV’s gear shift schedule
optimisation, such as [107].These references only focus on the gear shift schedule
optimisation with given gear ratios. These do not consider the best use of gear ratios to
maximise EM efficiency. As a result, there is a lack of published work which combines
the gear shifting schedule and gear ratios optimisation to improve the overall EV
performance.
In fact, the drivetrain systems efficiency is not only directly affected by the transmission
gear shift schedule, but the transmission gear ratios election as well [22]. For any given
motor, the shift schedule and transmission gear ratio pair selection are closely linked,
and mutually affected. Therefore, in order to improve the EV performance, it is
necessary to optimise the gear shifting schedule and gear ratios selection together, thus
enabling the motor to operate in higher efficiency zones.
This chapter applies the drag torque model to a two-speed EV powertrain system design
and optimisation using genetic algorithm methods. In this chapter, mathematic
modelling of a two-speed EV compromising major subsystems is briefly discussed,
followed by electric motor selection, gear ratio design, multi-plates wet clutch design,
drag torque model applicatioin, and shift schedule discussion. A genetic algorithm
140
method is used to accelerate the optimisation procedures. In order to demonstrate the
effectiveness of the drag torque in gear ratios optimisation and EV economy efficiency,
simulations based on the theoretical analysis and developed EV drivetrain model are
conducted using US06 driving cycles. Then, simulation results and analysis are
presented in the fourth section. Finally, the fifth section summarises this chapter.
8.2 Two-speed EV powertrain system modelling and design
8.2.1 Configuration of two-speed EV powertrain system
The pure EV powertrain system under consideration is equipped with a two-speed DCT.
The two-speed DCT housing is made from an aluminium alloy. And the DCT is made
up of two clutches, the inner clutch (C1) and the outer clutch (C2). The two clutches
have a common drum attached to the same input shaft from the electric motor, and the
friction plates are independently connected to the 1st or the 2nd gear. C1, shown in green,
connects the outer input shaft engaged with the 1st gear, and C2, shown in red, connects
the inner input shaft engaged with the 2nd gear.
Unlike our previously researched two-speed DCT, which is modified from a 6-speed
DCT (DQ250), the two-speed DCT under consideration here is a little different. After
analysis of the drag torque losses in the original two-speed DCT[86], we find that we
can diminish the drag torque loss and improve the reliability by redesigning the two-
speed transmission. The two clutches plates’ radiuses are designed as the same in order
to diminish the disengaged clutch drag torque losses, as shown in Figure 8-1. In order to
make the transmission control system simpler and reduce manufacturing costs, there are
no synchronisers in this new type of two-speed DCT. Thus, the transmission can be
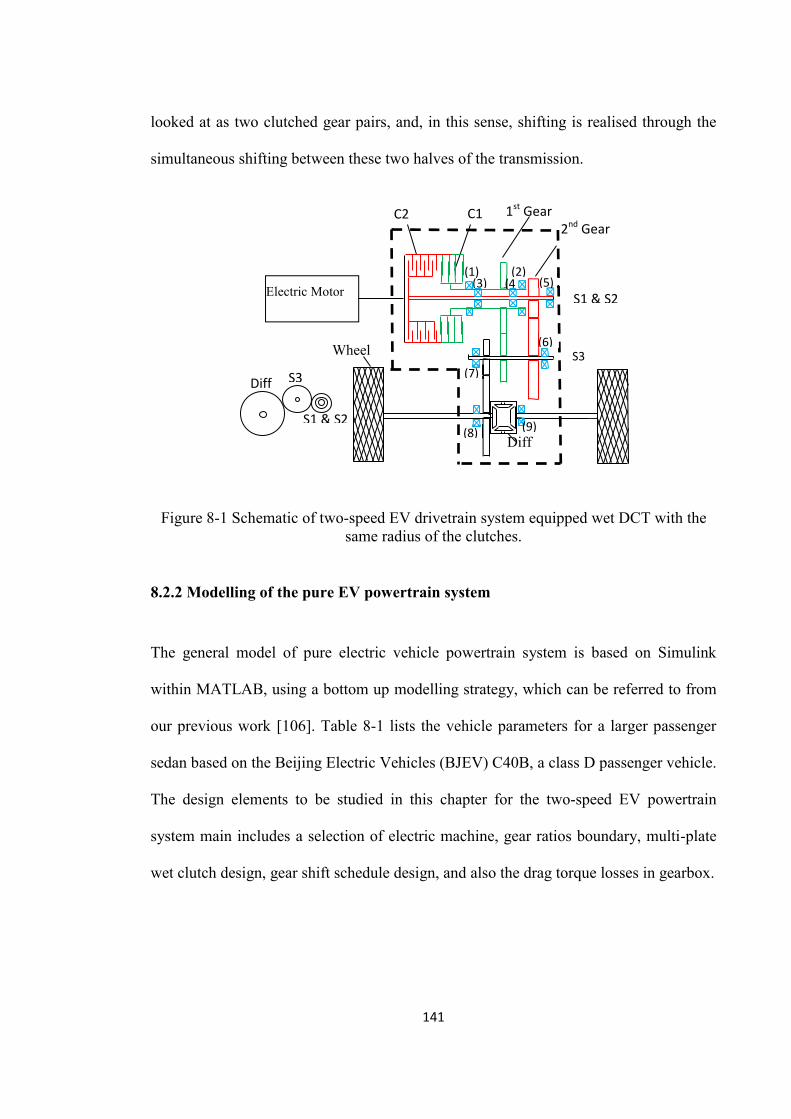
141
looked at as two clutched gear pairs, and, in this sense, shifting is realised through the
simultaneous shifting between these two halves of the transmission.
Figure 8-1 Schematic of two-speed EV drivetrain system equipped wet DCT with the same radius of the clutches.
8.2.2 Modelling of the pure EV powertrain system
The general model of pure electric vehicle powertrain system is based on Simulink
within MATLAB, using a bottom up modelling strategy, which can be referred to from
our previous work [106]. Table 8-1 lists the vehicle parameters for a larger passenger
sedan based on the Beijing Electric Vehicles (BJEV) C40B, a class D passenger vehicle.
The design elements to be studied in this chapter for the two-speed EV powertrain
system main includes a selection of electric machine, gear ratios boundary, multi-plate
wet clutch design, gear shift schedule design, and also the drag torque losses in gearbox.
C1 1st Gear C2
Diff
S1 & S2
2nd Gear
S3
S1 & S2
S3
Diff
Electric Motor
Wheel
(1) (5) (4
(7)
(6)
(9) (8)
(2) 1)(3)
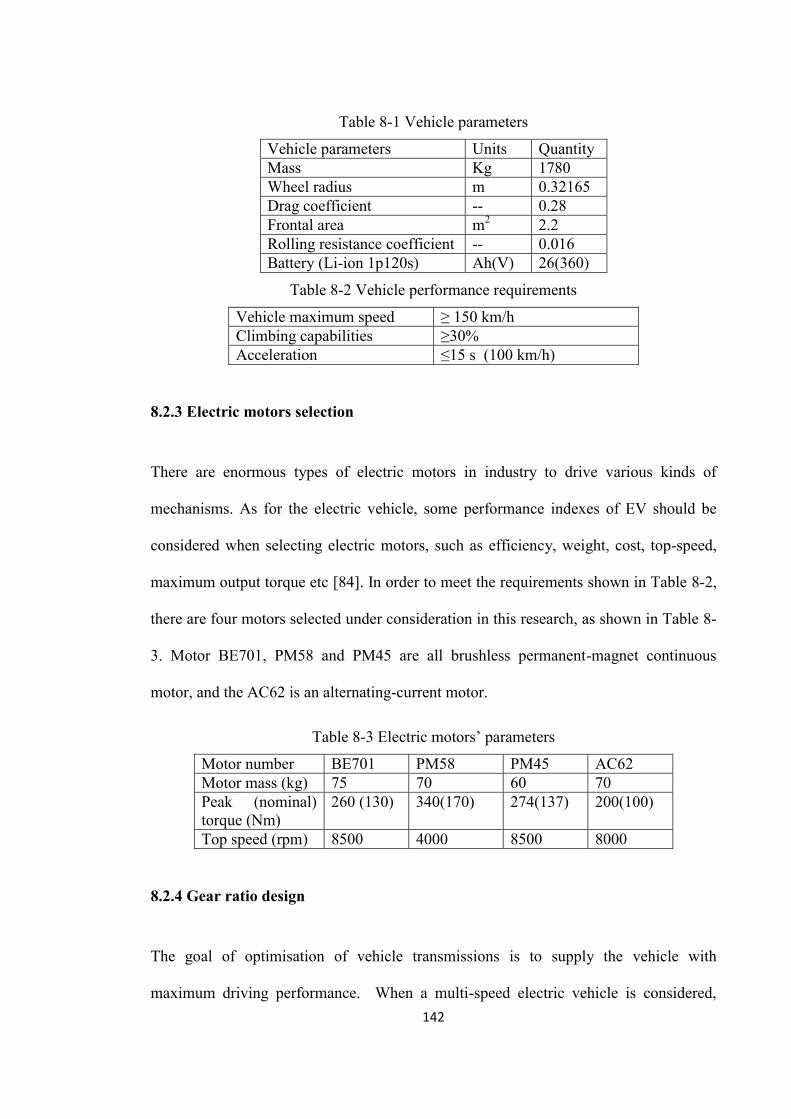
142
Table 8-1 Vehicle parameters
Vehicle parameters Units Quantity Mass Kg 1780 Wheel radius m 0.32165 Drag coefficient -- 0.28 Frontal area m2 2.2 Rolling resistance coefficient -- 0.016 Battery (Li-ion 1p120s) Ah(V) 26(360)
Table 8-2 Vehicle performance requirements
Vehicle maximum speed ≥ 150 km/h Climbing capabilities ≥30% Acceleration ≤15 s (100 km/h)
8.2.3 Electric motors selection
There are enormous types of electric motors in industry to drive various kinds of
mechanisms. As for the electric vehicle, some performance indexes of EV should be
considered when selecting electric motors, such as efficiency, weight, cost, top-speed,
maximum output torque etc [84]. In order to meet the requirements shown in Table 8-2,
there are four motors selected under consideration in this research, as shown in Table 8-
3. Motor BE701, PM58 and PM45 are all brushless permanent-magnet continuous
motor, and the AC62 is an alternating-current motor.
Table 8-3 Electric motors’ parameters
Motor number BE701 PM58 PM45 AC62 Motor mass (kg) 75 70 60 70 Peak (nominal) torque (Nm)
260 (130) 340(170) 274(137) 200(100)
Top speed (rpm) 8500 4000 8500 8000
8.2.4 Gear ratio design
The goal of optimisation of vehicle transmissions is to supply the vehicle with
maximum driving performance. When a multi-speed electric vehicle is considered,
143
minimization of losses becomes critical to the development of the drivetrain, ensuring
the benefits of the integrated transmission and electric machine are maximised.
As concluded by Mehrdad et al. [101], the vehicle transmission has to offer ratios
between engine/motor speed and vehicle wheel speed enabling the vehicle to:
(1) Move under difficult conditions,
(2) Reach the required maximum speed, and
(3) Operate in the fuel-efficient ranges of the engine/motor performance map.
Therefore, it is necessary to bound permissible transmission ratios meeting the
requirements above. The maximum ratio required 𝛾 is fixed by the first condition.
The second condition gives the maximum road speed ratio. And the smallest drivetrain
ratio 𝛾 is determined by the third condition.
For an EV equipped with two-speed transmission, the first gear ratio is mainly used to
meet the dynamic performances, such as acceleration, and grade ability. And the second
gear ratio is mainly used to enable the EM to operate in the high efficiency zone with
high economic performance thereby reaching the top speed requirements.
At low speed the minimum value of first gear ratio γ _ can be defined by the
requirement for the vehicle to achieve hill climbing capabilities. To evaluate the grade
ability the vehicle speed can be considered at constant speed, with no acceleration. In
this section, it is assumed that the vehicle speed is 15 km/h under grade ability. Thus,
the minimum first gear ratio can be evaluated as[101]:
γ _ =( ( Φ Φ) ρ )
η (8.1)
144
Contradicting this requirement is the top speed achieved by the vehicle. The lowest gear
ratio can be defined by dividing a desired maximum vehicle speed into the linear
equivalent of the maximum motor speed:
γ _ =. π
(8.2)
To confirm that the motor can provide the required torque at this speed, from Eq. (8.3) it
is assumed that there is no incline load and the rolling resistance torque is divided by the
maximum motor torque.
γ _ =∅ ρ ×
η , (8.3)
And the minimum ratio of second gear γ _ can be expressed as
γ _ =γ _
. (8.4)
Additionally, considering the manufacturing effects and the shift quality, the gap
between the two gear ratios should not be too large. According to Lechner [22], the ratio
between adjacent gears should be within a certain range. Hence, the maximum ratio of
the 2nd gear pairs is set at 15 for all the powertrain systems.
Thus for any given vehicle characteristic and performance requirement it is possible to
bound the required ratios in the transmission. With the given vehicle and EM
parameters, the range of first gear and second gear ratio is bounded, as shown in Table
8-4.
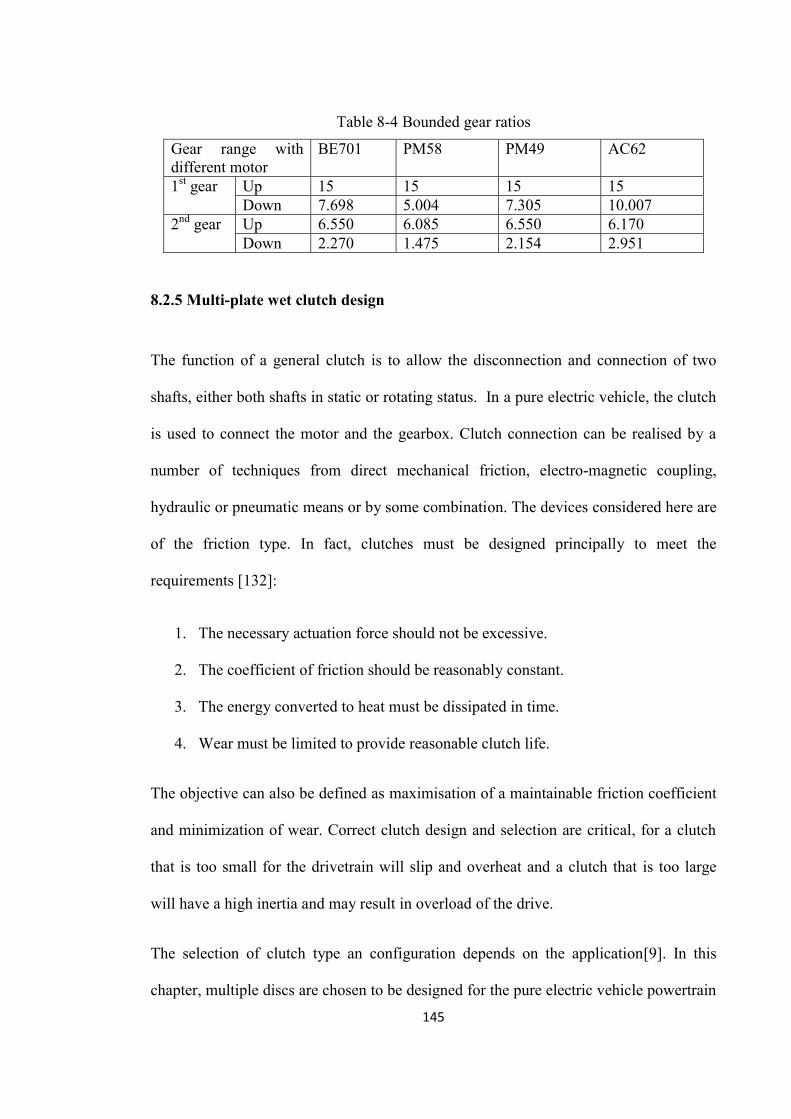
145
Table 8-4 Bounded gear ratios
Gear range with different motor
BE701 PM58 PM49 AC62
1st gear Up 15 15 15 15 Down 7.698 5.004 7.305 10.007
2nd gear Up 6.550 6.085 6.550 6.170 Down 2.270 1.475 2.154 2.951
8.2.5 Multi-plate wet clutch design
The function of a general clutch is to allow the disconnection and connection of two
shafts, either both shafts in static or rotating status. In a pure electric vehicle, the clutch
is used to connect the motor and the gearbox. Clutch connection can be realised by a
number of techniques from direct mechanical friction, electro-magnetic coupling,
hydraulic or pneumatic means or by some combination. The devices considered here are
of the friction type. In fact, clutches must be designed principally to meet the
requirements [132]:
1. The necessary actuation force should not be excessive.
2. The coefficient of friction should be reasonably constant.
3. The energy converted to heat must be dissipated in time.
4. Wear must be limited to provide reasonable clutch life.
The objective can also be defined as maximisation of a maintainable friction coefficient
and minimization of wear. Correct clutch design and selection are critical, for a clutch
that is too small for the drivetrain will slip and overheat and a clutch that is too large
will have a high inertia and may result in overload of the drive.
The selection of clutch type an configuration depends on the application[9]. In this
chapter, multiple discs are chosen to be designed for the pure electric vehicle powertrain
146
system. Two common basic assumptions are used in the development of procedures for
disc clutch design based on a uniform rate of wear at the mating surfaces or a uniform
pressure distribution between the mating surfaces. As the uniform wear assumption
results a lower torque capacity clutch than the uniform pressure assumption, clutches are
normally designed based on uniform wear.
The procedure for obtaining the initial geometry is listed below [132]:
1. Determine the required torque capacity. In a pure electric vehicle, it can be
determined by the maximum output torque of the electric motor T ;
2. Determine the maximum permissible pressurep . In the two-speed DCT, it is
determined as 2.76 Mpa.
3. Decide the coefficient of friction μ, here it is set as 0.13 for a paper based
material friction surface;
4. Decide the outer radius of the clutch platesr . Due to the size limitation of
transmission, the outer radius is determined to range from 0.04m to 0.1m;
5. Find the inner radius of the clutch plates surface r , which can be determined by
the normal relationship as:
r = r (8.5)
6. The number of clutch plate’s surfaces, N, can be calculated by the
following equation.
T = ∫ 2πμNp r rdr = p πμNr (r − r ) (8.6)
147
Where T is the maximum torque transmitted via a clutch. It is the same as the
electric motor maximum output torqueT . Additionally, the clutch surfaces number N
should be an even number as every clutch plate has two frictional surfaces.
8.2.6 Drag torque model application
The total drag torque losses in the two-speed dual clutch transmission are generally
made up of five parts, power losses caused by concentric shaft shearing losses, bearing
losses, gear meshing losses, churning and windage losses, and clutch drag torque losses,
as shown in Equation (7).
P = P + ∑ P + ∑ P + P + P (8.7)
The drag torque model in detail can be sourced from Chapter 5 and Chapter 6 and also
from our research work[86]. The work shows that the clutch drag torque, and gear
churning and windage losses are the main power losses within the whole power losses
of the two-speed dual clutch transmission, holding over eighty percent of total losses.
Both of them are affected by the speed, hence indirectly influenced by the gear ratios.
Hence, a combined consideration of gear ratio design and drag torque is important.
8.2.7 Shift schedule design
As mentioned in Chapter 3 and Chapter 4, a simple two speed transmission model is
used. It is applied to improve the operation of the electric motor in its higher efficiency
region, hence improve the powertrain efficiency as well. The shift map is both throttle
angle and vehicle speed dependent. According to the optimised shift map, (introduced in
148
Chapter 4), from vehicle speed and throttle angle (brake and acceleration signal),
required gear, G1 or G2, is selected. For this model only the overall gear ratio is
provided, the final drive ratio must be divided into the output ratios to determine actual
gear ratio. Separate lines are required for up and down shifts and are shown in Figure 8-
2. Shift logic for the two-speed transmission is described in Chapter 4 Section 3.
However, there is little change for the shift schedule in this section. Although it is still
based on the acquired shift schedule using the method described in Chapter 4, in order
to fully improve the efficiency of the transmission and consider the variation in electric
machines, a shift adjust value P is used to adjust the index of speed for the down-shift
line. Hence it can optimise the gap of the two lines to get the optimal shift schedule and
improve powertrain efficiency.
V = V ∗ P (8.8)
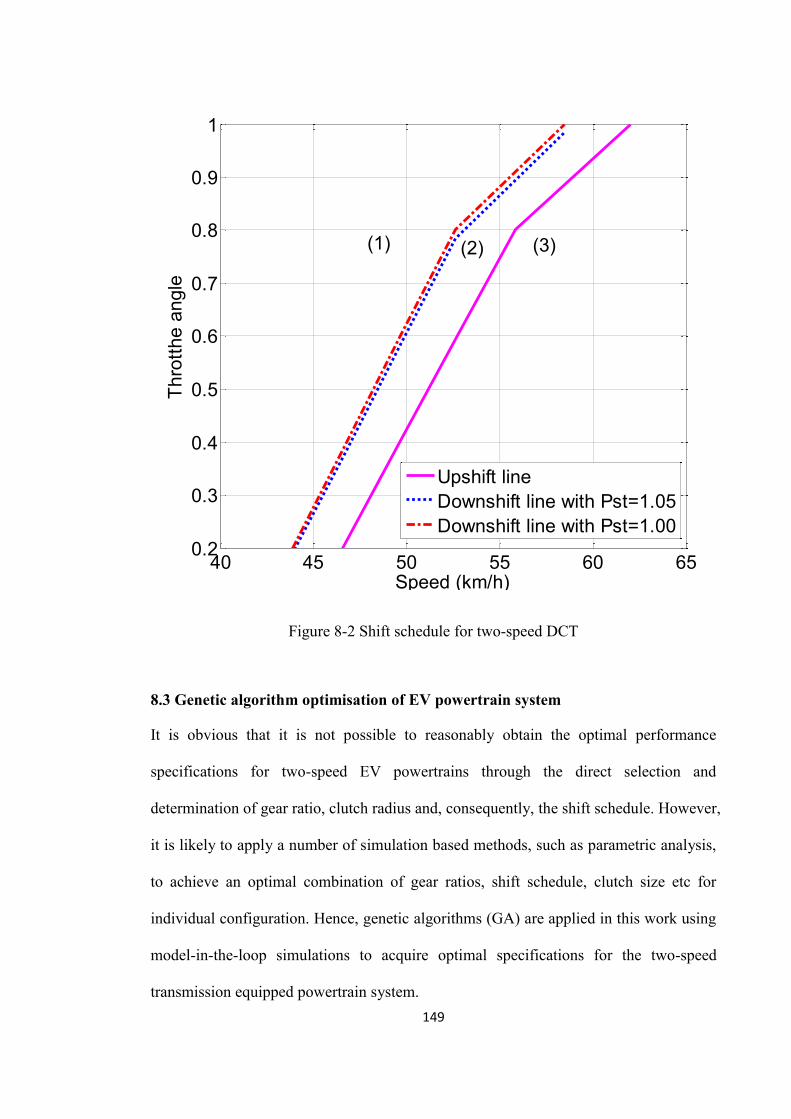
149
Figure 8-2 Shift schedule for two-speed DCT
8.3 Genetic algorithm optimisation of EV powertrain system
It is obvious that it is not possible to reasonably obtain the optimal performance
specifications for two-speed EV powertrains through the direct selection and
determination of gear ratio, clutch radius and, consequently, the shift schedule. However,
it is likely to apply a number of simulation based methods, such as parametric analysis,
to achieve an optimal combination of gear ratios, shift schedule, clutch size etc for
individual configuration. Hence, genetic algorithms (GA) are applied in this work using
model-in-the-loop simulations to acquire optimal specifications for the two-speed
transmission equipped powertrain system.
40 45 50 55 60 650.2
0.3
0.4
0.5
0.6
0.7
0.8
0.9
1
Speed (km/h)
Thro
tthe
angl
e
Upshift lineDownshift line with Pst=1.05Downshift line with Pst=1.00
(3)(1) (2)
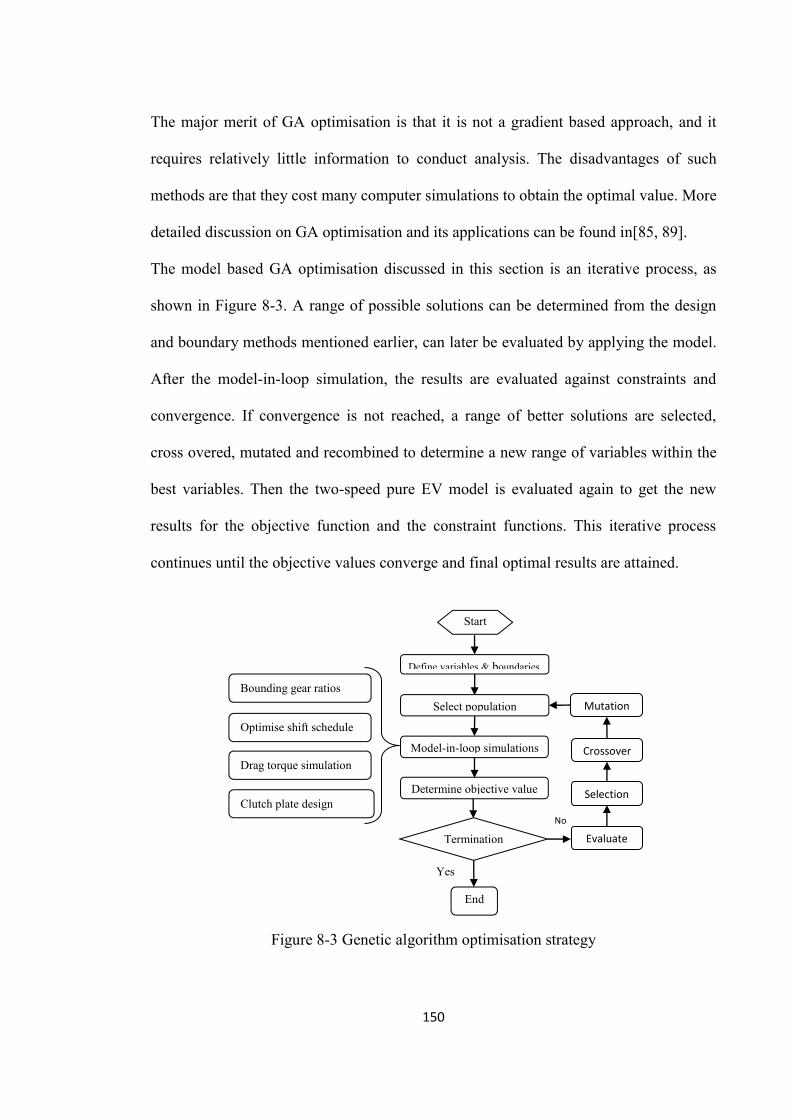
150
The major merit of GA optimisation is that it is not a gradient based approach, and it
requires relatively little information to conduct analysis. The disadvantages of such
methods are that they cost many computer simulations to obtain the optimal value. More
detailed discussion on GA optimisation and its applications can be found in[85, 89].
The model based GA optimisation discussed in this section is an iterative process, as
shown in Figure 8-3. A range of possible solutions can be determined from the design
and boundary methods mentioned earlier, can later be evaluated by applying the model.
After the model-in-loop simulation, the results are evaluated against constraints and
convergence. If convergence is not reached, a range of better solutions are selected,
cross overed, mutated and recombined to determine a new range of variables within the
best variables. Then the two-speed pure EV model is evaluated again to get the new
results for the objective function and the constraint functions. This iterative process
continues until the objective values converge and final optimal results are attained.
Figure 8-3 Genetic algorithm optimisation strategy
Define variables & boundaries
Select population
Determine objective value
Model-in-loop simulations
Start
Termination No
Yes
End
Evaluate
Selection
Crossover
Mutation Bounding gear ratios
Optimise shift schedule
Drag torque simulation
Clutch plate design
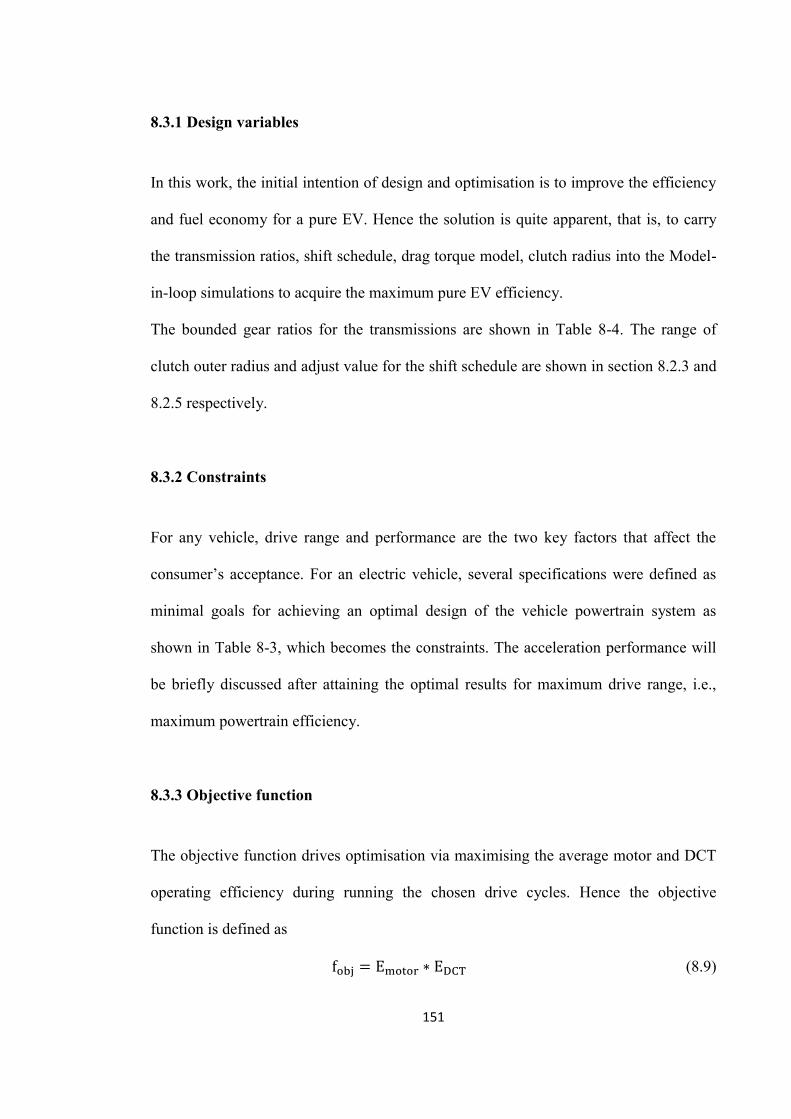
151
8.3.1 Design variables
In this work, the initial intention of design and optimisation is to improve the efficiency
and fuel economy for a pure EV. Hence the solution is quite apparent, that is, to carry
the transmission ratios, shift schedule, drag torque model, clutch radius into the Model-
in-loop simulations to acquire the maximum pure EV efficiency.
The bounded gear ratios for the transmissions are shown in Table 8-4. The range of
clutch outer radius and adjust value for the shift schedule are shown in section 8.2.3 and
8.2.5 respectively.
8.3.2 Constraints
For any vehicle, drive range and performance are the two key factors that affect the
consumer’s acceptance. For an electric vehicle, several specifications were defined as
minimal goals for achieving an optimal design of the vehicle powertrain system as
shown in Table 8-3, which becomes the constraints. The acceleration performance will
be briefly discussed after attaining the optimal results for maximum drive range, i.e.,
maximum powertrain efficiency.
8.3.3 Objective function
The objective function drives optimisation via maximising the average motor and DCT
operating efficiency during running the chosen drive cycles. Hence the objective
function is defined as
f = E ∗ E (8.9)
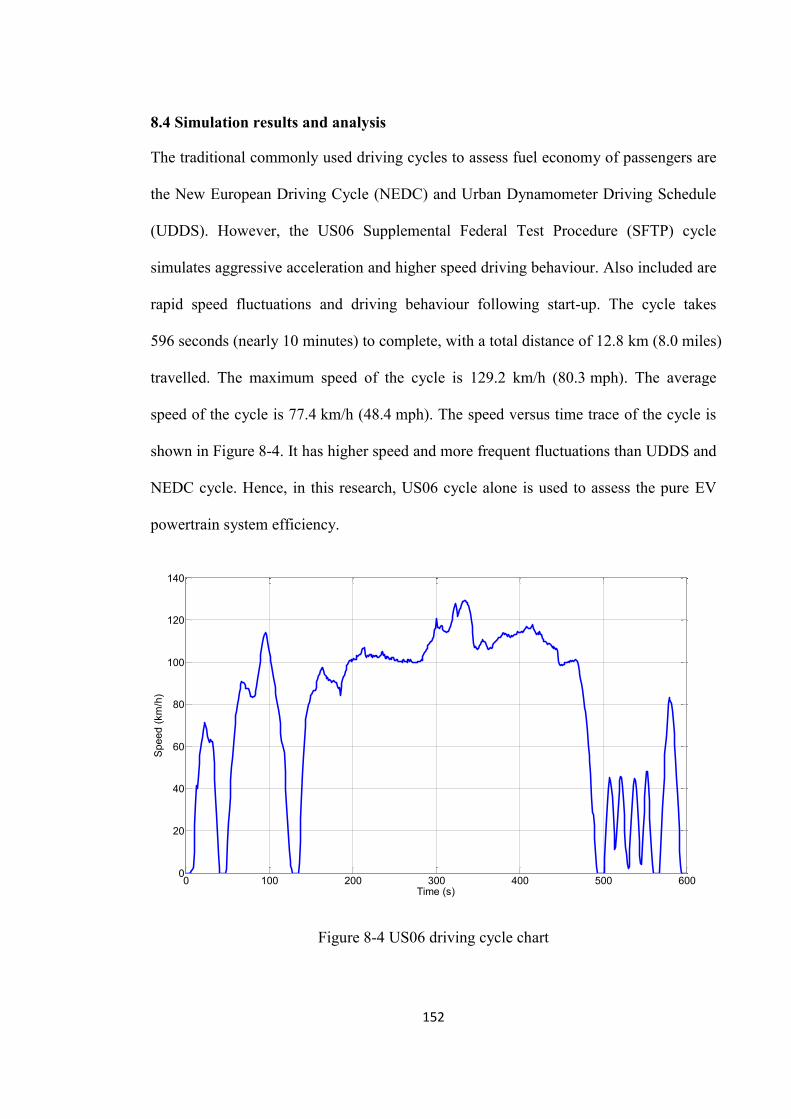
152
8.4 Simulation results and analysis
The traditional commonly used driving cycles to assess fuel economy of passengers are
the New European Driving Cycle (NEDC) and Urban Dynamometer Driving Schedule
(UDDS). However, the US06 Supplemental Federal Test Procedure (SFTP) cycle
simulates aggressive acceleration and higher speed driving behaviour. Also included are
rapid speed fluctuations and driving behaviour following start-up. The cycle takes
596 seconds (nearly 10 minutes) to complete, with a total distance of 12.8 km (8.0 miles)
travelled. The maximum speed of the cycle is 129.2 km/h (80.3 mph). The average
speed of the cycle is 77.4 km/h (48.4 mph). The speed versus time trace of the cycle is
shown in Figure 8-4. It has higher speed and more frequent fluctuations than UDDS and
NEDC cycle. Hence, in this research, US06 cycle alone is used to assess the pure EV
powertrain system efficiency.
Figure 8-4 US06 driving cycle chart
0 100 200 300 400 500 6000
20
40
60
80
100
120
140
Time (s)
Spe
ed (k
m/h
)
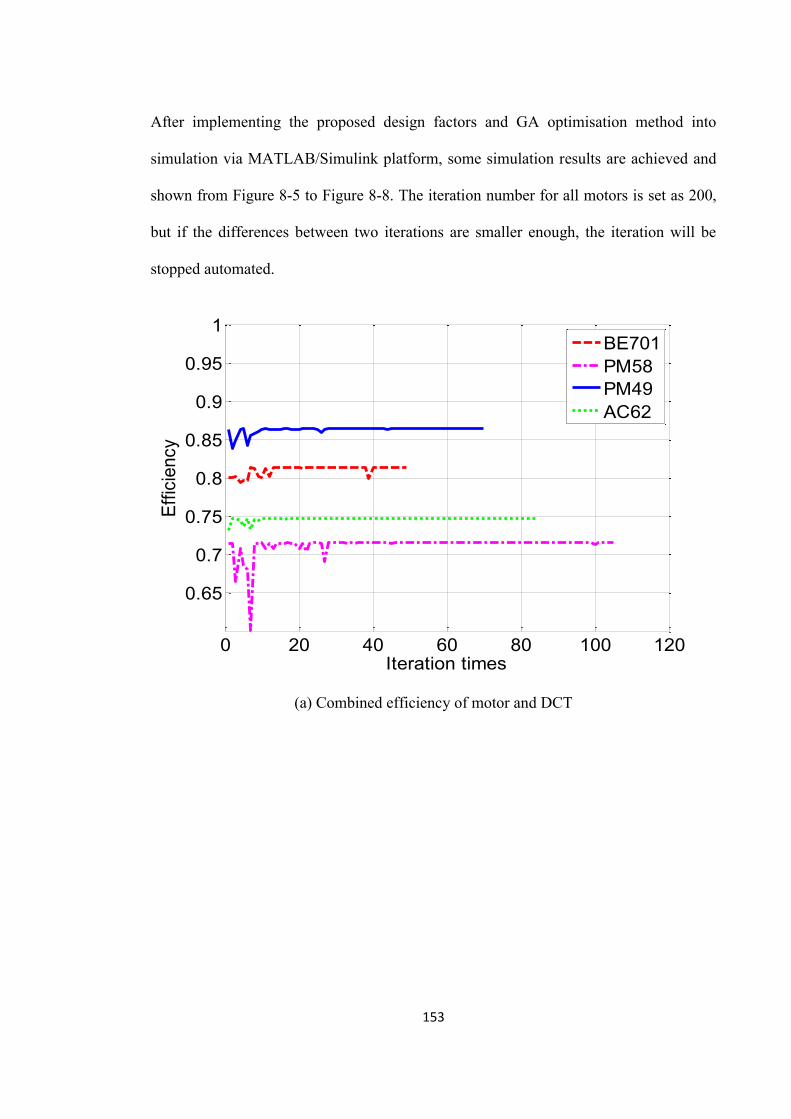
153
After implementing the proposed design factors and GA optimisation method into
simulation via MATLAB/Simulink platform, some simulation results are achieved and
shown from Figure 8-5 to Figure 8-8. The iteration number for all motors is set as 200,
but if the differences between two iterations are smaller enough, the iteration will be
stopped automated.
(a) Combined efficiency of motor and DCT
0 20 40 60 80 100 120
0.65
0.7
0.75
0.8
0.85
0.9
0.95
1
Iteration times
Effic
ienc
y
BE701PM58PM49AC62
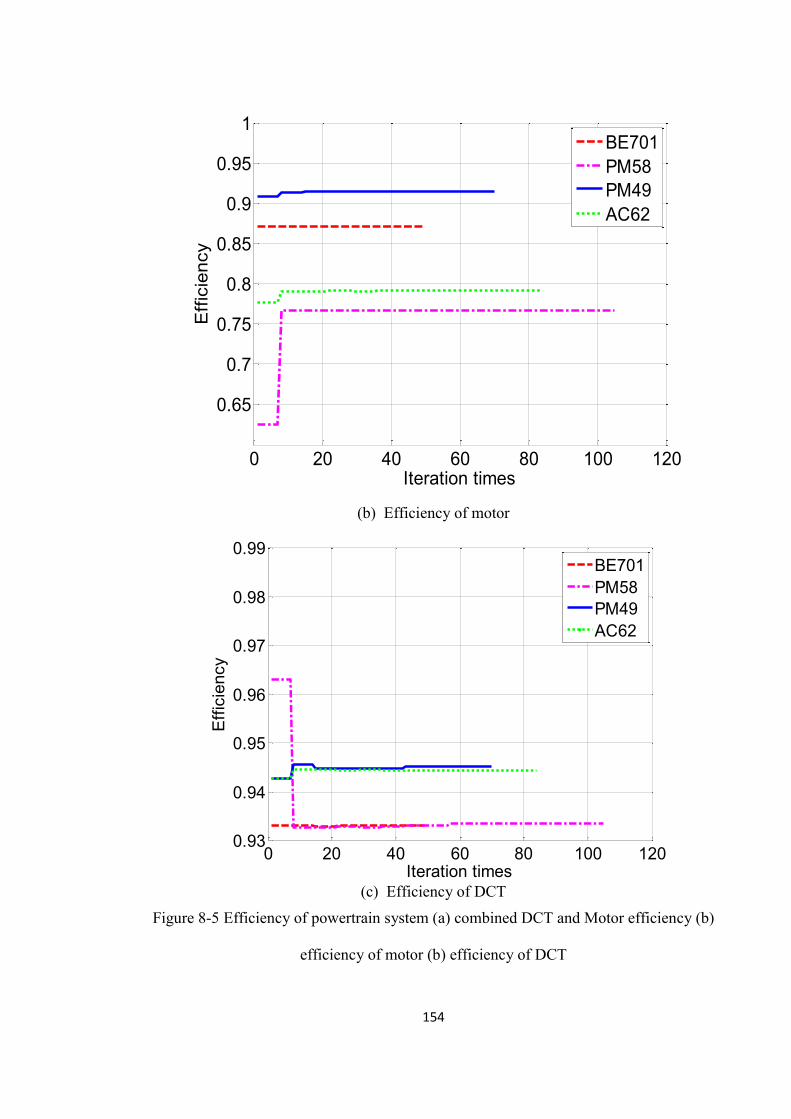
154
(b) Efficiency of motor
(c) Efficiency of DCT
Figure 8-5 Efficiency of powertrain system (a) combined DCT and Motor efficiency (b)
efficiency of motor (b) efficiency of DCT
0 20 40 60 80 100 120
0.65
0.7
0.75
0.8
0.85
0.9
0.95
1
Iteration times
Effi
cien
cy
BE701PM58PM49AC62
0 20 40 60 80 100 1200.93
0.94
0.95
0.96
0.97
0.98
0.99
Iteration times
Effi
cien
cy
BE701PM58PM49AC62
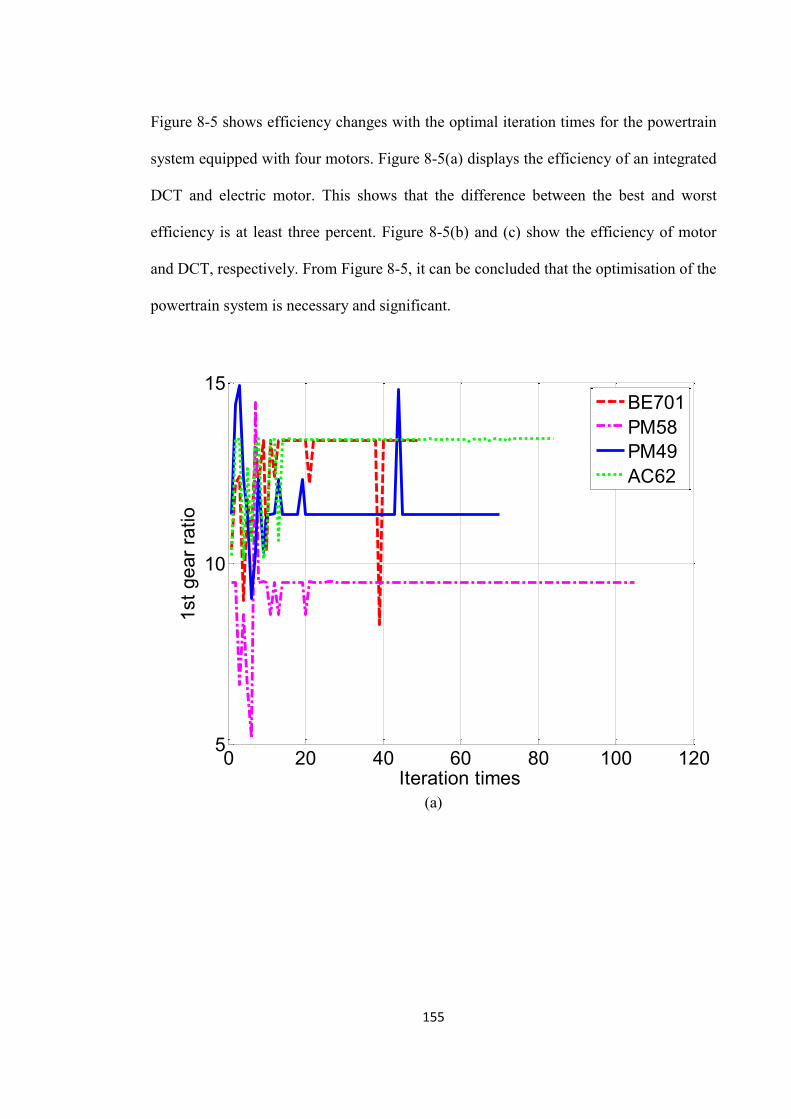
155
Figure 8-5 shows efficiency changes with the optimal iteration times for the powertrain
system equipped with four motors. Figure 8-5(a) displays the efficiency of an integrated
DCT and electric motor. This shows that the difference between the best and worst
efficiency is at least three percent. Figure 8-5(b) and (c) show the efficiency of motor
and DCT, respectively. From Figure 8-5, it can be concluded that the optimisation of the
powertrain system is necessary and significant.
(a)
0 20 40 60 80 100 1205
10
15
Iteration times
1st g
ear r
atio
BE701PM58PM49AC62
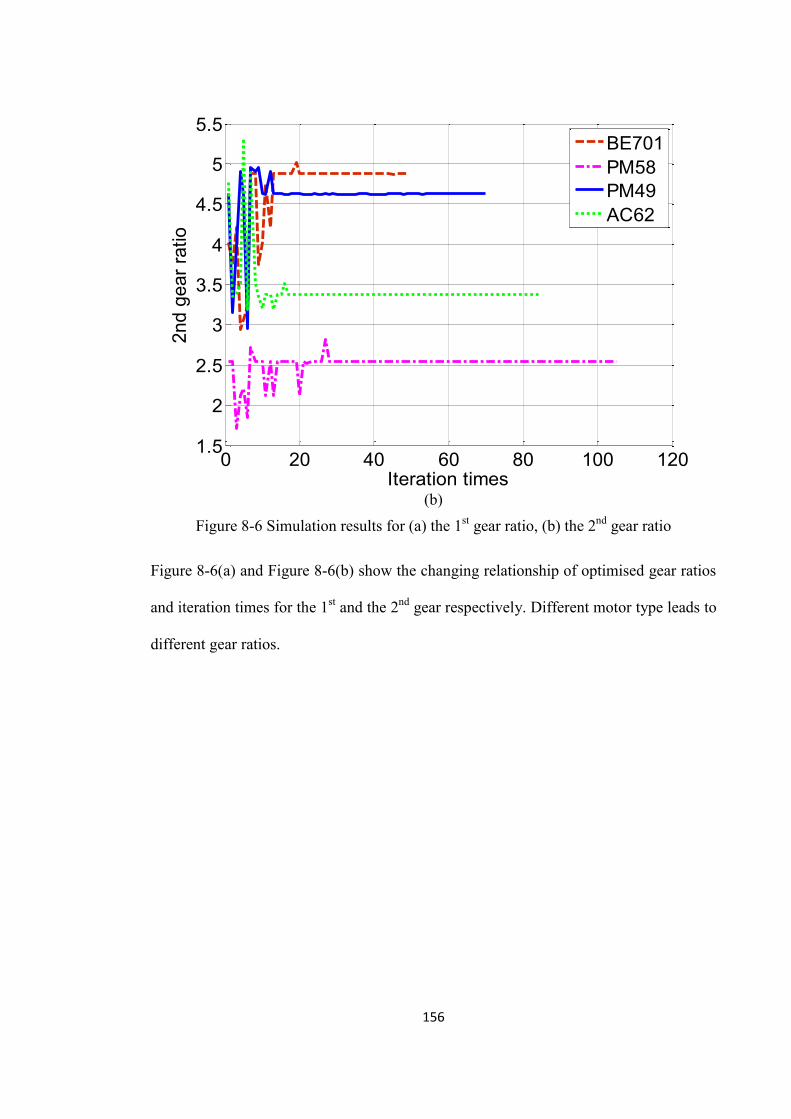
156
(b)
Figure 8-6 Simulation results for (a) the 1st gear ratio, (b) the 2nd gear ratio
Figure 8-6(a) and Figure 8-6(b) show the changing relationship of optimised gear ratios
and iteration times for the 1st and the 2nd gear respectively. Different motor type leads to
different gear ratios.
0 20 40 60 80 100 1201.5
2
2.5
3
3.5
4
4.5
5
5.5
Iteration times
2nd
gear
ratio
BE701PM58PM49AC62
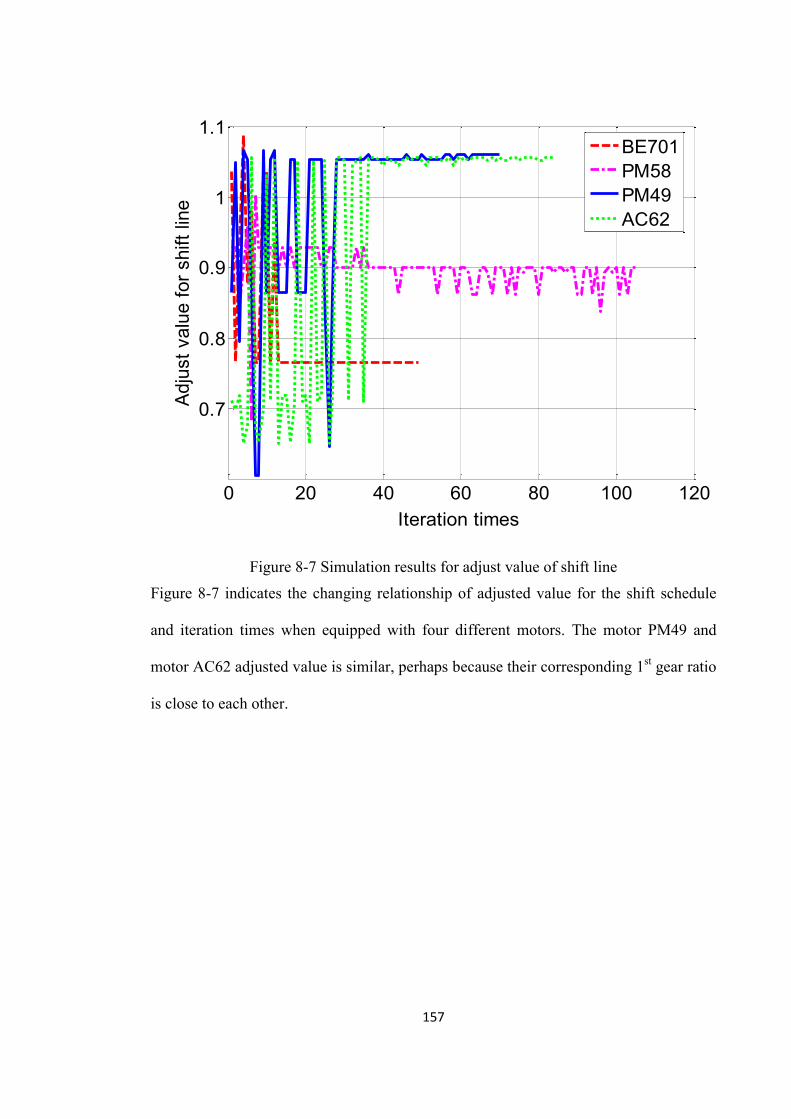
157
Figure 8-7 Simulation results for adjust value of shift line
Figure 8-7 indicates the changing relationship of adjusted value for the shift schedule
and iteration times when equipped with four different motors. The motor PM49 and
motor AC62 adjusted value is similar, perhaps because their corresponding 1st gear ratio
is close to each other.
0 20 40 60 80 100 120
0.7
0.8
0.9
1
1.1
Iteration times
Adju
st v
alue
for s
hift
line
BE701PM58PM49AC62
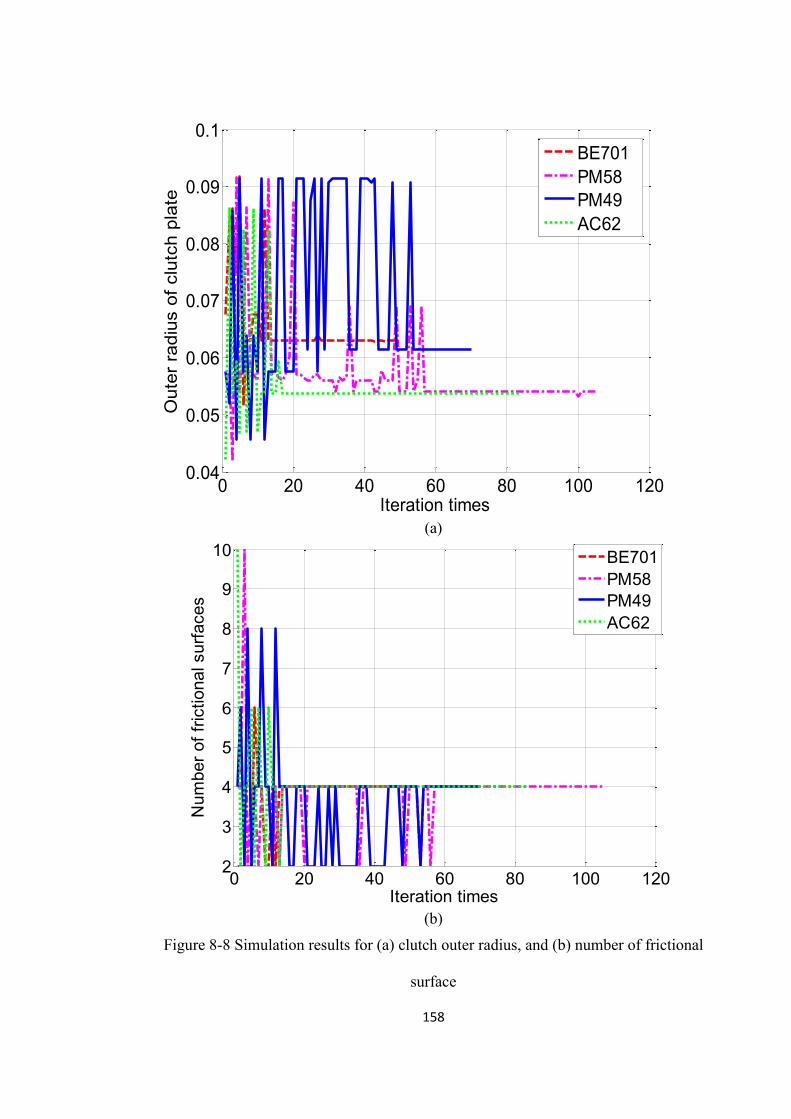
158
(a)
(b)
Figure 8-8 Simulation results for (a) clutch outer radius, and (b) number of frictional
surface
0 20 40 60 80 100 1200.04
0.05
0.06
0.07
0.08
0.09
0.1
Iteration times
Out
er r
adiu
s of
clu
tch
plat
e
BE701PM58PM49AC62
0 20 40 60 80 100 1202
3
4
5
6
7
8
9
10
Iteration times
Num
ber o
f fric
tiona
l sur
face
s
BE701PM58PM49AC62
159
Figure 8-8 (a) and (b) indicate the changing relationship of the outer radius of multi-
plate wet plates and iteration times and the consequent number of clutch frictional
surfaces.
8.6 Conclusions
In order to study the economic performance of a two-speed electric vehicle (EV)
equipped with a wet dual clutch transmission (DCT), this chapter presented a model
based methodology for the design and analysis of a two-speed electric vehicle
powertrain system. An integrated consideration of electric motor and two-speed dual
clutch transmission is conducted to design a pure electric vehicle powertrain system.
The design aspects include a selection of the electric machine, gear ratios boundary,
multi-plate wet clutch design, and gear shift schedule design. Additionally, this chapter
primarily applies the detailed drag torque model in the transmission design. Furthermore,
genetic algorithm optimisation was applied using model-in-the-loop techniques to
accelerate the design process and determine the optimal variables. Results of
simulations demonstrate that the difference in terms of the combined motor and DCT
efficiency between the worst and the best results can be 3% or even more when
equipped with the same motor. When equipped with a different motor, the maximum
difference in terms of powertrain efficiency can reach 15%.
160
Chapter 9 THESIS CONCLUSIONS AND RECOMMENDATIONS
This chapter concludes the thesis. It summarizes the main findings and contributions of
this research and presents a future direction to extend the research.
9.1 Summary of thesis
The knowledge concluded within the thesis is useful in studying and designing pure
electric vehicle powertrains and other similar engineering mechanisms. The developed
pure electric vehicle powertrain system model equipped with a two-speed dual clutch
transmission in Chapter 3 lays a foundation to further systematic study of drag torques
losses within transmission. The proposed EV model considers the battery, shift schedule,
vehicle control unit, transmission, vehicle, Electric Machine and the Driver. Simulations
based on mathematical models and the optimised shift schedules are conducted via
MATLAB/Simulink platform. NEDC and UDDS drive cycles are used to evaluate the
model performance.
Considering the different characteristic of electric motor from engine, integrated design
and study of the gears ratios and shift schedule within two-speed DCT in Chapter 4 lays
a foundation to further systematic designing of pure EV powertrain system and reducing
drag torque losses within transmission, hence improving powertrain system efficiency.
The entire drag torque model within the DCT is detailed in Chapter 5. Two reasonable
analytical models to predict the multi-plate wet clutch drag torque are studied and
chosen as acceptable methods from several existing analytical models. After theoretical
analysis of those two models respectively, simulations and comparisons are conducted
to show their difference. The comparison between the two clutch models concludes the
more practically model to predict the disengaged wet clutch drag torque. Then the
161
influences of clutch plate clearance, flow rate, grooves area, temperature, number and
size of clutch plates on drag torque are presented. Additionally, possible optimisation
design direction for clutch design is pointed out. Then, other parts of drag torque within
entire DCT has also been developed, which considers the gear meshing losses, gear
windage and churning, bearing and concentric shaft drag torque.
In order to investigate the effectiveness of the developed drag torque model,
experimental investigation (introduced in Chapter 6) is conducted to compare the
physical results with that of obtained from simulation under various operating
conditions. UTS powertrain test rig facilitates these experiment works and provides
enormous meaningful results to verify the proposed analytical and numerical studies.
This work can be looked as a reference to future research on reducing drag torque,
applications of drag torque in two-speed or multi-speed electric vehicle powertrain
system efficiency optimisation and torque estimated shift control. With some slight
adjustments according to the detail transmissions layout, this numerical method for
predicting the two-speed DCT drag torque can also be applied to other transmissions
equipped with wet clutch packages, in addition to ordinary manual transmission.
With the investigated drag torque model, Chapter 7 develops a mathematical model of
the thermal behaviour of a prototype dual clutch transmission. This is achieved through
the integration of mathematical models of gears, bearings and clutch losses for the
transmission. These losses are defined as the sources of energy generation to heat the
lubricating oil. A thermal model of the lubricant and transmission case was also
developed to evaluate transmission heat rejection, thus achieving a balanced
heating/cooling model of the transmission. Experimental investigation of the
transmission thermal behaviour is conducted to validate the effectiveness of the
162
combined drag torque and thermal prediction models, with accurate steady state results
achieved. Thermal behaviour study in this work can contribute to the design of future
transmission prototypes and assessment its reliability avoiding unnecessary failures. It
could help accelerating products development speed and save funds.
Finally, a model and simulation based methodology for the design and analysis of two-
speed electric vehicle powertrain system is introduced in Chapter 8. An integrated
consideration of electric motor and two-speed dual clutch transmission is conducted to
design for a pure electric vehicle powertrain system. The study aspects include selection
of electric machine, gear ratios boundary, multi-plate wet clutch design, and gear shift
schedule design. Moreover, this thesis primarily applies the detailed drag torque model
into the transmission design. Furthermore, genetic algorithm optimisation was applied
using model-in-the-loop techniques to accelerate the design process and determine the
optimal variables.
9.2 Summary of contributions and findings
9.2.1 Key contributions
The specific key contributions to knowledge of research work, as set out as the
objectives in section 1.3, are as follows.
1. Develop a pure EV powertrain system model.
This was achieved by considering the battery, shift schedule, vehicle control unit,
transmission, vehicle, electric machine and the Driver model. NEDC and UDDS drive
cycles are used to evaluate the model performance.
163
2. Integrated boundary gear ratios and develop shift schedule for two-speed DCT
equipped in a pure EV powertrain system.
This was achieved by applying the vehicle performance into gear ratios boundary, and
then using bounded gear ratios and characteristic of electric motor produces the shift
schedule. To validate the effectiveness of the proposed method, simulations based on
the mathematical model and the optimised shift lines are conducted via
MATLAB/Simulink platform. NEDC drive cycles are used to evaluate electric vehicle
range, and constant speed simulations are also conducted to evaluate acceleration and
range.
3. Develop drag torque loss model for the entire two-speed DCT,
This was achieved by elaborately choosing two reasonable analytical models
from several existing analytical models to conduct comparisons and predict the
multi-plate wet clutch drag torque. After theoretical analysis of those two
models respectively, simulations and comparisons are conducted to show their
difference, and the more practical one is chosen for further model. Then, other
parts of drag torque within the entire DCT has also been developed, including
the gear meshing losses, gear windage and churning, bearing and concentric
shaft drag torque.
4. Experimentally investigate the developed drag torque model and simulations,
This was achieved by designing and conducting experiments in UTS EV
powertrain system test rig to verify the proposed drag torque model and
simulations under various operating conditions.
5. Applying drag torque model into DCT thermal behaviour analysis,
164
This was achieved by integration of mathematical models of gear, bearing and clutch
losses for the transmission. These losses are defined as the sources of energy generation
to heat the lubricating oil. A thermal model of the lubricant and transmission case was
also developed to evaluate transmission heat rejection, thus achieving a balanced
heating/cooling model of the transmission. Experimental investigation of the
transmission thermal behaviour is conducted to validate the effectiveness of the
combined drag torque and thermal prediction models.
6. Applying drag torque model into pure EV powertrain system redesign and
optimisation using genetic algorithm,
This was achieved by integrated consideration of electric motor and two-speed
dual clutch transmission to design and optimisation of a pure electric vehicle
powertrain system. It applies the detailed drag torque model into the
transmission design, and the design aspects include selection of electric machine,
gear ratios boundary, multi-plate wet clutch design, and gear shift schedule
design. Furthermore, in order to accelerate the design process and determine the
optimal variables, genetic algorithm method was applied using model-in-the-
loop techniques.
9.2.2 Main findings on drag torque and its applications
1. The developed drag torque model performs well in the prediction of drag
torques for the transmission, and is can be applied to assess the efficiency of
the transmission. Results show that (1) the mean two-speed DCT efficiency
can be reach 95%. (2)The efficiency of DCT grows with the input torque
increasing, and decreases with the rise of input speed. Additionally, (3) the
165
entire drag torque is dominated by the viscous shear in the wet clutch
package followed by the differential gear churning and windage losses. (4)
Moreover, when the vehicle run in the 2nd gear, the drag torque generated by
clutch shear stress is smaller than that of run in the 1st gear in the same input
speed. (5) The gear churning and windage losses for the 2nd gear, however,
are larger than that of in the 1st gear.
2. If the clutch is with the same torque capacity, it is best to increase the
number of clutch plates and decrease the size of clutch plates, thus the total
drag torque will decrease, and hence there will be improvement of the
efficiency. During the design procedure of transmission, if excluding the
factors of size limitation, it is necessary to increase the number of clutch
plates and decrease the radius of the clutch plates in order to reduce the drag
torque losses.
3. The developed drag torque contributes to the study of transmission thermal
behaviour. The experimental results validate the effectiveness of the
combined drag torque and thermal prediction models, with accurate steady
state results achieved. Drag torque and thermal behaviour study in this work
reduces the difficulty in the design of future transmission prototypes and
calculating its reliability. This work reveals that the level of load applied in
the transmission has a minor affect in thermal rise in comparison to speed
dependent operation. With only a limited number of gear changes required
by the modified transmission, heat rejection through the casing only is
sufficient. The impact of gear churning and windage losses becomes more
and more significant with the speed increasing, especially in high speed. The
166
final stable temperature of DCT is influenced by the environment
temperature significantly.
4. After design and optimisation of pure EV powertrain system with integrated
consideration of electric motor and transmission including the developed
drag torque model, simulation results shows that difference for the combined
motor and DCT efficiency between the worst and the best results can be 3%
or even more when equipped with the same motor. When equipped with
different motor, the maximum difference of powertrain efficiency can reach
15%. This indicates that it is a significant requirement to integrate electric
motor with transmission to design and optimisation of pure EV powertrain
system performance.
9.3 Further research
The research presented in this thesis is focused on studying the drag torque within two-
speed DCT which is equipped in a pure EV powertrain system. However, it has only the
investigated drag torques model and applied them into the thermal behaviour analysis
and DCT redesign and optimisation.
Avenues for further research into DCT drag torque and its applications include:
1. Integrated design of electric vehicle powertrain system, considering the battery
energy management strategy, regenerative braking, electric motor, transmission
and its drag torque etc.
2. Applying drag torques model into DCT clutch shift control.
3. Applying drag torque model into studying on other kinds of transmissions, such
as the AMT gear shift control.
167
9.4 Conclusions
The principal aims of this thesis were twofold, numerical and experimental investigation
of drag torque within the two-speed dual clutch transmission, which is equipped into a
pure electric vehicle powertrain system, and the application of investigated drag torque
into transmission thermal behaviour analysis and design and optimisation of two-speed
EV powertrain system.
Different source of drag torque in the DCT are theoretically analysed and modelled,
including torsional resistance caused by viscous shear caused between wet clutch plates
and concentrically aligned shafts, gear mesh friction and windage, oil churning, and
bearing losses. Then experimental investigations are carried out on UTS electric vehicle
powertrain system test rig. Outcomes of experimentation on drag torque confirm that
simulation results agree well with the test data. Additionally, based on the drag torque
study, the thermal behaviour of the transmission are analysed via both theoretical and
experimental investigation. Finally, via using genetic algorithm method, integrated
optimal design of electric vehicle powertrain system equipped with two-speed DCT is
performed, considering the factors of shift schedule, electric motor selection, gear ratios
design, wet clutch design and application of investigated drag torque model.
This work can be looked as a reference to future research on reducing drag torque,
applications of drag torque in two-speed or multi-speed electric vehicle powertrain
system efficiency optimisation and torque estimated shift control. With some slight
adjustments according to the detail transmissions layout, this numerical method for
predicting the two-speed DCT drag torque can also be applied to other transmissions
equipped with wet clutch packages, let alone ordinary MT and AMT.
168
REFERENCES
[1] Chan, C. C., Electric, Hybrid & Fuel Cell Vehicles: Overview, State-of-the-art, Key Technologies & Issues. Proceedings of the IEEE, 2007. 95(4): pp. 704-718.
[2] http://www.dctfacts.com/latest-news/dct-mainstream-technology.aspx 01/2012. [3] Walker, P. D., N. Zhang, W. Zhan, et al., Modelling and simulation of gear
synchronisation and shifting in dual-clutch transmission equipped powertrains. Proceedings of the Institution of Mechanical Engineers, Part C: Journal of Mechanical Engineering Science, 2012(Journal Article).
[4] Zhu, B., N. Zhang, P. Walker, et al., Two-Speed DCT Electric Powertrain Shifting Control and Rig Testing. Advances in Mechanical Engineering, 2013. 2013(2013): pp. 10.
[5] Goetz, M., M. Levesley, and D. Crolla, Dynamic Modelling of a Twin Clutch Transmission for Crontroller Design. Materials Science Forum, 2003. 440-441(Journal Article): pp. 253-261-253-261.
[6] Goetz, M., M. Levesley, and D. Crolla, Dynamics and Control of Gearshifts on Twin-Clutch Transmission. Proceedings of the Institution of Mechancial Engineers Part D: Journal of Automobile Engineering, 2005. 219(Journal Article): pp. 951-963.
[7] Diab, Y., F. Ville, and P. Velex, Investigations on Power Losses in high speed gears. Proc. Inst. Mech. Eng. Part J: J. Eng. Tribol., 2006. 220: pp. 191-198.
[8] Heingartner, P. and D. Mba, Determining Power Losses in the Helical Gear Mesh. Gear Technol., 2005: pp. 32-37.
[9] Li, S., A. Vaidyanathan, J. Harianto, et al., Influence of Design Parameters on Mechanical Power Losses of Helical Gear Pairs. Journal of Advanced Mechanical Design, Systems, and Manufacturing, 2009. 3(2): pp. 13.
[10] Xu, H., A. Kahraman, N. E. Anderson, et al., Prediction of mechanical efficiency of parallel-axis gear pairs. J. Mech. Des. , 2007. 129: pp. 58-68.
[11] Dawson, P. H., Windage loss in large high speed gears. Proc. Inst. Mech. Eng. Part J: J. Engineering Tribology, 1984. 198A(1): pp. 51-59.
[12] Eastwick, C. N. and G. Johnson, Gear windage: a review. J.Mech. Des. , 2008. 130.
[13] Diab, Y., F. Ville, H. Houjoh, et al., Experimental and numerical investigations on the air pumping phenomenon in high speed spur and helical gears. Proc. Inst. Mech. Eng., Part C: J. Mechanical Engineering Sciences, 2004. 219(G8): pp. 785-790
[14] Changenet, C. and P. Velex, A model for the prediction of churning losses in geared transmissions—preliminary results. J. Mech. Des. , 2006. 129(1): pp. 128-133.
[15] Changenet, C., X. Oviedo-Marlot, and P. Velex, Power loss predictions in geared transmissions using thermal networks-application to a six speed manual gearbox. Trans. Am. Soc. Mech. Eng., 2006. 128: pp. 618–625
[16] Harris, T. A., Rolling Bearing Analysis. 1st ed. 1966. [17] Hashimoto, H., S. Wada, and Y. Murayama, The performance of a Turbulent
Lubricated Sliding Bearing Subject to Centrifugal Effect. Trans. Jpn, Soc. Mech. Eng.,Ser, C 1984. 49(446): pp. 1753-1761.
169
[18] Walker, P. D., N. Zhang, R. Tamba, et al., Simulations of drag torque affecting synchronisers in a dual clutch transmissions. Japan J. Indust. Appl. Math., 2011. 28: pp. 119-140.
[19] British Standards Institute BS ISO/TR 14179-1:2001, Gears-thermal capacity- Part 2:Thermal load-carrying capacity. 2001.
[20] Kato, Y., T. Murasugi, and H. Hirano, Fuel Economy Improvement through Tribological Analysis of the Wet Clutches and Brakes of an Automatic Transmission. Society of automotive Engineers of Japan, 1993. 16(12): pp. 57-60.
[21] Iqbal, S., T. Janssens, W. Desmet, et al., Transmitted power and energy flow behaviour of degrading wet friction clutches. International Journal of Applied Research in Mechanical Engineering, 2012. 2(1): pp. 94-100.
[22] Lechner, G. and H. Naunheimer, Automotive Transmissions—Fundamentals, Selection, Design and Application. 1st ed. 1999, Berlin: Springer.
[23] Kegresse, A., Automatic Variable Speed Transmission. 1945. [24] Murphy, T., Porsche shifts swiftly to PDK, in Ward's Autoworld. 2009. pp. 16-
17. [25] Wagner, G., Application of Transmission systems for Different Driveline
Configurations in Passenger Cars. SAE Technical Paper, 2001. 2001-01-0882(Journal Article).
[26] Goetz, M., Integrated Powertrain Control for Twin Clutch Transmissions. 2005, University of Leeds.
[27] Stefanini, S., Shift in power to the gearbox, in Automotive Manufacturing Solutions. 2003. pp. 70-73-70-73.
[28] Anonymous, Dual clutch technology voted transmission of the future at CTI symposium. China Weekly News, 2009(Journal Article): pp. 58-58.
[29] Rudolph, F., M. Schafer, A. Damm, et al., The Innovative Seven Speed Dual Clutch Gearbox for Volkswagen’s Compact Cars, in 28th Internationales Wiener Motorensymposium. 2007.
[30] Williamson, S. S., A. Emadi, and K. Rajashekara, Comprehensive efficiency modeling of electric traction motor drives for hybrid electric vehicle propulsion applications. IEEE Trans. Veh. Technol., 2007. 56(4): pp. 1561-1572.
[31] Dudley, D. W. and D. P. Townsend, Dudley's gear handbook. 1991: McGraw-Hill.
[32] Holmes, G. R. and R. Tamba, Solenoid control valve. 2006, F15B 13/44 (2006.01); F16K 31/06 (2006.01): United States of America.
[33] Rolland, D., A. O'Neill, T. Burchell, et al. Hew High performance Dual clutch transmission. in FISITA2006.
[34] Wagner, U. and A. Wagner, Electric Shift Gearbox (ESG) - Consistent development of the dual clutch transmission to a mild hybrid system. SAE Technical Paper, 2005. 2005-01-4182(Journal Article).
[35] Joshi, A. S., N. P. Shah, and C. Mi. Modeling and simulation of a dual clutch hybrid vehicle powertrain.
[36] Wang, J., J. Guo, G. Ao, et al., Simulation of a Single-axle Parallel Hybrid Electronic System with Two Clutches. Journal of Shang Hai Jiao Tong University, 2008. 42(6): pp. 882-886.
[37] Matthes, B. and F. Geunter. Dual Clutch Transmissions - Lessons Learnt and Future Potential.
170
[38] Link, M., B. Voss, E. Eggert, et al., The Automated Shift Transmission (AST) - Possibilities and Limits in production-type vehicles. SAE Technical Paper, 2001. 2001-01-0881(Journal Article).
[39] Berger, R., R. Meinhard, and C. Bunder. The Parallel Shift Gearbox PSG. [40] Tenberge, P., Double Clutch Transmission - Power-shiftable Winding
Transmission. VDI-Berichte, 2002. 1665(Journal Article): pp. 1033-1050. [41] Wagner, U., R. Berger, M. Ehrlich, et al. Electromotoric actuators for double
clutch transmissions - best efficiency by itself. [42] Wheals, J., A. Turner, K. Ramsay, et al., Double Clutch Transmission (DCT)
using Multiplexed Linear Actuation Technology and Dry Clutches for High Efficiency and Low Cost. SAE Technical Paper, 2007. 2007-01-1096(Journal Article).
[43] Turner, A. J., K. Ramsay, R. E. Clark, et al., Development of High Force electromechanical linear actuator for shift-by-wire automated manual transmissions. SAE Technical paper series, 2006(2006-01-0360).
[44] Qin, D., Y. Zhao, J. Hu, et al., Analysis of shifting control for dry dual clutch system. Journal of Chongqing University, 2009. 32(9): pp. 1016-1023.
[45] Ahlawat, R., H. K. Fathy, B. Lee, et al., Modelling and simulation of a dual clutch transmission vehicle to analyse the effect of pump selection on fuel economy. Vehicle system dynamics, 2009(Journal Article): pp. 1-18.
[46] Certez, C., O. Scherf, K. Stutzer, et al., Wet or Dry Clutchs for Dual Clutch Transmissions. FISITA World Automotive Conference 2004, 2004. F2004F136(Journal Article).
[47] Ni, C., T. Lu, and J. Zhang, Effect of friction discs wear on dry DCT shifting performance. Journal of Shang Hai Jiao Tong University, 2009. 46(10): pp. 1545-1554.
[48] Ni, C., T. Lu, M. Wu, et al., Quantification Detection of the Wear of DCT Dual-clutch. Journal of Shang Hai Jiao Tong University, 2008. 42(8): pp. 1319-1328.
[49] Qin, D., Y. Liu, J. Hu, et al., Control and Simulation of Launch with Two Clutches for Dual Clutch Transmissions. Journal of Mechanical Engineering, 2010. 46(18): pp. 121-127-121-127.
[50] Tersigni, S. H., H. Z. Tang, R. H. Iyer, et al., Durability of dual clutch transmission fluids. SAE Technical Paper, 2009. 2009-01-1801(Journal Article).
[51] Liu, Y., D. Qin, H. Jiang, et al., A systematic model for dynamics and control of dual clutch transmissions. Journal of Mechanical Design, 2009. 131(June).
[52] Kirschstein, S., The Impact of Launch Control on the Vibration Behaviour of a Dual Clutch Transmission Powertrain. VDI Berichte, 2007. 1971(Journal Article): pp. 197-217.
[53] Zhang, Y., X. Chen, X. Zhang, et al., Dynamic Modeling and Simulation of a Dual-Clutch Automated Lay-Shaft Transmission. Transactions of the ASME, 2005. 127(Journal Article): pp. 302-307-302-307.
[54] Kulkarni, M., T. Shim, and Y. Zhang, Shift Dynamics and Control of Dual-Clutch Transmissions. Mechanism and Machine Threory, 2007. 42(Journal Article): pp. 168-182.
[55] Lei, Y., J. Wang, and A. Ge. Research on Control stratgies of Double Clutch Transmission Based on System Simulation.
171
[56] Xuexun, G., F. Chang, Y. Jun, et al., Modeling and Simulation Research of Dual Clutch Transmission Based on Fuzzy Logic Control. SAE Technical Paper, 2007. 2007-01-3754(Journal Article).
[57] Zhang, N., A. Crowther, D. K. Liu, et al., A Finite Element Method for the Dynamic Analysis of Automatic Tranmission Gear Shifting with a Four-Degree-of-Freedom Planetary Gearset Element. Proceedings of the Institution of Mechancial Engineers Part D: Journal of Automobile Engineering, 2003. 217(Journal Article): pp. 461-473.
[58] Crowther, A. and N. Zhang, Torsional finite elements and nonlinear modelling in vehicle powertrain dynamics. Journal of Sound and Vibration, 2005. 184(Journal Article): pp. 825-849.
[59] Bartlett, H. and R. Whalley, Power Transmission System Modelling. Proceedings of the Institution of Mechancial Engineers, Part C, 1998. 212(Journal Article): pp. 497-508-497-508.
[60] Yang, W., G. Wu, and D. Qin, Drive line system modelling and shift characteristic of dual clutch tranmission powertrain. Journal of Mechanical Engineering, 2007. 43(7): pp. 188-194.
[61] Yang, W., Q. Chane, G. Wu, et al., Design of the intelligent compensating shifting schedule and its application in dual clutch automatic transmission vehicle. Journal of Mechanical Engineering, 2009. 45(1): pp. 205-210.
[62] Lovas, L., D. Play, J. Marialigeti, et al., Mechanical Behaviour Simulation for Synchromesh Mechanism Improvements. Proceedings of the Institution of Mechancial Engineers Part D: Journal of Automobile Engineering, 2006. 220(Journal Article): pp. 919-945.
[63] Socin, R. J. and L. K. Walters, Manual Transmission Synchronizers. SAE Technical Paper, 1968. 680008(Journal Article).
[64] Walker, P. D., N. Zhang, R. Tamba, et al., Simulation of drag torque affecting synchronisers in a dual clutch transmission. Japan journal of inductrial and applied mathematics, 2011. Doi: 10.1007/s13160-011-0030-4(Journal Article).
[65] Razzacki, S. T. and J. Hottenstein. Synchroniser Design and Development for Dual Clutch Stransmission (DCT). in SAE Technical Paper.
[66] Walker, P. D., N. Zhang, R. Tamba, et al. Synchroniser modeling with application specific to the dual clutch transmission.
[67] Mierlo, J. V., P. V. d. Bossche, and G. Maggetto, Models of energy sources for EV and HEV: Fuel cells, batteries, ultracapacitors, flywheels and engine-generators. Journal of Power Sources, Mar. 2004. 128(1): pp. 76-89.
[68] Mierlo, J. V. and G. Maggetto, Innovative iteration algorithm for a vehicle simulation program. IEEE Trans. Veh. Technol., Mar. 2004. 53(2): pp. 401-412.
[69] Anderson, N. E. and S. H. Loewenthal. Spur Gear System Efficiency at Part and Full Load. in NASA Technical Paper 1622.
[70] Michlin, Y. and V. Myunster, Determination of power losses in gear transmissions with rolling and sliding friction incorporated. Mechanism and Machine Theory, 2002. 37(2): pp. 167-174.
[71] Benedict, G. H. and B. W. Kelley, Instantaneous coefficients of gear tooth friction. ASLE Transactions, 1961. 4(Journal Article): pp. 59-70.
[72] Li, S. and A. Kahraman, Prediction of Spur Gear Mechanical Power Losses Using a Transient Elastohydrodynamic Lubrication Model. Tribology Transactions 2010. 53(4): pp. 554-563.
172
[73] British Standards Institute BS ISO/TR 14179-1:2001, Gears-thermal capacity-Part 1: rating gear drives with thermal equilibrium at 95◦C sump temperature. 2001.
[74] Heingartner, P. and D. Mba, Determining Power Losses in Helical Gear Mesh. Gear Technology, 2005(Journal Article): pp. 32-37.
[75] Al-Shibl, K., K. Simmons, and C. N. Eastwick, Modelling windage power loss from an enclosed spur gear. Proceedings of the Institution of Mechancial Engineers, Part A: Journal of Power and Energy, 2007. 221(Journal Article): pp. 331-341.
[76] Dawson, P. H., Windage loss in larger high speed gears. Proceedings of the Institution of Mechancial Engineers, 1984. 198A(1): pp. 51-59.
[77] Changenet, C., X. Oviedo-Marlot, and P. Velex, Power loss predictions in geared transmissions using thermal networks-appplication to a six speed manual gearbox. Transactions of the American Society of Mechanical Engineers, 2006. 128(May): pp. 618-625.
[78] Changenet, C. and P. Velex, A Model for the Prediction of Churning Losses in Geared Transmissions - Preliminary Results. Transactions of the American Society of Mechanical Engineers, 2007. 129(January): pp. 128-133.
[79] Satya, S., An investigation of load independent power losses of gear systems. 2009, Ohia State University: Ohia State,USA.
[80] Kitabayashi, H., C. Yu Li, and H. Hiraki, Analysis of the various factors affecting drag torque in multiple plate wet clutches. JSAE Technical Papaer, 2003. 2003-01-1973(Journal Article).
[81] Yuan, Y., E. Liu, and H. James, An improved hydrodynamic model for open wet transmission clutches. Journal of Fluids Engineering, 2007. 129(3): pp. 333-337.
[82] Aphale, C. R., J. Cho, W. W. Schultz, et al., Modeling and Parametric Study of Torque in Open Clutch Plates. Transactions of the American Society of Mechanical Engineers, 2006. 128(April): pp. 422-430.
[83] Schlichting, H., Boundary layer theory. Vol. 7. 1979, Antigua: McGraw-Hill Classic.
[84] Hansen, J., R. Ruedy, M. Sato, et al., Global Surface Temperature Change. American Geophysical Union, Dec. 2010: pp. 1-29.
[85] Chan, C. C., Outlook of Electric, Hybrid and Fuel Cell Vehicles. Journal of Automotive Safety and Energy, 2011. 2(1): pp. 12-14.
[86] Kessels, J., Energy management for automotive power net. Feb. 2007, Technische Universiteit Eindhoven: Eindhoven,The Netherlands.
[87] Rahman, S. B. A., Optimal Power Management for the UTS Plug-in Hybrid Electric Vehicle, in Faculty of Engineering and IT. 2011, University of Technology Sydney: Sydney.
[88] Schofield, N. and M. K. Jenkins, High performance brushless permanent magnet traction drives for hybrid electric vehicles, in Machines and Drives for Electric and Hybrid Vehicles (Digest No: 1996/152), IEE Colloquium on 1996, IET London pp. 1-6.
[89] Chan, C. C., Electric, Hybrid, and Fuel-Cell Vehicles: Architectures and Modeling. IEEE Transactions on vehicular technology, 2010. 59(2).
[90] Bellis, M. The History of Electric Vehicles http://inventors.about.com/od/estartinventions/a/History-Of-Electric-Vehicles.htm. 2011 [cited 2014 6th May 2014].
173
[91] Emadi, A., Y. J. Lee, and K. Rajashekara, Power electronics and motor drives in electric, hybrid electric, and plug-in hybrid vehicles. IEEE Trans. Ind. Electron., Jun. 2008. 55(6): pp. 2237-2245.
[92] Onoda, S. and A. Emadi, PSIM-based modeling of automotive power systems: Conventional, electric, and Hybrid Electric Vehicles. IEEE Trans. Veh. Technol., 2004. 53(2): pp. 390–400.
[93] Sivaramaiah, G. and V. R. Subramanian, An overview of the development of lead/acid traction batteries for electric vehicles in India. Journal of Power Sources, 1992. 38(1-2): pp. 165-170.
[94] Zou, Y. and F. Sun, Simulation software technology development for the electric vehicles. Mechanical science and technology, 2004. 23(7): pp. 761-764.
[95] Faggioli, E., P. Rena, V. Danel, et al., Supercapacitors for the energy management of electric vehicles. Journal of Power Sources, 1999. 84(2): pp. 261-269.
[96] Pattipati, B., K. Pattipati, J. P. Christopherson, et al., Automotive battery management systems, in IEEE Autotestcon 2008. pp. 581-586.
[97] Ferreira, A. A., J. A. Pomilio, G. Spiazzi, et al., Energy management fuzzy logic supervisory for electric vehicle power supplies system. IEEE Trans. Power Electron, 2008. 23(1): pp. 107-115.
[98] Lhomme, W., P. Delarue, A. Bouscayrol, et al., Comparison of control strategies for maximising energy in a supercapacitor storage subsystem. European Power Electronics and Drives Journal, 2009. 19(3): pp. 38-48.
[99] Peng, J., H. He, and N. Feng, Simulation Research on an Electric Vehicle Chassis System Based on a Collaborative Control System. Energies, 2013. 6(1): pp. 312-328.
[100] Tatsuo, K. and I. Mitsuhiro, Electronic Vehicle Control Unit: United States [101] Mehrdad, E., G. Yimin, G. S. E, et al., eds. Modern Electric, Hybrid Electric,
and Fuel Cell Vehicles: Fundamentals, Theory and Design. 2004, CRC Press. [102] Hori, Y., Further vehicle driven by electricity and control – research on four-
wheel-motored “UOT Electric March II”. IEEE transactions on industrial electronics, 2004. 51(5).
[103] Walker, P. D., S. A. Rahman, B. Zhu, et al., Modelling, Simulations, and Optimisation of Electric Vehicles for Analysis of Transmission Ratio Selection. Advances in Mechanical Engineering, 2013. 2013.
[104] Liu, H., Y. Lei, Z. Li, et al., A Multi-Layered and Modular Design Approach for Developing AMT Control System in Battery Electric Vehicles, in SAE 2012 World Congress & Exhibition. 2012, SAE International: Michigan, USA.
[105] Hoeijmakers, M. J. and J. A. Ferreira, The electric variable transmission. IEEE Trans. Ind. Appl., 2006. 42(4): pp. 1092-1100.
[106] Zhou, X., P. Walker, N. Zhang, et al., Performance Improvement of a Two Speed EV through Combined Gear Ratio and Shift Schedule Optimisation. SAE Technical Paper 2013-01-1477, 2013.
[107] Floyd, A., Driving Schedules Influence Electric and Hybrid Vehicle Efficiency, 34th Intersociety Energy Conversion Engineering Conference, in 34th Intersociety Energy Conversion Engineering Conference. 1999, SAE Technical Paper 1999-01-2707.
[108] Inagawa, T., H. Tomomatsu, Y. Tanaka, et al., Shift Control System Development (NAVI·AI-SHIFT) for 5 Speed Automatic Transmissions Using
174
Information From the Vehicle's Navigation System. SAE Technical Paper 2002-01-1254, 2002.
[109] Robinette, D., A DFSS Approach to Determine Automatic Transmission Gearing Content for Powertrain-Vehicle System Integration. SAE Int. J. Passeng. Cars - Mech. Syst., 2014. 7(3).
[110] Chen, M., D. Wang, H. Lee, et al., Application of CAE in Design Optimisation of a Wet Dual Cutch Transmission and Driveline. SAE Int. J. Passeng. Cars - Mech. Syst., 2014. 7(3).
[111] Yin, X., Y. Zhong, X. Wu, et al., Shift Quality Improvement through Integrated Control of Dual Clutches Pressure and Engine Speed for DCT. SAE Technical Paper 2014-01-1748, 2014.
[112] Manyala, J., Gearshift Actuator Dynamics Predictions in a Dual Clutch Transmission. SAE Int. J. Commer. Veh., 2013. 6(2).
[113] Goetz, M., M. Levesley, and D. Crolla, A Gearshift Controller for Twin Clutch Transmissions. VDI Berichte, 2003. 1786(Journal Article): pp. 381-400-381-400.
[114] Sun, S., S. Li, Y. Fu, et al., Research on Intelligent Self-Learning System for the Electro-Pneumatic Automated Manual Transmission Gear Position. SAE Technical Paper 2014-01-1741, 2014.
[115] Soares, A. C., L. Catapano, and R. Dias, The Use of Simulation for Choosing the Best Automated Manual Transmission: MAN Case Study. SAE Technical Paper 2013-36-0336, 2013.
[116] Rudolph, F., M. Schafer, A. Damm, et al. The Innovative Seven Speed Dulai Clutch Gearbox for Volkswagen's Compact Cars. in 28th Internationales Wiener Motorensymposium.
[117] Zhou, X., P. D. Walker, N. Zhang, et al., A numerical study of the impact of wet clutch drag torque on the performance of two-speed electric vehicle. International Journal. of Vehicle Performance, 2014 (Accepted).
[118] Lechner, G. and H. Naunheimer, Automotive Transmissions - Fundamentals, Selection, Design and Application. Vol. 1. 1999, Germany: Springer-Verlag. 448.
[119] Kitabyashi, H., C. Li, and H. Hiraki, Analysis of the Various Factors Affecting Drag Torque in Multiplate Plate Wet Clutches. JSAE Paper No.2003-01-1973., 2003.
[120] Yuan, Y., P. Attibele, and Y. Dong, CFD Simulation of the Flows Within Disengaged Wet Clutches of an Automatic Transmission. SAE Technical Paper 2003-01-0320, 2003.
[121] Aphale, C. R., J. Cho, W. W. Schultz, et al., Modeling and Parametric Study of Torque in Open Clutch Plates. Journal of Tribology, 2005. 128(2): pp. 422-430.
[122] Yuan, S., Z. Peng, and C. Jing, Experimental Research and Mathematical Model of Drag torque in Single-plate Wet clutch. Chinese Journal of Mechanical Engineering, 2010. 23: pp. 1-8.
[123] Patel, P. D. and J. M. Patel, An Experimental Investigation of Power Losses in Manual Transmission Gear Box. International Journal of Applied Research in Mechanical Engineering 2012. 2(1): pp. 1-5.
[124] Iritani, M., H. Aoki, K. Suzuki, et al., Prediction Technique for the Lubricating Oil Temperature in Manual Transaxle. SAE Technical Paper 1999-01-0747, 1999.
175
[125] Seetharaman, S., A. Kahraman, G. Bednarek, et al., A Model to Predict Mechanical Power Losses of Manual Transmissions. Automobiltechnische Zeitschrift, 2008(4): pp. 346-357.
[126] Per, R., B. Georg, S. Satya, et al., Development of an efficiency model for manual transmissions. ATZ worldwide, 2008. 110(4): pp. 36-43.
[127] Li, H., Q. Jing, and B. Ma, Modeling and Parametric Study on Drag Torque of Wet Clutch,. Proceedings of the FISITA 2012 World Automotive Congress, Lecture Notes in Electrical Engineering, 2013. 193: pp. 21-30.
[128] Chang, J., A Calculation formula for carrying-capacity of annular hydrostatic step-bearing taking account of oil-flow inertia. Chinese Journal of Mechanical Engineering, 1982. 18(1): pp. 62-68.
[129] Peter R. N. Childs, Mechanical Design. second ed. 2004, UK: Elsevier. [130] Schlichting, H. and K. Gersten, Boundary-Layer Theory. 2000: MacGraw-Hill. [131] Crowther, A. R., Transient vibration in powertrain systems with automatic
transmissions. 2004, University of Technology, Sydney. [132] Harding Performance DSG Software & Hardware program DQ250
http://hp.net.au/index.php/products/dq-250. [cited 2014. [133] Holmberg, K., P. Andersson, and A. Erdemir, Global energy consumption due to
friction in passenger cars. Tribology International, 2012. 47: pp. 221-234. [134] Roser, H., P. D. Walker, and N. Zhang. Robustness analysis of two-speed
electric vehicles. in Proceedings of the ASME 2013 International Mechanical Engineering Congress and Exposition. 2013. San Diego, California, USA.
[135] Changenet, C., M. Denis, and D. Nast, Thermal study of railway reduction gears. VDI BERICHTE, 1996. 1230: pp. 461-471.
[136] Coe, H. H., Comparison of predicted and measured temperature of UH-60 helicopter transmssion. NASA Technical Paper No. 2911, 1989: pp. 12.
[137] Joule, D., S. Hinduja, and J. N. Ashton, Thermal Analysis of a Spur Gearbox Part 1: Steady State Finite Element Analysis. Proceedings of the Institution of Mechanical Engineers, Part C: Journal of Mechanical Engineering Science 1988. 202(4 ): pp. 245-256
[138] Phillips, A. E., ed. The Development of a Practical Thermal Rating Method for Enclosed Gear Drives 1996, AGMA. 8.
[139] Handschuh, R. F. and C. J. Kilmain, Preliminary investigation of the thermal behaviour of high-speed helical gear trains. NASA/TM-2002-211336, 2002.
[140] Marklund, P., R. Mäki, R. Larsson, et al., Thermal influence on torque transfer of wet clutches in limited slip differential applications. Tribology International, 2007. 40: pp. 876-884.
[141] FUNCK, G., ed. Wärmeabführung bei Getrieben unter quasistationären Betriebsbedingungen. 1985, Technische Universität München. 198.