Embed Size (px)
Citation preview
University of Sydney FINC6021 Group assignment Lecturer: Angelo Aspris
Coca Cola Amatil Ltd.
Prepared by
420056878 | 420105969 | 312011768 |
420090067 | 420151508
ASX:CCL Valuation Report
420056878 | 420105969 | 312011768 | 420090067 | 420151508 ASX:CCL Valuation Report
i
CONTENTS Executive summary ............................................................................................................................................. 1
1. Highlights .................................................................................................................................................... 2
2. BUSINESS OVERVIEW ................................................................................................................................ 3
2.1 Business description .................................................................................................................................. 3
2.2 Macroeconomic environment .................................................................................................................... 3
2.3 Industry analysis ........................................................................................................................................ 4
2.4 Competitive positioning (SWOT) ............................................................................................................. 4
3. VALUATION.................................................................................................................................................. 6
3.1 Methodology and assumptions .................................................................................................................. 6
3.2 Growth rates .............................................................................................................................................. 7
3.3 Discount rate .............................................................................................................................................. 8
3.4 Base case valuation .................................................................................................................................... 9
3.5 Multiple Analysis .................................................................................................................................... 10
4. RISK ANALYSIS ......................................................................................................................................... 11
4.1 Possible risks ........................................................................................................................................... 11
4.2 Sensitivity analysis .................................................................................................................................. 11
4.3 Scenario analysis ..................................................................................................................................... 12
5. CONCLUSION ............................................................................................................................................. 12
6. Appendix .......................................................................................................................................................... i 6.1Regression results for Beta (5Y and 10Y data) ........................................................................................... i 6.2 Pro forma statements ............................................................................................................................ i 6.3 Free cash flow..................................................................................................................................... iii 6.4 Ratios of peers .................................................................................................................................... iii
REFERENCES ..................................................................................................................................................... a
1
Executive summary Coca-Cola Amatil (ASX: CCL) is the one of the biggest non-alcoholic beverage companies in the Asia-
Pacific region and listed in Australian Securities Exchange. The company operates and manufactures in
Australia, New Zealand, Indonesia, and PNG with a variety of product lines and brands (Coca-Cola Amatil
2013).
The purpose of this report is to value the CCL and provide the 12-month rating. We provide a “HOLD”
recommendation for investors, whereby a profound evaluation of company performance under current
industry and economic circumstances. Firstly, macroeconomic background, industry environment and SWOT
analysis are conducted to make key assumptions in forecasting the future performance of company. With that
valuable information, pro-forma statement for 5 years is modeled using sales driven model and developed by
reflecting the inside operating and financial condition. To determine the short to medium and terminal growth
rate, several variables are considered including real economic, population, generic growth, risks, and
operating performance in 4 countries. To assess the CCL’s value comparing to peer companies, 3 companies
are selected based on industry sector and financial performance, and appropriate multiples are used. Lastly,
sensitivity and scenario analysis are used to examine which variables affect on terminal growth and WACC of
CCL and how variable changes the company’s value within 4 scenario cases.
Note: It is important to note that all the historical data in the pro-forma statement projection is from Morningstar DatAnalysis ®.
420056878 | 420105969 | 312011768 | 420090067 | 420151508 ASX:CCL Valuation Report
2
1. Highlights
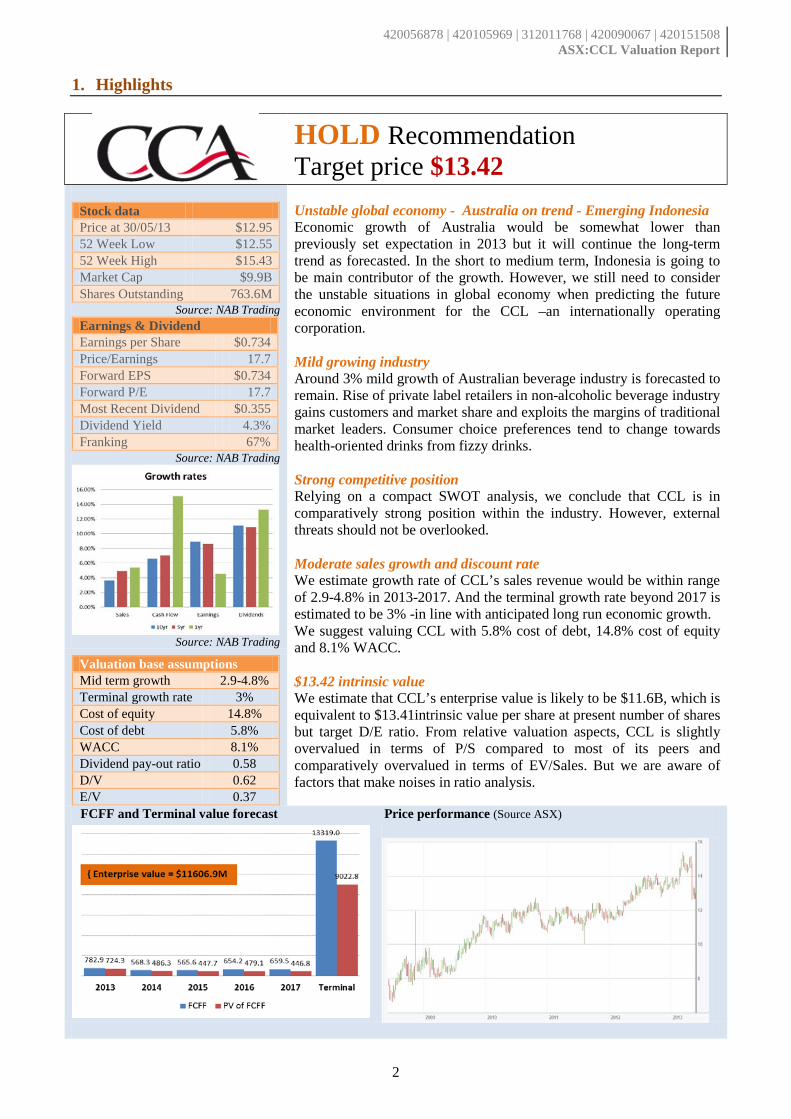
HOLD Recommendation Target price $13.42
Stock data Price at 30/05/13 $12.95 52 Week Low $12.55 52 Week High $15.43 Market Cap $9.9B Shares Outstanding 763.6M
Source: NAB Trading Earnings & Dividend Earnings per Share $0.734 Price/Earnings 17.7 Forward EPS $0.734 Forward P/E 17.7 Most Recent Dividend $0.355 Dividend Yield 4.3% Franking 67%
Source: NAB Trading
Source: NAB Trading
Valuation base assumptions Mid term growth 2.9-4.8% Terminal growth rate 3% Cost of equity 14.8% Cost of debt 5.8% WACC 8.1% Dividend pay-out ratio 0.58 D/V 0.62 E/V 0.37
Unstable global economy - Australia on trend - Emerging Indonesia Economic growth of Australia would be somewhat lower than previously set expectation in 2013 but it will continue the long-term trend as forecasted. In the short to medium term, Indonesia is going to be main contributor of the growth. However, we still need to consider the unstable situations in global economy when predicting the future economic environment for the CCL –an internationally operating corporation. Mild growing industry Around 3% mild growth of Australian beverage industry is forecasted to remain. Rise of private label retailers in non-alcoholic beverage industry gains customers and market share and exploits the margins of traditional market leaders. Consumer choice preferences tend to change towards health-oriented drinks from fizzy drinks. Strong competitive position Relying on a compact SWOT analysis, we conclude that CCL is in comparatively strong position within the industry. However, external threats should not be overlooked. Moderate sales growth and discount rate We estimate growth rate of CCL’s sales revenue would be within range of 2.9-4.8% in 2013-2017. And the terminal growth rate beyond 2017 is estimated to be 3% -in line with anticipated long run economic growth. We suggest valuing CCL with 5.8% cost of debt, 14.8% cost of equity and 8.1% WACC. $13.42 intrinsic value We estimate that CCL’s enterprise value is likely to be $11.6B, which is equivalent to $13.41intrinsic value per share at present number of shares but target D/E ratio. From relative valuation aspects, CCL is slightly overvalued in terms of P/S compared to most of its peers and comparatively overvalued in terms of EV/Sales. But we are aware of factors that make noises in ratio analysis.
FCFF and Terminal value forecast Price performance (Source ASX)
420056878 | 420105969 | 312011768 | 420090067 | 420151508 ASX:CCL Valuation Report
3
2. BUSINESS OVERVIEW
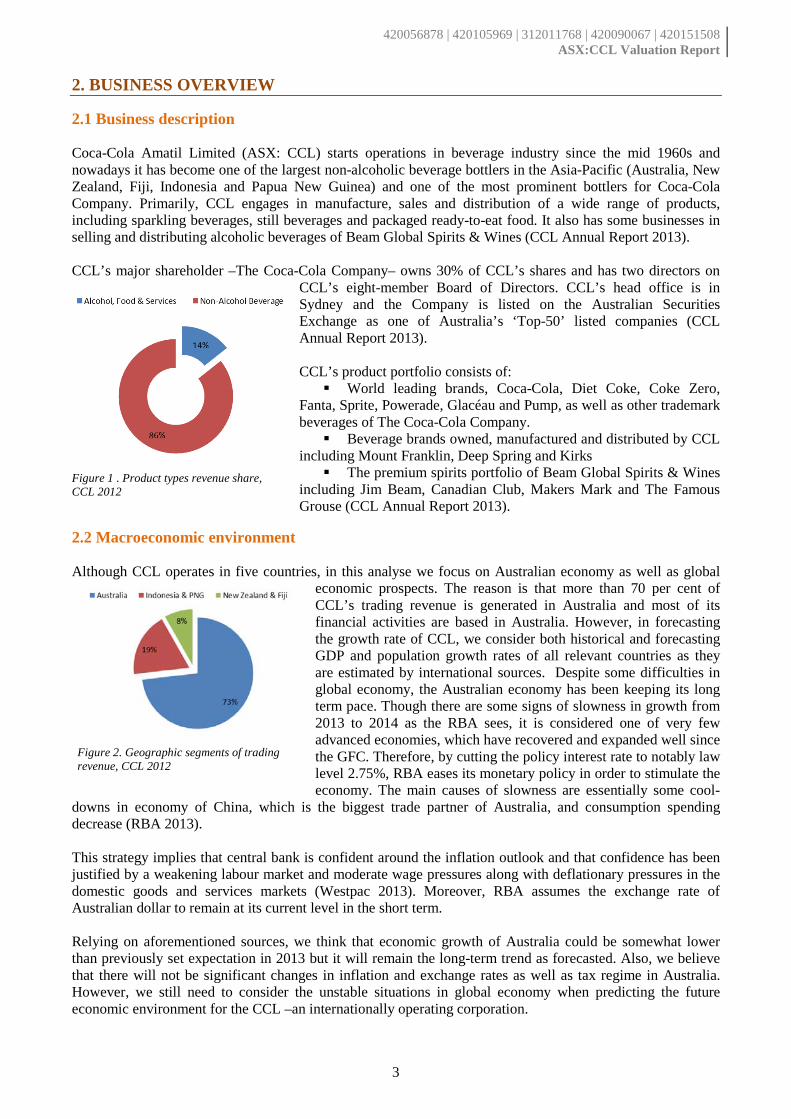
2.1 Business description Coca-Cola Amatil Limited (ASX: CCL) starts operations in beverage industry since the mid 1960s and nowadays it has become one of the largest non-alcoholic beverage bottlers in the Asia-Pacific (Australia, New Zealand, Fiji, Indonesia and Papua New Guinea) and one of the most prominent bottlers for Coca-Cola Company. Primarily, CCL engages in manufacture, sales and distribution of a wide range of products, including sparkling beverages, still beverages and packaged ready-to-eat food. It also has some businesses in selling and distributing alcoholic beverages of Beam Global Spirits & Wines (CCL Annual Report 2013). CCL’s major shareholder –The Coca-Cola Company– owns 30% of CCL’s shares and has two directors on
CCL’s eight-member Board of Directors. CCL’s head office is in Sydney and the Company is listed on the Australian Securities Exchange as one of Australia’s ‘Top-50’ listed companies (CCL Annual Report 2013). CCL’s product portfolio consists of: World leading brands, Coca-Cola, Diet Coke, Coke Zero,
Fanta, Sprite, Powerade, Glacéau and Pump, as well as other trademark beverages of The Coca-Cola Company. Beverage brands owned, manufactured and distributed by CCL
including Mount Franklin, Deep Spring and Kirks The premium spirits portfolio of Beam Global Spirits & Wines
including Jim Beam, Canadian Club, Makers Mark and The Famous Grouse (CCL Annual Report 2013).
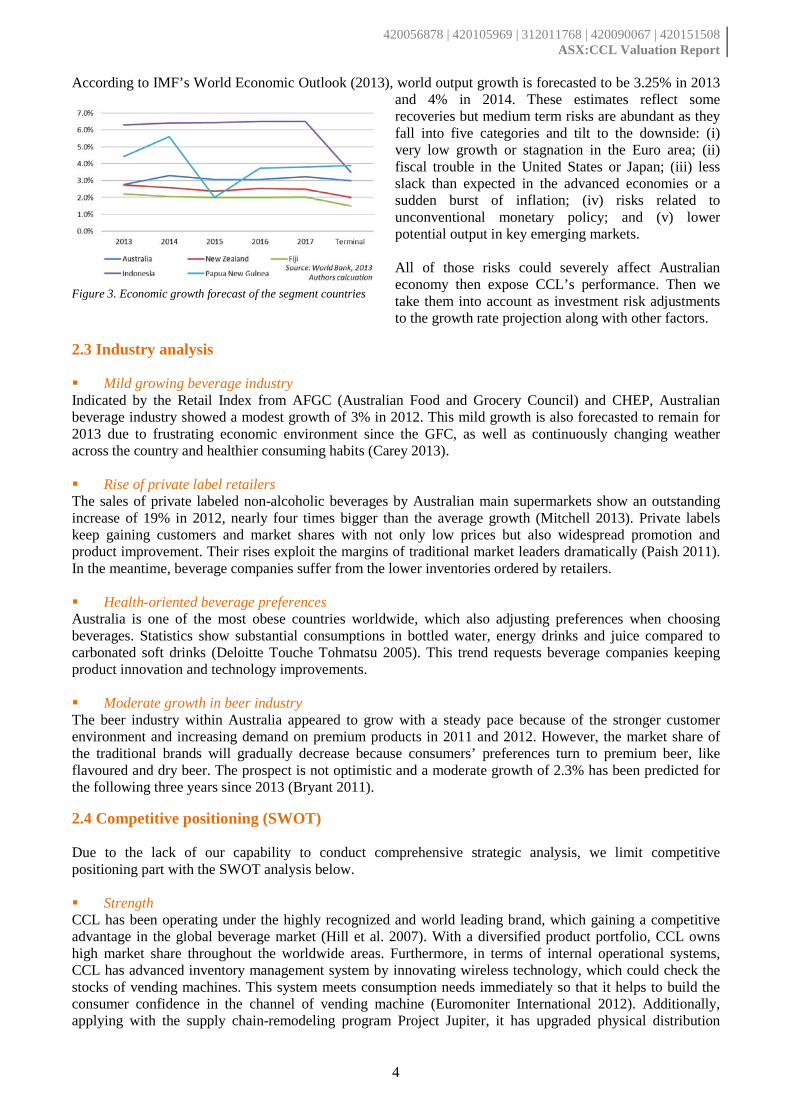
2.2 Macroeconomic environment Although CCL operates in five countries, in this analyse we focus on Australian economy as well as global
economic prospects. The reason is that more than 70 per cent of CCL’s trading revenue is generated in Australia and most of its financial activities are based in Australia. However, in forecasting the growth rate of CCL, we consider both historical and forecasting GDP and population growth rates of all relevant countries as they are estimated by international sources. Despite some difficulties in global economy, the Australian economy has been keeping its long term pace. Though there are some signs of slowness in growth from 2013 to 2014 as the RBA sees, it is considered one of very few advanced economies, which have recovered and expanded well since the GFC. Therefore, by cutting the policy interest rate to notably law level 2.75%, RBA eases its monetary policy in order to stimulate the economy. The main causes of slowness are essentially some cool-
downs in economy of China, which is the biggest trade partner of Australia, and consumption spending decrease (RBA 2013). This strategy implies that central bank is confident around the inflation outlook and that confidence has been justified by a weakening labour market and moderate wage pressures along with deflationary pressures in the domestic goods and services markets (Westpac 2013). Moreover, RBA assumes the exchange rate of Australian dollar to remain at its current level in the short term. Relying on aforementioned sources, we think that economic growth of Australia could be somewhat lower than previously set expectation in 2013 but it will remain the long-term trend as forecasted. Also, we believe that there will not be significant changes in inflation and exchange rates as well as tax regime in Australia. However, we still need to consider the unstable situations in global economy when predicting the future economic environment for the CCL –an internationally operating corporation.
Figure 1 . Product types revenue share, CCL 2012
Figure 2. Geographic segments of trading revenue, CCL 2012
420056878 | 420105969 | 312011768 | 420090067 | 420151508 ASX:CCL Valuation Report
4
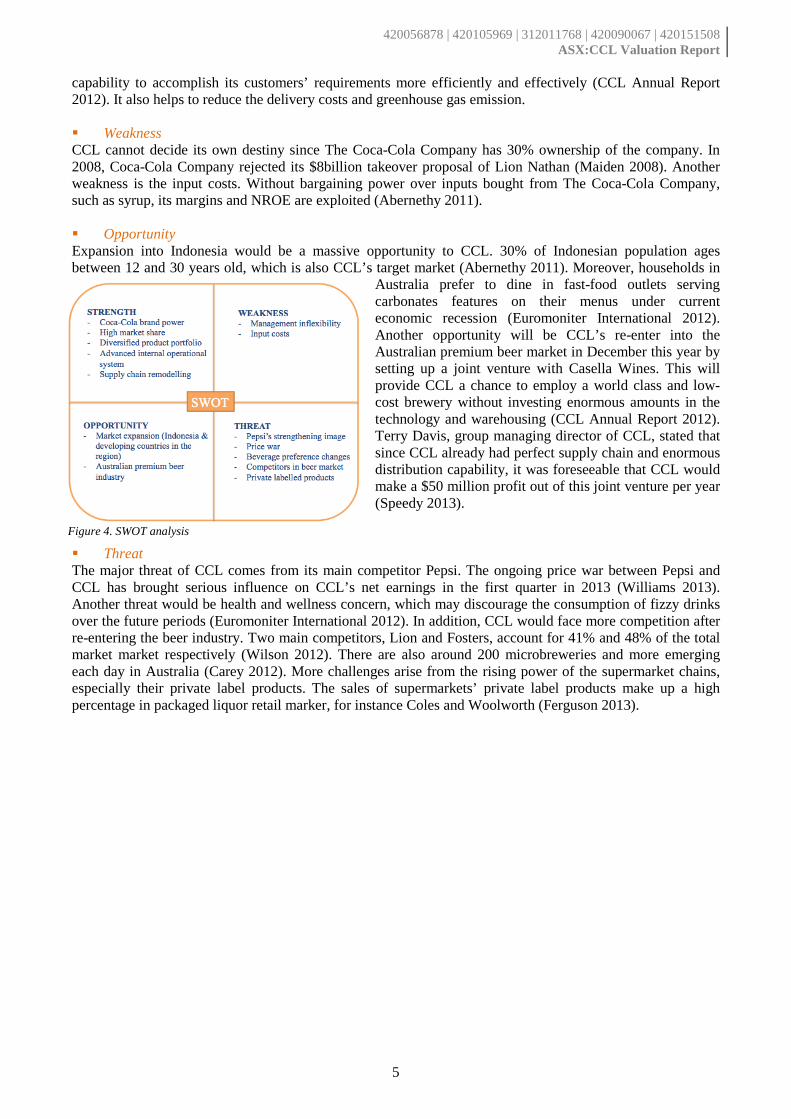
According to IMF’s World Economic Outlook (2013), world output growth is forecasted to be 3.25% in 2013 and 4% in 2014. These estimates reflect some recoveries but medium term risks are abundant as they fall into five categories and tilt to the downside: (i) very low growth or stagnation in the Euro area; (ii) fiscal trouble in the United States or Japan; (iii) less slack than expected in the advanced economies or a sudden burst of inflation; (iv) risks related to unconventional monetary policy; and (v) lower potential output in key emerging markets. All of those risks could severely affect Australian economy then expose CCL’s performance. Then we take them into account as investment risk adjustments to the growth rate projection along with other factors.
2.3 Industry analysis Mild growing beverage industry Indicated by the Retail Index from AFGC (Australian Food and Grocery Council) and CHEP, Australian beverage industry showed a modest growth of 3% in 2012. This mild growth is also forecasted to remain for 2013 due to frustrating economic environment since the GFC, as well as continuously changing weather across the country and healthier consuming habits (Carey 2013). Rise of private label retailers The sales of private labeled non-alcoholic beverages by Australian main supermarkets show an outstanding increase of 19% in 2012, nearly four times bigger than the average growth (Mitchell 2013). Private labels keep gaining customers and market shares with not only low prices but also widespread promotion and product improvement. Their rises exploit the margins of traditional market leaders dramatically (Paish 2011). In the meantime, beverage companies suffer from the lower inventories ordered by retailers. Health-oriented beverage preferences Australia is one of the most obese countries worldwide, which also adjusting preferences when choosing beverages. Statistics show substantial consumptions in bottled water, energy drinks and juice compared to carbonated soft drinks (Deloitte Touche Tohmatsu 2005). This trend requests beverage companies keeping product innovation and technology improvements. Moderate growth in beer industry The beer industry within Australia appeared to grow with a steady pace because of the stronger customer environment and increasing demand on premium products in 2011 and 2012. However, the market share of the traditional brands will gradually decrease because consumers’ preferences turn to premium beer, like flavoured and dry beer. The prospect is not optimistic and a moderate growth of 2.3% has been predicted for the following three years since 2013 (Bryant 2011).
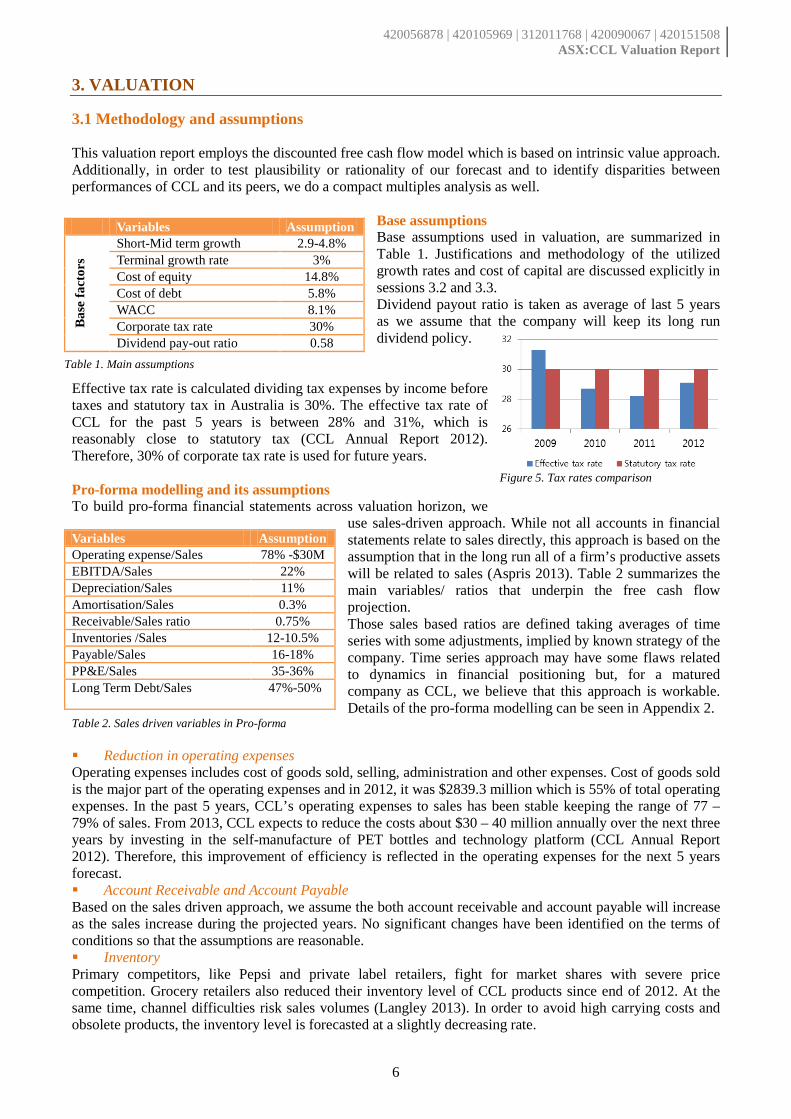
2.4 Competitive positioning (SWOT) Due to the lack of our capability to conduct comprehensive strategic analysis, we limit competitive positioning part with the SWOT analysis below. Strength CCL has been operating under the highly recognized and world leading brand, which gaining a competitive advantage in the global beverage market (Hill et al. 2007). With a diversified product portfolio, CCL owns high market share throughout the worldwide areas. Furthermore, in terms of internal operational systems, CCL has advanced inventory management system by innovating wireless technology, which could check the stocks of vending machines. This system meets consumption needs immediately so that it helps to build the consumer confidence in the channel of vending machine (Euromoniter International 2012). Additionally, applying with the supply chain-remodeling program Project Jupiter, it has upgraded physical distribution
Figure 3. Economic growth forecast of the segment countries
420056878 | 420105969 | 312011768 | 420090067 | 420151508 ASX:CCL Valuation Report
5
capability to accomplish its customers’ requirements more efficiently and effectively (CCL Annual Report 2012). It also helps to reduce the delivery costs and greenhouse gas emission. Weakness CCL cannot decide its own destiny since The Coca-Cola Company has 30% ownership of the company. In 2008, Coca-Cola Company rejected its $8billion takeover proposal of Lion Nathan (Maiden 2008). Another weakness is the input costs. Without bargaining power over inputs bought from The Coca-Cola Company, such as syrup, its margins and NROE are exploited (Abernethy 2011). Opportunity Expansion into Indonesia would be a massive opportunity to CCL. 30% of Indonesian population ages between 12 and 30 years old, which is also CCL’s target market (Abernethy 2011). Moreover, households in
Australia prefer to dine in fast-food outlets serving carbonates features on their menus under current economic recession (Euromoniter International 2012). Another opportunity will be CCL’s re-enter into the Australian premium beer market in December this year by setting up a joint venture with Casella Wines. This will provide CCL a chance to employ a world class and low-cost brewery without investing enormous amounts in the technology and warehousing (CCL Annual Report 2012). Terry Davis, group managing director of CCL, stated that since CCL already had perfect supply chain and enormous distribution capability, it was foreseeable that CCL would make a $50 million profit out of this joint venture per year (Speedy 2013).
Threat The major threat of CCL comes from its main competitor Pepsi. The ongoing price war between Pepsi and CCL has brought serious influence on CCL’s net earnings in the first quarter in 2013 (Williams 2013). Another threat would be health and wellness concern, which may discourage the consumption of fizzy drinks over the future periods (Euromoniter International 2012). In addition, CCL would face more competition after re-entering the beer industry. Two main competitors, Lion and Fosters, account for 41% and 48% of the total market market respectively (Wilson 2012). There are also around 200 microbreweries and more emerging each day in Australia (Carey 2012). More challenges arise from the rising power of the supermarket chains, especially their private label products. The sales of supermarkets’ private label products make up a high percentage in packaged liquor retail marker, for instance Coles and Woolworth (Ferguson 2013).
Figure 4. SWOT analysis
420056878 | 420105969 | 312011768 | 420090067 | 420151508 ASX:CCL Valuation Report
6
3. VALUATION
3.1 Methodology and assumptions This valuation report employs the discounted free cash flow model which is based on intrinsic value approach. Additionally, in order to test plausibility or rationality of our forecast and to identify disparities between performances of CCL and its peers, we do a compact multiples analysis as well.
Base assumptions Base assumptions used in valuation, are summarized in Table 1. Justifications and methodology of the utilized growth rates and cost of capital are discussed explicitly in sessions 3.2 and 3.3. Dividend payout ratio is taken as average of last 5 years as we assume that the company will keep its long run dividend policy.
Effective tax rate is calculated dividing tax expenses by income before taxes and statutory tax in Australia is 30%. The effective tax rate of CCL for the past 5 years is between 28% and 31%, which is reasonably close to statutory tax (CCL Annual Report 2012). Therefore, 30% of corporate tax rate is used for future years. Pro-forma modelling and its assumptions To build pro-forma financial statements across valuation horizon, we
use sales-driven approach. While not all accounts in financial statements relate to sales directly, this approach is based on the assumption that in the long run all of a firm’s productive assets will be related to sales (Aspris 2013). Table 2 summarizes the main variables/ ratios that underpin the free cash flow projection. Those sales based ratios are defined taking averages of time series with some adjustments, implied by known strategy of the company. Time series approach may have some flaws related to dynamics in financial positioning but, for a matured company as CCL, we believe that this approach is workable. Details of the pro-forma modelling can be seen in Appendix 2.
Table 2. Sales driven variables in Pro-forma Reduction in operating expenses Operating expenses includes cost of goods sold, selling, administration and other expenses. Cost of goods sold is the major part of the operating expenses and in 2012, it was $2839.3 million which is 55% of total operating expenses. In the past 5 years, CCL’s operating expenses to sales has been stable keeping the range of 77 – 79% of sales. From 2013, CCL expects to reduce the costs about $30 – 40 million annually over the next three years by investing in the self-manufacture of PET bottles and technology platform (CCL Annual Report 2012). Therefore, this improvement of efficiency is reflected in the operating expenses for the next 5 years forecast. Account Receivable and Account Payable Based on the sales driven approach, we assume the both account receivable and account payable will increase as the sales increase during the projected years. No significant changes have been identified on the terms of conditions so that the assumptions are reasonable. Inventory Primary competitors, like Pepsi and private label retailers, fight for market shares with severe price competition. Grocery retailers also reduced their inventory level of CCL products since end of 2012. At the same time, channel difficulties risk sales volumes (Langley 2013). In order to avoid high carrying costs and obsolete products, the inventory level is forecasted at a slightly decreasing rate.
Variables Assumption
Bas
e fa
ctor
s
Short-Mid term growth 2.9-4.8% Terminal growth rate 3% Cost of equity 14.8% Cost of debt 5.8% WACC 8.1% Corporate tax rate 30% Dividend pay-out ratio 0.58
Table 1. Main assumptions
Variables Assumption Operating expense/Sales 78% -$30M EBITDA/Sales 22% Depreciation/Sales 11% Amortisation/Sales 0.3% Receivable/Sales ratio 0.75% Inventories /Sales 12-10.5% Payable/Sales 16-18% PP&E/Sales 35-36% Long Term Debt/Sales 47%-50%
Figure 5. Tax rates comparison
420056878 | 420105969 | 312011768 | 420090067 | 420151508 ASX:CCL Valuation Report
7
PPE From the previous period from 2008 to 2012, it showed a continuous increasing trend on the capital expenditure on PPE, ending up with a peak point on 2012. It is convinced that the ratios of the historical PPE/sales can be used to predict for the future period. Due to the expansion into Indonesia markets, 36% is predicted for 2013-2015. Since then, this ratio will decline slightly to 35%. Long Term Debt At the end of 2012, CCL had a total $2787.2 debt, of which 75.3% will mature within 2013-2017. According to CCL Annual Report (2012), debt of 2013 and 2014 has been fully funded. Assuming CCL will finance the debt one year ahead, a higher L/T Debt over Sales ratio has been forecasted for 2014-2016.
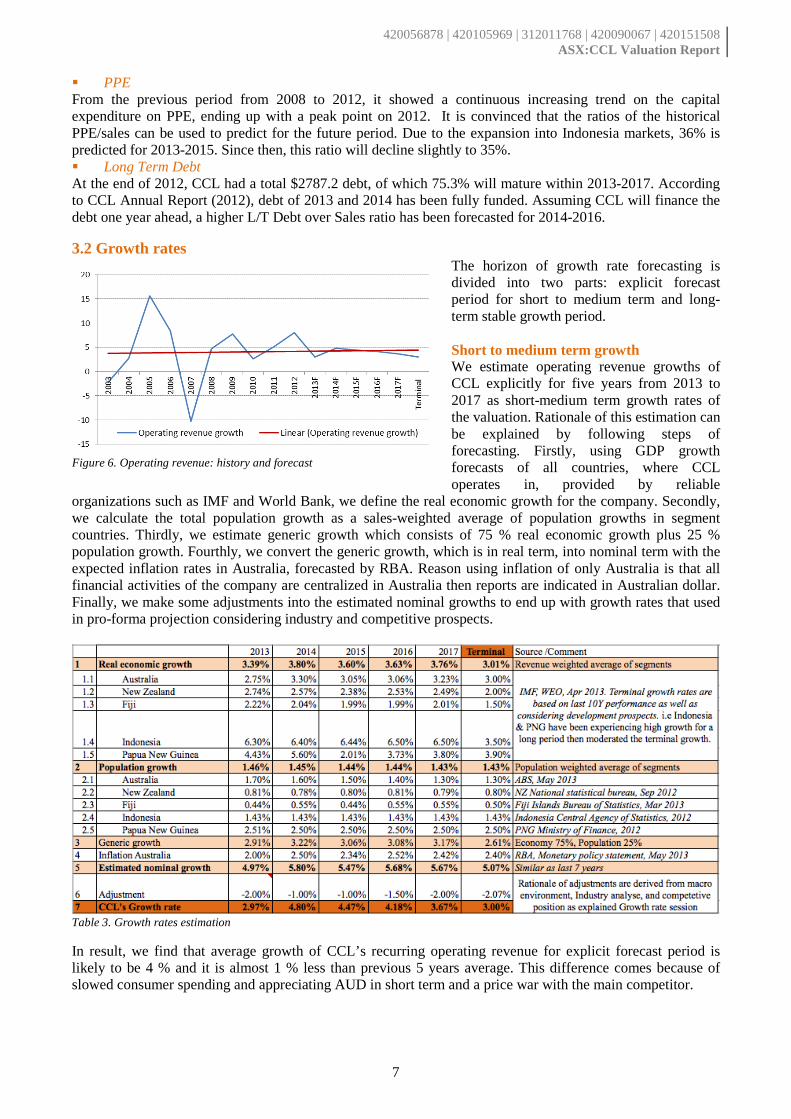
3.2 Growth rates The horizon of growth rate forecasting is divided into two parts: explicit forecast period for short to medium term and long-term stable growth period. Short to medium term growth We estimate operating revenue growths of CCL explicitly for five years from 2013 to 2017 as short-medium term growth rates of the valuation. Rationale of this estimation can be explained by following steps of forecasting. Firstly, using GDP growth forecasts of all countries, where CCL operates in, provided by reliable
organizations such as IMF and World Bank, we define the real economic growth for the company. Secondly, we calculate the total population growth as a sales-weighted average of population growths in segment countries. Thirdly, we estimate generic growth which consists of 75 % real economic growth plus 25 % population growth. Fourthly, we convert the generic growth, which is in real term, into nominal term with the expected inflation rates in Australia, forecasted by RBA. Reason using inflation of only Australia is that all financial activities of the company are centralized in Australia then reports are indicated in Australian dollar. Finally, we make some adjustments into the estimated nominal growths to end up with growth rates that used in pro-forma projection considering industry and competitive prospects.
Table 3. Growth rates estimation
In result, we find that average growth of CCL’s recurring operating revenue for explicit forecast period is likely to be 4 % and it is almost 1 % less than previous 5 years average. This difference comes because of slowed consumer spending and appreciating AUD in short term and a price war with the main competitor.
Figure 6. Operating revenue: history and forecast
420056878 | 420105969 | 312011768 | 420090067 | 420151508 ASX:CCL Valuation Report
8
However, 4 % is still a high growth rate for such a matured business and the main drivers of this growth would be emerging expansion in Indonesia and strengthening of the Coke Zero brand (CCL Annual Report 2012). Terminal growth Estimation of terminal growth rate generally follows the method which is used in explicit forecasting. But the difference is that in defining its components, which are economic growth, population growth and inflation, we used 10 years historical data instead of using forecasts. And, as we assume, the long term growth is to be stabilized around 3 % which is little bit less than last 10 years average. This drop might be caused by deviation in consumer choice towards healthy foods and drinks as well as market maturity in Indonesia. Market growth analysis Australia & New Zealand 3.3% of growth in volume and EBIT has been witnessed in Australian market although bad weather condition, weaker consumer spending and aggressive competition hampered the growth. Developing the technology provided the cost savings of production and further accessibility to customers. As a result, CCL maintained the EBIT margin above 20% and the market share of sparkling beverages has increased. In addition, innovation on new product and expanding product line allows CCL stay in the competitive position in the market. Unlike other countries, CCL in New Zealand showed the disappointing result as poor weather condition and slowed down consumer spending constrained to make health earnings and volumes. CCL in New Zealand has launched the new product line and expand their portfolio but only energy category continued to grow in the market (CCL Annual Report 2012). Indonesia Indonesian commercial beverage market is growing fast reaching increment of 10.3% in volume and 16.8% in EBIT. CCL expects to grow 10 -15% in volume and more than 15% growth in EBIT as they enter into new categories (fast-growing tea and juice categories) and expands the product line (Burn energy drink, Minute maid pulpy lemon). Furthermore, improvement on manufacturing and capacity, and investing in people capability will also contribute to the strong performance in Indonesia. However, electricity shortage, road system and logistics issues are challenging CCL when developing market infrastructure (2012 Eastern creek & Northemad investor day – Indonesia & PNG 2012). Fiji, Papua New Guinea (PNG), and the Pacific Islands Earnings in Fiji experienced a drop of 3.1% in the first half of FY12 because of the two major floods, cyclones and the adversely impact brought by lower tourist numbers to the local economy. Because of a successful installation of new juice line Minute Maid Pulpy in July, improvements in both volumes and earnings have been observed, and thus CCL gains back 40% share of the local juice market in the late FY12 (Financial Results 2012). CCL continues generating stable profit growth of 16.8% in the PNG market with the new Port Moresby line, which has been doubling PET bottle production capacity and further decreasing dependence on the production facility in Lae. Additionally, the strong volume growth of 10.3% in PNG enables CCL gaining another source of solid earnings through increasing promotions and new cold drink cooler placements. To further strengthening the growth of its alcoholic beverage businesses in the Pacific market, CCL has: (i) confirmed the acquisition of the Foster’s brewery and distillery in Fiji; and (ii) completed the distribution of its premium beer line for Grupo Modelo, Carlsberg and Molson Coors in Fiji, PNG and the Pacific Islands.
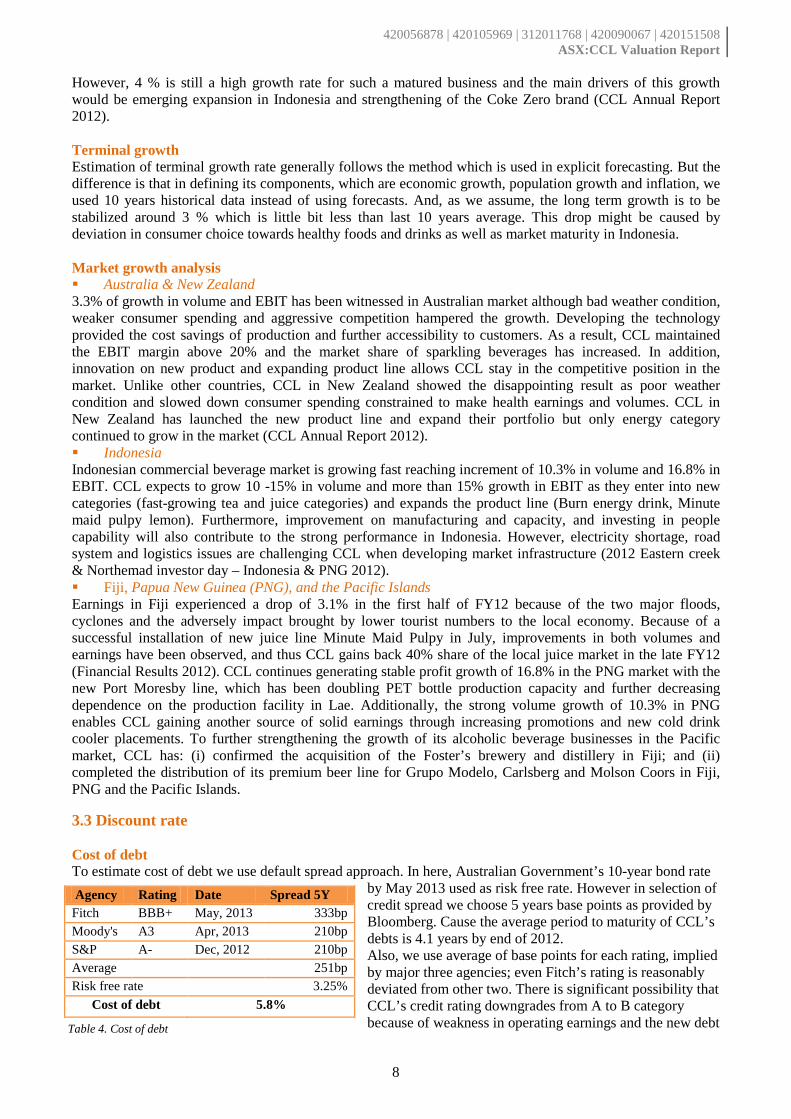
3.3 Discount rate Cost of debt To estimate cost of debt we use default spread approach. In here, Australian Government’s 10-year bond rate
by May 2013 used as risk free rate. However in selection of credit spread we choose 5 years base points as provided by Bloomberg. Cause the average period to maturity of CCL’s debts is 4.1 years by end of 2012. Also, we use average of base points for each rating, implied by major three agencies; even Fitch’s rating is reasonably deviated from other two. There is significant possibility that CCL’s credit rating downgrades from A to B category because of weakness in operating earnings and the new debt
Agency Rating Date Spread 5Y Fitch BBB+ May, 2013 333bp Moody's A3 Apr, 2013 210bp S&P A- Dec, 2012 210bp Average 251bp Risk free rate 3.25%
Cost of debt 5.8%
Table 4. Cost of debt
420056878 | 420105969 | 312011768 | 420090067 | 420151508 ASX:CCL Valuation Report
9
issuance programs which amount up to AU$2 billion and US$2 billion (Moody’s 2013). Cost of equity Cost of equity is calculated with CAPM model. Since no matter what approach is employed the valuation is
subjective to researcher’s expectation, it is better rely on this broadly used model. We have wondered that long series of historical data would not be good enough to reflect the risk profile of the company at current capital structure. Hence, we run recent 5 years monthly data based regression initially. In result of that, we found Beta for CCL equals to 0.23. Re-levering this to target D/E ratio, used in pro-forma projection, we end up with 0.24, which is still abnormally low. The quality of regression is
statistically significant at 10% confidence level. And result is equal to Thomson Reuter’s latest estimation (Appendix 1). It is reasonable that this suspiciously low beta can be the reality because of extremely volatile and weak performance of the ASX All Ordinaries index as market benchmark in recent years in comparison with CCL’s mature performance. However, in CAPM calculation we use 0.31 –the beta which comes from re-levering 10 years regression result (0.29) instead of 5 years. Because we assume that relative volatility of CCL will increase as market stabilizes. Therefore, we balance between some degree of accuracy in capital structure (5 years data) and a forward-looking rationality of the beta (10 years data). Moreover, it is likely that CCL's new debt issuance program and weakened earning might affect its risk magnitude. Using 10 years data, we achieve even more confident statistical significance in regression. For market premium, we use average of only positive historical data to avoid negative premium linked to weak market performance. Risk free rate is represented by Australian Government’s 10Y bond. WACC Here we assume that 37.8 % equity and 62.2 % debt weights will remain in CCL’s capital structure. This is a structure that has bit more debt weight than present, following an announced leveraging policy by the company.
WACC=0.378×14.8%+0.622×5.8% ×(1-0.3) =8.1%
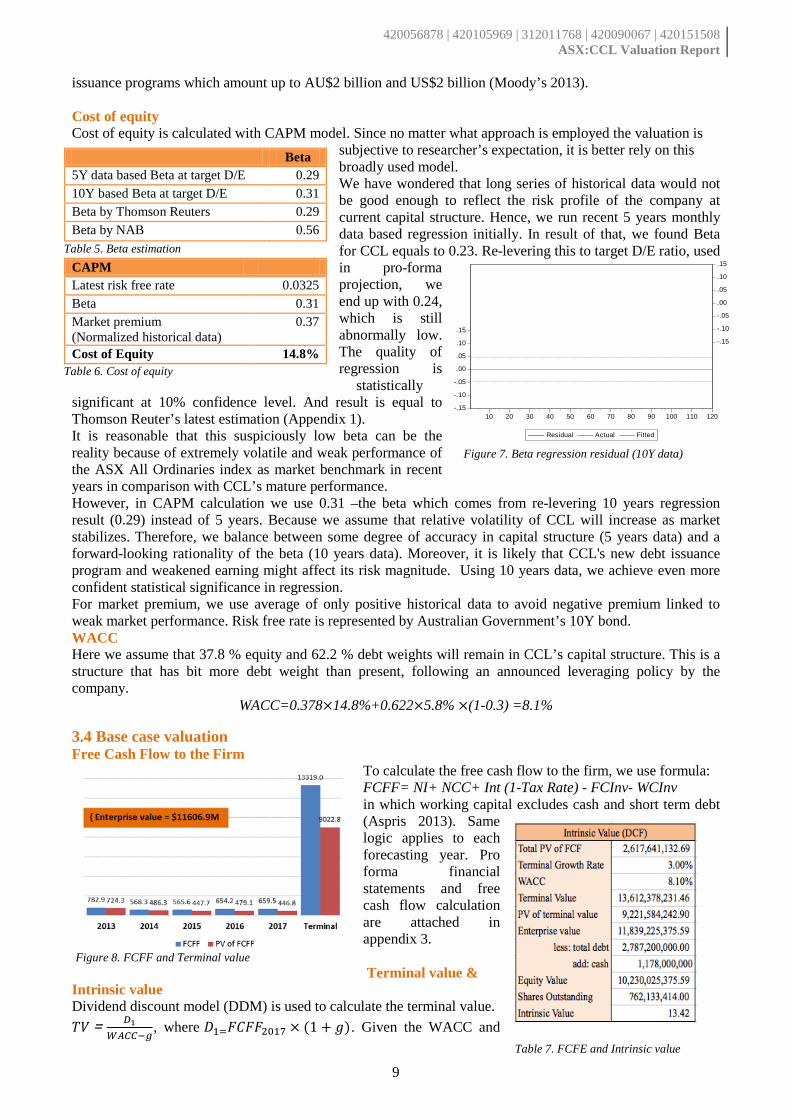
3.4 Base case valuation Free Cash Flow to the Firm
To calculate the free cash flow to the firm, we use formula: FCFF= NI+ NCC+ Int (1-Tax Rate) - FCInv- WCInv in which working capital excludes cash and short term debt (Aspris 2013). Same logic applies to each forecasting year. Pro forma financial statements and free cash flow calculation are attached in appendix 3. Terminal value &
Intrinsic value Dividend discount model (DDM) is used to calculate the terminal value. 𝑇𝑉= 𝐷1
𝑊𝐴𝐶𝐶−𝑔, where 𝐷1=𝐹𝐶𝐹𝐹2017 × (1 + 𝑔). Given the WACC and
Beta 5Y data based Beta at target D/E 0.29 10Y based Beta at target D/E 0.31 Beta by Thomson Reuters 0.29 Beta by NAB 0.56
Table 5. Beta estimation CAPM Latest risk free rate 0.0325 Beta 0.31 Market premium (Normalized historical data)
0.37
Cost of Equity 14.8% Table 6. Cost of equity
-.15
-.10
-.05
.00
.05
.10
.15
-.15
-.10
-.05
.00
.05
.10
.15
10 20 30 40 50 60 70 80 90 100 110 120
Residual Actual Fitted
Figure 7. Beta regression residual (10Y data)
Figure 8. FCFF and Terminal value
Table 7. FCFE and Intrinsic value
420056878 | 420105969 | 312011768 | 420090067 | 420151508 ASX:CCL Valuation Report
10
terminal growth rate in Section 3.2 & 3.3, we discount FCFF and terminal value to the beginning of 2013 to get the enterprise value. After adjustments of debt and cash in 2012, equity value is calculated as $10,230,025,375.59. Then dividing this equity value by outstanding shares, we obtain the intrinsic value at $13.42.
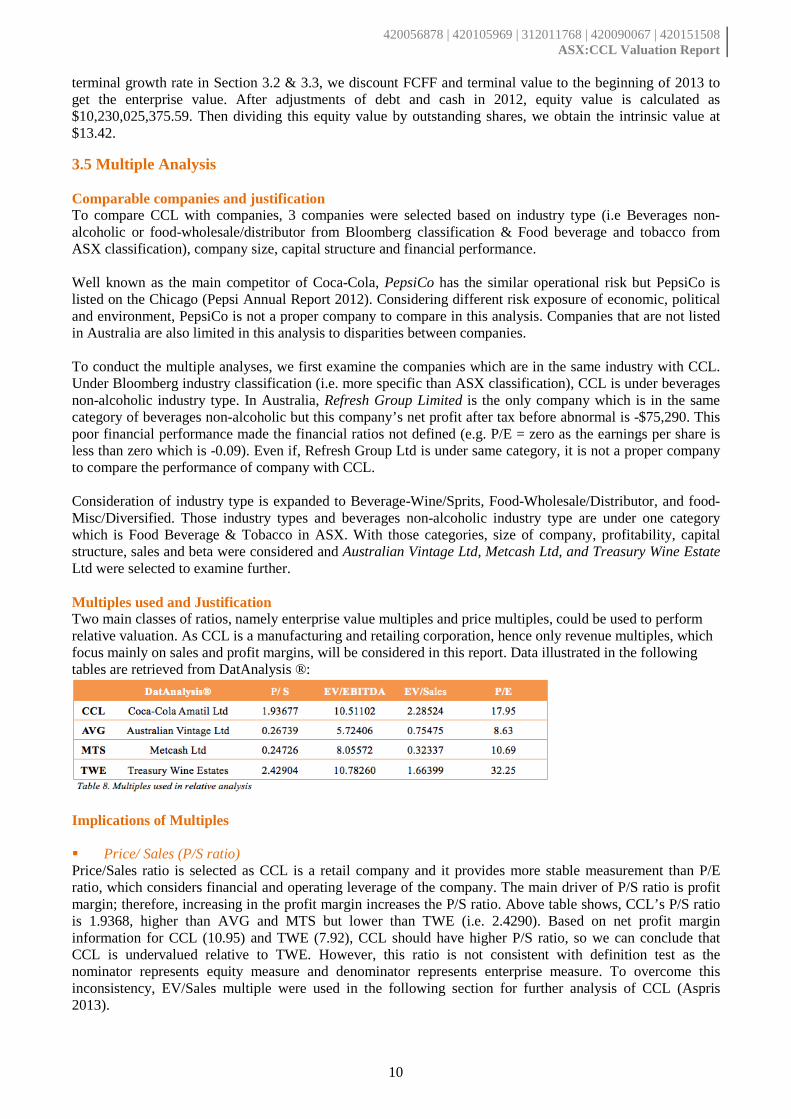
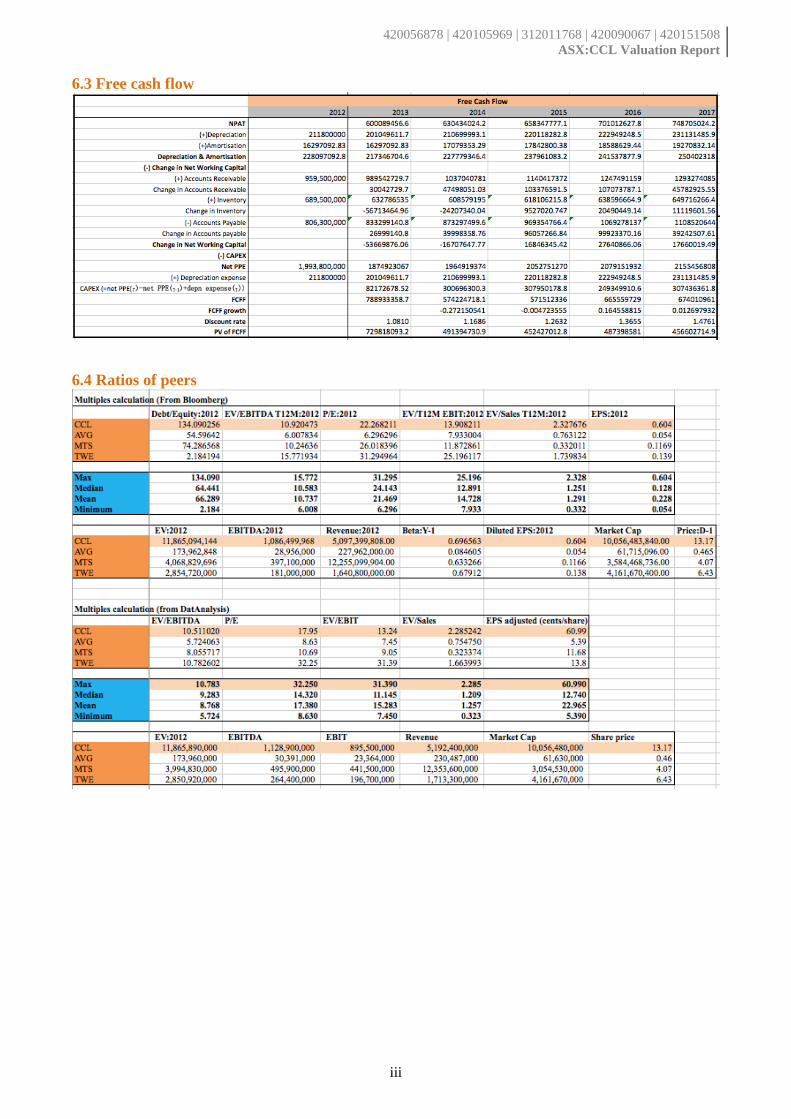
3.5 Multiple Analysis Comparable companies and justification To compare CCL with companies, 3 companies were selected based on industry type (i.e Beverages non-alcoholic or food-wholesale/distributor from Bloomberg classification & Food beverage and tobacco from ASX classification), company size, capital structure and financial performance. Well known as the main competitor of Coca-Cola, PepsiCo has the similar operational risk but PepsiCo is listed on the Chicago (Pepsi Annual Report 2012). Considering different risk exposure of economic, political and environment, PepsiCo is not a proper company to compare in this analysis. Companies that are not listed in Australia are also limited in this analysis to disparities between companies. To conduct the multiple analyses, we first examine the companies which are in the same industry with CCL. Under Bloomberg industry classification (i.e. more specific than ASX classification), CCL is under beverages non-alcoholic industry type. In Australia, Refresh Group Limited is the only company which is in the same category of beverages non-alcoholic but this company’s net profit after tax before abnormal is -$75,290. This poor financial performance made the financial ratios not defined (e.g. P/E = zero as the earnings per share is less than zero which is -0.09). Even if, Refresh Group Ltd is under same category, it is not a proper company to compare the performance of company with CCL. Consideration of industry type is expanded to Beverage-Wine/Sprits, Food-Wholesale/Distributor, and food-Misc/Diversified. Those industry types and beverages non-alcoholic industry type are under one category which is Food Beverage & Tobacco in ASX. With those categories, size of company, profitability, capital structure, sales and beta were considered and Australian Vintage Ltd, Metcash Ltd, and Treasury Wine Estate Ltd were selected to examine further. Multiples used and Justification Two main classes of ratios, namely enterprise value multiples and price multiples, could be used to perform relative valuation. As CCL is a manufacturing and retailing corporation, hence only revenue multiples, which focus mainly on sales and profit margins, will be considered in this report. Data illustrated in the following tables are retrieved from DatAnalysis ®:
Implications of Multiples Price/ Sales (P/S ratio) Price/Sales ratio is selected as CCL is a retail company and it provides more stable measurement than P/E ratio, which considers financial and operating leverage of the company. The main driver of P/S ratio is profit margin; therefore, increasing in the profit margin increases the P/S ratio. Above table shows, CCL’s P/S ratio is 1.9368, higher than AVG and MTS but lower than TWE (i.e. 2.4290). Based on net profit margin information for CCL (10.95) and TWE (7.92), CCL should have higher P/S ratio, so we can conclude that CCL is undervalued relative to TWE. However, this ratio is not consistent with definition test as the nominator represents equity measure and denominator represents enterprise measure. To overcome this inconsistency, EV/Sales multiple were used in the following section for further analysis of CCL (Aspris 2013).
420056878 | 420105969 | 312011768 | 420090067 | 420151508 ASX:CCL Valuation Report
11
EV/EBITDA CCL is comparatively fairly valued in terms of EV/EBITDA. Since operating profit is one of the main drivers in affecting CCL’s value, and EV/EBITDA does not account for companies’ different capital structures, hence these factors will make EV/EBITDA a better multiple for CCL (Aspris 2013, ReadyRatios 2013). This multiple indicates that how much an investor should pay for every dollar of a company’s earnings compared to its peers. A lower EV/EBITDA shows that the investment on a company’s share would be cheaper (YCharts 2013). As EV/EBITDA normally is within the range of 6.0x to 18.0x, hence CCL’s value of 10.51102x indicates that it is fairly valued in terms of annual cash flow, especially comparing to AVG (Morningstar 2013, Macabacus, LLC. 2013). However, several factors may create noises to this comparison:
(i) Companies having a higher growth might have very low current earnings and yet a huge upside, i.e. a higher potential dollar by which its shares could rise in future, and thus it will be traded at a higher EV/EBITDA.
(ii) EBITDA will overestimate cash flow from operating (CFO) if working capital continues to grow.
(iii) Free cash flow to firm (FCFF) has a stronger relationship to a corporate valuation than EBITDA does (Aspris 2013).
EV/Sales CCL is comparatively overvalued in terms of EV/Sales. As this multiple is a pre-interest measure of profitability, i.e. operating profit margin, therefore it is suitable for valuing CCL as a revenue-oriented company (Aspris 2013). In general, a lower value of EV/Sales indicates that it is relatively cheaper for investors to pay for revenues generated by a company (YCharts 2013). Yet, such ratio could be slightly misleading, as higher EV/Sales could also signal that investors expect for a huge increase in the future sales, while a lower EV/Sales might indicate that potential revenues in the coming years are not quite attractive (Macabacus, LLC. 2013). As EV/Sales normally is within the range of 1.00x to 3.00x, therefore CCL (2.28524x) can be still considered as performing well in terms of this ratio (Morningstar 2013, Macabacus, LLC. 2013).
4. RISK ANALYSIS
4.1 Possible risks CCL may encounter the following possible risks in operations, which would impair future earnings and then diminish share value. Severe price war and low profit margins Market losing to existing and potential competitors (PepsiCo and private label retailers) Increasing costs due to unhedged commodity price risks Consumer preferences changes To quantify the risks on enterprise value and share price, sensitivity analysis and scenario analysis are conducted in the next section.
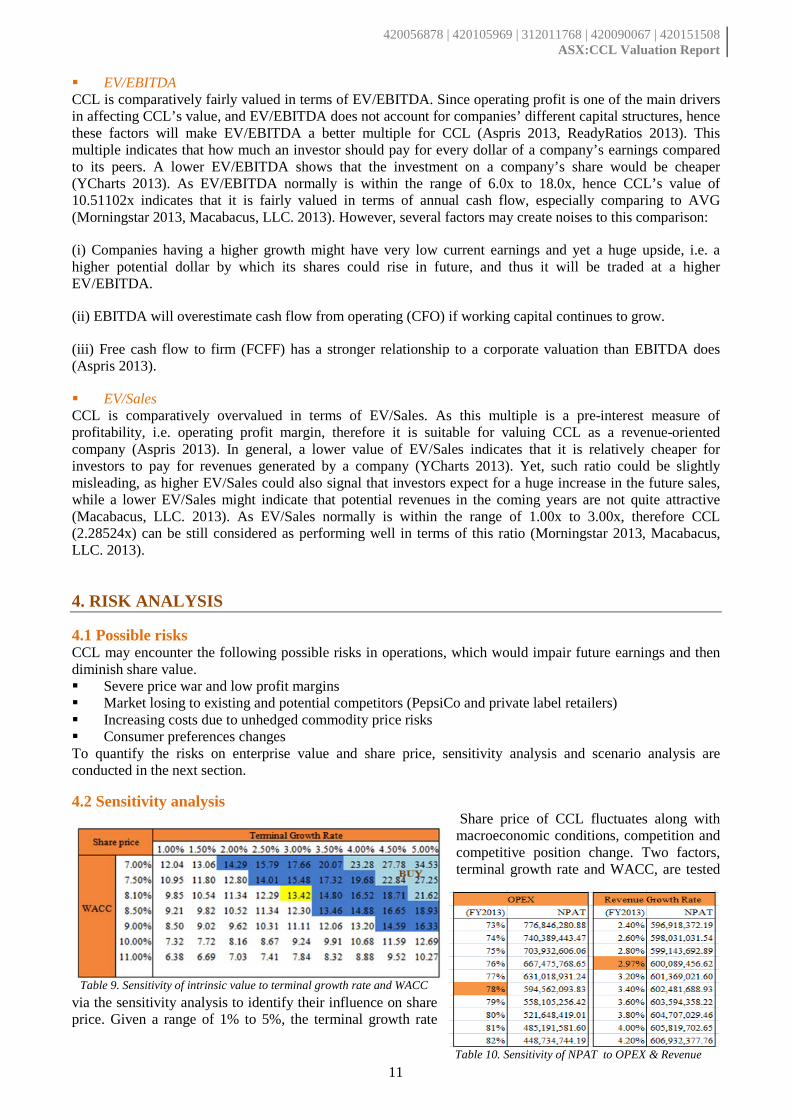
4.2 Sensitivity analysis Share price of CCL fluctuates along with macroeconomic conditions, competition and competitive position change. Two factors, terminal growth rate and WACC, are tested
via the sensitivity analysis to identify their influence on share price. Given a range of 1% to 5%, the terminal growth rate
Table 9. Sensitivity of intrinsic value to terminal growth rate and WACC
Table 10. Sensitivity of NPAT to OPEX & Revenue
420056878 | 420105969 | 312011768 | 420090067 | 420151508 ASX:CCL Valuation Report
12
deviates from its base case (3%) at 0.5% each time. Analogically, WACC is examined varying from 7% to 11%. Under the given assumptions, share price would be in the range of $6.38 to $34.53. Beyond that, share price of CCL is more sensitive to WACC compared to terminal growth rate. As a retail company, revenue growth rate and operating expenses play vital roles in future earnings of CCL. Therefore, we test how the NPAT will be in FY2013 if operating expenses changing from 73% to 82% while revenue growth rate changing from 2.4% to 4.2%. When OPEX increases to 82% of revenues, NPAT drops by 25% significantly. When OPEX decreases by only 5% of current level, NPAT improves by 31%. Similarly, NPAT is enhanced by 1.14% with revenue growth rate at 4.2% and is reduced by 0.53% with revenue growth rate at 2.4%.
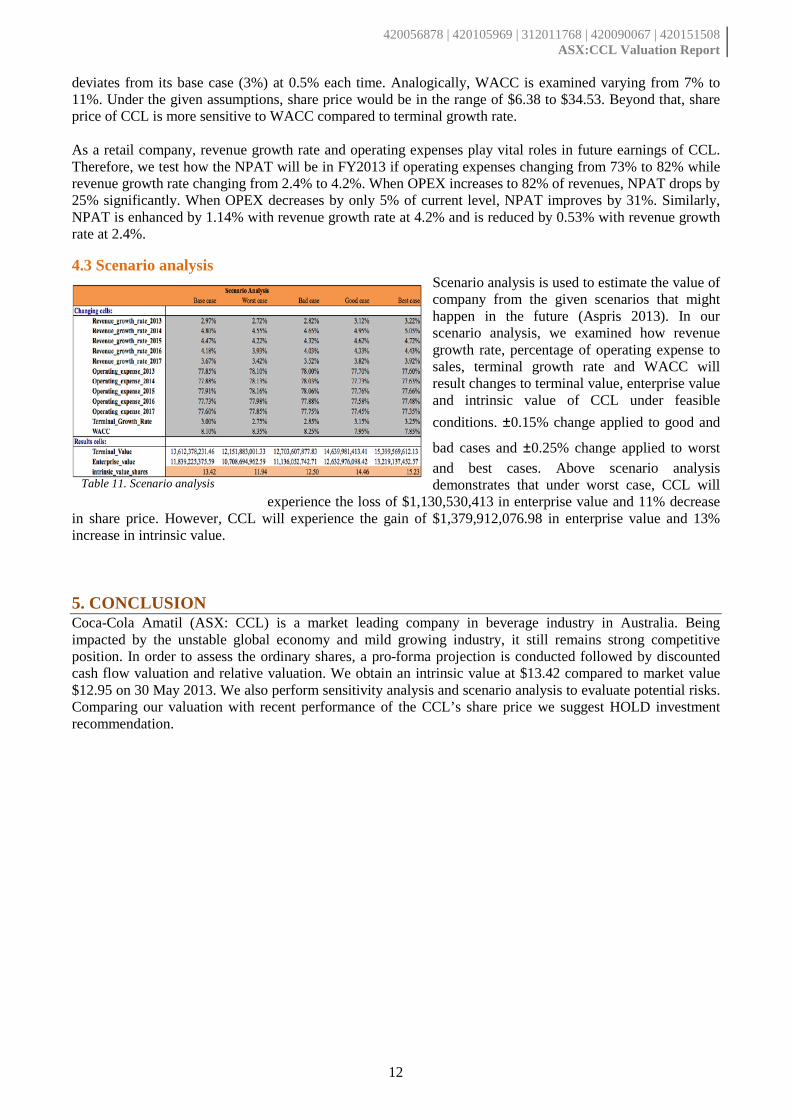
4.3 Scenario analysis Scenario analysis is used to estimate the value of company from the given scenarios that might happen in the future (Aspris 2013). In our scenario analysis, we examined how revenue growth rate, percentage of operating expense to sales, terminal growth rate and WACC will result changes to terminal value, enterprise value and intrinsic value of CCL under feasible conditions. ±0.15% change applied to good and
bad cases and ±0.25% change applied to worst and best cases. Above scenario analysis demonstrates that under worst case, CCL will
experience the loss of $1,130,530,413 in enterprise value and 11% decrease in share price. However, CCL will experience the gain of $1,379,912,076.98 in enterprise value and 13% increase in intrinsic value.
5. CONCLUSION Coca-Cola Amatil (ASX: CCL) is a market leading company in beverage industry in Australia. Being impacted by the unstable global economy and mild growing industry, it still remains strong competitive position. In order to assess the ordinary shares, a pro-forma projection is conducted followed by discounted cash flow valuation and relative valuation. We obtain an intrinsic value at $13.42 compared to market value $12.95 on 30 May 2013. We also perform sensitivity analysis and scenario analysis to evaluate potential risks. Comparing our valuation with recent performance of the CCL’s share price we suggest HOLD investment recommendation.
Table 11. Scenario analysis
i
6. Appendix
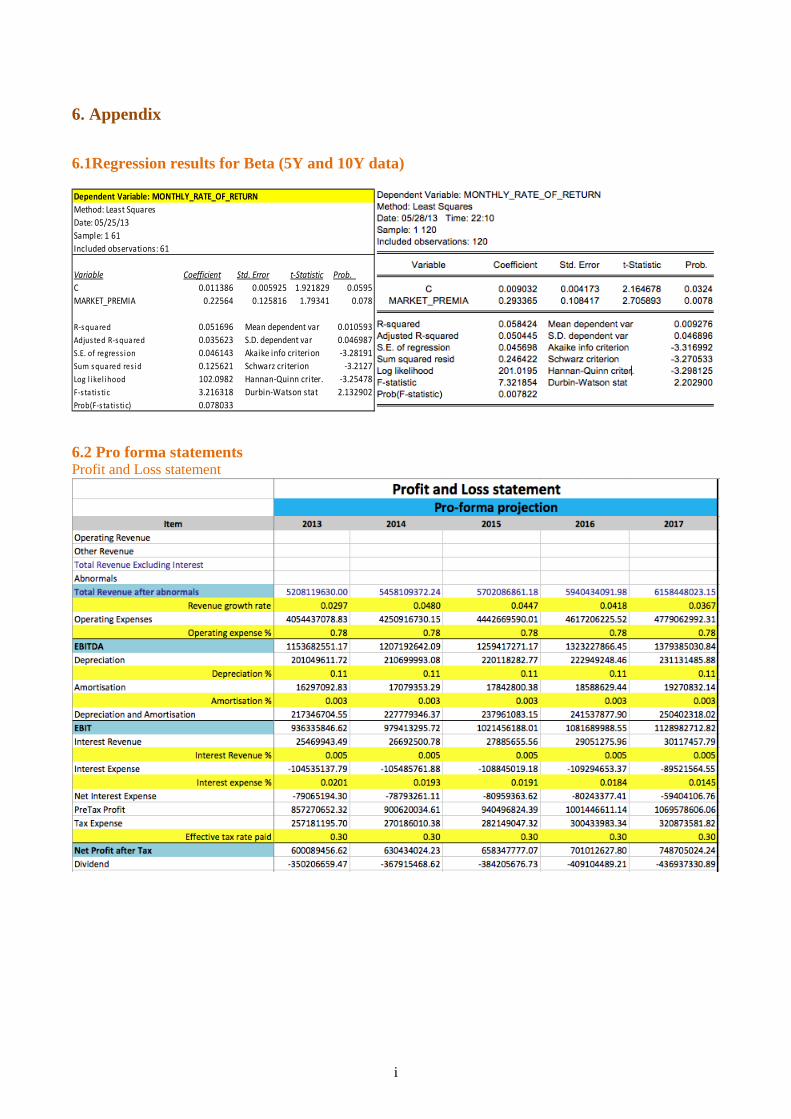
6.1Regression results for Beta (5Y and 10Y data)
6.2 Pro forma statements Profit and Loss statement
Dependent Variable: MONTHLY_RATE_OF_RETURNMethod: Least SquaresDate: 05/25/13 Sample: 1 61Included observations: 61
Variable Coefficient Std. Error t-Statistic Prob. C 0.011386 0.005925 1.921829 0.0595MARKET_PREMIA 0.22564 0.125816 1.79341 0.078
R-squared 0.051696 Mean dependent var 0.010593Adjusted R-squared 0.035623 S.D. dependent var 0.046987S.E. of regress ion 0.046143 Akaike info criterion -3.28191Sum squared res id 0.125621 Schwarz criterion -3.2127Log l ikel ihood 102.0982 Hannan-Quinn criter. -3.25478F-statis tic 3.216318 Durbin-Watson stat 2.132902Prob(F-s tatis tic) 0.078033
420056878 | 420105969 | 312011768 | 420090067 | 420151508 ASX:CCL Valuation Report
ii
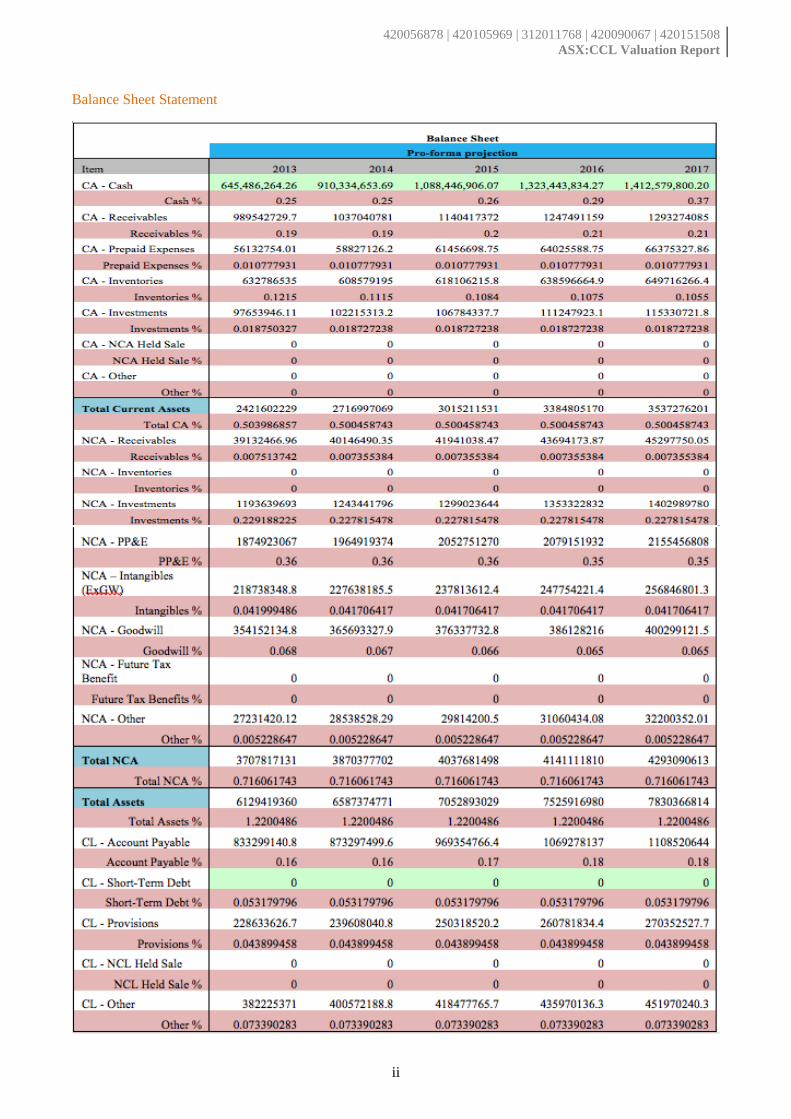
Balance Sheet Statement
420056878 | 420105969 | 312011768 | 420090067 | 420151508 ASX:CCL Valuation Report
iii
6.3 Free cash flow
6.4 Ratios of peers
a
REFERENCES Abernethy, J. 2011, Evaluating Coca-Cola Amatil Limited, Switzer, viewed 14 May 2013, <http://www.switzer.com.au/the-experts/john-abernethy/evaluating-coca-cola-amatil-limited/> Aspris, A. 2013, Corporate Valuation (FINC 6021), The University of Sydney, Sydney, 25 April, viewed 27 May 2013, <https://blackboard.econ.usyd.edu.au> Aspris, A. 2013, Corporate Valuation (FINC 6021), The University of Sydney, Sydney, 23 May, viewed 27 May 2013, <https://blackboard.econ.usyd.edu.au> Bloomberg L.P. 2013, FA, Financial data, viewed 19 May 2013, Bloomberg L.P. Bryant, R. 2011, Brewing up a storm, Smart Company, viewed 29 May 2013, < http://www.smartcompany.com.au/food-and-beverages/20110525-brewing-up-a-storm.html> Carey, K. 2013, ‘AFGC predicts modest growth for food and beverage industry’, Australian Food News, 30 January, viewed 12 May 2013, < http://www.ausfoodnews.com.au/2013/01/30/afgc-predicts-modest-growth-for-food-and-beverage-industry.html > Carey, K. 2012, ‘Big beer moves as market change’, Australian Food News, 18 October, viewed 29 May 2013, < http://www.ausfoodnews.com.au/2012/10/18/big-beer-moves-as-markets-change.html> Coca-Cola Amatil 2012, Annual report 2012, Coca-Cola Amatil, Sydney, viewed 20 May 2013, < http://CCLmatil.com/INVESTORRELATIONS/Pages/AnnualReports.aspx> Coca-Cola Amatil 2013, Company Overview, Coca-Cola Amatil, Sydney, viewed 11 May 2013, < http://CCLmatil.com/AboutCCL/Pages/CompanyOverview.aspx > Coca-Cola Amatil 2012, 2012 Eastern creek & Northemad investor day – Australasia, Coca-Cola Amatil, Sydney, viewed 20 May 2013, < http://CCLmatil.com/InvestorRelations/Pages/Presentations.aspx> Coca-Cola Amatil 2012, 2012 Financial Results, A.B.N 26 004 139 397, Coca-Cola Amatil, Sydney, viewed 21 May 2013, <http://www.asx.com.au/asxpdf/20130219/pdf/42d3bqxm5n98gx.pdf> DatAnalysis Premium 2013, CCL, Financial data, viewed 16 May 2013, Morningstar Inc. Deloitte Touche Tohmatsu 2005, Profitable growth and value creation in the soft drink industry, Deloitte Touche Tohmatsu, viewed 11 May 2013, <http://www.deloitte.com/assets/Dcom-Venezuela/Local%20Assets/Documents/White%20Paper_Soft%20Drinks(2).pdf > Euromoniter International 2012, Carbonates in Australia, Euromoniter International, viewed 15 May 2013, <http://www.euromonitor.com/carbonates-in-australia/report> Ferguson, A. 2013, ‘ Bitter battles in what looks to be an ailing market’, Sydney Morning Herald, 9 February, viewed 29 May 2013, <http://www.smh.com.au/business/bitter-battles-in-what-looks-to-be-an-ailing-market-20130208-2e3wx.html> Hill, L., Jones, R., Galvin, P. and Haidar, A. 2007, Strategic Management: An integrated approach, Wiley, Melbourne. International Monetary Fund 2013, World Economic Outlook, International Monetary Fund, ISBN 978-1-61635-555-5, viewed 21 April 2013, < http://www.imf.org/external/pubs/ft/weo/2013/01/pdf/text.pdf> Khan, S. 2005, Coca Cola Marketing Strategies, Virtual University of Pakistan, viewed 15 May 2013, <http://www.scribd.com/doc/2516371/Strategic-Management>
420056878 | 420105969 | 312011768 | 420090067 | 420151508 ASX:CCL Valuation Report
b
Langley, S. 2013, ‘CCL expects first half decline because of ‘grocery channel difficulty’, Australian Food News, 8 May, viewed 25 May 2013, <http://www.ausfoodnews.com.au/2013/05/08/CCL-expects-first-half-decline-because-of-%E2%80%98grocery-channel-difficulty%E2%80%99.html> Macabacus, LLC. 2013, Valuation Multiples, New York, viewed 15 May 2013, < http://macabacus.com/valuation/multiples> Maiden, M. 2008, ‘As bottler, not brand owner, CCL has a weakness Lion Nathan can exploit, Age Business Day’, 17 November, viewed 15 May 2013, <http://www.theage.com.au/business/as-bottler-not-brand-owner-CCL-has-a-weakness-lion-nathan-can-exploit-20081117-695d.html> Mitchell, S. 2013, ‘Low-cost rivals a factor in Coca-Cola downgrade’, Financial Review, 9 May, viewed 12 May 2013, <http://www.afr.com/p/business/companies/low_cost_rivals_factor_in_coca_cola_tB791145Psk1BpgI7WpoAM> Moody’s Corporation 2013, Moody’s Discourses on Credit Ratings of Coca-Cola Amatil Limited, Moody’s Corporation, viewed 20 April 2013, <http://www.moodys.com/research/Moodys-Disclosures-on-Credit-Ratings-of-Coca-Cola-Amatil-Limited--PR_248406> Morningstar 2013, Financialdownload (CCL), viewed 20 May 2013, Morningstar DatAnalysis. ReadyRatios 2013, EV/EBITDA ratio, viewed 15 May 2013, <http://www.readyratios.com/reference/market/ev_ebitda_ratio.html> ReadyRatios 2013, Price/Sales ratio, viewed 15 May 2013, <http://www.readyratios.com/reference/market/price_sales_ratio.html> Speedy, B. 2013, ‘For Coca-Cola Amatil, things goes better with beer’, Australian, 15 February, viewed 29 May 2013, < http://www.theaustralian.com.au/news/features/for-coca-cola-amatil-things-go-better-with-beer/story-e6frgabx-1226577883754> Paish, M. 2011, ‘Global report highlights challenges for Australian food and beverage industry’, Australian Food News, 25 November, viewed 11 May 2013, <http://www.ausfoodnews.com.au/2011/11/25/global-report-highlights-challenges-for-australian-food-and-beverage-industry.html > PepsiCo Inc 2012, Annual report 2012, PepsiCo Inc., New York, viewed 20 May 2013, < http://www.pepsico.com/Investors/Annual-Reports.html> Westpac Institutional Bank 2013, Westpac Market Outlook March 2013, Westpac Institutional Bank, Sydney, viewed 21 April 2013, <http://www.westpacbrokerbase.com.au/index.php/download_file/view/719/72/>. Williams, K. 2013, ‘Coca-Cola Amatil hit by Pepsi price war’, Sydney Morning Herald, 7 May, viewed 14 May 2013, <http://news.smh.com.au/breaking-news-business/cocacola-amatil-hit-by-pepsi-price-war-20130507-2j4ra.html> Wilson, N. 2012, ‘A fight is brewing between the boutique beer brigade and Foster’s and Lion’, Herald Sun, 27 January, viewed 29 May 2013, <http://www.heraldsun.com.au/business/a-fight-is-brewing-between-the-boutique-beer-brigade-and-fosters-and-lion/story-fn7j19iv-1226254738727> YCharts 2013, EV/EBITDA, YCharts, Chicago, viewed 15 May 2013, <http://ycharts.com/glossary/terms/ev_ebitda> YCharts 2013, EV/Revenues, YCharts, Chicago, viewed 15 May 2013, <http://ycharts.com/glossary/terms/ev_revenues> YCharts 2013, Price to Sales Ratio, YCharts, Chicago, viewed 15 May 2013, <http://ycharts.com/glossary/terms/ps_ratio>