Embed Size (px)
Citation preview

PRICE BUBBLE IN SELECTED ASEAN AGRICULTURAL EXPORTS: AN
APPLICATION OF THE GENERALIZED SUPREMUM AUGMENTED DICKEY-FULLER
Karlo Martin C. Caramugan and Dr. Purisima G. Bayacag
University of Southeastern Philippines
School of Applied Economics
Bo. Obrero, Davao City
1

Background
• An increase in the price of a commodity is caused
by either decreasing supply or an increasing
demand.
• Fundamental Factors - the demand, supply and the
stocks for the commodity come into play.
INTRODUCTION
2

Background
• The global commodity prices have trended upward
since 2006 and have experienced several large
spikes with the 2007-2008 episodes as the most
dramatic (Etienne et al., 2013).
• The prolonged rise of global commodity prices
peaked in mid-2008, and fell sharply and bottomed
out in early 2009 (Varadi, 2012).
INTRODUCTION
3

Background
• From then, the global commodity prices was seen rising
again and accelerating in 2010 (Bank of Japan, 2011;
Varadi, 2012).
• This price increase which strongly deviated from its
fundamental value was characterized as explosive and
indicative of a price bubble.
INTRODUCTION
4

Background
• In the financial market, a bubble is a phenomenon
where an early increase in price of assets is
observed due to the investors’ speculative motive.
• Investors believe that prices will be higher
tomorrow so they buy a lot of assets today with an
intention to sell the same at even a higher price in
the future in the view of gaining profiting from the
differentials.
INTRODUCTION
5

Background
• Commodity Futures Trading Commission (CFTC), defines a
commodity price bubble as a rapid run-up in prices caused by
excessive buying of the commodity that is unrelated to any of the
basic, underlying factors affecting the supply and demand for a
commodity.
• Speculative bubbles are usually associated with a “bandwagon”
effect in which speculators rush to buy the commodity before the
price trend ends, and an even greater rush to sell the commodity
when prices reverse.
INTRODUCTION
6

Background
• When the fundamental factors do not seem to
justify such a price, then bubble exists (Stiglitz ,
1990).
INTRODUCTION
7

• Fundamental factors- demand and
supply relationship.
•Bubble factor- speculated price level
deviating from the fundamental
factors.
IN SHORT
8

Background
• Fundamental price or a bubble price?- A tag of war.
• Fundamental price particularly due to structural and cyclical factors.
1. Fall in the global stockpile of agricultural commodity
2. Demand is increasing as a result of population growth and
income growth of emerging economies;
3. Conversion of agricultural land, low crop yields, rising input
costs and neglected agricultural technology and
infrastructure investments.
• Bubble price due to speculation in agricultural commodities.
INTRODUCTION
9

Rationale
• Motivation:
1. The study of financial bubbles have been numerous as
compared to fewer investigations conducted in the context
of commodities (Brooks et al., 2014).
2. It is undeniable that prices and volatilities rose quickly in a
relatively short period of time; What is less clear is
whether speculators were the cause or whether such
price dynamics were caused by fundamental factors
(Brooks et al., 2014).
INTRODUCTION
10

Rationale
• Commodities are core inputs to the production process or
are consumption goods, the continuous increase in the
price of these commodities post real production costs
(Brooks et al., 2014).
• The inflation caused by increasing commodity prices
accounts for up to a third to more than half of the nominal
rate of inflation in developing countries particularly in Asia
(Wahl, 2008).
INTRODUCTION
11

Rationale
• As food prices increase, the monetary cost of achieving a
fixed consumption basket increases (Hoyos and
Medvedev, 2009) thereby reducing consumers’ welfare.
Food price increase may lead up to food crises which post
a problem for the vulnerable poor.
• Price shock worsen the ability to implement social safety
programs (e.g. Conditional Cash Transfer or CCT) for the
vulnerable poor population (Areal et al., 2013)
INTRODUCTION
12

Rationale
• Bubble sends wrong signals.
• As the price of a crop increases, it drives farmers to
increase their acreage for that specific crop and further
increase their acreage even more as the selling price of
the commodity continues to increase.
• The subsequent price collapse results to misallocation of
valuable.
INTRODUCTION
13

Rationale
• Farmers attempt to minimize their exposure to price risk by
growing their own food, avoiding new technologies and
diversifying their activities i.e. planting different crops
(Kurosaki and Fafchamps, 2001).
• Risk avoidance inhibits gains from specialization, that is,
instead of investing more on farm productivity, farmers
would spend more on income-stabilizing strategies.
INTRODUCTION
14

Objectives of the Study
1. Empirically investigate the existence of price bubbles in the major
agricultural exports of selected ASEAN countries using futures
prices of rice, rubber, palm oil and coconut oil;
2. Determine the duration then date-stamp the exact starting and
termination dates of price bubbles, and
3. Provide a descriptive correlation between the bubbles and the
economic and political landscape of the ASEAN and the world.
INTRODUCTION
15

Why ASEAN and why such commodities?
• The 5 ASEAN countries have a significant economic dependence
on these 4 commodities.
• RICE- In 2010, the ASEAN region collectively exported 16.05
million tons of rice or nearly 49% of the world’s total rice exports.
• Thailand topped the list of rice exporters not only in the region but
also in the world, accounting for 30.63% of total world rice exports
in 2011.
INTRODUCTION
16

Why ASEAN and why such commodities?
• RUBBER- The region also supplies the majority of the natural
rubber needs of the world.
• In 2013, Thailand remained the largest producer of natural rubber,
accounting for 34% of global production equivalent to 4.1 MT,
followed by Indonesia and Vietnam, accounting for 26% and 9%
respectively
INTRODUCTION
17

Why ASEAN and why such commodities?
• PALM OIL- In terms of production, in 2015, among the top 10 palm
oil producers in the world, 3 are from ASEAN with Indonesia
producing about 30% of the world’s palm oil supply.
• 2nd by Malaysia (21%)
• 7th Thailand is the (2%).
INTRODUCTION
18

Why ASEAN and why such commodities?
• PALM OIL- In terms of palm oil exports, Indonesia accounts for
52% of total palm oil exports
• 2nd Malaysia (39%)
• 13th Thailand (0.32% )
INTRODUCTION
19

Why ASEAN and why such commodities?
• COCONUT OIL- An important agricultural product of Philippines,
Indonesia, Malaysia, Singapore and Thailand
• Collectively, the 5 countries collectively supply 54% of the world’s
coconut oil in 2015.
• Of the total volume of coconut oil exports in 2015, Philippines,
Indonesia, Malaysia and Singapore aggregately exported 96%
INTRODUCTION
20

Theoretical Framework
• Rational Commodity Pricing- this theory states that the price of a
commodity is determined by the current and expected future payoffs
(profit from the sale of the commodity) .
Standard Arbitrage Condition
METHODOLOGY
21

Theoretical Framework
• Moreover, for eq. 1 to hold for the indefinite horizon, stocks should
be positive and no stock-outs occur such that sellers have
intentional inventory as buffer. The forward iteration of eq. 1 results
to:
• Generalizing equation (2):
METHODOLOGY
Market fundamental
component
Bubble
component22

Theoretical Framework
• In the absence of a bubble the condition which exist is:
• Showing that the price of a commodity is solely reflective of the
fundamental dynamics of the market when bubble does not exist,
eq. 1 is equal to:
METHODOLOGY
23

Theoretical Framework
• The Animal Spirit Theory
Greater Fool
Extrapolation Theory
METHODOLOGY
24

Conceptual Framework
METHODOLOGY
25

Bubble Estimation Procedure
METHODOLOGY
26
ADF SADF GSADF
DEVELOPMENT OF THE MODEL

Bubble Estimation Procedure
METHODOLOGY
27
• The use of the tradition unit root and cointegration-based
tests proposed by Diba and Grossman (1998) may fail to
detect the existence of bubbles when they are periodically
collapsing.

Bubble Estimation Procedure
METHODOLOGY
28
• Homm and Breitung (2012) had compared several widely
used techniques for identifying bubbles and found out that
Phillip, Wu and Yu (2011, hereinafter PWY) strategy
performs the best.

Bubble Estimation Procedure
METHODOLOGY
29
• Phillip, Shi and Yu (2012, hereinafter PSY) extended the
methodologies of PWY (2011) and Phillips and Yu (2011,
hereinafter PY) which employs a series of recursive
bubble testing procedure.
• This date-stamping method may find out the exact bubble
origination and collapse dates and determine whether
prices deviate from a random walk and become mildly
explosive (Etienne et al., 2013; PSY, 2013).

Bubble Estimation Procedure
METHODOLOGY
30
• These types of tests use a right tail variation of the
Augmented Dickey-Fuller unit root test with the null
hypothesis of a unit root and the alternative explosive
process (Caspi, 2013).

Sample interval
Comparing ADF, SADF and GSADF
31

Bubble Estimation Procedure
METHODOLOGY
32
• Following the conventions of PSY as employed in the studies of
Etienne et al., (2013) and Areal et al., (2013), the methodology is
based on the repeated application of the Augmented Dickey-Fuller
test on eq. 7 on subsamples of the data in recursive fashion (PSY,
2013).

Bubble Estimation Procedure
METHODOLOGY
33
Unit Root
Mildly explosive autoregressive coefficient
• Testing for bubble (explosive behavior) is based on the right-tail
variation of the standard ADF unit root test with the null hypothesis
of a unit root and the alternative of mildly explosive autoregressive
coefficient (Caspi, 2013).

How do we know if it is the start or the end of the bubble period?
34
• The STARTING DATE is the first observation (in
your price series) wherein the corresponding value
of the GSADF is greater than GSADF CV.
• The END DATE is the last observation (in your price
series) wherein the corresponding value of the
GSADF is lesser than the GSADF CV.

35
Frequency Palm oil price % ΔP gsadf gsadf cv gsadf-gsadf cv
2006M10 422.32 -0.84543 0.703214 -1.54865
2006M11 476.74 13% 0.616901 0.763607 -0.14671
2006M12 528.24 11% 2.20054 0.766493 1.434047
2007M01 550.78 4% 2.410614 0.702918 1.707696
2007M02 553.75 1% 1.594959 0.730464 0.864495
2007M03 566.39 2% 1.566803 0.745734 0.821069
2007M04 645.41 14% 3.032619 0.70621 2.326409
2007M05 740.63 15% 4.834058 0.696872 4.137186
2007M06 748.43 1% 3.322004 0.667344 2.65466
2007M07 764.47 2% 2.924979 0.659606 2.265373
2007M08 729.56 -5% 1.521844 0.689345 0.832499
… … … … … …
2008M08 791.77 -0.29979 0.713646 -1.01343
2008M09 667.04 -16% -0.72985 0.68632 -1.41617
2008M10 486.40 -27% -0.83323 0.709682 -1.54291
2008M11 433.10 -11% -0.52833 0.759169 -1.2875
2008M12 440.38 2% -0.53619 0.825783 -1.36198
2009M01 522.15 19% -0.80739 0.770508 -1.5779
2009M02 529.40 1% -0.62591 0.766876 -1.39278
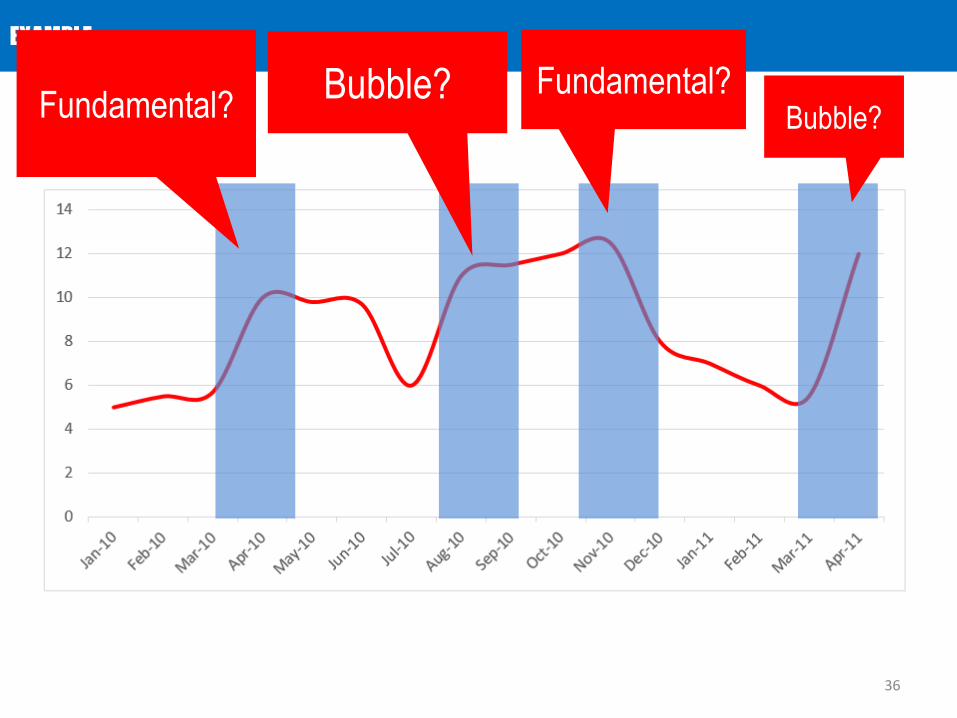
EXAMPLE
36
Fundamental?Fundamental?Bubble?
Bubble?

How do we conduct the estimation procedure?
37
STEP 1: Calculate the GSADF statistics and come up with a
series (call it GSADF series).
STEP 2: Simulate through MCS the critical values (call it the
GSADF CV series).
STEP 3: Compare the two series. Recall the hypothesis testing.
If GSADF>GSADF CV series, reject Ho, and conclude
that a bubble exist.
Explosive autoregressive coefficient (bubble)
The hypothesis testing:
Unit Root (fundamental)

RESULTS- SADF and GSADF statistics
38

RESULTS
39
Price series
GSADF series
GSADF CV series

RESULTS
40

RESULTS- Coconut oil price
41

42
RELEVANT EVENTS
Year
200
720
10 United States- strengthening private
final demand
Global economy expanded driven by
the robust business spending in the
US and recovery in Japan
China- Rapid growth of fixed
investments
China- Decline of annual import
growth in 2004 and 2005.
200
4
United States- Record merchandise
trade balance deficit
200
6
High petroleum oil price
Global financial crisis
ECONOMIC EVENTS POLITICAL EVENTS
COCONUT OIL
Philippines- Political uncertainty linked
to the national elections in May
Philippines- sizeable fiscal deficit and
faced the rising international oil prices

RESULTS- Rubber price
43

RESULTS- Rubber price
44

RELEVANT EVENTS
45
Year
Contraction of the automotive industry
(2008)
200
0's
Massive car scrappage measure in
developed markets (2010)
SEA-La Nina
China- increased demand by tire
producers (2003)
Establishment of the International
Rubber Company Limited (2004)
China- strong growth in demand (2005)
Higher oil prices; decrease demand for
synthetic rubber and increase demand
in natural rubber (2005)
Rising petroleum prices (2008)
Black Sea bumping incident (1988)
Thailand - general election (1988)
Louvre Accord- The accord promoted
stabilisation of major exchange rates
(1987)
International Natural Rubber
Agreement (1987)
1980
's
Conclusion of the Uruguay Round
(1994)
Single European Act (1986) EU expansion (1987)
Malaysia- constitutional crisis (1988)
Establishment of the World Trade
Organization (1995)
1990
's
RUBBERECONOMIC EVENTS POLITICAL AND OTHER EVENTS

RESULTS- Palm oil price
46

RESULTS- Palm oil price
47

RELEVANT EVENTS
48
Year
Demand pressure on the shift of
preference from crude oil to biofuels
PALM OIL
200
6-20
07
Increasing import demand of China
Malaysia and Indonesia- imposed
United States- dollar began to
depreciate steeply20
07-
200
8
Volatility in the economic performance
of major exporting countries
Volatility in pretroluem prices
ECONOMIC EVENTS

RESULTS- Rice price
49

RESULTS- Rice price
50

SUMMARY AND CONCLUSION
51
• The rise in commodity prices had earned the attention of academicians,
policy makers, and investors as the phenomenon had its effects on the
economy, food security, and investment decisions.
• The study sought to determine the existence of a bubble or price
exuberance and to eventually date-stamp the exact starting and
termination dates of the price upswings.
• While the study did not attempt to determine why such price spike exists
over a particular period, the study provided the dynamics of the
international and domestic economies to place the bubble into
perspective.
• Using the Generalized Supremum Augmented Dickey-Fuller, a right-tailed
rolling version of the ADF, several bubbles had been discovered in all of
the commodities under study.

RECOMMENDATIONS
52
1. Conducting a univariate modeling framework.
2. Investigating the possibility of cross-commodity price transmission on the
same periods may be conducted.
3. Improve the transparency in commodity futures exchanges and over-the-
counter markets.
4. A regulatory agency like the CTFC must be given additional powers to allow it
to directly intervene in exchange trading. These powers include buying or
selling derivatives contracts to avert possible price collapse or deflate bubbles.

RECOMMENDATIONS
53
5. Better information and analysis of global and local markets and improved
transparency could reduce the incidence and magnitude of panic-driven price
surges.
6. Countries must improve their capacity to produce consistent, accurate and
timely agricultural market data and analysis, especially in response to
weather shocks such as floods or droughts.
7. The creation and revival of an international supply management system for
the agricultural commodities