Embed Size (px)
Citation preview
Excel Programming Project: World Capitals Project
Introduction
In this project you will learn how to format GPS geographic coordinates in “degrees – decimal minutes” format into decimal degrees as required to import into ArcGIS as required by the “Add XY data” menu option. The “degrees – decimal minutes” format is a very common format used in GPS waypoint downloads so this is a very common type of formatting problem. To process the format conversion process you will learn about the “Left()”, “Right()”, “Mid()”, “Len()”, and “Value()” functions in Excel.
In addition to learning Excel functions, you will learn about map templates in ArcGIS 10.1 in order to create the world base map. We will also go over the “Add XY Data” menu option and its operational settings. Other ArcGIS procedures that are used include:
Turning on labels for the imported GPS coordinates
Using the “Print & Page Setup” menu item to properly setup the print layout.
Switching from “Data” and “Layout” view
Setting document properties including “relative source references”
Download Documentation and Data Files
As a first step create a folder under “\ArcGIS_Data\” that consists of your initials. For example:
C:\ArcGIS_Data\DTA\
All project folders will be under this folder for the course. Now create a “WorldCapitals” folder under your initials, for example:
C:\ArcGIS_Data\DTA\WorldCapitals\
1
All of the files that you download or create for the World Capitals project will be stored in this folder. Now you should download the following files to this new folder:
http://www.usouthal.edu/geography/allison/gy461/WorldCapitalsProj.pdf
http://www.usouthal.edu/geography/allison/gy461/WorldCapitals.xlsm
The PDF file is this document, and the Excel file contains the world capital GPS coordinates.
Create the World Map ArcGIS Project file from a Template
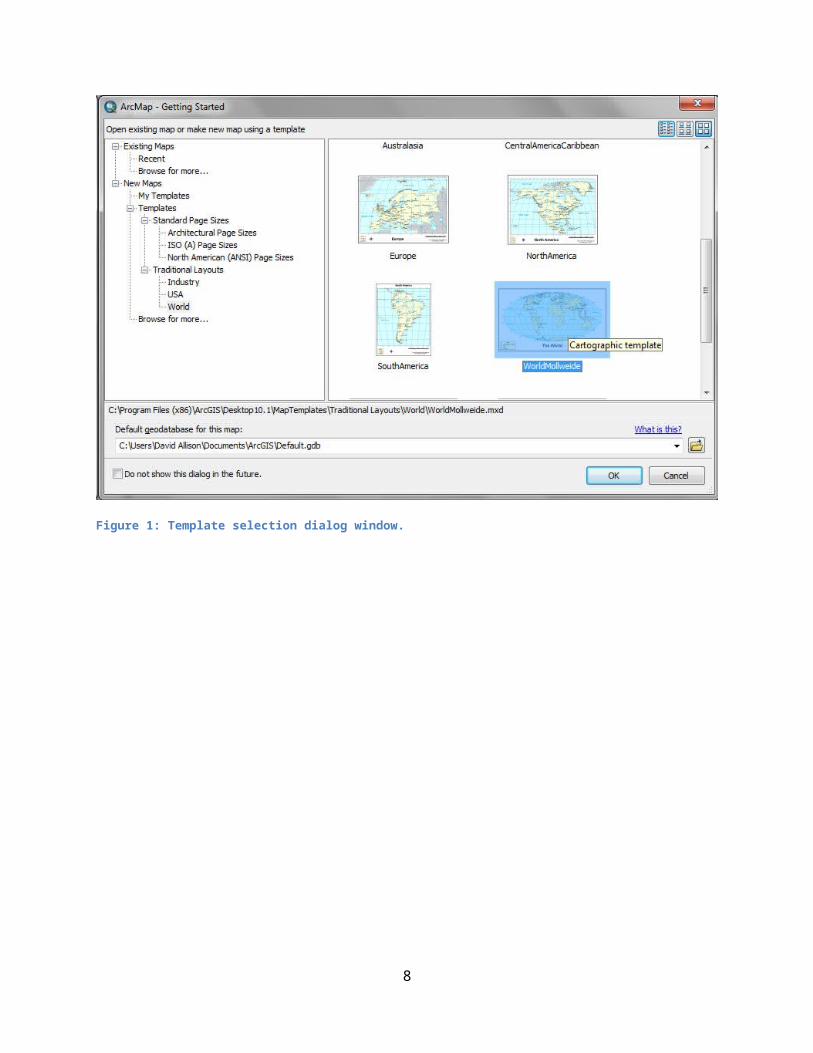
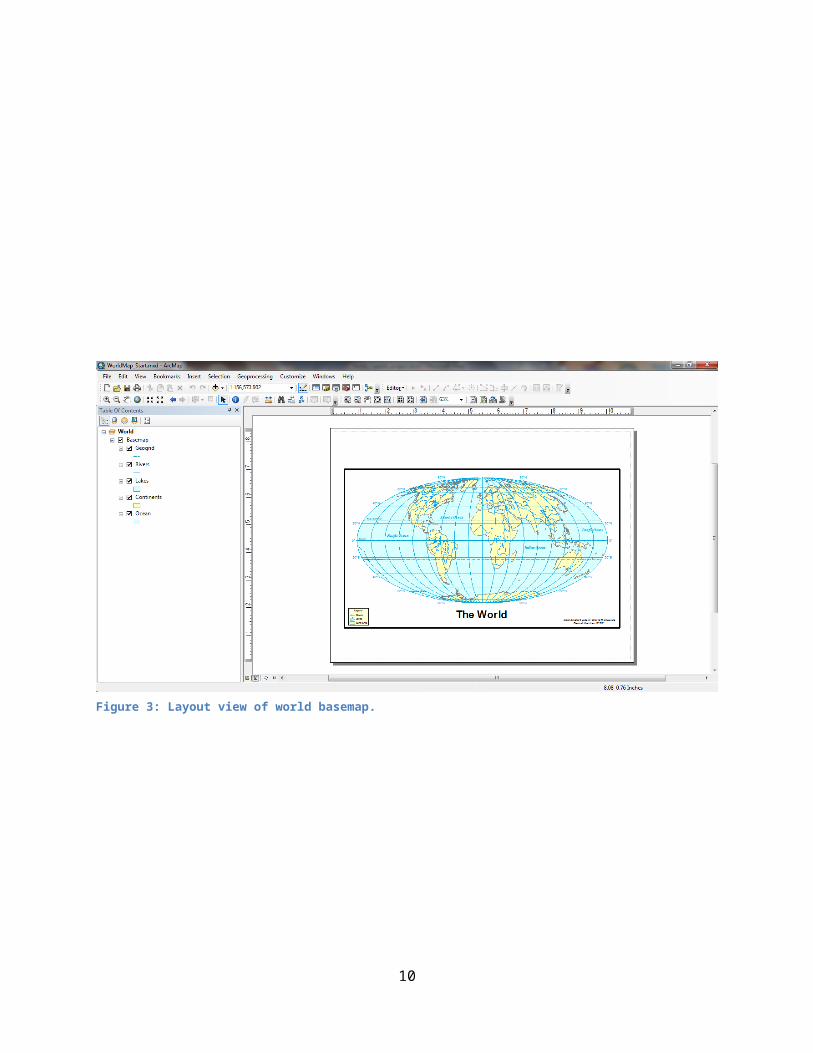
Start ArcMAP from the desktop. From the “File > New” menu dialog select a “Template > World” layout. Use the “WorldMollWeide” projection (Figure 1). Next, select “File > Print & Page Setup” to activate the dialog in Figure 2. After selecting an appropriate printer driver, set the dialog options as in Figure 2. The template file is set to “Layout” view. Try switching from “Layout View” to “Data View” view in the “View” menu to see the difference. Note that the “Layout View” shows the media and plotting edges, and shows coordinates in page inches when the cursor is outside of the data frame. The “Layout View” of the base map should appear as in Figure 3.
Format GPS Data for Importing into ArcMap
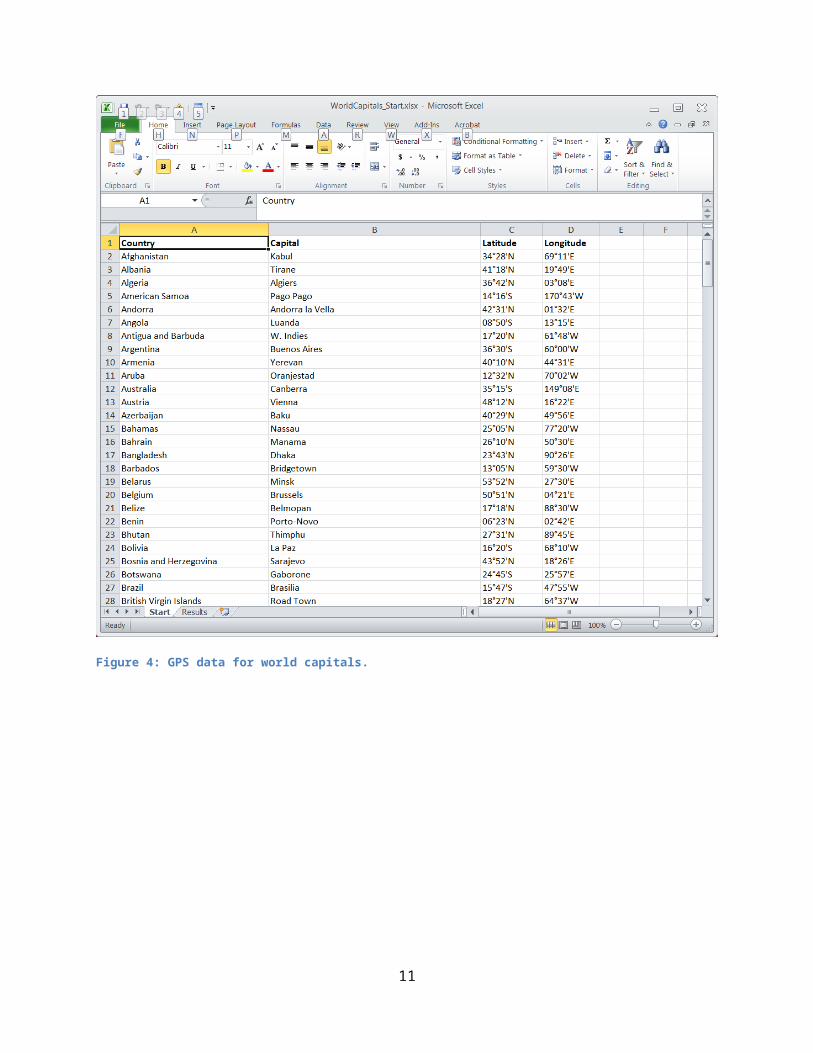
Figure 4 contains the first page of GPS data stored in the Excel spreadsheet file “WorldCapitals_start.xlsx”. Note that the latitude and longitude coordinates are in the format:
Latitude: DD°MM’H
Longitude: {D}DD°MM’H
Where “D” represents a degree “digit”, “M” represents a minutes “digit”, and “H” refers to a hemisphere indicator. For latitude the hemisphere is either “N” or “S”; for longitude the hemisphere designator is either “E” or “W”. In the case of longitude degrees, the number of digits is either 2 or 3, with the leading “0” being dropped if the value is less than 100. To calculate a decimal degree value from latitude or longitude one should use the following equation:
Decimal degree = +DD+MM/60
2
If the longitude is “W” or the latitude is “S”, the equation will be:
Decimal degree = -DD-MM/60
In order to calculate the decimal degree value we need to isolate the degree and minute values as numbers in their own columns in the spreadsheet. Because the GPS coordinates are embedded in a single “string” value for each longitude and latitude, several string handling functions in Excel will have to be used:
Value(string): converts a string to a numeric value.
Len(string): returns the character length of a string value.
Right(string,len): returns the string consisting of the right-most “len” characters of the string.
Mid(string, start, len): returns the substring starting at “start” character and ending at “start+len” character position from the string value.
Left(string,len): returns the substring of the “string” value using the “len” number of left-most characters.
If(exp,true,false): if “exp” is true, the “true” statement is returned, otherwise the “false” statement is returned.
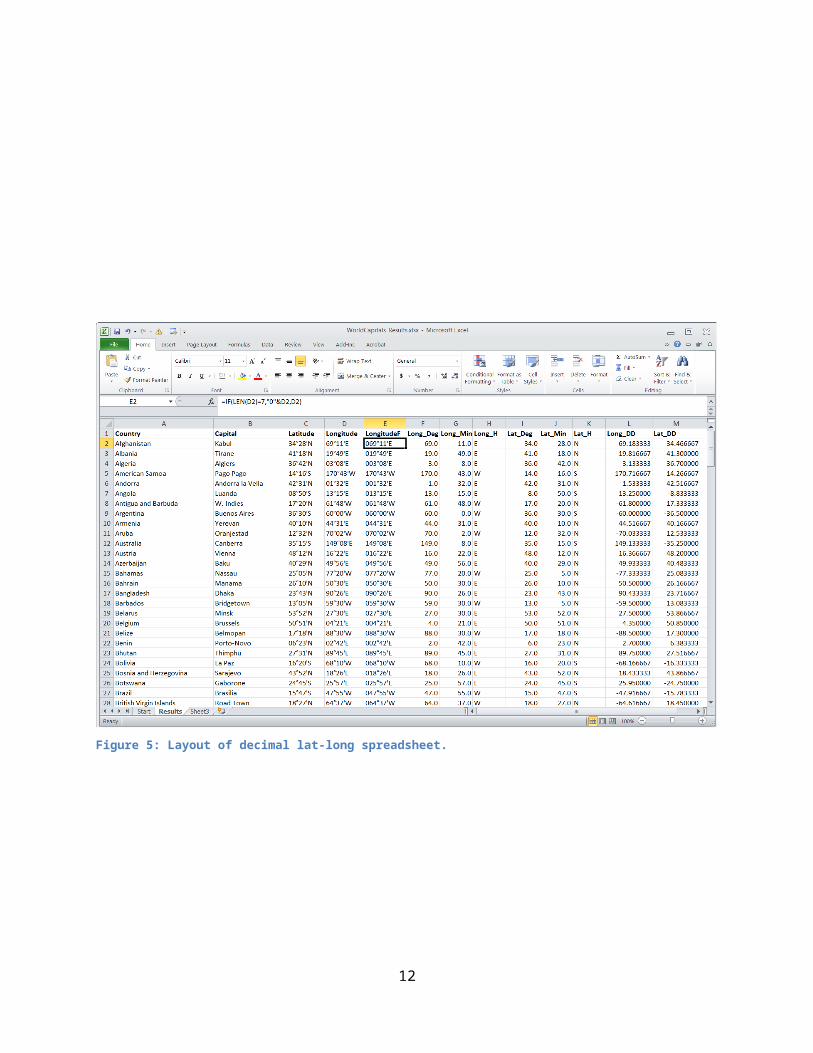
Note that in any of the above functions, any one of the parameters inside the parentheses could be cell addresses (i.e. “D4”) . Figure 6 contains the proper layout for the decimal degree spreadsheet that should be derived from the starting GPS coordinate spreadsheet. Below are the column headings and what they represent:
LongitudeF: contains a longitude string that contains a leading “0” for longitude degree values less than 100. For this column the longitude character string is always 8 characters long. For example the longitude string “69°11'E” is converted to “069°11'E”. You will need to use the If() and Len() functions, and the string “&” addition operator.
Long_Deg: this column should contain the numeric value of the longitude degree extracted from the “LongitudeF” column. You will need to use the Value() and Left() functions to isolate this value.
Long_Min: this column should contain the numeric value of the longitude minutes extracted from the “LongitudeF” column. You will need to use the Value() and Mid() functions to isolate this value.
3
Long_H: this column should contain the hemisphere designation character (“E” or “W”) extracted from the “LongitudeF” column. You will need to use the Right() function to isolate this value.
Lat_Deg, Lat_Min, Lat_H: these columns correspond the the degrees, minutes, and hemisphere designation of the latitude calculated from the Latitude column. You should use the same functions used above to calculate these values. Note that the character length of the latitude string is 7.
Long_DD: this column contains the longitude converted to a decimal degree numeric value, negative if in the western hemisphere. You will need to use an If() statement to decide how to add or subtract values:
If Long_H = “E” then
Long_DD = Long_Deg + Long_Min/60
Else
Long_DD = -Long_Deg – Long_Min/60
Endif
Lat_DD: should contain the decimal degree numeric value of the latitude string. Use the same If() logic as above to distinguish between positive north hemisphere versus negative south hemisphere values.
Format the Long_DD and Lat_DD to a precision of 6 decimal places for these columns. Save this spreadsheet as “WorldCapitals_Results.xlsx”. Note that the original data and calculated values have been created in a 2nd sheet named “Results”. The original data is in the 1st sheet named “Start”.
Importing GPS Coordinates into ArcMap
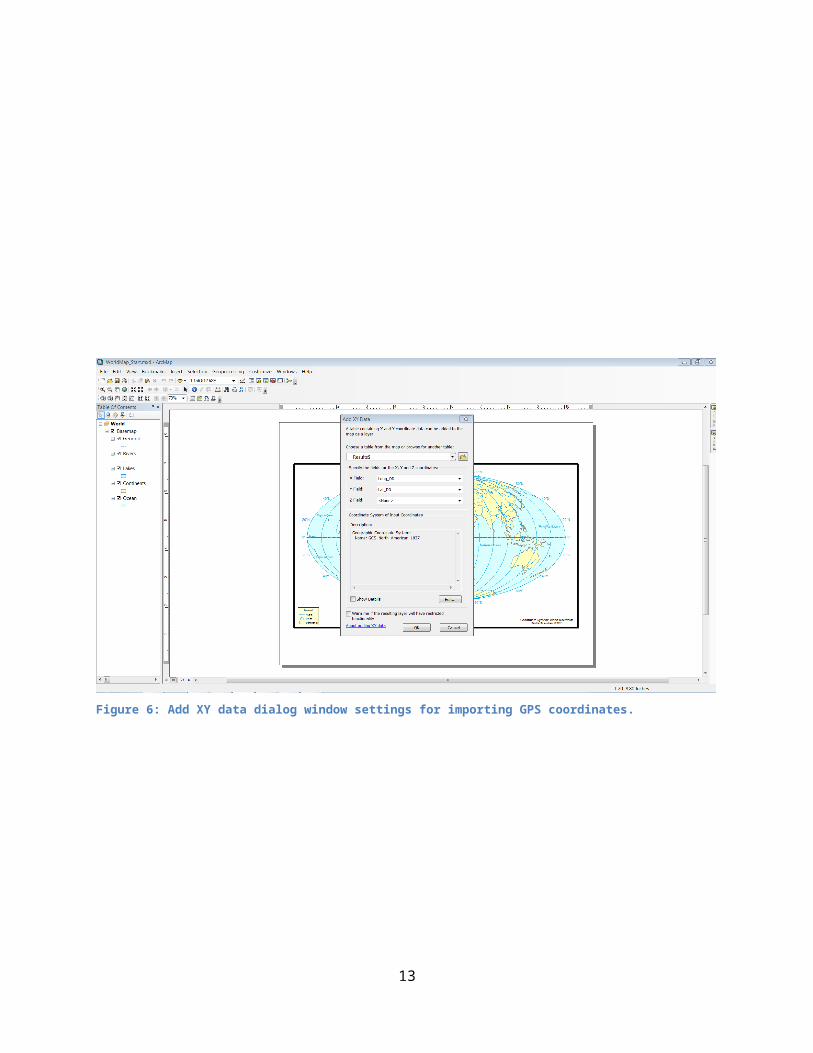
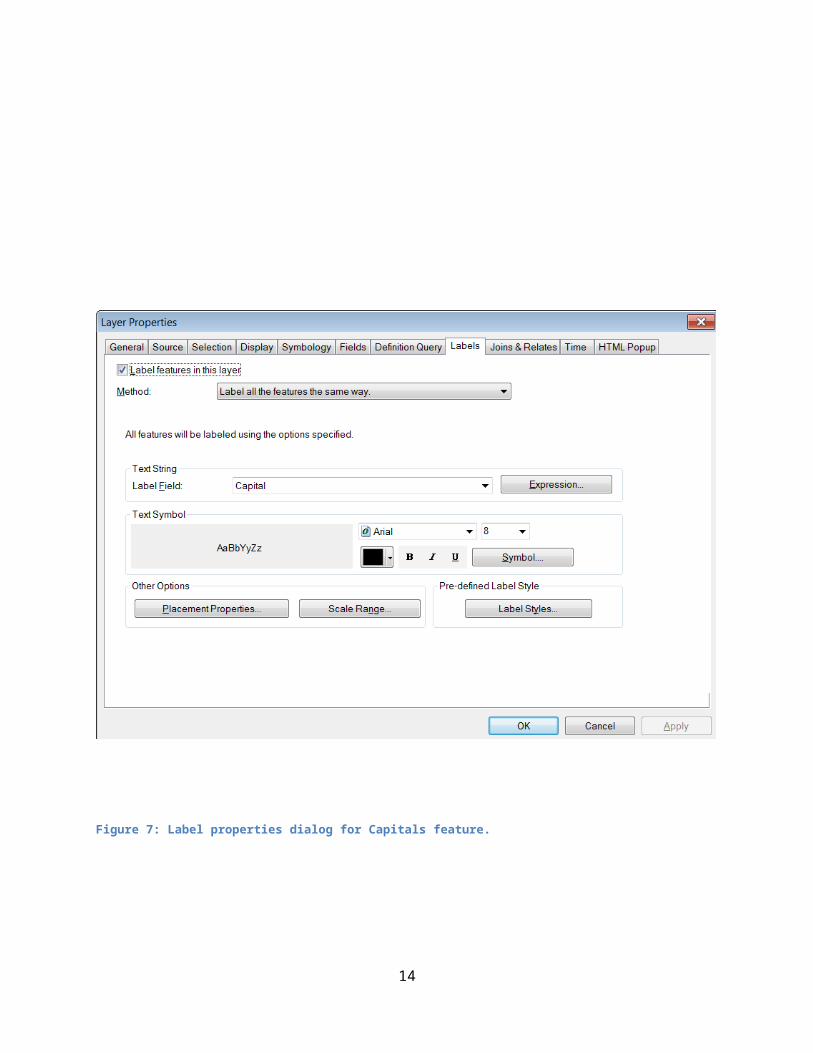
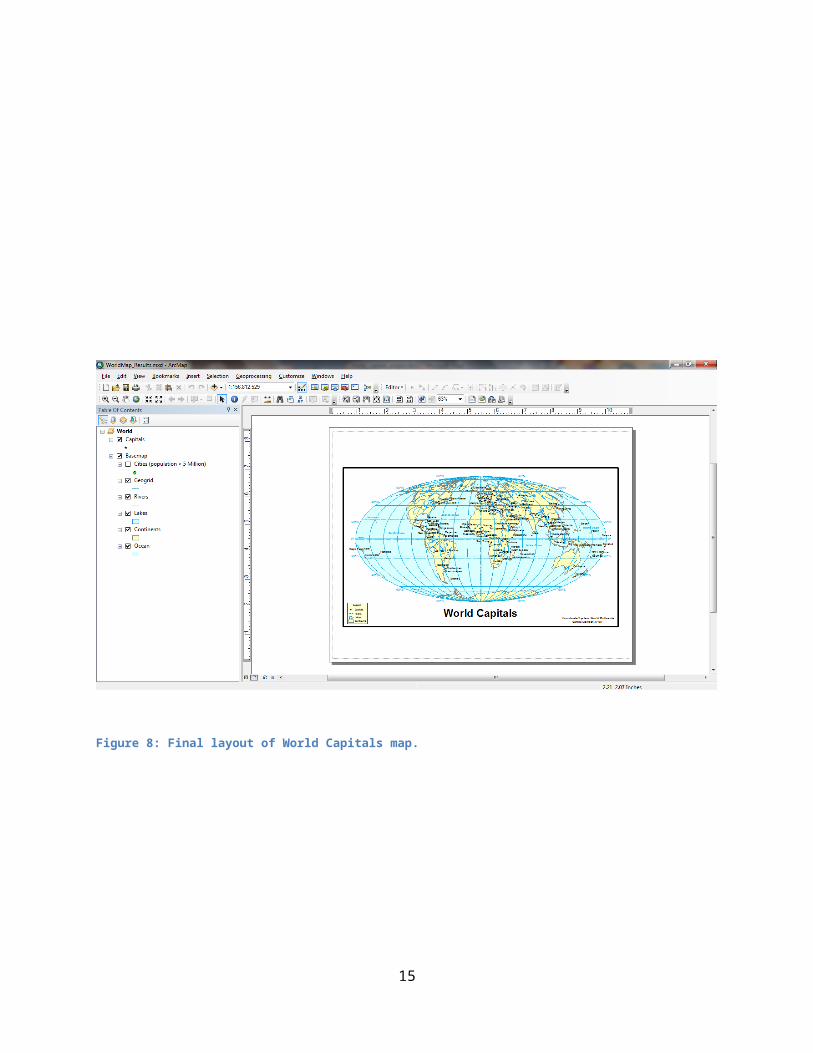
In order to import the decimal degree GPS coordinates as points into an ArcMap project you will need to use the “File > Add Data > Add XY Data” menu option. Open the world base map and activate this menu option. With the file open button (yellow folder button) in the window dialog specify the “WorldCapitals_Results.xlsx” spreadsheet, and the “Results” sheet. The dialog should be filled out as in Figure 7. Note that the “X” and “Y” are “Long_DD” and “Lat_DD” respectively, and that the coordinate system specified for the imported data is “Geographic > World > WGS 1984”. To turn on the capital names as labels right-click on the world capitals feature layer, and then select “properties”. Select the “label” tab and then set the options as in Figure 8. You may also need to change the color of the point markers to make them more visible. The name of the world capitals feature layer defaults to “Results Events”. With the “properties” menu under the “General” tab rename the feature class to “World Capitals”. Your map should now appear as in Figure 9.
Producing a Hard Copy of the World Capitals Map
4
A hard copy printout is generally required for mapping projects, therefore, this last step will familiarize you with producing printouts in the GIT461 lab. Your instructor will indicate which printer to use for each project- make sure you select that printer driver in the print dialog window. Most labs have several possible printer devices so be sure you know the correct one. Before sending any type of map to a printer you should use the “File > Page & Print Setup” menu option to control how the map “fits” on the chosen output media size. In this project we are using letter (8.5 x 11 inch) paper media in “landscape” orientation. Use this menu option to bring up the dialog window in Figure 10, and then fill in the information as indicated in this figure (except that the printer driver name will probably be different). When finished, use “File > Print Preview” to preview, and if it appears OK send it to the printer for a hard copy to turn in.
In addition to the above properties, make the project file use relative path names through the “File > Map Document Properties” menu option. Fill in the dialog as indicated in Figure 11, replacing {your name here} with your actual name. Make sure to “check” the “store relative path names to data sources” checkbox before selecting the “OK” button. By checking this option you will be able to move the project folder to another disk without breaking the links to the project files.
Note: Plot scale for the map in Figure 9 is 1:150,000,000. The reference scale for font size control is 1:50,000,000. The labels for World Capitals are 8-point size.
5
Figure 1: Template selection dialog window.
6
Figure 2: Print and Page Setup dialog window.
7
8
Figure 3: Layout view of world basemap.
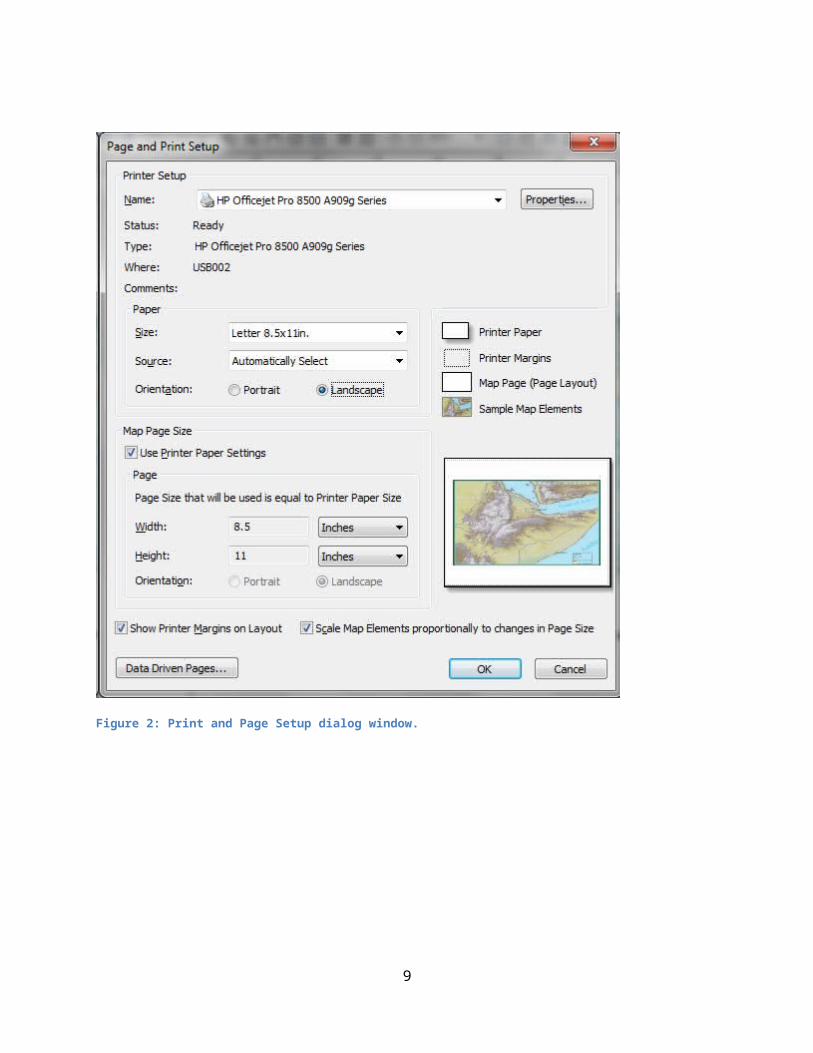
Figure 4: GPS data for world capitals.
9
10
Figure 5Figure 5: Layout of decimal lat-long spreadsheet.
11
Figure 6: Add XY data dialog window settings for importing GPS coordinates.
12
Figure 7: Label properties dialog for Capitals feature.
13
Figure 8: Final layout of World Capitals map.
14
Figure 9: Page & Print Setup dialog window.
15
Figure 10: Map document properties window dialog.