Embed Size (px)
Citation preview

1
University of São Paulo “Luiz de Queiroz” College of Agriculture
Use efficiency of controlled release fertilizer on the growth of croton and petunia and N loss by leaching
Sueyde Fernandes de Oliveira
Thesis presented to obtain the degree of Doctor in Science. Area: Crop Science
Piracicaba 2016

2
Sueyde Fernandes de Oliveira Agronomist
Use efficiency of controlled release fertilizer on the growth of croton and petunia and N loss by leaching
versão revisada de acordo com a resolução CoPGr 6018 de 2011
Advisor: Profa. Dra. SIMONE DA COSTA MELLO
Thesis presented to obtain the degree of Doctor in Science. Area: Crop Science
Piracicaba 2016

Dados Internacionais de Catalogação na Publicação
DIVISÃO DE BIBLIOTECA - DIBD/ESALQ/USP
Oliveira, Sueyde Fernandes de Use efficiency of controlled release fertilizer on the growth of croton and petunia and N loss by leaching / Sueyde Fernandes de Oliveira. - - versão revisada de acordo com a resolução CoPGr 6018 de 2011. - - Piracicaba, 2016.
72 p. : il.
Tese (Doutorado) - - Escola Superior de Agricultura “Luiz de Queiroz”.
1. Codiaeum variegatum 2. Petunia×hybrida Vilm.-Andr 3.Nitrogênio 4. Lixiviação I. Título
CDD 635.9 O48u
“Permitida a cópia total ou parcial deste documento, desde que citada a fonte – O autor”

3
DEDICATION
I am dedicating this thesis to my parents, Eunice Antonio dos Santos de
Oliveira and Manoel Antonio Fernandes de Oliveira, and my husband, Renato
Salla Braghin, who have always supported my decisions, and for teaching me
to pursue all of my dreams with integrity and purpose.
Thank you very much!
Chega o momento de alcançarmos a vitória maior e é aí que
descobrimos o quanto ainda somos pequenos e temos que
aprender, pois cada conquista nossa abre as portas para a
construção de um novo sonho...
(Autor desconhecido)

4
5
ACKNOWLEDGEMENTS
First I thank God for all of the opportunities and achievements in my life. None of this
would have been possible without God's love and the endless possibilities He
creates.
My parents, Eunice Antonio dos S. de Oliveira and Manoel Antonio F. de Oliveira,
and my sister, Aline F. de Oliveira. Their presence in my life has made this possible.
My husband, Renato Salla Braghin, who have always been there for me with support,
love, and encouragement.
My advisor, Simone da Costa Mello, the knowledge transmitted during these years,
that has been instrumental in my sucess. I am fortunate for trust in my potential and
allow to continue my Phd. In addition, Dr. Paul Fisher the opportunity he provide me
to work in the Department of Environmental Horticulture at University of Florida in
Gainesville Florida, for the significant contribution and helpful insights to this research
work. He has shown me, by his example, what a good scientist (and person) should
be.
Along these lines, I would like to thank Luiz de Queiroz College of Agriculture,
University of Sao Paulo (USP) and University of Florida. The departments of Crop
Science and Environmental Horticulture both provided an excellent education and
numerous opportunities. Special thanks to the secretary at USP, Luciane Aparecida
Toledo, for answering numerous questions, providing moral support, and her
professionalism.
For their support of my research, I would like to thank the professors at ESALQ/USP
and CENA/USP, specially to Prof. Keigo Minami, and Angelo Pedro Jacomino, José
Lavres Junior, Luiz Antônio Gallo, Marisa de Cássia Piccolo, and Paulo Hercilio
Viegas Rodrigues, and the employees Aparecida de Fátima Patreze, Cleusa Pereira
Cabral, Fabiana C. Fracassi Adorno, José Nivaldo dos Santos, for access and use of
laboratory equipment and the questions and help they were willing to provide.
To CNPq - National Counsel of Technological and Scientific Development, for
granting the scholarship in Brazil. To CAPES - Foundation Coordination for the
Improvement of Higher Education Personnel, of the Ministry of Education, Brazil, for
granting the scholarship to travel and work in the United States of America.
The companies Compo-Expert, Everris, Hidrosense, Produquimica, and Van Noije
Ornamentals, for financial support and technical assistance during the experiment.

6
I would also like to thank to the employees and friends done during my stay in the
United States, Dale Haskell, Javier Lopez, Jay Jaudon, Jinsheng Huang, Maria Paz,
Rosanna Freyre, Ryan Dickson, and Victor Zayas, who collected and analyzed
samples with me in the field and in the laboratories, and for the patience with my
english.
At last, but not least, I am so greatful to all my friends for their support and help
throughout this whole period, Ester Holcman, Fernando Silveira, Gustavo Quesada,
Marcela Del Carmen, Mateus Donegá, Rafael Campagnol, Renes Pinheiro, and
Ricardo Matsuzaki.
And to all the people who contributed directly or indirectly to this work.

7
SUMMARY
RESUMO..................................................................................................................... 9
ABSTRACT ............................................................................................................... 11
1 INTRODUCTION .................................................................................................... 13
1.1 Controlled release fertilizer .................................................................................. 13
1.2 Codiaeum variegatum ......................................................................................... 14
1.3 Petunia × hybrida Vilm.-Andr ............................................................................... 16
References ................................................................................................................ 17
2 EFFECTS OF CONTROLLED RELEASE FERTILIZERS ON CROTON GROWTH AND NITROGEN LEACHING ............................................................................... 23
2.2 Materials and Methods ........................................................................................ 25
2.3 Results and Discussion ....................................................................................... 27
2.4 Conclusions ......................................................................................................... 43
References ................................................................................................................ 43
3 STRATEGIES TO PROVIDE FERTILIZER FOR BOTH PRODUCTION AND CONSUMER PHASES OF PETUNIA ................................................................... 47
3.1 Introduction .......................................................................................................... 47
3.2 Materials and Methods ........................................................................................ 49
3.2.1 Greenhouse Fertilizer Experiment (petunia) ..................................................... 49
3.2.2 Nitrogen Release from CRF in the Greenhouse Fertilizer Experiment (Sand Containers, No Plants) .................................................................................... 52
3.2.3 Growth Chamber Experiment ........................................................................... 53
3.2.4 Statistical Analysis ............................................................................................ 54
3.3 Results and Discussion ....................................................................................... 56
3.4 Conclusions ......................................................................................................... 70
References ................................................................................................................ 71

8

9
RESUMO
Eficiência do uso de fertilizantes de liberação controlada no crescimento de cróton e petúnia e perda de N pela lixiviação
O mercado de flores e plantas ornamentais tais como cróton (Codiaeum
variegatum) e petúnia (Petunia×hybrida Vilm.-Andr) apresenta-se em constante desenvolvimento tecnológico, caracterizando-se como um dos mais promissores segmentos da horticultura. A adubação, visando o aumento da eficiência do fertilizante e redução de perdas, são temas de estudos em todo o mundo. Assim, foram realizados dois experimentos para avaliar o uso de fertilizantes de liberação controlada (FLC) no crescimento de duas espécies de plantas ornamentais e a perda de nitrogênio por lixiviação. O primeiro experimento teve como objetivo avaliar fontes e doses de FLC e solução nutritiva no crescimento de cróton e a concentração de nitrogênio (N) na solução drenada dos vasos. Os resultados revelaram que a solução nutritiva e as menores concentrações de FLC proporcionaram o maior crescimento das plantas, e as taxas de N perdidas por lixiviação foram superiores para o tratamento com solução. O segundo experimento objetivou comparar estratégias de adubação que proporcionem nutrição adequada durante a fase de produção e do consumidor com menor custo, as quais incluíam FLC e solução nutritiva. Simultaneamente, foram realizados dois experimentos para avaliar a liberação de nitrogênio pelos fertilizantes, sem as plantas, nas condições de cultivo das plantas (estufa) e em câmaras de crescimento sob três temperaturas de incubação. Os resultados mostraram que durante a fase de produção todos os tratamentos resultaram em plantas nos padrões comerciais, e no período que simulou a fase do consumidor as plantas que receberam apenas solução nutritiva durante a fase de produção apresentaram deficiência nutricional, enquanto com os FLC as plantas cresceram vigorosamente, principalmente para os tratamentos com as maiores doses. Os fertilizantes avaliados apresentaram diferença quanto à temperatura na liberação dos nutrientes, sendo maior a taxa de liberação quanto maior a temperatura. De acordo com os resultados o FLC proporcionou o crescimento das plantas na mesma proporção que a solução nutritiva, com uma redução na concentração de N por lixiviação e acréscimo inferior a U$0.065 no custo por planta quando utilizado FLC durante a produção. Palavras-chave: Codiaeum variegatum; Petunia×hybrida Vilm.-Andr; Nitrogênio;
Lixiviação

10

11
ABSTRACT
Use efficiency of controlled release fertilizers on the growth of croton and petunia and N loss by leaching
The market of flowers and ornamentals such as croton (Codiaeum
variegatum) and petunia (Petunia×hybrida Vilm.-Andr) have been created new technologies to constantly development, as one of the most promising segments of horticulture. Fertilization providing adequate nutrition and less leaching to the environment is the objective of numerous studies around the world. Therefore, two studies were conducted to evaluate the use of controlled release fertilizer (CRF) on the growth of two ornamental species, and N loss by leaching. The first experiment aim to evaluate sources and rates of CRF and water soluble fertilizer (WSF) on croton growth and nitrogen concentration on drained solution. Results showed that treatments with WSF and low rates of CRF provided higher plants growth, and the amount of N leached was higher for WSF treatments. The second experiment objective to compare plant performance and cost for strategies that potentially provide adequate nutrition during both the production and consumer phases for container-grown Petunia plants. In addition, two experiments were conducted to evaluate nutrient release in sand containers inside of the greenhouse and under controlled temperature conditions without plants. Results showed that during production phase all fertilizer treatments produced high quality plants, and during consumer phase, plants grown with WSF only during the production phase were nutrient-deficient, while plants receiving CRFs were still growing vigorously, especially in a high rate. The release rates of all CRF products were temperature-dependent. In conclusion CRF provided plant growth at the same rate that WSF, with less N leaching and extra cost less than U$0.065 per plant with CRF during production.
Keywords: Codiaeum variegatum; Petunia×hybrida Vilm.-Andr; Nitrogen; Leaching

12

13
1 INTRODUCTION
1.1 Controlled release fertilizer
The fertilizer industry faces a continuous challenge to improve its
products increasing the efficiency of their use, particularly of nitrogenous fertilizers,
and to minimize any possible adverse environmental impact. This is done either
through improvement of fertilizers already in use, or through development of new
specific fertilizer types (MAENE, 1995; TRENKEL et al., 1988). One possible way to
improve management of nutrient application is by using controlled-release (CRF) or
slow-release fertilizers (SRF), matching nutrient supply with plant demand and
maintaining nutrient availability (SHAVIV, 2000).
There has been limited use of slow- and controlled-release fertilizers on
many agricultural crops because the relatively higher prices compared to
conventional mineral fertilizers. Only since the end of the 1990s have they been used
for a wider range of commodity or conventional agricultural crops. This change was
made possible through large-scale production and excellent promotion and advisory
work (TRENKEL, 2010).
These fertilizers still represent only about 0.15% of the market
(TRENKEL, 1997), though is projected at a compound annual growth rate of 6.5%
until 2019. In 2013, the estimated use market was valued at $2,061.2 million, and
grass and ornaments was the leading application segment in 2014 followed by
cereals & oilseeds and fruits & vegetables (MARKETS AND MARKETS, 2014).
The worldwide experiences in agricultural development have proved
that rational fertilization is the most efficient and important measure for increasing
crop production (XIANG et al., 2008). Controlled-release and ‘stabilized’ fertilizers
meet, to a significant extent, requirements for an ideal fertilizer (SHOJI and
GANDEZA, 1992), which after granulation are given a protective, water-insoluble
coating to control water penetration and thus dissolution rate, nutrient release and
duration of release (TRENKEL, 2010). Thus, nutrient release is efficiently controlled
or delayed by improving the fertilizer itself, which matches the release time and
intensity with the demands of plants for nutrients, providing enhanced nutrient use
efficiency (AZEEM et al., 2014).
The release of nutrients depends on the formulation of the coating
materials, as polymeric material used by each manufacturer that depends on its
chemical and physical properties, further coating thickness and CRF prill shape and

14
diameter (CARSON; OZORES-HAMPTON, 2013). According to Trenkel (2010), there
are three main groups of coated/encapsulated fertilizers, based on the following
coating materials: sulphur, sulphur plus polymers, and polymeric/polyolefin materials.
There are variables such as humidity and temperature that influence the
release of nutrients into the medium. The resin surrounding membrane is dissolved,
gradually releasing the nutrients present in the fertilizer and continues according to
the temperature and / or with the removal of nutrients from the solution by plant
(SGARBI et al., 1999). Therefore, understanding these mechanisms in terms of
nutrient availability to the target crop plant is critical to the choosing the proper
material and is valid for economic considerations (i.e., maximizing the utilization of
added fertilizer) and even more for minimizing fertilizer leaching (HANAFI, 2000).
Three methods categories are used to estimate N release: laboratory;
growth chamber or greenhouse; and field methods (CARSON; OZORES-HAMPTON,
2012). Growth chamber and greenhouse methods are used to evaluate or compare
how CRFs will act in a particular controlled environment (BROSCHAT; MOORE,
2007; HUETT; GOGEL, 2000). Lastly, field methods are used to measure N release
in commercial vegetable field conditions (SIMONNE; HUTCHINSON, 2005).
However, CRF used alone does not provide a complete solution to the
problem of nutrient leaching, but it can help address a number of grower needs to
apply the right fertilizer, at the right time, rate, and location. Appropriate application
methods and CRF types must be calibrate to match crop production (BROSCHAT;
KLOCK-MOORE, 2001). Therefore, these studies were undertaken in order to (1)
determine appropriate application rates, timing and methods of fertilization among
two species of ornamental plants (2) determine nutrient uptake and indices of N-use
(3) leaching losses of nitrogen under different types of CRF and WSF (4) an
economic analysis of CRFs versus water soluble fertilizer (WSF) to help guide grower
fertilizer decisions (Chapter 3).
1.2 Codiaeum variegatum
Ornamental plant production represents an important agricultural
industry in Brazil with a net wholesale value of R$5.7 billion in 2014 (INSTITUTO
BRASILEIRO DE FLORICULTURA - IBRAFLOR, 2015), whereas containerized
flowers and plants represent 20% of total market value (JUNQUEIRA; PEETZ, 2013).
Among ornamental species, few shrubs are available with as great a variety of

15
beautiful leaf colors and shape as croton, an example of the most common plants
that have not been explored.
Native to South Sea Island and the Malaya Peninsula, croton
(Codiaeum variegatum) is a group of beautifully variegated leafy perennial, tropical
woody shrubs or trees with glabrous branches and with multicolored spots to
irregular color patches or solid-colored leaves of red, orange, yellow, and green,
belonging to the family Euphorbiaceae (GILMAN, 1999; MAZHER et al., 2011).
Plants are generally available in many areas within its hardiness range, as one
indoor and outdoor plant.
Potted ornamental plants are grown containerized mostly in substrates.
Thus, excessive mineral nutrients are supplied to ensure plant growth is not
restricted. The negative impacts (i.e., leaching and runoff) of this strategy are more
pronounced in containerized crop production where nutrient uptake efficiencies are
low because of the relatively inert substrates used as growing medium (OWEN
JUNIOR et al, 2008). This management strategy needs to be reconsidered as a
result of economic and environmental concerns surrounding current production
practices.
Therefore, is required to know nutritional demands of the crop to ensure
highest production. Some studies were carried out aiming to evaluate nutrient
content on the leaves of croton (POOLE and CONOVER, 1976; CONOVER and
POOLE, 1984). Chase e Poole (1989) suggested optimum levels for nitrogen (3,5-
5,5%), phosphorus (0,45-0,55%), potassium (3,2-3,7%), sulfur (0,2-0,3%),
magnesium (0,4-0,6%), and calcium (1,0-1,5%). Based on tissue nutrient levels, is
essential that a fertilizer material provides sufficient nutrients for the initial start
followed by a uniform supply that synchronizes well with the nutrient requirement of
the crop.
Controlled-release fertilizers, sometimes considered a useful adjunct to
a liquid fertilization program for containerized nursery crops, may also be used as the
sole source of nutrients. Exclusive use of CRF can greatly reduce the quantities of
these nutrients that are leached in runoff water (RATHIER; FRINK, 1989; SHARMA,
1979).
Several studies have reported satisfactory growth of various woody
ornamentals in which N, K, and P requirements were met entirely by a preplant
application of controlled release fertilizer (POOLE; CONOVER, 1989; SANDROCK et

16
al., 2005; KARAM et al., 2009). Based on a study carried out by El-Aziz et al. (2007),
croton plants had higher growth at the lowest level of fertilizer, suggesting the use of
lower rates of CRFs.
Due to the wide variety of fertilizers available on the market, optimum
formulations, levels, and application strategies differ greatly, affected by species,
growing media, and environmental conditions. Thus the purpose of this study was to
investigate sources and rates of CRFs on croton production compared with water
soluble fertilizer by using quantitative analyses, N uptake and indices of N-use by
plants (Chapter 2).
1.3 Petunia × hybrida Vilm.-Andr
Petunia (Petunia hybrida Vilm.), belonging to the family Solanaceae, is
an annual herbaceous with a long flowering period and a wide range of shapes and
sizes. Its center of origin and genetic diversity is in South America, and most of
commercial materials are hybrids (GARCÍA-ALBARADO et al., 2010). It is popular as
bedding ornamental plant for summer home gardens and commercial landscaping
projects (ARANCON et al., 2008).
‘Supertunia’ petunia cultivars were the first in a wave of new
vegetatively propagated introductions in the early 1990s when breeding programs
began redeveloping multiflora (large flower number on large branched plants) petunia
types from wild species and older cultivars (GRIESBACH, 2006). New petunia
cultivars with increased genetic variability in terms of stress tolerance, plant vigor,
trailing growth, flower size and number, and postproduction durability, could
potentially result in variability in fertilizer response.
In intensive horticulture, the management of mineral nutrition is a key
factor in determining the ornamental value of the plants. When the plant is growing
vegetatively, consideration needs to be given to the form of nutrient applied, the
application rate and time of application in order to prevent nutrient deficiencies from
limiting growth and quality (ZHANG et al., 2012).
The best fertilization in ornamental plant production depends on the
method, the irrigation frequency and local environmental (KANG; IERSEL, 2001).
Typical N fertilization recommendations for stock herbaceous ornamental crops are
between 150 and 250 mg N L−1 applied at each irrigation (DOLE; GIBSON, 2006).
Petunia must be grown with a relatively high supply of nutrients to produce
17
marketable plants. During their growing-season, the plants may be irrigated with as
much as 150-200 ppm of N. Many growers supplement their liquid feed program with
a controlled release fertilizer (CRF) such as Osmocote, and a topdress of CRF
applied the week before shipping may improve performance for the retailer and
consumer. (HAMRICK, 2003).
Nutrients can be supplied through a combination of preplant dry
fertilizers in the substrate, supplemental application of water soluble fertilizer, and/or
incorporation of controlled release fertilizers (SANTOS et al., 2011). However,
fertilization strategies for Petunia vary widely between commercial growers, resulting
in a range of resource efficiencies, suggesting a need to better understand nutrient
uptake processes and fertilizer response (SANTOS et al., 2008).
Several studies have been conducted in order to assess petunia
nutritional requirement and water soluble fertilizer used as a source of nutrients
(ZHANG et al., 2012; SMITH et al., 2004; SANTOS et al., 2011; ALEM et al., 2015),
although just some of them tested controlled-release fertilizers (KLOCK-MOORE;
BROSCHAT, 2001; CURREY; LOPEZ, 2014).
Recently, there has been interest in the potential of CRF to maintain
some residual fertilizer for the consumers, as an opportunity to add value and
profitability with a slightly higher sales price by providing the product with a fertilizer
load, and thus increasing the post-production of flowers. In this study, fertilizer
strategies were compared in Supertunia cultivar to compare plant performance and
nutrient release that potentially provide adequate nutrition during both the production
and consumer phases for container-grown floricultural plants (Chapter 3).
References
ALEM, P.; THOMAS, P.A.; IERSEL, M.W. van. Substrate water content and fertilizer rate affect growth and flowering of potted petunia. Hortscience, Alexandria, v. 50, p. 582-589, 2015.
ARANCON, N.Q.; EDWARDS, C.A.; BABENKO, A.; CANNON, J.; GALVIS, P.; METZGER, J.D. Influences of vermicomposts, produced by earthworms and microorganisms from cattle manure, food waste and paper waste, on the germination, growth and flowering of petunias in the greenhouse. Applied Soil Ecology, Amsterdam, v. 39, p. 91–99, 2008.
AZEEM, B.; KUSHAARI, K.; MAN, Z.B.; BASIT, A.; THANH, T.H. Review on materials and methods to produce controlled release coated urea fertilizer. Journal of controlled release, Amsterdam, v. 181, p. 11-21, 2014.

18
BROSCHAT, T.K.; MOORE, K.K. Release rates of ammonium-nitrogen, nitrate-nitrogen, phosphorus, potassium, magnesium, iron, and manganese from seven controlled-release fertilizers. Communications in Soil Science and Plant Analysis, New York, v. 38, p. 843-850, 2007.
CARSON, L.C.; OZORES-HAMPTON, M. Methods for determining nitrogen release from controlled-release fertilizers used for vegetable production. Horttechnology, Alexandria, v. 22, p. 20-24, 2012.
CARSON, L.C.; OZORES-HAMPTON, M. Factors affecting nutrient availability, placement, rate, and application timing of controlled-release fertilizers for Florida vegetable production using seepage irrigation. Horttechnology, Alexandria, v. 23, p. 553-562, 2013.
CONOVER, C.A.; POOLE, R.T. Light and fertilizer recommendations for production of acclimatized potted foliage plants. Journal Foliage Digest, Tehran, v. 7, n. 8, p. 1-6, 1984.
MARKETS AND MARKETS. Controlled-release fertilizers market by type (condensation products of urea, coated and encapsulated fertilizers, and N stabilizers), by crop type, and by geography: global trends and forecast to 2019. Disponível em: < http://www.reportlinker.com/p02414824-summary/Controlled-Fertilizers-Market-by-Type-Condensation-Products-of-Urea-Coated-Encapsulated-Fertilizers-N-Stabilizers-by-Crop-Type-by-Geography-Global-Trends-and-Forecast-to.html > Acesso: 27 out. 2015.
CURREY, C.J.; LOPEZ, R.G. Controlled-release fertilizer during cutting propagation affects growth and tissue nutrient concentrations and rooted cuttings of annual bedding plants. Hortscience, Alexandria, v. 49, p. 152-159, 2014.
DOLE, J.M.; GIBSON, J.L. Cutting propagation: a guide to propagating and producing floriculture crops. Batavia: Ball Publ., 2006. 385 p.
EL-AZIZ, N.G.A. Stimulatory effect of NPK fertilizer and benzyladenine on growth and chemical constituents of Codiaeum variegatum L. plant. American-Eurasian
Journal of Agricultural and Environmental Sciences, Deira, v. 2, p. 711-719, 2007.
GARCÍA-ALBARADO, J.C.; TREJO-TÉLLEZ, L.I.; VELÁSQUEZ-HERNÁNDEZ, M.A.; RUIZ-BELLO, A.; GÓMEZ-MERINO, F.C. 2010. Crecimiento de petunia en respuesta a diferentes proporciones de composta en substrato. Revista Chapingo. Serie Horticultura, Chapingo, v. 16, p. 107-113, 2010.
GILMAN, E.F. Codiaeum variegatum, Fact sheet, 1999. Disponível em: <http://hort.ifas.ufl.edu/database/documents/pdf/shrub_fact_sheets/codvara.pdf>. Acesso em: 06 set. 2015.

19
GRIESBACH, R.J. Petunia. In: ANDERSON, N.O. Flower breeding and genetics: Issues, challenges and opportunities for the 21st century. Dordrecht: Springer, 2006. p. 301–336.
HAMRICK, D. Ball redbook: crop production. 17th ed. Batavia: Ball Publ., 2003. v. 2, 724 p.
HANAFI, M.M.; ELTAIB, S.M.; AHMAD, M.B. Physical and chemical characteristics of controlled release fertilizer. European Polymer Journal, New York, v. 36, p. 2081-2088, 2000.
HEFFER, P.; PRUD'HOMME, M. Short-term fertilizer outlook 2014/2015. Marrakech: International Fertilizer Industry Association, 2014. 4 p.
HUETT, D.O.; GOGEL, B.J. Longevities and nitrogen, phosphorus, and potassium release patterns of polymer-coated controlled-release fertilizers at 30ºC and 40ºC. Communications in Soil Science and Plant Analysis, New York, v. 31, p. 959-973, 2000.
INSTITUTO BRASILEIRO DE FLORICULTURA. O mercado de flores no Brasil. Disponível em: <http://www.ibraflor.com/publicacoes/vw.php?cod=235>. Acesso: 19 ago. 2015.
JUNQUEIRA, A.H.; PEETZ, M.S. Balanço da floricultura brasileira em 2013. Jornal Entreposto. 2013. Disponível em: <http://www.hortica.com.br/artigos/2014/Balanco_Floricultura_2013.pdf>. Acesso em: 19 ago. 2015.
KANG, J.C.; IERSEL, M.W. van. Interactions between temperature and fertilizer concentration affect growth of sub irrigated petunias. Journal of Plant Nutrition, Monticello, v. 24, n. 4/5, p. 753-765, 2001.
KARAM, N.S.; MOHAMMAD, M.J.; JABR, M.Z. Fertilization through wastewater of croton (Codiaeum variegatum Blume) in zeolite containing substrates. Jordan Journal of Agricultural Sciences, Jordan, v. 5, p. 407-419, 2009.
KLOCK-MOORE, K.A.; BROSCHAT, T.K. Irrigation systems and fertilizer affect petunia growth. Horttechnology, Alexandria, v. 11, p. 553-562, 2001.
MAENE, L.M. Changing perception of fertilizer worldwide. In: NNUAL MEETING FERTILIZER INDUSTRY ROUND TABLE, 45., 1995, Raleigh. Proceedings… Raleigh: Fertilizer Industry Round Table, 1995. p. 37-45.
MAZHER, A.A.M.; ZAGHLOUL, S.M.; MAHMOUD, S.A.; SIAM, H.S. Stimulatory effect of kinetin, ascorbic acid and glutamic acid on growth and chemical constituents of Codiaeum variegatum L. plants. American-Eurasian Journal of Agricultural & Environmental Sciences, Deira, v. 10, n. 3, p. 318-323, 2011.
OWEN, J.S. Jr.; WARREN, S.L.; BILDERBACK, T.E.; ALBANO, J.P. 2008. Phosphorus rate, leaching fraction, and substrate influence on influent quantity,

20
effluent nutrient content, and response of a containerized woody ornamental crop. Hortscience, Alexandria, v. 43, n. 3, p. 906-912, 2008.
POOLE, R.T.; CONOVER, C.A. Fluoride and foliage. Apopka: University of Florida, Agricultural Research Center, 1976. 4 p. (Apopka Research Report, RH-76-2).
POOLE, R.T.; CONOVER, C.A. Fertilization of four indoor foliage plants with osmocote or nutricote. Journal of Environmental Horticulture, Washington, v. 7, p. 102-108, 1989.
RATHIER, T.M.; FRINK, C.R. Nitrate in runoff water from container grown Juniper and Alberta spruce under different irrigation and N fertilization regimes. Journal of environmental horticulture, Washington, v. 7, p. 32-35, 1989.
SANDROCK, D.R.; AZARENKO, A.N.; RIGHETTI, T.L. Fertilization of two container-grown woody ornamentals based on their specific nitrogen accumulation patterns. Hortscience, Alexandria, v. 40, p. 451-456, 2005.
SANTOS, K.M.; FISHER, P.R.; ARGO, W.R. A survey of water and fertilizer management during cutting propagation. Horttechnology, Alexandria, v. 18, p. 597–604, 2008.
SANTOS, K.M.; FISHER, P.R.; YEAGER, T.H.; SIMONNE, E.H.; CARTER, H.S.; ARGO, W.R. Effect of petunia stock plant nutritional status on fertilizer response during propagation. Journal of Plant Nutrition, New York, v. 34, p. 1424-1436, 2011.
SIMONNE, E.H.; HUTCHINSON, C.M. Controlled-release fertilizers for vegetable production in the era of best management practices: Teaching new tricks to an old dog. Horttechnology, Alexandria, v. 15, p. 36-46, 2005.
SGARBI, F.; SILVEIRA, R.V.A.; HIGASHI, E.N.; PAULA, T.A.; MOREIRA, A.; RIBEIRO, F.A. Influência da aplicação de fertilizante de liberação controlada na produção de mudas de um clone de Eucalyptusurophylla. In: SIMPÓSIO SOBRE FERTILIZAÇÃO E NUTRIÇÃO FLORESTAL, 2., 1999, Piracicaba. Anais... Piracicaba: IPEF; ESALQ, 1999. p. 120-125.
SHARMA, G.C. Controlled-release fertilizers and horticultural applications. Scientia Horticulturae, Amsterdam, v. 11, p. 107-129, 1979.
SHAVIV, A. Advances in controlled-release fertilizers. Advances in Agronomy, San Diego, v. 71, p. 1-49, 2001.
SHOJI, S.; GANDEZA, A.T. Controlled release fertilizers with polyolefin resin coating. Sendai: Konno Printing, 1992. 91 p.
SMITH, B.R.; FISHER, P.R.; ARGO, W.R. Growth and pigment content of container-grown impatiens and petunia in relation to root substrate pH and applied micronutrient concentration. Hortscience, Alexandria, v. 39, p. 1421-1425, 2004.

21
TRENKEL, M.E. Improving fertilizer use efficiency: controlled-release and stabilized fertilizer in agriculture. Paris: IFA, 1997. 153 p.
TRENKEL, M.E. Slow- and controlled-release and stabilized fertilizers: an option for enhancing nutrient use efficiency in agriculture. Paris: IFA, 2010. 160 p.
TRENKEL, M.E.; WICHMANN, W.; KUMMER, K.F. New challenges for the world fertilizer industry with regard to agriculture. Monte Carlo: IFA Agro-Economics Committee, 1988. 151 p.
XIANG, Y.; JI-YUN, J.; PING, H.E.; MING-ZAO, L. Recent advances on the technologies to increase fertilizer use efficiency. Agricultural Sciences in China, Beijing, v. 7, p. 469-479, 2008.
YOUNIS, A.; RIAZ, A.; WASSEM, M.; KHAN, M.A.; NADEEM, M. Production of quality croton (Codiaeum variegatum) plants by using different growing media. American-Eurasian Journal of Agricultural & Environmental Sciences, Deira, v. 7, p. 232-237, 2010.
ZHANG, W.; LI, X.; CHEN, F.; LU, J. Accumulation and distribution characteristics for nitrogen, phosphorus and potassium in different cultivars of Petunia hybrida Vlim. Scientia Horticulturae, Amsterdam, v. 141, p. 83-90, 2012.

22

23
2 EFFECTS OF CONTROLLED RELEASE FERTILIZERS ON CROTON GROWTH
AND NITROGEN LEACHING
Abstract The fertilizer management is an essential step in the production process, because it allow the plant to use as much of its productive capacity. Maximum improvement of nutrients use by plants and less loss to the environment were tested aiming to increase productivity with reduced environmental impacts. This study aimed to evaluate different sources and doses of controlled release fertilizer (CRF) on growth, nutrient uptake and efficiency of nutrients use by croton plants. The study was carried out during September, 2013 and February, 2014 in a greenhouse in Piracicaba, SP, Brazil. The experimental design used was the randomized block, with six treatments (two sources of CRF - Osmocote and Basacote, with two doses (1.5 and 3.0 g.L-1 of substrate), water soluble fertilizer (WSF) and control) and three replications. Croton plants were grown in plastic pots of 4L, containing substrate prepared with pine bark and doses of fertilizer previously added to the substrate at planting. It was used drip irrigation with clear water and nutrient solution recommended for the culture applied for WSF treatment. Plant growth (number of leaves, leaf area, stem height, root volume, shoot and root dry weight) and total nutrient content in tissues plants were evaluated every 30 days. Electrical conductivity, pH, nitrate, ammonium and total nitrogen concentration were measured in the leached solution. Based on the results CRFs at a low rate provided similar results for most of variables analyzed and plant visual compared to WSF. CRF maintained pH and EC within the recommended range for croton growth and lower nitrogen concentration in the leached solution compared with WSF. Keywords: Controlled release fertilizer; Nitrogen; Nutrient release; Ornamentals
2.1 Introduction
Croton (Codiaeum variegatum L.) is one of the most popular plants grown
indoor which belongs to the family Euphorbiaceae (GOVAERTS et al., 2000). It is a
tropical woody shrub to 4 m high, with simply leaves alternate, blade variously
shaped, usually 8-25 cm long, divided to the midrib, or twisted, variously motted with
red, purple, and yellow (WHISTLER, 2000). Croton plants have attained a prominent
place among foliage plants due to its adaptation to indoor conditions, leaf shape,
color range and specimen planting in the shaded landscape (WILSON et al., 2002).
Grown as a potted plant, foliage beauty fully depends of potting media and adequate
nutrition. Therefore, quantities of soluble fertilizers and/or controlled release fertilizer
(CRF) need to be applied in the substrate to planting media.
Fertilizers are added as a source of plant nutrients in the medium. There is
usually an improvement in plant growth and quality when appropriate fertilizers are
added, increasing fertilizer use efficiency and preventing nutrient losses to the

24
environment. One possible way to improve nutrient and particularly nitrogen use
efficiency while reducing the environmental hazards is by using controlled-release
fertilizers. Potential advantages of controlling nutrient supply depend mainly on two
factors: matching nutrient supply with plant demand and maintaining nutrient
availability (SHAVIV, 2001).
CRFs show the follow advantages: reduction of stress and specific toxicity,
particularly to seedlings, caused through high ionic concentrations, application of
substantially larger fertilizer dressings as compared to conventional soluble fertilizers,
and reducing such losses by leaching, nitrification, immobilization and volatilization.
Moreover, CRFs can meet the crop nutrient demand for the entire season through a
single application, reducing the demand for short-season manual labor (SHAVIV,
2001; TRENKEL, 2010).
Most CRFs used for container ornamentals are derived from polymer-coated
fertilizers, in which water soluble fertilizer granules are encapsulated by a polymer.
Release rates of nutrients from various coated fertilizers are positively correlated with
temperature and moisture status of the substrate (NELSON, 2012; SONNEVELD;
VOOGT, 2009), and response to environmental conditions depends on the
formulation of the coating materials, as polymeric material specific by each
manufacturer (CARSON; OZORES-HAMPTON, 2013).
CRFs are applied commonly before planting in container plant production
because of their long-term nutrient release. The use of polymer-coated CRFs in
ornamental container markets is most sensitive to the quality of the CRF and to its
release properties due to plants growing in confined volumes and under heavy
leaching conditions (SHAVIV, 2001; CONOVER; POOLE, 1992; HUETT; MORRIS,
1999). Through proper use of CRFs, both agronomic and environmental benefits may
be attained with CRF applications as compared to conventional fertilizers. The first
one can optimize the level of nutrient supply, release rate, and leaching fraction in
order to maintain high yield and reduce leaching losses (CONOVER; POOLE, 1992).
An effective assessment of the environmental impact of CRFs must be rely on
improved knowledge regarding nutrient release characteristics and mechanisms,
effects of environmental factors on the release, and plant nutrient demand under
different agricultural conditions (SHAVIV, 2001). Many types of CRFs and longevities
have been developed to meet the variable nutritional requirements of different plants

25
(HULME; BUCHHEIT, 2007), which depends on the crop and its production time,
total nutrient requirement, specific periods of peak demand (ANDIRU et al., 2013).
The controlled release of nutrients depends on temperature and moisture of
soil with the release rate increasing at higher temperatures with greater moisture
content. Because N is generally assumed to be the most important nutrient in coated
fertilizers, longevities of nutrient coated fertilizers are based primarily on the release
rate of N from these materials (BROSCHAT; MOORE, 2007). The type of coating is
responsible for the mechanism of release elements from encapsulated fertilizers,
which release mechanism is basically a nutrient transfer from the fertilizer–polymer
interface to the polymer–soil interface, by diffusion/swelling, degradation of the
polymer coating, and fracture or dissolution (SHAVIV, 2001).
Due to physical and chemical properties of substrates and nutrient
requirements, it is necessary to calibrate fertilizer sources and rates for different
species. Several studies concerning the effect of NPK fertilization to the croton plant
have been conducted (KARAM et al., 2009; MOHAMMAD et al., 2004; CONOVER;
POOLE, 1983). However, most of these studies were relatively short term. In this
study, nutrient release patterns of two types of CRFs were compared to water-soluble
fertilizer on croton production and nitrogen leaching.
2.2 Materials and Methods
The experiment was conducted at the University of Sao Paulo, Crop Science
Department, in Piracicaba, Sao Paulo State, Brazil, from Sept. 2013 to Feb. 2014.
The greenhouse has 192 m2 of ground area, with screen on the walls, diffusive
plastic film cover and thermo-reflective shading screen disposed internally.
Greenhouse was controlled by an environmental control system with sensors
connected to a datalogger (Campbell CR10), which recorded air temperature (oC)
and relative humidity (%) every hour (Figure 1).

26
Figure 1 - Daily means of air temperature (
oC) and relative humidity (%) in the greenhouse according
to environmental control system data. Lines represent data obtained by averaging environmental measurements each hour
Rooted cuttings of croton 'Petra' from Van Noije Ornamentals were
transplanted into 4L containers filled with pine bark (Basaplant Ornamentals, SP,
Brazil) that contained a small pre-plant charge, which chemical characteristics are:
pH 5.8, nitrogen total 0.55%, phosphorus 0.27%, potassium 0.62%, calcium 0.80%,
0.14% magnesium, 0.14% sulfur. The experiment was a randomized block design
with three replicates and five treatments and control. The treatments included two
sources of controlled release fertilizer at rates of 1.5 and 3.0 g per liter of substrate,
compared to water soluble fertilizer (WSF). Each plot had 14 plants. Fertilizers used
were Osmocote Plus 15-09-12 and Basacote 15-08-12, both products with longevity
between 5 and 6 months. The following soluble fertilizers were used to prepare 1000
L of solution: calcium nitrate (375 g), potassium nitrate (342.5 g), mono-ammonium
phosphate (126.92 g), ammonium nitrate (105.12 g) and magnesium sulfate (61.3 g).
The CRFs were incorporated into the substrate with a measured dose per container
before planting.
Plants were drip irrigated, using moisture-sensor (Irrigation controler-MRI)
based control with starting voltage limit irrigation of 4 kPa. For treatment with WSF,
plants received just nutrient solution. Drained solution samples were collected to
measure pH, electrical conductivity (EC), nitrate and ammonium concentrations each
10 days, for two randomly selected replicate pots per treatment on each block. The
10
15
20
25
30
30
40
50
60
70
80
90
100
20/08/2013 20/09/2013 20/10/2013 20/11/2013 20/12/2013 20/01/2014
URmed (%) Tmed (°C)

27
amount of 300 ml of clear water was applied per container to get between 100 and
200 ml of solution that were filtrated through filter paper no42. Aliquots of 50 ml were
kept in tubes with sulfuric acid (1%, v/v) at -10ºC for no more than 60 days until
analysis.
The concentrations of NO3-N and NH4-N were determined using Flow Injection
Analysis System (FIA) (RUZICKA; HANSEN, 1981) by the Center for Nuclear Energy
in Agriculture, University of Sao Paulo. Ammonium was analyzed by condutivimetry
with sodium hydroxide (SOLÓRZANO, 1969) and nitrate by colorimetry after reaction
with sulfanilamide and N-naftil (GINÉ-ROSIAS, 1979).
Every 30 days, two plants per plot were destructively sampled to measure
number of leaves, stem height, leaf area (Leaf area meter LI-3100), root volume
(BOSA et al., 2003), shoot and root dry weight and tissue nutrient content. Total
nutrient content in oven-dried ground plant tissue of croton was analyzed according
to Malavolta et al. (1997) methodology. Nutrient uptake was calculated from plant
tissue, multiplying the concentration of nutrients by dry weight of shoots, roots and
total plant. Plants were harvested 150 DAT, according to the marketing standards set
by Veiling system, Holambra, Sao Paulo State.
At the end of the experiment (five months after transplanting), five plants per
plot from each treatment was graded visually based on a scale of 1-4, where 1=
plants with prominent green color and opaque leaves; 2= plants with multicolor and
some dark purple leaves, and low bright; 3 = plants with multicolor leaves, and low
bright; and 4 = plants with multicolor leaves and prominent orange shades, and
bright.
Data were subject to analysis of variance using Proc GLM in SAS (Version
9.3; SAS Institute, Cary, NC). Means were analyzed using Tukey’s honestly
significant difference test at α=0.05. Leachate solution measurements (pH, EC,
nitrate, ammonium, and nitrogen concentration) were analyzed over the time using
ANOVA.
2.3 Results and Discussion
Growth during the production phase: There was interaction between
fertilizers and growth periods to the number of leaves (p<0.0001), leaf area
(p<0.0001), stem height (p=0.0078), root volume (p=0.048), and shoot dry weight
(p=0.0034), with the exception of root dry weight, which was affected only by growth

28
period (Table 1). During growth period croton plants showed statistical difference
between treatments after 90 days of transplant. Before that, variables increased just
over time. At the end of experiment, significant differences were found among
treatments on the vegetative growth (Figure 2).
Table 1 - Mean values of number of leaves, leaf area, stem height, root volume, shoot and root dry weight of croton plants grown in containers affected by different rates and types of fertilizers
Number of leaves
Leaf area Stem height
Root volume
Shoot dry weight
Root dry weight
Main Factors
cm2 cm cm3 g g
Fertilizers (F)
Control 12.26 584.21 12.31 29.78 5.99 2.71
WSF 16.83 1014.57 15.35 38.71 8.52 3.10
OSM 1.5g 15.23 832.40 12.86 32.07 6.83 2.85
OSM 3.0g 14.97 854.71 12.78 29.31 6.91 2.51
BAS 1.5g 15.03 774.80 13.15 32.50 6.25 2.91
BAS 3.0g 14.03 712.41 11.30 24.83 5.57 2.04
Growth Period (P) 30 8.25 401.84 8.75 16.97 3.28 1.55
60 11.83 571.30 10.34 29.98 4.50 1.93
90 15.03 770.44 12.51 30.22 6.15 2.63
120 17.03 876.34 14.61 33.78 7.26 3.15
150 21.50 1357.66 18.58 45.05 11.30 4.18
Interaction effects F x P a * ** ** * * ns
CV (%) 16.82 22.65 15.37 23.46 19.53 24.92
LSD 2.38 164.68 1.73 5.82 1.01 0.53 a ns, *, ** No significant or significant at P≥ 0.05, and 0.01, respectively.

29
Figure 2 - Effects of different fertilizer treatments on the number of leaves (a), leaf area (b), stem
height (c), root volume (d), shoot (e) and root dry weight (f) due to growing period subjected to different fertilizer treatments
The highest values for number of leaves and leaf area occurred with WSF and
low rate of OSM compared to the other treatments and control. It was observed that
leaf size was 18.7% and 73% higher with WSF than Osmocote and control,
respectively. Stem height and shoot dry weight were higher for plants receiving WSF,
OSM, and low rate of BAS, compared with high rate of BAS and control. The highest
root volume occurred for treatment with WSF, which resulted in larger roots
compared to other treatments. Root dry weight was statistically different just over
time, whereas weight increased 4.18 g by the end of growth period (Table 1). In
comparison to soluble fertilizer, the CRFs showed similar results on the croton growth
even at rates up to 3 g L-1. It implies advantages for CRFs placed in the substrate
compared to WSF because CRFs reduced the impact of nitrogen leaching. One

30
possible explanation for the growth response observed in this study may be related
to the source of N applied and fertilization management. The nutrients from WSF are
readily available and applied with high frequency to the ornamental plants produced
in pots. For CRFs, the nutrient releases depend on the fertilizer characteristics, rate
of application and environment conditions as temperature and soil humidity (SGARBI
et al., 1999; SHAVIV, 2007; SONMEVELD; VOOGT, 2009; NELSON, 2012).
According to plant visual grades, the best treatments were WSF (note 4) and
Basacote (note 4) fertilizer at low rate (1.5 g/pot), where plants showed multicolor
leaves with prominent orange shades and bright leaves (Figure 3). Plants treated
with higher level of Basacote (note 3) or Osmocote (note 2) had multicolor and some
dark purple leaves, but low bright. Similar results were found for Raese et al. (2007),
which have shown that increasing N rates resulted in darker green color of leaves.
Plants without fertilization showed opaque and prominent green color leaves (note 1),
and did not have uniform shape. In commercial foliage plant production, the ratings of
2 and 3 are generally considered to be of good quality by consumers for croton with
leaf variegation.
Figure 3 - Effects of different fertilizer treatments on color leaves at the end of growing period
subjected to different fertilizer treatments. White number of each photo represent graded visually scale notes.
Control OSM 1.5 g OSM 3.0 g
WSF BAS 1.5 g BAS 3.0 g
1
3 44
4
2 3

31
Nutrient levels: The treatments with high rates of CRFs and WSF provided highest N
concentrations compared to low rates and control (Table 2). The shoot N
concentrations increased 17 and 28% for OSM and BAS, respectively, when
increasing the CRF fertilization from 1.5g.L-1 to 3.0g.L-1. As well as the shoots, the
root N concentrations increased 22.4% for WSF, 24% for OSM, and 26% for BAS
when fertilized with high rate compared with low rates and without fertilizer (control).
Nutrient concentration in leaf tissue of croton plants did not show differential
responses to P, K, Ca, Mg, and S concentration during the five-month evaluation
period, which averages were 3.9, 4.85, 14.8, 5.6, and 2.1 g.kg-1, respectively. The
values obtained for P, Ca, Mg and S in the shoots were in accordance with
concentrations recommended by Mills and Jones Jr. (1996), which suggested
sufficiency range of nutrients in mature leaves of croton. However, N and K
concentrations were lower than the values obtained for these authors, although
nutrient deficiencies were not observed in the leaves. Interestingly, P and K
concentrations increased with WSF in the roots, while Mg concentration in the roots
decreased with WSF as compared to the other treatments and control. Studies show
that high concentrations of one of them (K and Mg) inhibits absorption of another,
whereas this antagonism is more intense from K relative to Mg (Epstein and Bloom,
2006). The Ca concentrations were not affected by types and rates of fertilizers in the
roots as in the shoots. However, calcium was absorbed in higher quantities by the
plants compared with other nutrients, both in the shoots and roots, due to the high
requirement of this element by plants of the family euphorbiaceae, as described in
other research’s (LAVIOLA; DIAS, 2008; AUGUSTO et al., 2003). Sulfur was higher
for OSM and BAS in high rates, which differ from the treatments with WSF and
control.
There was interaction between the treatments and growth period for N, P, K,
Ca, Mg, and S uptakes in the shoots (Table 3). Except to N, the other nutrient
uptakes did not change with treatments until 60 DAT (Figure 4). For N uptake, WSF
and high rate of CRFs were similar between them and higher than control. At 90
DAT, N uptake was higher for WSF than BAS and control. However, for the other
nutrients, the results differed between treatments. For N and K uptakes, at 120 DAT,
WSF was similar high rate of OSM and higher than other treatments and control. P
uptake was higher with WSF than to the other treatments and control. Ca, Mg and S
uptake showed similar results than N and K, but the highest treatments did not differ

32
than low rate of OSM. At 150 DAT, WSF increased the nutrient uptakes as compared
to the other treatments, except to Ca. Ca uptake was higher with WSF and high rate
of OSM as compared to BAS and control.

33
Table 2 - Average of nutrient concentrations in croton plants during the growth period affected by different rates and types of fertilizers
Treatments Concentration of nutrients on the plants (g kg-1) a
N P K Ca Mg S
Shoot Root Shoot Root Shoot Root Shoot Root Shoot Root Shoot Root
Control 8.26 d 6.10 c 3.70 a 2.14 b 4.63 a 4.50 b 13.25 a 12.78 a 5.24 a 8.40 a 1.82 a 2.14 b
WSF 13.61 ab 8.77 ab 4.71 a 3.02 a 5.04 a 6.39 a 14.69 a 11.72 a 5.40 a 6.42 b 2.12 a 2.16 b
OSM 1.5g 11.34 bc 7.14 bc 3.58 a 1.57 b 4.87 a 5.07 b 14.77 a 15.41 a 5.81 a 7.58 ab 2.03 a 2.23 ab
OSM 3.0g 13.30 abc 8.87 ab 4.00 a 1.77 b 4.70 a 5.00 b 15.82 a 14.64 a 5.84 a 7.27 ab 2.28 a 2.59 a
BAS 1.5g 11.18 c 7.17 bc 3.15 a 1.77 b 4.93 a 5.15 b 14.69 a 14.38 a 5.59 a 7.63 ab 1.97 a 2.45 ab
BAS 3.0g 14.31 a 9.04 a 4.28 a 1.72 b 4.92 a 4.98 b 15.63 a 12.34 a 6.05 a 7.15 ab 2.36 a 2.60 a
Test F ** ** ns ** ns * ns ns ns ns ns ns
CV (%) 6.94 7.89 16.37 12.54 4.59 7.29 6.82 10.89 8.98 7.29 12.81 6.23
LSD 2.36 0.98 1.81 0.40 0.63 0.60 2.87 2.33 1.44 0.85 0.76 0.23 a Values represent the average of six replications.
b ns, *, ** No significant or significant at P≥ 0.05, and 0.01, respectively.

34
Table 3 - Uptake of nitrogen (N), phosphorus (P), potassium (K), calcium (Ca), magnesium (Mg) and sulfur (S) uptake by shoot and root of croton plants grown in containers affected by different levels and types of fertilizers
Main Factors N P K Ca Mg S
Shoot Root Total Shoot Root Total Shoot Root Total Shoot Root Total Shoot Root Total Shoot Root Total
Fertilizers (F) mg plant-1
Control 42.94 15.91 65.34 19.88 5.20 28.70 24.31 11.23 40.43 71.15 35.35 119.76 27.76 22.96 55.56 9.49 5.39 16.46
WSF 125.16 27.06 152.21 40.42 9.42 49.85 44.56 19.88 64.44 131.56 36.90 168.47 46.08 19.22 65.31 18.68 6.39 25.08
OSM 1.5g 80.08 20.03 100.12 24.56 3.79 28.36 34.32 13.82 48.15 106.29 45.47 151.77 40.91 21.96 62.87 13.98 5.98 19.97
OSM 3.0g 92.94 21.09 114.07 28.03 3.79 31.83 33.53 12.26 45.79 110.86 38.04 148.90 40.56 18.92 59.48 15.19 5.74 20.97
BAS 1.5g 72.87 20.83 93.71 19.58 4.82 24.40 31.18 14.42 45.60 95.19 43.33 138.52 36.05 22.50 58.56 12.58 6.51 19.41
BAS 3.0g 82.59 18.20 100.80 24.31 3.31 27.62 27.56 9.78 37.34 88.06 24.75 112.81 34.11 14.33 48.44 13.02 4.93 17.96
Growth Period (P)
30 29.85 12.78 42.63 10.59 4.17 14.76 13.10 8.64 21.75 40.66 19.13 59.79 16.62 10.58 27.20 6.73 4.38 11.12
60 54.24 14.98 69.22 16.74 4.41 21.15 22.45 10.75 33.20 62.23 27.37 89.60 24.64 15.08 39.72 8.84 5.06 13.84
90 78.12 20.55 98.67 26.23 4.58 30.81 31.48 14.80 46.28 95.71 34.92 130.63 35.51 19.74 55.25 13.16 6.07 19.59
120 97.44 22.71 125.55 31.96 5.23 40.21 37.96 15.13 57.16 116.47 45.35 172.87 43.56 23.83 71.43 15.67 6.17 23.15
150 154.21 31.59 185.80 45.12 6.90 52.02 57.91 18.49 76.40 187.53 59.77 247.30 67.57 30.68 98.25 24.72 7.44 32.17
Interaction effects
F x P a ** * ** ** ** ** ** ** ** ** ns ** ** ns ns ** ns **
CV (%) 14.08 16.74 17.24 25.07 28.21 29.76 15.82 20.95 22.95 14.90 24.97 23.16 19.27 19.53 20.98 19.47 20.20 20.94
LSD 21.07 2.43 15.64 11.44 1.24 13.83 8.68 2.38 9.66 19.00 11.86 25.21 9.34 4.65 9.26 3.88 0.85 2.96
a ns, *, ** No significant or significant at p≥ 0.05, and 0.01, respectively

35
Figure 4 - Effects of different fertilizer treatments on nitrogen (N), phosphorus (P), potassium (K),
calcium (Ca), magnesium (Mg) and sulfur uptake on the shoots due to growing period subjected to different fertilizer treatments
Nutrient uptakes in the roots were affected by treatments and growth period
after 60 DAT for P, 90 DAT for N, K, Mg and S, and 120 DAT for Ca (Table 3). N
uptake at 120 DAT was higher with WSF as compared to BAS at high rate and
control, and did not differ of OSM and low rate of BAS (Figure 5). At the end of
growth period, N uptake was higher with WSF than other treatments. P and K
uptakes, from 120 DAT, were higher with WSF than CRF and control. Treatments did
not affect Ca absorption during growth period, except BAS at high rate from 120 DAT
to 150 DAT. Mg was higher with CRFs than without fertilizer, while CRF treatments
resulted in lower S uptake at the same period compared with WSF.

36
Figure 5 - Effects of different fertilizer treatments on nitrogen (N), phosphorus (P), potassium (K),
calcium (Ca), magnesium (Mg) and sulfur uptake on the roots due to growing period subjected to different fertilizer treatments
37
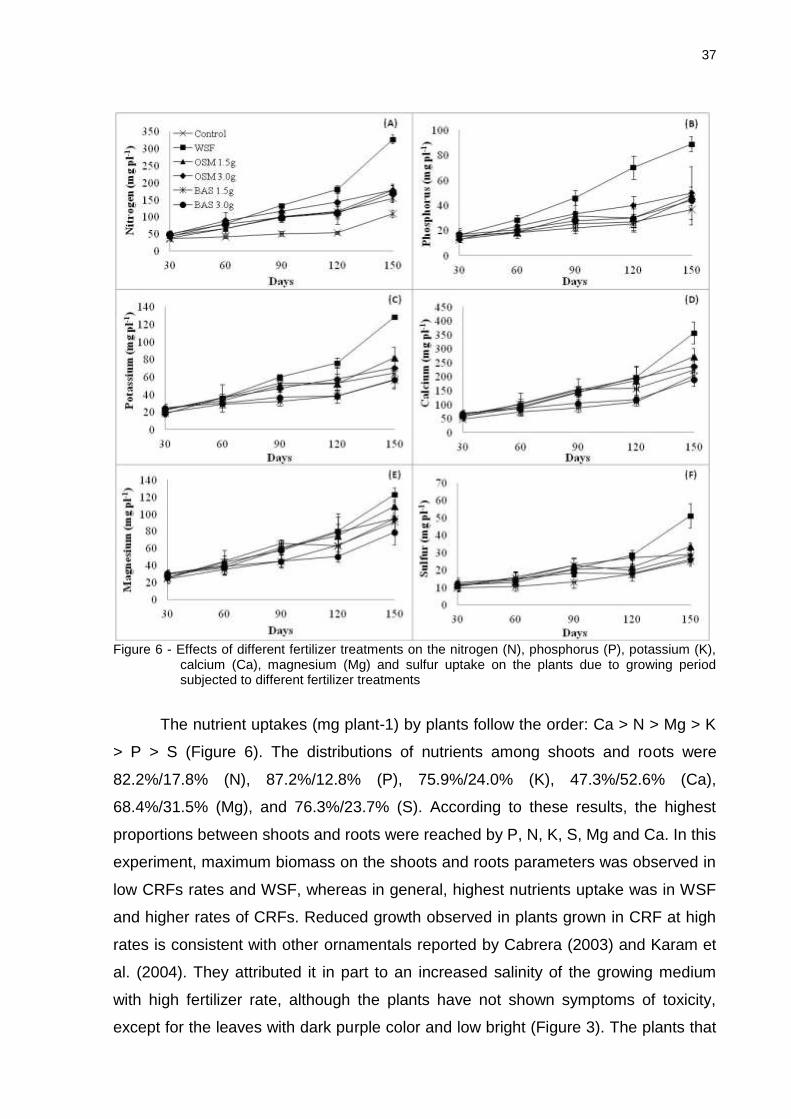
Figure 6 - Effects of different fertilizer treatments on the nitrogen (N), phosphorus (P), potassium (K),
calcium (Ca), magnesium (Mg) and sulfur uptake on the plants due to growing period subjected to different fertilizer treatments
The nutrient uptakes (mg plant-1) by plants follow the order: Ca > N > Mg > K
> P > S (Figure 6). The distributions of nutrients among shoots and roots were
82.2%/17.8% (N), 87.2%/12.8% (P), 75.9%/24.0% (K), 47.3%/52.6% (Ca),
68.4%/31.5% (Mg), and 76.3%/23.7% (S). According to these results, the highest
proportions between shoots and roots were reached by P, N, K, S, Mg and Ca. In this
experiment, maximum biomass on the shoots and roots parameters was observed in
low CRFs rates and WSF, whereas in general, highest nutrients uptake was in WSF
and higher rates of CRFs. Reduced growth observed in plants grown in CRF at high
rates is consistent with other ornamentals reported by Cabrera (2003) and Karam et
al. (2004). They attributed it in part to an increased salinity of the growing medium
with high fertilizer rate, although the plants have not shown symptoms of toxicity,
except for the leaves with dark purple color and low bright (Figure 3). The plants that

38
have absorbed in larger quantities the fertilizer applied at high rates of CRFs
probably complies with luxury absorption described by Malavolta (2006), which
describes a possible absorption after the critical level of the crop and above the level
of toxicity.
Nutrient release: Leached solution from the containers collected each 10 days was
significantly affected by fertilizer treatments for substrate pH and EC (Figure 7).
Substrate-pH level for WSF was lower than substrate-pH for all other treatments.
Most pH levels were in the range of 5.5 and 7.0, and the lowest substrate-pH
occurred was 3.82 at 135 days for WSF, which did not affect plant production as
showed on figure 2. The CRFs substrate-EC kept between 0.5-2.0 dS m-1.
Recommended levels of EC when using the PourThru technique for container-grown
plants in pine bark substrate fertilized with only a CRF should range from 0.2 to 0.5
dSm–1 (SOUTHERN NURSERY ASSOCIATION, 2007), which is lower than obtained
in this experiment. The WSF treatment was also significantly higher than with other
treatments. From 75 DAT to the end of the study, leached EC gradually increased to
4.26 S m-1, that was above the EC levels recommended, because high leachate EC
levels is consider detrimental to the health for wood ornamentals.

39
Figure 7 - Electrical conductivity (EC) and pH values of drained solution from container due to growing
period subjected to different fertilizer treatments
Nitrogen leaching response in all fertilizer treatments studied is shown in figure
8. A greater proportion of N in the leached solution was in nitrate form, regardless of
the fertilizer. NO3- losses were significantly higher with WSF (1121.82 mg L-1)
compared to the other treatments, which loss was lower than 200 mg L-1 throughout
the entire period. For all CRFs, leachate NO3-N was highest during the first 20 days,
than decreased less than 100 mg L-1 for the remainder of the experimental period.
Other differences in leachate nitrate concentrations were found during the last half of
the study, increasing after 70 DAT for high rates of OSM and BAS. Like NO3-, most of
the NH4-N losses were produced at the beginning of the experiment (before 20 DAT),

40
although all treatments leached only small amounts over the experimental period.
CRFs in a high rate leached higher amount of NH4-N compared with low rates, WSF,
and control. More specifically, at the beginning of the experiment, OSM released
125.97 mg L-1 and BAS 75.22 mg L-1, compared with WSF (35.47 mgL-1). The results
are in agreement with those reported by Fernández-Escobar et al. (2004) and
Newman et al. (2006), which reported NH4-N values near to zero, much lower than
nitrate form in the leached solution.
Total cumulative N leaching per pot was highest with WSF, followed by OSM
and BAS in a high rate, although CRFs regardless of rates did not produced
significantly N losses (Figure 9). Nitrate losses for WSF was 76.95% of the total
applied, whereas CRFs leached no more than 10%. Throughout the experiment, as
expected, measured N release from the control treatment was close to zero. NH4+
represented just 5% of total nitrogen collected from the containers. Therefore,
nitrogen lost from the leachate solution was primarily in the nitrate form.

41
Figure 8 - Amounts of nitrate, ammonium and total nitrogen leached from containers due to growing period subjected to different fertilizer treatments

42
Figure 9 - Percentage ratio of nitrate (a), ammonium (b) and total nitrogen (c) leached accumulated from containers and nitrogen applied per treatment due to growing period subjected to different fertilizer treatments

43
2.4 Conclusions
Controlled release fertilizer showed to be as effective as WSF for
growth of croton during the study period. Osmocote and WSF provided similar results
for most of variables analyzed during the growth period, while Basacote used as a
source of nutrients resulted in better plant visual together WSF. Controlled release
fertilizers applied at a low rate provided better results for growth.
The use of controlled release fertilizer maintained pH and EC within the
optimum range for croton growth compared with WSF, and CRF resulted in
significantly lower nitrogen concentration in the leached solution compared with WSF,
reducing such losses by leaching.
Thus, both controlled release fertilizers tested would be recommended
for croton production. Other CRF products can be tested for longer periods of
evaluation, in order to keep the plants for a longer period in the greenhouse for sale.
References
ANDIRU, G.A.; PASIAN, C.C.; FRANTZ, J.M.; JOURDAN, P. Longevity of controlled-release fertilizer influences the growth of bedding Impatiens. Horttechnology, Alexandria, v. 23, n. 2, p. 157-164, 2013.
AUGUSTO, D.C.C.; GUERRINI, I.A.; ENGEL, V.L.; ROUSSEAU, G.X. Utilização de esgotos domésticos tratados através de um sistema biológico na produção de mudas de Croton floribundus Spreng. (Capixingui) e Copaifera langsdorffii Desf. (Copaíba). Revista Árvore, Viçosa, v. 27, n. 3, p. 335-342, 2003.
BOSA, N.; CALVETE, E.O.; NIENOW, A.A.; SUZIN, M. 2003. Enraizamento e aclimatização de plantas micropropagadas de gipsofila. Horticultura Brasileira, Brasília, v. 21, n. 2, p. 207-210, 2003.
BROSCHAT, T.K. Rates of ammonium-nitrogen, nitrate-nitrogen, phosphorus, and potassium from two controlled-release fertilizers under different substrate environments. Horttechnology, Alexandria, v. 15, p. 332-335, 2005.
BROSCHAT, T.K.; MOORE, K.K. Release rates of ammonium-nitrogen, nitrate-nitrogen, phosphorus, potassium, magnesium, iron, and manganese from seven controlled-release fertilizers. Communications in Soil Science and Plant Analysis, New York, v. 38, p. 843-850, 2007.
CABRERA, R.I. Nitrogen balance for two container-grown woody ornamental plants. Scientia Horticulturae, Amsterdam, v. 97, p. 297-308, 2003.
CONOVER, C.A.; POOLE, R.T. Influence of shade and fertilizer levels on yield of croton stock plants. Proceedings of the Florida State Horticultural Society, Crystal River, v. 96, p. 261-263, 1983.

44
CONOVER, C.A.; POOLE, R.T. Water utilization of six foliage plants under two interior light intensities. Journal of Environmental Horticulture, Washington, v. 10, p. 111-113, 1992.
FERNÁNDEZ-ESCOBAR, R.; BENLLOCH, M.; HERRERA, E.; GARCÍA-NOVELO, J.M. Effect of traditional and slow-release N fertilizers on growth of olive nursery plants and N losses by leaching. Scientia Horticulturae, Amsterdam, v. 101, p. 39-49, 2004.
FISHER, P.R.; DICKSON, R.W.; MOHAMMAD-POUR, G.S.; HUANG, J. Effect of solution electrical conductivity (EC) and pre-plant nutrient form on the ph of a peat-perlite substrate. Acta Horticulturae, Korbeek, n. 1034, p. 249-254, 2014.
GINÉ-ROSIAS, M.F.G. Determinação simultânea de nitrato e nitrito em águas e solos por injeção em fluxo contínuo. 1979. 70 p. Dissertação (Mestrado em Ciências) - Centro de Energia Nuclear na Agricultura, Universidade de São Paulo, Piracicaba, 1979.
GOVAERTS, R.; FRODIN, D. G.; RADCLIFFE-SMITH, A. World checklist and bibliography of Euphorbiaceae. Kew: Royal Botanic Gardens, 2000. 4 v.
HUETT, D.O.; MORRIS, S.C. Fertilizer use efficiency by containerized nursery plants. III. Effect of heavy leaching and damaged fertilizer prills on plant growth, nutrient uptake, and nutrient loss. Australian Journal Agriculture Research, Collingwood, v. 50, p. 217-222, 1999.
HULME, F.; BUCHHEIT, C. The value in osmocote controlled release technology. Marysville: The Scotts Exchange Tech Shares; The Scotts Company, 2007. 5 p.
KARAM, N.S.; MOHAMMAD, M.J.; JABR, M.Z. Fertilization through wastewater of croton (Codiaeum variegatum Blume) in zeolite- containing substrates. Jordan Journal of Agricultural Sciences, Amman, v. 5, p. 407-419, 2009.
LAVIOLA, B.G.; DIAS, L.A.S. Teor e acúmulo de nutrientes em folhas e frutos de pinhão-manso. Revista Brasileira de Ciência do Solo, Viçosa, v. 32, p. 1969-1975, 2008.
MALAVOLTA, E.; VITTI, G.C.; OLIVEIRA, S.A. Avaliação do estado nutricional das plantas: princípios e aplicações. 2. ed. Piracicaba: POTAFOS, 1997. 319 p.
MATTSON, N. What’s your fertilizer cost? Growers talk magazine. Batavia: Ball Publ., 2010. 6 p.
MILLS, H.A.; JONES JR., J.B. Plant analysis handbook II: a practical sampling, preparation, analysis, and interpretation guide. Athens, 1996. 213 p.
MOHAMMAD, M.J.; KARAM, N.S.; AL-LATAIFEH, N.K. Response of croton grown in a zeolite-containing substrate to different concentrations of fertilizer solution.

45
Communications in Soil Science and Plant Analysis, New York, v. 35, p. 2283-2297, 2004.
NELSON, P.V. Greenhouse operations and management. 7th ed. Upper Saddle River: Prentice Hall, 2012. 612 p.
NEWMAN, J.P.; ALBANO, J.P.; MERHAUT, D.J.; BLYTHE, E.K. Nutrient release from controlled-release fertilizer in a neutral pH substrate in an outdoor environment: I. Leachate electrical conductivity, pH, and nitrogen, phosphorus, and potassium concentrations. Hortscience, Alexandria, v. 41, p. 1674-1682, 2006.
RAESE, J.T.; DRAKE, S.R.; CURRY, E.A. Nitrogen fertilizer influences fruit quality, soil nutrients, and cover crops, leaf color and nitrogen content, biennial bearing and cold hardiness of 'Golden Delicious'. Journal of Plant Nutrition, Monticello, v. 30, p. 1585-1604, 2007.
RUZICKA, J.; HANSEN, E.H. Flow injection analysis. New York: Wiley Interscience, 1981. 395 p.
SHAVIV, A. Advances in controlled-release fertilizers. Advances in Agronomy, San Diego, v. 71, p. 1-49, 2001.
SOLÓRZANO, L. Determination of ammonia in natural water by the phenol-hypochlorite method. Limnology and Oceanography, Grafton, v. 14, p. 799-801, 1969.
SONNEVELD, C.; VOOGT W. Plant nutrition of greenhouse crops. Dordrecht: Springer, 2009. 423 p.
TRENKEL, M.E. Slow and controlled release and stabilized fertilizers: an option for enhancing nutrient efficiency in agriculture. 2nd ed. Paris: IFA, 2010. 160 p.
WHISTLER, W.A. Tropical ornamental: a guide. Oregon: Timber Press, 2000. 542 p.

46

47
3 STRATEGIES TO PROVIDE FERTILIZER FOR BOTH PRODUCTION AND
CONSUMER PHASES OF PETUNIA
Abstract The effects of fertilization management strategies using soluble fertilizers and controlled release fertilizers (CRFs) were studied on biomass of petunia (Petunia × hybrida), and N leaching. Strategies included a Dual Coated Technology (DCT) controlled release fertilizer (CRF) with a second coating that delayed initial nutrient release, compared with Osmocote (OSM) (a conventional single-coated CRF), and water soluble fertilizer (WSF). Rooted cuttings of petunia were grown for 42 days in 2.84 L containers (the “production phase”) with WSF only, a low rate of combined WSF and OSM, or low and high label rates of WSF and OSM top-dressed (WSF+OSM TD), WSF and DCT (WSF+DCT), OSM, or a commercial blend of OSM and DCT (OSM + DCT). By the end of production phase after 42 days, all fertilizer strategies tested produced horticulturally acceptable plants in terms of chlorophyll index and number of flowers. In a subsequent "consumer phase", plants were maintained in containers or were transplanted into a landscape and irrigated with clear water for 98 days. Plant performance (number of flowers, SPAD chlorophyll index, dry weight, and tissue nitrogen level) was greater during the consumer phase in treatments with high rates of CRF compare with WSF only, or lower rates of CRF. Based on nutrient release in a sand substrate without plants at 10, 21 or 32 oC, the DCT had delayed nutrient release compared with single-coated CRF. The release rates of all CRF products, and the duration of the delay in release from DCT were temperature-dependent. These results emphasize the importance of considering temperature on the longevity of product. A partial budget found that the lowest cost treatment was WSF only at $0.02/container. Comparing at high rates, using WSF+DCT ($0.085) was more expensive than incorporated OSM ($0.05), and had a similar cost to WSF+OSM TD ($0.084). The greatly improved consumer performance for plants with residual fertilizer compared with WSF provides an opportunity to add value and profitability with a slightly higher sales price. Several fertilizer strategies are available depending on material and labor cost and availability, and preferred crop management style. Keywords: Controlled release fertilizer; Nitrogen; Nutrient release; Petunia × hybrid;
Temperature
3.1 Introduction
Providing residual fertilizer to containerized floriculture products in order
to improve post-production (consumer) performance is a means to add value and
differentiate product quality. Water soluble fertilizers (WSFs, or fertigation) and
controlled release fertilizers (CRFs) are widely used for production of container crops.
Using CRFs instead of WSF are recommended to the landscape service industry as
a best management practice to provide nutrients for an extended period (ANDIRU et
al., 2013; CHEN et al., 2011). Controlled release fertilizers include urea, ammonium

48
nitrate, potassium nitrate, or other soluble fertilizer materials coated with a polymer,
resin, sulfur, or a hybrid of sulfur-coated urea coated with a polymer or resin.
Polymer-coated materials release nutrients primarily based on the temperature and
moisture status of the substrate (SONNEVELD; VOOGT, 2009). Many studies have
demonstrated that CRFs have potential to reduce nitrogen and phosphorus runoff as
compared with fertigation (WILSON; ALBANO, 2011; WU et al., 2008). The use of
CRFs alone do not provide a complete solution to the problem of nutrient leaching,
however, and appropriate fertilizer application methods, CRF types, and irrigation
strategies must be calibrated to match crop needs and the local environment
(BROSCHAT; MOORE, 2007).
Both growth chamber and greenhouse methods have been used to
compare how CRFs will act in a particular controlled environment (BROSCHAT;
MOORE, 2007; CARSON; OZORES-HAMPTON, 2012). Field methods are also used
to measure nitrogen (N) release in commercial vegetable soil conditions
(BIRRENKOTT et al., 2005; SIMONNE; HUTCHINSON, 2005). The CRF response
profile under controlled laboratory conditions can be combined with substrate
extraction methods in the field to quantify release characteristics of CRFs for different
crops and locations (BIRRENKOTT et al., 2005).
A range of fertilizer strategies are available to provide nutrients during
production and consumer phases. Containers may be produced with WSF and then
top-dressed with CRF prior to sale. A CRF may alternatively be incorporated or top-
dressed at planting with a longevity that exceeds the production time, so that residual
nutrient reserves remain for the consumer. A technology termed Dual Coated
Technology (DCT, ProtectTM, Everris, The Netherlands) has a second outer coating
over an Osmocote Exact TM CRF prill, which according to the manufacturer delays the
initial nutrient release for 1.5 to 2 months depending on temperature. For the
purposes of clarity in this article, we will use OSM to refer to a single-coated
technology (OsmocoteTM), to differentiate from DCT. A blended product of OSM and
DCT (Hi-EndTM) will be referred to as OSM+DCT, and both OSM and DCT will be
referred to as types of CRF.
The objective of this study was to compare nutrient release, plant
performance, and cost for strategies that potentially provide adequate nutrition during
both the production and consumer phases for container-grown floricultural plants.
Unless indicated as top-dressed (TD), all CRF treatments were incorporated into the

49
growing substrate prior to planting. Fertilizer strategies included WSF only, a
combination of low rates of WSF during production plus OSM (WSF+OSM), WSF
during production with DCT (WSF+DCT), and OSM or OSM+DCT without WSF.
These strategies were used to encompass most approaches in use by floriculture
producers. A greenhouse experiment was conducted with petunia grown in a
peat/perlite substrate in containers for 42 days with WSF or CRF treatments to
simulate the production phase. Plant growth and nutrient level were evaluated under
simulated consumer conditions in a landscape planting and in containers for 98
additional days. A simple financial budget for each fertilizer strategy was calculated.
An additional experiment was conducted to generate nutrient release curves in
growth chambers at 10, 21, and 32 oC with sand-filled columns, using a protocol
based on Carson and Ozores-Hampton (2012).
3.2 Materials and Methods
3.2.1 Greenhouse Fertilizer Experiment (petunia)
A greenhouse fertilizer experiment was conducted at the University of
Florida, Environmental Horticulture Research Complex in Gainesville, FL, from 16
Sept. 2014 to 5 Feb. 2015. During the production phase from 16 Sept. 2014 to 29
Oct. 2014, greenhouse daily light integral (DLI) averaged (± SD) 15.7 ± 5.1 mol.m-2.d-
1 and daily air temperature averaged (± SD) 24.1 ± 2.2 oC. This production period
was followed by 98 d from 30 Oct. 2014 to 5 Feb. 2015, as the “consumer period” in
either the same greenhouse (DLI (± SD) of 12.5 ± 5.7 mol.m-2.d-1 and 21.3 ± 1.1 oC)
or following transplanting into a drip-irrigated landscape bed (DLI (± SD) of 21.9 ± 8.2
mol.m-2.d-1 and 17.0 ± 5.8 oC). In the landscape, plants were spaced at 0.5 m along
the bed, and were drip-irrigated using 500 L.h-1 per.100 m drip tape during for 60 min
approximately every two days depending on rainfall. A total of 19.6 cm of rain fell the
consumer phase. Plants in the landscape were covered with spun-bound
polyethylene cloth on nights when frosts occurred (19 Nov. and 20 Nov.2014 and 8
Jan.2015), with a minimum air temperature of 0 oC (32 ºF).
Unrooted cuttings of petunia ‘Supertunia Vista Bubblegum’ from
Innovaplant Costa Rica were transplanted into 25 mm diameter paper-wrapped pots
(Ellepots; Blackmore, Apopka, FL) with 70% peat/30% perlite mix (Fafard 1P Mix;
Sun Gro Horticulture, Agawa, MA) on 28 Aug. 2014. After cuttings were well-rooted
(16 Sept. 2014), they were transplanted into 2.84 L containers (trade 1-gal

50
containers; Growers solution, Cookeville, TN) filled with 80% peat moss, perlite and
vermiculite substrate (Fafard 2 Mix; Sun Gro Horticulture, Agawam, MA) that
contained a low concentration of water-soluble fertilizer as a pre-plant nutrient charge
(initial electrical conductivity (EC) 600 µS.cm-1, pH 6.3 using the saturated medium
extract method (WARNCKE, 1986). The bottom of each container was lined with
nylon mesh to avoid substrate being lost through drainage holes.
Production phase: The experiment was a randomized complete block
design with three benches in the same greenhouse compartment, where each bench
represented a block with six replicate containers for each treatment combination. The
treatments included 10 fertilizer strategies at a medium and high rate for color crops
based on label recommendations and input from the fertilizer manufacturer (Dr. F.
Hulme, Everris, personal communication), adjusted to provide equivalent nitrogen
rates across CRF fertilizer types (Table 1).
Table 1 - Fertilization treatments applied to petunia ‘Supertunia Vista Bubblegum’ over a 42 days crop cycle for the greenhouse plant growth experiment. OSM refers to 15N-3.93P-9.96K Osmocote Plus
TM, DCT refers to 14N-3.49P-9.13K Protect
TM dual-coated, OSM+DCT refers
to a blend of 15N-3.93P-9.96K Osmocote ExactTM
and DCT (Hi-EndTM
), and WSF refers to 15N-2.18P-12.45K (Peters Excel 15-5-15) water soluble fertilizer
Treatment Code Incorporated pre-plant Fertilizer during the production phase (42 days)
Fertilizer during the consumer phase (98 days)
(1) WSF None WSF (200 mg.L
-1 N) None
(2) WSF+OSM OSM (2.37 kg/m3) WSF (100 mg
.L
-1 N) None
(3) WSF+OSM TD Low None WSF (200 mg.L
-1 N) OSM TD(3.56 kg/m
3)
(4) WSF+OSM TD High None WSF (200 mg.L
-1 N) OSM TD(5.93 kg/m
3)
(5) OSM Low OSM (3.56 kg/m3) None None
(6) OSM High OSM (5.93 kg/m3) None None
(7) WSF + DCT Low DCT (3.81 kg/m3) WSF (200 mg
.L
-1 N) None
(8) WSF + DCT High DCT (6.35 kg/m3) WSF (200 mg
.L
-1 N) None
(9) OSM+DCT Low OSM+DCT(3.56kg/m3) None None
(10) OSM+DCT High OSM+DCT(5.93kg/m3) None None
Between 0 to 42 d, plants were irrigated with one of three solutions: clear
water (treatments 5, 6, 9, and 10), 100 mg.L-1 of nitrogen (N) (treatment 2) from 15 N-
2.2 P-12.5 K (Peters Excel 15-5-15, Everris, North America), or 200 mg.L-1 N from
15N-2.18P-12.45K (treatments 1, 3, 4, 7, and 8). For treatments with incorporated
CRF, a measured dose of the fertilizer per container was mixed into the substrate
before planting, at 534 and 890 mg.L-1 N of substrate for the low or high rate
treatments. Controlled release fertilizers used were DCT 14N-3.5P-9.1K (Dual coated

51
technology; Everris, CA Geldermalsen, The Netherlands), OSM 15N-3.9P-9.9K
(Osmocote Plus; Everris, North America) and OSM+DCT 15N-3.93P-9.96K
(Osmocote Exact Hi-End; Everris, CA Geldermalsen, The Netherlands), with
longevity between 5 and 6 months for the three products.
Plants were drip irrigated in the greenhouse, using both manual and moisture-
sensor (10HS Moisture Sensor, Decagon Pullman, WA) based control. Clear water
quality was EC 410 µS.cm-1, pH 7.61 and 51 mg.L-1 calcium carbonate (CaCO3)
alkalinity. Plants were grown with near-zero leaching, using collection saucers for
reabsorption of any leachate. At the end of the experiment, was applied 5.4L per
plant.
The pour-through method (WHIPKER et al., 2011) was used for non-
destructive pH and EC measurements at days 0, 7, 14, 21, and 28 and then every 15
d from day 28 onward, for two randomly selected replicate pots per treatment on
each of the three benches. For nitrate and ammonium analysis of leachate using
semi-automated and automated colorimetry by the University of Florida Analytical
Research Laboratory (Gainesville, FL), two replicate containers per bench were
combined into a composite sample, resulting in three replicates for leachate analysis
per treatment combination per measurement date.
At day 0, 150 rooted liners were destructively sampled to measure initial dry
weight and tissue nutrient content. At day 42, six plants each treatment were
destructively sampled for N level in tissue and total plant dry weight (shoot and roots
combined). For N analysis of combined shoot and root tissue by Quality Analytical
Laboratories (Panama City, FL), the two replicate containers per bench were
combined into a composite sample, resulting in three replicates per treatment
combination. At day 42, the number of flowers (all open or closed buds showing pink
petal color) were counted, and chlorophyll index was measured on five fully
expanded leaves per plant with a Minolta SPAD meter on all 18 replicates per
fertilizer treatment.
To simulate a consumer phase in either containers or the landscape after day
42, six plants per treatment remained in the 2.84 L containers, and six plants were
transplanted into the landscape in a sandy soil for an additional 98 d. No additional
fertilizer was applied except for CRF in top-dress treatments (3) and (4). The
landscape soil was tested before planting with a Mehlich III P and K soil extraction
and deionized water to extract NH4/NO3 from the soil (Quality Analytical

52
Laboratories, Panama City, FL) and showed no detected N, high P (487.8 ppm) and
K (219.1 ppm) (MYLAVARAPU et al., 2014), pH 6.32, and an EC of 0.20 µS.cm-1. All
plants in both locations were irrigated with clear tap water. Every 15 d after
transplanting, chlorophyll index was non-destructively measured on all plants.
Flowers were counted every 15 d from day 70 onwards. During the consumer phase,
plants were drip-irrigated in the landscape, or in the greenhouse were manually
watered using a hose (with zero leaching using collection saucers under each
container). For the container-grown plants only, pour-through leachate samples were
collected from each container every 15 d.
At day 140, the 12 plants in containers or the landscape were destructively
sampled for tissue dry weight and nutrient content, chlorophyll analysis, and number
of flowers. Nitrogen uptake efficiency was calculated from leaf tissue. Total N content
in oven-dried ground plant tissue samples was determined by potassium persulfate /
sodium hydroxide digestion and analyzed with a Lachat Quik-Chem flow injection
NO3 analyzer by Quality Analytical Laboratories.
3.2.2 Nitrogen Release from CRF in the Greenhouse Fertilizer Experiment (Sand
Containers, No Plants)
Based on protocols from Birrenkott et al. (2005), a leachate collection unit
(LCU) was assembled by placing a standard nursery container inside a 15.2 cm
diameter hole cut into the lid of 7.6 L black poly bucket (Plasticas Inc. Dallas, TX). An
injection-molded 2.3 L nursery container (Classic 300S; Nursery Supplies, Inc.,
Chambersburg, PA) was inserted into the collection bucket lid and slid into position
so that about 2.5 cm of the bottom of the nursery container protruded through the lid,
with all drain holes beneath the collection bucket lid. The nursery container was
plastic welded to the lid of the collection bucket using a 0.4 cm diameter HDPE
plastic welding rod and a plastic welding gun. The container was welded on both the
top and bottom sides of the lid. A circular disk (15.2 cm diameter x 2.5 cm height) cut
from porous spun-bound polyester fabric was placed in the bottom of the nursery
container to cover the drain holes, filter the leachate solution and retain the
hydrochloric acid (HCl)-washed sand substrate.
Treatments applied to LCUs were arranged on the greenhouse benches
alongside the containers filled with petunia, in a randomized complete block design
with three replicate LCUs per treatment. Fertilizers were applied to each LCU with

53
five treatments, representing a control (no fertilizer), or the high rates as used in the
experiment with plants (Table 1) of incorporated OSM, DCT, blended OSM+DCT (Hi-
End), and OSM top-dressed (OSM TD). The LCUs received similar volumes of
overhead irrigation as the volumes applied to petunia containers, using clear water,
via a dripper during the production phase or hand-watering during the consumer
phase. Each week, leachate containers were emptied and stored with sulfuric acid
(1%, v/v) at 4 oC. Every 21 d (days 21, 42, 63, 84, 105, and 126), an additional 2 L of
water was applied to each container to ensure a complete leaching of released
nutrients. This leached sample was combined with the previous 14 d of leachate for
each container to represent the combined nutrient release over each 21 days period.
Leachate pH, EC, ammonium (NH4-N), nitrate (NO3-N), and volume were then
measured as described on greenhouse fertilizer experiment.
3.2.3 Growth Chamber Experiment
Plastic columns measuring 40 cm in height (filled with substrate to the 25-cm
line) and 5 cm internal diameter were mounted vertically into growth chambers.
Columns were filled with 0.5 L of HCl-washed sand, fitted with mesh in the end and
sealed to retain moisture. The experiment included three fertilizer source treatments,
three growth chamber incubation temperatures (10, 21 and 32 °C), and 14 sampling
dates (1, 2, 4, 7, 14, 28, 42, 56, 70, 84, 98, 112, 126, and 147 d), with six replicate
columns for each fertilizer treatment randomized within each temperature
environment.
For each experimental unit, fertilizer was added at a rate of 5.93 g.L-1 of OSM,
5.93 g.L-1 of OSM+DCT (Hi-End), or 6.36 g.L-1 for DCT to provide 890 mg N per L of
substrate. Granular fertilizer was weighed and hand-mixed into the sand of each
column. A beaker containing 40 of 0.2M sulfuric acid was placed in each growth
chamber for ammonia gas entrapment to trap ammonia (NH3) that volatilizes from the
soil.
Experimental conditions and leachate sampling from the sand columns were
based on published protocols (CABRERA, 1997; CARSON; OZORES-HAMPTON,
2012; FAN; LI, 2010). Columns remained saturated with water up to the upper level
of the sand. At each sampling date, all columns were removed from the growth
chamber and 1.25 L of deionized water was added to each column
(substrate/extraction solution ratio of 1:2.5). Leachate from each container was

54
captured in polyethylene beakers and filtered through Whatman No.42 filter paper.
Each replicate column was measured separately for pH, EC and leachate volume.
Pairs of replicate columns were combined for nitrogen analysis and stored with
sulfuric acid (1%, v/v) at 4 °C for no more than 15 d before analysis at the UF/IFAS
Analytical Services Laboratories. Air temperature was measured in the three
controlled climate conditions using dataloggers.
3.2.4 Statistical Analysis
Nutrient and plant growth data from petunia containers were analyzed with
analysis of variance (ANOVA) using SAS PROC GLM (version 9.2; SAS Institute,
Cary, N.C.) where the effect of fertilizer on SPAD, number of flowers, dry weight, and
tissue N concentration was tested at day 42. The pH, EC, and N concentration in
pour-through samples were averaged for each container over the 42 d period before
analyzing fertilizer effects using ANOVA. Because plants receiving treatments 1, 3,
and 4 were treated identically during the production phase (200 mg.L-1 WSF and no
CRF), these plants were combined as one treatment during the production phase.
Plants in these three treatments were analyzed separately during the consumer
phase, after CRF was top-dressed for treatments 3 and 4 but not for treatment 1.
During the consumer phase, SPAD and number of flowers were analyzed separately
by measurement day and location (greenhouse or landscape). For the LCUs, main
and interaction effects of fertilizer and measurement day were analyzed for pH, EC,
and mg N.
In the growth chamber experiment, main and interaction effects of fertilizer,
temperature, and measurement day were analyzed for pH, EC, and mg N. In all
analyses, least-square treatment means were compared using Tukey’s HSD at
α=0.05. The nutrient release curves in terms of cumulative percent of total nitrogen
released (R, as a percentage calculated from mg N in leachate/total 445 mg N per
column applied) over time t (in days) was first fitted with the Richards (1959) function
(eq. 1). Initial (Hinit) and final (Hfinal) percent release were set to 1% and 100%,
respectively, and PROC NLIN in SAS was used to estimate N (inflection parameter)
and K (rate parameter) by fertilizer and temperature.
R = (Hinit * Hfinal) /( (HinitN + (Hfinal
N - HinitN) * e-K*t )(1/N)) (1)

55
After plotting the rate parameter K in equation (1) for each fertilizer, K
increased with temperature in an approximately linear fashion. Therefore K was
calculated from the column temperature T, K was replaced with a linear function a +
bT, and PROC NLIN was used to estimate N, a, and b in eq. (2) separately for each
fertilizer:
R = (Hinit * Hfinal) /( (HinitN + (Hfinal
N - HinitN) * e-1*(a+bT)*t )(1/N)) (2)
The empirically fitted curves from equation (2) could therefore be used to
describe the observed nutrient release at t days within the temperature range from 10
to 32 oC for each fertilizer based on the three parameters, N, a, and b and the
temperature T.
3.2.5 Economic Analysis
Based on the treatments applied in the greenhouse fertilizer experiment, a
partial budget analyzed the cost of CRF and WSF strategies. Fertilizer cost for OSM
was assumed to be $83.70 per 50 lb bag based on the 2014 catalog cost from BWI
(Apopka, FL). The DCT and OSM+DCT products were not currently sold in the U.S.
However, based on manufacturer information (Dr. F. Hulme, personal
communication), the costs per 50 lb bag were estimated at 120% ($100.50) or 110%
($92.13) of the base CRF cost of Osmocote Plus, respectively. The labor cost for top-
dressing containers with CRF assumed an hourly rate of $9.66 based on the
minimum wage of $8.05 for 2015 in Florida (Florida Nursery, Growers and
Landscape Association, 2015), with an additional 20% (total $9.66) to allow for
administrative and insurance costs. An estimate of 720 containers top-dressed per
hour (12 plants per minute) was based on discussion with several greenhouse
growers using CRF.
The price of WSF was based on Peters Excel 15-5-15TM (15N-2.18P-12.45K,
2014 catalog cost from BWI, Apopka, FL) at $31.20 per 25 lb bag. The amount of N
from the WSF applied to the containers was calculated on a pot-by-pot basis
(Mattson, 2010). To use this method it was necessary to consider the cost and weight
per bag, percentage of N, the volume of water applied per container (5.4 L), and the
applied concentration of fertilizer (0, 100 or 200 mg.L-1 N). These assumptions were
used to calculate the WSF cost per container from eq. (3), (4) and (5).

56
Cost per g of N = (cost per bag ($) /(weight per bag (g) * % N per bag) (3)
N applied (g) = ((volume of water applied (L) * concentration of fertilizer (mg.L-
1N))/1000) (4)
Total cost per container WSF = (grams of N applied /cost per gram of N) (5)
3.3 Results and Discussion
Growth during the production phase: Fertilizer treatments affected total dry weight
(p=0.0028), SPAD chlorophyll index (p=0.0019), and number of flowers (p<0.0001) at
day 42, with least-square treatment means shown in Table 2. The highest dry weight
occurred with the high rate of incorporated OSM (treatment 6), which resulted in
more growth than with the low rate of OSM+DCT (treatment 9) or the WSF only
treatment (combined 1, 3 and 4). SPAD chlorophyll index was higher for plants
receiving the low rate of incorporated OSM (treatment 5) compared with the low rate
of WSF+DCT (treatment 7). The highest number of flowers occurred with the low and
high rates of incorporated OSM (treatments 5 and 6). Overall, OSM incorporated at
low or high rates (treatments 5 and 6) resulted in high levels of growth and quality
indices across all variables (dry weight, SPAD chlorophyll index, and number of
flowers). However, at day 42 all plants appeared horticulturally acceptable as
saleable flowering products, in terms of multiple open blooms with dark green foliage
covering the container surface, regardless of fertilizer strategy (Figure 1A).

57
Table 2 - Summary analysis of variance table showing the effects of fertilizer treatments on plant growth and nutrition in containers at the end of the production phase (42 days)
Treatments Total dry weight
(g/plant)
SPAD chlorophyll
Index
Flowers (no./plant)
pH Electrical
conductivity (µS.cm-1)
Substrate-N
(mg L-1)
Tissue N (%)
(1, 3, and 4) WSF 11.4 b z 37.8 ab 11.3 c 6.62 a 1668 d 27.4 c 4.6 ab
(2) WSF+OSM 14.3 ab 37.7 ab 14.4 bc 6.34 bc 2308 c 72.0 b 4.9 ab
(5) OSM Low 14.7 ab 41.8 a 29.5 a 6.32 bc 2301 c 86.0 b 3.1 c
(6) OSM High 17.5 a 41.3 ab 20.8 ab 6.12 d 3224 a 142.
1 a 4.7 ab
(7) WSF+DCT Low 13.8 ab 37.3 b 9.3 c 6.35 b 2535 bc 69.3 b 5.2 ab
(8) WSF+DCT High 13.7 ab 39.1 ab 12.8 bc 6.30 bc 2869 ab 99.1 b 5.3 a
(9) OSM+DCT Low 10.0 b 38.0 ab 9.6 c 6.38 b 2210 c 83.3 b 3.0 c
(10) OSM+DCT High 15.7 ab 40.4 ab 18.7 b 6.20 cd 3141 a 144.
2 a 3.8 bc
z Least-square means were compared using Tukey’s HSD at the α=0.05 level.

58
Figure 1 - Photographs of representative plants grown with the different fertilizer treatments detailed in Table 1. (A) Photograph taken at the end of the production phase (42 days after planting); (B) 42 days in the consumer phase (84 days after planting) or (C) 98 days in the consumer phase (140 days after planting). White arrows on the left of each photo represent the container height of 16.5 cm to provide a comparative scale, because photos were taken an increasing distance away from the plants as time progressed

59
Nutrient levels during the production phase: Fertilizer treatments affected substrate-pH
(p<0.0001), substrate-EC (p=<0.0001), substrate-N (p=<0.0001), and tissue-N
(p<0.0001), with least-square treatment means shown in Table 2. Substrate-pH level for
WSF only (combined treatments 1, 3 and 4) was higher than substrate-pH for all other
treatments. The lowest pH levels occurred with the high rate of OSM (treatment 6) and
OSM+DCT (treatment 10). Substrate-EC with the WSF only treatment (combined
treatments 1, 3 and 4) was also significantly lower than with other treatments. The
highest substrate-EC occurred with the high rate of OSM (treatment 6) and OSM+DCT
(treatment 10). The observed trend whereby high pH treatments tended to have a low
EC is consistent with cation exchange of fertilizer cations with protons on the peat
substrate (FISHER et al., 2014). Most pH levels were slightly higher than recommended
for petunia [5.4 to 6.2 (FISHER, 2003)] during the production phase, although there
were no visual signs of iron deficiency (Figure 1A) or large differences in SPAD
chlorophyll level (Table 2). The recommended range for EC using the pour-through
method of 2600 to 4600 µS.cm-1 for most established plants (WHIPKER et al., 2003)
was above the EC levels observed in treatments except for the high rates of OSM
(treatment 6), WSF+DCT (treatment 8), or OSM+DCT (treatment 10). The average
substrate-N content during the production phase (Table 2) was highest with the high rate
of incorporated OSM (treatment 6) or OSM+DCT (treatment 10), and was lowest with
the WSF only treatments (1, 3 and 4). The low rate of OSM (treatment 5) and
OSM+DCT (treatment 9) resulted in 3.1% and 3.0% tissue-N, respectively, which was
lower than the range recommended by Mills and Jones (1996) for petunia of 3.85-
7.60%.
Growth and tissue-N during the consumer phase: Fertilizer treatments differed in total
dry weight by day 140 (Table 3). In the greenhouse (p<0.0001), dry weight was highest
with WSF+DCT (treatments 7 and 8) or WSF+OSM TD (treatments 3 and 4) at both the
low and high rates. In the landscape (p=0.0001), the highest dry weight occurred with
high rates of WSF+DCT (treatment 8) or WSF+OSM TD (treatment 4). Both WSF+DCT
and WSF+OSM TD strategies were expected to release the majority of their CRF
nutrients during the consumer phase, an assumption that was supported by the higher
dry weight during the consumer phase, especially at high CRF rates. Photographs of

60
plants after 42 days in the consumer phase (84 d. after planting, Figure 1B) illustrate
reduced growth of WSF only (treatment 1), WSF+OSM (treatment 2), low rate of OSM
(treatment 5), and low rate of OSM+DCT (treatment 9) by day 84. At the end of
consumer phase (140 d.), all plants exhibited yellow foliage, particularly plants grown
with treatments 1, 2, 5, 7 and 9 (Figure 1C).

61
Table 3 - Summary analysis of variance (ANOVA) table showing the effects of fertilizer treatments on plant growth and tissue-N after 98 days in the consumer phase (140 days after planting) for the containers continued in the greenhouse or transplanted to the landscape
Treatments
Greenhouse Landscape
Total dry weight (g)
SPAD chlorophyll
index
Flowers (no./plant)
Tissue N (%) Total dry weight (g)
SPAD Flowers
(no./plant) Tissue N (%)
(1) WSF 43.9 ez 18.5 d 45 ab 0.80 b 34.0 e 29.4 bc 0 c 0.96 b
(2) WSF+OSM 75.0 bcd 29.8 bc 33 ab 1.03 ab 54.7 d 29.6 bc 2 bc 1.30 ab
(3) WSF+OSM TD Low 83.2 ab 33.6 abc 44 ab 1.17 ab 73.7 c 31.5 ab 7 abc 1.56 a
(4) WSF+OSM TD High 85.7 ab 37.4 a 56 a 1.57 a 90.7 ab 30.4 abc 15 ab 1.73 a
(5) OSM Low 60.0 cde 29.7 c 14 b 1.30 ab 46.6 d 33.4 a 2 bc 1.40 ab
(6) OSM High 79.1 bc 33.2 abc 19 ab 1.33 ab 78.3 bc 30.4 abc 6 abc 1.76 a
(7) WSF+DCT Low 87.4 ab 32.2 abc 33 ab 1.33 ab 71.1 c 27.2 c 9 abc 1.43 ab
(8) WSF+DCT High 103.0 a 35.8 ab 41 ab 1.70 a 95.8 a 27.8 c 17 a 1.26 ab
(9) OSM+DCT Low 55.7 de 28.6 c 16 b 1.30 ab 47.9 d 29.5 bc 2 bc 1.33 ab
(10) OSM+DCT High 81.0 bc 32.4 abc 27 ab 1.47 ab 74.6 c 28.9 bc 9 abc 1.36 ab z Least-square means were compared using Tukey’s HSD at the α=0.05 level. The ANOVA for each variable was run separately by environment
(greenhouse or landscape).
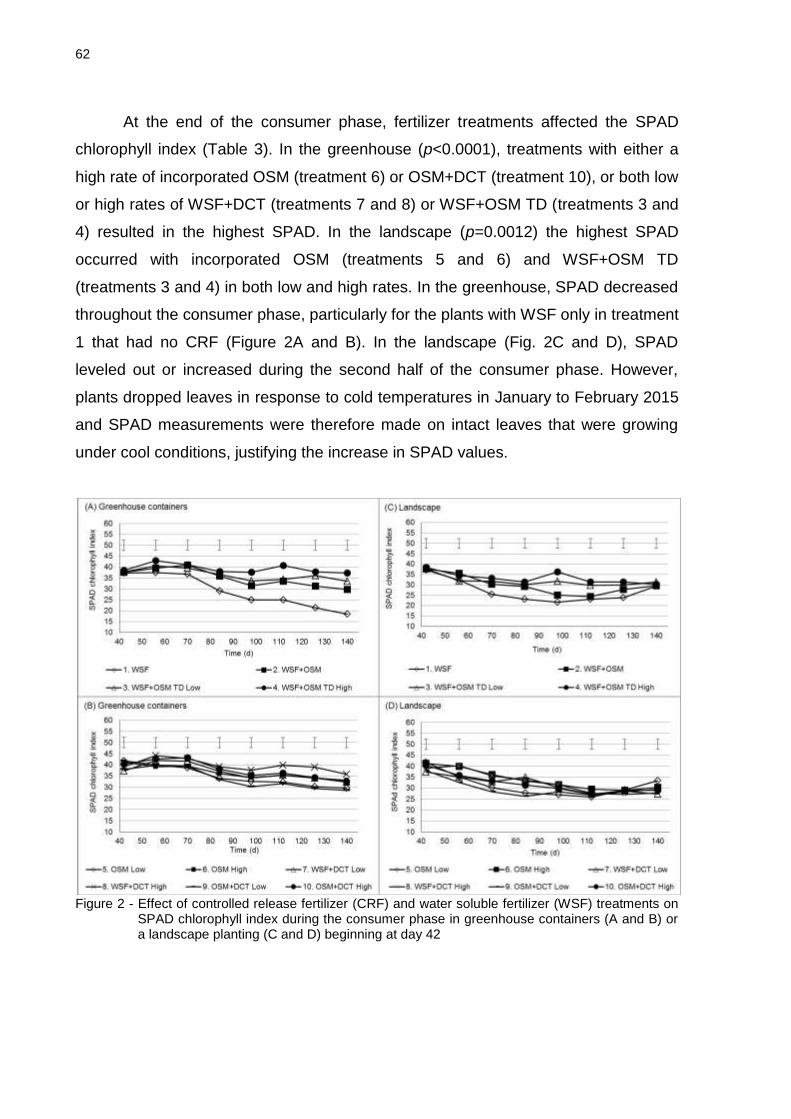
62
At the end of the consumer phase, fertilizer treatments affected the SPAD
chlorophyll index (Table 3). In the greenhouse (p<0.0001), treatments with either a
high rate of incorporated OSM (treatment 6) or OSM+DCT (treatment 10), or both low
or high rates of WSF+DCT (treatments 7 and 8) or WSF+OSM TD (treatments 3 and
4) resulted in the highest SPAD. In the landscape (p=0.0012) the highest SPAD
occurred with incorporated OSM (treatments 5 and 6) and WSF+OSM TD
(treatments 3 and 4) in both low and high rates. In the greenhouse, SPAD decreased
throughout the consumer phase, particularly for the plants with WSF only in treatment
1 that had no CRF (Figure 2A and B). In the landscape (Fig. 2C and D), SPAD
leveled out or increased during the second half of the consumer phase. However,
plants dropped leaves in response to cold temperatures in January to February 2015
and SPAD measurements were therefore made on intact leaves that were growing
under cool conditions, justifying the increase in SPAD values.
Figure 2 - Effect of controlled release fertilizer (CRF) and water soluble fertilizer (WSF) treatments on
SPAD chlorophyll index during the consumer phase in greenhouse containers (A and B) or a landscape planting (C and D) beginning at day 42

63
The number of flowers at the end of the consumer phase (p=0.0074, Table 3)
was higher for WSF+OSM TD high rate (treatment 4) than the low rate of
incorporated OSM (treatment 5) or OSM+DCT (treatment 9) in the greenhouse. In
the landscape (p=0.0040), plants fertilized with the high rate of WSF+DCT (treatment
8) had a higher number of flowers than WSF (treatment 1), WSF+OSM (treatment 2),
low rate of incorporated OSM (treatment 5) or OSM+DCT (treatment 9) (Table 3). By
the end of the consumer phase, there were no flowers on the WSF only plants in the
field. The number of flowers peaked at 70 d. after transplant (28 d. in the greenhouse
or landscape), and decreased after this period. The number of flowers remained
higher for plants in the greenhouse compared with plants in the landscape (Figure 3).
Figure 3 - Effect of controlled release fertilizer (CRF) and water soluble fertilizer (WSF) treatments on
number of flower count per plant during the consumer phase in greenhouse containers (A and B) or a landscape planting (C and D) beginning at day 42
At the end of the consumer phase (140 d.), tissue-N concentration (Table 3)
was lower than the recommended range of 3.85-7.60% (MILLS; JONES, 1996) for all
treatments. There were differences between fertilizer treatments in tissue-N in both
the greenhouse (p=0.01) and the landscape (p=0.002). Tissue-N was lowest in the

64
WSF only treatment (1) in both environments. Tissue-N in the greenhouse-grown
plants was significantly lower in WSF treatment 1 than with high rates of WSF+OSM
TD (treatment 4) or WSF+DCT (treatment 8). In the landscape, tissue-N in the WSF
treatment 1 was lower than either WSF+OSM TD treatments (3 and 4), or the high
rate of incorporated OSM (treatment 6).
Nutrient release in the Greenhouse Without Plants: Nutrient release over time
differed between CRF treatments in the sand-containing LCUs without plants or WSF
in the greenhouse (Figure 4). Throughout the experiment, as expected, measured N
release from the washed sand control was close to zero. During the production phase
(up to 42 d., OSM, and OSM+DCT had similar release curves. However, initial
release from DCT was close to zero for the first 15 d., and then had a similar release
rate with other CRF products, as represented by the parallel gradients of curves in
figure 4. From day 63 onward, the OSM+DCT product had a faster release rate than
OSM or OSM TD. Faster release of OSM+DCT than OSM alone was not expected.
However, polymers may differ between the OSM product that was formulated in the
US, compared with the OSM+DCT product manufactured in Europe. By day 42, at
the end of the production phase, OSM, and OSM+DCT had released between 42.0 to
44.1% of applied N. In contrast, DCT had released only half this level (21.0%), which
would result in greater potential release during the consumer phase. At the end of the
consumer phase, 82.1% of OSM, 91.2% of OSM+DCT, and 65.9% of DCT were
released. Throughout the LCU experiment, OSM TD had a similar release rate to the
incorporated OSM. In the petunia experiment, however, OSM was not top-dressed
until 42 d. and the top-dressed LCU data were therefore out of phase with the
planted petunia experiment. By the end of the consumer phase at 140 d., lower
concentration of nutrients would therefore have been released from OSM TD applied
at petunia at 42 d., compared with incorporated OSM applied at day 0.
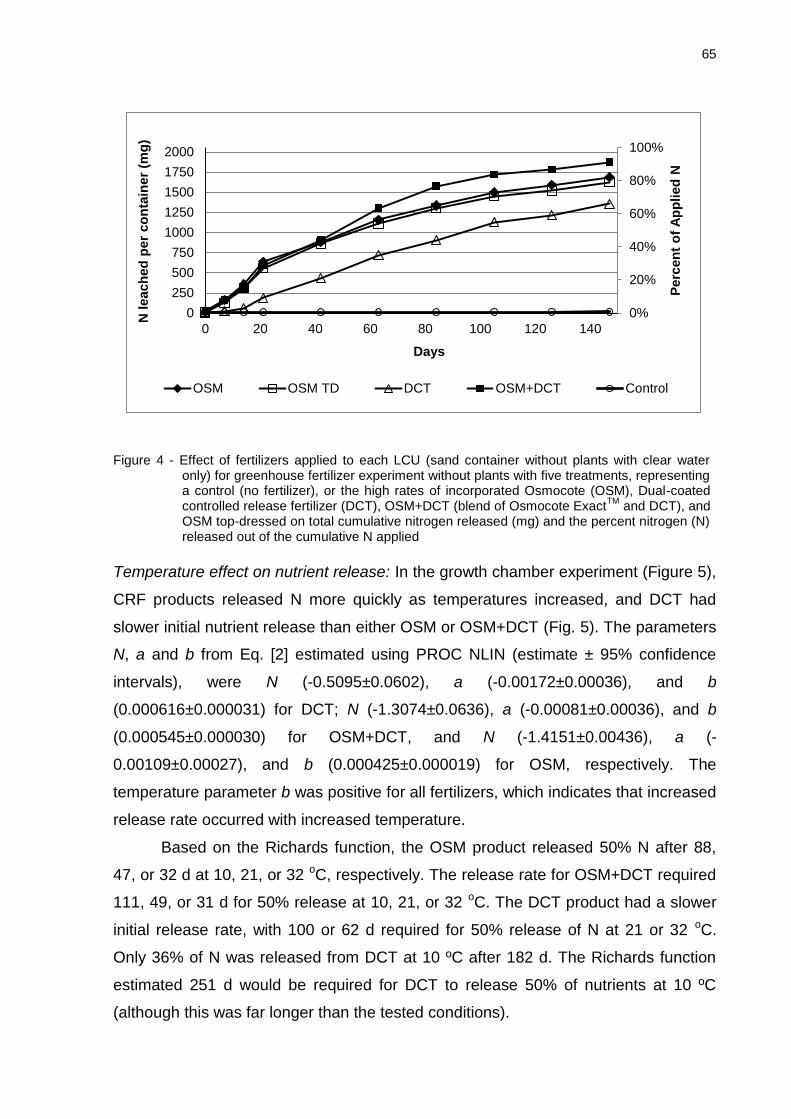
65
Figure 4 - Effect of fertilizers applied to each LCU (sand container without plants with clear water
only) for greenhouse fertilizer experiment without plants with five treatments, representing a control (no fertilizer), or the high rates of incorporated Osmocote (OSM), Dual-coated controlled release fertilizer (DCT), OSM+DCT (blend of Osmocote Exact
TM and DCT), and
OSM top-dressed on total cumulative nitrogen released (mg) and the percent nitrogen (N) released out of the cumulative N applied
Temperature effect on nutrient release: In the growth chamber experiment (Figure 5),
CRF products released N more quickly as temperatures increased, and DCT had
slower initial nutrient release than either OSM or OSM+DCT (Fig. 5). The parameters
N, a and b from Eq. [2] estimated using PROC NLIN (estimate ± 95% confidence
intervals), were N (-0.5095±0.0602), a (-0.00172±0.00036), and b
(0.000616±0.000031) for DCT; N (-1.3074±0.0636), a (-0.00081±0.00036), and b
(0.000545±0.000030) for OSM+DCT, and N (-1.4151±0.00436), a (-
0.00109±0.00027), and b (0.000425±0.000019) for OSM, respectively. The
temperature parameter b was positive for all fertilizers, which indicates that increased
release rate occurred with increased temperature.
Based on the Richards function, the OSM product released 50% N after 88,
47, or 32 d at 10, 21, or 32 oC, respectively. The release rate for OSM+DCT required
111, 49, or 31 d for 50% release at 10, 21, or 32 oC. The DCT product had a slower
initial release rate, with 100 or 62 d required for 50% release of N at 21 or 32 oC.
Only 36% of N was released from DCT at 10 ºC after 182 d. The Richards function
estimated 251 d would be required for DCT to release 50% of nutrients at 10 ºC
(although this was far longer than the tested conditions).
0%
20%
40%
60%
80%
100%
0
250
500
750
1000
1250
1500
1750
2000
0 20 40 60 80 100 120 140
Perc
en
t o
f A
pp
lied
N
N leach
ed
per
co
nta
iner
(mg
)
Days
OSM OSM TD DCT OSM+DCT Control
66
A temperature of 21 ºC is typically used to rate CRF longevity, and the manufacturer
rating for both the OSM product and the inner coating layer for the DCT product was
5 to 6 months at 21 ºC. By 182 d (approximately 6 months) at 21 ºC, the OSM,
OSM+DCT and DCT products had released 89, 88, and 78% of N, respectively.
Nutrient release rate in % N/day could be calculated based on the gradient of
the Richards function curves in Figure 5. At 10 oC, it took 136 d for the release rate
for DCT to equal or exceed that of OSM. In contrast, at 21 oC and 32 oC, it took 51
and 31 d, respectively, for DCT to have an equal or greater release rate compared
with OSM. The lag in release from the second coating in DCT was therefore
temperature-dependent.
Economic Analysis. The lowest cost treatment was WSF only (treatment 1) at
$0.02/container (Table 4). Many greenhouse growers produce plants using WSF
rather than CRF because of lower production cost and the flexibility of being able to
vary applied nutrient concentration during crop growth.

67
Figure 5 - Effect of controlled release fertilizers on total cumulative nitrogen released (mg per column) and the percent of nitrogen (N) released/N applied in three growth chamber incubation temperatures (10, 21 and 32 °C). Curves represent the Richards function fitted separately by fertilizer, including the temperature function in equation (2)

68
Table 4 - Production cost per container ($ per plant) of petunia ‘Supertunia Vista Bubblegum’ fertilizer in 2.84 L containers for the tested controlled release fertilizer (CRF) and water soluble fertilizer (WSF) strategies. The labor cost of applying fertilizer was only considered for treatments with top-dressed CRF, because labor cost to prepare WSF or apply CRF before planting would be minor. Cost estimates only consider the production phase, because during the consumer phase only clear water was applied
(1) WSF
(2) WSF + OSM
(3) WSF + OSM TD Low
(4) WSF + OSM TD
High
(5) OSM Low
(6) OSM High
(7) WSF + DCT Low
(8) WSF + DCT High
(9) OSM + DCT Low
(10) OSM + DCT High
CRF Costs Cost per 50 lb bag (US$)
$83.7 $83.75 $83.75 $83.75 $83.75 $100.5 $100.5 $92.13 $92.13 Cost per gram
$0.004 $0.004 $0.004 $0.004 $0.004 $0.004 $0.004 $0.004 $0.004
CRF weight (g/container)
5.5 8.2 13.7 8.2 13.7 8.8 14.7 8.2 13.7 Material cost per container
$0.02 $0.030 $0.051 $0.030 $0.051 $0.039 $0.065 $0.033 $0.056
Labor cost per container (top-dressed)z
$0.013 $0.013 Cost per container of CRF (material, labor)
$0.02 $0.044 $0.064 $0.030 $0.051 $0.039 $0.065 $0.033 $0.056
WSF Costs Concentration of fertilizer (mg.L-1 N)
200 100 200 200 200 200
N applied (g)
1.08 0.54 1.08 1.08 1.08 1.08 Total cost per container WSF (materials)y
$0.02 $0.01 $0.020 $0.020 $0.020 $0.020
CRF cost $0.00 $0.02 $0.044 $0.064 $0.030 $0.051 $0.039 $0.065 $0.033 $0.056 WSF cost
$0.02 $0.01 $0.020 $0.020 $0.000 $0.000 $0.020 $0.020 $0.000 $0.000
Total cost per container
$0.02 $0.03 $0.064 $0.084 $0.030 $0.051 $0.059 $0.085 $0.033 $0.056 Additional cost beyond WSF only $0.00 $0.01 $0.044 $0.064 $0.010 $0.031 $0.039 $0.065 $0.013 $0.036
z Top-dressing cost assumes a labor cost/h of $9.66, with 720 containers top-dressed per hour (5 s per plant)
y WSF cost assumes $31.20 per 11.3-kg bag with 15% N, giving a cost per gram of N equal to $0.018.
69
Using incorporated OSM (treatments 5 and 6) increased cost by $0.010 to
$0.031 per container at the low or high experimental rates, respectively, compared
with WSF only. However, based on results from the petunia experiment, improved
plant performance with residual fertilizer from CRF has potential to be promoted in
product marketing. A slight increase in sales price could easily pay for the added cost
of CRF compared with WSF only.
The cost of CRF application increased when labor was required to top-dress
containers (treatments 3 and 4) by an estimated $0.013 per container compared with
incorporating OSM before planting (which had an assumed zero labor cost,
treatments 5 and 6). In addition, $0.02 in WSF cost would be required if top-dressing
occurred before shipping (at the production phase, as in this experiment). Where
labor is limiting or costly, incorporation of CRF would therefore be preferred to top-
dressing. A practical management advantage of top-dressing CRF is that for growers
who prefer using fertigation, top dressing does not require changes in fertilizer during
production.
In the petunia experiment, OSM+DCT treatments had similar observed
nutrient release rate and plant performance to OSM. The slightly higher cost of
OSM+DCT (treatments 9 and 10) than OSM alone (treatments 5 and 6) (by $0.003 to
$0.005 per container at the low or high rates, respectively) would therefore not be
justified.
Treatment 2 with low WSF and CRF rates, was $0.01 more costly than WSF
alone, and equal in cost to the low rate of incorporated OSM. The main advantage of
combination WSF and CRF in production is where (a) there is a mix of plant species
that are fertigated at a low WSF concentration, and CRF is only applied to the subset
of vigorous crops that require a higher fertilizer charge, or (b) the grower wants to
provide a small amount of residual fertilizer while still being able to regulate fertilizer
level during production using WSF.
Using DCT in combination with WSF (treatments 7 and 8) was more
expensive than OSM (treatments 5 and 6), and had a similar cost to WSF+OSM TD
(treatments 3 and 4). The higher cost of WSF+DCT compared with OSM resulted
from both an increased cost of the CRF, and the need to apply WSF during the
production phase before nutrient release occurred from the DCT. The most likely
situation where DCT would be preferred by growers is where crops are produced with

70
fertigation, a residual fertilizer is desired for the consumer, but the grower prefers not
to top-dress with CRF.
3.4 Conclusions
If plant products are delivered to the consumer without some residual fertilizer,
the grower is passing the responsibility for subsequent fertilization to the customer.
Although many landscapers and consumers fertilize plants in the landscape
(SCHOBER et al., 2010), plants are not always fertilized after sale. Without residual
fertilizer, no matter how good the plant genetics or quality at point of sale, plant
performance is likely to be poor for long-term and vigorous plants such as petunia in
hanging baskets, patio containers, or the landscape.
All fertilizer treatments, which included WSF only, a low rate of combined WSF
and CRF, WSF and DCT, or CRF produced high quality plants after 42 d of
production (the grower phase). Growers therefore have multiple strategies to produce
similar quality plants, and the choice comes down to factors such as cost and
practicality.
Plants grown with WSF only during the production phase, without residual
fertilizer, were severely nutrient-deficient (as quantified by chlorophyll index and
flower number) after 42 d in the consumer phase (day 84, Figures 2 and 3). In
contrast, any plants receiving CRF were still growing vigorously after 42 d in the
consumer phase, especially when OSM (incorporated or top-dressed) or DCT were
applied at a high rate.
None of the fertilizer treatments resulted in substrate-EC levels during the
production phase that exceeded the recommended range (Table 2). Low tissue-N
levels and poor plant performance were observed by the end of the consumer phase.
Therefore, improved plant performance during the consumer phase may have been
achievable by increasing applied fertilizer concentrations.
The DCT had delayed nutrient release compared with single-coated CRF, in
both the greenhouse LCU and growth chamber studies (Figures 4 and 5). The
release rates of all CRF products, and the duration of the delay in release from DCT
were temperature-dependent. These results emphasize the importance of
considering temperature on the longevity of product.
An economic analysis indicated the cost per trade 1-gallon (2.84 L) container
ranged from $0.020 per container with WSF only, to $0.051 with incorporated OSM,

71
$0.084 with top-dressed OSM, and $0.085 with DCT at the high rates. Overall,
several options are available to growers to add a residual nutrient charge for the
consumer phase, with the choice of fertilizer strategy depending on material and
labor cost and availability, and preferred crop management style. Given the improved
plant performance in the consumer phase with residual fertilizer observed in the
petunia experiment, if this added value could be promoted to consumers, the slight
extra cost of CRF compared with WSF would be more than compensated for by an
increased sales price.
References
ANDIRU, G.A.; PASIAN, C.C.; FRANTZ, J.M.; JOURDAN, P. Longevity of controlled release fertilizer influences the growth of bedding Impatiens. HortTechnology, Alexandria, v. 23, p. 157-164, 2013.
BIRRENKOTT, B.A.; CRAIG, J.L.; MCVEY, G.R. A leach collection system to track the release of nitrogen from controlled release fertilizer in container ornamentals. HortScience, Alexandria, v. 40, p. 1887-1891, 2005.
BROSCHAT, T.K.; MOORE, K.K. Release rates of ammonium-nitrogen, nitrate-nitrogen, phosphorus, potassium, magnesium, iron, and manganese from seven controlled release fertilizers. Communications in Soil Science and Plant Analysis, New York, v. 38, p. 843-850, 2007.
CABRERA, R.I. Comparative evaluation of nitrogen release patterns from controlled release fertilizer by nitrogen leaching analysis. Hortscience, Alexandria, v. 32, p. 669-673, 1997.
CARSON, L.C.; OZORES-HAMPTON, M.. Methods for determining nitrogen release from controlled release fertilizers used for vegetable production. HortTechnology, Alexandria, v. 22, p. 20-24, 2012.
CHEN, Y.; BRACY, R.P.; OWINGS, A.D.; QUEBEDEAUX, J.P. Controlled release fertilizer type and rate affect landscape establishment of seven herbaceous perennials. HortTechnology, Alexandria, v. 21, p. 336-342, 2011.
FAN, X.H.; LI, Y.C. Nitrogen release from slow-release fertilizers as affected by soil type and temperature. Soil Science Society of America Journal, Madison, v. 74, p. 1635-1641, 2010.
FISHER, P. Managing pH for container media. In: HAMRICK, D. Ball redbook: crop production. Batavia: Ball Publ., 2003. p. 39-45.
FISHER, P.R.; DICKSON, R.W.; MOHAMMAD-POUR, G.S.; HUANG, J. Effect of solution electrical conductivity (ec) and pre-plant nutrient form on the pH of a peat-perlite substrate. Acta Horticulturae, Korbeek, n. 1034, p. 249-254, 2014.

72
FLORIDA NURSERY. Growers and Landscape Association. Greenline, Orlando, v 36, Apr. 2015. Disponível em: <http://greenline.fngla.org>. Acesso em: 14 Abr. 2015.
MATTSON, N. What’s your fertilizer cost? Growers talk magazine. Batavia: Ball Publ., 2010. 6 p.
MILLS, H.A.; JONES JUNIOR, J.B. Plant analysis handbook II: a practical sampling, preparation, analysis, and interpretation guide. Athens: Micro-Macro, 1996. 422 p.
MYLAVARAPU, R.S.; D'ANGELO, W.; WILKINSON, N.; MOON, D. UF/IFAS Extension Soil Testing Laboratory (ESTL): analytical procedures and training manual. 2014. Disponível em: <http://edis.ifas.ufl.edu/ss312>. Acesso em: 04 out. 2015.
RICHARDS, F.J. A flexible growth function for empirical use. Journal of Experimental Botany, Lancaster, v. 10, p. 290-300, 1959.
SHOBER, A.L.; DENNY, G.C.; BROSCHAT, T.K. Management of fertilizers and water for ornamental plants in urban landscapes: current practices and impacts on water resources in Florida. HortTechnology, Alexandria, v. 20, p. 94-106, 2010.
SIMONNE, E.H.; HUTCHINSON, C.M. Controlled release fertilizers for vegetable production in the era of best management practices: Teaching new tricks to an old dog. HortTechnology, Alexandria, v. 15, p. 36–46, 2005.
SONNEVELD, C.; VOOGT, W. Plant nutrition of greenhouse crops. Dordrecht: Springer, 2009.
WARNCKE, D.D. Analyzing greenhouse growth media by the saturation extraction method. Hortscience, Alexandria, v. 21, p. 223-225, 1986.
WHIPKER, B.E.; CAVINS, T.J.; GIBSON, J.L.; DOLE, J.M.; NELSON, P.V.; FONTENO, W. Water, media, and nutrition testing. In: NAU, J. Ball redbook: crop production. Chicago: Ball Publ., 2011. v. 2, p. 49-59.
WHIKER, B.E.; CAVINS, T.J.; GIBSON, J.L.; DOLE, J.M.; NELSON, P.V.; FONTENO, W.; BAILEY, D.A. Water, media, and nutrition testing. In: HAMRICK, J. Ball redbook: crop production. Chicago: Ball Publ., 2003. p. 47-62.
WILSON, P.C; ALBANO, J.P. Impact of fertigation versus controlled release fertilizer formulations on nitrate concentrations in nursery drainage water. HortTechnology, Alexandria, v. 21, p. 176-180, 2011.
WU, L.; LIU, M.; LIANG, R. Preparation and properties of a double-coated slow-release NPK compound fertilizer with superabsorbent and water-retention. Bioresource Technology, Trivandrum, v. 99, p. 547-554, 2008.