Embed Size (px)
Citation preview
University of São Paulo “Luiz de Queiroz” College of Agriculture
Sugarcane thi1 homologues: a molecular and functional study
Andréia Prata Vieira
Thesis presented to obtain the degree of Doctor in Science. Program: International Plant Cell and Molecular Biology
Piracicaba 2018
Andréia Prata Vieira Bachelor and Licentiate in Biological Sciences
Sugarcane thi1 homologues: a molecular and functional study
Advisor: Prof. Dr. MARIE-ANNE VAN SLUYS
Thesis presented to obtain the degree of Doctor in Science. Program: International Plant Cell and Molecular Biology
Piracicaba 2018

2
Dados Internacionais de Catalogação na Publicação
DIVISÃO DE BIBLIOTECA – DIBD/ESALQ/USP
Prata, Andréia Vieira
Sugarcane thi1 homologues: a molecular and functional study / Andréia Prata Vieira. - - Piracicaba, 2018.
121 p.
Tese (Doutorado) - - USP / Escola Superior de Agricultura “Luiz de Queiroz”.
1. Gene thi1 2. Tiamina 3. Evolução 4. Caracterização genômica 5. Cana-de-açúcar 6. Physcomitrella patens 7. Complementação funcional L. . I. Título
3
Acknowledgments
First of all, I would like to thank my family that always supported me to walk my path.
A special mention to my Grandma Emilia, who is the foundation of this loving family; to my
aunts Sandra and Margarete, my first teachers that made me love studying; to my father Reinaldo,
who, among all the support, kept my car working so I could commute every day; to my grandma
Helena, grandfathers José and Antônio, my uncles Jorge and Cassio and my aunt Ana, people
who certainly participated on my formation as a person.
I also want to thank my brother Daniel for making me choose Biology for a profession
and for all the math/physics/statistics/excel/programing-ish stuff. Also his wife, Natasha, for
providing me English classes, without which I would not have been able to do this doctorate or
write this thesis; and for giving me my beloved nephew, Bernardo (strong bear) who is an
example of a struggle for life.
A very special acknowledgment to my Mom Lourdes for all her efforts to keep us
studying no matter what, I owe her practically everything I have conquered.
I deeply thank the family I've chosen for my life: Mr. Sullyvan, for all the unconditional
love, cuteness and happiness; and Fernando, for being my safety harbor and my best friend. For
the partnership and patience, for spending his time working with me many times in the lab, for
being with me in the tough moments and encouraging me to keep going, for all the love we
shared all these years and for the future that we are building together. We are the best and
smallest pack and “the strength of the pack is the wolf, and the strength of the wolf is the pack”
(The Law for the Wolves, Rudyard Kipling).
I would like to thank my best couple of friends, Karina Tisovec and Luiz Gustavo
Dufner, for all these years of friendship and for all the lunches together, which were very
important relaxing moments.
I also would like to thank the good friends I made at Rutgers University, whom I will
keep forever in my heart: Hilarina Casie Chitty, who was with me from the very beginning, for
the long conversations about everything; Filipa Carvalho, the “right” Portuguese speaker, for
having such a good heart and all the friendship; Megan Francis, an example of an efficient
employee, for helping me to survive all the bureaucratic process that a first student of a new
program could face, and also for being a good friend; and finally Amber Annett, a “best friend
forever”, for all the fellowship in gardening, at meals, at the spa, at the gym, in house parties, at
all “cheap thrills” and all the other adventures we had together. And I also would like to thank
these four ladies for helping me in the saga of finding a wedding dress!
In my professional life, first I would like to acknowledge my advisor Prof. Dr. Marie-
Anne Van Sluys, who opened my eyes to the Molecular Plant Biology with her great classes. Her

4
scientific career is an example for me and, for almost ten years, she has encouraged me to
develop my potential as a scientist.
I thank all GaTE Lab (Genomic and Transposable Elements Lab) current and former
members, for the friendship and very high quality science discussions, mainly the ones who
participated somehow in my formation as scientist and helped a lot in my research (Nathalia de
Setta, Danielle Quintanilha, Erika Maria de Jesus, Paula Turrini, Guilherme Queiroga Cruz,
Andrés Ochoa Cruz, Mayra Kuroki, Jonas Gaiarsa, Cushla Metcalf and José Hernandes). Special
thanks to the laboratory technician Tatiana Correa, for the readiness to help no matter what, for
all the lab organization making it a very good place to work.
I thank all the professors involved in assembling the Double Degree Ph.D. Program for
making it happen, mainly Dr. Helaine Carrer for personally taking care of my bureaucratic
process.
I gratefully acknowledge all people involved in my internship abroad at Rutgers
University: Prof. Dr. Michael Lawton for accepting me as his PhD student, teaching me all about
Physcomitrella patens transformation, and for the careful review of this manuscript; Dr. Rong Di for
all the teaching and the help in the lab work and for being a wonderful example of scientist,
woman and mother; Yee Chen for teaching me the daily operation of the lab, taking care of my
plants and lending me her bike.
I would like to express my gratitude to the CATG (Centro Avançado de Tecnologias em
Genômica), LNCC (Laboratório Nacional de Computação Científica), Laboratório de Anatomia Vegetal,
LPBR (Laboratório de Protreínas e Biologia Redox), Laboratório de reparo do DNA and LAFIECO
(Laboratório de Fisiologia Ecológica de Plantas) laboratories from University of São Paulo for leaving
me opened doors to use their facilities and its staff for the willingness to help.
I would like to express my gratitude to the Brazilian fellow scientists who somehow
helped in this study: to Dr. Hana Paula Masuda and Fernanda Marisca Bizotto from Universidade
Federal do ABC for all the help with subcellular localization experiments; to Tássia Cristina dos
Santos for helping me see GFP fluorescence for the first time in my experiments; to Eglee
Igarashi for the carbohydrates measurement; to Dr. Rodrigo Galhardo for providing the S.
cerevisiae strains (W303 e KBY5) and the expression vectors used in functional complementation
assay.
Finally, I gratefully acknowledge funding from Fundação de Amparo a Pesquisa do Estado de
São Paulo (FAPESP) (process numbers 2012/02671-7, 2015/05058-2 and 2015/15419-2),
University of São Paulo and Rutgers University.

5
EPIGRAPHE
“You know what you gotta do when life gets you down?
Just keep swimming...”
Dory – “Finding Nemo”
6
TABLE OF CONTENTS
ABSTRACT ........................................................................................................................................... 9
RESUMO.............................................................................................................................................. 10
LIST OF FIGURES ............................................................................................................................. 11
LIST OF TABLES ............................................................................................................................... 15
LIST OF ABBREVIATIONS AND ACRONYMS ........................................................................... 16
LIST OF SYMBOLS ........................................................................................................................... 18
1. INTRODUCTION ........................................................................................................................... 19
1.1. THIAMINE ................................................................................................................................................... 19 1.1.1. Thiamine structure and its role in metabolism ................................................................................... 20
1.1.2. Bioavailability of thiamine ................................................................................................................. 21
1.1.3. Thiamine biosynthesis ........................................................................................................................ 22
1.1.4. Metabolic control of thiamine level .................................................................................................... 25
1.2. THIAZOLE BIOSYNTHETIC PROTEIN (THI1) ORTHOLOGUES ......................................................................... 27 1.2.1. THI1 orthologues as a bifunctional protein ....................................................................................... 27
1.2.2. At-THI1 structure ............................................................................................................................... 29
1.2.3. Subcellular localization of THI1 in Arabidopsis ................................................................................ 30
1.2.4. At-thi1 promoter and expression ........................................................................................................ 31
1.2.5. A. thaliana tz-201 mutant ................................................................................................................... 33
1.3. OBJECTIVES ................................................................................................................................................ 35 1.3.1. Motivation and previous results in our laboratory ............................................................................ 35
1.3.1.1. Sugarcane ..................................................................................................................................................... 35 1.3.1.2. Outstanding questions concerning thi1 function .......................................................................................... 36
1.3.2. General objective ............................................................................................................................... 37
1.3.3. Specific objectives .............................................................................................................................. 37
REFERENCES .................................................................................................................................... 38
2. THIAMINE THIAZOLE ENZYME (THI1): DIVERSITY IN PLANTS, MOLECULAR AND
FUNCTIONAL ANALYSES OF TWO SUGARCANE PARALOGS. .......................................... 43
ABSTRACT ......................................................................................................................................... 43
2.1. INTRODUCTION ........................................................................................................................................... 45 2.1.1. Economic relevance of sugarcane ...................................................................................................... 45
2.1.2. Sugarcane Biology ............................................................................................................................. 46
2.1.3. Study of thi1 homologues in sugarcane .............................................................................................. 48
2.2. MATERIAL AND METHODS .......................................................................................................................... 50 2.2.1. Screening sugarcane BAC libraries for sc-thi1 homologues ............................................................. 50
2.2.2. Synteny and phylogeny analyses ........................................................................................................ 50
2.2.3. Plant thi1 phylogeny .......................................................................................................................... 50
2.2.4. Saccharum thi1 diversity network analysis ........................................................................................ 52
2.2.5. RNA-seq analyses ............................................................................................................................... 52
2.2.6. Functional complementation assay .................................................................................................... 53
7
2.2.7. Subcellular localization ..................................................................................................................... 54
2.3. RESULTS ..................................................................................................................................................... 57 2.3.1. Genomic identification of sc-thi1 homologues ................................................................................... 57
2.3.2. Synteny and Phylogeny of thi1 in grasses .......................................................................................... 58
2.3.3. Thi1 nucleotide diversity in plants ..................................................................................................... 60
2.3.4. Genomic diversity in sugarcane cultivars .......................................................................................... 64
2.3.5. Differential expression analysis of sc-thi1 ......................................................................................... 67
2.3.5.1. Whole root and kernel top ............................................................................................................................ 67 2.3.5.2. Sporisorium scitamineum (smut disease) infection ...................................................................................... 68 2.3.5.3. Roots tips ...................................................................................................................................................... 69
2.3.6. Subcellular localization ..................................................................................................................... 69
2.3.7. Functional complementation assay .................................................................................................... 72
2.4. DISCUSSION ................................................................................................................................................ 75 2.5. CONCLUSIONS ............................................................................................................................................ 77
REFERENCES .................................................................................................................................... 78
3. CONSTRUCTION OF PLANT MODEL FOR FUNCTIONAL STUDY OF THI1
HOMOLOGUES ................................................................................................................................. 83
ABSTRACT ......................................................................................................................................... 83
3.1. INTRODUCTION ........................................................................................................................................... 85 3.1.1. Physcomitrella patens as a plant model............................................................................................. 85
3.1.2. Homologous Recombination .............................................................................................................. 86
3.2. MATERIAL AND METHODS .......................................................................................................................... 88 3.2.1. Plant material and growth conditions................................................................................................ 88
3.2.2. Gene copies identification .................................................................................................................. 88
3.2.3. Constructs for Homologous recombination ....................................................................................... 89
3.2.4. Transformation of Moss protoplasts .................................................................................................. 91
3.2.5. Morphological analysis ..................................................................................................................... 92
3.2.6. Effect of thiamine on mutant growth .................................................................................................. 92
3.2.7. Fresh and dry weights ........................................................................................................................ 94
3.2.8. Carbohydrate analysis ....................................................................................................................... 94
3.3. RESULTS AND DISCUSSION................................................................................................................. 95 3.3.1. Genomic identification of PpThi1 homologues .................................................................................. 95
3.3.2. Mutants lines generation by Homologous recombination ................................................................. 97
3.3.3. Morphological analysis of the protonemata ...................................................................................... 98
3.3.4. Effect of thiamine on mutant growth ................................................................................................ 100
3.3.5. Fresh and dry weight ....................................................................................................................... 103
3.3.6. Carbohydrate analysis ..................................................................................................................... 104
3.4. CONCLUSIONS .......................................................................................................................................... 106 3.5. PERSPECTIVES .......................................................................................................................................... 106
REFERENCES .................................................................................................................................. 107
4. FINAL CONSIDERATIONS ....................................................................................................... 109
REFERENCES .................................................................................................................................. 110
APPENDIX - BRACHYPODIUM DISTACHYON THI1 MUTANT LINES ................................ 111
8
ABSTRACT ....................................................................................................................................... 111
INTRODUCTION ................................................................................................................................................ 111 CRISPR/Cas ............................................................................................................................................... 112
MATERIAL AND METHODS ............................................................................................................................... 113 Plant material and growth conditions ........................................................................................................ 113
CRISPR/Cas9 technology ........................................................................................................................... 113
Seeds germination ...................................................................................................................................... 114
CRISPR/Cas mutation analysis .................................................................................................................. 114
RESULTS .......................................................................................................................................................... 115 The choice of target sequence of Bd-thi1 ................................................................................................... 115
Brachypodium distachyon transformants obtaining .................................................................................. 117
T1 analysis 118
DISCUSSION ..................................................................................................................................................... 120
REFERENCES .................................................................................................................................. 121
9
ABSTRACT
Sugarcane thi1 homologues: a molecular and functional study
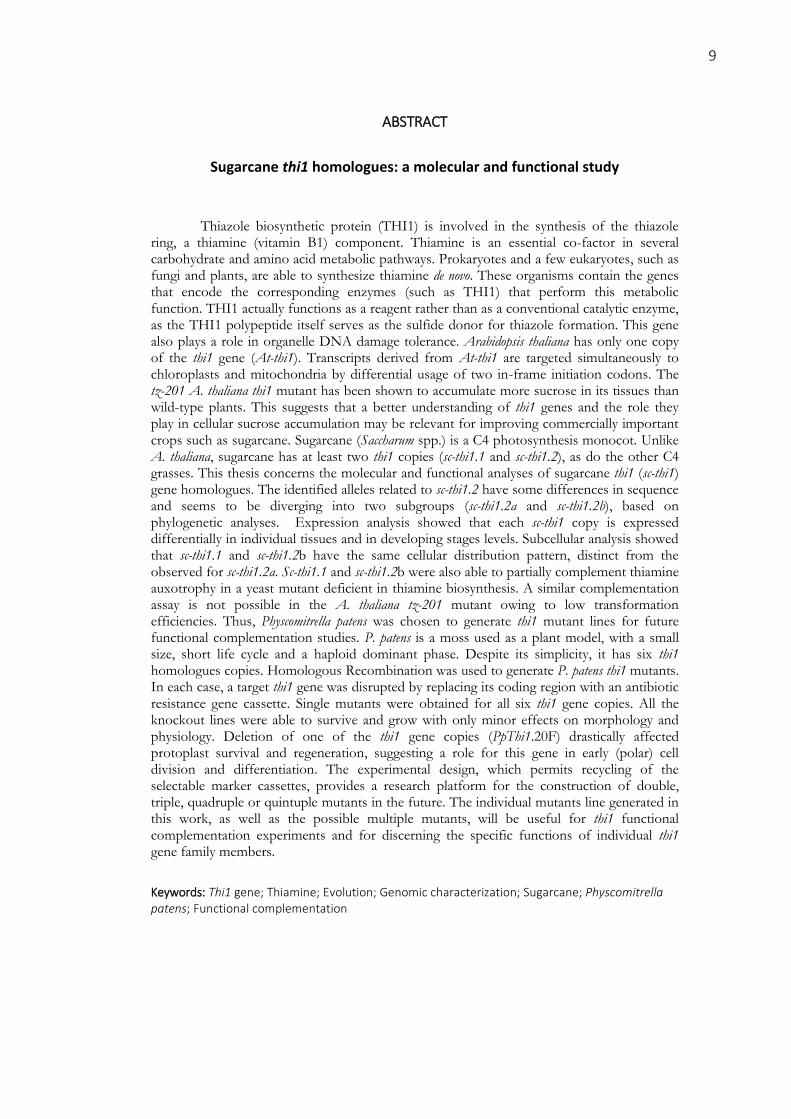
Thiazole biosynthetic protein (THI1) is involved in the synthesis of the thiazole ring, a thiamine (vitamin B1) component. Thiamine is an essential co-factor in several carbohydrate and amino acid metabolic pathways. Prokaryotes and a few eukaryotes, such as fungi and plants, are able to synthesize thiamine de novo. These organisms contain the genes that encode the corresponding enzymes (such as THI1) that perform this metabolic function. THI1 actually functions as a reagent rather than as a conventional catalytic enzyme, as the THI1 polypeptide itself serves as the sulfide donor for thiazole formation. This gene also plays a role in organelle DNA damage tolerance. Arabidopsis thaliana has only one copy of the thi1 gene (At-thi1). Transcripts derived from At-thi1 are targeted simultaneously to chloroplasts and mitochondria by differential usage of two in-frame initiation codons. The tz-201 A. thaliana thi1 mutant has been shown to accumulate more sucrose in its tissues than wild-type plants. This suggests that a better understanding of thi1 genes and the role they play in cellular sucrose accumulation may be relevant for improving commercially important crops such as sugarcane. Sugarcane (Saccharum spp.) is a C4 photosynthesis monocot. Unlike A. thaliana, sugarcane has at least two thi1 copies (sc-thi1.1 and sc-thi1.2), as do the other C4 grasses. This thesis concerns the molecular and functional analyses of sugarcane thi1 (sc-thi1) gene homologues. The identified alleles related to sc-thi1.2 have some differences in sequence and seems to be diverging into two subgroups (sc-thi1.2a and sc-thi1.2b), based on phylogenetic analyses. Expression analysis showed that each sc-thi1 copy is expressed differentially in individual tissues and in developing stages levels. Subcellular analysis showed that sc-thi1.1 and sc-thi1.2b have the same cellular distribution pattern, distinct from the observed for sc-thi1.2a. Sc-thi1.1 and sc-thi1.2b were also able to partially complement thiamine auxotrophy in a yeast mutant deficient in thiamine biosynthesis. A similar complementation assay is not possible in the A. thaliana tz-201 mutant owing to low transformation efficiencies. Thus, Physcomitrella patens was chosen to generate thi1 mutant lines for future functional complementation studies. P. patens is a moss used as a plant model, with a small size, short life cycle and a haploid dominant phase. Despite its simplicity, it has six thi1 homologues copies. Homologous Recombination was used to generate P. patens thi1 mutants. In each case, a target thi1 gene was disrupted by replacing its coding region with an antibiotic resistance gene cassette. Single mutants were obtained for all six thi1 gene copies. All the knockout lines were able to survive and grow with only minor effects on morphology and physiology. Deletion of one of the thi1 gene copies (PpThi1.20F) drastically affected protoplast survival and regeneration, suggesting a role for this gene in early (polar) cell division and differentiation. The experimental design, which permits recycling of the selectable marker cassettes, provides a research platform for the construction of double, triple, quadruple or quintuple mutants in the future. The individual mutants line generated in this work, as well as the possible multiple mutants, will be useful for thi1 functional complementation experiments and for discerning the specific functions of individual thi1 gene family members.
Keywords: Thi1 gene; Thiamine; Evolution; Genomic characterization; Sugarcane; Physcomitrella patens; Functional complementation
10
RESUMO
Homólogos a thi1 em cana-de-açúcar: estudo molecular e funcional
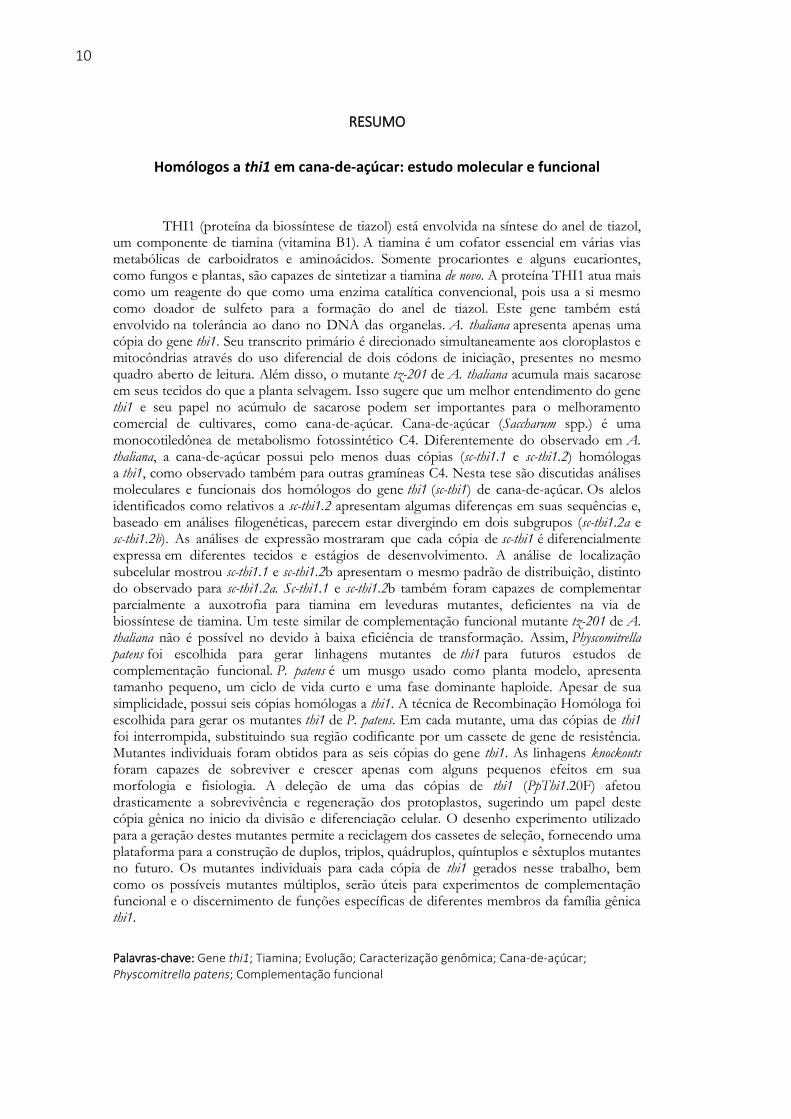
THI1 (proteína da biossíntese de tiazol) está envolvida na síntese do anel de tiazol, um componente de tiamina (vitamina B1). A tiamina é um cofator essencial em várias vias metabólicas de carboidratos e aminoácidos. Somente procariontes e alguns eucariontes, como fungos e plantas, são capazes de sintetizar a tiamina de novo. A proteína THI1 atua mais como um reagente do que como uma enzima catalítica convencional, pois usa a si mesmo como doador de sulfeto para a formação do anel de tiazol. Este gene também está envolvido na tolerância ao dano no DNA das organelas. A. thaliana apresenta apenas uma cópia do gene thi1. Seu transcrito primário é direcionado simultaneamente aos cloroplastos e mitocôndrias através do uso diferencial de dois códons de iniciação, presentes no mesmo quadro aberto de leitura. Além disso, o mutante tz-201 de A. thaliana acumula mais sacarose em seus tecidos do que a planta selvagem. Isso sugere que um melhor entendimento do gene thi1 e seu papel no acúmulo de sacarose podem ser importantes para o melhoramento comercial de cultivares, como cana-de-açúcar. Cana-de-açúcar (Saccharum spp.) é uma monocotiledônea de metabolismo fotossintético C4. Diferentemente do observado em A. thaliana, a cana-de-açúcar possui pelo menos duas cópias (sc-thi1.1 e sc-thi1.2) homólogas a thi1, como observado também para outras gramíneas C4. Nesta tese são discutidas análises moleculares e funcionais dos homólogos do gene thi1 (sc-thi1) de cana-de-açúcar. Os alelos identificados como relativos a sc-thi1.2 apresentam algumas diferenças em suas sequências e, baseado em análises filogenéticas, parecem estar divergindo em dois subgrupos (sc-thi1.2a e sc-thi1.2b). As análises de expressão mostraram que cada cópia de sc-thi1 é diferencialmente expressa em diferentes tecidos e estágios de desenvolvimento. A análise de localização subcelular mostrou sc-thi1.1 e sc-thi1.2b apresentam o mesmo padrão de distribuição, distinto do observado para sc-thi1.2a. Sc-thi1.1 e sc-thi1.2b também foram capazes de complementar parcialmente a auxotrofia para tiamina em leveduras mutantes, deficientes na via de biossíntese de tiamina. Um teste similar de complementação funcional mutante tz-201 de A. thaliana não é possível no devido à baixa eficiência de transformação. Assim, Physcomitrella patens foi escolhida para gerar linhagens mutantes de thi1 para futuros estudos de complementação funcional. P. patens é um musgo usado como planta modelo, apresenta tamanho pequeno, um ciclo de vida curto e uma fase dominante haploide. Apesar de sua simplicidade, possui seis cópias homólogas a thi1. A técnica de Recombinação Homóloga foi escolhida para gerar os mutantes thi1 de P. patens. Em cada mutante, uma das cópias de thi1 foi interrompida, substituindo sua região codificante por um cassete de gene de resistência. Mutantes individuais foram obtidos para as seis cópias do gene thi1. As linhagens knockouts foram capazes de sobreviver e crescer apenas com alguns pequenos efeitos em sua morfologia e fisiologia. A deleção de uma das cópias de thi1 (PpThi1.20F) afetou drasticamente a sobrevivência e regeneração dos protoplastos, sugerindo um papel deste cópia gênica no inicio da divisão e diferenciação celular. O desenho experimento utilizado para a geração destes mutantes permite a reciclagem dos cassetes de seleção, fornecendo uma plataforma para a construção de duplos, triplos, quádruplos, quíntuplos e sêxtuplos mutantes no futuro. Os mutantes individuais para cada cópia de thi1 gerados nesse trabalho, bem como os possíveis mutantes múltiplos, serão úteis para experimentos de complementação funcional e o discernimento de funções específicas de diferentes membros da família gênica thi1.
Palavras-chave: Gene thi1; Tiamina; Evolução; Caracterização genômica; Cana-de-açúcar; Physcomitrella patens; Complementação funcional

11
LIST OF FIGURES
Figure 1. Structure of thiamine. Thiamine is composed of a pyrimidine ring linked to a thiazole ring by a
methylene bridge (Berdanier and Adkins, 1998). ........................................................................................ 20
Figure 2. The role of thiamine in a plant cell. Plant cell structures are represented by green:
chloroplast; blue: mitochondria; yellow: cytoplasm; dark green: cell wall; orange: plasmatic membrane;
grey: nucleus; white: vacuole. ..................................................................................................................... 21
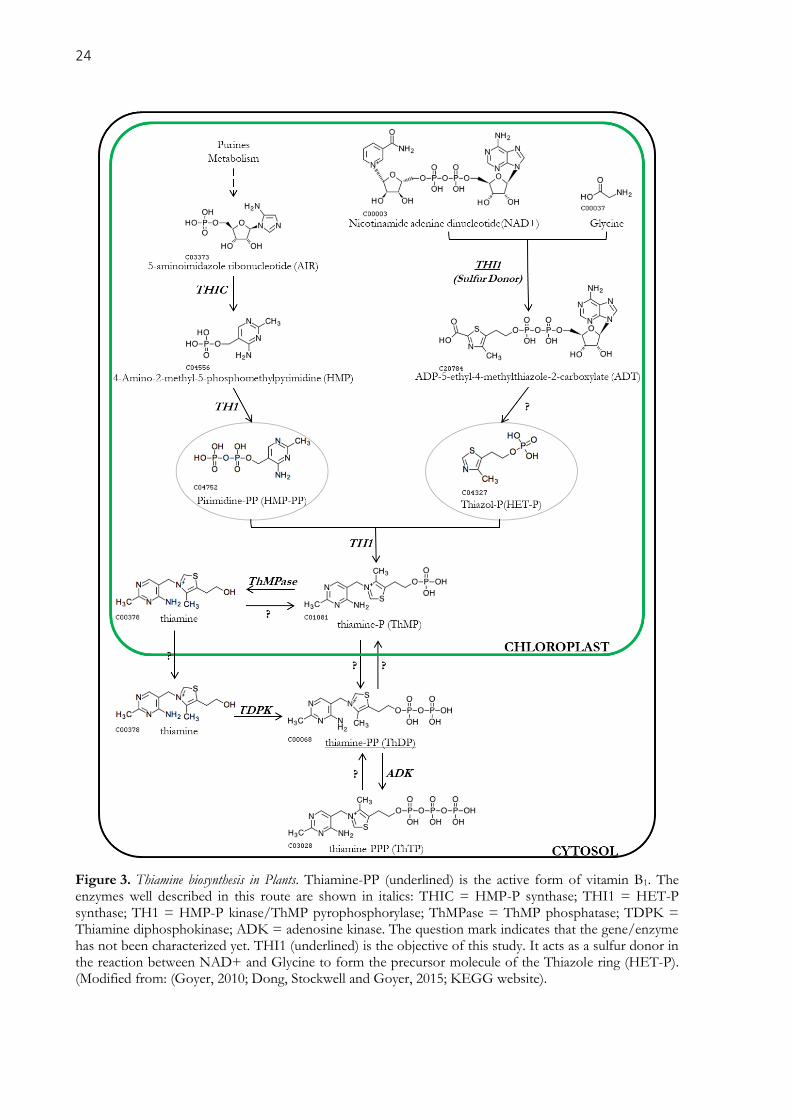
Figure 3. Thiamine biosynthesis in Plants. Thiamine-PP (underlined) is the active form of vitamin B1.
The enzymes well described in this route are shown in italics: THIC = HMP-P synthase; THI1 = HET-P
synthase; TH1 = HMP-P kinase/ThMP pyrophosphorylase; ThMPase = ThMP phosphatase; TDPK =
Thiamine diphosphokinase; ADK = adenosine kinase. The question mark indicates that the gene/enzyme
has not been characterized yet. THI1 (underlined) is the objective of this study. It acts as a sulfur donor in
the reaction between NAD+ and Glycine to form the precursor molecule of the Thiazole ring (HET-P).
(Modified from: (Goyer, 2010; Dong, Stockwell and Goyer, 2015; KEGG website). ................................. 24
Figure 4. ThDP (TPP) riboswitch-mediated regulation of the gene expression via alternative splicing in
vascular plants. The 3’ splice site is highlighted with an asterisk (reproduced from Bocobza et al., 2007). ..
................................................................................................................................................... 25
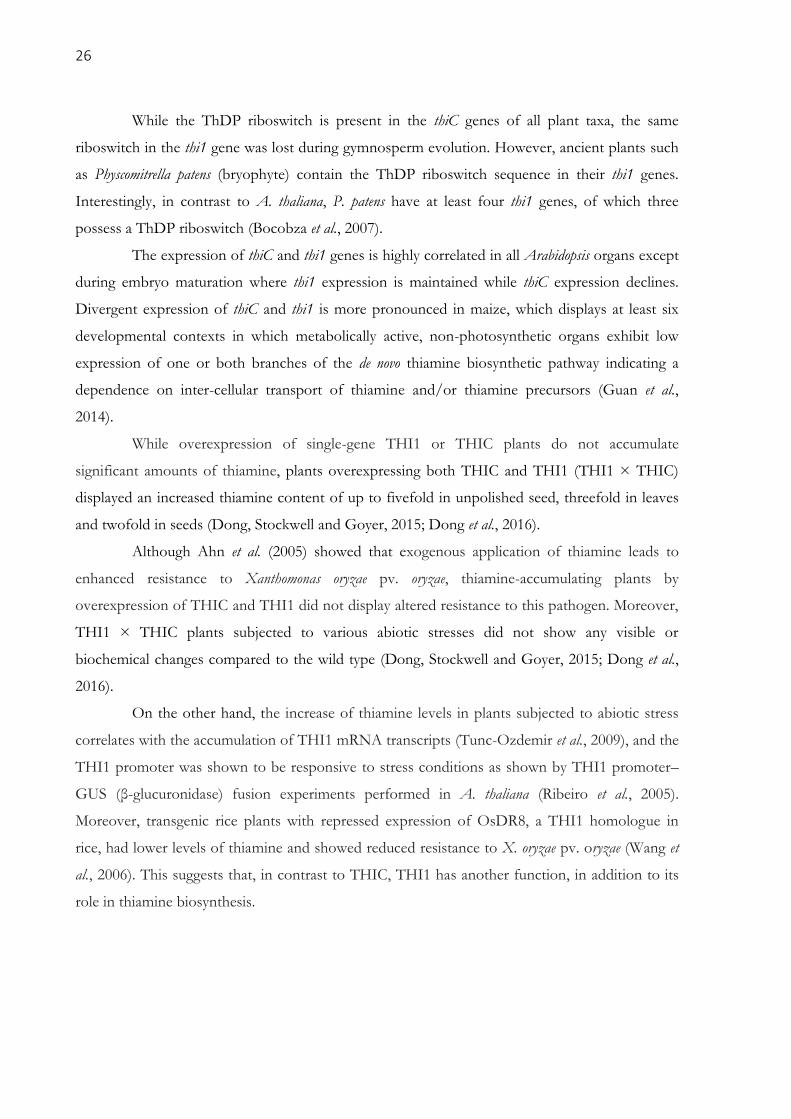
Figure 5. Probable sulfur loss reaction by the Cys172 of A-THI1 cysteine 172. ...................................... 28
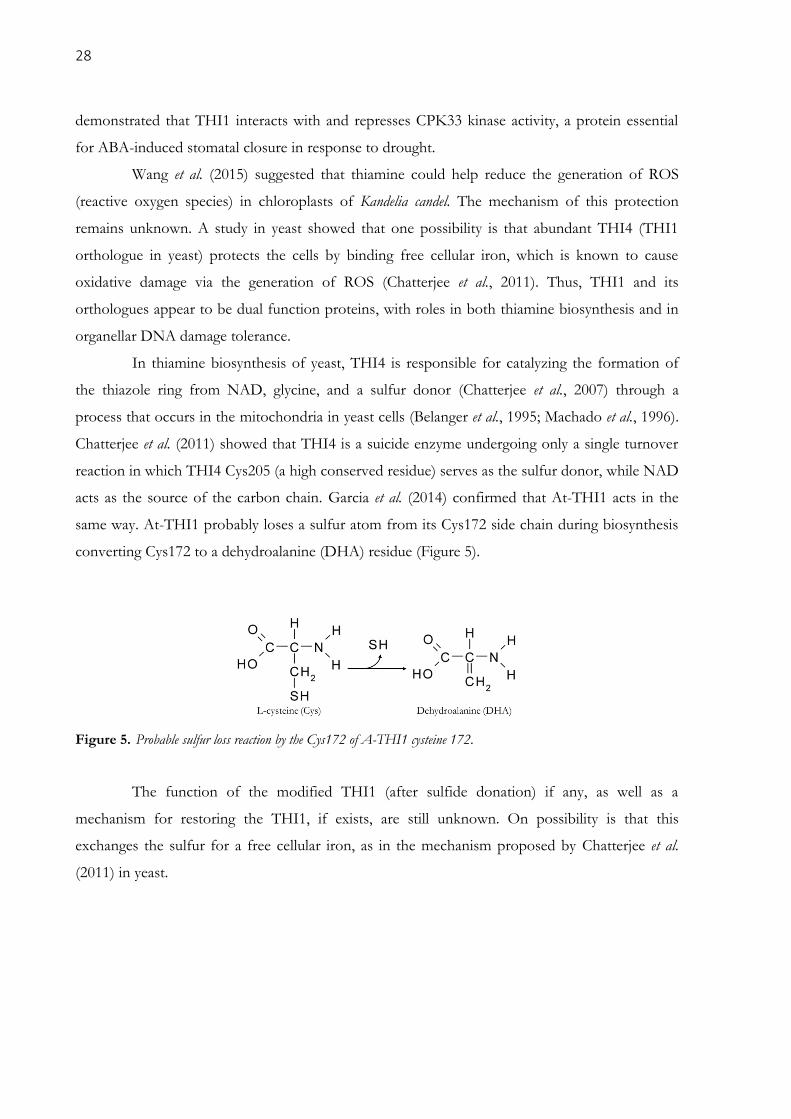
Figure 6. Structure of THI1. A) Monomeric structure: topology diagram of THI1 depicting the two
halves variation of mononucleotide-binding motifs, colored in magenta and blue. The first α-helix is in
yellow, β-subdomain is in green, and the β-meander is colored red. B) Octameric structure: each ring
torus layer was distinctly colored (gray and blue). All AHZ molecules are represented in red. (Modified
from Godoi et al. (2006)). ............................................................................................................................ 29
Figure 7. Schematic representation of the At-THI1 N-terminal region. Below the line is the consensus
sequence (single letter amino acid code) for translational initiation. Both start codons (methionine) are in
bold type. (Modified from Chabregas et al. (2001)). ................................................................................... 30
Figure 8. Dual targeting of THI1 in a plant cell. The thi1 gene translates to the THI1 protein (Machado
et al., 1996; Ribeiro et al., 1996; Papini-Terzi et al., 2003), which is targeted simultaneously to
mitochondria and to chloroplasts, where it acts in the thiamine synthesis (Chabregas et al., 2001). Plant
cell structures are represented by purple: nucleus; green: chloroplast; blue: mitochondria; yellow:
cytoplasm; dark green: cell wall; orange: plasmatic membrane; white: vacuole. ...................................... 31
Figure 9. Transcription of the A. thaliana thi1 gene follows a circadian rhythm. Thi1 mRNA levels
quantified by qRT-PCR in wild-type (WT) plants. Open and hatched bars along the horizontal axis
represent light and dark to LD condition, and subjective light and subjective dark to LL condition. LD:
Plants were submitted to 16 h photoperiod for 72 h. LL: Plants submitted to continuous light (free-
running) (Momoli, unpublished data) .......................................................................................................... 33
Figure 10. Comparison of phenotype and genotype between the A. thaliana WT (var. Ler) and the tz-201
mutant. Plants were grown in medium supplemented (+T) or not (–T) with thiamine. Below, a partial
nucleotide sequence of the thi1 gene showing the altered nucleotide in the mutant line (arrow). (Modified
from Papini-Terzi et al. (2003)). .................................................................................................................. 34
Figure 11. Summary of the role of thi1 gene on the thiamine metabolic pathways of A. thaliana. The thi1
gene translates to the THI1 protein (Machado et al., 1996; Ribeiro et al., 1996; Papini-Terzi et al., 2003)
The THI1 is targeted simultaneously to mitochondria – where it has a role in DNA protection – and to
chloroplast, where it contributes to thiamine synthesis (Chabregas et al., 2001, 2003). Thiamine acts as a
co-factor in many different metabolic pathways, as indicated. Plant cell structures are represented by
purple: nucleus; green: chloroplast; blue: mitochondria; yellow: cytoplasm; dark green: cell wall;
orange: plasmatic membrane; white: vacuole. ............................................................................................ 36
Figure 12. Map of sugarcane growing countries. Light green plants represent places where sugarcane is
cultivated (reproduced from SugarCane.org). ............................................................................................. 45
Figure 13. Top 10 countries in sugarcane production in 2016 (FAOSTAT website). ................................. 46

12
Figure 14. Schematic diagram of evolutionary history of grasses and sugarcane. BEP clade:
Bambusoideae, Ehrhartoideae and Pooideae subfamilies. Numbers indicate divergence times in million-
year units (Mya), relative to nearest common ancestors (reproduced from De Setta et al., 2014). ............. 47
Figure 15. Schematic representation of the genome of modern cultivars. White and gray bars correspond
to S. officinarum and S. spontaneum chromosomes or chromosome segments, respectively. Chromosomes
from the same row are homologous (or homeologous) (reproduced from D’Hont, 2005). ......................... 48
Figure 16. Destination vector pK7FWG2.0. Three sc-thi1 N-terminal (CTP+MPS) versions were
independently inserted between the attR1 and attR2 sites, replacing the lethal ccdB gene, using the
Gateway™ Technology, resulting in a C-terminal fusion of the GFP fluorescence tag (reproduced from:
Karimi, Inzé and Depicker, 2002). ............................................................................................................... 55
Figure 17. Structure of the thi1 gene in A. thaliana and in the Poaceae family. Black boxes represent
introns, gray boxes represent exons and dashed boxes represent untranslated regions (5’UTR to the left
and 3’UTR to the right). ............................................................................................................................... 58
Figure 18. Comparison of thi1 gene and its genomic flanking regions in sugarcane and other plants
through phylogenetic and synteny analyses. A) Maximum Parsimony tree inferred by MEGA5.1 using
Phylogeny reconstruction parameter and 1000 bootstrap replicates. The tree is based on the multiple
alignment of the two exons of the single thi1 copy from A. thaliana (at), O. sativa (os) and B. distachyon
(bd) and two copies of thi1 on chromosome 2 (siA) and 4 (siB) in S. italica, 2 (sbA) and 3 (sbB) in S.
bicolor, and 3 (zmA) and 8 (zmB) in Z. mays. B) Synteny analysis was performed using blastx between
sugarcane BAC sequences and sequences from the other genomes obtained from the Phytozome 9.1
database. Rectangles indicate genes. Accession number of the genes: 1-Sb03g025470; 2-Sb03g025480; 3-
Sb03g025490; 4-Sb03g025500; 5-Sb03g025510; 6-Sb03g025530; 7-Sb03g025540; 8-Sb03g025550; 9-
Sb03g025560; 10-Sb02g039980; 11-Sb02g039990; 12-Sb02g039995; 13-Sb02g040000; 14-Sb02g040010;
15-Sb02g040020; 16-Sb02g040040; 17-Sb02g040050; 18-Sb02g040070; 19-Sb02g040110; 20-
Sb02g040120; 21-Sb02g040140; 22-Sb02g040150; 23-Sb02g040160; 24-Si033048; 25-Si029341; 26-
Si030570; 27-Si033272; 28-Si030843; 29-Si006377; 30-Si006932; 31-Si005733; 32-Si006773; 33-
Si008008; 34-Si005676; 35-AT5G54745; 36-AT5G54750; 37-AT5G54760; 38-AT5G54780; 39-
AT5G54790; 40-AT5G54800; *Part of the Z. mays chromosome 7, which is syntenic to region B, but does
not have either thi1 copy II or gene 17. ....................................................................................................... 59
Figure 19. Plants THI1 alignment. The red arrows indicate the presence of both initiation codons. The
black arrow indicates the conserve cysteine residue. For reference, the THI14 (S. cerevisiae) is also shown
in the alignment. ........................................................................................................................................... 61
Figure 20. Comparison of THI1 protein among sugarcane and other plants. Neighbor-joining thi1
phylogenetic tree inferred by MEGA6.1 using thi1 CDS present in 38 plants. Highest ranked substitution
model (Tamura 3-parameter) and 500 bootstrap replicates were used. The * indicates the Monocot
branch. ................................................................................................................................................... 62
Figure 21. Overview of the genomic sequence alignment of the three sc-thi1 selected to represent each
group. Sc-thi1 is represented by 108_C04 BAC; sc-thi1.2a by 017_B18, and sc-thi1.2b by 094_O04. The
grey/black bar represents the sc-thi1 gene structure. CTP = chloroplast transit peptide; MPS =
mitochondrial pre-sequence; Green =A; Blue = T; orange = C; red = G. ................................................. 63
Figure 22. Amino acid sequence alignment of the three sc-thi1 selected to represent each group. The lines
below the sequence represent parts of the protein select for different analyses: dotted line region was used
in the Network analysis (section 2.3.4); dashed line region was used in the subcellular localization
analysis (section 2.3.3); and solid line region was used expression analysis (section 2.3.5). The black
arrow indicates the second initiation codon, which is the first amino acid of the Del-N constructs for
complementation assay (section 2.3.6). Color shades represent the identities and similarities among
amino acids, with a threshold of 50%. ......................................................................................................... 64
Figure 23. Network analysis of thi1 gene in Saccharum complex. The network was constructed using the
NETWORK 4.6.1.3 software (Bandelt et al., 1999) with default parameters. A 539 bp alignment of 210
sequences was used to construct the network. The right part of the figure is a close-up of the entire
network shown in the left. The size of the circles is proportional to the number of sequences in the
haplotype; the distance between clusters is proportional to the number of substitutions observed between
sequences. ................................................................................................................................................... 66
Figure 24. Comparative transcript expression of sc-thi1 versions in two tissues of a 3 months old R570
sugarcane plants. FPKM per tissue and sc-thi1 copy. ................................................................................. 67
13
Figure 25. Comparative transcript expression of sc-thi1 versions in two development stages of RB92-5345
sugarcane plants infected or not (control) with Sporisorium scitamineum (smut disease). FPKM per
sample and sc-thi1 copy. DAI = days after inoculation. Minimum and maximum values are represented by
the error bars. .............................................................................................................................................. 68
Figure 26. Transient expression of 35S-sc-thi1Nterminal-GFP fusions in WT. The images were taken by
confocal microscope LSM880 (Zeiss™). The GFP and chloroplast signals were collected separately and
later overlapped. Scale bar =100μm. .......................................................................................................... 71
Figure 27. Functional yeast complementation assay. S. cerevisiae strains W303 and KBY5 were
transformed with the three versions of thi1 gene found in sugarcane genome, and with the positive control
A184V and the negative control and DelN, and plated in YNB media with or without tryptophan and/or
thiamine. W = tryptophan and “thia” = thiamine. Each column represents one transformant. Lines
represent dilution series. a) and b) are the experimental controls to check if all strains are able to grow (a)
and if all transformed ones can grow without tryptophan (b). c) and d) show the growth after 4 days of
incubation, while e) and f) is after 28 days of incubation, both cases at 30ºC. ........................................... 74
Figure 28. Physcomitrella patens life cycle: haploid spores produce protonemal filaments that extend by
apical division and tip growth. The filaments produce buds that develop into leafy gametophores, which
enlarge by diffuse growth. Haploid spores are produced by diploid sporophytes, which develop from eggs
fertilized by swimming sperm at the gametophore apex. Modified from PHYSCObase database. .............. 85
Figure 29. Homologous recombination during meiosis. Modified from http://academic.pgcc.edu. ........... 87
Figure 30. Homologous recombination scheme: The target gene represents any thi1 copy. The regions A
and B were chosen as HR targeting sequences. The gene targeting plasmid contains a selection marker in
between regions A and B. After cell transformation, HR occurs between the gene targeting plasmid and the
targeted native gene locus, resulting in Targeted Gene Replacement (TGR) or gene knockout (KO). The
black arrowheads represent loxP sites (present only in the constructions using pNT82 and pBSMDIIIa
vectors) which can be used to remove the selectable marker from the target gene locus. Modified from
Kuwayama (2012). ....................................................................................................................................... 89
Figure 31. Experimental scheme comprising protoplast isolation, PEG-mediated transformation,
antibiotic selection and regeneration of P. patens transformants. .............................................................. 91
Figure 32. Image filtering process. ............................................................................................................. 93
Figure 33. P. patens thi1 copies: The chromosomes 20, 23 and 24 are represented, showing the regions
containing thi1 copies (dark grey). Other genes at the same region are showing in light grey. The arrow
points to the gene orientation. ..................................................................................................................... 95
Figure 34. Overview of the alignment of the six PpThi1 genomic. The grey/black bar represents the gene
structure. Green =A; Blue = T; orange = C; red = G. ............................................................................... 96
Figure 35. Overview of protein alignment among the five PpTHI1. The blues shading indicates regions of
protein identity (dark blue = 100% identity and white = 0%). CTP = chloroplast transit peptide; MPS =
mitochondrial pre-sequence. CTP and MPS were marked based on predictions made for these sequences
in At-thi1 (Chabregas et al. 2003). .............................................................................................................. 96
Figure 36. Experimental design for constructing P. patens line mutants for single thi1 copy, by HR. The
chromosomes 20, 23 and 24 are represented, showing the regions containing thi1 copies (different shades
of green). Other genes at the same region are showing in light grey. The block arrows indicates gene
orientation. The solid black arrowheads represent loxP sites. Grey lines indicate the HR process, which
replaces each PpThi1 by a different resistance gene. (zeo = zeocin; hyg = hygromycin; G418 = geneticin).
................................................................................................................................................... 97
Figure 37. PCR amplification of internal sequence from inside each correspondent resistance gene from
mutants genomic DNA. 1 – PpThi1.20R-hyg; 2 – PpThi1.23R-hyg; 3 – WT (hyg); 4 – PpThi1.24-zeo; 5 –
WT (zeo); 6 – PpThi1.20F-G418; 7 – PpThi1.23F-G418; 8 – WT (G418). ................................................. 98
Figure 38. Protonemata-rich mutant cultures were fragmented (blended) and transferred onto BCDAT
and BCDATG (which is the same as BCDAT supplemented with 0.5% glucose) medium. DAB = days after
blend. Scale bar = 500μm. ........................................................................................................................... 99
Figure 39. Examples of PpThi1 mutant colonies presenting a globular structure at the tip of the
protonemata. From left to right: 5x, 20x and 40x magnification in microscopy. ...................................... 100
14
Figure 40. Increase in culture area from 1 to 2 weeks in the presence or absence of thiamine (0.5 mg/L). ...
................................................................................................................................................. 101
Figure 41. Increase in culture area from 1 to 3 weeks in the presence or absence of thiamine (0.5 mg/L). ...
................................................................................................................................................. 101
Figure 42. Examples of PpThi1 mutant colonies grown with or without 0.5 mg/L thiamine addition. Scale
bar = 2 mm. ................................................................................................................................................ 103
Figure 43. Dry and fresh weight ratio for different PpThi1 mutants samples........................................... 104
Figure 44. Carbohydrate content of PpThi1 mutant lines. The vertical bar indicates the standard
deviation. ................................................................................................................................................. 105
Figure 45. Brachypodium distachyon: A) Spikelet containing typically around 10 to 12 seeds. B) B.
distachyon exhibit undemanding maintenance requirements, growing successfully under sterile conditions
in glass jars on vermiculite supplemented with 0.5x Hoagland solution. Bar = 5 cm C) The smaller stature
of B. distachyon allows typical planting densities of at least 300 plants square meter in ordered arrays for
seed production or mutant screening. Modified from (Draper et al., 2001). ............................................. 112
Figure 46. Final expression plasmid to gene edition of monocotyledonous plants by CRISPR/Cas9. The
gRNA is the genome specific part and, here, is the bd-thi1 gRNA. Two version were obtained: one with the
hygromycin resistance gene (HygR), and the other with the geneticin resistance gene (G418
R). .............. 113
Figure 47. At-thi1 and Bd-thi1 cDNA alignment. The Bd-thi1 gRNA target is highlighted to the left. The
highlight to the right is the altered codon of A. thaliana tz-201 mutant, and the C which is substituted by a
T is pointed by the arrow. The differences in the same codon in B. distachyon are silent mutations. ....... 115
Figure 48. Part of the protein alignment of all thi1-like sequence from sequenced plants available in
Phytozome, highlighting the gRNA tagert to CRISPR/Cas edition of the thi1 gene in B. distachyon. ....... 116
Figure 49. B. distachyon calli in selective media. Three weeks of selection after bombardment (35 mg/L of
hygromycin; 25 mg/L of gentamicin). The brown calli will not survive. a) Transformants of hygromycin
resistance CRISPR/Cas9 plasmid shows about 60% survivor rate. b) Transformants of G418 resistance
CRISPR/Cas9 plasmid shows about 30% survivor rate. ............................................................................ 117
Figure 50. B. distachyon calli in regeneration media. a) After two weeks on regeneration selective media
(5 mg/L of hygromycin; 10 mg/L of gentamicin), many calli died (brown) and some starts to regenerate
(arrows). b) On media without thiamine addition the regenerants plants are bleached (arrow). c) Rooting
media whit thiamine. .................................................................................................................................. 117
Figure 51. B. distachyon regeneranted plants. a) Overview of the 22 regenerants. b) Highlighting of the
immature seeds. .......................................................................................................................................... 118
Figure 52. T1 germinated plants. The scale bar is 30 cm ruler. ............................................................... 119
Figure 53. Alignment of the region containing the gRNA target sequenced for the 11 plants obtained and
the WT. ................................................................................................................................................. 119
15
LIST OF TABLES
Table 1. Organisms from Phytozome v9.1 database which present At-thi1 homologues sequences in their
genomes. The raw number of transcripts found in the database for each organism and number of
transcripts selected to be used in this study are shown. ............................................................................... 51
Table 2. Selected BACs for sc-thi1 presence .............................................................................................. 57
Table 3. Percentage of identity among the three sc-thi1 CDS. .................................................................. 63
Table 4. Number of assembled clones from each genome (total number and number related to each sc-
thi1 copy). .................................................................................................................................................... 65
Table 5. Prediction in subcellular localization of silico using different predictors. .................................. 69
Table 6. Primer design to construction of HR plasmids. ........................................................................... 90
Table 7. HSV limits used to create the image mask ................................................................................... 93
Table 8. Percentage of nucleotide identity among PpThi1 copies. Highlighted in black is the identity
between PpTthi1.3 R copies of chromosome 23. .......................................................................................... 95
Table 9. Percentage of amino acid identity among PpTHI1 copies. .......................................................... 96
Table 10. P. patens regenerants colonies after three or more attempts to transform the HR plasmids. ...... 98
Table 11. Average increase of the colonies areas between 1 and 2 weeks, and 1 and 3 weeks. ................ 102
Table 12. Description of the plasmids used to CRISPR/Cas9 gene edition of the B. distachyon thi1 gene. ....
................................................................................................................................................... 114
Table 13. B. distachyon regenerants and F1 seeds obtained after three attempts to transform the plasmids
which direct the Cas9 protein to Bd-thi1 in order to gene edition. ............................................................ 118
16
LIST OF ABBREVIATIONS AND ACRONYMS
ABA – Abscisic acid
ADK – Adenosine kinase
ADT – Adenosine diphospho-5-(b-ethyl)-4-methylthiazole-2-carboxylic acid
AHZ – 2-carboxylate-4-methyl-5-β-(ethyl adenosine 5’-diphosphate) thiazole
AIR – 5-aminoimidazole ribonucleotide
ANFAEVA – Associação Nacional dos Fabricantes de Veículos Automotores (National Association of
Motor Vehicle Manufacturers)
At – Arabidopsis thaliana
BAC – Bacterial artificial chromosome
Bd – Brachypodium distachyon
BLAST – Basic Local Alignment Search Tool
CaMV 35S – Cauliflower Mosaic Virus 35S promoter
cDNA – Complementary DNA
CDS – Coding DNA Sequence
CEFAP – Centro de Facilidade de Apoio a Pesquisa da Universidade de São Paulo (Facility Center for
Research Support of University of São Paulo)
CI – Consistency Index
cpDNA – Chloroplast DNA
CPK33 – Calcium-dependent protein kinase 33
CTP – Chloroplast transited peptide
DAB -– Days after blend
DAI – Days after inoculation
DHA – Dehydroalanine
DNA – Deoxyribonucleic acid
DSBs – DNA double-strand breaks
ER – Endoplasmic reticulum
EST – Expressed sequence tag
FAD – Flavin adenine dinucleotide
FAO - Food and Agriculture Organization of the United Nations
FAOSTAT – Food and Agriculture Organization of the United Nations: Statistics
FPKM – Fragments Per Kilobase Million
GaTE Lab – Genomic and transposable element Laboratory
GFP – Green fluorescence protein
GUS – β-glucuronidase
HAD – Haloacid dehalogenase phosphatase
HET-P -– Thiazole ring or 4-methyl-5-b-hydroxyethylthiazole phosphate
HMP-P – 4-amino-2-methyl-5-hydroxymethylpyrimidine monophosphate
HMP-PP – Pyrimidine ring or 4-amino-2-methyl-5-hydroxymethylpyrimidine diphosphate
HR -– Homologous recombination
KO – Knockouts
17
LAFIECO – Laboratório de Fisiologia Ecológica de Plantas (Laboratory of Ecological Plant
Physiology)
LD – Light-Dark
LL – Light- Light
MMR – Mismatch repair
MPS – Mitochondrial pre-sequence
mRNA – Messenger RNA
MYA – Million years ago
NAD – Nicotinamide adenine dinucleotide
NAD(P) – Nicotinamide adenine dinucleotide phosphate
PCR – Polymerase chain reaction
PEG – Polyethylene glycol
Pi – Inorganic phosphate
Pp – Physcomitrella patens
qRT-PCR – Real time quantitative PCR
RENAVAM – Registro Nacional de Veículos Automotores (National Registry of Motor Vehicles)
RI – Retention Index
RNA – Ribonucleic acid
RNA-seq – RNA sequencing
ROS – Reactive oxygen species
RPKM – Reads Per Kilobase Million
SAS – Sugarcane Assembled Sequences
sb – Sorghum bicolor
sc – Sugarcane
si – Setaria italica
SUCEST – Sugarcane expressed sequence tag
TDPK -– ThDP kinase or Thiamine diphosphokinase
TGR -– Targeted gene replacement
TH1 – Biosynthetic bifunctional enzyme (HMP-P kinase/ThMP pyrophosphorylase)
ThDP (or ThPP or TPP) – Thiamine diphosphate or thiamine pyrophosphate ThMP
pyrophosphorylase
THI1 -– Thiazole biosynthetic protein (plants)
thi1as – thi1 antisense
thi1s – thi1 sense
THI4 – Thiazole biosynthetic protein (yeast)
THIC – HMP-P synthase
ThMP – Thiamine monophosphate
ThMPase – ThMP phosphatase
ThTP – Thiamine triphosphate
USP – University of São Paulo
UTR – Untranslated region
WT – Wild-type
zm – Zea mays
18
LIST OF SYMBOLS
°C – Degrees Celsius
bp – Base pairs
cm – Centimeter
Gb – Gigabase
Kb – Kilobase
L – Liters
Mbp – Megabase pair
mg – Milligram
ml – Milliliter
mm – Millimeter
mM – Millimolar
nm – Nanometer
μl – Microliter
μm – Micrometer
19
1. INTRODUCTION
1.1. Thiamine
Thiamine was the first of the water-soluble vitamins to be identified, leading to the
discovery of more such trace compounds essential for survival and to the notion of vitamin. It
was also the first vitamin B to be described, hence the name B1. It was isolated from rice
polishings as the “anti-beriberi factor” in 1926 by Jansen and Donath, 300 years after the Dutch
physicist Jacobus Bonitus described the beriberi (meaning “sheep”) disease on Java. He wrote in
1630 [(Friedrich, 1988)]:
“A certain troublesome affliction which attacks men is called by the inhabitants [of Java] beriberi. I believe those
whom this disease attacks with their knees shaking and legs raised up, walk like sheep. It is a kind of paralysis or
rather tremor: for it penetrates the motion and sensation of the hands and feet, indeed, sometimes the whole
body…”
In the 19th century, beriberi was widespread in eastern and Southeast Asia, and it was
especially a problem for sailors on long voyages. The first insight into the real cause of beriberi
came in the 1880s in the Japanese Navy, when a correlation between the sailors’ diet and beriberi
was noted by a Japanese naval surgeon, Kanehiro Takaki. After changing their diet, introducing
meat and dry milk, the incidence of beriberi plummeted sharply. Despite this compelling
connection, most of the medical community continued to believe that beriberi was the result of a
microbial infection or a toxin produced by a microorganism (Fattal-Valevski, 2011).
In 1886 a Dutch medical officer, Dr. Christian Eijkman, discovered that chickens fed
with white (polished or milled) rice developed a beriberi-like condition (polyneuritis), whereas red
(partially polished) rice, unhusked rice (padi) and rice hulls prevented and even cured the disease.
In 1901, another Dutch physician, Grijens, theorized that natural foodstuffs contained an
unknown factor, absent in polished rice, which prevents the development of the disease
(Berdanier and Adkins, 1998).
In 1906, Frederick Gowland Hopkins, a biochemist at Cambridge University, expressed
the belief that there were unsuspected “dietetic factors” besides protein, carbohydrates, fat, and
minerals that were vital for health (Semba and Bloem, 2008). In 1911 a young chemist in London,
Dr. Casimir Funk, crystallized an amine substance from rice bran. He thought he had isolated the
dietary factor involved in beriberi and coined the name vitamin (from “vital amine) for it (Funk,
1911). A year later, he presented the idea that beriberi, pellagra and scurvy were all nutritional

20
deficiency diseases. Later, in 1929, Eijkman and Hopkins received the Nobel Prize because their
observations led to the discovery of vitamins (Semba and Bloem, 2008).
In 1926, Jansen and Donath finally isolated a compound from rice bran and named it
aneurine. Unfortunately, those investigators missed the sulfur atom, and their published incorrect
formula for aneurine caused confusion for several years. In the 30’s, Williams and Cline
published the first correct formula and synthesis for the vitamin, and came up with a new name
“thiamin”. The American Chemical Society added an “e” and “thiamine” is now the accepted
term (Fattal-Valevski, 2011).
1.1.1. Thiamine structure and its role in metabolism
The name thiamine comes from the fact that the compound contains both a sulfur
group (the thiol group) and nitrogen in its structure. Thiamine is a relatively simple compound of
a pyrimidine (4-amino-2-methyl-5-pyrimidyl) ring linked to a thiazole (4-methyl-5-β-
hydroxyethylthiazolium) ring by a methylene bridge (Figure 1). It can be phosphorylated on its
hydroxyl group to form thiamine monophosphate (ThMP), diphosphate (ThDP), or triphosphate
(ThTP) esters (Berdanier and Adkins, 1998).
Figure 1. Structure of thiamine. Thiamine is composed of a pyrimidine ring linked to a thiazole ring by a methylene bridge (Berdanier and Adkins, 1998).
Thiamine diphosphate (ThDP), also called thiamine pyrophosphate (ThPP) or
cocarboxylase, is the active (coenzymic) form of thiamine and it is the most abundant
intracellular form of this vitamin in plants (Ajjawi, Tsegaye and Shintani, 2007) and yeast
(Schweingruber et al., 1991). It is essential to all living organisms as it serves as enzymatic cofactor
in biosynthesis of terpenes, and branched-chain amino acids (valine, leucine and isoleucine) and
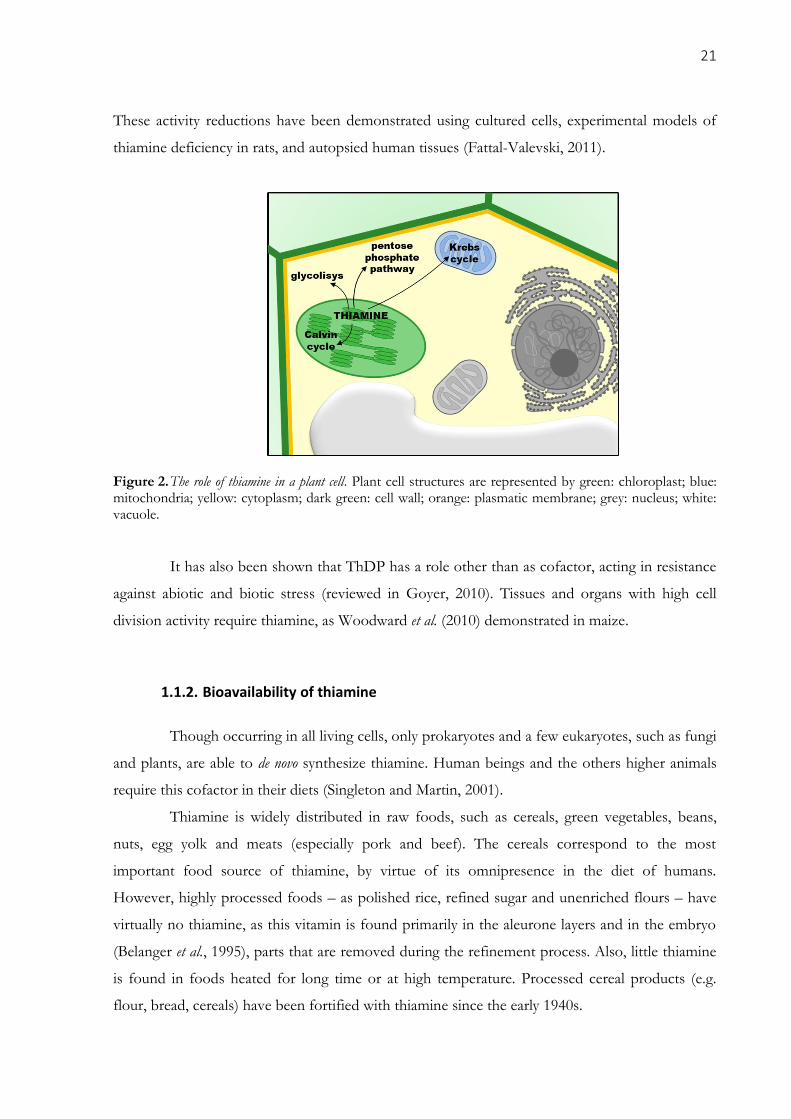
in a variety of carbohydrate metabolic pathways, including the Calvin cycle, nonoxidative pentose
phosphate pathways, the citric acid cycle, and glycolysis (Figure 2). Some of the enzymes for
which it serves as cofactors include transketolase, pyruvate dehydrogenase and α-ketoglutarate
dehydrogenase (Belanger et al., 1995). Deficiency of thiamine leads to a reduction in the activity
of these enzymes, which is different for each enzyme and shows a strong cell-type dependency.
21
These activity reductions have been demonstrated using cultured cells, experimental models of
thiamine deficiency in rats, and autopsied human tissues (Fattal-Valevski, 2011).
Figure 2. The role of thiamine in a plant cell. Plant cell structures are represented by green: chloroplast; blue: mitochondria; yellow: cytoplasm; dark green: cell wall; orange: plasmatic membrane; grey: nucleus; white: vacuole.
It has also been shown that ThDP has a role other than as cofactor, acting in resistance
against abiotic and biotic stress (reviewed in Goyer, 2010). Tissues and organs with high cell
division activity require thiamine, as Woodward et al. (2010) demonstrated in maize.
1.1.2. Bioavailability of thiamine
Though occurring in all living cells, only prokaryotes and a few eukaryotes, such as fungi
and plants, are able to de novo synthesize thiamine. Human beings and the others higher animals
require this cofactor in their diets (Singleton and Martin, 2001).
Thiamine is widely distributed in raw foods, such as cereals, green vegetables, beans,
nuts, egg yolk and meats (especially pork and beef). The cereals correspond to the most
important food source of thiamine, by virtue of its omnipresence in the diet of humans.
However, highly processed foods – as polished rice, refined sugar and unenriched flours – have
virtually no thiamine, as this vitamin is found primarily in the aleurone layers and in the embryo
(Belanger et al., 1995), parts that are removed during the refinement process. Also, little thiamine
is found in foods heated for long time or at high temperature. Processed cereal products (e.g.
flour, bread, cereals) have been fortified with thiamine since the early 1940s.
22
In humans, thiamine uptake is enhanced by thiamine deficiency and is decreased by
thyroid hormone, diabetes, alcohol and age. Chronic alcohol consumption is the most common
cause of acute thiamine deficiency in affluent societies (Depeint et al., 2006). Thiamine is
absorbed primarily in the duodenum and proximal jejunum small intestine by a specific active
transport mechanism. At high concentrations, however, thiamine uptake appears to take place
through simple passive diffusion (Laforenza et al., 1997). A significant amount of the absorbed
thiamine is phosphorylated, mainly to ThPP, thereby trapping the transported thiamine inside the
absorptive cell. Intracellular ThPP is dephosphorylated by microsomal phosphatases to produce
free thiamine before exit (Ball, 2004).
All cells of the body can accumulate thiamine. However, the human body does not store
enough of this vitamin and thus a daily supply is needed. The total thiamine in the body is only
about 30 mg, with 40% residing in the muscle and the rest found mainly in the brain, heart, liver
and kidney (Depeint et al., 2006). Thiamine excess is excreted in the urine (Berdanier and Adkins,
1998).
The thiamine needs of an individual are influenced by age, energy intake, carbohydrate
intake, body weight and pregnancy. The U.S. Food and Nutrition Board (1998) recommend an
average dietary allowance of 1.0 mg/day. Fitzpatrick et al. (2012) estimated that thiamine content
should be increased 3.9-, 5.7- and 3.0-fold in wheat, rice and corn, respectively, to reach the
recommended daily allowance if any one of these crops represents 80% of the daily intake of
calories.
1.1.3. Thiamine biosynthesis
Thiamine biosynthesis occurs in bacteria, some protozoans, plants, and fungi. Since
thiamine was described, many studies have been done to elucidate the biochemical basis for its
synthesis in both prokaryotes and eukaryotes. For both kingdoms, the thiamine diphosphate
(ThDP) biosynthesis involves the separate syntheses of the thiazole (4-methyl-5-b-
hydroxyethylthiazole phosphate, HET-P) and pyrimidine (4-amino-2-methyl-5-
hydroxymethylpyrimidine diphosphate, HMP-PP) moieties which are subsequently coupled, with
the corresponding release of phosphate (Pi).
In plants, the pyrimidine moiety (HMP-PP) of thiamine is very likely synthesized via a
pathway identical to that of bacteria in which the first committed step involves a complex
chemical rearrangement of 5-aminoimidazole ribonucleotide (AIR) to 4-amino-2-methyl-5-
hydroxymethylpyrimidine monophosphate (HMP-P) which is catalyzed by HMP-P synthase
23
(THIC). Then, HMP-P is phosphorylated to HMP-PP (the pyrimidine ring) by thiamine
biosynthetic bifunctional enzyme (TH1) (which also catalyzes the condensation of HMP-PP and
HET-P) (Goyer, 2010) (Figure 3). Indeed, a homologue of bacterial THIC was characterized in
Arabidopsis (Raschke et al., 2007; Kong et al., 2008), and homologue of bacterial TH1 were
characterized in Brassica napus (Kim et al., 1998), Zea mays (Rapala-Kozik et al., 2007) and
Arabidopsis (Ajjawi, Tsegaye and Shintani, 2007).
In the case of the thiazole moiety (HET-P), prokaryotes and eukaryotes use different
pathways. Thiazole biosynthesis in bacteria is well characterized and involves a complex chain of
oxidative condensation reactions that use 1-deoxy-D-xylulose-5-phosphate, glycine (or tyrosine)
and a sulfur source (Jurgenson, Begley and Ealick, 2009). Sulfur is proposed to be derived from
cysteine and incorporated into the thiazole ring by a series of enzyme-mediated sulfur transfer
steps that are encoded by six genes: ThiS, ThiF, ThiG, ThiI, and IscS (NifS) (Hwang et al., 2014).
In eukaryotes, a different pathway leads to the formation of the thiazole moiety and
depends on a single gene product, the so-called thiamine thiazole synthase: THI1 in Arabidopsis
thaliana (Machado et al., 1996) and THI4 in Saccharomyces cerevisiae (Praekelt and Meacock, 1992).
THI1 catalyzes the formation of an adenylated thiazole product (ADT, adenosine diphospho-5-
(b-ethyl)-4-methylthiazole-2-carboxylic acid) from NAD, glycine and a sulfide group (Chatterjee
et al., 2007) which is subsequently hydrolyzed to HET-P by a so-far-uncharacterized enzyme
(Dong et al., 2016). Chatterjee et al. (2011) demonstrated that the THI1 homologue in yeast
(THI4) uses itself as a sulfide donor for thiazole formation, modifying itself. In other words, the
donor protein functions as a reagent rather than as a conventional catalytic enzyme. The function
of the modified THI1 (after sulfide donation) if any, is still unknown.
Thiazole biosynthesis in archaea is poorly understood. Interestingly, most archaea have
homologues that cluster to the THI4 family proteins, but lack the conserved cysteine residue of
the yeast protein and instead have a histidine residue which is well conserved. Hwang et al. (2014),
studying Haloferax volcanii, proposed a model in which bacterial related enzymes are used for
synthesis of the pyrimidine moiety and eukaryotic enzymes are used for formation of the thiazole
ring in archaea that present the cysteine residue (halophilic archaea and ammonium oxidizing
archaea).
ThMP is then dephosphorylated to thiamine by at least one phosphatase from the
haloacid dehalogenase phosphatase (HAD) family (ThMPase (Hasnain et al., 2016)). Both ThMP
and thiamine are transported from the chloroplast to the cytosol by unknown enzyme. Thiamine
is then pyrophosphorylated to ThDP by ThDP kinase (TDPK) in the cytosol (Ajjawi et al., 2007).
ADK add another phosphate to ThDP to form ThTP (Dzeja and Terzic, 2009).
24
Figure 3. Thiamine biosynthesis in Plants. Thiamine-PP (underlined) is the active form of vitamin B1. The enzymes well described in this route are shown in italics: THIC = HMP-P synthase; THI1 = HET-P synthase; TH1 = HMP-P kinase/ThMP pyrophosphorylase; ThMPase = ThMP phosphatase; TDPK = Thiamine diphosphokinase; ADK = adenosine kinase. The question mark indicates that the gene/enzyme has not been characterized yet. THI1 (underlined) is the objective of this study. It acts as a sulfur donor in the reaction between NAD+ and Glycine to form the precursor molecule of the Thiazole ring (HET-P). (Modified from: (Goyer, 2010; Dong, Stockwell and Goyer, 2015; KEGG website).
25
1.1.4. Metabolic control of thiamine level
THIC, which synthesizes the pyrimidine moiety, and THI1, which synthesizes the
thiazole moiety, are key enzymes in thiamine metabolism, and, as such, are obvious targets for
thiamine engineering. Many studies have been done using these two enzymes.
Thiamine biosynthesis is largely regulated by the biological clock. It was demonstrated
that both the thiC and thi1 promoters are under the control of the circadian clock (Momoli, 2008;
Bocobza et al., 2013, respectively).
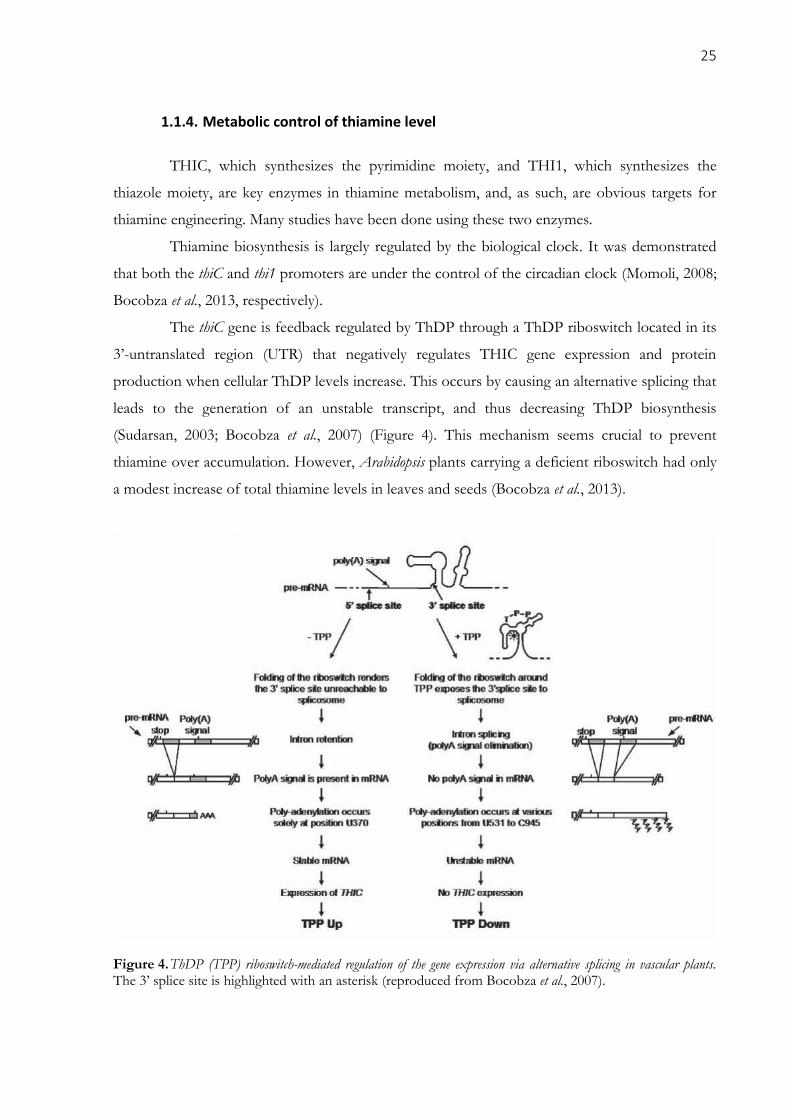
The thiC gene is feedback regulated by ThDP through a ThDP riboswitch located in its
3’-untranslated region (UTR) that negatively regulates THIC gene expression and protein
production when cellular ThDP levels increase. This occurs by causing an alternative splicing that
leads to the generation of an unstable transcript, and thus decreasing ThDP biosynthesis
(Sudarsan, 2003; Bocobza et al., 2007) (Figure 4). This mechanism seems crucial to prevent
thiamine over accumulation. However, Arabidopsis plants carrying a deficient riboswitch had only
a modest increase of total thiamine levels in leaves and seeds (Bocobza et al., 2013).
Figure 4. ThDP (TPP) riboswitch-mediated regulation of the gene expression via alternative splicing in vascular plants. The 3’ splice site is highlighted with an asterisk (reproduced from Bocobza et al., 2007).
26
While the ThDP riboswitch is present in the thiC genes of all plant taxa, the same
riboswitch in the thi1 gene was lost during gymnosperm evolution. However, ancient plants such
as Physcomitrella patens (bryophyte) contain the ThDP riboswitch sequence in their thi1 genes.
Interestingly, in contrast to A. thaliana, P. patens have at least four thi1 genes, of which three
possess a ThDP riboswitch (Bocobza et al., 2007).
The expression of thiC and thi1 genes is highly correlated in all Arabidopsis organs except
during embryo maturation where thi1 expression is maintained while thiC expression declines.
Divergent expression of thiC and thi1 is more pronounced in maize, which displays at least six
developmental contexts in which metabolically active, non-photosynthetic organs exhibit low
expression of one or both branches of the de novo thiamine biosynthetic pathway indicating a
dependence on inter-cellular transport of thiamine and/or thiamine precursors (Guan et al.,
2014).
While overexpression of single-gene THI1 or THIC plants do not accumulate
significant amounts of thiamine, plants overexpressing both THIC and THI1 (THI1 × THIC)
displayed an increased thiamine content of up to fivefold in unpolished seed, threefold in leaves
and twofold in seeds (Dong, Stockwell and Goyer, 2015; Dong et al., 2016).
Although Ahn et al. (2005) showed that exogenous application of thiamine leads to
enhanced resistance to Xanthomonas oryzae pv. oryzae, thiamine-accumulating plants by
overexpression of THIC and THI1 did not display altered resistance to this pathogen. Moreover,
THI1 × THIC plants subjected to various abiotic stresses did not show any visible or
biochemical changes compared to the wild type (Dong, Stockwell and Goyer, 2015; Dong et al.,
2016).
On the other hand, the increase of thiamine levels in plants subjected to abiotic stress
correlates with the accumulation of THI1 mRNA transcripts (Tunc-Ozdemir et al., 2009), and the
THI1 promoter was shown to be responsive to stress conditions as shown by THI1 promoter–
GUS (β-glucuronidase) fusion experiments performed in A. thaliana (Ribeiro et al., 2005).
Moreover, transgenic rice plants with repressed expression of OsDR8, a THI1 homologue in
rice, had lower levels of thiamine and showed reduced resistance to X. oryzae pv. oryzae (Wang et
al., 2006). This suggests that, in contrast to THIC, THI1 has another function, in addition to its
role in thiamine biosynthesis.

27
1.2. Thiazole biosynthetic protein (THI1) orthologues
The “Thiazole Biosynthetic Protein” is a conserved protein, with orthologues found in
fungi, archaea and plants. The Schizosaccharomyces pombe gene thi4 was the first to be identified
(Schweingruber et al., 1991). Homologous genes were identified in other fungi, as Saccharomyces
cerevisiae (Praekelt and Meacock, 1992) and Uromyces fabae (Sohn et al., 2000), as well as in many
sequenced archaea, as Methanococcus jannaschii (Bult et al., 1996), Methanobacterium thermoautotrophicum
(Smith et al., 1997), Archaeoglobus fulgidus (Klenk et al., 1997), Pyrococcus horikoshii (Kawarabayasi et
al., 1998) and Aeropyrum permix (Kawarabayasi et al., 1999). Just one eubacteria, Thermotoga
marítima, contains a sequence homologous to thi4, probably due to horizontal gene transfer from
an archaeon (Nelson et al., 1999).
Homologues were also identified in many plant species. The plant thi4 homologue was
first described in Zea mays, and was named thi1 because it was the first plant protein involved in
thiamine biosynthesis to be described (Belanger et al., 1995). Later studies identified thi4
homologues in several other plants, for example, At-thi1 from Arabidopsis thaliana (Machado et al.,
1996), Ag-thi1 from Alnus glutinosa (Ribeiro et al., 1996), Cs-thi1 from Citrus sinensis (Jacob-Wilk et
al., 1997) and OsDR8 from Oryza sativa (Wang et al., 2006). Moreover, thi1 homologues have been
identified in all sequenced plants, as will be discussed further in the next Chapter. cDNAs
corresponding to thi1 were also identified in Saccharum spp. (Vettore et al., 2003).
1.2.1. THI1 orthologues as a bifunctional protein
Interestingly the first identification of At-thi1 was not related to the function of the
protein in the thiamine biosynthetic pathway. It was actually isolated in a complementation assay
screen for genes involved in DNA repair carried out by Machado et al. (1996). They confirmed in
a complementation assay that the At-thi1 gene could functionally complement the yeast thi4
disruption mutant strain by restoring it to thiamine prototrophy. Besides that, the At-thi1 cDNA
shows homology to stress-related genes of Fusarium (sti35) (Choi et al., 1990). Involvement of
THI1 and its orthologues in DNA protection and other stress-related pathways (such as sugar
deprivation, high salinity, hypoxia, and oxidative stress) have been proposed (Machado et al.,
1996; Ribeiro et al., 2005; Medina-Silva et al., 2006; Ruiz-Roldán et al., 2008; Tunc-Ozdemir et al.,
2009). In addition, abscisic acid (ABA) played an important role in up-regulation of thiamine
biosynthetic genes THI1 during salt stress (Rapala-Kozik et al., 2012). Li et al. (2016)
28
demonstrated that THI1 interacts with and represses CPK33 kinase activity, a protein essential
for ABA-induced stomatal closure in response to drought.
Wang et al. (2015) suggested that thiamine could help reduce the generation of ROS
(reactive oxygen species) in chloroplasts of Kandelia candel. The mechanism of this protection
remains unknown. A study in yeast showed that one possibility is that abundant THI4 (THI1
orthologue in yeast) protects the cells by binding free cellular iron, which is known to cause
oxidative damage via the generation of ROS (Chatterjee et al., 2011). Thus, THI1 and its
orthologues appear to be dual function proteins, with roles in both thiamine biosynthesis and in
organellar DNA damage tolerance.
In thiamine biosynthesis of yeast, THI4 is responsible for catalyzing the formation of
the thiazole ring from NAD, glycine, and a sulfur donor (Chatterjee et al., 2007) through a
process that occurs in the mitochondria in yeast cells (Belanger et al., 1995; Machado et al., 1996).
Chatterjee et al. (2011) showed that THI4 is a suicide enzyme undergoing only a single turnover
reaction in which THI4 Cys205 (a high conserved residue) serves as the sulfur donor, while NAD
acts as the source of the carbon chain. Garcia et al. (2014) confirmed that At-THI1 acts in the
same way. At-THI1 probably loses a sulfur atom from its Cys172 side chain during biosynthesis
converting Cys172 to a dehydroalanine (DHA) residue (Figure 5).
Figure 5. Probable sulfur loss reaction by the Cys172 of A-THI1 cysteine 172.
The function of the modified THI1 (after sulfide donation) if any, as well as a
mechanism for restoring the THI1, if exists, are still unknown. On possibility is that this
exchanges the sulfur for a free cellular iron, as in the mechanism proposed by Chatterjee et al.
(2011) in yeast.
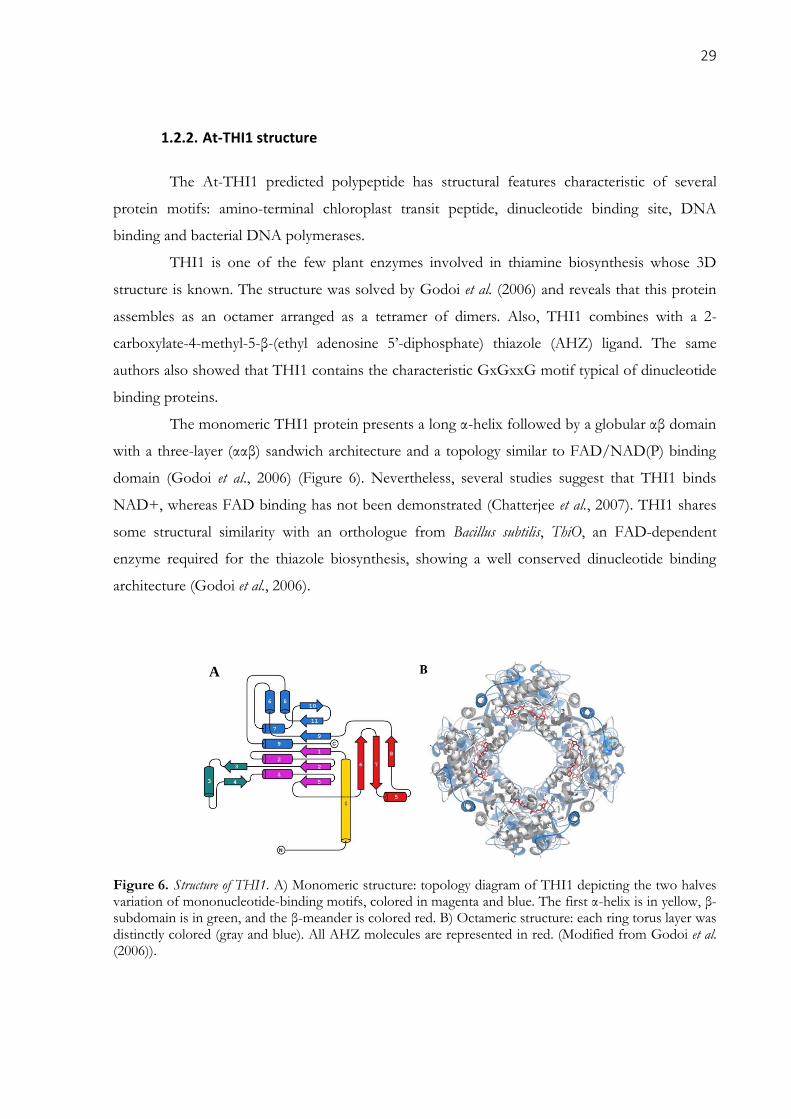
29
1.2.2. At-THI1 structure
The At-THI1 predicted polypeptide has structural features characteristic of several
protein motifs: amino-terminal chloroplast transit peptide, dinucleotide binding site, DNA
binding and bacterial DNA polymerases.
THI1 is one of the few plant enzymes involved in thiamine biosynthesis whose 3D
structure is known. The structure was solved by Godoi et al. (2006) and reveals that this protein
assembles as an octamer arranged as a tetramer of dimers. Also, THI1 combines with a 2-
carboxylate-4-methyl-5-β-(ethyl adenosine 5’-diphosphate) thiazole (AHZ) ligand. The same
authors also showed that THI1 contains the characteristic GxGxxG motif typical of dinucleotide
binding proteins.
The monomeric THI1 protein presents a long α-helix followed by a globular αβ domain
with a three-layer (ααβ) sandwich architecture and a topology similar to FAD/NAD(P) binding
domain (Godoi et al., 2006) (Figure 6). Nevertheless, several studies suggest that THI1 binds
NAD+, whereas FAD binding has not been demonstrated (Chatterjee et al., 2007). THI1 shares
some structural similarity with an orthologue from Bacillus subtilis, ThiO, an FAD-dependent
enzyme required for the thiazole biosynthesis, showing a well conserved dinucleotide binding
architecture (Godoi et al., 2006).
Figure 6. Structure of THI1. A) Monomeric structure: topology diagram of THI1 depicting the two halves variation of mononucleotide-binding motifs, colored in magenta and blue. The first α-helix is in yellow, β-subdomain is in green, and the β-meander is colored red. B) Octameric structure: each ring torus layer was distinctly colored (gray and blue). All AHZ molecules are represented in red. (Modified from Godoi et al. (2006)).
A
30
1.2.3. Subcellular localization of THI1 in Arabidopsis
In yeast, the THI4 protein is encoded by the nuclear genome, but bears a mitochondrial
transport signal sequence at its N-terminal, which indicates that it is targeted to this organelle
(Machado et al., 1997). However, in plants, both thiazole and pyrimidine moieties are synthesized
in plastids (Julliard and Douce, 1991; Gerdes et al., 2012).
The At-thi1 gene is also a single nuclear gene, but At-THI1 protein is targeted to both
mitochondrial and chloroplasts by a differential usage of two in-frame translational start codons.
The translation initiation at the first AUG directs translocation of THI1 to chloroplasts, which is
where thiamine biosynthesis occurs in plants. However, when translation starts from the second
AUG, THI1 is directed to the mitochondria (Chabregas et al., 2001, 2003) (Figure 7).
Figure 7. Schematic representation of the At-THI1 N-terminal region. Below the line is the consensus sequence (single letter amino acid code) for translational initiation. Both start codons (methionine) are in bold type. (Modified from Chabregas et al. (2001)).
Therefore, the dual targeting of HET-P synthase (thiazole) would enable this enzyme to
function in protection against DNA damage when targeted to both mitochondria and
chloroplast, and to function additionally in thiamine biosynthesis when targeted to chloroplasts.
Translation preferentially occurs at the first AUG of this protein, suggesting a likely requirement
for THI1 in chloroplasts (Chabregas et al., 2003). One possibility is that THI1 may donate sulfur
to other requiring molecules.
Figure 8 summarizes the route of THI1 throughout chloroplast and mitochondria and
the role of the thi1 gene in the thiamine metabolic pathway.

31
Figure 8. Dual targeting of THI1 in a plant cell. The thi1 gene translates to the THI1 protein (Machado et al., 1996; Ribeiro et al., 1996; Papini-Terzi et al., 2003), which is targeted simultaneously to mitochondria and to chloroplasts, where it acts in the thiamine synthesis (Chabregas et al., 2001). Plant cell structures are represented by purple: nucleus; green: chloroplast; blue: mitochondria; yellow: cytoplasm; dark green: cell wall; orange: plasmatic membrane; white: vacuole.
1.2.4. At-thi1 promoter and expression
Expression of the plant At-thi1 mRNA is not affected by thiamine availability but it is
associated with cells undergoing particular developmental pathways such as nodule formation
and differentiation (Ribeiro et al., 1996; Nagae et al., 2016), ethylene-induced fruit maturation
(Jacob-Wilk et al., 1997) and it is affected by light, as transcript levels are reduced in dark
conditions (Papini-Terzi et al., 2003).
High expression rates of the thi1 gene were detected in tissues with intense metabolic
activity (such as leaves), as previously described for thi1 homologues in plants (Belanger et al.,
1995; Ribeiro et al., 1996). Maize (Zea mays) thi2, a paralog of A. thaliana thi1, is highly expressed
in dividing tissues (shoot apical meristem, immature tassel, and leaf primordium) and regulates
organ formation (Woodward et al., 2010).
Papini-Terzi et al. (2003) demonstrated that thi1 mRNA is highly expressed in leaves in
contrast to roots, in which only very low amounts of thi1-mRNA are detected. This is in spite of
the fact that plants used in these analyses were cultivated in vitro, and thus their roots were
exposed to light. In the same work they suggest that the low levels of thi1 in roots could be due
to lack of plastid maturity and, consequently, readiness for thiamine synthesis, as isolated roots
from most plant species cannot grow in vitro without thiamine supplementation (Bonner, 1940).
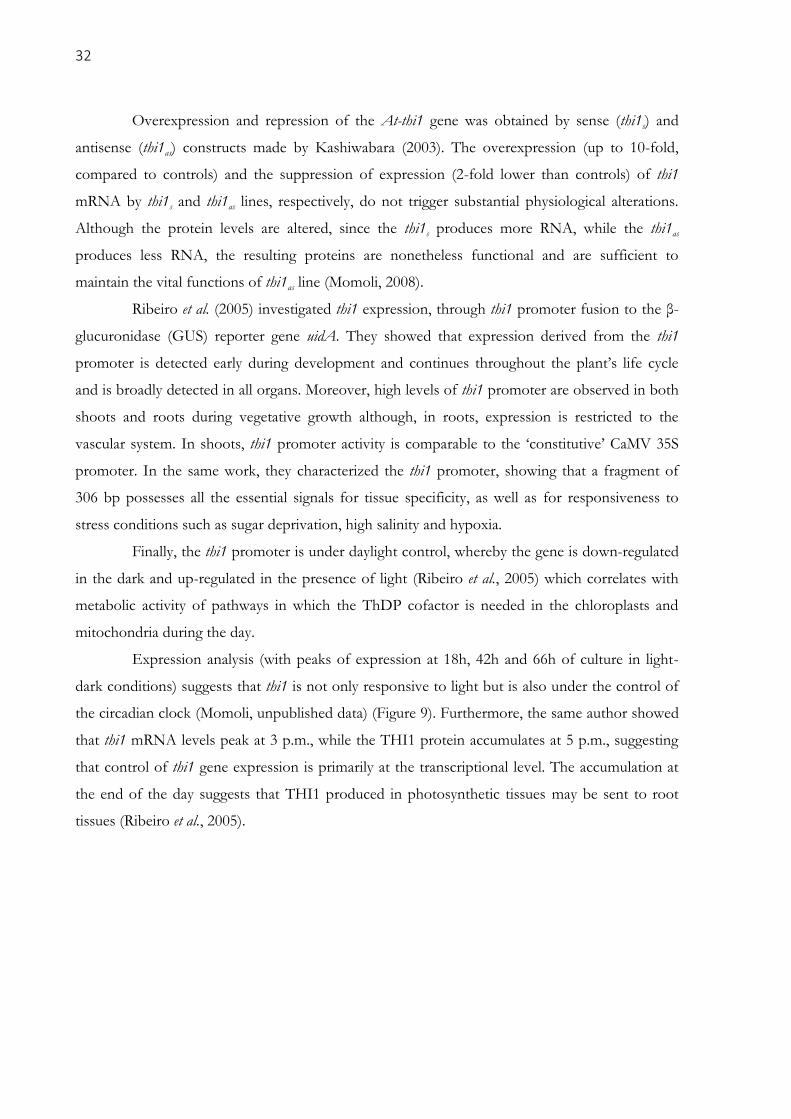
32
Overexpression and repression of the At-thi1 gene was obtained by sense (thi1s) and
antisense (thi1as) constructs made by Kashiwabara (2003). The overexpression (up to 10-fold,
compared to controls) and the suppression of expression (2-fold lower than controls) of thi1
mRNA by thi1s and thi1as lines, respectively, do not trigger substantial physiological alterations.
Although the protein levels are altered, since the thi1s produces more RNA, while the thi1as
produces less RNA, the resulting proteins are nonetheless functional and are sufficient to
maintain the vital functions of thi1as line (Momoli, 2008).
Ribeiro et al. (2005) investigated thi1 expression, through thi1 promoter fusion to the β-
glucuronidase (GUS) reporter gene uidA. They showed that expression derived from the thi1
promoter is detected early during development and continues throughout the plant’s life cycle
and is broadly detected in all organs. Moreover, high levels of thi1 promoter are observed in both
shoots and roots during vegetative growth although, in roots, expression is restricted to the
vascular system. In shoots, thi1 promoter activity is comparable to the ‘constitutive’ CaMV 35S
promoter. In the same work, they characterized the thi1 promoter, showing that a fragment of
306 bp possesses all the essential signals for tissue specificity, as well as for responsiveness to
stress conditions such as sugar deprivation, high salinity and hypoxia.
Finally, the thi1 promoter is under daylight control, whereby the gene is down-regulated
in the dark and up-regulated in the presence of light (Ribeiro et al., 2005) which correlates with
metabolic activity of pathways in which the ThDP cofactor is needed in the chloroplasts and
mitochondria during the day.
Expression analysis (with peaks of expression at 18h, 42h and 66h of culture in light-
dark conditions) suggests that thi1 is not only responsive to light but is also under the control of
the circadian clock (Momoli, unpublished data) (Figure 9). Furthermore, the same author showed
that thi1 mRNA levels peak at 3 p.m., while the THI1 protein accumulates at 5 p.m., suggesting
that control of thi1 gene expression is primarily at the transcriptional level. The accumulation at
the end of the day suggests that THI1 produced in photosynthetic tissues may be sent to root
tissues (Ribeiro et al., 2005).
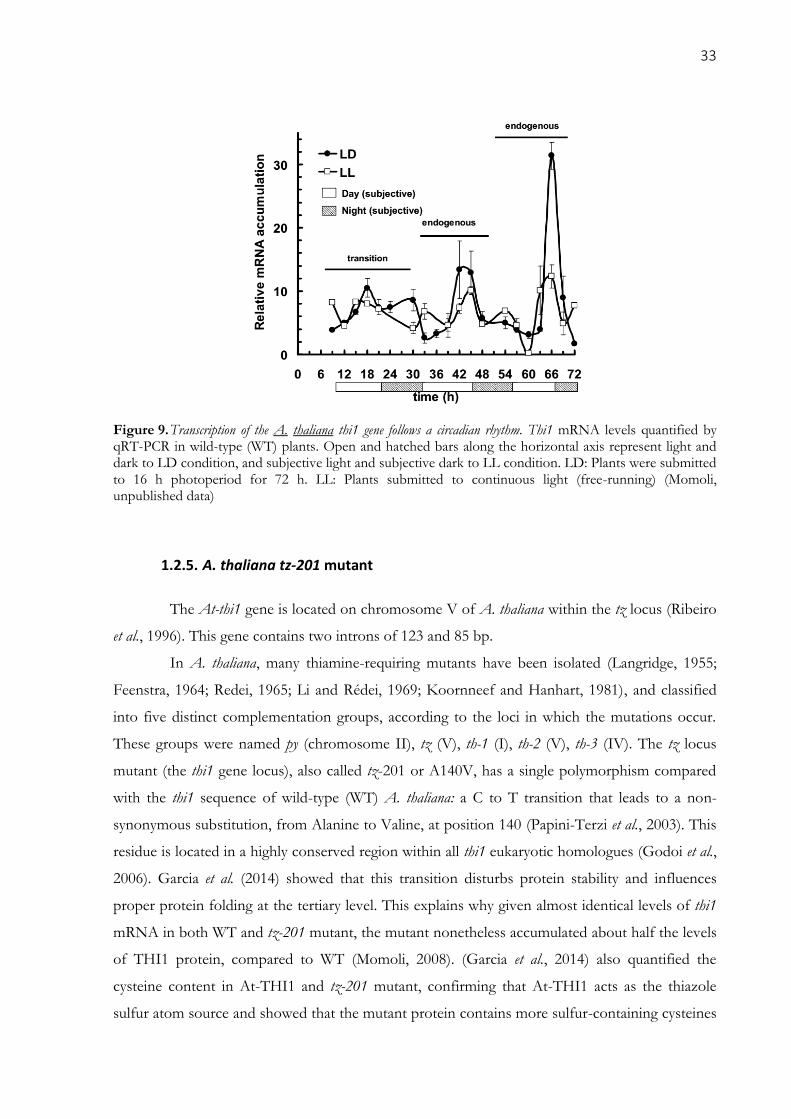
33
Figure 9. Transcription of the A. thaliana thi1 gene follows a circadian rhythm. Thi1 mRNA levels quantified by qRT-PCR in wild-type (WT) plants. Open and hatched bars along the horizontal axis represent light and dark to LD condition, and subjective light and subjective dark to LL condition. LD: Plants were submitted to 16 h photoperiod for 72 h. LL: Plants submitted to continuous light (free-running) (Momoli, unpublished data)
1.2.5. A. thaliana tz-201 mutant
The At-thi1 gene is located on chromosome V of A. thaliana within the tz locus (Ribeiro
et al., 1996). This gene contains two introns of 123 and 85 bp.
In A. thaliana, many thiamine-requiring mutants have been isolated (Langridge, 1955;
Feenstra, 1964; Redei, 1965; Li and Rédei, 1969; Koornneef and Hanhart, 1981), and classified
into five distinct complementation groups, according to the loci in which the mutations occur.
These groups were named py (chromosome II), tz (V), th-1 (I), th-2 (V), th-3 (IV). The tz locus
mutant (the thi1 gene locus), also called tz-201 or A140V, has a single polymorphism compared
with the thi1 sequence of wild-type (WT) A. thaliana: a C to T transition that leads to a non-
synonymous substitution, from Alanine to Valine, at position 140 (Papini-Terzi et al., 2003). This
residue is located in a highly conserved region within all thi1 eukaryotic homologues (Godoi et al.,
2006). Garcia et al. (2014) showed that this transition disturbs protein stability and influences
proper protein folding at the tertiary level. This explains why given almost identical levels of thi1
mRNA in both WT and tz-201 mutant, the mutant nonetheless accumulated about half the levels
of THI1 protein, compared to WT (Momoli, 2008). (Garcia et al., 2014) also quantified the
cysteine content in At-THI1 and tz-201 mutant, confirming that At-THI1 acts as the thiazole
sulfur atom source and showed that the mutant protein contains more sulfur-containing cysteines
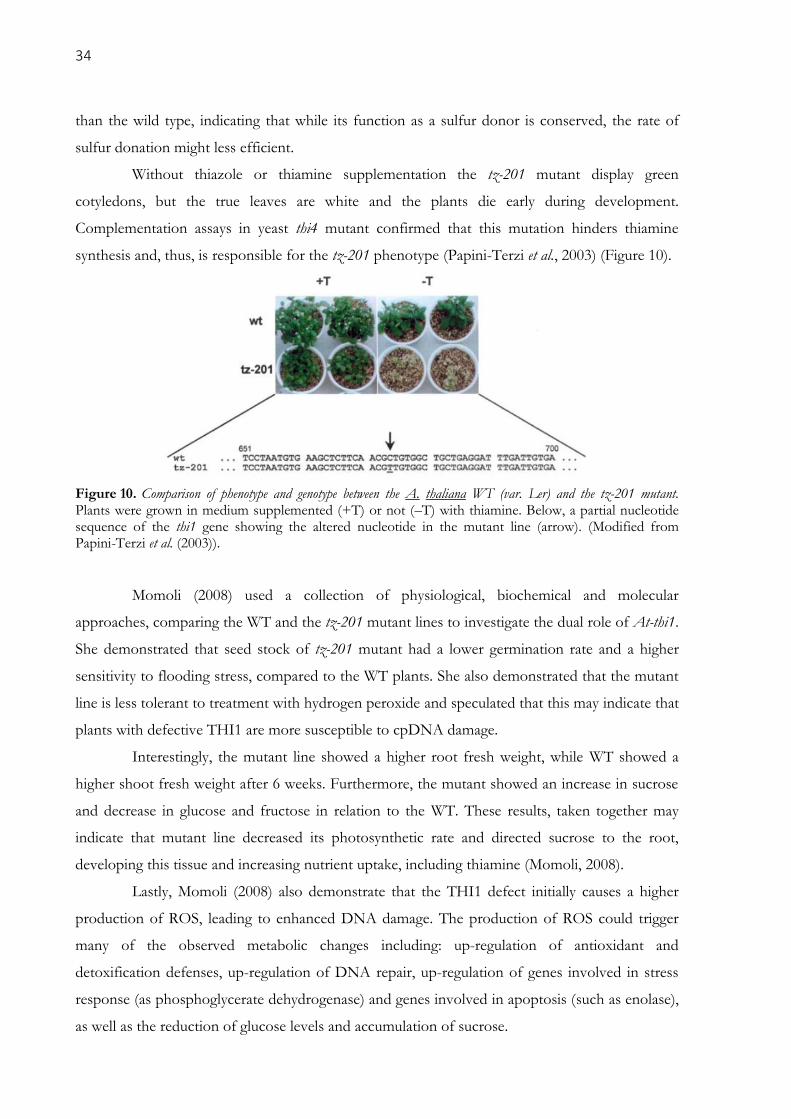
34
than the wild type, indicating that while its function as a sulfur donor is conserved, the rate of
sulfur donation might less efficient.
Without thiazole or thiamine supplementation the tz-201 mutant display green
cotyledons, but the true leaves are white and the plants die early during development.
Complementation assays in yeast thi4 mutant confirmed that this mutation hinders thiamine
synthesis and, thus, is responsible for the tz-201 phenotype (Papini-Terzi et al., 2003) (Figure 10).
Figure 10. Comparison of phenotype and genotype between the A. thaliana WT (var. Ler) and the tz-201 mutant. Plants were grown in medium supplemented (+T) or not (–T) with thiamine. Below, a partial nucleotide sequence of the thi1 gene showing the altered nucleotide in the mutant line (arrow). (Modified from Papini-Terzi et al. (2003)).
Momoli (2008) used a collection of physiological, biochemical and molecular
approaches, comparing the WT and the tz-201 mutant lines to investigate the dual role of At-thi1.
She demonstrated that seed stock of tz-201 mutant had a lower germination rate and a higher
sensitivity to flooding stress, compared to the WT plants. She also demonstrated that the mutant
line is less tolerant to treatment with hydrogen peroxide and speculated that this may indicate that
plants with defective THI1 are more susceptible to cpDNA damage.
Interestingly, the mutant line showed a higher root fresh weight, while WT showed a
higher shoot fresh weight after 6 weeks. Furthermore, the mutant showed an increase in sucrose
and decrease in glucose and fructose in relation to the WT. These results, taken together may
indicate that mutant line decreased its photosynthetic rate and directed sucrose to the root,
developing this tissue and increasing nutrient uptake, including thiamine (Momoli, 2008).
Lastly, Momoli (2008) also demonstrate that the THI1 defect initially causes a higher
production of ROS, leading to enhanced DNA damage. The production of ROS could trigger
many of the observed metabolic changes including: up-regulation of antioxidant and
detoxification defenses, up-regulation of DNA repair, up-regulation of genes involved in stress
response (as phosphoglycerate dehydrogenase) and genes involved in apoptosis (such as enolase),
as well as the reduction of glucose levels and accumulation of sucrose.

35
1.3. Objectives
1.3.1. Motivation and previous results in our laboratory
1.3.1.1. Sugarcane
The thi1 gene appears to play an important role in sucrose accumulation in sugarcane.
As described above, many studies have been carried out to discern both thiazole biosynthesis and
the function of thi1 gene in different plants and other organisms. A refined search in the
SUCEST (Sugarcane Expressed Sequence Tag (EST)) program database (Vettore et al., 2003)
identified two SAS (Sugarcane Assembled Sequence) as putative sugarcane At-thi1 homologues.
They were named SAS1_sc-thi1 and SAS2_sc-thi1. For the assembly of SAS1_sc-thi1, 41 ESTs were
used and for the assembly of SAS2_sc-thi1, 4 ESTs were used. These ESTs are derived from
libraries prepared from different sugarcane tissues: for SAS1_sc-thi1, the ESTs are derived from
all tissues, but mainly from seeds, whereas for SAS2_sc-thi1, the ESTs are derived solely from
stem and seed tissues. This suggests a differential expression profile of THI1 in sugarcane.
Initially, all sugarcane ESTs were compared with the THI1 protein form A. thaliana.
From the ~240,000 ESTs of the library, 48 reads in the SUCEST database have correspondence
to At-THI1. One of them, SCRLLV1049411.g, is uniquely associated with SAS1_sc-thi1.
Among these 48 ESTs, the ones with the highest scores to each SAS were selected as
references. For SAS1_sc-thi1 the selected EST was SCQGSD1046F12.g, which is 892 bp long.
For SAS2_sc-thi1 the EST SCSGST1070H09.b was selected, which is 657 bp long. Both ESTs
have 81% identity with the At-THI1 protein. Between the two reads there is 94% nucleotide
identity but there are 30 SNPs within the overlapping region of 500 bases.
The presence of these two isoforms is interesting because it suggests a different type of
gene regulation, compared with A. thaliana (Figure 11), which has only one copy of the gene
(Machado et al., 1996). Interestingly, two At-thi1 homologues were also identified in Zea mays
(Belanger et al., 1995), which is a C4 grass, like sugarcane.
36
,
Figure 11. Summary of the role of thi1 gene on the thiamine metabolic pathways of A. thaliana. The thi1 gene translates to the THI1 protein (Machado et al., 1996; Ribeiro et al., 1996; Papini-Terzi et al., 2003) The THI1 is targeted simultaneously to mitochondria – where it has a role in DNA protection – and to chloroplast, where it contributes to thiamine synthesis (Chabregas et al., 2001, 2003). Thiamine acts as a co-factor in many different metabolic pathways, as indicated. Plant cell structures are represented by purple: nucleus; green: chloroplast; blue: mitochondria; yellow: cytoplasm; dark green: cell wall; orange: plasmatic membrane; white: vacuole.
1.3.1.2. Outstanding questions concerning thi1 function
From the literature review, four outstanding questions remain unanswered. These serve
to guide this research into the function of the two isoforms of thi1 in sugarcane:
Is each copy targeted to different subcellular compartments? (The work of Chabregas et al.
(2001) showed that the A. thaliana THI1 transcript is targeted to both the mitochondria and
the chloroplasts).
Does each copy have a different function? (The THI1 protein is considered to be
bifunctional because it has a role in the biosynthesis of the thiazole moiety of thiamine,
probably acting as sulfur donor, as demonstrated recently by Chatterjee et al. (2011); it is also
involved in DNA damage protection and other stress-related pathways (Machado et al., 1997;
Medina-Silva et al., 2006; Momoli, 2008).
Do both copies have the same function, but are simply expressed at different times and in
distinct tissues? (The analysis of the tissue of origin for the EST reads used to cluster
SAS1_sc-thi1 e SAS2_sc-thi1 showed that the first gene copy is expressed in all tissues but
predominantly in seeds, while the second gene copy is expressed solely in stems and seeds).
Does gene duplication simply reflect the need for additional thiamine or THI1 to cope with
the increased demands of C4 photosynthetic metabolism? (This reflecting its role as a
cofactor for several enzymes involved in carbon sequestration).
37
1.3.2. General objective
The objective of this project component was to add knowledge about the sugarcane thi1
homologues.
1.3.3. Specific objectives
a) Associate the two SUCEST SAS with the corresponding sugarcane genes and
genomic regions of this complex polyploid.
b) Evaluate sugarcane allelic diversity.
c) Determine the expression profile of genes homologous to At-thi1.
d) Verify possible functional divergences of different thi1 copies.
e) Generate thi1 mutants in plant systems for subsequent functional studies.
38
REFERENCES
Ahn, I.P., Kim, S. and Lee, Y.H. (2005) ‘Vitamin B1 Functions as an Activator of Plant Disease
Resistance’, Plant Physiology, 138(3), pp. 1505–1515.
Ajjawi, I. et al. (2007) ‘Thiamin pyrophosphokinase is required for thiamin cofactor activation in
Arabidopsis’, Plant Molecular Biology, 65(1–2), pp. 151–162.
Ajjawi, I., Tsegaye, Y. and Shintani, D. (2007) ‘Determination of the genetic, molecular, and
biochemical basis of the Arabidopsis thaliana thiamin auxotroph th1’, Archives of biochemistry and
biophysics, 459(1), pp. 107–14.
Ball, G. F. M. (2004) ‘Fungal Disease Resistance in Plants: Biochemistry, Molecular Biology, and
Genetic Engineering’, International Journal of Food Science and Technology, 41(1), pp. 111–112.
Belanger, F. C. et al. (1995) ‘Evidence for the thiamine biosynthetic pathway in higher-plant plastids
and its developmental regulation’, Plant Molecular Biology, 29(4), pp. 809–821.
Berdanier, C. D. and Adkins, T. K. (1998) Advanced nutrition. Vol. 2, Micronutrients. CRC Press.
Bocobza, S. et al. (2007) ‘Riboswitch-dependent gene regulation and its evolution in the plant
kingdom’, Genes & Development, 21(22), pp. 2874–2879.
Bocobza, S. E. et al. (2013) ‘Orchestration of Thiamin Biosynthesis and Central Metabolism by
Combined Action of the Thiamin Pyrophosphate Riboswitch and the Circadian Clock in
Arabidopsis’, The Plant Cell, 25(1), pp. 288–307.
Bonner, J. (1940) ‘On the Growth Factor Requirements of Isolated Roots’, American Journal of Botany,
27(8), p. 692.
Bult, C. J. et al. (1996) ‘Complete Genome Sequence of the Methanogenic Archaeon, Methanococcus
jannaschii’, Science, 273(5278), pp. 1058–1073.
Chabregas, S. M. et al. (2001) ‘Dual targeting properties of the N-terminal signal sequence of
Arabidopsis thaliana THI1 protein to mitochondria and chloroplasts’, Plant molecular biology, 46(6),
pp. 639–50.
Chabregas, S. M. et al. (2003) ‘Differential usage of two in-frame translational start codons regulates
subcellular localization of Arabidopsis thaliana THI1’, Journal of Cell Science, 116(2), pp. 285–291.
Chatterjee, A. et al. (2007) ‘Biosynthesis of Thiamin Thiazole in Eukaryotes: Conversion of NAD to
an Advanced Intermediate’, Journal of the American Chemical Society, 129(10), pp. 2914–2922.
Chatterjee, A. et al. (2011) ‘Saccharomyces cerevisiae THI4p is a suicide thiamine thiazole synthase’,
Nature, 478(7370), pp. 542–546.
Choi, G. H. et al. (1990) ‘sti35, a Stress-Responsive Gene in Fusarium spp.’, Journal Of Bacteriology,
172(8), pp. 4522–4528.
Depeint, F. et al. (2006) ‘Mitochondrial function and toxicity: Role of the B vitamin family on
mitochondrial energy metabolism’, Chemico-Biological Interactions, 163(1–2), pp. 94–112.

39
Dong, W. et al. (2016) ‘Overexpression of Thiamin Biosynthesis Genes in Rice Increases Leaf and
Unpolished Grain Thiamin Content But Not Resistance to Xanthomonas oryzae pv. oryzae’, Frontiers
in Plant Science, 7(May), pp. 1–11.
Dong, W., Stockwell, V. O. and Goyer, A. (2015) ‘Enhancement of Thiamin Content in Arabidopsis
thaliana by Metabolic Engineering’, Plant and Cell Physiology, 56(12), pp. 2285–2296.
Dzeja, P. and Terzic, A. (2009) ‘Adenylate kinase and AMP signaling networks: metabolic monitoring,
signal communication and body energy sensing’, International Journal of Molecular Sciences, 10(4), pp.
1729–1772.
Fattal-Valevski, A. (2011) ‘Thiamine (Vitamin B1 )’, Journal of Evidence-Based Complementary &
Alternative Medicine, 16(1), pp. 12–20.
Feenstra, W. J. (1964) ‘Isolation of nutritional mutants in Arabidopsis thaliana’, Genetica, 35(1), pp. 259–
269.
Fitzpatrick, T. B. et al. (2012) ‘Vitamin Deficiencies in Humans: Can Plant Science Help?’, The Plant
Cell Online, 24(2), pp. 395–414.
Friedrich, W. (1988) Vitamins. De Gruyter.
Funk, C. (1911) ‘On the chemical nature of the substance which cures polyneuritis in birds induced
by a diet of polished rice’, The Journal of Physiology, 43(5), pp. 395–400.
Garcia, A. F. et al. (2014) ‘THI1, a protein involved in the biosynthesis of thiamin in Arabidopsis
thaliana: Structural analysis of THI1(A140V) mutant’, Biochimica et Biophysica Acta (BBA) - Proteins
and Proteomics, 1844(6), pp. 1094–1103.
Gerdes, S. et al. (2012) ‘Plant B Vitamin Pathways and their Compartmentation: a Guide for the
Perplexed’, Journal of Experimental Botany, 63(15), pp. 5379–5395.
Godoi, P. H. C. et al. (2006) ‘Structure of the Thiazole Biosynthetic Enzyme THI1 from Arabidopsis
thaliana’, Journal of Biological Chemistry, 281(41), pp. 30957–30966.
Goyer, A. (2010) ‘Thiamine in plants: aspects of its metabolism and functions’, Phytochemistry, 71(14–
15), pp. 1615–24.
Guan, J.-C. et al. (2014) ‘Divisions of labor in the thiamin biosynthetic pathway among organs of
maize’, Frontiers in plant science, 5(August), p. 370.
Hasnain, G. et al. (2016) ‘Bacterial and plant HAD enzymes catalyse a missing phosphatase step in
thiamin diphosphate biosynthesis’, Biochemical Journal, 473(2), pp. 157–166.
Hwang, S. et al. (2014) ‘Conserved active site cysteine residue of archaeal THI4 homolog is essential
for thiamine biosynthesis in Haloferax volcanii’, BMC Microbiology, 14(1).
Jacob-Wilk, D. et al. (1997) ‘Induction of a Citrus gene highly homologous to plant and yeast thi genes
involved in thiamine biosynthesis during natural and ethylene-induced fruit maturation’, Plant
Molecular Biology, 35(5), pp. 661–666.
40
Julliard, J. H. and Douce, R. (1991) ‘Biosynthesis of the thiazole moiety of thiamin (vitamin B1) in
higher plant chloroplasts’, Proceedings of the National Academy of Sciences of the United States of America,
88(6), pp. 2042–5.
Jurgenson, C. T., Begley, T. P. and Ealick, S. E. (2009) ‘The Structural and Biochemical Foundations
of Thiamin Biosynthesis’, Annual Review of Biochemistry, 78(1), pp. 569–603.
Kashiwabara, P. M. (2003) Interferência na expressão do gene thi1 de Arabidopsis thaliana: conseqüências
biológicas. University of São Paulo.
Kawarabayasi, Y. et al. (1998) ‘Complete Sequence and Gene Organization of the Genome of a
Hyper-thermophilic Archaebacterium, Pyrococcus horikoshii OT3’, DNA Research, 5, pp. 55–76.
Kawarabayasi, Y. et al. (1999) ‘Complete Genome Sequence of an Aerobic Hyper-thermophilic
Crenarchaeon, Aeropyrum pernix Kl’ DNA Research, 6(2):83-101, 145-52.
KEGG. KEGG Pathway. Available at: http://www.kegg.jp/kegg-
bin/highlight_pathway?scale=1.0&map=map00730&keyword=thiamine (Accessed: 3 February
2018).
Kim, Y. S. et al. (1998) ‘A Brassica cDNA clone encoding a bifunctional hydroxymethylpyrimidine
kinase/thiamin-phosphate pyrophosphorylase involved in thiamin biosynthesis’, Plant Molecular
Biology, 37(6), pp. 955–966.
Klenk, H. P. et al. (1997) ‘The complete genome sequence of the hyperthermophilic, sulphate-
reducing archaeon Archaeoglobus fulgidus’, Nature, 390(6658), pp. 364–370.
Kong, D. et al. (2008) ‘AtTHIC, a gene involved in thiamine biosynthesis in Arabidopsis thaliana’, Cell
Research, 18(5), pp. 566–576.
Koornneef, M. and Hanhart, C. J. (1981) ‘A new thiamine locus in Arabidopsis thaliana’, Arabidopsis Inf.
Serv., 18, pp. 52–58.
Laforenza, U. et al. (1997) ‘Thiamine uptake in human intestinal biopsy specimens, including
observations from a patient with acute thiamine deficiency’, American Journal of Clinical Nutrition,
66(2), pp. 320–326.
Langridge, J. (1955) ‘Biochemical mutations in the crucifer Arabidopsis thaliana (L.) heynh’, Nature,
176(4475), pp. 260–261.
Li, C. L. et al. (2016) ‘THI1, a Thiamine Thiazole Synthase, Interacts with Ca 2+ -Dependent Protein
Kinase CPK33 and Modulates the S-Type Anion Channels and Stomatal Closure in Arabidopsis’,
Plant Physiology, 170(2), pp. 1090–1104.
Li, S. L. and Rédei, G. P. (1969) ‘Thiamine mutants of the crucifer, Arabidopsis’, Biochemical Genetics,
3(2), pp. 163–170.
Machado, C. R. et al. (1996) ‘Thi1, a thiamine biosynthetic gene in Arabidopsis thaliana, complements
bacterial defects in DNA repair’, Plant molecular biology, 31(3), pp. 585–93.
41
Machado, C. R. et al. (1997) ‘Dual role for the yeast THI4 gene in thiamine biosynthesis and DNA
damage tolerance’, Journal of Molecular Biology, 273(1), pp. 114–121.
Medina-Silva, R. et al. (2006) ‘Heat stress promotes mitochondrial instability and oxidative responses
in yeast deficient in thiazole biosynthesis’, Research in Microbiology, 157, pp. 275–281.
Momoli, M. M. (2008) Aspectos funcionais do gene thi1 em plantas selvagens e mutantes de Arabidopsis thaliana
(Brassicaceae). University of São Paulo.
Nagae, M. et al. (2016) ‘The Thiamine Biosynthesis Gene THI1 Promotes Nodule Growth and Seed
Maturation’, Plant Physiology, 172(3), pp. 2033–2043.
Nelson, K. E. et al. (1999) ‘Evidence for lateral gene transfer between Archaea and bacteria from
genome sequence of Thermotoga maritima’, Nature, 399(6734), pp. 323–329.
Papini-Terzi, F. S. et al. (2003) ‘Point mutation is responsible for Arabidopsis tz-201 mutant phenotype
affecting thiamin biosynthesis’, Plant & cell physiology, 44(8), pp. 856–60.
Praekelt, U. M. and Meacock, P. A (1992) ‘MOL1, a Saccharomyces cerevisiae gene that is highly
expressed in early stationary phase during growth on molasses’, Yeast, 8(9), pp. 699–710.
Rapala-Kozik, M. et al. (2007) ‘Molecular characterization of the thi3 gene involved in thiamine
biosynthesis in Zea mays: cDNA sequence and enzymatic and structural properties of the
recombinant bifunctional protein with 4-amino-5-hydroxymethyl-2-methylpyrimidine (phosphate)
kinase and’, The Biochemical journal, 408(2), pp. 149–59.
Rapala-Kozik, M. et al. (2012) ‘The upregulation of thiamine (vitamin B1) biosynthesis in Arabidopsis
thaliana seedlings under salt and osmotic stress conditions is mediated by abscisic acid at the early
stages of this stress response’, BMC Plant Biology, 12, p. 2.
Raschke, M. et al. (2007) ‘Vitamin B1 biosynthesis in plants requires the essential iron sulfur cluster
protein, THIC’, Proceedings of the National Academy of Sciences of the United States of America, 104(49),
pp. 19637–42.
Redei, G. P. (1965) ‘Genetic Blocks in the Thiamine Synthesis of the Angiosperm Arabidopsis’,
American Journal of Botany, 52(8), p. 834.
Ribeiro, A. et al. (1996) ‘Identification of agthi1, whose product is involved in biosynthesis of the
thiamine precursor thiazole, in actinorhizal nodules of Alnus glutinosa’, Plant Journal, pp. 361–368.
Ribeiro, D. T. et al. (2005) ‘Functional characterization of the thi1 promoter region from Arabidopsis
thaliana’, Journal of Experimental Botany, 56(417), pp. 1797–1804.
Ruiz-Roldán, C. et al. (2008) ‘The Fusarium oxysporum sti35 gene functions in thiamine biosynthesis and
oxidative stress response’, Fungal Genetics and Biology, 45(1), pp. 6–16.
Schweingruber, A. et al. (1991) ‘Thiamine in Schizosaccharomyces pombe: dephosphorylation, intracellular
pool, biosynthesis and transport’, Current genetics, 19(4), pp. 249–54.
Semba, R. and and Bloem, M. (2008) Nutrition and health in developing countries. Humana Press; 2nd
edition.
42
Singleton, C. K. and Martin, P. R. (2001) ‘Molecular mechanisms of thiamine utilization’, Current
molecular medicine, 1(2), pp. 197–207.
Smith, D. R. et al. (1997) ‘Complete Genome Sequence of Methanobacterium thermoautotrophicum:
Functional Analysis and Comparative Genomics’, Journal Of Bacteriology, 179(22), pp. 7135–7155.
Sohn, J. et al. (2000) ‘High Level Activation of Vitamin B1 Biosynthesis Genes in Haustoria of the
Rust Fungus Uromyces fabae’, 13(6), pp. 629–636.
Sudarsan, N. (2003) ‘Metabolite-binding RNA domains are present in the genes of eukaryotes’, RNA,
9(6), pp. 644–647.
Tunc-Ozdemir, M. et al. (2009) ‘Thiamin Confers Enhanced Tolerance to Oxidative Stress in
Arabidopsis’, Plant Physiology, 151(1), pp. 421–432.
U.S. Food and Nutrition Board (1998) Dietary reference intakes for thiamin, riboflavin, niacin, vitamin B6,
folate, vitamin B12, pantothenic acid, biotin, and choline. National Academy Press.
Vettore, A. L. et al. (2003) ‘Analysis and Functional Annotation of an Expressed Sequence Tag
Collection for Tropical Crop Sugarcane’, Genome Research, 13(12), pp. 2725–2735.
Wang, G. et al. (2006) ‘Dual Function of Rice OsDR8 Gene in Disease Resistance and Thiamine
Accumulation’, Plant Molecular Biology, 60(3), pp. 437–449.
Wang, L. et al. (2015) ‘Proteomic analysis of changes in the Kandelia candel chloroplast proteins
reveals pathways associated with salt tolerance’, Plant Science, 231, pp. 159–172.
Woodward, J. B. et al. (2010) ‘A Maize Thiamine Auxotroph Is Defective in Shoot Meristem
Maintenance’, The Plant Cell, 22(10), pp. 3305–3317.

43
2. THIAMINE THIAZOLE ENZYME (THI1): DIVERSITY IN PLANTS, MOLECULAR
AND FUNCTIONAL ANALYSES OF TWO SUGARCANE PARALOGS.
ABSTRACT
Sugarcane (Saccharum spp.) is a C4 photosynthesis monocot, like corn (Zea mays) and sorghum (Sorghum bicolor), and is grown for sucrose production, which accumulates in the stem of the plant. It is an important tropical crop, used to produce sugar and ethanol, with the latter being an important biofuel in Brazil. The thi1 gene was the first reported to be involved in plant thiamine biosynthesis. THI1 protein is known to be involved in the synthesis of the thiazole ring, a thiamine (vitamin B1) component, which is an essential co-factor in several carbohydrate and amino acid metabolic pathways. This research aims to study the genomic structure, evolution and function of thi1 in sugarcane. While A. thaliana and other plants contain only a single copy of thi1, we report here that sugarcane has at least two copies (sc-thi1.1 and sc-thi1.2), like other C4 grasses whose genomes have been sequenced. The identified alleles related to sc-thi1.2 have some differences in sequence and seem to be diverging into two subgroups (sc-thi1.2a and sc-thi1.2b), based on a phylogenetic analysis. Expression analyses show that sc-thi1 genes are expressed in different tissues and developmental stages, but in differing levels, although sc-thi1.1 showed highest expression levels in all cases analyzed. Genetic diversity analysis showed that thi1 duplication in monocots arose in the ancestral Panicoideae subfamily (between 60-50 MYA) and remains in many modern cultivars of sugarcane. Moreover, subcellular localization assay showed that sc-thi1.1 and sc-thi1.2b are targeted in a pattern that is distinct from that of sc-thi1.2a. Finally, complementation studies performed in a yeast THI4 mutant demonstrate that only two of the three sc-thi1 isoforms are able to restore thiamine auxotrophy, albeit at a low level. As vitamin B1 acts as co-factor in the carbohydrate metabolic pathway, the fundamental biological knowledge about sc-thi1 is relevant to the sugarcane breeding, for which we seek increased accumulation of sucrose.
Keywords: Sugarcane; Thi1 gene; Genomic characterization, Evolutionary diversity; Expression analysis; Functional complementation

44
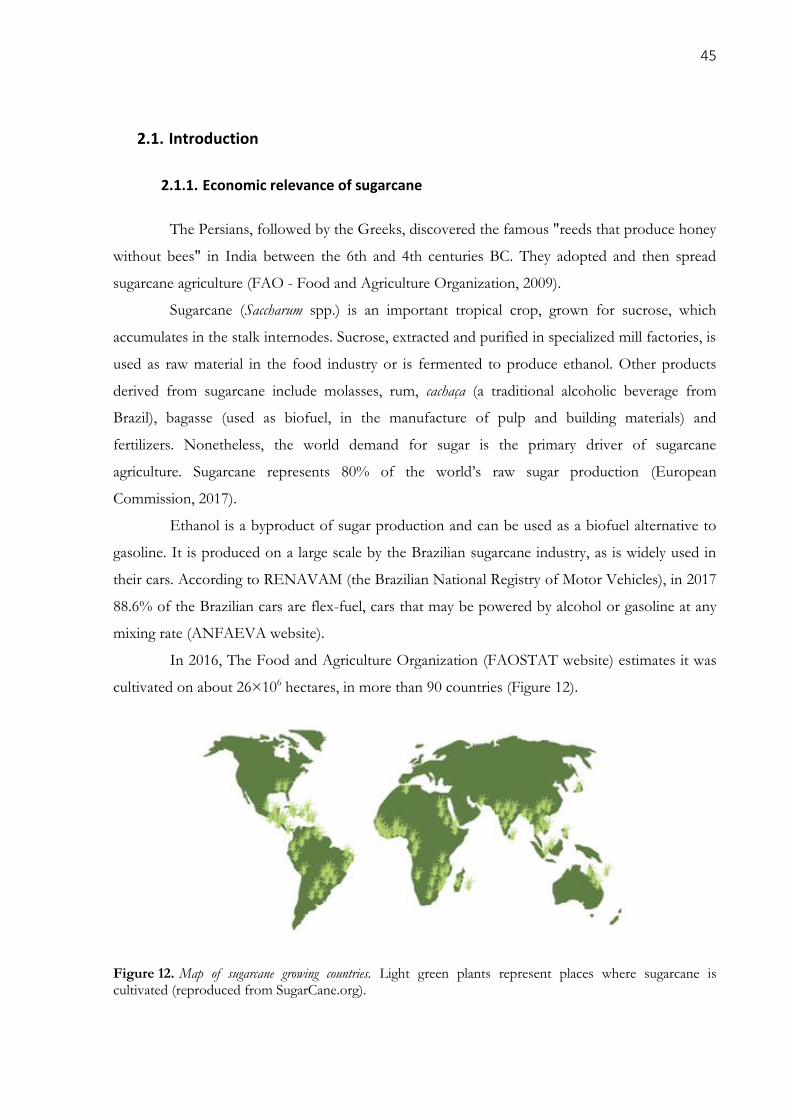
45
2.1. Introduction
2.1.1. Economic relevance of sugarcane
The Persians, followed by the Greeks, discovered the famous "reeds that produce honey
without bees" in India between the 6th and 4th centuries BC. They adopted and then spread
sugarcane agriculture (FAO - Food and Agriculture Organization, 2009).
Sugarcane (Saccharum spp.) is an important tropical crop, grown for sucrose, which
accumulates in the stalk internodes. Sucrose, extracted and purified in specialized mill factories, is
used as raw material in the food industry or is fermented to produce ethanol. Other products
derived from sugarcane include molasses, rum, cachaça (a traditional alcoholic beverage from
Brazil), bagasse (used as biofuel, in the manufacture of pulp and building materials) and
fertilizers. Nonetheless, the world demand for sugar is the primary driver of sugarcane
agriculture. Sugarcane represents 80% of the world’s raw sugar production (European
Commission, 2017).
Ethanol is a byproduct of sugar production and can be used as a biofuel alternative to
gasoline. It is produced on a large scale by the Brazilian sugarcane industry, as is widely used in
their cars. According to RENAVAM (the Brazilian National Registry of Motor Vehicles), in 2017
88.6% of the Brazilian cars are flex-fuel, cars that may be powered by alcohol or gasoline at any
mixing rate (ANFAEVA website).
In 2016, The Food and Agriculture Organization (FAOSTAT website) estimates it was
cultivated on about 26×106 hectares, in more than 90 countries (Figure 12).
Figure 12. Map of sugarcane growing countries. Light green plants represent places where sugarcane is cultivated (reproduced from SugarCane.org).
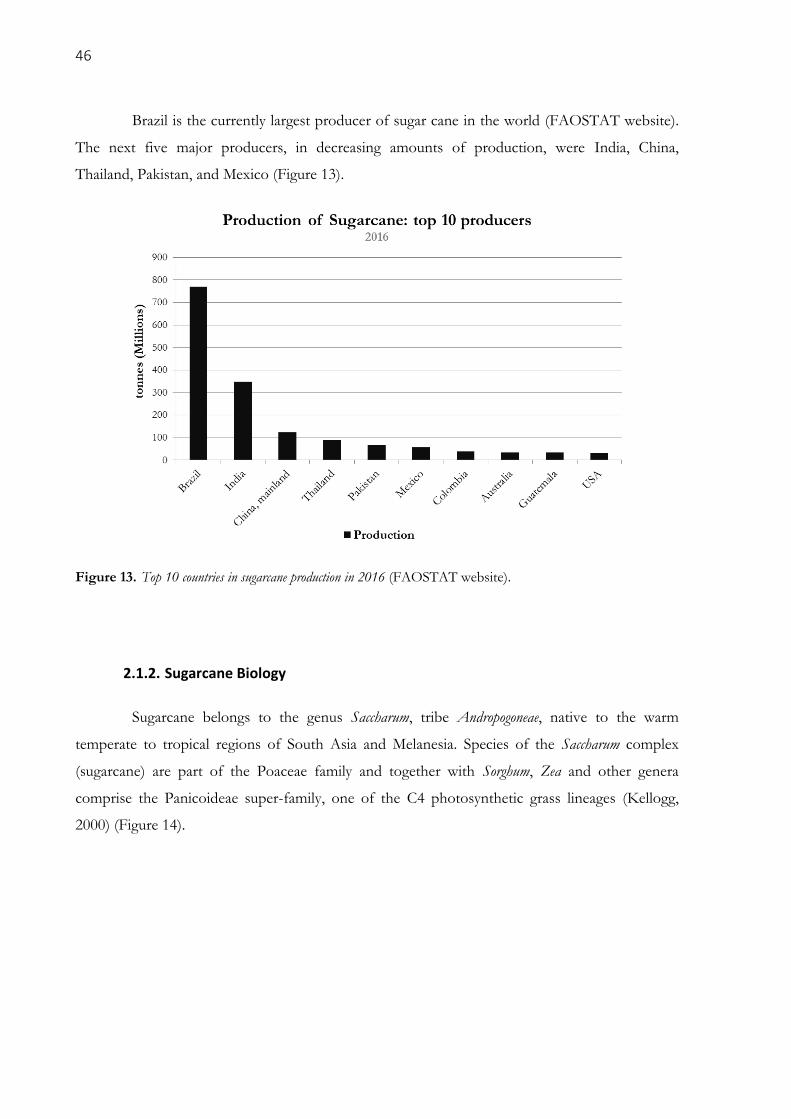
46
Brazil is the currently largest producer of sugar cane in the world (FAOSTAT website).
The next five major producers, in decreasing amounts of production, were India, China,
Thailand, Pakistan, and Mexico (Figure 13).
Figure 13. Top 10 countries in sugarcane production in 2016 (FAOSTAT website).
2.1.2. Sugarcane Biology
Sugarcane belongs to the genus Saccharum, tribe Andropogoneae, native to the warm
temperate to tropical regions of South Asia and Melanesia. Species of the Saccharum complex
(sugarcane) are part of the Poaceae family and together with Sorghum, Zea and other genera
comprise the Panicoideae super-family, one of the C4 photosynthetic grass lineages (Kellogg,
2000) (Figure 14).
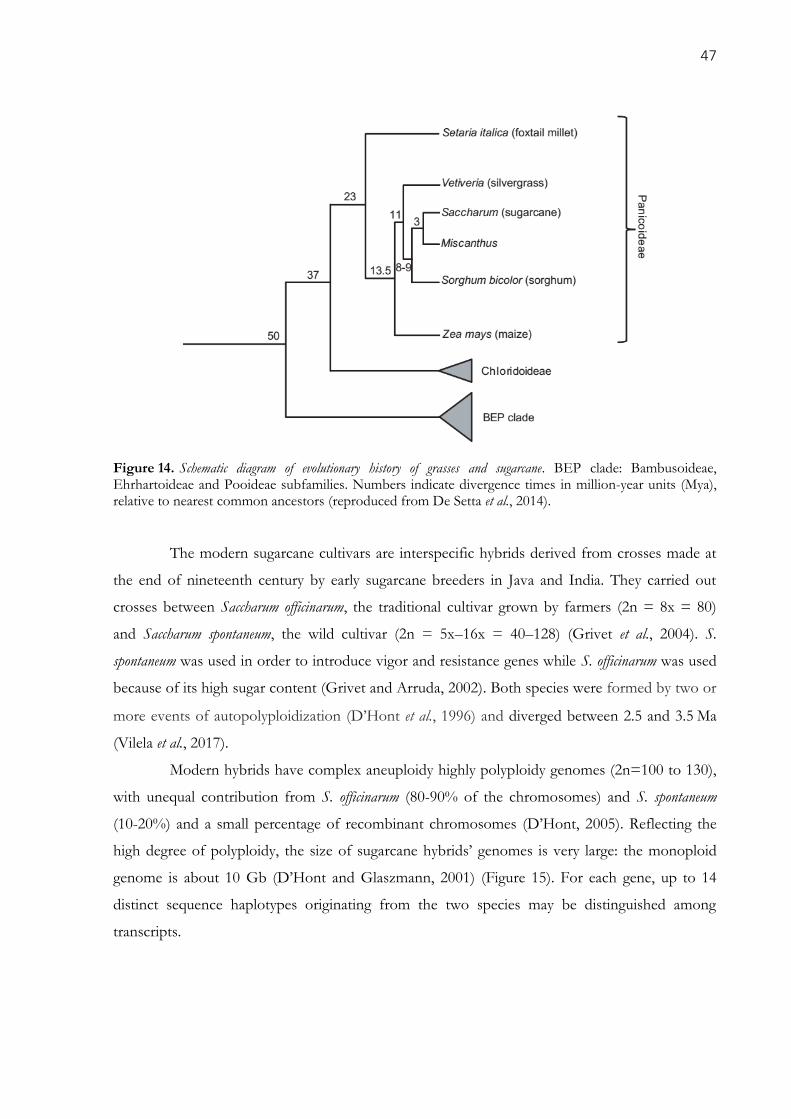
47
Figure 14. Schematic diagram of evolutionary history of grasses and sugarcane. BEP clade: Bambusoideae, Ehrhartoideae and Pooideae subfamilies. Numbers indicate divergence times in million-year units (Mya), relative to nearest common ancestors (reproduced from De Setta et al., 2014).
The modern sugarcane cultivars are interspecific hybrids derived from crosses made at
the end of nineteenth century by early sugarcane breeders in Java and India. They carried out
crosses between Saccharum officinarum, the traditional cultivar grown by farmers (2n = 8x = 80)
and Saccharum spontaneum, the wild cultivar (2n = 5x–16x = 40–128) (Grivet et al., 2004). S.
spontaneum was used in order to introduce vigor and resistance genes while S. officinarum was used
because of its high sugar content (Grivet and Arruda, 2002). Both species were formed by two or
more events of autopolyploidization (D’Hont et al., 1996) and diverged between 2.5 and 3.5 Ma
(Vilela et al., 2017).
Modern hybrids have complex aneuploidy highly polyploidy genomes (2n=100 to 130),
with unequal contribution from S. officinarum (80-90% of the chromosomes) and S. spontaneum
(10-20%) and a small percentage of recombinant chromosomes (D’Hont, 2005). Reflecting the
high degree of polyploidy, the size of sugarcane hybrids’ genomes is very large: the monoploid
genome is about 10 Gb (D’Hont and Glaszmann, 2001) (Figure 15). For each gene, up to 14
distinct sequence haplotypes originating from the two species may be distinguished among
transcripts.
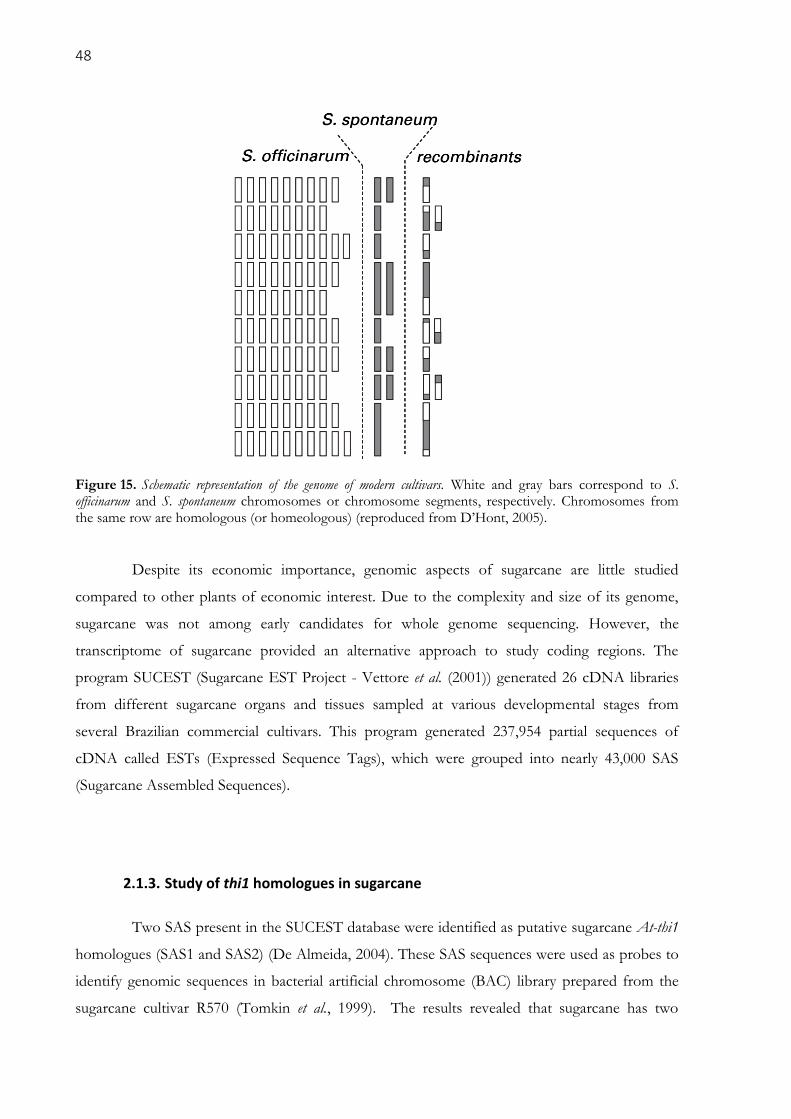
48
Figure 15. Schematic representation of the genome of modern cultivars. White and gray bars correspond to S. officinarum and S. spontaneum chromosomes or chromosome segments, respectively. Chromosomes from the same row are homologous (or homeologous) (reproduced from D’Hont, 2005).
Despite its economic importance, genomic aspects of sugarcane are little studied
compared to other plants of economic interest. Due to the complexity and size of its genome,
sugarcane was not among early candidates for whole genome sequencing. However, the
transcriptome of sugarcane provided an alternative approach to study coding regions. The
program SUCEST (Sugarcane EST Project - Vettore et al. (2001)) generated 26 cDNA libraries
from different sugarcane organs and tissues sampled at various developmental stages from
several Brazilian commercial cultivars. This program generated 237,954 partial sequences of
cDNA called ESTs (Expressed Sequence Tags), which were grouped into nearly 43,000 SAS
(Sugarcane Assembled Sequences).
2.1.3. Study of thi1 homologues in sugarcane
Two SAS present in the SUCEST database were identified as putative sugarcane At-thi1
homologues (SAS1 and SAS2) (De Almeida, 2004). These SAS sequences were used as probes to
identify genomic sequences in bacterial artificial chromosome (BAC) library prepared from the
sugarcane cultivar R570 (Tomkin et al., 1999). The results revealed that sugarcane has two
49
genomic copies of thi1 (sc-thi1.1 and sc-thi1.2, corresponding, respectively, to SAS1 and SAS2),
with nine BACs identified using SAS1 as a probe and ten using SAS2 as a probe.
We hypothesized that this duplication may be associated with differential expression
profiles of THI1 in sugarcane, differential function of each copy, or differential organelle
targeting. The presence of these two gene copies suggests at least the potential for differential
gene regulation, compared to A. thaliana, which has only one copy of the gene.
In this work, we report the gene structure of both sc-thi1 copies, their genomic context
and synteny analyses, the genetic diversity of thi1 gene copies in the genus Saccharum. Differential
gene expression pattern of the two gene copies was also studied. Thiamine biosynthesis was
examined using yeast complementation assays.
The results supported that each SAS represents sc-thi1 copies located at two different
genomic loci. A deep phylogeny coupled with comparative sequence analyses revealed that the
ten sc-thi1.2 sequences actually represent two different sc-thi1 versions and were subdivided in sc-
thi1.2a and sc-thi1.2b. The orthology analysis showed that this duplication is also present in the C4
grasses Zea mays, Sorgum bicolor, Setaria italica and Panicum virgatum.
Sc-thi1.1 and sc-thi1.2b have the same cellular distribution pattern (in the mesophyll cells),
distinct from the observed for sc-thi1.2a (in the edges of the epidermal cells, in a punctate
pattern). Moreover, sc-thi1.1 and sc-thi1.2b are able to complement thiamine auxotrophy in a thi4
yeast mutant, if the N-terminal chloroplast transit peptide of the encoded sc-THI1 protein is
removed.
50
2.2. Material and Methods
2.2.1. Screening sugarcane BAC libraries for sc-thi1 homologues
A sugarcane BAC library (de Setta et al., 2014) is available. A pair of primers (thi1_F:
CAC CAT GGC CGA GAA CAG; thi1_R: CGT ACG AGC TCT CCA AGG AC) was
synthesized, corresponding to a conserved region of thi1, based SAS1 and SAS2 from the
SUCEST Database (Vettore et al. (2003)) that were identified as putative thi1 homologues. The
amplification of this region generated a 108 bp fragment that was used to screen the library. The
screening, sequencing and assembly of the BACs were done as described in de Setta et al. (2014).
2.2.2. Synteny and phylogeny analyses
Synteny analysis was carried out to compare BAC sequences containing both thi1 copies
and the related genomic region of six plants: Arabidopsis thaliana, Oryza sativa, Brachypodium
distachyon, Sorghum bicolor and Zea mays, retrieved from in silico DNA alignment comparison of the
predicted protein sequences of the BACs against the selected genomes present in the Phytozome
v9.1 database (Goodstein et al., 2012).
The Coding DNA Sequences (CDSs) of the thi1 gene from the selected BACs and plant
genomes were aligned using ClustalW2 (Thompson, Higgins and Gibson, 1994) with default
parameters. A Neighbor-joining phylogenetic tree was inferred using MEGA 5.1 program
(Tamura et al., 2011) with the following parameters: Analysis - Phylogeny Reconstruction;
Statistical Method - Maximum Parsimony; number of sites: 1008; No. of bootstrap reps = 1000;
CI = 0.743520; RI = 0.747651.
2.2.3. Plant thi1 phylogeny
In order to generate a plant thi1 phylogeny, proteins homologues to At-thi1 were
selected from the Phytozome v9.1 database (Goodstein et al., 2012). Ninety-three sequences,
present in thirty-eight plant species, were found. However, only sixty of them were selected for
analysis because some sequences were not complete or they displayed alternative splicing of
transcripts derived from the same gene. Table 1 shows the name of the plants that contain thi1
genes, the number of transcripts that were found in the database and how many transcripts were
selected for this study. A multiple alignment of CDSs from all the transcripts selected plus the sc-
thi1 CDS was done using ClustalOmega program (Sievers et al., 2011) with default parameters. A
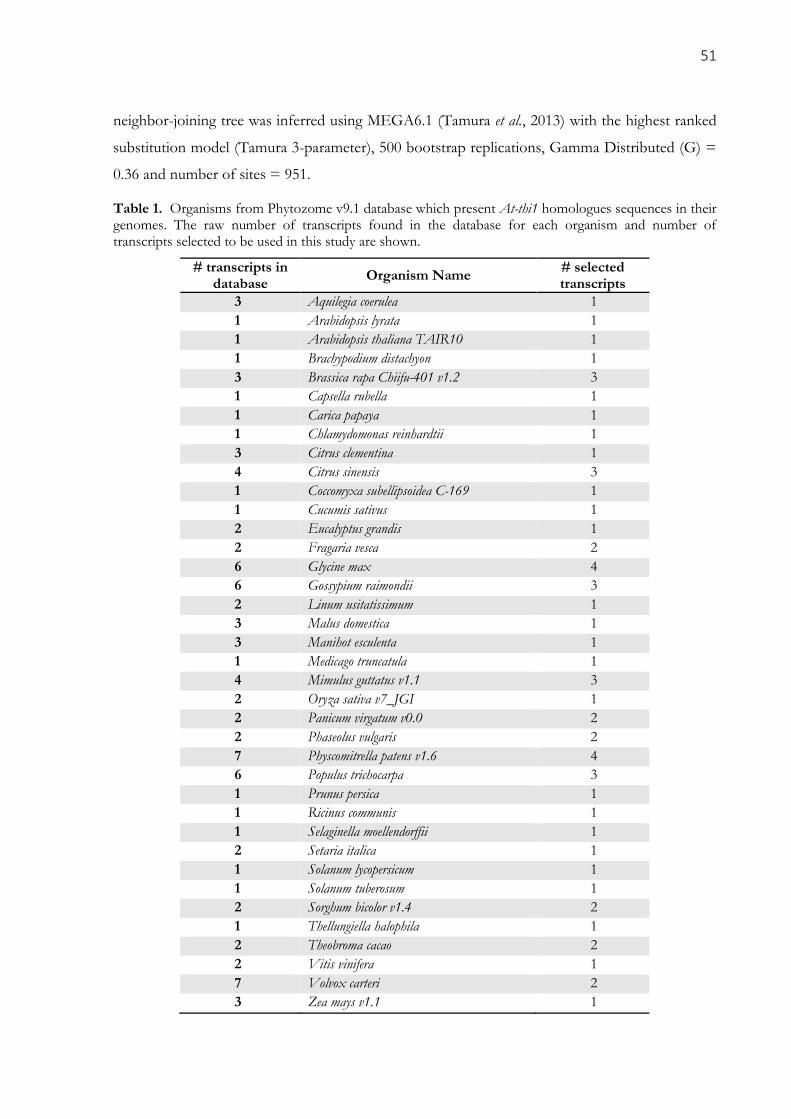
51
neighbor-joining tree was inferred using MEGA6.1 (Tamura et al., 2013) with the highest ranked
substitution model (Tamura 3-parameter), 500 bootstrap replications, Gamma Distributed (G) =
0.36 and number of sites = 951.
Table 1. Organisms from Phytozome v9.1 database which present At-thi1 homologues sequences in their genomes. The raw number of transcripts found in the database for each organism and number of transcripts selected to be used in this study are shown.
# transcripts in database
Organism Name # selected transcripts
3 Aquilegia coerulea 1
1 Arabidopsis lyrata 1
1 Arabidopsis thaliana TAIR10 1
1 Brachypodium distachyon 1
3 Brassica rapa Chiifu-401 v1.2 3
1 Capsella rubella 1
1 Carica papaya 1
1 Chlamydomonas reinhardtii 1
3 Citrus clementina 1
4 Citrus sinensis 3
1 Coccomyxa subellipsoidea C-169 1
1 Cucumis sativus 1
2 Eucalyptus grandis 1
2 Fragaria vesca 2
6 Glycine max 4
6 Gossypium raimondii 3
2 Linum usitatissimum 1
3 Malus domestica 1
3 Manihot esculenta 1
1 Medicago truncatula 1
4 Mimulus guttatus v1.1 3
2 Oryza sativa v7_JGI 1
2 Panicum virgatum v0.0 2
2 Phaseolus vulgaris 2
7 Physcomitrella patens v1.6 4
6 Populus trichocarpa 3
1 Prunus persica 1
1 Ricinus communis 1
1 Selaginella moellendorffii 1
2 Setaria italica 1
1 Solanum lycopersicum 1
1 Solanum tuberosum 1
2 Sorghum bicolor v1.4 2
1 Thellungiella halophila 1
2 Theobroma cacao 2
2 Vitis vinifera 1
7 Volvox carteri 2
3 Zea mays v1.1 1

52
2.2.4. Saccharum thi1 diversity network analysis
In order to study the thi1 homologues diversity in the Saccharum complex, a network
analysis was done. Sequences for network were obtained through PCR amplification using a pair
of primers (thi1Conserved_F: CTC CTC AAG TCC TCC TTC GC and thi1Conseved_R: TCA
TGC CGA TGT CCT GGA G) which correspond to a conserved region of sc-thi1 from the
nineteen BACs. Genomic DNA from Miscanthus sp., S. spontaneum (Mandalay), S. spontaneum (IN-
84-58), S. officinarum, the hybrids from Brazil breeding programs SP8032-80, R570 (BACs),
SP7011-43, SP8132-50, RB835486, RB72454, RB867515, and the hybrids POJ-2878 (from Java),
NA56-79 (from Argentina), NCo-310 (from South Africa) and Co-290 (from India) were used as
template in the PCR. As positive control, the same region also was amplified from S. bicolor.
These amplicons were then sequenced at the ABI PRIS 3730 DNA ANALYZER platform
(Applied Biosystems™). Phred-Phrap-Consed package (Ewing and Green, 1998; Ewing et al.,
1998; Gordon, Abajian and Green, 1998; Gordon, 2003) was used to sequencing quality control,
assembly and sequence edition. Each gene was analyzed individually using default parameters.
Only bases with phred quality ≥ 20 were used, resulting in core sequences of about 330 bp
(Figure 22). The sequence of this region was also obtained from sbA, sbB, zmA e zmB by blasting
in Phytozome v9.1 database (Goodstein et al., 2012).
All the resulting sequences were aligned using ClustalOmega (Sievers et al., 2011) with
default parameters. A network analysis were done using DnaSP5 (Librado and Rozas, 2009) and
NETWORK 4.6.1.2 (Bandelt, Forster and Rohl, 1999) software considering the gaps, with other
default parameters.
Based on the molecular characterization, three sc-thi1 sequences from the BACs were
selected to represent different versions of sc-thi1 in subsequent analyses. The sc-thi1 sequence
found in the 108_C04 BAC represents sc-thi1.1, the one found in the 017_B18 BAC represents sc-
thi1.2a and the 094_O04 BAC represents sc-thi1.2b.
2.2.5. RNA-seq analyses
Reads of three RNA-seq databases were mapped against the variable region of the N-
terminal (corresponding to amino acids 1-89 of the encoded polypeptide, Figure 22) of the three
sc-thi1 versions. This region was used as it is the only part of the protein which differentiates
between the sc-thi1 copies. The three RNA-seq available databases used were:
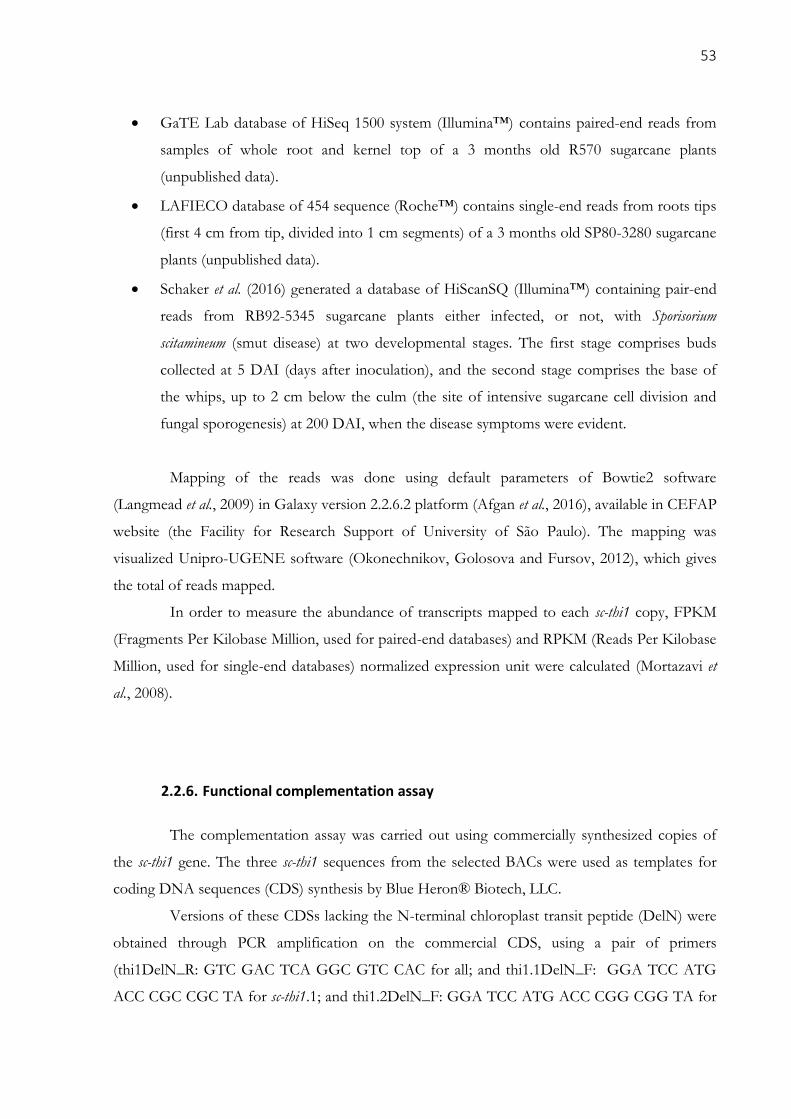
53
GaTE Lab database of HiSeq 1500 system (Illumina™) contains paired-end reads from
samples of whole root and kernel top of a 3 months old R570 sugarcane plants
(unpublished data).
LAFIECO database of 454 sequence (Roche™) contains single-end reads from roots tips
(first 4 cm from tip, divided into 1 cm segments) of a 3 months old SP80-3280 sugarcane
plants (unpublished data).
Schaker et al. (2016) generated a database of HiScanSQ (Illumina™) containing pair-end
reads from RB92-5345 sugarcane plants either infected, or not, with Sporisorium
scitamineum (smut disease) at two developmental stages. The first stage comprises buds
collected at 5 DAI (days after inoculation), and the second stage comprises the base of
the whips, up to 2 cm below the culm (the site of intensive sugarcane cell division and
fungal sporogenesis) at 200 DAI, when the disease symptoms were evident.
Mapping of the reads was done using default parameters of Bowtie2 software
(Langmead et al., 2009) in Galaxy version 2.2.6.2 platform (Afgan et al., 2016), available in CEFAP
website (the Facility for Research Support of University of São Paulo). The mapping was
visualized Unipro-UGENE software (Okonechnikov, Golosova and Fursov, 2012), which gives
the total of reads mapped.
In order to measure the abundance of transcripts mapped to each sc-thi1 copy, FPKM
(Fragments Per Kilobase Million, used for paired-end databases) and RPKM (Reads Per Kilobase
Million, used for single-end databases) normalized expression unit were calculated (Mortazavi et
al., 2008).
2.2.6. Functional complementation assay
The complementation assay was carried out using commercially synthesized copies of
the sc-thi1 gene. The three sc-thi1 sequences from the selected BACs were used as templates for
coding DNA sequences (CDS) synthesis by Blue Heron® Biotech, LLC.
Versions of these CDSs lacking the N-terminal chloroplast transit peptide (DelN) were
obtained through PCR amplification on the commercial CDS, using a pair of primers
(thi1DelN_R: GTC GAC TCA GGC GTC CAC for all; and thi1.1DelN_F: GGA TCC ATG
ACC CGC CGC TA for sc-thi1.1; and thi1.2DelN_F: GGA TCC ATG ACC CGG CGG TA for
54
both sc-thi1.2a and sc-thi1.2b) corresponding to polypeptide sequence starting from the second
initiation codon (amino acid 78 in Figure 22) to the stop codon (amino acid 360).
The CDS, containing the restriction enzyme sites of BamHI at 5’ and Sal1 at 3', were
inserted in the yeast expression vector pG-1 (Schena, Picard and Yamamoto, 1991) using T4
ligase (Promega®) according to the manufacturer's protocol. Two more constructs were used as
control: A184V as positive control, which is the CDS of the A. thaliana tz-201 mutant and is able
to complement the thiamine auxotrophy in the thi4 yeast mutant (Papini-Terzi et al., 2003); and
DelN as negative control, which is the A. thaliana wild-type (WT) thi1 lacking the N-terminal
chloroplast transit peptide (Galhardo, 2003). All constructs were transformed in KBY5 strain by
the heat shock method (Schiestl and Gietz, 1989).
S. cerevisiae strains used in this work were W303 (mata, ade2-1, trp1-1, leu2-3-112, can1-100,
ura3-1, his3-11-115) and KBY5 (as W303, THI4::URA3 (Praekelt, Byrne and Meacock, 1994).
Selection of transformants with pG-1 constructs was performed on yeast nitrogen base (YNB)
(BD Biosciences®) medium lacking tryptophan.
For the thiamine auxotrophy experiment, cells were grown overnight in liquid YNB
without tryptophan, centrifuged, and re-suspended in 10 mM MgSO4. From an OD = 1, three
serial and, tenfold dilutions were prepared. These were then plated on minimal medium (same as
yeast nitrogen base, but lacking both thiamine HCL (YNB -thia) and tryptophan, from
USBiological®) plates, either with or without thiamine and tryptophan, and incubated for 28 days
at 30°C and, analyzed every 4 days thereafter.
2.2.7. Subcellular localization
In order to evaluate the subcellular localization of each sc-thi1 copy, the N-terminal
region (N-term) containing both the chloroplast transit peptide (CTP) and the mitochondria pre-
sequence (MPS) was fused to the green fluorescence protein (GFP) reporter. Based on the work
of Chabregas et al. (2003), which examined the subcellular localization of At-thi1, the N-terminal
(CTP+MPS) was defined as the first 127 amino acids of Figure 22. This region was amplified
from each of the sc-thi1 CDSs (commercially synthesized as described above) using a pair of
primers (thi1-NT-Gat_F: TAC AAA AAA GCA GGC TAT GGC CAC CAC CGC GG; thi1-
NT-Gat_R: CAA GAA AGC TGG GTT CGG GGA CAC CGA CTG CTC) containing part of
the attB adaptors (underlined) to the Gateway cloning system (Invitrogen™). A second PCR
reaction was done to complete the attB adaptor, using another pair of primers (ATTB1.1: GGG
55
GAC AAG TTT GTA CAA AAA AGC AGG CT; ATTB2.2: GGG GAC CAC TTT GTA
CAA GAA AGC TGG GT).
The final attB-PCR products were cloned into the destination vector pK7FWG2.0
(Karimi, Inzé and Depicker, 2002) (Figure 16) through the Gateway™ cloning Technology
(Invitrogen™) following the manufacturer's specifications, resulting in three expression vectors,
each one containing one of the sc-thi1 N-termini fused to the N-terminus of the GFP
fluorescence reporter gene, under the control of the constitutive Cauliflower Mosaic Virus 35S
promoter (CaMV 35S).
Figure 16. Destination vector pK7FWG2.0. Three sc-thi1 N-terminal (CTP+MPS) versions were independently inserted between the attR1 and attR2 sites, replacing the lethal ccdB gene, using the Gateway™ Technology, resulting in a C-terminal fusion of the GFP fluorescence tag (reproduced from: Karimi, Inzé and Depicker, 2002).
The 35S-GFP-At5g47540 construct provided by Fernanda Marisca Bizotto (Laboratório
de Evolução e Diversidade II from Federal University of ABC) was used as a positive control. For
this construct the GFP expression is expected to be found in the cytoplasm of epidermal cells of
tobacco leaves.
The three final vectors (one for each sc-thi1 copy; 35S-scTHI1.1(N-term)-GFP, 35S-
scTHI1.2a(N-term)-GFP and 35S-scTHI1.2b(N-term)-GFP) and the positive control vector were
56
transformed independently into Agrobacterium tumefaciens C58C1-pMP90 and then transfected into
Nicotiana tabacum leaves, both following the protocol described by (Sparkes et al., 2006). Two
different sections of two different leaves of two different plants in different ages (5 and 8 weeks
old) were infiltrated with each construction. An absorbance of 0.1 for the Agrobacterium culture
was used.
The infiltrated leaves were covered with aluminum foil and kept under summer
conditions at the greenhouse for two days. The samples were collected at 9 a.m. in the third day
after infiltration. The expression of the transgene within the abaxial side of the leaf was examined
by confocal microscope LSM880 (Zeiss™) using a 10x objective. GFP was excited with the
argon laser (488 nm), and emitted light was collected between 498 and 510 nm. Chloroplasts were
excited with the argon laser (488 nm), and emitted light was collected from 610 to 669 nm. The
GFP and chloroplast signals were collected separately and later superimposed computationally
with ZEN black edition (Zeiss) software.
.
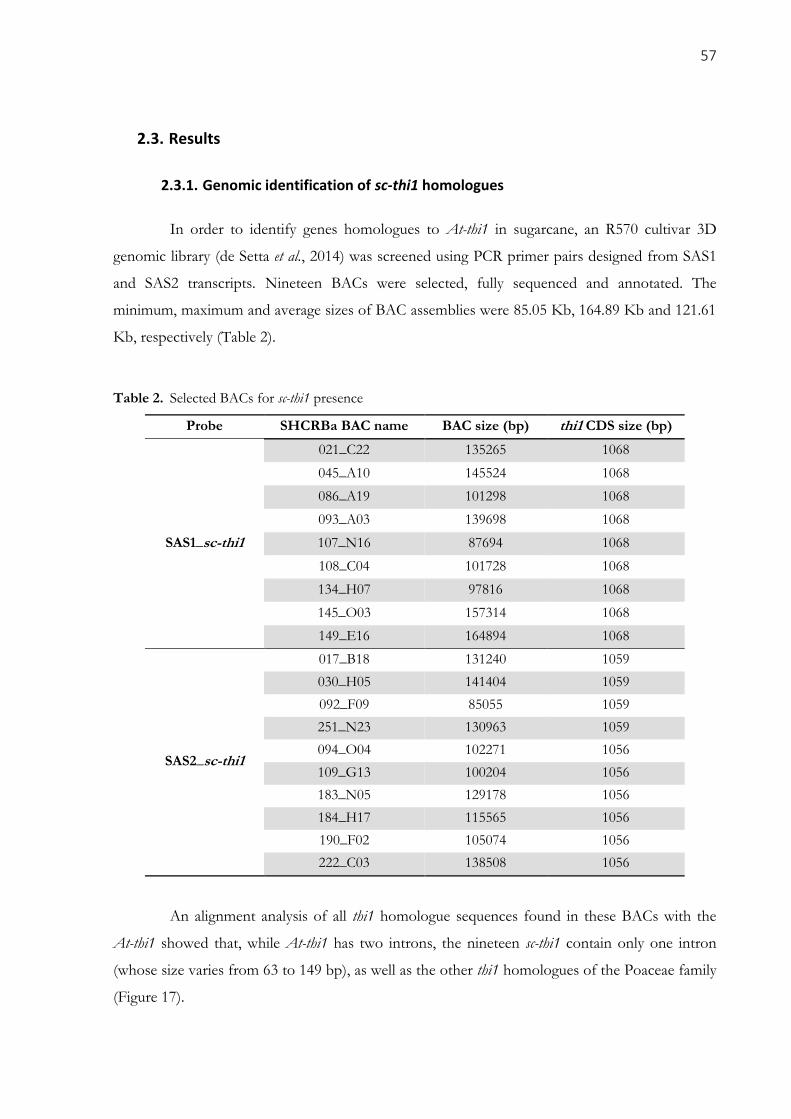
57
2.3. Results
2.3.1. Genomic identification of sc-thi1 homologues
In order to identify genes homologues to At-thi1 in sugarcane, an R570 cultivar 3D
genomic library (de Setta et al., 2014) was screened using PCR primer pairs designed from SAS1
and SAS2 transcripts. Nineteen BACs were selected, fully sequenced and annotated. The
minimum, maximum and average sizes of BAC assemblies were 85.05 Kb, 164.89 Kb and 121.61
Kb, respectively (Table 2).
Table 2. Selected BACs for sc-thi1 presence
Probe SHCRBa BAC name BAC size (bp) thi1 CDS size (bp)
SAS1_sc-thi1
021_C22 135265 1068
045_A10 145524 1068
086_A19 101298 1068
093_A03 139698 1068
107_N16 87694 1068
108_C04 101728 1068
134_H07 97816 1068
145_O03 157314 1068
149_E16 164894 1068
SAS2_sc-thi1
017_B18 131240 1059
030_H05 141404 1059
092_F09 85055 1059
251_N23 130963 1059
094_O04 102271 1056
109_G13 100204 1056
183_N05 129178 1056
184_H17 115565 1056
190_F02 105074 1056
222_C03 138508 1056
An alignment analysis of all thi1 homologue sequences found in these BACs with the
At-thi1 showed that, while At-thi1 has two introns, the nineteen sc-thi1 contain only one intron
(whose size varies from 63 to 149 bp), as well as the other thi1 homologues of the Poaceae family
(Figure 17).

58
Figure 17. Structure of the thi1 gene in A. thaliana and in the Poaceae family. Black boxes represent introns, gray boxes represent exons and dashed boxes represent untranslated regions (5’UTR to the left and 3’UTR to the right).
2.3.2. Synteny and Phylogeny of thi1 in grasses
Synteny analysis was performed using the nineteen sugarcane BACs sequences, the thi1
containing genomic region of A. thaliana (Eudicot) and other five grass genomes aiming to
understand the evolutionary history from THI1 coding genes. As presented in Figure 18, this
analysis supports that there are two copies of thi1 in sugarcane genome, found in two distinct
genomic loci. Nine clones correspond to sc-thi1.1, and ten correspond to sc-thi1.2. Differences in
intergenic regions length along the BACs are due mainly to differential transposable element
insertions (data not shown).
Thi1 genes are found on the chromosomes 2 (sbA) and 3 (sbB) of S. bicolor, the
chromosomes 3 (zmA) and 8 (zmB) of Z. mays and in the chromosomes 2 (siA) and 4 (siB) of S.
italica. Only one copy of thi1 has been identified in O. sativa and B. distachyon. Using a comparative
genomics approach, we reveal that among the plant genomes analyzed, there are five different
genomic environments (A-E) surrounding thi1 gene (Figure 18). The plant thi1 gene is found in at
least 5 independent genomic locations. First, in the common ancestor of the Andropogoneae tribe
(sugarcane, sorghum, and maize) two loci carry thi1 copies (thi1.1 – present in region A and thi1.2
– present in region B), which is in accordance with the observed high collinearity between
sugarcane and sorghum chromosomes (Ming et al., 1998). Interestingly, Z. mays duplicated the
entire region A and despite having region B, which carries a copy of thi1 in the other genomes, Z.
mays has lost thi1 from that location, as well as, a neighboring gene (gene 17 in the figure 18).
Second, S. italica has two thi1 copies, one in a region syntenic to those of O. sativa and B.
distachyon, and another copy located in a different region of all species analyzed in this study.
Finally, the A. thaliana thi1 region is non-syntenic to any region of grasses studied.

59
Figure 18. Comparison of thi1 gene and its genomic flanking regions in sugarcane and other plants through phylogenetic and synteny analyses. A) Maximum Parsimony tree inferred by MEGA5.1 using Phylogeny reconstruction parameter and 1000 bootstrap replicates. The tree is based on the multiple alignment of the two exons of the single thi1 copy from A. thaliana (at), O. sativa (os) and B. distachyon (bd) and two copies of thi1 on chromosome 2 (siA) and 4 (siB) in S. italica, 2 (sbA) and 3 (sbB) in S. bicolor, and 3 (zmA) and 8 (zmB) in Z. mays. B) Synteny analysis was performed using blastx between sugarcane BAC sequences and sequences from the other genomes obtained from the Phytozome 9.1 database. Rectangles indicate genes. Accession number of the genes: 1-Sb03g025470; 2-Sb03g025480; 3-Sb03g025490; 4-Sb03g025500; 5-Sb03g025510; 6-Sb03g025530; 7-Sb03g025540; 8-Sb03g025550; 9-Sb03g025560; 10-Sb02g039980; 11-Sb02g039990; 12-Sb02g039995; 13-Sb02g040000; 14-Sb02g040010; 15-Sb02g040020; 16-Sb02g040040; 17-Sb02g040050; 18-Sb02g040070; 19-Sb02g040110; 20-Sb02g040120; 21-Sb02g040140; 22-Sb02g040150; 23-Sb02g040160; 24-Si033048; 25-Si029341; 26-Si030570; 27-Si033272; 28-Si030843; 29-Si006377; 30-Si006932; 31-Si005733; 32-Si006773; 33-Si008008; 34-Si005676; 35-AT5G54745; 36-AT5G54750; 37-AT5G54760; 38-AT5G54780; 39-AT5G54790; 40-AT5G54800; *Part of the Z. mays chromosome 7, which is syntenic to region B, but does not have either thi1 copy II or gene 17.
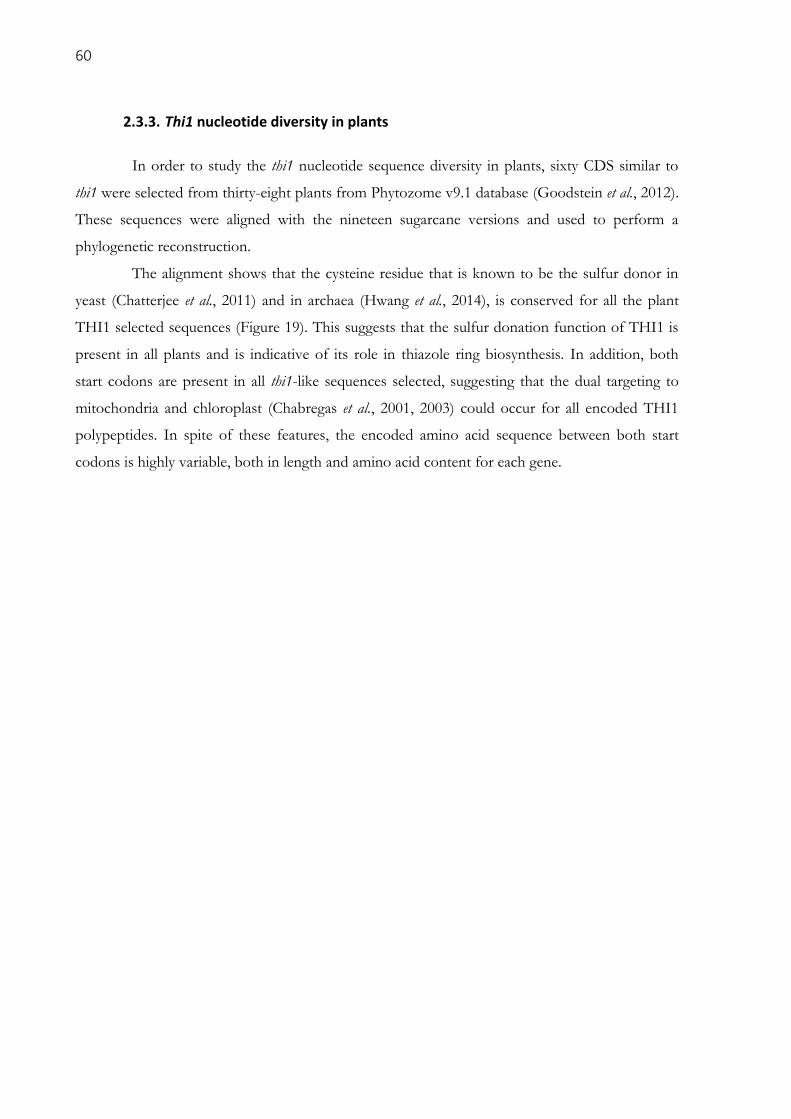
60
2.3.3. Thi1 nucleotide diversity in plants
In order to study the thi1 nucleotide sequence diversity in plants, sixty CDS similar to
thi1 were selected from thirty-eight plants from Phytozome v9.1 database (Goodstein et al., 2012).
These sequences were aligned with the nineteen sugarcane versions and used to perform a
phylogenetic reconstruction.
The alignment shows that the cysteine residue that is known to be the sulfur donor in
yeast (Chatterjee et al., 2011) and in archaea (Hwang et al., 2014), is conserved for all the plant
THI1 selected sequences (Figure 19). This suggests that the sulfur donation function of THI1 is
present in all plants and is indicative of its role in thiazole ring biosynthesis. In addition, both
start codons are present in all thi1-like sequences selected, suggesting that the dual targeting to
mitochondria and chloroplast (Chabregas et al., 2001, 2003) could occur for all encoded THI1
polypeptides. In spite of these features, the encoded amino acid sequence between both start
codons is highly variable, both in length and amino acid content for each gene.
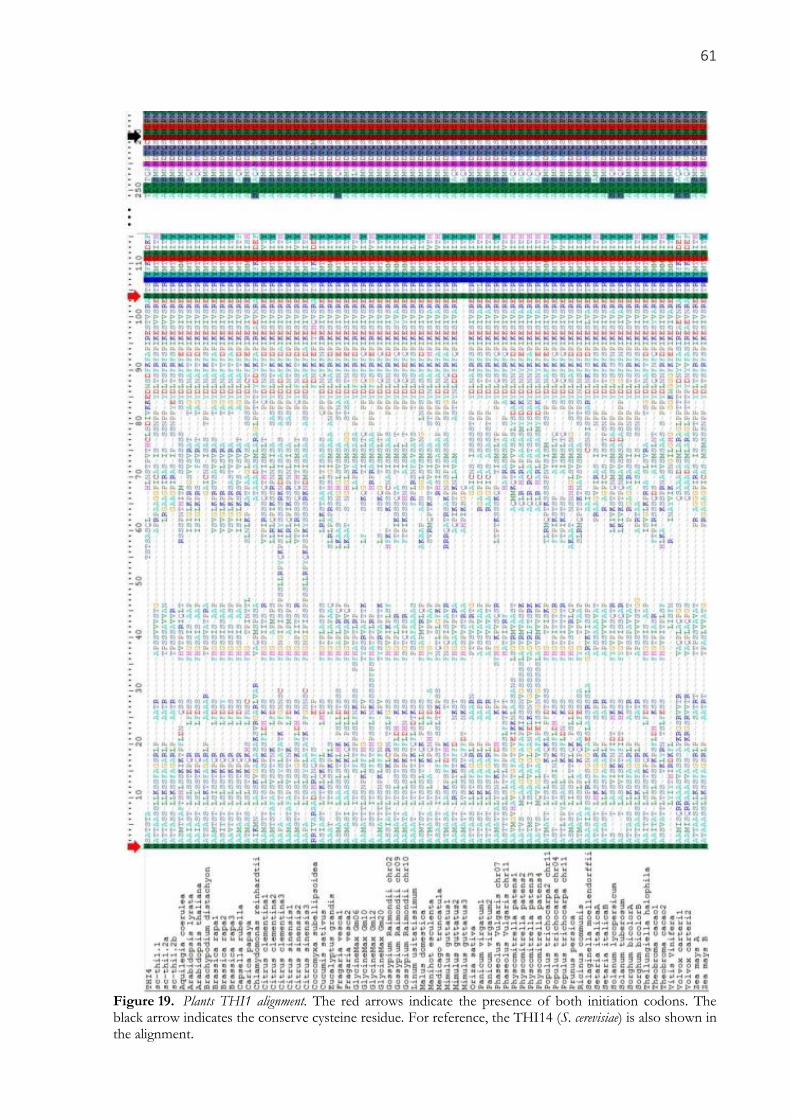
61
Figure 19. Plants THI1 alignment. The red arrows indicate the presence of both initiation codons. The black arrow indicates the conserve cysteine residue. For reference, the THI14 (S. cerevisiae) is also shown in the alignment.

62
The phylogenetic tree (Figure 20) illustrates that the thi1 selected sequences groups in
four well-supported clades, according to the species taxonomy (Eudicots, Monocots, Bryophytes
and Chlorophytes), but the basal evolutionary relationships were not resolved.
While C3 metabolism grasses (Brachypodium distachyon and Oryza sativa) have just one thi1
copy, all C4 metabolism grasses (Panicum virgatum, Setaria italica, Zea mays and Sorghum bicolor) also
present two copies homologous to thi1 gene. In accordance with the synteny above, each thi1
copy of S. bicolor is grouped with different sc-thi1 clades.
Figure 20. Comparison of THI1 protein among sugarcane and other plants. Neighbor-joining thi1 phylogenetic tree inferred by MEGA6.1 using thi1 CDS present in 38 plants. Highest ranked substitution model (Tamura 3-parameter) and 500 bootstrap replicates were used. The * indicates the Monocot branch.
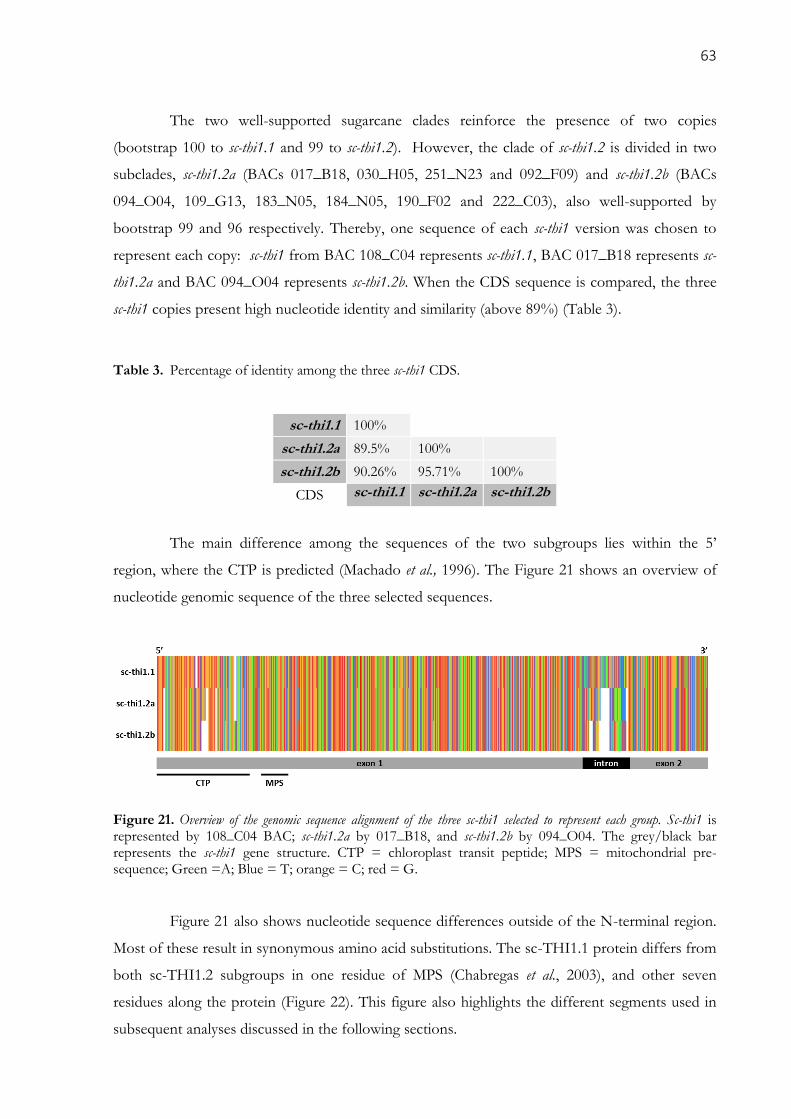
63
The two well-supported sugarcane clades reinforce the presence of two copies
(bootstrap 100 to sc-thi1.1 and 99 to sc-thi1.2). However, the clade of sc-thi1.2 is divided in two
subclades, sc-thi1.2a (BACs 017_B18, 030_H05, 251_N23 and 092_F09) and sc-thi1.2b (BACs
094_O04, 109_G13, 183_N05, 184_N05, 190_F02 and 222_C03), also well-supported by
bootstrap 99 and 96 respectively. Thereby, one sequence of each sc-thi1 version was chosen to
represent each copy: sc-thi1 from BAC 108_C04 represents sc-thi1.1, BAC 017_B18 represents sc-
thi1.2a and BAC 094_O04 represents sc-thi1.2b. When the CDS sequence is compared, the three
sc-thi1 copies present high nucleotide identity and similarity (above 89%) (Table 3).
Table 3. Percentage of identity among the three sc-thi1 CDS.
sc-thi1.1 100%
sc-thi1.2a 89.5% 100%
sc-thi1.2b 90.26% 95.71% 100%
CDS sc-thi1.1 sc-thi1.2a sc-thi1.2b
The main difference among the sequences of the two subgroups lies within the 5’
region, where the CTP is predicted (Machado et al., 1996). The Figure 21 shows an overview of
nucleotide genomic sequence of the three selected sequences.
Figure 21. Overview of the genomic sequence alignment of the three sc-thi1 selected to represent each group. Sc-thi1 is represented by 108_C04 BAC; sc-thi1.2a by 017_B18, and sc-thi1.2b by 094_O04. The grey/black bar represents the sc-thi1 gene structure. CTP = chloroplast transit peptide; MPS = mitochondrial pre-sequence; Green =A; Blue = T; orange = C; red = G.
Figure 21 also shows nucleotide sequence differences outside of the N-terminal region.
Most of these result in synonymous amino acid substitutions. The sc-THI1.1 protein differs from
both sc-THI1.2 subgroups in one residue of MPS (Chabregas et al., 2003), and other seven
residues along the protein (Figure 22). This figure also highlights the different segments used in
subsequent analyses discussed in the following sections.
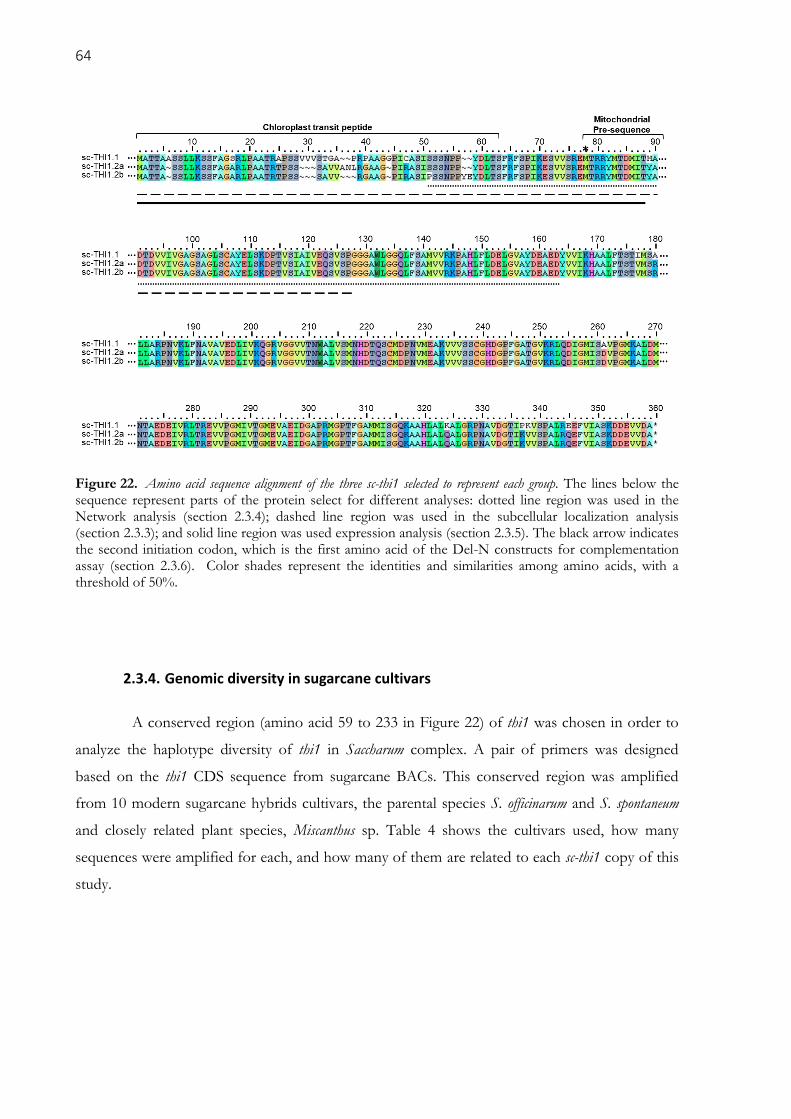
64
Figure 22. Amino acid sequence alignment of the three sc-thi1 selected to represent each group. The lines below the sequence represent parts of the protein select for different analyses: dotted line region was used in the Network analysis (section 2.3.4); dashed line region was used in the subcellular localization analysis (section 2.3.3); and solid line region was used expression analysis (section 2.3.5). The black arrow indicates the second initiation codon, which is the first amino acid of the Del-N constructs for complementation assay (section 2.3.6). Color shades represent the identities and similarities among amino acids, with a threshold of 50%.
2.3.4. Genomic diversity in sugarcane cultivars
A conserved region (amino acid 59 to 233 in Figure 22) of thi1 was chosen in order to
analyze the haplotype diversity of thi1 in Saccharum complex. A pair of primers was designed
based on the thi1 CDS sequence from sugarcane BACs. This conserved region was amplified
from 10 modern sugarcane hybrids cultivars, the parental species S. officinarum and S. spontaneum
and closely related plant species, Miscanthus sp. Table 4 shows the cultivars used, how many
sequences were amplified for each, and how many of them are related to each sc-thi1 copy of this
study.
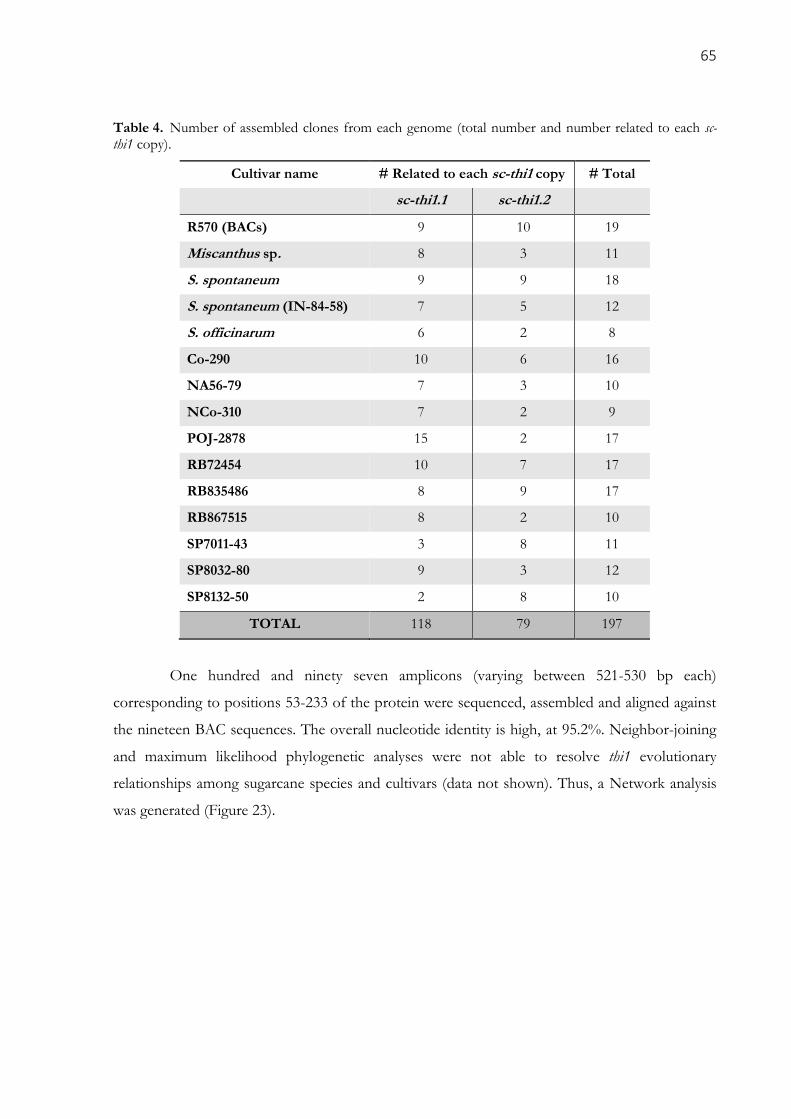
65
Table 4. Number of assembled clones from each genome (total number and number related to each sc-thi1 copy).
Cultivar name # Related to each sc-thi1 copy # Total
sc-thi1.1 sc-thi1.2
R570 (BACs) 9 10 19
Miscanthus sp. 8 3 11
S. spontaneum 9 9 18
S. spontaneum (IN-84-58) 7 5 12
S. officinarum 6 2 8
Co-290 10 6 16
NA56-79 7 3 10
NCo-310 7 2 9
POJ-2878 15 2 17
RB72454 10 7 17
RB835486 8 9 17
RB867515 8 2 10
SP7011-43 3 8 11
SP8032-80 9 3 12
SP8132-50 2 8 10
TOTAL 118 79 197
One hundred and ninety seven amplicons (varying between 521-530 bp each)
corresponding to positions 53-233 of the protein were sequenced, assembled and aligned against
the nineteen BAC sequences. The overall nucleotide identity is high, at 95.2%. Neighbor-joining
and maximum likelihood phylogenetic analyses were not able to resolve thi1 evolutionary
relationships among sugarcane species and cultivars (data not shown). Thus, a Network analysis
was generated (Figure 23).
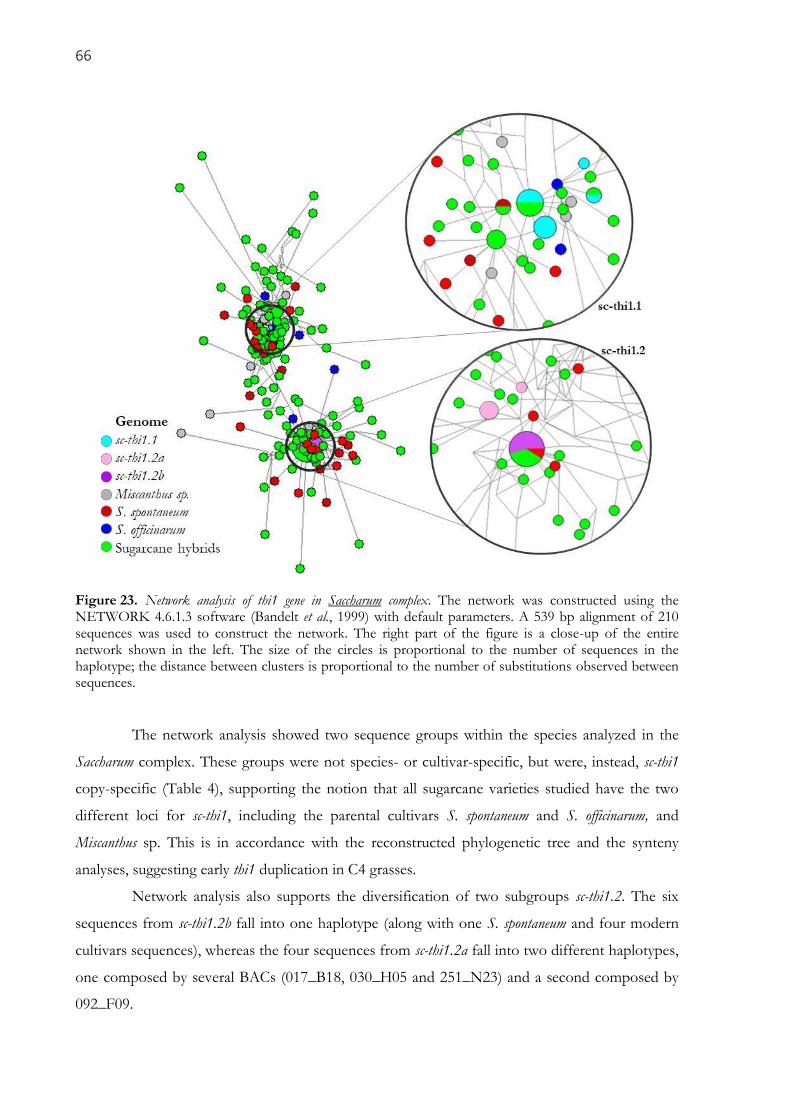
66
Figure 23. Network analysis of thi1 gene in Saccharum complex. The network was constructed using the NETWORK 4.6.1.3 software (Bandelt et al., 1999) with default parameters. A 539 bp alignment of 210 sequences was used to construct the network. The right part of the figure is a close-up of the entire network shown in the left. The size of the circles is proportional to the number of sequences in the haplotype; the distance between clusters is proportional to the number of substitutions observed between sequences.
The network analysis showed two sequence groups within the species analyzed in the
Saccharum complex. These groups were not species- or cultivar-specific, but were, instead, sc-thi1
copy-specific (Table 4), supporting the notion that all sugarcane varieties studied have the two
different loci for sc-thi1, including the parental cultivars S. spontaneum and S. officinarum, and
Miscanthus sp. This is in accordance with the reconstructed phylogenetic tree and the synteny
analyses, suggesting early thi1 duplication in C4 grasses.
Network analysis also supports the diversification of two subgroups sc-thi1.2. The six
sequences from sc-thi1.2b fall into one haplotype (along with one S. spontaneum and four modern
cultivars sequences), whereas the four sequences from sc-thi1.2a fall into two different haplotypes,
one composed by several BACs (017_B18, 030_H05 and 251_N23) and a second composed by
092_F09.
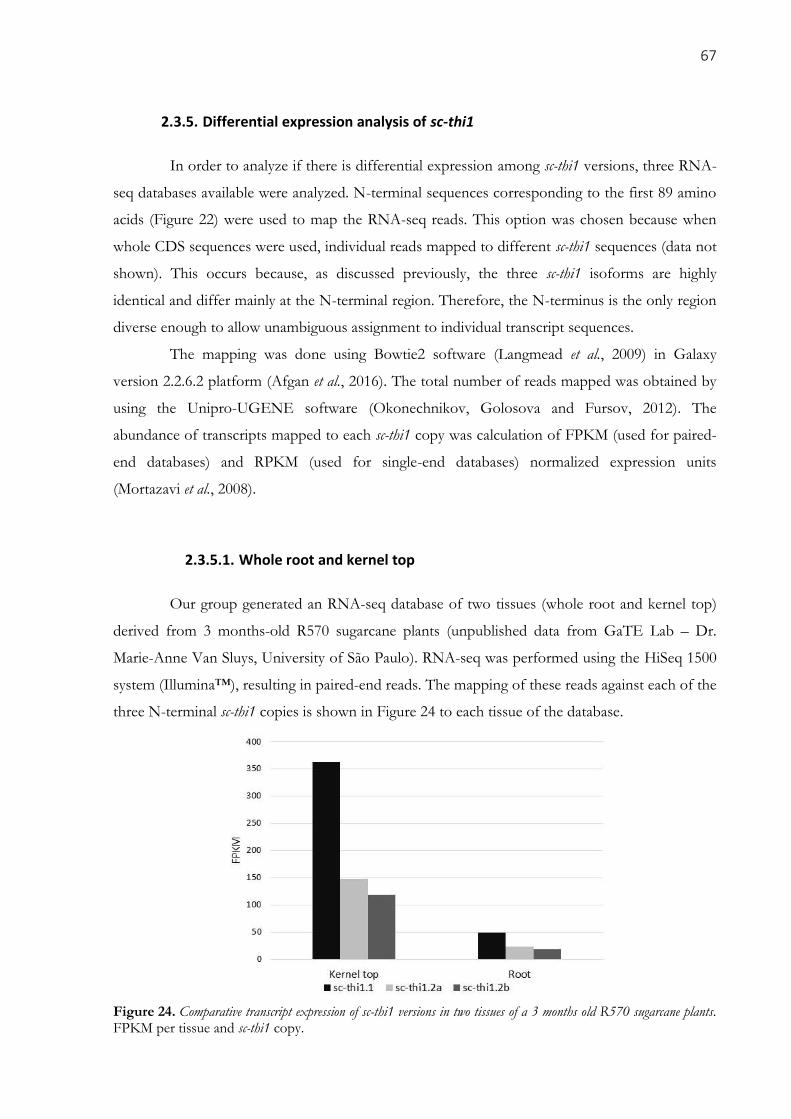
67
2.3.5. Differential expression analysis of sc-thi1
In order to analyze if there is differential expression among sc-thi1 versions, three RNA-
seq databases available were analyzed. N-terminal sequences corresponding to the first 89 amino
acids (Figure 22) were used to map the RNA-seq reads. This option was chosen because when
whole CDS sequences were used, individual reads mapped to different sc-thi1 sequences (data not
shown). This occurs because, as discussed previously, the three sc-thi1 isoforms are highly
identical and differ mainly at the N-terminal region. Therefore, the N-terminus is the only region
diverse enough to allow unambiguous assignment to individual transcript sequences.
The mapping was done using Bowtie2 software (Langmead et al., 2009) in Galaxy
version 2.2.6.2 platform (Afgan et al., 2016). The total number of reads mapped was obtained by
using the Unipro-UGENE software (Okonechnikov, Golosova and Fursov, 2012). The
abundance of transcripts mapped to each sc-thi1 copy was calculation of FPKM (used for paired-
end databases) and RPKM (used for single-end databases) normalized expression units
(Mortazavi et al., 2008).
2.3.5.1. Whole root and kernel top
Our group generated an RNA-seq database of two tissues (whole root and kernel top)
derived from 3 months-old R570 sugarcane plants (unpublished data from GaTE Lab – Dr.
Marie-Anne Van Sluys, University of São Paulo). RNA-seq was performed using the HiSeq 1500
system (Illumina™), resulting in paired-end reads. The mapping of these reads against each of the
three N-terminal sc-thi1 copies is shown in Figure 24 to each tissue of the database.
Figure 24. Comparative transcript expression of sc-thi1 versions in two tissues of a 3 months old R570 sugarcane plants. FPKM per tissue and sc-thi1 copy.
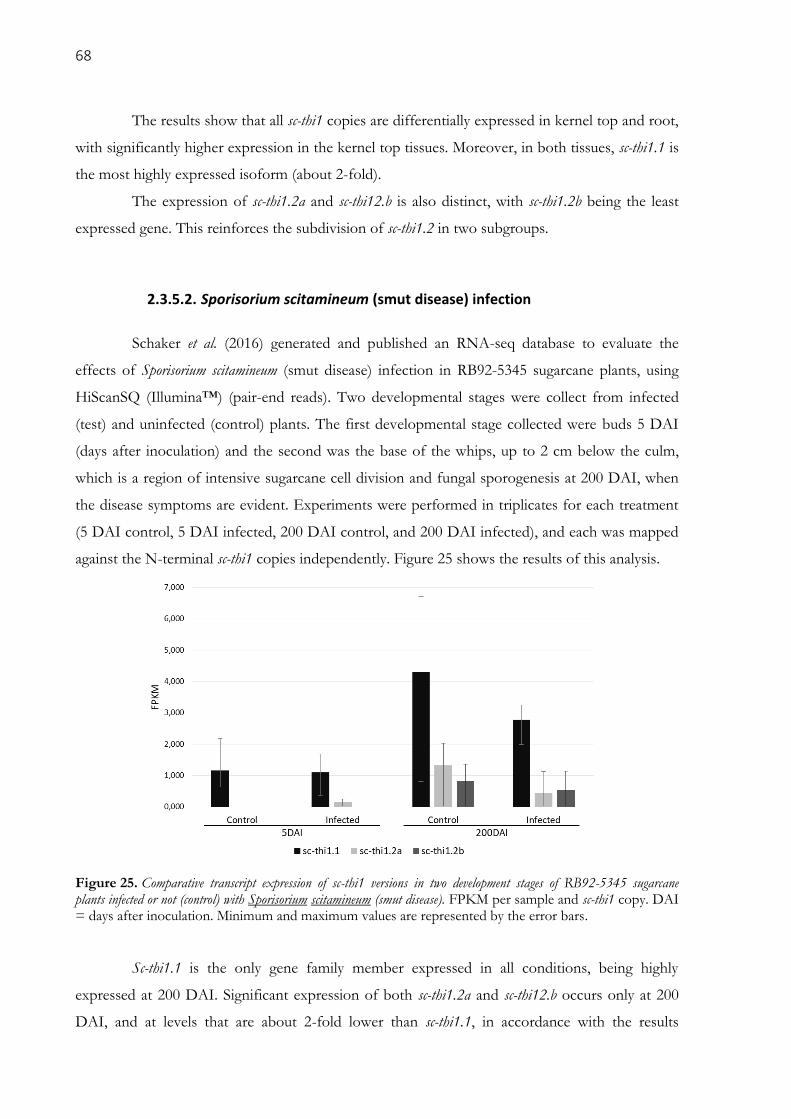
68
The results show that all sc-thi1 copies are differentially expressed in kernel top and root,
with significantly higher expression in the kernel top tissues. Moreover, in both tissues, sc-thi1.1 is
the most highly expressed isoform (about 2-fold).
The expression of sc-thi1.2a and sc-thi12.b is also distinct, with sc-thi1.2b being the least
expressed gene. This reinforces the subdivision of sc-thi1.2 in two subgroups.
2.3.5.2. Sporisorium scitamineum (smut disease) infection
Schaker et al. (2016) generated and published an RNA-seq database to evaluate the
effects of Sporisorium scitamineum (smut disease) infection in RB92-5345 sugarcane plants, using
HiScanSQ (Illumina™) (pair-end reads). Two developmental stages were collect from infected
(test) and uninfected (control) plants. The first developmental stage collected were buds 5 DAI
(days after inoculation) and the second was the base of the whips, up to 2 cm below the culm,
which is a region of intensive sugarcane cell division and fungal sporogenesis at 200 DAI, when
the disease symptoms are evident. Experiments were performed in triplicates for each treatment
(5 DAI control, 5 DAI infected, 200 DAI control, and 200 DAI infected), and each was mapped
against the N-terminal sc-thi1 copies independently. Figure 25 shows the results of this analysis.
Figure 25. Comparative transcript expression of sc-thi1 versions in two development stages of RB92-5345 sugarcane plants infected or not (control) with Sporisorium scitamineum (smut disease). FPKM per sample and sc-thi1 copy. DAI = days after inoculation. Minimum and maximum values are represented by the error bars.
Sc-thi1.1 is the only gene family member expressed in all conditions, being highly
expressed at 200 DAI. Significant expression of both sc-thi1.2a and sc-thi12.b occurs only at 200
DAI, and at levels that are about 2-fold lower than sc-thi1.1, in accordance with the results
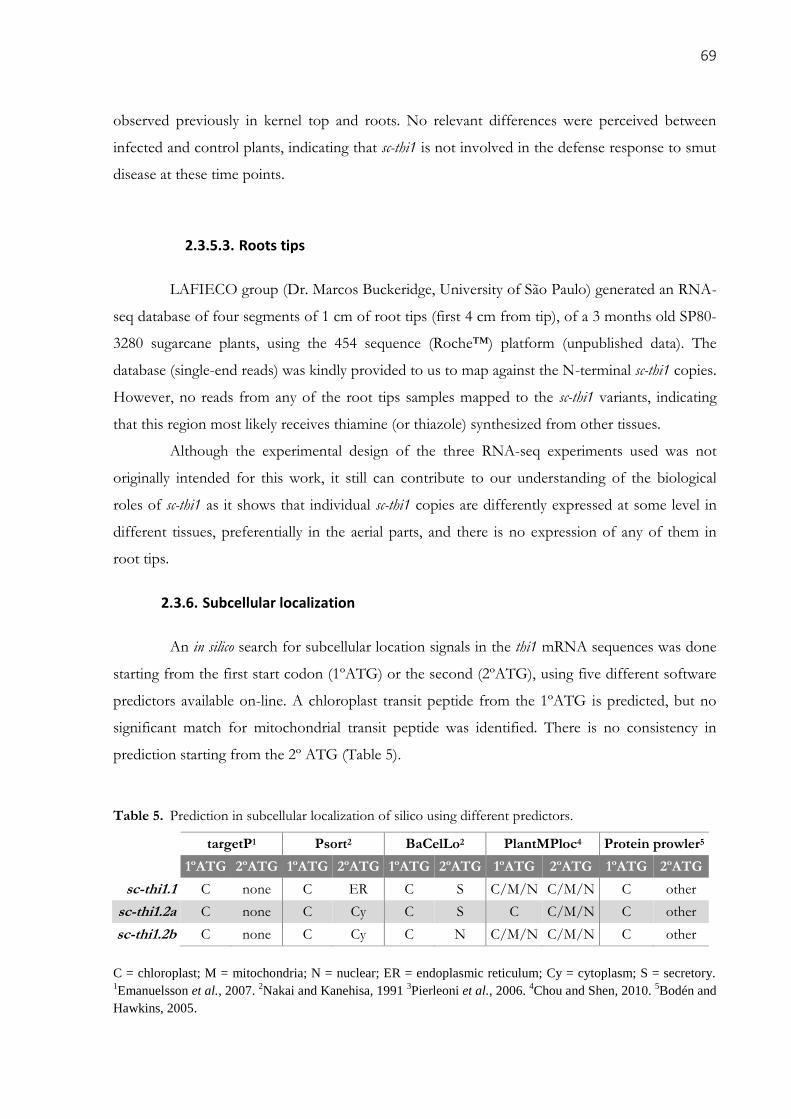
69
observed previously in kernel top and roots. No relevant differences were perceived between
infected and control plants, indicating that sc-thi1 is not involved in the defense response to smut
disease at these time points.
2.3.5.3. Roots tips
LAFIECO group (Dr. Marcos Buckeridge, University of São Paulo) generated an RNA-
seq database of four segments of 1 cm of root tips (first 4 cm from tip), of a 3 months old SP80-
3280 sugarcane plants, using the 454 sequence (Roche™) platform (unpublished data). The
database (single-end reads) was kindly provided to us to map against the N-terminal sc-thi1 copies.
However, no reads from any of the root tips samples mapped to the sc-thi1 variants, indicating
that this region most likely receives thiamine (or thiazole) synthesized from other tissues.
Although the experimental design of the three RNA-seq experiments used was not
originally intended for this work, it still can contribute to our understanding of the biological
roles of sc-thi1 as it shows that individual sc-thi1 copies are differently expressed at some level in
different tissues, preferentially in the aerial parts, and there is no expression of any of them in
root tips.
2.3.6. Subcellular localization
An in silico search for subcellular location signals in the thi1 mRNA sequences was done
starting from the first start codon (1ºATG) or the second (2ºATG), using five different software
predictors available on-line. A chloroplast transit peptide from the 1ºATG is predicted, but no
significant match for mitochondrial transit peptide was identified. There is no consistency in
prediction starting from the 2º ATG (Table 5).
Table 5. Prediction in subcellular localization of silico using different predictors.
targetP1 Psort2 BaCelLo2 PlantMPloc4 Protein prowler5
1ºATG 2ºATG 1ºATG 2ºATG 1ºATG 2ºATG 1ºATG 2ºATG 1ºATG 2ºATG
sc-thi1.1 C none C ER C S C/M/N C/M/N C other
sc-thi1.2a C none C Cy C S C C/M/N C other
sc-thi1.2b C none C Cy C N C/M/N C/M/N C other
C = chloroplast; M = mitochondria; N = nuclear; ER = endoplasmic reticulum; Cy = cytoplasm; S = secretory. 1Emanuelsson et al., 2007.
2Nakai and Kanehisa, 1991
3Pierleoni et al., 2006.
4Chou and Shen, 2010.
5Bodén and
Hawkins, 2005.
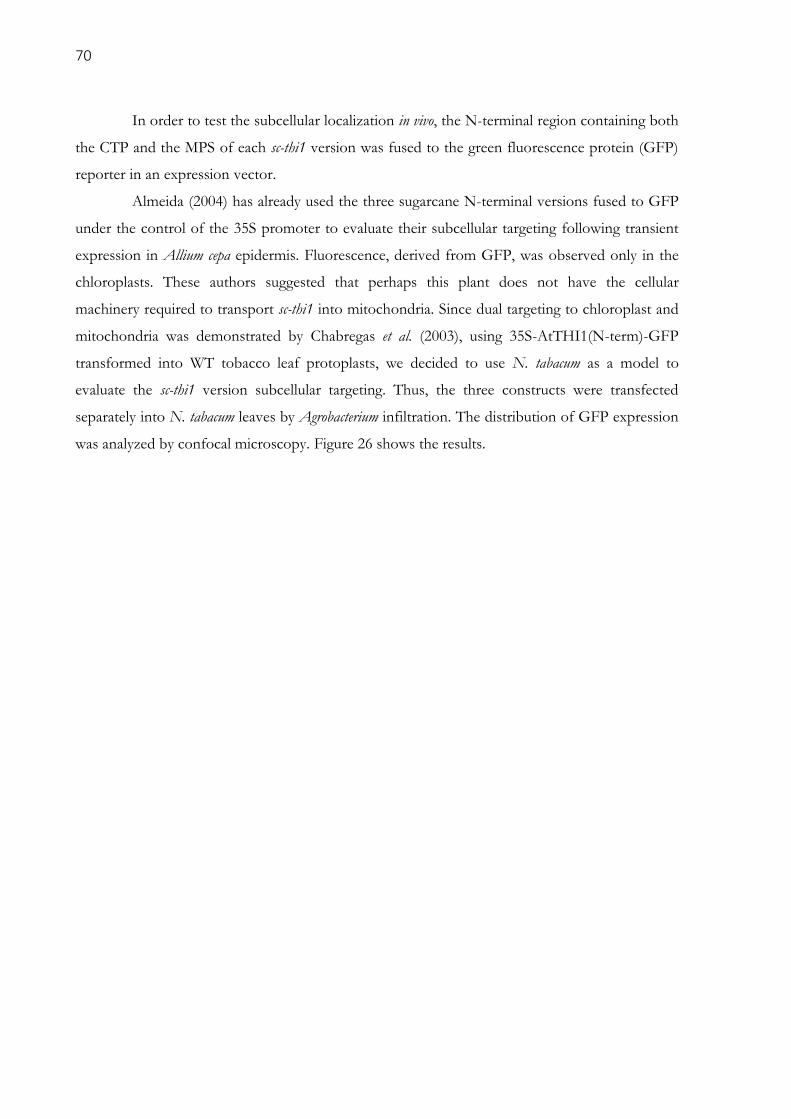
70
In order to test the subcellular localization in vivo, the N-terminal region containing both
the CTP and the MPS of each sc-thi1 version was fused to the green fluorescence protein (GFP)
reporter in an expression vector.
Almeida (2004) has already used the three sugarcane N-terminal versions fused to GFP
under the control of the 35S promoter to evaluate their subcellular targeting following transient
expression in Allium cepa epidermis. Fluorescence, derived from GFP, was observed only in the
chloroplasts. These authors suggested that perhaps this plant does not have the cellular
machinery required to transport sc-thi1 into mitochondria. Since dual targeting to chloroplast and
mitochondria was demonstrated by Chabregas et al. (2003), using 35S-AtTHI1(N-term)-GFP
transformed into WT tobacco leaf protoplasts, we decided to use N. tabacum as a model to
evaluate the sc-thi1 version subcellular targeting. Thus, the three constructs were transfected
separately into N. tabacum leaves by Agrobacterium infiltration. The distribution of GFP expression
was analyzed by confocal microscopy. Figure 26 shows the results.
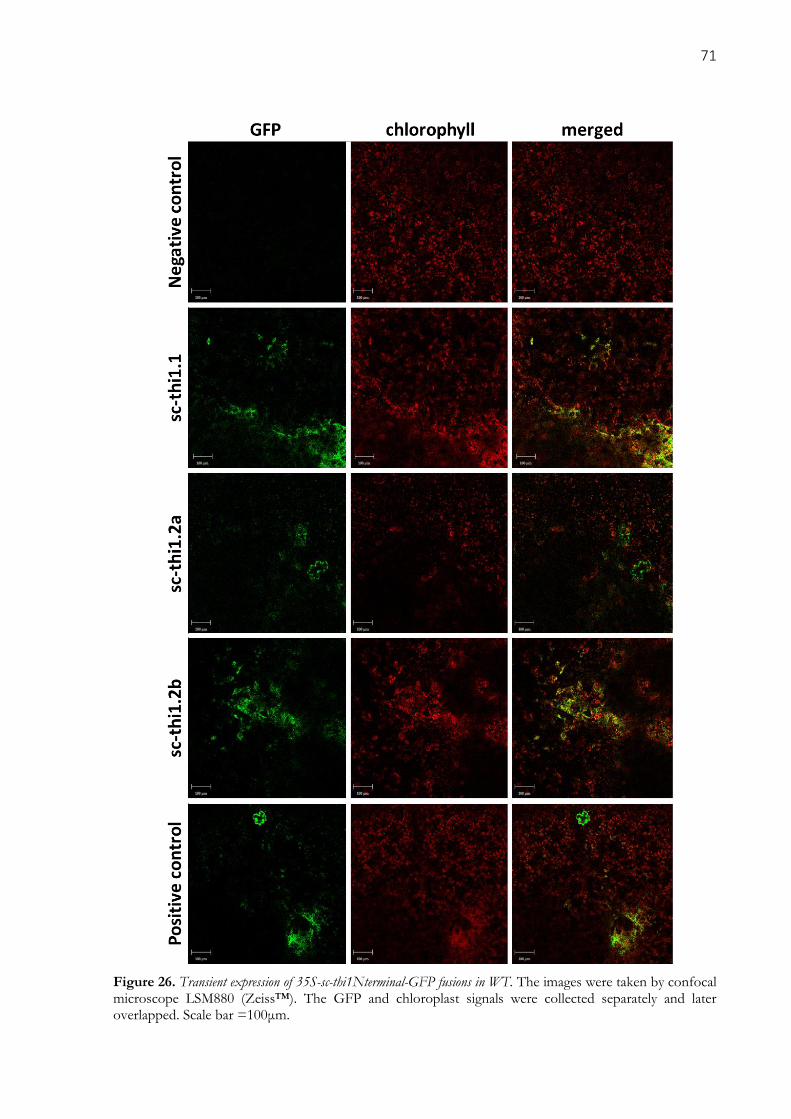
71
Figure 26. Transient expression of 35S-sc-thi1Nterminal-GFP fusions in WT. The images were taken by confocal microscope LSM880 (Zeiss™). The GFP and chloroplast signals were collected separately and later overlapped. Scale bar =100μm.
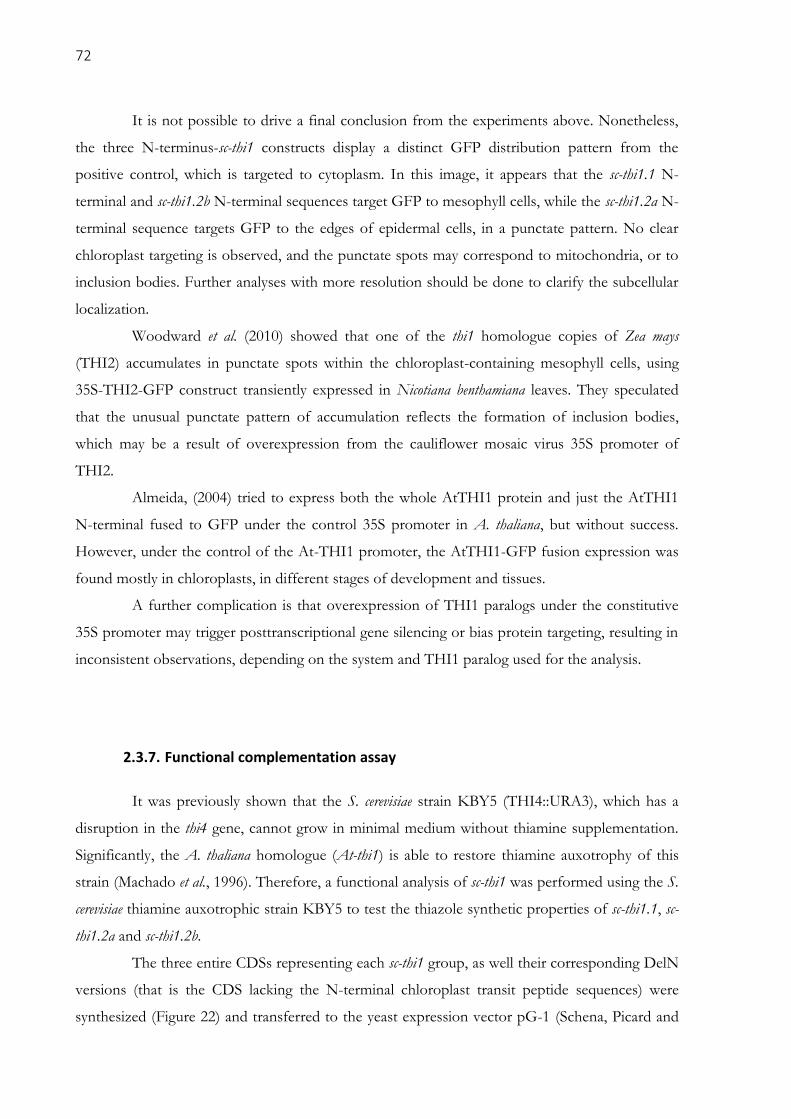
72
It is not possible to drive a final conclusion from the experiments above. Nonetheless,
the three N-terminus-sc-thi1 constructs display a distinct GFP distribution pattern from the
positive control, which is targeted to cytoplasm. In this image, it appears that the sc-thi1.1 N-
terminal and sc-thi1.2b N-terminal sequences target GFP to mesophyll cells, while the sc-thi1.2a N-
terminal sequence targets GFP to the edges of epidermal cells, in a punctate pattern. No clear
chloroplast targeting is observed, and the punctate spots may correspond to mitochondria, or to
inclusion bodies. Further analyses with more resolution should be done to clarify the subcellular
localization.
Woodward et al. (2010) showed that one of the thi1 homologue copies of Zea mays
(THI2) accumulates in punctate spots within the chloroplast-containing mesophyll cells, using
35S-THI2-GFP construct transiently expressed in Nicotiana benthamiana leaves. They speculated
that the unusual punctate pattern of accumulation reflects the formation of inclusion bodies,
which may be a result of overexpression from the cauliflower mosaic virus 35S promoter of
THI2.
Almeida, (2004) tried to express both the whole AtTHI1 protein and just the AtTHI1
N-terminal fused to GFP under the control 35S promoter in A. thaliana, but without success.
However, under the control of the At-THI1 promoter, the AtTHI1-GFP fusion expression was
found mostly in chloroplasts, in different stages of development and tissues.
A further complication is that overexpression of THI1 paralogs under the constitutive
35S promoter may trigger posttranscriptional gene silencing or bias protein targeting, resulting in
inconsistent observations, depending on the system and THI1 paralog used for the analysis.
2.3.7. Functional complementation assay
It was previously shown that the S. cerevisiae strain KBY5 (THI4::URA3), which has a
disruption in the thi4 gene, cannot grow in minimal medium without thiamine supplementation.
Significantly, the A. thaliana homologue (At-thi1) is able to restore thiamine auxotrophy of this
strain (Machado et al., 1996). Therefore, a functional analysis of sc-thi1 was performed using the S.
cerevisiae thiamine auxotrophic strain KBY5 to test the thiazole synthetic properties of sc-thi1.1, sc-
thi1.2a and sc-thi1.2b.
The three entire CDSs representing each sc-thi1 group, as well their corresponding DelN
versions (that is the CDS lacking the N-terminal chloroplast transit peptide sequences) were
synthesized (Figure 22) and transferred to the yeast expression vector pG-1 (Schena, Picard and
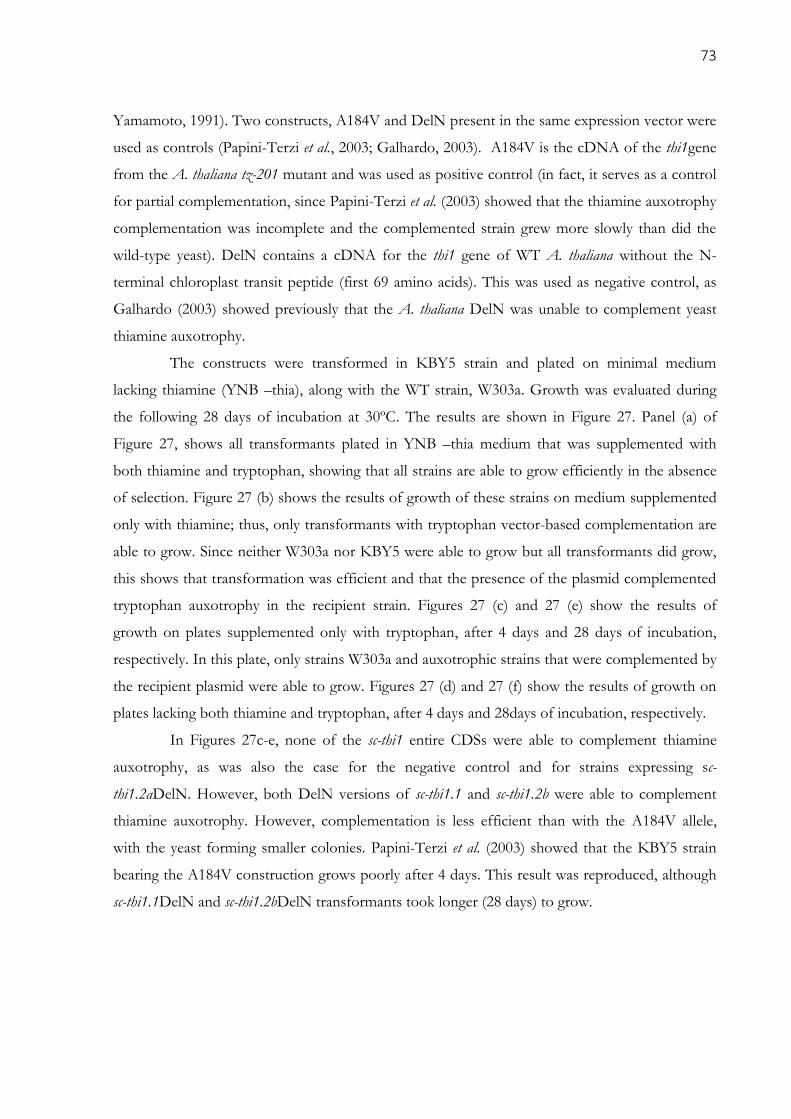
73
Yamamoto, 1991). Two constructs, A184V and DelN present in the same expression vector were
used as controls (Papini-Terzi et al., 2003; Galhardo, 2003). A184V is the cDNA of the thi1gene
from the A. thaliana tz-201 mutant and was used as positive control (in fact, it serves as a control
for partial complementation, since Papini-Terzi et al. (2003) showed that the thiamine auxotrophy
complementation was incomplete and the complemented strain grew more slowly than did the
wild-type yeast). DelN contains a cDNA for the thi1 gene of WT A. thaliana without the N-
terminal chloroplast transit peptide (first 69 amino acids). This was used as negative control, as
Galhardo (2003) showed previously that the A. thaliana DelN was unable to complement yeast
thiamine auxotrophy.
The constructs were transformed in KBY5 strain and plated on minimal medium
lacking thiamine (YNB –thia), along with the WT strain, W303a. Growth was evaluated during
the following 28 days of incubation at 30ºC. The results are shown in Figure 27. Panel (a) of
Figure 27, shows all transformants plated in YNB –thia medium that was supplemented with
both thiamine and tryptophan, showing that all strains are able to grow efficiently in the absence
of selection. Figure 27 (b) shows the results of growth of these strains on medium supplemented
only with thiamine; thus, only transformants with tryptophan vector-based complementation are
able to grow. Since neither W303a nor KBY5 were able to grow but all transformants did grow,
this shows that transformation was efficient and that the presence of the plasmid complemented
tryptophan auxotrophy in the recipient strain. Figures 27 (c) and 27 (e) show the results of
growth on plates supplemented only with tryptophan, after 4 days and 28 days of incubation,
respectively. In this plate, only strains W303a and auxotrophic strains that were complemented by
the recipient plasmid were able to grow. Figures 27 (d) and 27 (f) show the results of growth on
plates lacking both thiamine and tryptophan, after 4 days and 28days of incubation, respectively.
In Figures 27c-e, none of the sc-thi1 entire CDSs were able to complement thiamine
auxotrophy, as was also the case for the negative control and for strains expressing sc-
thi1.2aDelN. However, both DelN versions of sc-thi1.1 and sc-thi1.2b were able to complement
thiamine auxotrophy. However, complementation is less efficient than with the A184V allele,
with the yeast forming smaller colonies. Papini-Terzi et al. (2003) showed that the KBY5 strain
bearing the A184V construction grows poorly after 4 days. This result was reproduced, although
sc-thi1.1DelN and sc-thi1.2bDelN transformants took longer (28 days) to grow.
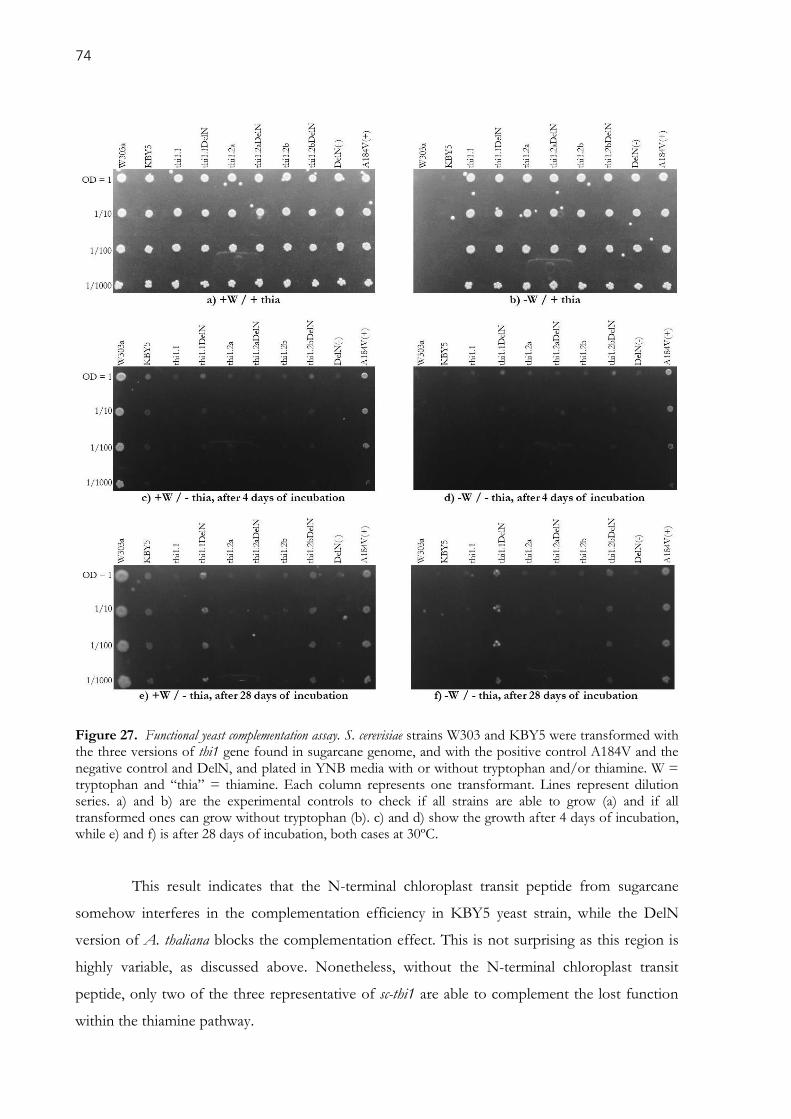
74
Figure 27. Functional yeast complementation assay. S. cerevisiae strains W303 and KBY5 were transformed with the three versions of thi1 gene found in sugarcane genome, and with the positive control A184V and the negative control and DelN, and plated in YNB media with or without tryptophan and/or thiamine. W = tryptophan and “thia” = thiamine. Each column represents one transformant. Lines represent dilution series. a) and b) are the experimental controls to check if all strains are able to grow (a) and if all transformed ones can grow without tryptophan (b). c) and d) show the growth after 4 days of incubation, while e) and f) is after 28 days of incubation, both cases at 30ºC.
This result indicates that the N-terminal chloroplast transit peptide from sugarcane
somehow interferes in the complementation efficiency in KBY5 yeast strain, while the DelN
version of A. thaliana blocks the complementation effect. This is not surprising as this region is
highly variable, as discussed above. Nonetheless, without the N-terminal chloroplast transit
peptide, only two of the three representative of sc-thi1 are able to complement the lost function
within the thiamine pathway.
75
2.4. Discussion
All plants sequenced to date present at least one thi1 homologue gene. The phylogenetic
tree inferred using plants thi1-like genes is in accordance with the species taxonomy (Eudicots,
Monocots, Bryophytes and Chlorophytes), indicating that this gene evolved along with the rest of
the plants’ genomes. An alignment of these thi1-like sequences showed that most of the
nucleotide changes have resulted in synonymous substitution, except within the N-terminal
region, which is highly variable. The maintenance of this gene throughout the evolution of the
plants and the amino acid sequence of the catalytic sites can be explained by the proposed thi1
dual function (Machado et al., 1996). Thi1 has a key function in thiamine biosynthesis as an
important cofactor for many metabolic pathways, such as the carbohydrate pathway (Belanger et
al., 1995). It also has a less well understood function in organellar DNA damage tolerance and in
other stress related pathways (see section 1.2.1 for a review of this subject).
The variability found in the N-terminal region could be explained by its targeting
function, which depends on the kinds of amino acids present (hydrophobic and positively
charged) (van Heijne and Gavel, 1988; Käll, Krogh and Sonnhammer, 2004) rather than on
specific amino acid sequences. This would make it a region able to accommodate non-
synonymous substitutions without loss of function. Although thi1 homologues are present in all
plants, the synteny analysis showed that thi1 genes from different plants are found in different
genomic environments.
Our molecular characterization of the sugarcane thi1 gene revealed that gene duplication
has not only occurred in C4 photosynthetic plants but that the genes are located on different
genomic regions. Five non syntenic genomic environments were identified. There have been
duplications and translocations of the gene, as well as duplications of entire regions containing
the gene. Based on genomic diversity analysis, we conclude that the two copies of thi1 present in
sugarcane arose in the ancestral Panicoideae subfamily and remains in many modern cultivars of
sugarcane.
Genomic identification of sugarcane thi1 homologues revealed nine alleles of sc-thi1.1
and ten alleles of sc-thi1.2. Phylogenetic and network analyses of its sequences showed that,
despite the similarity of all sc-thi1.2 genes, a diversification of sc-thi1.2 is nonetheless occurring.
Two subgroups were identified (comprising four alleles of the sc-thi1.2a group and six alleles of
the sc-thi1.2b group).
Analysis of tree sugarcane RNA-seq databases revealed that all sc-thi1 versions are more
highly expressed in older plants (six months) when compared to young buds. Also, they are up to
7-fold more highly expressed in kernel top than in roots. This correlates with the At-thi1

76
expression pattern, which showed higher expression in leaves and very low expression in roots
(Papini-Terzi et al., 2003). None of the sc-thi1 versions are expressed at root tips, in accordance
with the fact that At-thi1 expression is restricted to the vascular system in root (Ribeiro et al.,
2005).
Low levels of thi1 in roots could be due the state of plastid maturity and, consequently,
their readiness for thiamine synthesis, which would suggest a dependence on inter-cellular
transport of thiamine and/or the thiamine precursor thiazole, and explaining why isolated roots
from most plant species cannot grow in vitro without thiamine supplementation (Bonner, 1940).
Sc-thi1 is the most expressed gene, being 2-fold more highly expressed than the two sc-
thi1.2 gene, in all studied cases. Sc-thi1.2a is slightly more expressed than sc-thi1.2b. The differential
expression in times and/or tissues of sc-thi1 isoforms is in accordance with observations in Zea
mays, which also has two thi1 copies (zm-thi1 and zm-thi2). These genes also have a distinct pattern
of accumulation within the plant, which reflects their sub-functionalization, with zm-THI1 being
predominantly in mature green leaves, and zm-THI2 expressed preferentially in young, rapidly
dividing tissues (Woodward et al., 2010).
Although rice thi1 homologues have been related to biotic stress (specifically, resistance
to X. oryzae pv. oryzae (Wang et al., 2006)), the comparison between the expression pattern of sc-
thi1 version in control plants and plants infected with smut disease (Sporisorium scitamineum)
indicates that sc-thi1 is not involved in the response to this biotic stress.
Differences in expression pattern are also observed in the subcellular localization of sc-
thi1 copies. Sc-thi1.1 and sc-thi1.2b have a similar pattern, being targeted to the mesophyll cells,
while, sc-thi1.2a is found in the edges of epidermal cells, in a punctuated pattern.
Although both zm-thi1 and zm-thi12 can restore thiamine prototrophy in yeast (Belanger
et al., 1995), only two of the three sc-thi1 isoforms can complement the KBY5 strain thi4
mutation, albeit less efficiently. However, sc-thi1.1 and sc-thi1.2b are able to do so when the
chloroplast transit peptide is removed (DelN), indicating that this region may interfere somehow
with mitochondrial translocation in yeast.
The differences observed in cellular localization, expression, and capacity for functional
complementation, supports the presence of three thi1 homologues in sugarcane and opens
avenues for further functional studies of these genes.
77
2.5. Conclusions
The thi1 gene is present in all sequenced plants, with different copy numbers and in
different genomic contexts. This thesis expanded this observation.
While the N-terminus of THI1 protein is highly variable, the rest of the protein is well
conserved.
Sugarcane has three copies of thi1: sc-thi1.1, which is the most different among the three,
and sc-thi1.2a and sc-thi1.2b, which are similar and yet seem to be diverging from each
other.
Sc-thi1.1 is the most highly expressed isoform in different tissues and developing stages.
Sc-thi1 is not involved in smut disease response.
Sc-thi1.1 and sc-thi1.2b are capable to partially complement thiamine auxotrophy in a
mutant yeast strain.
78
REFERENCES
Afgan, E. et al. (2016) ‘The Galaxy platform for accessible, reproducible and collaborative biomedical
analyses: 2016 update’, Nucleic acids research, 44(W1), pp. W3–W10.
Almeida, J. D. de (2004) Origem, evolução e direcionamento da proteína THI1 em plantas. University of São
Paulo.
ANFAEVA. Estatísticas. Available at: http://www.anfavea.com.br/estatisticas.html (Accessed: 26
January 2018).
Bandelt, H. J., Forster, P. and Rohl, A. (1999) ‘Median-joining networks for inferring intraspecific
phylogenies’, Molecular Biology and Evolution, 16(1), pp. 37–48.
Belanger, F. C. et al. (1995) ‘Evidence for the thiamine biosynthetic pathway in higher-plant plastids
and its developmental regulation’, Plant Molecular Biology, 29(4), pp. 809–821.
Bodén, M. and Hawkins, J. (2005) ‘Prediction of subcellular localization using sequence-biased
recurrent networks’, Bioinformatics, 21(10), pp. 2279–2286.
Bonner, J. (1940) ‘On the Growth Factor Requirements of Isolated Roots’, American Journal of Botany,
27(8), p. 692.
Chabregas, S. M. et al. (2001) ‘Dual targeting properties of the N-terminal signal sequence of
Arabidopsis thaliana THI1 protein to mitochondria and chloroplasts’, Plant molecular biology, 46(6),
pp. 639–50.
Chabregas, S. M. et al. (2003) ‘Differential usage of two in-frame translational start codons regulates
subcellular localization of Arabidopsis thaliana THI1’, Journal of Cell Science, 116(2), pp. 285–291.
Chatterjee, A. et al. (2011) ‘Saccharomyces cerevisiae THI4p is a suicide thiamine thiazole synthase’,
Nature, 478(7370), pp. 542–546.
Chou, K. C. and Shen, H. Bin (2010) ‘Plant-mPLoc: A top-down strategy to augment the power for
predicting plant protein subcellular localization’, PLoS ONE, 5(6).
D’Hont, A. et al. (1996) ‘Characterization of the double genome structure of sugarcane cultivars
(Saccharum ssp.) by molecular cytogenetics’, Mol. Gen. Genet., 250, p. 405–413.
D’Hont, A. (2005) ‘Unraveling the genome structure of polyploids using FISH and GISH; examples
of sugarcane and banana’, Cytogenetic and Genome Research, 109(1–3), pp. 27–33.
D’Hont, A. and Glaszmann, J. C. (2001) ‘Sugarcane genome analysis with molecular markers: a first
decade of research’, Proc Int Soc Sugar Cane Technol, 24, pp. 556–559.
Emanuelsson, O. et al. (2007) ‘Locating proteins in the cell using TargetP, SignalP and related tools’,
Nature Protocols, 2(4), pp. 953–971.
European Commission (2017) Agriculture and Rural Development | Sugar. Available at:
https://ec.europa.eu/agriculture/sugar_en (Accessed: 26 January 2018).

79
Ewing, B. et al. (1998) ‘Base-calling of automated sequencer traces using phred. I. Accuracy
assessment’, Genome research, 8(3), pp. 175–85.
Ewing, B. and Green, P. (1998) ‘Base-calling of automated sequencer traces using phred. II. Error
probabilities’, Genome research, 8(3), pp. 186–94.
FAO - Food and Agriculture Organization (2009) Sugar Beet White Sugar. FAO Press.
FAOSTAT. Food and Agriculture Organization of the United States. Available at:
http://www.fao.org/faostat/en/#data/QC/visualize (Accessed: 26 January 2018).
Galhardo, R. S. (2003) Análise funcional do gene thi1 de Arabidopsis thaliana. University of São Paulo.
Godoi, P. H. C. et al. (2006) ‘Structure of the Thiazole Biosynthetic Enzyme THI1 from Arabidopsis
thaliana’, Journal of Biological Chemistry, 281(41), pp. 30957–30966.
Goodstein, D. M. et al. (2012) ‘Phytozome: a comparative platform for green plant genomics’, Nucleic
Acids Research, 40(D1), pp. D1178–D1186.
Gordon, D. (2003) ‘Viewing and Editing Assembled Sequences Using Consed’, in Current Protocols in
Bioinformatics. Chapter 11:Unit11.2.
Gordon, D., Abajian, C. and Green, P. (1998) ‘Consed: a graphical tool for sequence finishing’,
Genome research, 8(3), pp. 195–202.
Grivet, L. et al. (2004) ‘A review of recent molecular genetics evidence for sugarcane evolution and
domestication’, Ethnobotany Research & Applications, 2(0), pp. 9–17.
Grivet, L. and Arruda, P. (2002) ‘Sugarcane genomics: Depicting the complex genome of an
important tropical crop’, Current Opinion in Plant Biology, 5(2), pp. 122–127.
van Heijne, G. and Gavel, Y. (1988) ‘Topogenic signals in intregal membrane proteins’, Eur.J.Biochem.,
174, pp. 671–678.
Hwang, S. et al. (2014) ‘Conserved active site cysteine residue of archaeal THI4 homolog is essential
for thiamine biosynthesis in Haloferax volcanii’, BMC Microbiology, 14(1).
Käll, L., Krogh, A. and Sonnhammer, E. L. L. (2004) ‘A combined transmembrane topology and
signal peptide prediction method’, Journal of Molecular Biology, 338(5), pp. 1027–1036.
Karimi, M., Inzé, D. and Depicker, A. (2002) ‘GATEWAY vectors for Agrobacterium-mediated plant
transformation’, Trends in plant science, 7(5), pp. 193–5.
Kellogg, E. A. (2000) ‘The Grasses: A Case Study in Macroevolution’, Annual Review of Ecology and
Systematics, 31(1), pp. 217–238.
Langmead, B. et al. (2009) ‘Ultrafast and memory-efficient alignment of short DNA sequences to the
human genome’, Genome Biology, 10(3), p. R25.
Librado, P. and Rozas, J. (2009) ‘DnaSP v5: a software for comprehensive analysis of DNA
polymorphism data’, Bioinformatics, 25(11), pp. 1451–1452.
Machado, C. R. et al. (1996) ‘Thi1, a thiamine biosynthetic gene in Arabidopsis thaliana, complements
bacterial defects in DNA repair’, Plant molecular biology, 31(3), pp. 585–93.
80
Ming, R. et al. (1998) ‘Detailed alignment of saccharum and sorghum chromosomes: comparative
organization of closely related diploid and polyploid genomes’, Genetics, 150(4), pp. 1663–82.
Mortazavi, A. et al. (2008) ‘Mapping and quantifying mammalian transcriptomes by RNA-Seq’, Nature
Methods, 5(7), pp. 621–628.
Nakai, K. and Kanehisa, M. (1991) ‘Expert system for predicting protein localization sites in gram-
negative bacteria’, Proteins, 11(2), pp. 95–110.
Okonechnikov, K., Golosova, O. and Fursov, M. (2012) ‘Unipro UGENE: a unified bioinformatics
toolkit’, Bioinformatics Applications Note, 28(8), pp. 1166–116710.
Papini-Terzi, F. S. et al. (2003) ‘Point mutation is responsible for Arabidopsis tz-201 mutant phenotype
affecting thiamin biosynthesis’, Plant & cell physiology, 44(8), pp. 856–60.
Pierleoni, A. et al. (2006) ‘BaCelLo: A balanced subcellular localization predictor’, Bioinformatics, 22(14),
pp. 408–416.
Praekelt, U. M., Byrne, K. L. and Meacock, P. A. (1994) ‘Regulation of THI4 (MOL1), a thiamine-
biosynthetic gene of Saccharomyces cerevisiae’, Yeast, 10(4), pp. 481–490.
Ribeiro, D. T. et al. (2005) ‘Functional characterization of the thi1 promoter region from Arabidopsis
thaliana’, Journal of Experimental Botany, 56(417), pp. 1797–1804.
Schaker, P. D. C. et al. (2016) ‘RNAseq transcriptional profiling following whip development in
sugarcane smut disease’, PLoS ONE, 11(9).
Schena, M., Picard, D. and Yamamoto, K. R. (1991) ‘Vectors for constitutive and inducible gene
expression in yeast’, in Methods in enzymology, pp. 389–398.
Schiestl, R. H. R. and Gietz, R. D. R. (1989) ‘High efficiency transformation of intact yeast cells using
single stranded nucleic acids as a carrier’, Current Genetics, 16(5–6), pp. 339–346.
de Setta, N. et al. (2014) ‘Building the sugarcane genome for biotechnology and identifying
evolutionary trends’, BMC Genomics, 15(1), p. 540.
Sievers, F. et al. (2011) ‘Fast, scalable generation of high-quality protein multiple sequence alignments
using Clustal Omega’, Molecular systems biology, 7, p. 539.
Sparkes, I. A. et al. (2006) ‘Rapid, transient expression of fluorescent fusion proteins in tobacco plants
and generation of stably transformed plants’, Nature Protocols, 1(4), pp. 2019–2025.
SugarCane.org. Map of sugarcane growing countries. Available at:
http://sugarcane.org/internal/images/map-of-sugarcane-growing-countries/view (Accessed: 27
January 2018).
Tamura, K. et al. (2011) ‘MEGA5: Molecular Evolutionary Genetics Analysis Using Maximum
Likelihood, Evolutionary Distance, and Maximum Parsimony Methods’, Molecular Biology and
Evolution, 28(10), pp. 2731–2739.
Tamura, K. et al. (2013) ‘MEGA6: Molecular Evolutionary Genetics Analysis version 6.0’, Molecular
biology and evolution. Oxford University Press, 30(12), pp. 2725–9.

81
Thompson, J. D., Higgins, D. G. and Gibson, T. J. (1994) ‘CLUSTAL W: improving the sensitivity of
progressive multiple sequence alignment through sequence weighting, position-specific gap
penalties and weight matrix choice’, Nucleic acids research, 22(22), pp. 4673–80.
Tomkins, J. P. et al. (1999) ‘A bacterial artificial chromosome library for sugarcane’, Theor Appl Genet.,
Aug;99(3-4):419-24.
Vettore, A. L. et al. (2001) ‘The libraries that made SUCEST’, Genetics and Molecular Biology, 24(1–4), pp.
1–7.
Vettore, A. L. et al. (2003) ‘Analysis and Functional Annotation of an Expressed Sequence Tag
Collection for Tropical Crop Sugarcane’, Genome Research, 13(12), pp. 2725–2735.
Vilela, M. de M. et al. (2017) ‘Analysis of three sugarcane homo/homeologous regions suggests
independent polyploidization events of Saccharum officinarum and Saccharum spontaneum’, Genome
Biology and Evolution, 9(2), p. 293.
Wang, G. et al. (2006) ‘Dual Function of Rice OsDR8 Gene in Disease Resistance and Thiamine
Accumulation’, Plant Molecular Biology, 60(3), pp. 437–449.
Woodward, J. B. et al. (2010) ‘A Maize Thiamine Auxotroph Is Defective in Shoot Meristem
Maintenance’, The Plant Cell, 22(10), pp. 3305–3317.

82
83
3. CONSTRUCTION OF PLANT MODEL FOR FUNCTIONAL STUDY OF THI1
HOMOLOGUES
ABSTRACT
The use of complementation assays to identify and study thi1 gene homologues from other species is not possible in A. thaliana as the only At-thi1 mutant able to survive (tz-201 mutant) is not transformable. Therefore, plant models with modified thi1 genes are needed. Physcomitrella patens was chosen as it shares fundamental genetic and physiological processes with vascular plants, and can be used in studies of plant evolution, development and physiology. P. patens is a small organism with a short life cycle. Moreover, P. patens’ dominant phase is the haploid gametophyte, which facilitates genetic analyses. Interestingly, even though it is an ancient plant, it has six thi1 homologues, in contrast to C4 grasses, which contain only two copies. The copies were named based on the chromosome number on which they are located and on their chromosomal orientation (PpThi1.20F, PpThi1.20R, PpThi1.23F, PpThi1.23R1, PpThi1.23R2 and PpThi1.24). Two of these (PpThi1.23R1, PpThi1.23R2) are identical and are treated here as one class (PpThi1.23R). In order to produce thi1 gene modified plant lines, Homologous Recombination technology was used. Five plasmids were made in order to knockout each of the five PpThi1 gens individually, resulting in the replacement of the native gene with a resistance gene cassette that also allows for the selection of the transformants. Gene knockout plasmids were transformed into protoplasts, which were analyzed for survival and regeneration capabilities. Single PpThi1 mutant lines were obtained for all PpThi1 copies. Many regenerants were obtained for all PpThi1 copies knockouts, except for PpThi1.20F, which appeared to affect the ability of protoplasts to survive and regenerate. Morphological analysis, growth area measurement, fresh and dry weight analyses and soluble carbohydrate content quantification showed that both protonemal and gametophyte growth of the knockouts plants were normal, although subtle effects morphological and physiological were observed. Because the experimental design allows for recycling of the resistance gene cassette, it is possible to sequentially construct strains in which multiple, and indeed all, of the thi1 genes are mutated and/or deleted. Such multiple mutants will be useful for thi1 functional complementation experiments and for discerning the specific function of individual thi1 gene family members.
Keywords: Physcomitrella patens; Plant model; Thi1 gene; Mutant lines; Homologous Recombination; Soluble sugar; Protonemata regeneration

84
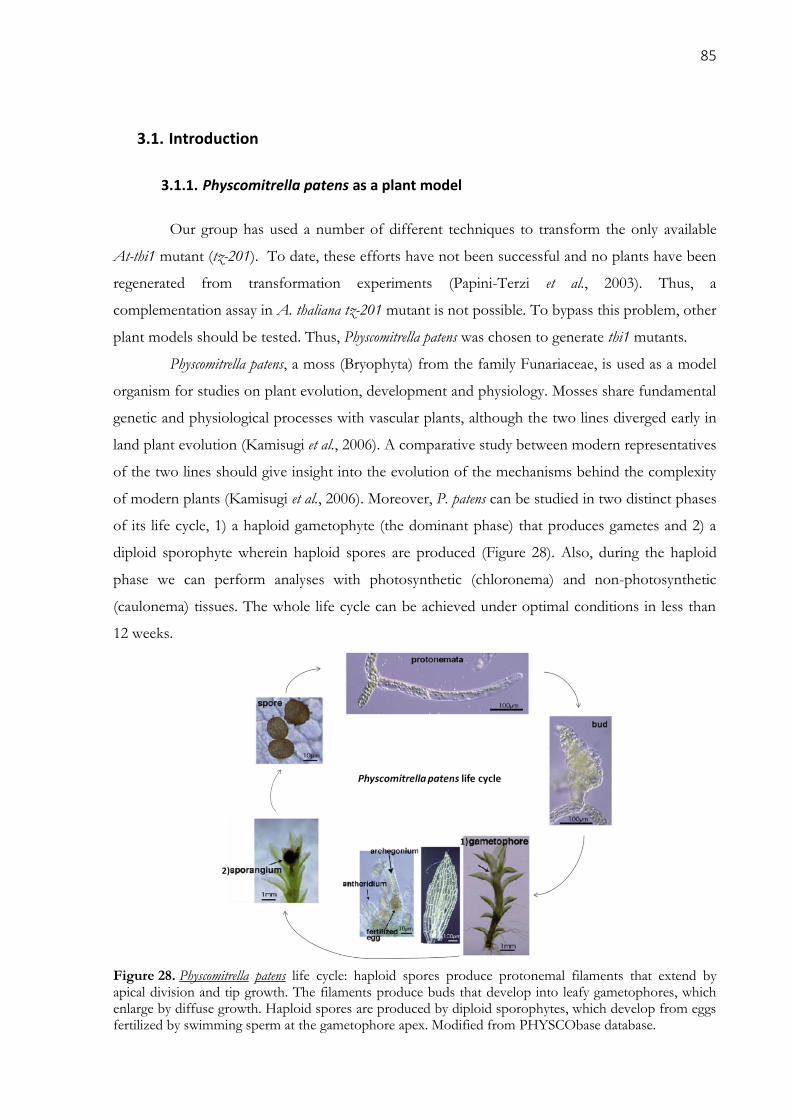
85
3.1. Introduction
3.1.1. Physcomitrella patens as a plant model
Our group has used a number of different techniques to transform the only available
At-thi1 mutant (tz-201). To date, these efforts have not been successful and no plants have been
regenerated from transformation experiments (Papini-Terzi et al., 2003). Thus, a
complementation assay in A. thaliana tz-201 mutant is not possible. To bypass this problem, other
plant models should be tested. Thus, Physcomitrella patens was chosen to generate thi1 mutants.
Physcomitrella patens, a moss (Bryophyta) from the family Funariaceae, is used as a model
organism for studies on plant evolution, development and physiology. Mosses share fundamental
genetic and physiological processes with vascular plants, although the two lines diverged early in
land plant evolution (Kamisugi et al., 2006). A comparative study between modern representatives
of the two lines should give insight into the evolution of the mechanisms behind the complexity
of modern plants (Kamisugi et al., 2006). Moreover, P. patens can be studied in two distinct phases
of its life cycle, 1) a haploid gametophyte (the dominant phase) that produces gametes and 2) a
diploid sporophyte wherein haploid spores are produced (Figure 28). Also, during the haploid
phase we can perform analyses with photosynthetic (chloronema) and non-photosynthetic
(caulonema) tissues. The whole life cycle can be achieved under optimal conditions in less than
12 weeks.
Figure 28. Physcomitrella patens life cycle: haploid spores produce protonemal filaments that extend by apical division and tip growth. The filaments produce buds that develop into leafy gametophores, which enlarge by diffuse growth. Haploid spores are produced by diploid sporophytes, which develop from eggs fertilized by swimming sperm at the gametophore apex. Modified from PHYSCObase database.
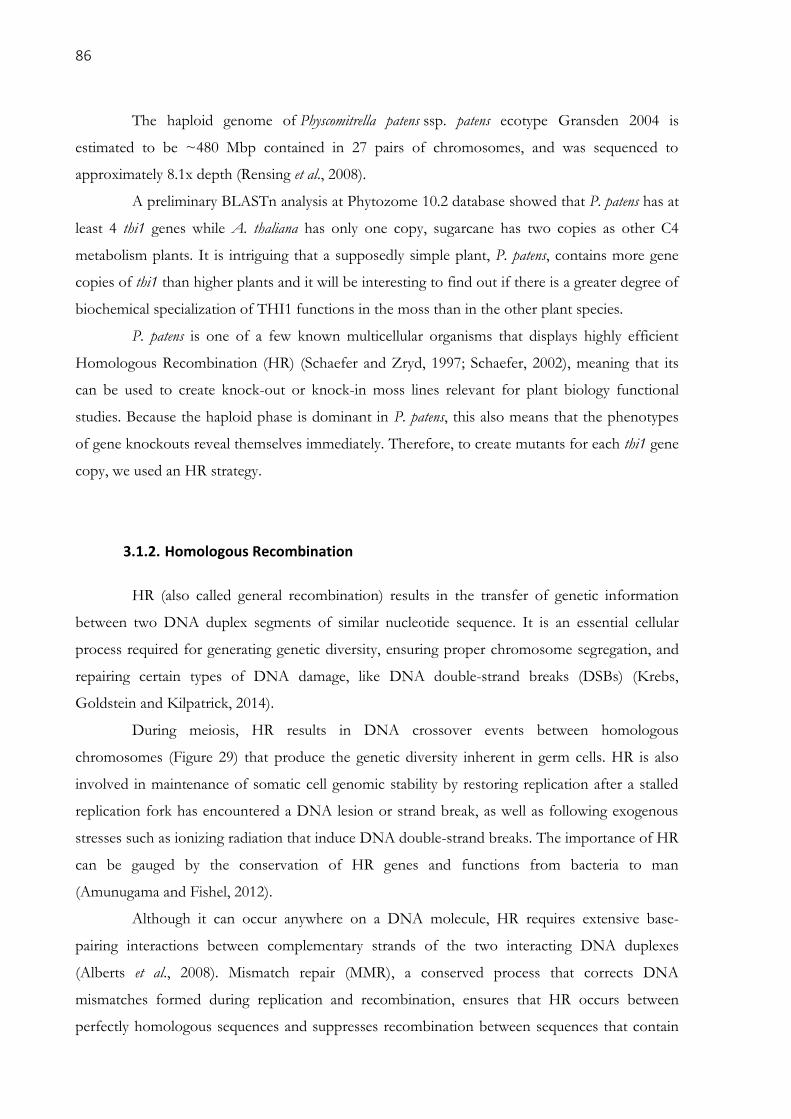
86
The haploid genome of Physcomitrella patens ssp. patens ecotype Gransden 2004 is
estimated to be ~480 Mbp contained in 27 pairs of chromosomes, and was sequenced to
approximately 8.1x depth (Rensing et al., 2008).
A preliminary BLASTn analysis at Phytozome 10.2 database showed that P. patens has at
least 4 thi1 genes while A. thaliana has only one copy, sugarcane has two copies as other C4
metabolism plants. It is intriguing that a supposedly simple plant, P. patens, contains more gene
copies of thi1 than higher plants and it will be interesting to find out if there is a greater degree of
biochemical specialization of THI1 functions in the moss than in the other plant species.
P. patens is one of a few known multicellular organisms that displays highly efficient
Homologous Recombination (HR) (Schaefer and Zryd, 1997; Schaefer, 2002), meaning that its
can be used to create knock-out or knock-in moss lines relevant for plant biology functional
studies. Because the haploid phase is dominant in P. patens, this also means that the phenotypes
of gene knockouts reveal themselves immediately. Therefore, to create mutants for each thi1 gene
copy, we used an HR strategy.
3.1.2. Homologous Recombination
HR (also called general recombination) results in the transfer of genetic information
between two DNA duplex segments of similar nucleotide sequence. It is an essential cellular
process required for generating genetic diversity, ensuring proper chromosome segregation, and
repairing certain types of DNA damage, like DNA double-strand breaks (DSBs) (Krebs,
Goldstein and Kilpatrick, 2014).
During meiosis, HR results in DNA crossover events between homologous
chromosomes (Figure 29) that produce the genetic diversity inherent in germ cells. HR is also
involved in maintenance of somatic cell genomic stability by restoring replication after a stalled
replication fork has encountered a DNA lesion or strand break, as well as following exogenous
stresses such as ionizing radiation that induce DNA double-strand breaks. The importance of HR
can be gauged by the conservation of HR genes and functions from bacteria to man
(Amunugama and Fishel, 2012).
Although it can occur anywhere on a DNA molecule, HR requires extensive base-
pairing interactions between complementary strands of the two interacting DNA duplexes
(Alberts et al., 2008). Mismatch repair (MMR), a conserved process that corrects DNA
mismatches formed during replication and recombination, ensures that HR occurs between
perfectly homologous sequences and suppresses recombination between sequences that contain
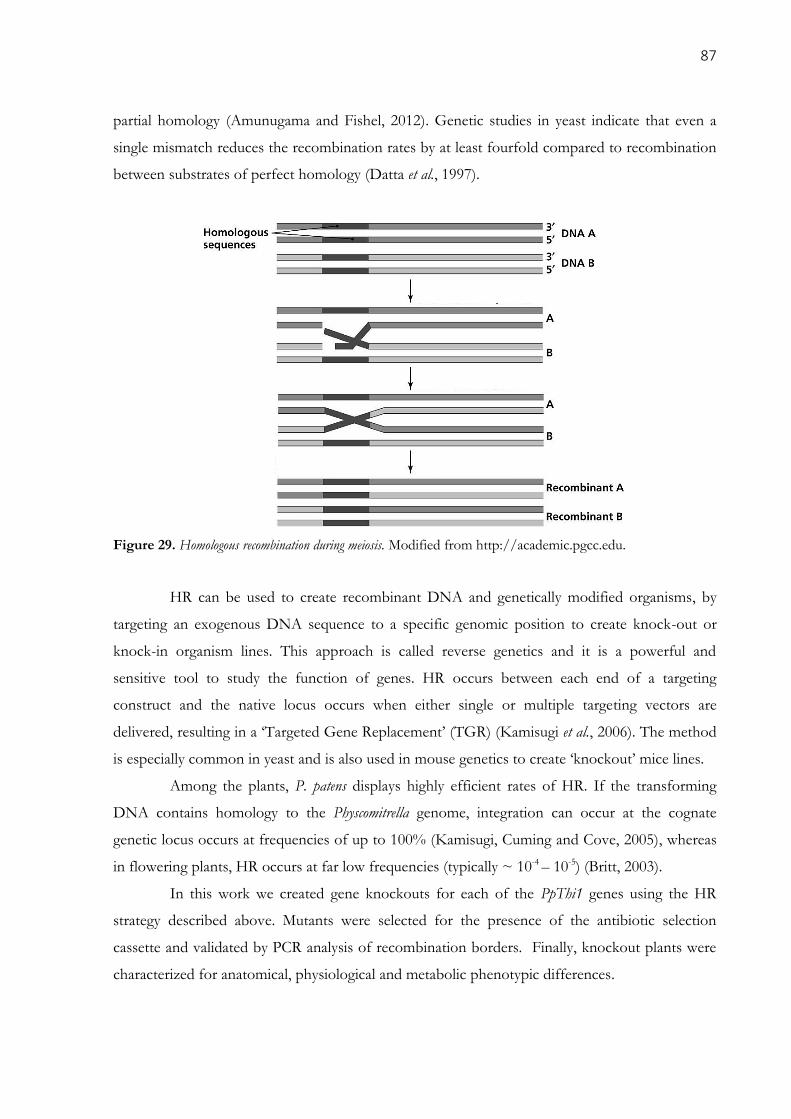
87
partial homology (Amunugama and Fishel, 2012). Genetic studies in yeast indicate that even a
single mismatch reduces the recombination rates by at least fourfold compared to recombination
between substrates of perfect homology (Datta et al., 1997).
Figure 29. Homologous recombination during meiosis. Modified from http://academic.pgcc.edu.
HR can be used to create recombinant DNA and genetically modified organisms, by
targeting an exogenous DNA sequence to a specific genomic position to create knock-out or
knock-in organism lines. This approach is called reverse genetics and it is a powerful and
sensitive tool to study the function of genes. HR occurs between each end of a targeting
construct and the native locus occurs when either single or multiple targeting vectors are
delivered, resulting in a ‘Targeted Gene Replacement’ (TGR) (Kamisugi et al., 2006). The method
is especially common in yeast and is also used in mouse genetics to create ‘knockout’ mice lines.
Among the plants, P. patens displays highly efficient rates of HR. If the transforming
DNA contains homology to the Physcomitrella genome, integration can occur at the cognate
genetic locus occurs at frequencies of up to 100% (Kamisugi, Cuming and Cove, 2005), whereas
in flowering plants, HR occurs at far low frequencies (typically ~ 10-4 – 10-5) (Britt, 2003).
In this work we created gene knockouts for each of the PpThi1 genes using the HR
strategy described above. Mutants were selected for the presence of the antibiotic selection
cassette and validated by PCR analysis of recombination borders. Finally, knockout plants were
characterized for anatomical, physiological and metabolic phenotypic differences.
88
3.2. Material and Methods
Construction of the plasmids used for HR of PpThi1 genes, along with a knowledge of
the methods used for cultivation, protoplasts production, transformation and regeneration of P.
patens, was carried out at the School of Environmental and Biological Science of Rutgers
University, The State University of New Jersey (United States of America), under the supervision
of Dr. Michael Lawton and collaboration of Dr. Rong Di, during the internship abroad
established in the Double Degree PhD program, with FAPESP BEPE fellowship from
September 2015 to September 2016. HR lines and subsequent analyses were performed at GaTE
Lab (IB-USP).
3.2.1. Plant material and growth conditions
All experiments were performed using the Physcomitrella patens ssp. patens ecotype
Gransden 2004. Gametophores were cultured aseptically on BCDAT medium (0.1 mM MgSO4,
1.84 mM KH2PO4, 1 M KNO3, 4.5 mM FeSO4, 5 mM Ammonium tartrate, 50 mM CaCl2, 8%
agar) (PHYSCO manual), in growth chamber at 25º ± 1ºC, with 12/12h dark/light periods.
Protonemata-rich cultures were obtained and kept in BCDATG medium (BCDAT medium
supplemented with 0.5% [w/v] glucose) (PHYSCO manual).
3.2.2. Gene copies identification
The genome of Physcomitrella patens is already sequenced and available (COSMOSS;
PHYSCObase database). A BLASTn analysis against the Phytozome v.12 database shows the
presence of six gene copies homologous to At-thi1 at the P. patens v3.3 genome. They were
named PpThi1.20F, PpThi1.20R, PpThi1.23F, PpThi1.23R1, PpThi1.23R2 and PpThi1.24 based on
the chromosome number on which they are located (chromosomes 20, 23 or 24) and their
respective chromosomal orientation (F or R) on it. As PpThi1.23R1 and PpThi1.23R2 are 100%
identical, they were treated as one unit, since both gene copies can be deleted simultaneously by a
single HR event.
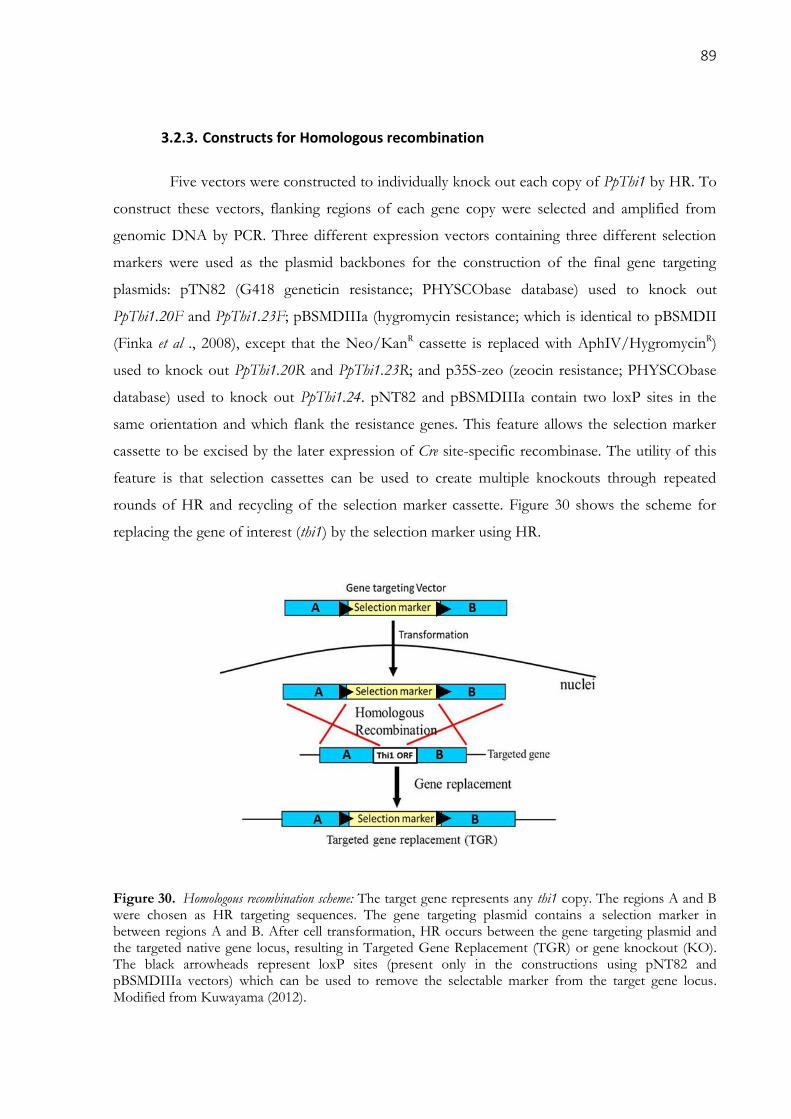
89
3.2.3. Constructs for Homologous recombination
Five vectors were constructed to individually knock out each copy of PpThi1 by HR. To
construct these vectors, flanking regions of each gene copy were selected and amplified from
genomic DNA by PCR. Three different expression vectors containing three different selection
markers were used as the plasmid backbones for the construction of the final gene targeting
plasmids: pTN82 (G418 geneticin resistance; PHYSCObase database) used to knock out
PpThi1.20F and PpThi1.23F; pBSMDIIIa (hygromycin resistance; which is identical to pBSMDII
(Finka et al ., 2008), except that the Neo/KanR cassette is replaced with AphIV/HygromycinR)
used to knock out PpThi1.20R and PpThi1.23R; and p35S-zeo (zeocin resistance; PHYSCObase
database) used to knock out PpThi1.24. pNT82 and pBSMDIIIa contain two loxP sites in the
same orientation and which flank the resistance genes. This feature allows the selection marker
cassette to be excised by the later expression of Cre site-specific recombinase. The utility of this
feature is that selection cassettes can be used to create multiple knockouts through repeated
rounds of HR and recycling of the selection marker cassette. Figure 30 shows the scheme for
replacing the gene of interest (thi1) by the selection marker using HR.
Figure 30. Homologous recombination scheme: The target gene represents any thi1 copy. The regions A and B were chosen as HR targeting sequences. The gene targeting plasmid contains a selection marker in between regions A and B. After cell transformation, HR occurs between the gene targeting plasmid and the targeted native gene locus, resulting in Targeted Gene Replacement (TGR) or gene knockout (KO). The black arrowheads represent loxP sites (present only in the constructions using pNT82 and pBSMDIIIa vectors) which can be used to remove the selectable marker from the target gene locus. Modified from Kuwayama (2012).
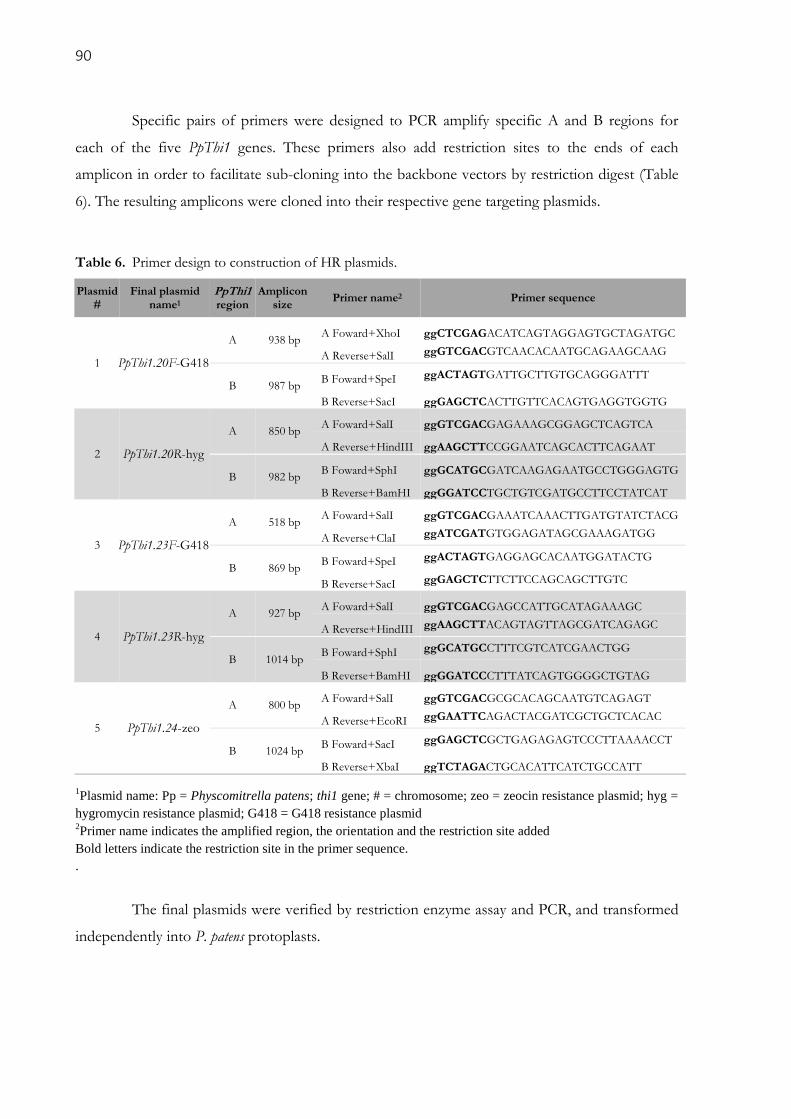
90
Specific pairs of primers were designed to PCR amplify specific A and B regions for
each of the five PpThi1 genes. These primers also add restriction sites to the ends of each
amplicon in order to facilitate sub-cloning into the backbone vectors by restriction digest (Table
6). The resulting amplicons were cloned into their respective gene targeting plasmids.
Table 6. Primer design to construction of HR plasmids.
Plasmid #
Final plasmid name1
PpThi1 region
Amplicon size
Primer name2 Primer sequence
1 PpThi1.20F-G418
A 938 bp A Foward+XhoI ggCTCGAGACATCAGTAGGAGTGCTAGATGC
A Reverse+SalI ggGTCGACGTCAACACAATGCAGAAGCAAG
B 987 bp B Foward+SpeI ggACTAGTGATTGCTTGTGCAGGGATTT
B Reverse+SacI ggGAGCTCACTTGTTCACAGTGAGGTGGTG
2 PpThi1.20R-hyg
A 850 bp A Foward+SalI ggGTCGACGAGAAAGCGGAGCTCAGTCA
A Reverse+HindIII ggAAGCTTCCGGAATCAGCACTTCAGAAT
B 982 bp B Foward+SphI ggGCATGCGATCAAGAGAATGCCTGGGAGTG
B Reverse+BamHI ggGGATCCTGCTGTCGATGCCTTCCTATCAT
3 PpThi1.23F-G418
A 518 bp A Foward+SalI ggGTCGACGAAATCAAACTTGATGTATCTACG
A Reverse+ClaI ggATCGATGTGGAGATAGCGAAAGATGG
B 869 bp B Foward+SpeI ggACTAGTGAGGAGCACAATGGATACTG
B Reverse+SacI ggGAGCTCTTCTTCCAGCAGCTTGTC
4 PpThi1.23R-hyg
A 927 bp A Foward+SalI ggGTCGACGAGCCATTGCATAGAAAGC
A Reverse+HindIII ggAAGCTTACAGTAGTTAGCGATCAGAGC
B 1014 bp B Foward+SphI ggGCATGCCTTTCGTCATCGAACTGG
B Reverse+BamHI ggGGATCCCTTTATCAGTGGGGCTGTAG
5 PpThi1.24-zeo
A 800 bp A Foward+SalI ggGTCGACGCGCACAGCAATGTCAGAGT
A Reverse+EcoRI ggGAATTCAGACTACGATCGCTGCTCACAC
B 1024 bp B Foward+SacI ggGAGCTCGCTGAGAGAGTCCCTTAAAACCT
B Reverse+XbaI ggTCTAGACTGCACATTCATCTGCCATT
1Plasmid name: Pp = Physcomitrella patens; thi1 gene; # = chromosome; zeo = zeocin resistance plasmid; hyg =
hygromycin resistance plasmid; G418 = G418 resistance plasmid 2Primer name indicates the amplified region, the orientation and the restriction site added
Bold letters indicate the restriction site in the primer sequence.
.
The final plasmids were verified by restriction enzyme assay and PCR, and transformed
independently into P. patens protoplasts.
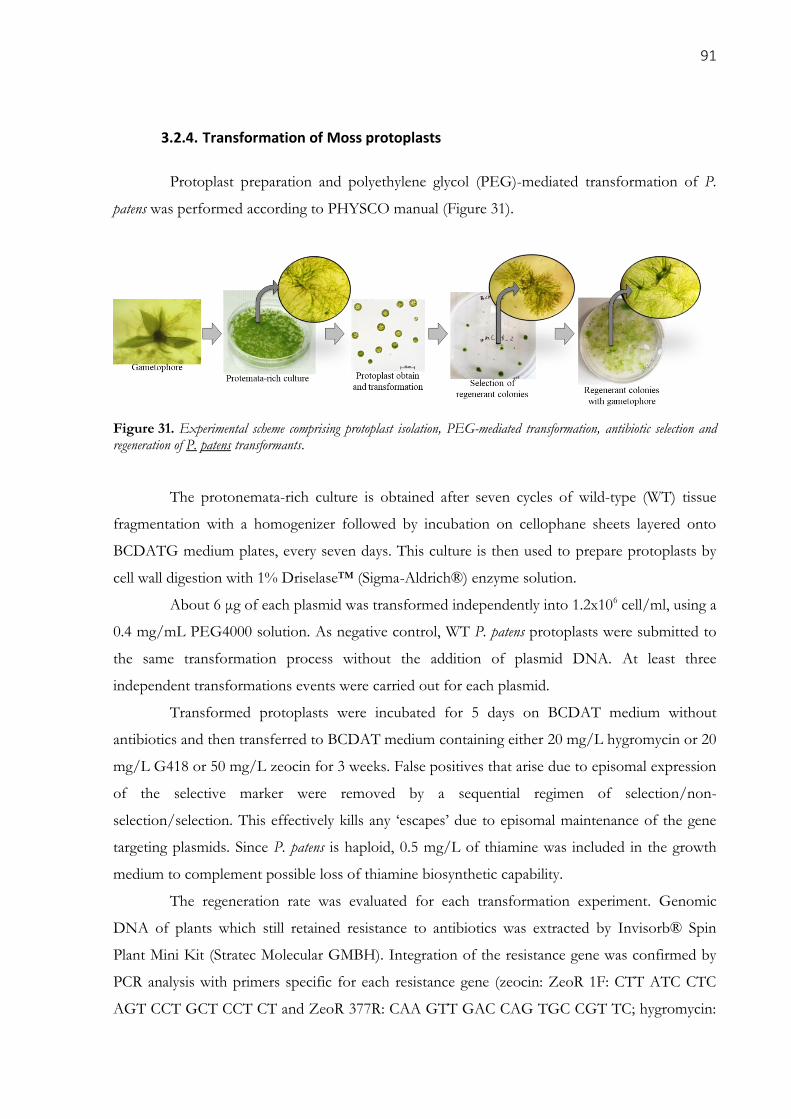
91
3.2.4. Transformation of Moss protoplasts
Protoplast preparation and polyethylene glycol (PEG)-mediated transformation of P.
patens was performed according to PHYSCO manual (Figure 31).
Figure 31. Experimental scheme comprising protoplast isolation, PEG-mediated transformation, antibiotic selection and regeneration of P. patens transformants.
The protonemata-rich culture is obtained after seven cycles of wild-type (WT) tissue
fragmentation with a homogenizer followed by incubation on cellophane sheets layered onto
BCDATG medium plates, every seven days. This culture is then used to prepare protoplasts by
cell wall digestion with 1% Driselase™ (Sigma-Aldrich®) enzyme solution.
About 6 μg of each plasmid was transformed independently into 1.2x10⁶ cell/ml, using a
0.4 mg/mL PEG4000 solution. As negative control, WT P. patens protoplasts were submitted to
the same transformation process without the addition of plasmid DNA. At least three
independent transformations events were carried out for each plasmid.
Transformed protoplasts were incubated for 5 days on BCDAT medium without
antibiotics and then transferred to BCDAT medium containing either 20 mg/L hygromycin or 20
mg/L G418 or 50 mg/L zeocin for 3 weeks. False positives that arise due to episomal expression
of the selective marker were removed by a sequential regimen of selection/non-
selection/selection. This effectively kills any ‘escapes’ due to episomal maintenance of the gene
targeting plasmids. Since P. patens is haploid, 0.5 mg/L of thiamine was included in the growth
medium to complement possible loss of thiamine biosynthetic capability.
The regeneration rate was evaluated for each transformation experiment. Genomic
DNA of plants which still retained resistance to antibiotics was extracted by Invisorb® Spin
Plant Mini Kit (Stratec Molecular GMBH). Integration of the resistance gene was confirmed by
PCR analysis with primers specific for each resistance gene (zeocin: ZeoR 1F: CTT ATC CTC
AGT CCT GCT CCT CT and ZeoR 377R: CAA GTT GAC CAG TGC CGT TC; hygromycin:
92
HygF: CTA TTT CTT TGC CCT CGG ACG and HygR: GCG ACG TCT GTC GAG AAG
TT; geneticin: nptIIF: GAG GCT ATT CGG CTA TGA CTG and nptIIR: TCG ACA AGA
CCG GCT TCC ATC).
To prepare protonemata that were at similar developmental stages, this tissue was
fragmented with a homogenizer and transferred onto new medium every five days (Nishiyama et
al., 2000). On this culture schedule, the protonemata usually did not develop any buds.
Protonemata-rich mutant cultures were stored aseptically in water in 50 mL conical tubes at 4ºC
in the dark. When necessary, they were spread on cellophane sheets layered onto BCDATG
medium plates, and kept in normal growth conditions for one week to recover.
3.2.5. Morphological analysis
The regeneration of the protonemata-rich mutants in BCDAT and in BCDATG (0.5%
[w/v] glucose) was observed by stereomicroscopy and finer-scale observations were made by
light microscopy.
3.2.6. Effect of thiamine on mutant growth
The effect of thiamine in the medium on the growth rate of mutant colonies was
evaluated. As a starting material for this experiment, ten protonemal colonies (~1 mm in
diameter) of each mutant line were inoculated the same distance apart on BCDAT agar plates
supplemented or not with 0.5 mg/L thiamine and kept in normal growth conditions. The
protonemal colonies and the gametophores were observed and photographed under the
stereomicroscope after 1 and 2 weeks.
The growth of the culture was measured using the area obtained from the analysis of the
microscopy images. The original image was filtered to obtain a mask only in the desired color
spectrum. For the analysis the HSV (Hue, Saturation, Value) representation was used with the
limits presented in Table 7. Each parameter can vary its value between 0 and 1. These limits
maximize the visualization of the shades of green.
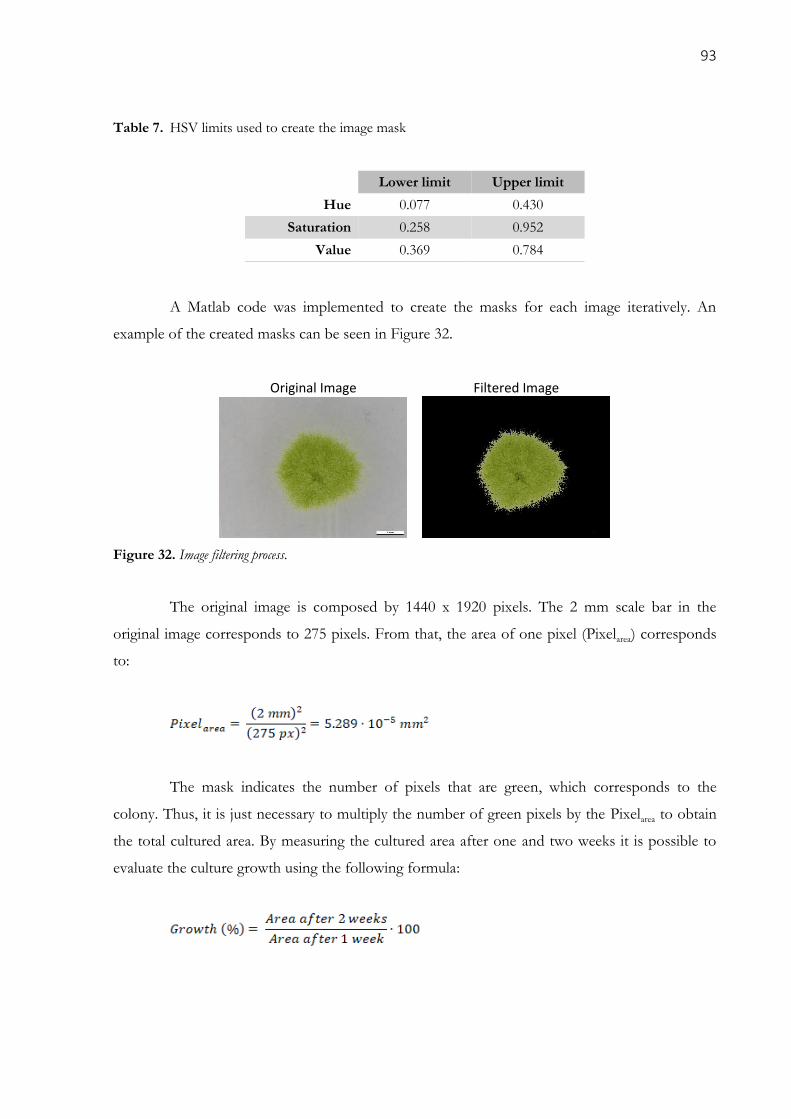
93
Table 7. HSV limits used to create the image mask
Lower limit Upper limit
Hue 0.077 0.430
Saturation 0.258 0.952
Value 0.369 0.784
A Matlab code was implemented to create the masks for each image iteratively. An
example of the created masks can be seen in Figure 32.
Original Image Filtered Image
Figure 32. Image filtering process.
The original image is composed by 1440 x 1920 pixels. The 2 mm scale bar in the
original image corresponds to 275 pixels. From that, the area of one pixel (Pixelarea) corresponds
to:
The mask indicates the number of pixels that are green, which corresponds to the
colony. Thus, it is just necessary to multiply the number of green pixels by the Pixelarea to obtain
the total cultured area. By measuring the cultured area after one and two weeks it is possible to
evaluate the culture growth using the following formula:

94
3.2.7. Fresh and dry weights
Fresh and dry weights were measured for four colonies with gametophores of each
PpThi1 mutant, except for the PpThi1.20F mutant, for which only two colonies were obtained.
Dry material was obtained by drying the colonies for 2 hours at 110º C in an incubator. The ratio
between dry weight and fresh weight was determined.
3.2.8. Carbohydrate analysis
Plant material prepared to determine dry weight was used to quantify soluble
carbohydrates. First the material was pulverized using a mortar and pestle. Total soluble
carbohydrates were extracted by six washes with 1 mL of 80% ethanol and concentrated by
SpeedVac™. The material was resuspended in 1 mL of Milli-Q™ water and pigments were
removed by chloroform extraction. Carbohydrate composition was determined by high-
performance anion exchange chromatography with pulsed amperometric detection
(HPAEC/PAD) in a Dionex DX-500 system using a Carbo-Pac SA10 column.
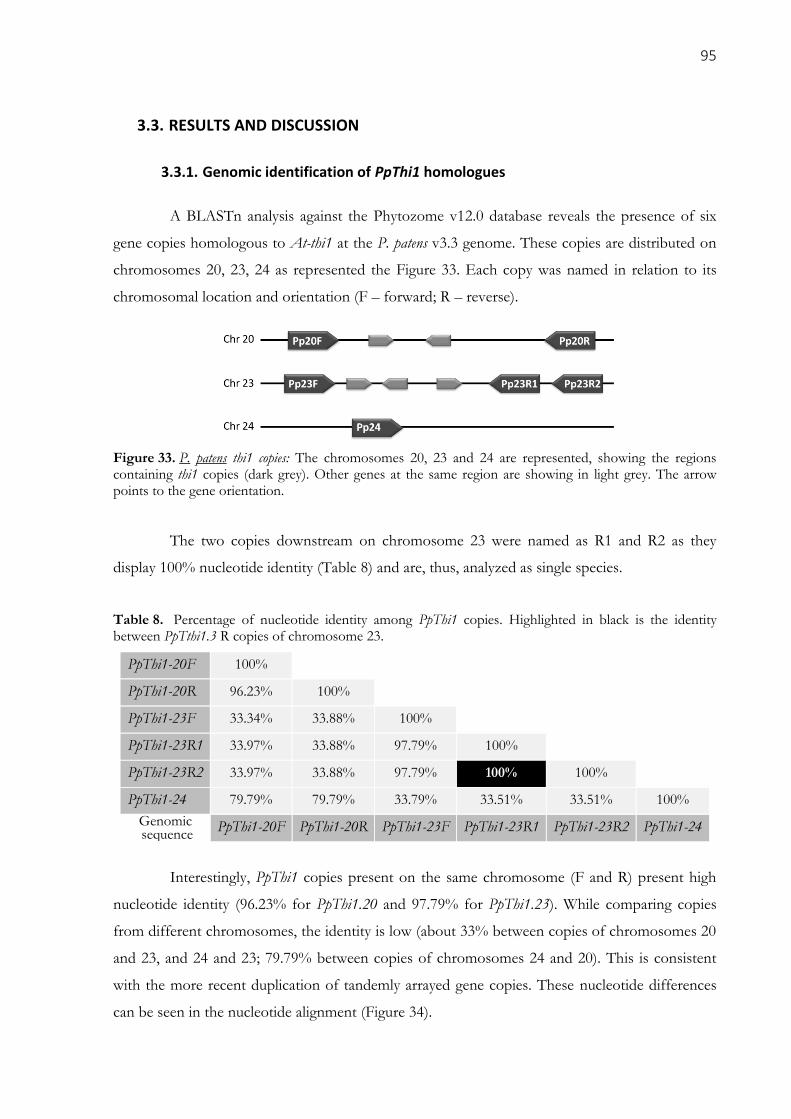
95
3.3. RESULTS AND DISCUSSION
3.3.1. Genomic identification of PpThi1 homologues
A BLASTn analysis against the Phytozome v12.0 database reveals the presence of six
gene copies homologous to At-thi1 at the P. patens v3.3 genome. These copies are distributed on
chromosomes 20, 23, 24 as represented the Figure 33. Each copy was named in relation to its
chromosomal location and orientation (F – forward; R – reverse).
Figure 33. P. patens thi1 copies: The chromosomes 20, 23 and 24 are represented, showing the regions containing thi1 copies (dark grey). Other genes at the same region are showing in light grey. The arrow points to the gene orientation.
The two copies downstream on chromosome 23 were named as R1 and R2 as they
display 100% nucleotide identity (Table 8) and are, thus, analyzed as single species.
Table 8. Percentage of nucleotide identity among PpThi1 copies. Highlighted in black is the identity between PpTthi1.3 R copies of chromosome 23.
PpThi1-20F 100%
PpThi1-20R 96.23% 100%
PpThi1-23F 33.34% 33.88% 100%
PpThi1-23R1 33.97% 33.88% 97.79% 100%
PpThi1-23R2 33.97% 33.88% 97.79% 100% 100%
PpThi1-24 79.79% 79.79% 33.79% 33.51% 33.51% 100%
Genomic sequence
PpThi1-20F PpThi1-20R PpThi1-23F PpThi1-23R1 PpThi1-23R2 PpThi1-24
Interestingly, PpThi1 copies present on the same chromosome (F and R) present high
nucleotide identity (96.23% for PpThi1.20 and 97.79% for PpThi1.23). While comparing copies
from different chromosomes, the identity is low (about 33% between copies of chromosomes 20
and 23, and 24 and 23; 79.79% between copies of chromosomes 24 and 20). This is consistent
with the more recent duplication of tandemly arrayed gene copies. These nucleotide differences
can be seen in the nucleotide alignment (Figure 34).
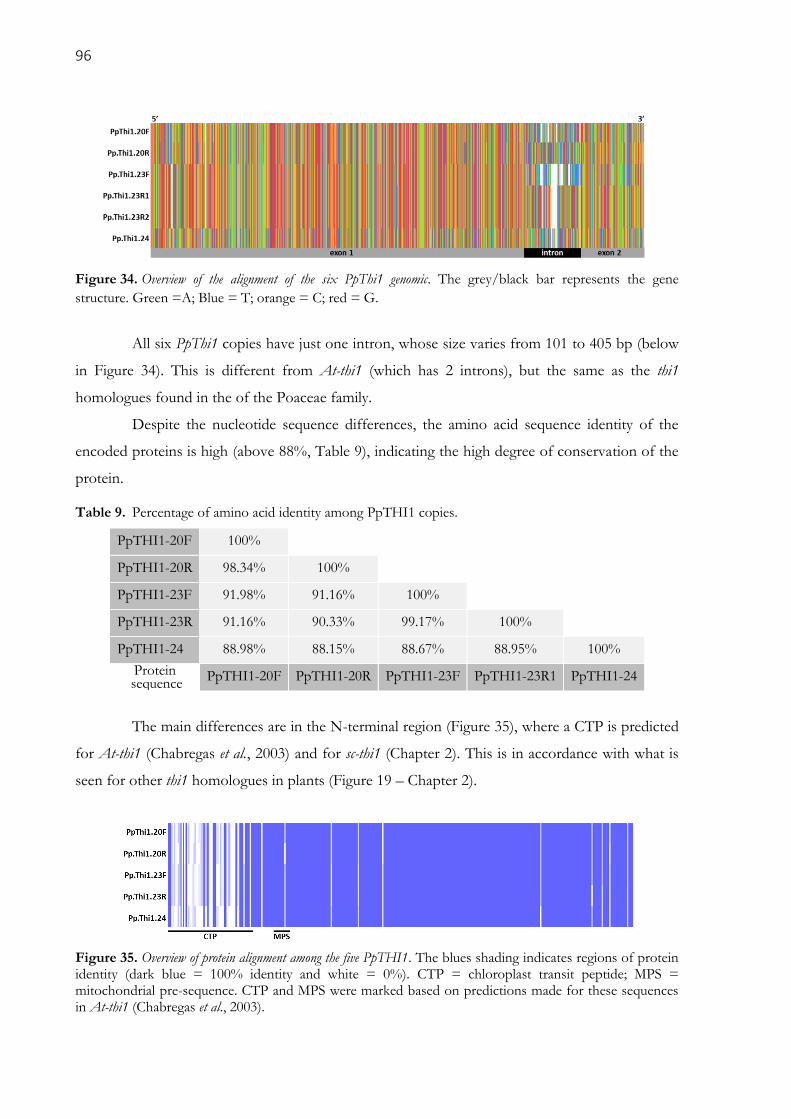
96
Figure 34. Overview of the alignment of the six PpThi1 genomic. The grey/black bar represents the gene
structure. Green =A; Blue = T; orange = C; red = G.
All six PpThi1 copies have just one intron, whose size varies from 101 to 405 bp (below
in Figure 34). This is different from At-thi1 (which has 2 introns), but the same as the thi1
homologues found in the of the Poaceae family.
Despite the nucleotide sequence differences, the amino acid sequence identity of the
encoded proteins is high (above 88%, Table 9), indicating the high degree of conservation of the
protein.
Table 9. Percentage of amino acid identity among PpTHI1 copies.
PpTHI1-20F 100%
PpTHI1-20R 98.34% 100%
PpTHI1-23F 91.98% 91.16% 100%
PpTHI1-23R 91.16% 90.33% 99.17% 100%
PpTHI1-24 88.98% 88.15% 88.67% 88.95% 100%
Protein sequence
PpTHI1-20F PpTHI1-20R PpTHI1-23F PpTHI1-23R1 PpTHI1-24
The main differences are in the N-terminal region (Figure 35), where a CTP is predicted
for At-thi1 (Chabregas et al., 2003) and for sc-thi1 (Chapter 2). This is in accordance with what is
seen for other thi1 homologues in plants (Figure 19 – Chapter 2).
Figure 35. Overview of protein alignment among the five PpTHI1. The blues shading indicates regions of protein identity (dark blue = 100% identity and white = 0%). CTP = chloroplast transit peptide; MPS = mitochondrial pre-sequence. CTP and MPS were marked based on predictions made for these sequences in At-thi1 (Chabregas et al., 2003).
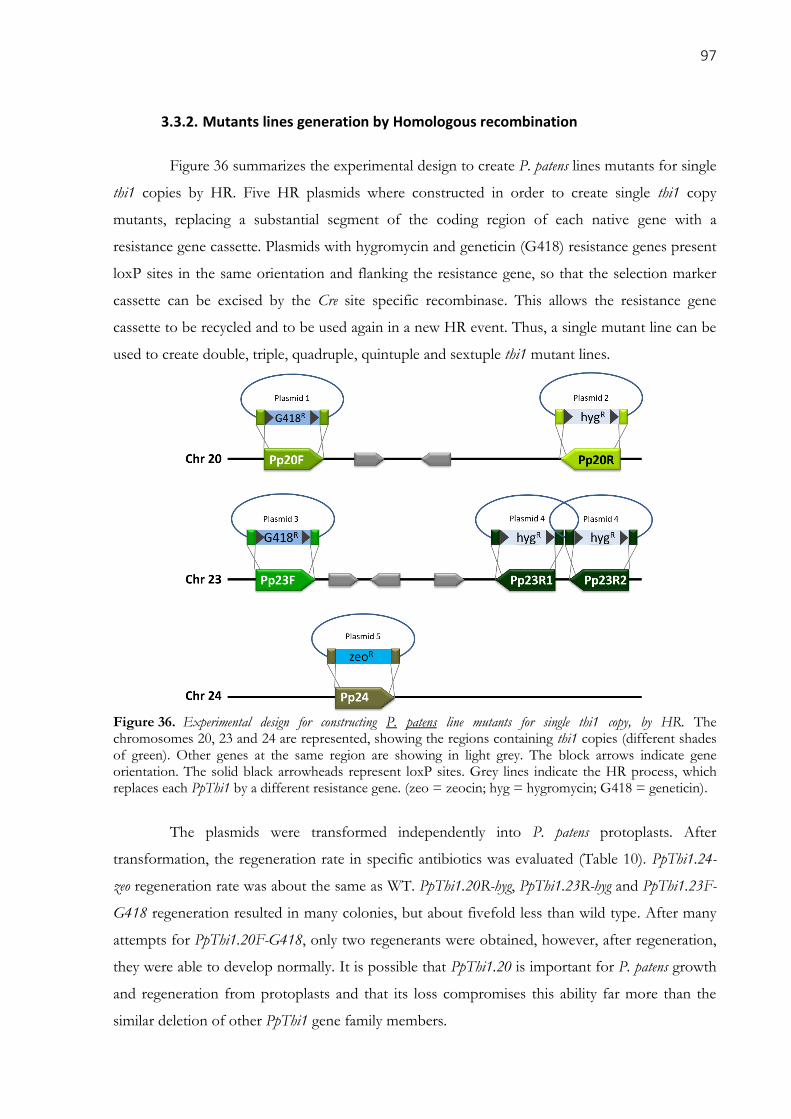
97
3.3.2. Mutants lines generation by Homologous recombination
Figure 36 summarizes the experimental design to create P. patens lines mutants for single
thi1 copies by HR. Five HR plasmids where constructed in order to create single thi1 copy
mutants, replacing a substantial segment of the coding region of each native gene with a
resistance gene cassette. Plasmids with hygromycin and geneticin (G418) resistance genes present
loxP sites in the same orientation and flanking the resistance gene, so that the selection marker
cassette can be excised by the Cre site specific recombinase. This allows the resistance gene
cassette to be recycled and to be used again in a new HR event. Thus, a single mutant line can be
used to create double, triple, quadruple, quintuple and sextuple thi1 mutant lines.
Figure 36. Experimental design for constructing P. patens line mutants for single thi1 copy, by HR. The chromosomes 20, 23 and 24 are represented, showing the regions containing thi1 copies (different shades of green). Other genes at the same region are showing in light grey. The block arrows indicate gene orientation. The solid black arrowheads represent loxP sites. Grey lines indicate the HR process, which replaces each PpThi1 by a different resistance gene. (zeo = zeocin; hyg = hygromycin; G418 = geneticin).
The plasmids were transformed independently into P. patens protoplasts. After
transformation, the regeneration rate in specific antibiotics was evaluated (Table 10). PpThi1.24-
zeo regeneration rate was about the same as WT. PpThi1.20R-hyg, PpThi1.23R-hyg and PpThi1.23F-
G418 regeneration resulted in many colonies, but about fivefold less than wild type. After many
attempts for PpThi1.20F-G418, only two regenerants were obtained, however, after regeneration,
they were able to develop normally. It is possible that PpThi1.20 is important for P. patens growth
and regeneration from protoplasts and that its loss compromises this ability far more than the
similar deletion of other PpThi1 gene family members.

98
Table 10. P. patens regenerants colonies after three or more attempts to transform the HR plasmids.
Plasmids Attempts Regenerants colonies
WT (control) 3 Over one thousand
PpThi1.20F-G418 3 Over one hundred
PpThi1.20R-hyg 8 Two
PpThi1.23F-G418 3 Over one hundred
PpThi1.23R-hyg 3 Over one hundred
PpThi1.24-zeo 3 Over one thousand
Different rates of regeneration may indicate different functions for each copy, as it is
not an antibiotic specific bias. PpThi1.20R-hyg and PpThi1.23R-hyg are both resistant to
hygromycin, while PpThi1.23F-G418 is resistant to geneticin and shows same regeneration rates.
PCR amplification of the correspondent resistance gene cassette using genomic DNA of
individual confirmed that mutant line for each single PpThi1 copies were obtained by HR (Figure
37).
Figure 37. PCR amplification of internal sequence from inside each correspondent resistance gene from mutants genomic DNA. 1 – PpThi1.20R-hyg; 2 – PpThi1.23R-hyg; 3 – WT (hyg); 4 – PpThi1.24-zeo; 5 – WT (zeo); 6 – PpThi1.20F-G418; 7 – PpThi1.23F-G418; 8 – WT (G418).
3.3.3. Morphological analysis of the protonemata
In order to analyze the overall morphology and development of PpThi1 mutant line,
protonemata-rich mutant cultures were fragmented (blended) transferred onto medium in the
presence or absence of glucose (0.5% [w/v]). Medium containing glucose is used to keep the
moss in the protonematal phase, while the absence of glucose promotes gametophore
development.
No substantial visual differences were observed in WT or mutant plants growing in the
presence or absence of glucose. No gametophore grew in presence of glucose. However, we did
observe some subtle morphological differences in growth of mutants compared to WT.
A qualitative morphological description of each PpThi1 mutant line was constructed
based on preliminary observations of four plates of protonemata-rich KOs of each line, made
under the stereomicroscope and microscope. Figure 38 represents one example of what was
observed for each PpThi1 mutant line at two and nine days after blending (DAB) and plating onto
new medium.
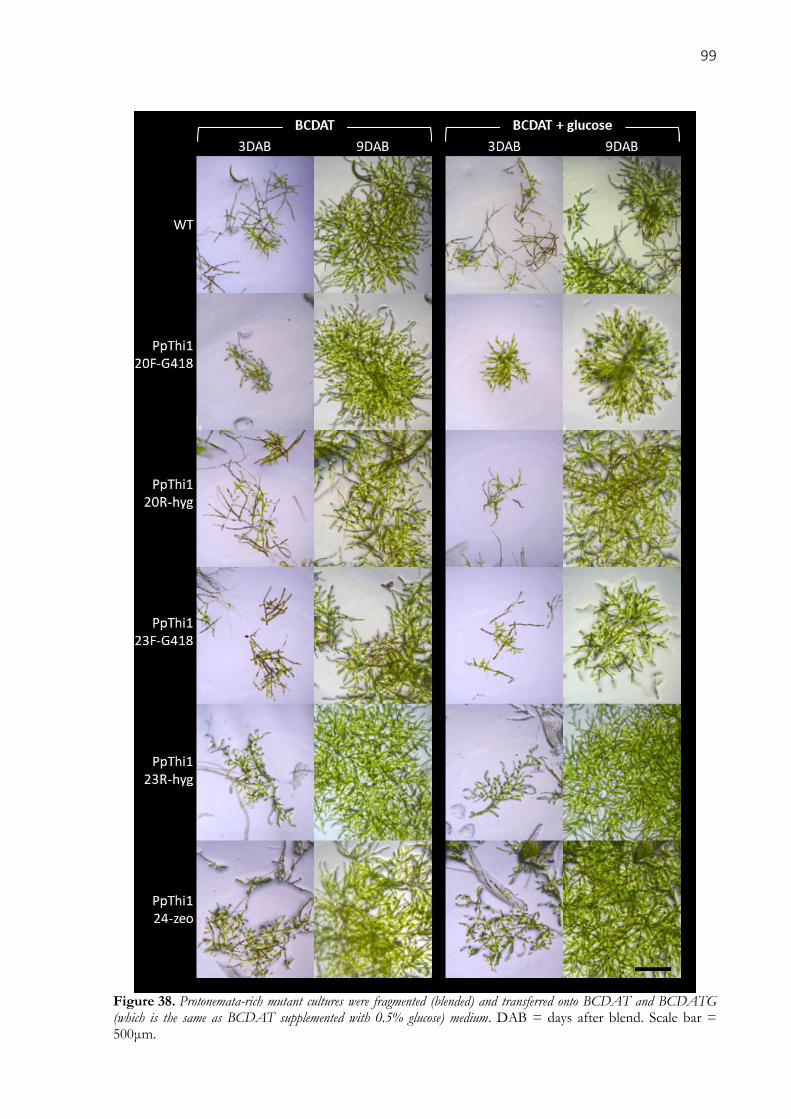
99
Figure 38. Protonemata-rich mutant cultures were fragmented (blended) and transferred onto BCDAT and BCDATG (which is the same as BCDAT supplemented with 0.5% glucose) medium. DAB = days after blend. Scale bar = 500μm.
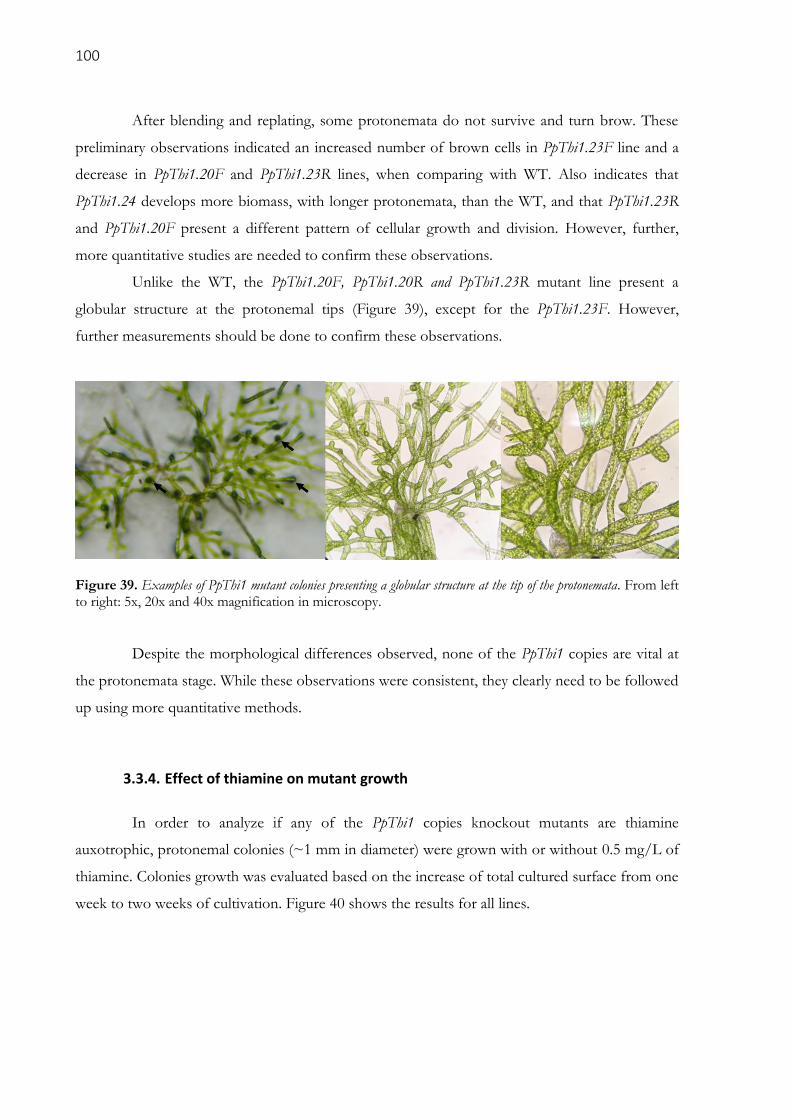
100
After blending and replating, some protonemata do not survive and turn brow. These
preliminary observations indicated an increased number of brown cells in PpThi1.23F line and a
decrease in PpThi1.20F and PpThi1.23R lines, when comparing with WT. Also indicates that
PpThi1.24 develops more biomass, with longer protonemata, than the WT, and that PpThi1.23R
and PpThi1.20F present a different pattern of cellular growth and division. However, further,
more quantitative studies are needed to confirm these observations.
Unlike the WT, the PpThi1.20F, PpThi1.20R and PpThi1.23R mutant line present a
globular structure at the protonemal tips (Figure 39), except for the PpThi1.23F. However,
further measurements should be done to confirm these observations.
Figure 39. Examples of PpThi1 mutant colonies presenting a globular structure at the tip of the protonemata. From left to right: 5x, 20x and 40x magnification in microscopy.
Despite the morphological differences observed, none of the PpThi1 copies are vital at
the protonemata stage. While these observations were consistent, they clearly need to be followed
up using more quantitative methods.
3.3.4. Effect of thiamine on mutant growth
In order to analyze if any of the PpThi1 copies knockout mutants are thiamine
auxotrophic, protonemal colonies (~1 mm in diameter) were grown with or without 0.5 mg/L of
thiamine. Colonies growth was evaluated based on the increase of total cultured surface from one
week to two weeks of cultivation. Figure 40 shows the results for all lines.
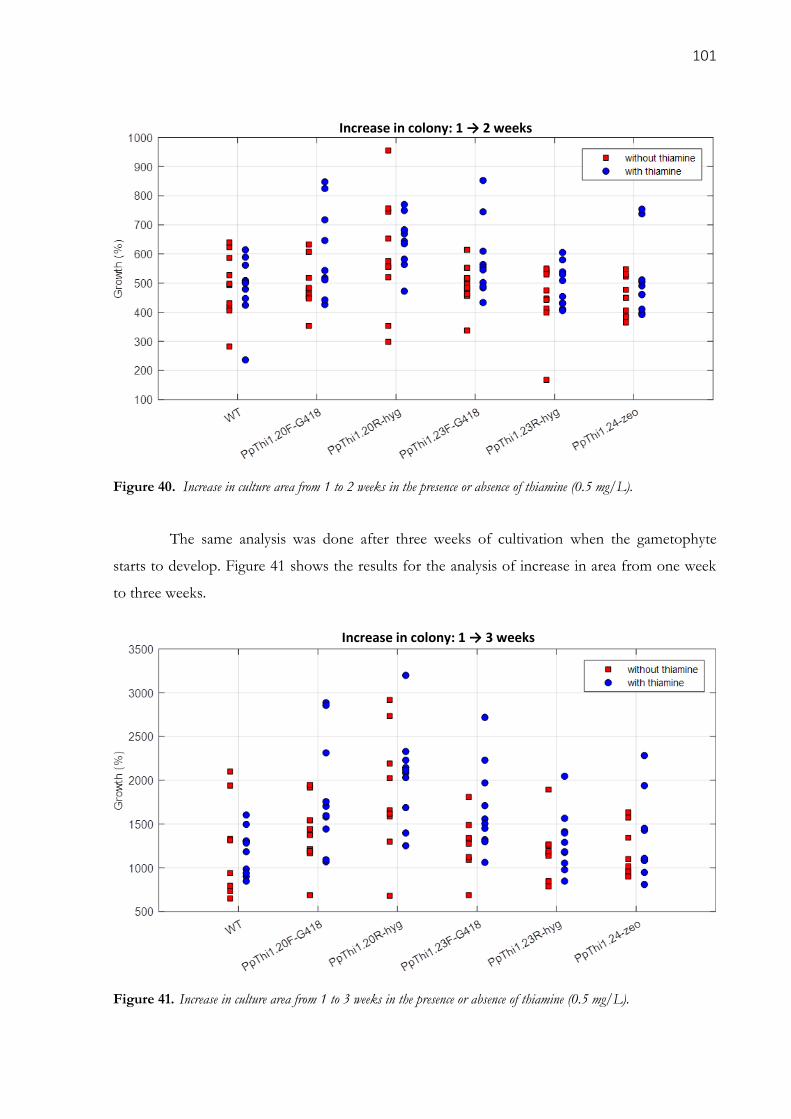
101
Figure 40. Increase in culture area from 1 to 2 weeks in the presence or absence of thiamine (0.5 mg/L).
The same analysis was done after three weeks of cultivation when the gametophyte
starts to develop. Figure 41 shows the results for the analysis of increase in area from one week
to three weeks.
Figure 41. Increase in culture area from 1 to 3 weeks in the presence or absence of thiamine (0.5 mg/L).
Increase in colony: 1 → 3 weeks
Increase in colony: 1 → 2 weeks
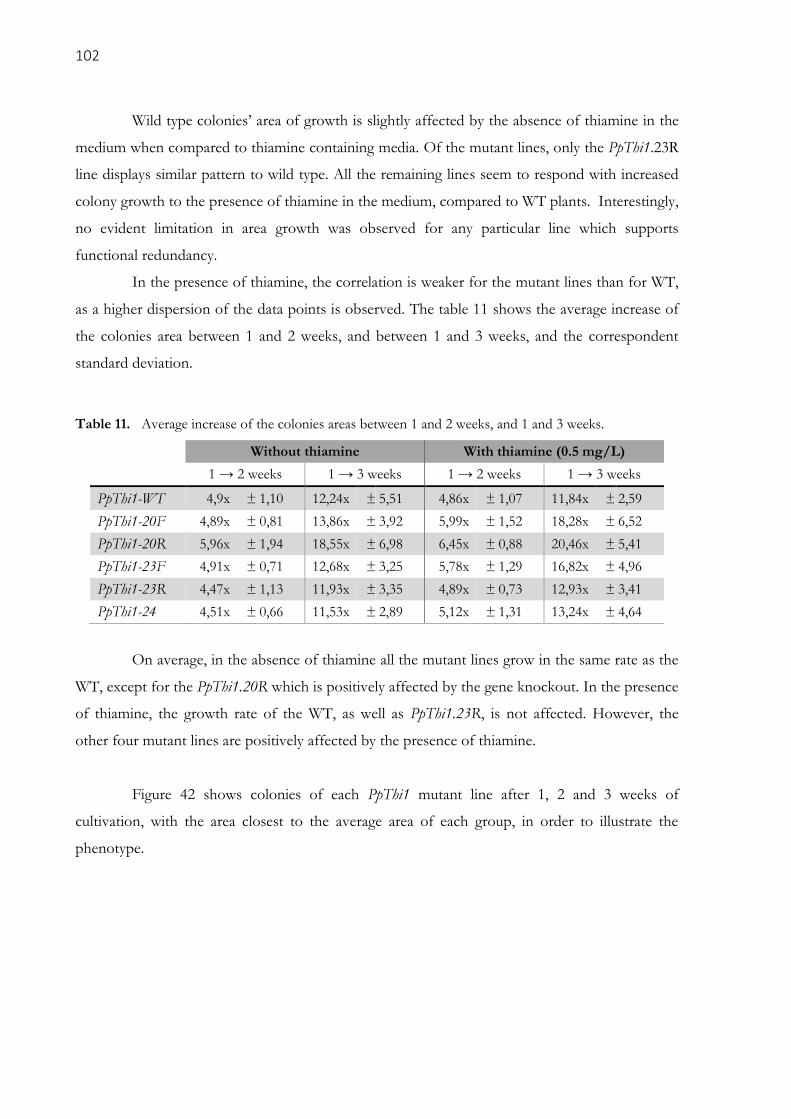
102
Wild type colonies’ area of growth is slightly affected by the absence of thiamine in the
medium when compared to thiamine containing media. Of the mutant lines, only the PpThi1.23R
line displays similar pattern to wild type. All the remaining lines seem to respond with increased
colony growth to the presence of thiamine in the medium, compared to WT plants. Interestingly,
no evident limitation in area growth was observed for any particular line which supports
functional redundancy.
In the presence of thiamine, the correlation is weaker for the mutant lines than for WT,
as a higher dispersion of the data points is observed. The table 11 shows the average increase of
the colonies area between 1 and 2 weeks, and between 1 and 3 weeks, and the correspondent
standard deviation.
Table 11. Average increase of the colonies areas between 1 and 2 weeks, and 1 and 3 weeks.
Without thiamine With thiamine (0.5 mg/L)
1 → 2 weeks 1 → 3 weeks 1 → 2 weeks 1 → 3 weeks
PpThi1-WT 4,9x ± 1,10 12,24x ± 5,51 4,86x ± 1,07 11,84x ± 2,59
PpThi1-20F 4,89x ± 0,81 13,86x ± 3,92 5,99x ± 1,52 18,28x ± 6,52
PpThi1-20R 5,96x ± 1,94 18,55x ± 6,98 6,45x ± 0,88 20,46x ± 5,41
PpThi1-23F 4,91x ± 0,71 12,68x ± 3,25 5,78x ± 1,29 16,82x ± 4,96
PpThi1-23R 4,47x ± 1,13 11,93x ± 3,35 4,89x ± 0,73 12,93x ± 3,41
PpThi1-24 4,51x ± 0,66 11,53x ± 2,89 5,12x ± 1,31 13,24x ± 4,64
On average, in the absence of thiamine all the mutant lines grow in the same rate as the
WT, except for the PpThi1.20R which is positively affected by the gene knockout. In the presence
of thiamine, the growth rate of the WT, as well as PpThi1.23R, is not affected. However, the
other four mutant lines are positively affected by the presence of thiamine.
Figure 42 shows colonies of each PpThi1 mutant line after 1, 2 and 3 weeks of
cultivation, with the area closest to the average area of each group, in order to illustrate the
phenotype.

103
Figure 42. Examples of PpThi1 mutant colonies grown with or without 0.5 mg/L thiamine addition. Scale bar = 2 mm.
3.3.5. Fresh and dry weight
Momoli (2008) reported that the At-thi1 mutant (tz-201) has a higher root fresh weight,
while the WT has a higher shoot fresh weight after 6 weeks. In order to evaluate if PpThi1
mutations also causes general physiological changes in moss, the ratio between dry and fresh
weight was evaluated (Figure 43).

104
Figure 43. Dry and fresh weight ratio for different PpThi1 mutants samples.
The percentage of dry weight is high variable among the samples and does not differ
from what is observed for the WT, except for PpThi1.23R mutant which has significantly lower
dry weight content than does the WT and the other mutant lines.
Unlike A. thaliana, the bulk of mass of P. patens grows very close to the culture medium.
This may interfere with measuring the water content of this plant, at the harvesting for the
experiment. Another possibility for these weight measure differences is the differences in the
dispersal of the blended protonemata on the petri dish.
3.3.6. Carbohydrate analysis
Sucrose is a disaccharide (glucose + fructose) essential to the translocation of sugars
from photosynthetic source leaves to other plant organs while glucose and fructose represent the
hexoses that partition carbon into the plant cell metabolism. Vitamin B1 is necessary to some of
the key pathways in which those soluble sugars enter metabolism. Raffinose, different from
sucrose, is a trisaccharide (galactose, glucose and fructose) that is mostly related to plant cell wall
metabolism.
Momoli (2008) demonstrated that the At-thi1 mutant (tz-201) has an increased level of
sucrose and corresponding decrease in glucose and fructose, relative to the WT plant. Thus, the
soluble carbohydrate content was evaluated for all PpThi1 mutant lines. Figure 44 (A) shows the
sucrose content while (B) shows glucose, fructose and raffinose content.
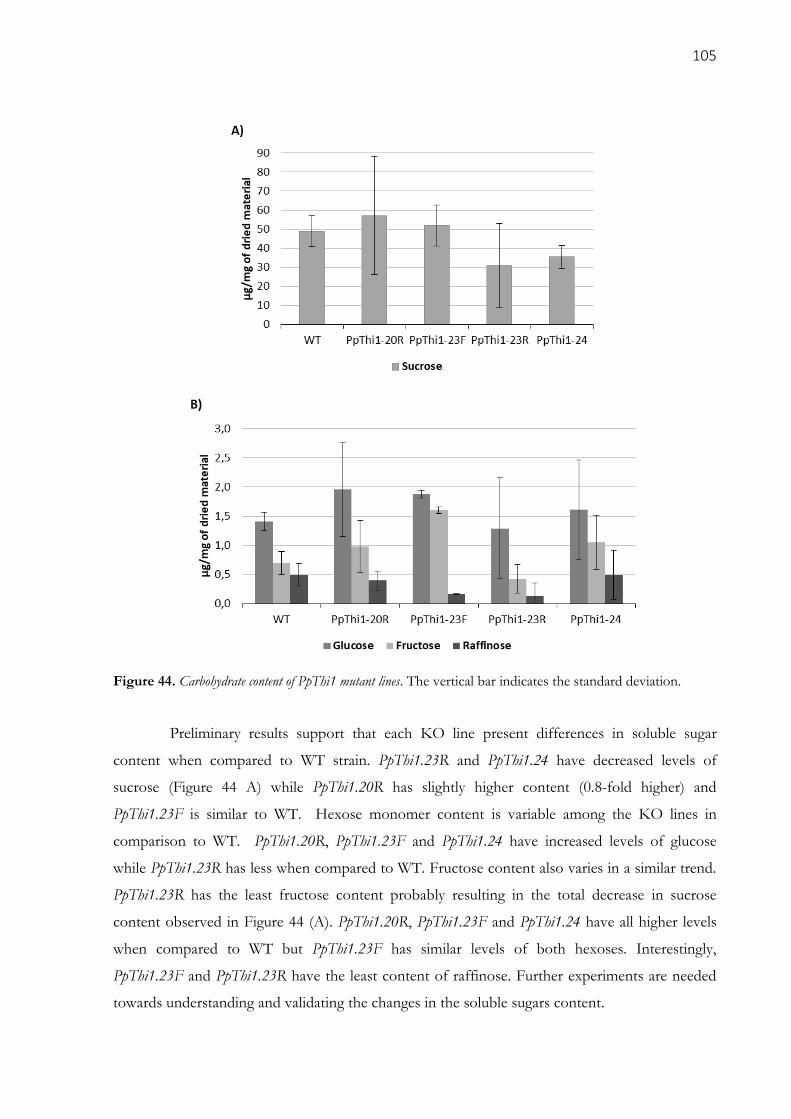
105
Figure 44. Carbohydrate content of PpThi1 mutant lines. The vertical bar indicates the standard deviation.
Preliminary results support that each KO line present differences in soluble sugar
content when compared to WT strain. PpThi1.23R and PpThi1.24 have decreased levels of
sucrose (Figure 44 A) while PpThi1.20R has slightly higher content (0.8-fold higher) and
PpThi1.23F is similar to WT. Hexose monomer content is variable among the KO lines in
comparison to WT. PpThi1.20R, PpThi1.23F and PpThi1.24 have increased levels of glucose
while PpThi1.23R has less when compared to WT. Fructose content also varies in a similar trend.
PpThi1.23R has the least fructose content probably resulting in the total decrease in sucrose
content observed in Figure 44 (A). PpThi1.20R, PpThi1.23F and PpThi1.24 have all higher levels
when compared to WT but PpThi1.23F has similar levels of both hexoses. Interestingly,
PpThi1.23F and PpThi1.23R have the least content of raffinose. Further experiments are needed
towards understanding and validating the changes in the soluble sugars content.
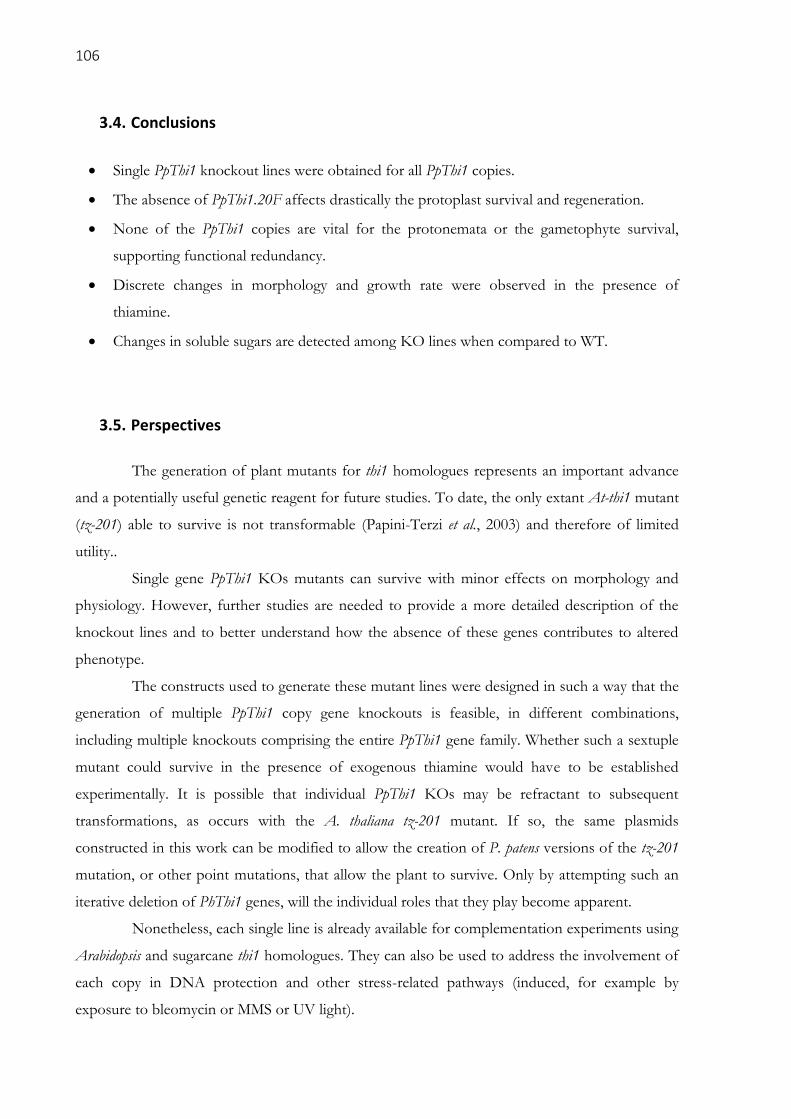
106
3.4. Conclusions
Single PpThi1 knockout lines were obtained for all PpThi1 copies.
The absence of PpThi1.20F affects drastically the protoplast survival and regeneration.
None of the PpThi1 copies are vital for the protonemata or the gametophyte survival,
supporting functional redundancy.
Discrete changes in morphology and growth rate were observed in the presence of
thiamine.
Changes in soluble sugars are detected among KO lines when compared to WT.
3.5. Perspectives
The generation of plant mutants for thi1 homologues represents an important advance
and a potentially useful genetic reagent for future studies. To date, the only extant At-thi1 mutant
(tz-201) able to survive is not transformable (Papini-Terzi et al., 2003) and therefore of limited
utility..
Single gene PpThi1 KOs mutants can survive with minor effects on morphology and
physiology. However, further studies are needed to provide a more detailed description of the
knockout lines and to better understand how the absence of these genes contributes to altered
phenotype.
The constructs used to generate these mutant lines were designed in such a way that the
generation of multiple PpThi1 copy gene knockouts is feasible, in different combinations,
including multiple knockouts comprising the entire PpThi1 gene family. Whether such a sextuple
mutant could survive in the presence of exogenous thiamine would have to be established
experimentally. It is possible that individual PpThi1 KOs may be refractant to subsequent
transformations, as occurs with the A. thaliana tz-201 mutant. If so, the same plasmids
constructed in this work can be modified to allow the creation of P. patens versions of the tz-201
mutation, or other point mutations, that allow the plant to survive. Only by attempting such an
iterative deletion of PhThi1 genes, will the individual roles that they play become apparent.
Nonetheless, each single line is already available for complementation experiments using
Arabidopsis and sugarcane thi1 homologues. They can also be used to address the involvement of
each copy in DNA protection and other stress-related pathways (induced, for example by
exposure to bleomycin or MMS or UV light).
107
REFERENCES
Alberts B. et al. (2008) Molecular Biology of the Cell, 5th edition. New York: Garland Science.
Amunugama, R. and Fishel, R. (2012) Homologous recombination in eukaryotes’ Progress in Molecular
Biology and Translational Science, 110:155-206.
Britt, A. (2003) ‘Re-engineering plant gene targeting’, Trends in Plant Science, 8(2), pp. 90–95.
Chabregas, S. M. et al. (2003) ‘Differential usage of two in-frame translational start codons regulates
subcellular localization of Arabidopsis thaliana THI1’, Journal of Cell Science, 116(2), pp. 285–291.
COSMOSS. The Physcomitrella patens computational biology resource. Available at:
http://www.cosmoss.org/ (Accessed: 3 February 2018).
Datta, A. et al. (1997) ‘Dual roles for DNA sequence identity and the mismatch repair system in the
regulation of mitotic crossing-over in yeast’, Genetics Communicated by John R. Roth, 94, pp. 9757–
9762.
Finka, A. et al. (2008) ‘The knock-out of ARP3a gene affects F-actin cytoskeleton organization
altering cellular tip growth, morphology and development in moss Physcomitrella patens’, Cell Motil
Cytoskeleton, 65(10), pp. 769-784.
Http://academic.pgcc.edu. Homologous recombination. Available at:
http://academic.pgcc.edu/~kroberts/Lecture/Chapter 7/07-29_Recombination_L.jpg
(Accessed: 4 February 2018).
Kamisugi, Y. et al. (2006) ‘The mechanism of gene targeting in Physcomitrella patens: Homologous
recombination, concatenation and multiple integration’, Nucleic Acids Research, 34(21), pp. 6205–
6214.
Kamisugi, Y., Cuming, A. C. and Cove, D. J. (2005) ‘Parameters determining the efficiency of gene
targeting in the moss Physcomitrella patens’, Nucleic acids research, 33(19), p. e173.
Krebs, J. E., Goldstein, E. S. and Kilpatrick, S. T. (2014) Lewin’s Gene XI, Jones & Bartlett Leraning.
Kuwayama, H. (2012) ‘Enhancement of Homologous Recombination Efficiency by Homologous
Oligonucleotides’, in Cell Interaction. InTech.
Momoli, M. M. (2008) Aspectos funcionais do gene thi1 em plantas selvagens e mutantes de Arabidopsis thaliana
(Brassicaceae). University of São Paulo.
Nishiyama, T. et al. (2000) ‘Tagged Mutagenesis and Gene-trap in the Moss, Physcomitrella patens by
Shuttle Mutagenesis’, DNA Research, 7(1), pp. 9–17.
Papini-Terzi, F. S. et al. (2003) ‘Point mutation is responsible for Arabidopsis tz-201 mutant phenotype
affecting thiamin biosynthesis’, Plant & cell physiology, 44(8), pp. 856–60.
PHYSCObase database. Physcomitrella patens database. Available at: http://moss.nibb.ac.jp/ (Accessed:
3 February 2018).

108
PHYSCO manual. Chapter 9.1: PEG mediated transformation. Available at:
www.nibb.ac.jp/evodevo/PHYSCOmanual/9.1.htm%0A. (Accessed: 4 February 2018).
Rensing, S. A. et al. (2008) ‘The Physcomitrella genome reveals evolutionary insights into the conquest
of land by plants’, Science, 319(5859), pp. 64–69.
Schaefer, D. G. (2002) ‘A New Moss Genetics : Targeted Mutagenesis in Physcomitrella patens’, Annual
Review of Plant Biology, 53(1), pp. 477–501.
Schaefer, D. G. and Zryd, J.-P. (1997) ‘Efficient gene targeting in the moss Physcomitrella patens’, The
Plant Journal, pp. 1195–1206.
.
109
4. FINAL CONSIDERATIONS
Results from the work described in this thesis reveal that sugarcane and Physcomitrella
patens harbor more than one copy of thi1 in their genomes.
Sugarcane has two genomic loci containing thi1 (sc-thi1.1 and sc-thi1.2) each displaying
synteny to other Poaceae. Sc-thi1.2 locus discloses that the alleles of sc-thi1.2 are diverging from
each other. Moreover, these three sc-thi1 gene versions have differential expression patterns and
complements differentially the KBY5 thiamine auxotrophic yeast strain.
P. patens has six different thi1 copies, two on chromosome 20, three on chromosome 23
and one on chromosome 24. The knockout of each of them is not lethal, although generates gene
mutations leads to some differences in morphology and growth. Of the knockout mutants
generated, deletion of PpThi1.20F results in a marked decrease in regeneration efficiency.
The redundancy described in chapter 2 and 3 in both sugarcane and P. patens may
indicate a specialization of functions other than thiamine biosynthesis, such as the organellar
DNA protection/repair described for Arabidopsis thaliana thi1 single copy (Machado et al., 1997).
As describe for yeast (Chatterjee et al., 2011), THI1 acts as a reagent donating the sulfur for the
thiazole ring formation. Taken together, the results presented here advance our knowledge and
understanding of the thiazole biosynthetic protein and its cellular and biochemical functions.
Finally, the generation of P. patens single thi1 copy knockouts lines provides a useful
plant system for further functional studies of this gene family.

110
REFERENCES
Machado, C. R. et al. (1996) ‘Thi1, a thiamine biosynthetic gene in Arabidopsis thaliana, complements
bacterial defects in DNA repair’, Plant molecular biology, 31(3), pp. 585–93.
Chatterjee, A. et al. (2011) ‘Saccharomyces cerevisiae THI4p is a suicide thiamine thiazole synthase’,
Nature, 478(7370), pp. 542–546.

111
APPENDIX - Brachypodium distachyon thi1 mutant lines
ABSTRACT
In order to obtain mutants for the study of the gene thi1, in addition to Physcoitrella patens discussed in Chapter 3, we also tried to obtain thi1 mutants for Brachypodium distachyon. B. distachyon is a grass related to the major cereal grains and is used as a model due to its relatively small genome, short life cycle and small size. B. distachyon has only one thi1 copy (Bd-thi1). To produce thi1 mutant plant line, CRISPR/Cas9-gene editing technology was applied. Two vectors containing different resistance genes were constructed to edit Bd-thi1. After transformation and selection, 22 plants regenerated and from them, 475 T1 seeds were obtained. The germination rate of these seed was very low. The 11 plants able to germinate and grow were tested for CRISPR/Cas9 thi1 gene edition and did not present the expected edition.
Keywords: 1. Brachypodium distachyon; 2. Plant model; 3. Thi1 gene; 4. Mutant lines; 5. CRISPR/Cas9
Introduction
Brachypodium distachyon (Figure 45) is a grass related to the major cereal grain species
including wheat, barley, oats, maize, rice, rye, sorghum, millet and sugarcane. It has several
advantages as an experimental model organism for understanding the genetic, functional, and
cellular and molecular biology of grasses. Its genome is composed of five chromosomes
containing 272 million nucleotides, which is a small genome size for a grass species. (The
International Brachypodium Initiative, 2010). B. distachyon is a self-fertile, inbreeding annual plant
with a life cycle of less than 4 months. These features, coupled with its small size (approximately
20 cm at maturity), lack of seed-head shatter, and undemanding growth requirements should
make it amenable to high-throughput genetics and mutant screens (Draper et al., 2001).
Moreover, a BLASTn analysis with Phytozome 10.2 database shows that B. distachyon has only
one thi1-like copy, which makes the genetics analyses easier.
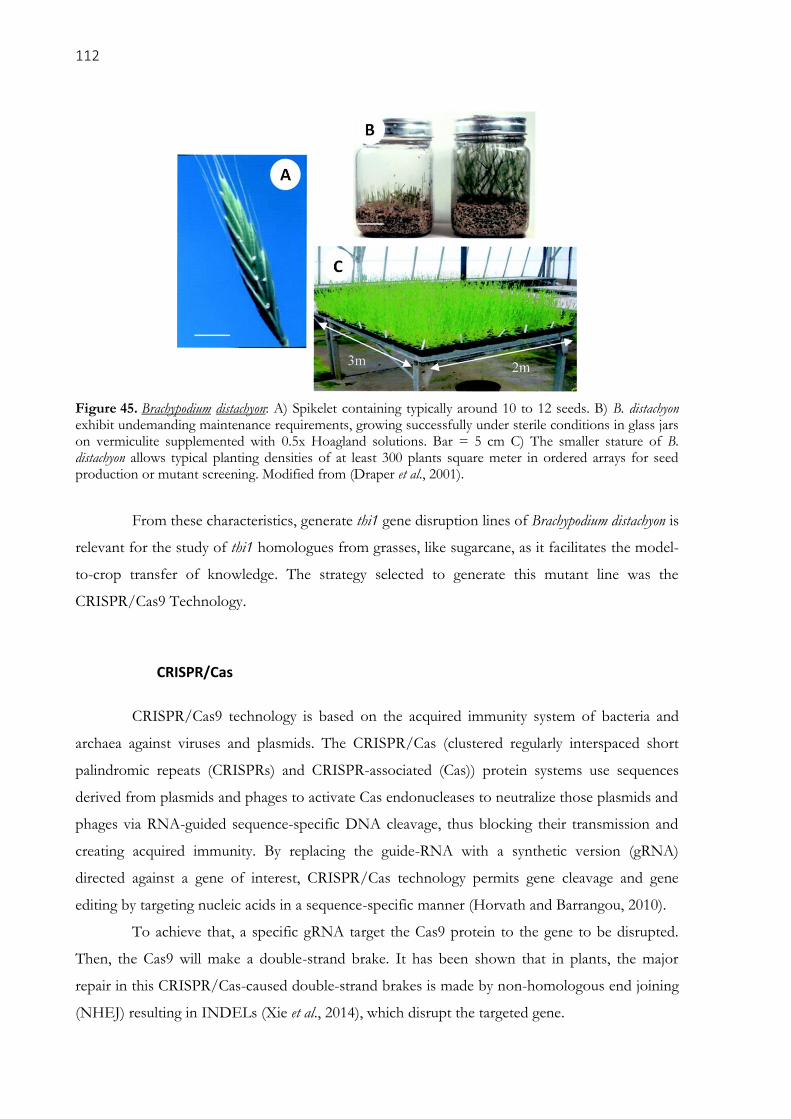
112
Figure 45. Brachypodium distachyon: A) Spikelet containing typically around 10 to 12 seeds. B) B. distachyon exhibit undemanding maintenance requirements, growing successfully under sterile conditions in glass jars on vermiculite supplemented with 0.5x Hoagland solutions. Bar = 5 cm C) The smaller stature of B. distachyon allows typical planting densities of at least 300 plants square meter in ordered arrays for seed production or mutant screening. Modified from (Draper et al., 2001).
From these characteristics, generate thi1 gene disruption lines of Brachypodium distachyon is
relevant for the study of thi1 homologues from grasses, like sugarcane, as it facilitates the model-
to-crop transfer of knowledge. The strategy selected to generate this mutant line was the
CRISPR/Cas9 Technology.
CRISPR/Cas
CRISPR/Cas9 technology is based on the acquired immunity system of bacteria and
archaea against viruses and plasmids. The CRISPR/Cas (clustered regularly interspaced short
palindromic repeats (CRISPRs) and CRISPR-associated (Cas)) protein systems use sequences
derived from plasmids and phages to activate Cas endonucleases to neutralize those plasmids and
phages via RNA-guided sequence-specific DNA cleavage, thus blocking their transmission and
creating acquired immunity. By replacing the guide-RNA with a synthetic version (gRNA)
directed against a gene of interest, CRISPR/Cas technology permits gene cleavage and gene
editing by targeting nucleic acids in a sequence-specific manner (Horvath and Barrangou, 2010).
To achieve that, a specific gRNA target the Cas9 protein to the gene to be disrupted.
Then, the Cas9 will make a double-strand brake. It has been shown that in plants, the major
repair in this CRISPR/Cas-caused double-strand brakes is made by non-homologous end joining
(NHEJ) resulting in INDELs (Xie et al., 2014), which disrupt the targeted gene.
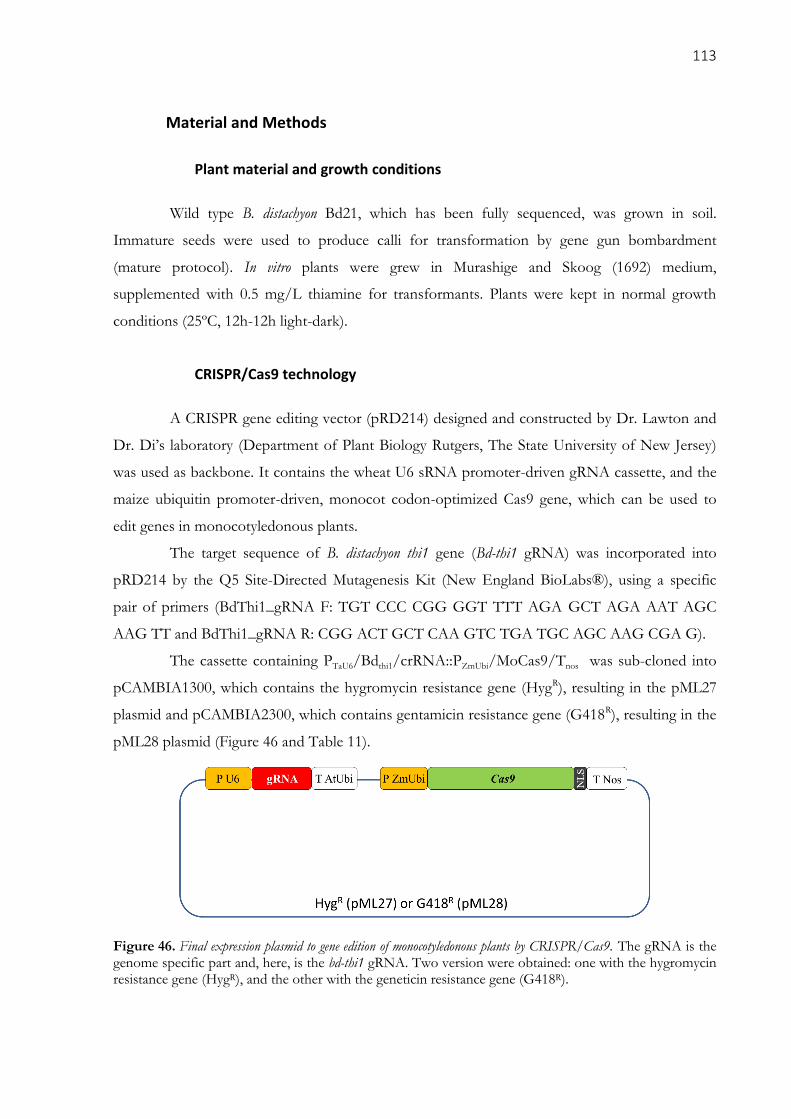
113
Material and Methods
Plant material and growth conditions
Wild type B. distachyon Bd21, which has been fully sequenced, was grown in soil.
Immature seeds were used to produce calli for transformation by gene gun bombardment
(mature protocol). In vitro plants were grew in Murashige and Skoog (1692) medium,
supplemented with 0.5 mg/L thiamine for transformants. Plants were kept in normal growth
conditions (25ºC, 12h-12h light-dark).
CRISPR/Cas9 technology
A CRISPR gene editing vector (pRD214) designed and constructed by Dr. Lawton and
Dr. Di’s laboratory (Department of Plant Biology Rutgers, The State University of New Jersey)
was used as backbone. It contains the wheat U6 sRNA promoter-driven gRNA cassette, and the
maize ubiquitin promoter-driven, monocot codon-optimized Cas9 gene, which can be used to
edit genes in monocotyledonous plants.
The target sequence of B. distachyon thi1 gene (Bd-thi1 gRNA) was incorporated into
pRD214 by the Q5 Site-Directed Mutagenesis Kit (New England BioLabs®), using a specific
pair of primers (BdThi1_gRNA F: TGT CCC CGG GGT TTT AGA GCT AGA AAT AGC
AAG TT and BdThi1_gRNA R: CGG ACT GCT CAA GTC TGA TGC AGC AAG CGA G).
The cassette containing PTaU6/Bdthi1/crRNA::PZmUbi/MoCas9/Tnos was sub-cloned into
pCAMBIA1300, which contains the hygromycin resistance gene (HygR), resulting in the pML27
plasmid and pCAMBIA2300, which contains gentamicin resistance gene (G418R), resulting in the
pML28 plasmid (Figure 46 and Table 11).
Figure 46. Final expression plasmid to gene edition of monocotyledonous plants by CRISPR/Cas9. The gRNA is the genome specific part and, here, is the bd-thi1 gRNA. Two version were obtained: one with the hygromycin resistance gene (HygR), and the other with the geneticin resistance gene (G418R).
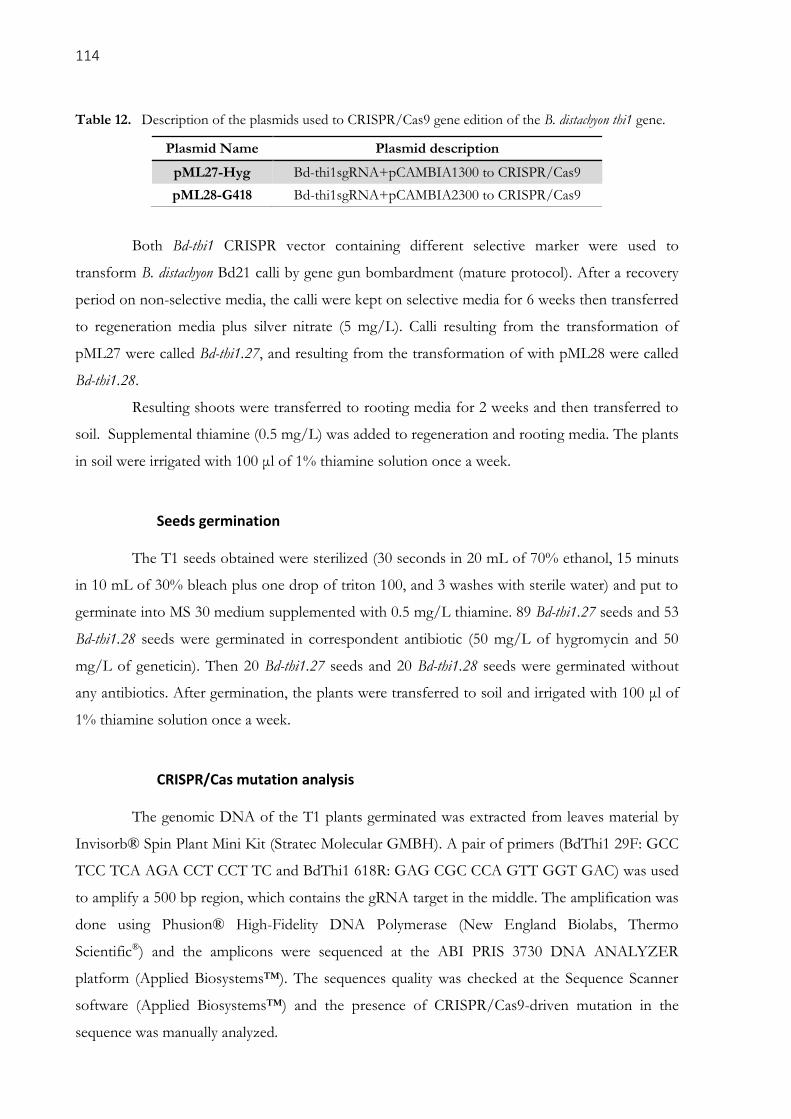
114
Table 12. Description of the plasmids used to CRISPR/Cas9 gene edition of the B. distachyon thi1 gene.
Plasmid Name Plasmid description
pML27-Hyg Bd-thi1sgRNA+pCAMBIA1300 to CRISPR/Cas9
pML28-G418 Bd-thi1sgRNA+pCAMBIA2300 to CRISPR/Cas9
Both Bd-thi1 CRISPR vector containing different selective marker were used to
transform B. distachyon Bd21 calli by gene gun bombardment (mature protocol). After a recovery
period on non-selective media, the calli were kept on selective media for 6 weeks then transferred
to regeneration media plus silver nitrate (5 mg/L). Calli resulting from the transformation of
pML27 were called Bd-thi1.27, and resulting from the transformation of with pML28 were called
Bd-thi1.28.
Resulting shoots were transferred to rooting media for 2 weeks and then transferred to
soil. Supplemental thiamine (0.5 mg/L) was added to regeneration and rooting media. The plants
in soil were irrigated with 100 μl of 1% thiamine solution once a week.
Seeds germination
The T1 seeds obtained were sterilized (30 seconds in 20 mL of 70% ethanol, 15 minuts
in 10 mL of 30% bleach plus one drop of triton 100, and 3 washes with sterile water) and put to
germinate into MS 30 medium supplemented with 0.5 mg/L thiamine. 89 Bd-thi1.27 seeds and 53
Bd-thi1.28 seeds were germinated in correspondent antibiotic (50 mg/L of hygromycin and 50
mg/L of geneticin). Then 20 Bd-thi1.27 seeds and 20 Bd-thi1.28 seeds were germinated without
any antibiotics. After germination, the plants were transferred to soil and irrigated with 100 μl of
1% thiamine solution once a week.
CRISPR/Cas mutation analysis
The genomic DNA of the T1 plants germinated was extracted from leaves material by
Invisorb® Spin Plant Mini Kit (Stratec Molecular GMBH). A pair of primers (BdThi1 29F: GCC
TCC TCA AGA CCT CCT TC and BdThi1 618R: GAG CGC CCA GTT GGT GAC) was used
to amplify a 500 bp region, which contains the gRNA target in the middle. The amplification was
done using Phusion® High-Fidelity DNA Polymerase (New England Biolabs, Thermo
Scientific®) and the amplicons were sequenced at the ABI PRIS 3730 DNA ANALYZER
platform (Applied Biosystems™). The sequences quality was checked at the Sequence Scanner
software (Applied Biosystems™) and the presence of CRISPR/Cas9-driven mutation in the
sequence was manually analyzed.
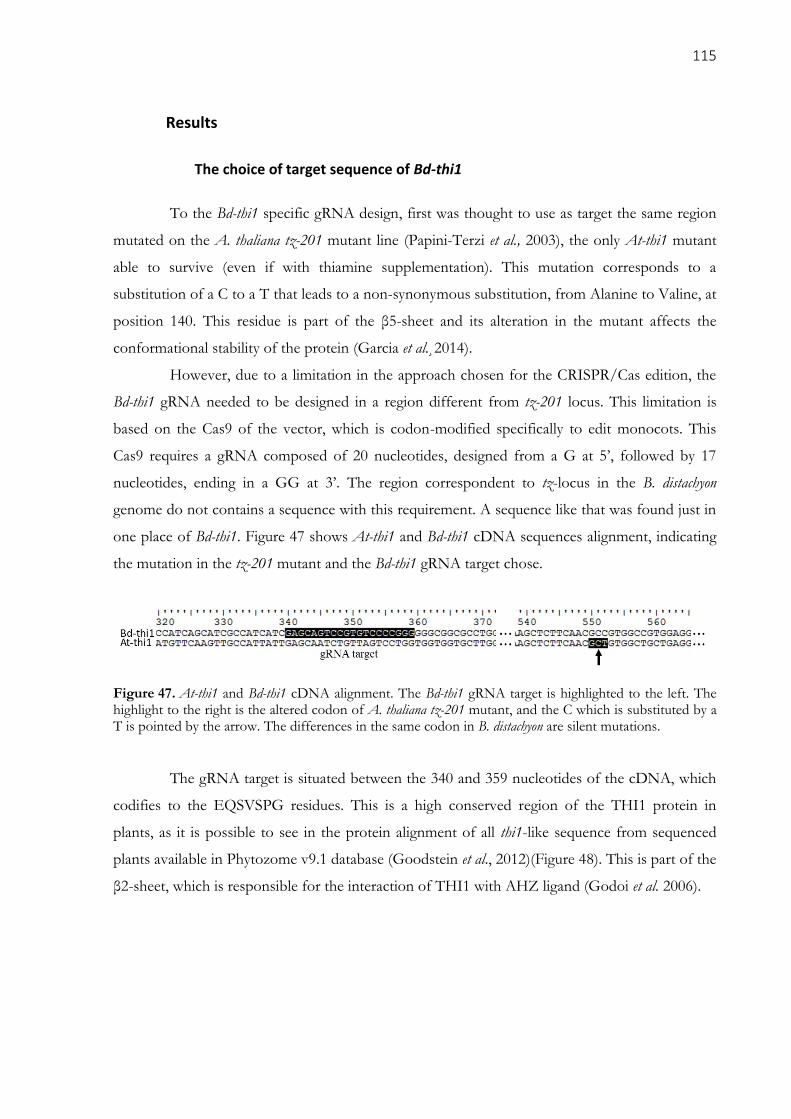
115
Results
The choice of target sequence of Bd-thi1
To the Bd-thi1 specific gRNA design, first was thought to use as target the same region
mutated on the A. thaliana tz-201 mutant line (Papini-Terzi et al., 2003), the only At-thi1 mutant
able to survive (even if with thiamine supplementation). This mutation corresponds to a
substitution of a C to a T that leads to a non-synonymous substitution, from Alanine to Valine, at
position 140. This residue is part of the β5-sheet and its alteration in the mutant affects the
conformational stability of the protein (Garcia et al.¸2014).
However, due to a limitation in the approach chosen for the CRISPR/Cas edition, the
Bd-thi1 gRNA needed to be designed in a region different from tz-201 locus. This limitation is
based on the Cas9 of the vector, which is codon-modified specifically to edit monocots. This
Cas9 requires a gRNA composed of 20 nucleotides, designed from a G at 5’, followed by 17
nucleotides, ending in a GG at 3’. The region correspondent to tz-locus in the B. distachyon
genome do not contains a sequence with this requirement. A sequence like that was found just in
one place of Bd-thi1. Figure 47 shows At-thi1 and Bd-thi1 cDNA sequences alignment, indicating
the mutation in the tz-201 mutant and the Bd-thi1 gRNA target chose.
Figure 47. At-thi1 and Bd-thi1 cDNA alignment. The Bd-thi1 gRNA target is highlighted to the left. The highlight to the right is the altered codon of A. thaliana tz-201 mutant, and the C which is substituted by a T is pointed by the arrow. The differences in the same codon in B. distachyon are silent mutations.
The gRNA target is situated between the 340 and 359 nucleotides of the cDNA, which
codifies to the EQSVSPG residues. This is a high conserved region of the THI1 protein in
plants, as it is possible to see in the protein alignment of all thi1-like sequence from sequenced
plants available in Phytozome v9.1 database (Goodstein et al., 2012)(Figure 48). This is part of the
β2-sheet, which is responsible for the interaction of THI1 with AHZ ligand (Godoi et al. 2006).
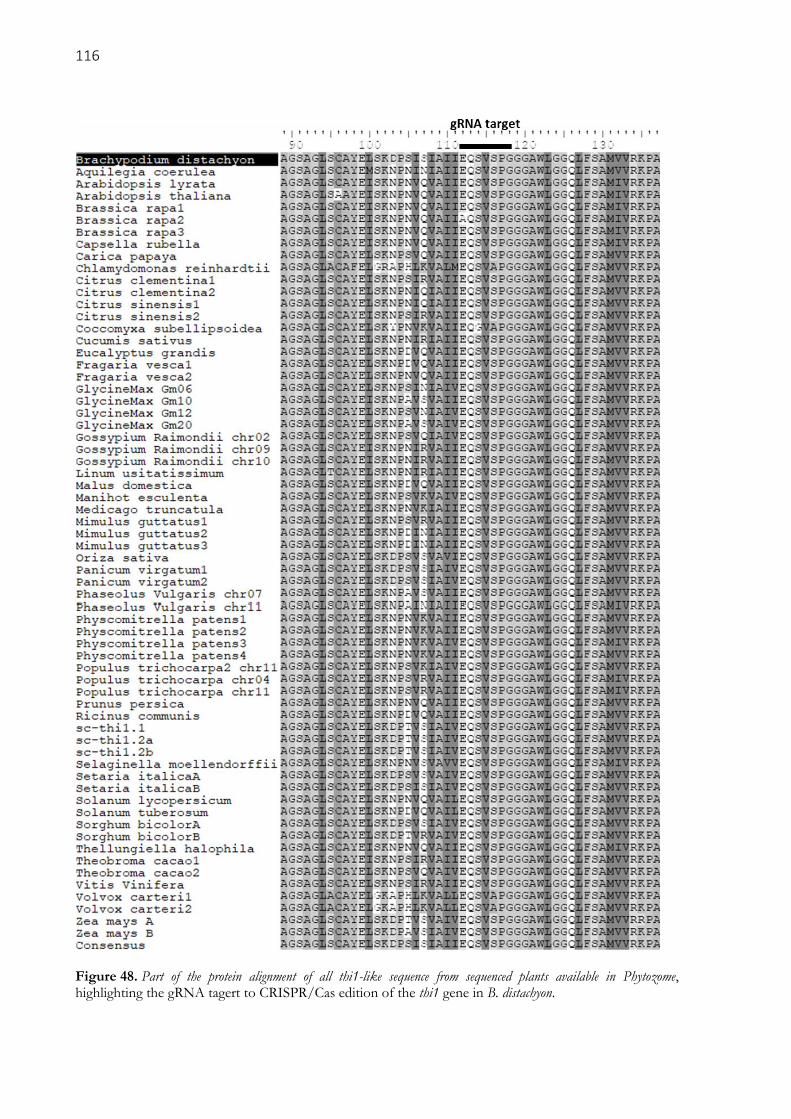
116
Figure 48. Part of the protein alignment of all thi1-like sequence from sequenced plants available in Phytozome, highlighting the gRNA tagert to CRISPR/Cas edition of the thi1 gene in B. distachyon.
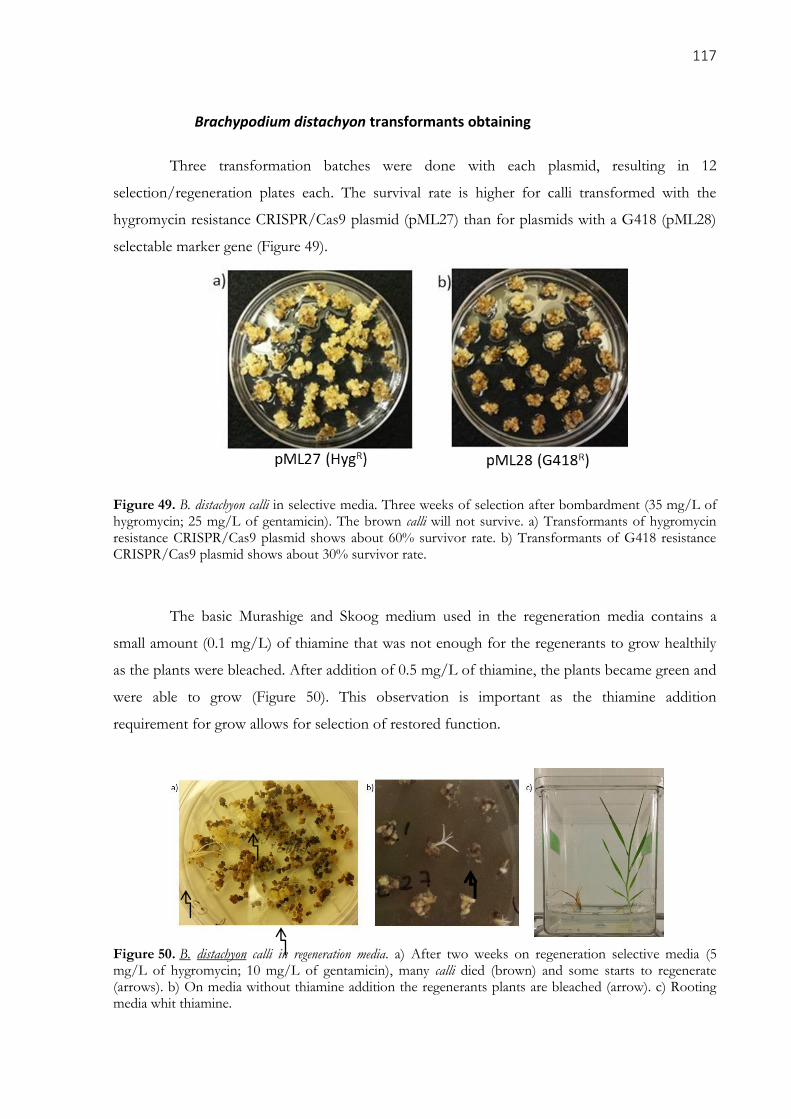
117
Brachypodium distachyon transformants obtaining
Three transformation batches were done with each plasmid, resulting in 12
selection/regeneration plates each. The survival rate is higher for calli transformed with the
hygromycin resistance CRISPR/Cas9 plasmid (pML27) than for plasmids with a G418 (pML28)
selectable marker gene (Figure 49).
Figure 49. B. distachyon calli in selective media. Three weeks of selection after bombardment (35 mg/L of hygromycin; 25 mg/L of gentamicin). The brown calli will not survive. a) Transformants of hygromycin resistance CRISPR/Cas9 plasmid shows about 60% survivor rate. b) Transformants of G418 resistance CRISPR/Cas9 plasmid shows about 30% survivor rate.
The basic Murashige and Skoog medium used in the regeneration media contains a
small amount (0.1 mg/L) of thiamine that was not enough for the regenerants to grow healthily
as the plants were bleached. After addition of 0.5 mg/L of thiamine, the plants became green and
were able to grow (Figure 50). This observation is important as the thiamine addition
requirement for grow allows for selection of restored function.
Figure 50. B. distachyon calli in regeneration media. a) After two weeks on regeneration selective media (5 mg/L of hygromycin; 10 mg/L of gentamicin), many calli died (brown) and some starts to regenerate (arrows). b) On media without thiamine addition the regenerants plants are bleached (arrow). c) Rooting media whit thiamine.
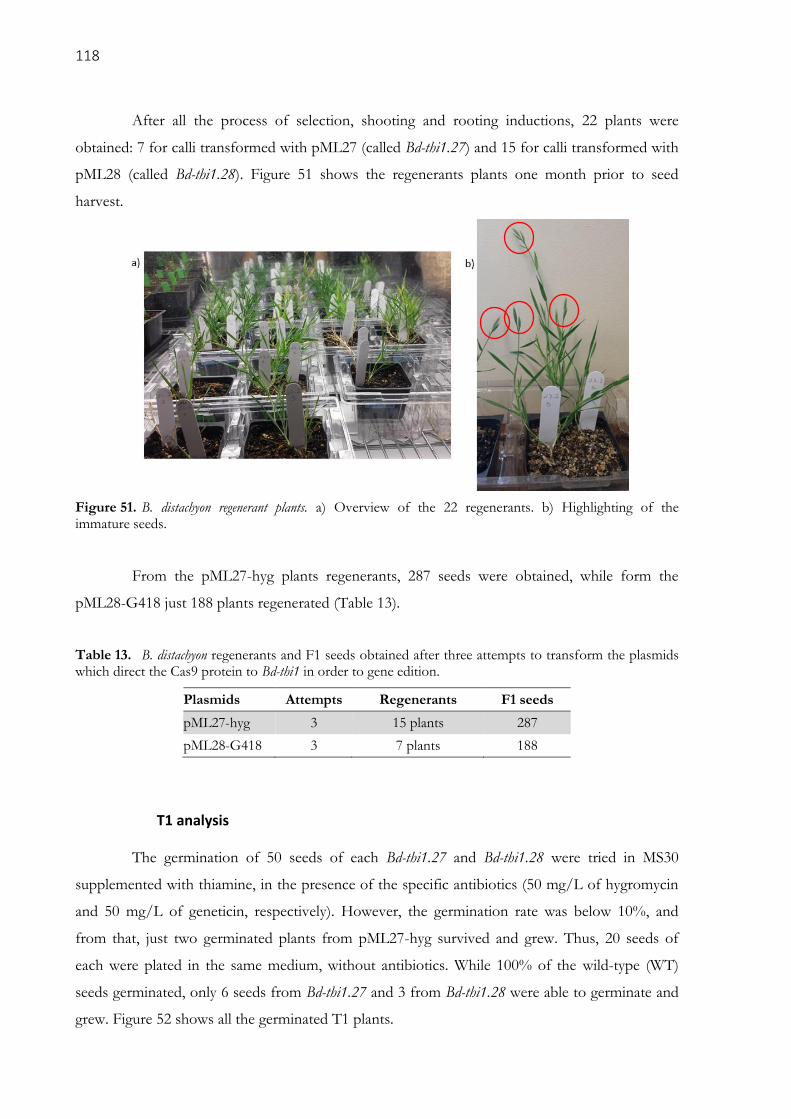
118
After all the process of selection, shooting and rooting inductions, 22 plants were
obtained: 7 for calli transformed with pML27 (called Bd-thi1.27) and 15 for calli transformed with
pML28 (called Bd-thi1.28). Figure 51 shows the regenerants plants one month prior to seed
harvest.
Figure 51. B. distachyon regenerant plants. a) Overview of the 22 regenerants. b) Highlighting of the immature seeds.
From the pML27-hyg plants regenerants, 287 seeds were obtained, while form the
pML28-G418 just 188 plants regenerated (Table 13).
Table 13. B. distachyon regenerants and F1 seeds obtained after three attempts to transform the plasmids which direct the Cas9 protein to Bd-thi1 in order to gene edition.
Plasmids Attempts Regenerants F1 seeds
pML27-hyg 3 15 plants 287
pML28-G418 3 7 plants 188
T1 analysis
The germination of 50 seeds of each Bd-thi1.27 and Bd-thi1.28 were tried in MS30
supplemented with thiamine, in the presence of the specific antibiotics (50 mg/L of hygromycin
and 50 mg/L of geneticin, respectively). However, the germination rate was below 10%, and
from that, just two germinated plants from pML27-hyg survived and grew. Thus, 20 seeds of
each were plated in the same medium, without antibiotics. While 100% of the wild-type (WT)
seeds germinated, only 6 seeds from Bd-thi1.27 and 3 from Bd-thi1.28 were able to germinate and
grew. Figure 52 shows all the germinated T1 plants.
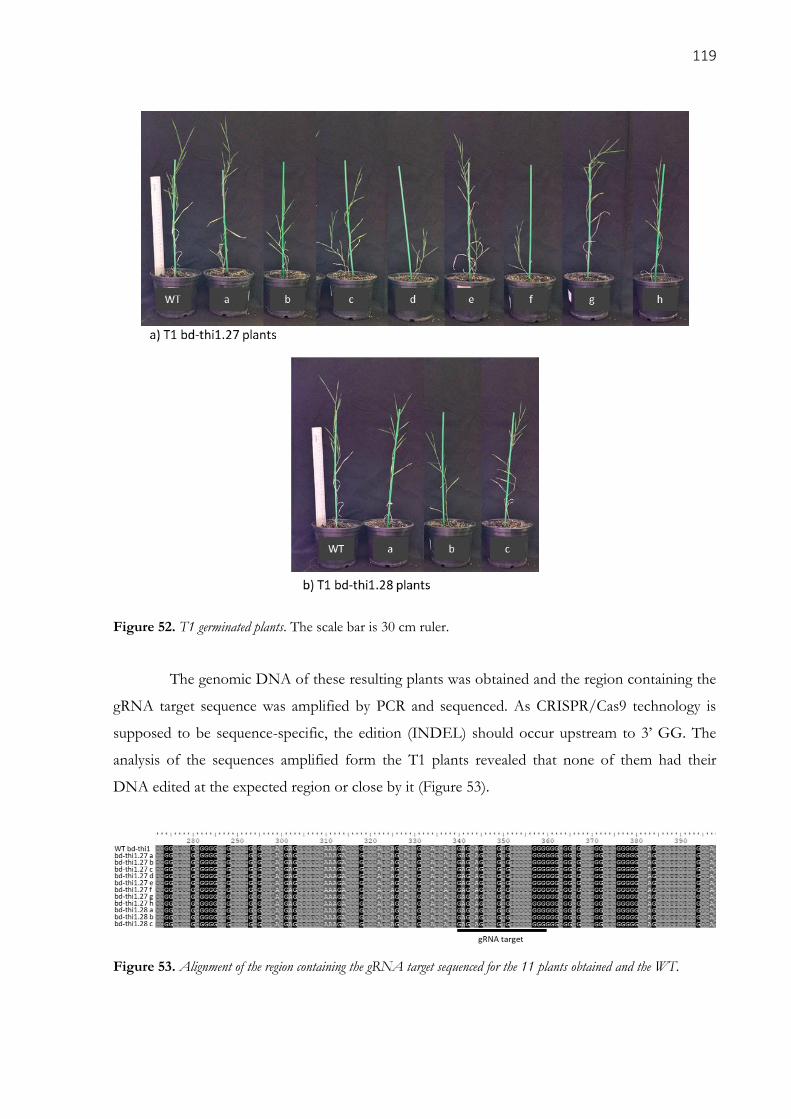
119
Figure 52. T1 germinated plants. The scale bar is 30 cm ruler.
The genomic DNA of these resulting plants was obtained and the region containing the
gRNA target sequence was amplified by PCR and sequenced. As CRISPR/Cas9 technology is
supposed to be sequence-specific, the edition (INDEL) should occur upstream to 3’ GG. The
analysis of the sequences amplified form the T1 plants revealed that none of them had their
DNA edited at the expected region or close by it (Figure 53).
Figure 53. Alignment of the region containing the gRNA target sequenced for the 11 plants obtained and the WT.
120
Discussion
The selection of calli in medium containing antibiotics indicates that the plasmid was
integrated in the cells genome. The absence of gene edition in the plants obtained can be
explained by two situations:
1 – The plasmids do not work: the construction is not able to target properly the Cas9
to the gene target; the Cas9 codon modified is not compatible with B. distachyon; the whole system
does not work in B. distachyon.
2 – The gene edition occurs but interferes in the plant regeneration/survival/seed
germination: this hypothesis is based on the observation that the tz-201 is the only mutant of A.
thaliana for the thi1 gene known to date. Probably because other mutations in the At-thi1 are
defective to the plant.

121
REFERENCES
Draper, J. et al. (2001) ‘Brachypodium distachyon. A New Model System for Functional Genomics in
Grasses’, Plant physiology, 127(4), pp. 1539–1555.
Garcia, A. F. et al. (2014) ‘THI1, a protein involved in the biosynthesis of thiamin in Arabidopsis
thaliana: Structural analysis of THI1(A140V) mutant’, Biochimica et Biophysica Acta (BBA) - Proteins
and Proteomics, 1844(6), pp. 1094–1103.
Godoi, P. H. C. et al. (2006) ‘Structure of the Thiazole Biosynthetic Enzyme THI1 from Arabidopsis
thaliana’, Journal of Biological Chemistry, 281(41), pp. 30957–30966.
Goodstein, D. M. et al. (2012) ‘Phytozome: a comparative platform for green plant genomics’, Nucleic
Acids Research, 40(D1), pp. D1178–D1186.
Horvath, P. and Barrangou, R. (2010) ‘CRISPR/Cas, the immune system of Bacteria and Archaea’,
Science, 327(5962), pp. 167–170.
Murashige, T. and Skoog, F. (1962) ‘A Revised Medium for Rapid Growth and Bio Assays with
Tobacco Tissue Cultures’, Physiologia Plantarum, 15(3), pp. 473–497.
Papini-Terzi, F. S. et al. (2003) ‘Point mutation is responsible for Arabidopsis tz-201 mutant phenotype
affecting thiamin biosynthesis’, Plant & cell physiology, 44(8), pp. 856–60.
The International Brachypodium Initiative (2010) ‘Genome sequencing and analysis of the model grass
Brachypodium distachyon’, Nature, 463, 763-768.
Xie K, Zhang J, Yang Y. (2014) ‘Genome-wide prediction of highly specific guideRNA spacers for
CRISPR–Cas9-mediated genome editing in model plants and major crops’, Mol. Plant., 7:923–926.


![Aunts and uncles (3)[1] sound](https://img.pdfslide.us/doc/110x75/558bfb48d8b42a1f3c8b46ec/aunts-and-uncles-31-sound.jpg)