Embed Size (px)
Citation preview
University of Salerno
Synthesis and characterization of (photo)catalysts for water/wastewater treatment
applications
Department of Industrial engineering
PhD Vincenzo Vaiano
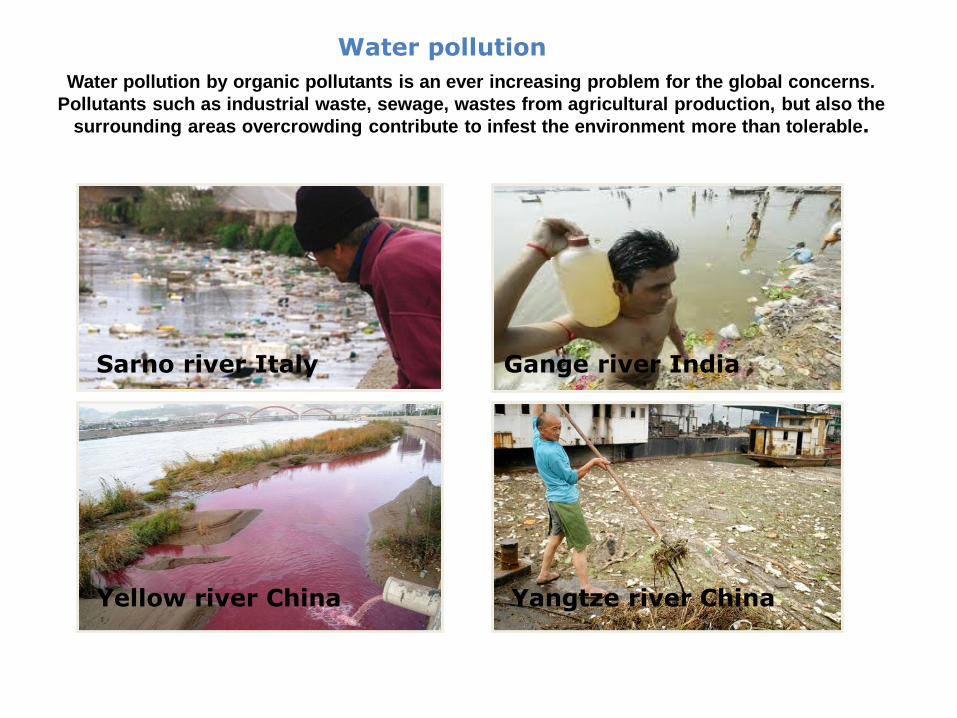
Water pollution by organic pollutants is an ever increasing problem for the global concerns.
Pollutants such as industrial waste, sewage, wastes from agricultural production, but also the
surrounding areas overcrowding contribute to infest the environment more than tolerable.
Sarno river Italy
Yellow river China Yangtze river China
Gange river India
Water pollution

COMMERCIAL TECNOLOGIES FOR
WASTEWATER TREATMENT
• Biological oxidation: not able to remove bio-recalcitrant compounds
• Chemical oxidation: extended treatment times and unpleasant taste
• Physical filtration: costly pumping, need to replace filters • Ultraviolet disinfection: expensive parts
WHY PHOTOCATALYSIS ? • The oxidant is atmospheric oxygen • No consumption of expensive oxidizing chemicals • No production of sludge
• The photocatalytic reaction may be driven by sunlight
• Able to the mineralization of the majority of organic pollutants
• Able to remove emerging contaminants and bacteria
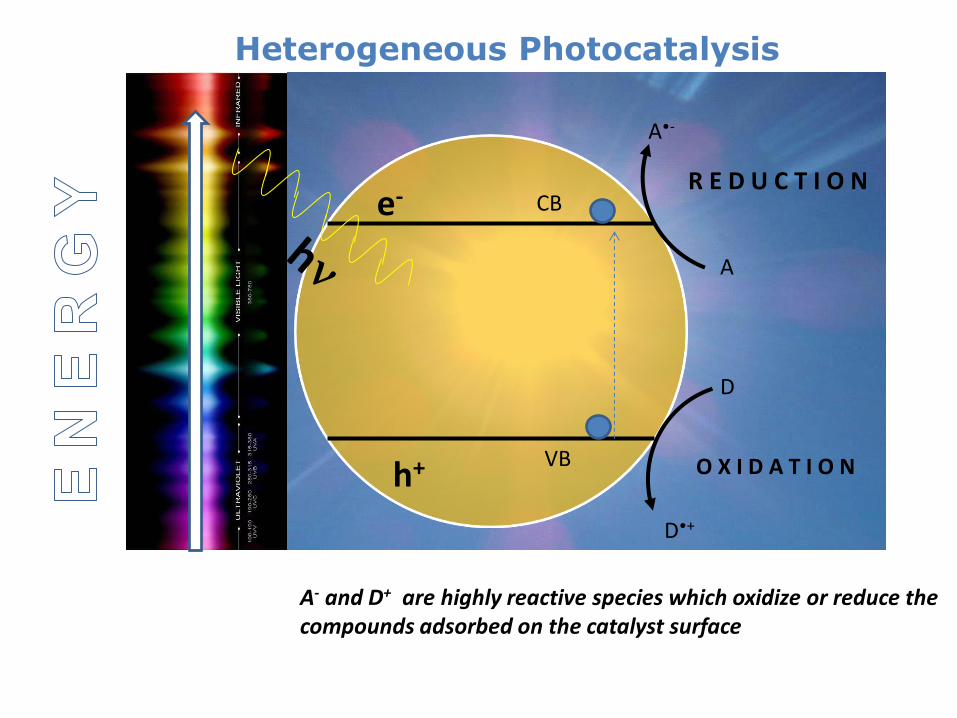
e-
h+
CB
VB
D
A
A•-
D•+
O X I D A T I O N
R E D U C T I O N
Heterogeneous Photocatalysis
A- and D+ are highly reactive species which oxidize or reduce the compounds adsorbed on the catalyst surface
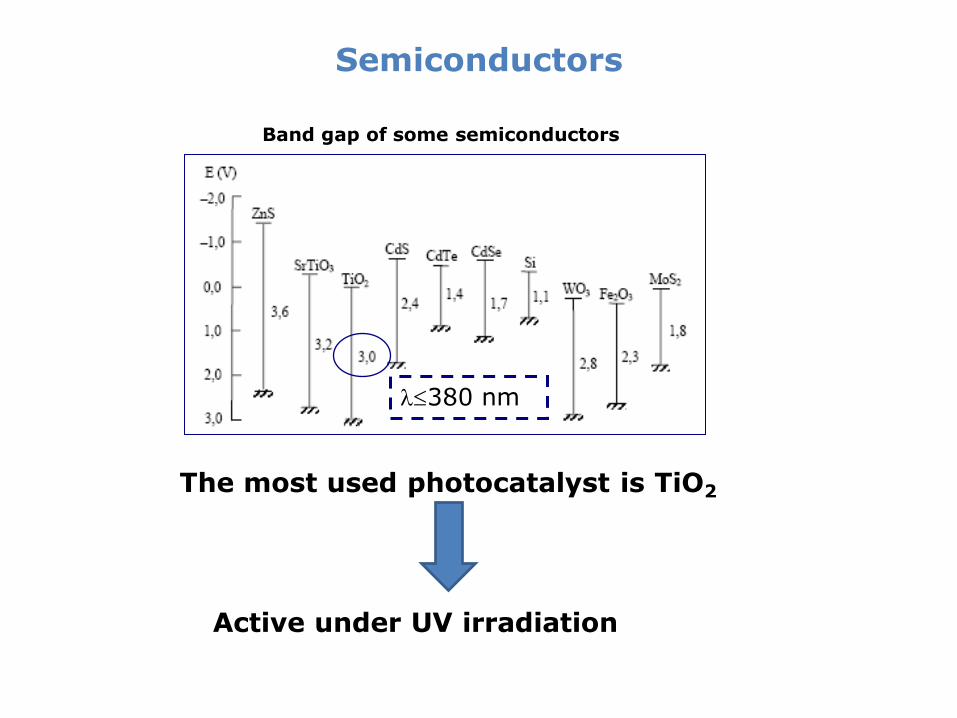
Semiconductors
Band gap of some semiconductors
380 nm
The most used photocatalyst is TiO2
Active under UV irradiation
TiO2 preparation methods
• Sol–gel processes
• Thermal plasma synthesis
• Flame aerosol synthesis
• Spray Pyrolysis
• Hydrothermal synthesis
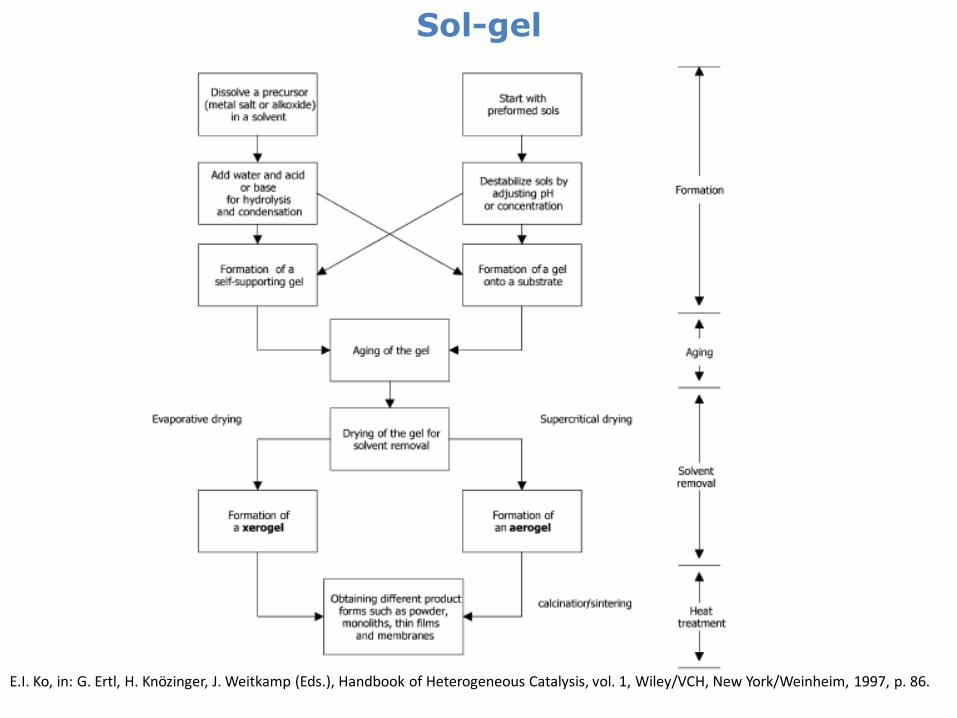
Sol-gel
E.I. Ko, in: G. Ertl, H. Knözinger, J. Weitkamp (Eds.), Handbook of Heterogeneous Catalysis, vol. 1, Wiley/VCH, New York/Weinheim, 1997, p. 86.
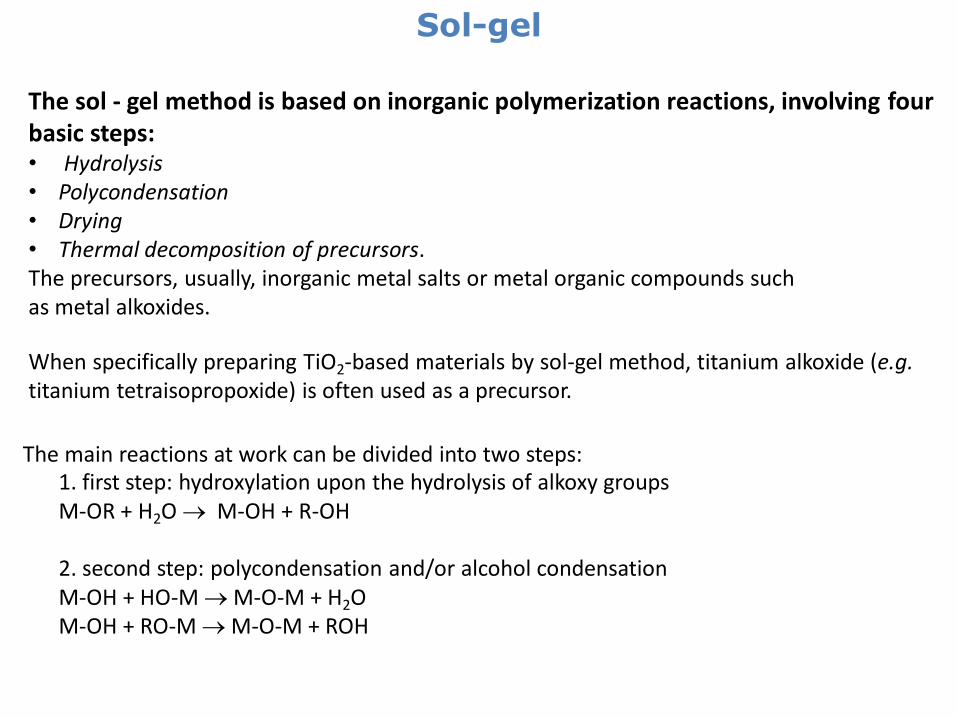
Sol-gel
When specifically preparing TiO2-based materials by sol-gel method, titanium alkoxide (e.g. titanium tetraisopropoxide) is often used as a precursor.
The sol - gel method is based on inorganic polymerization reactions, involving four basic steps: • Hydrolysis • Polycondensation • Drying • Thermal decomposition of precursors. The precursors, usually, inorganic metal salts or metal organic compounds such as metal alkoxides.
The main reactions at work can be divided into two steps: 1. first step: hydroxylation upon the hydrolysis of alkoxy groups M-OR + H2O M-OH + R-OH 2. second step: polycondensation and/or alcohol condensation M-OH + HO-M M-O-M + H2O M-OH + RO-M M-O-M + ROH
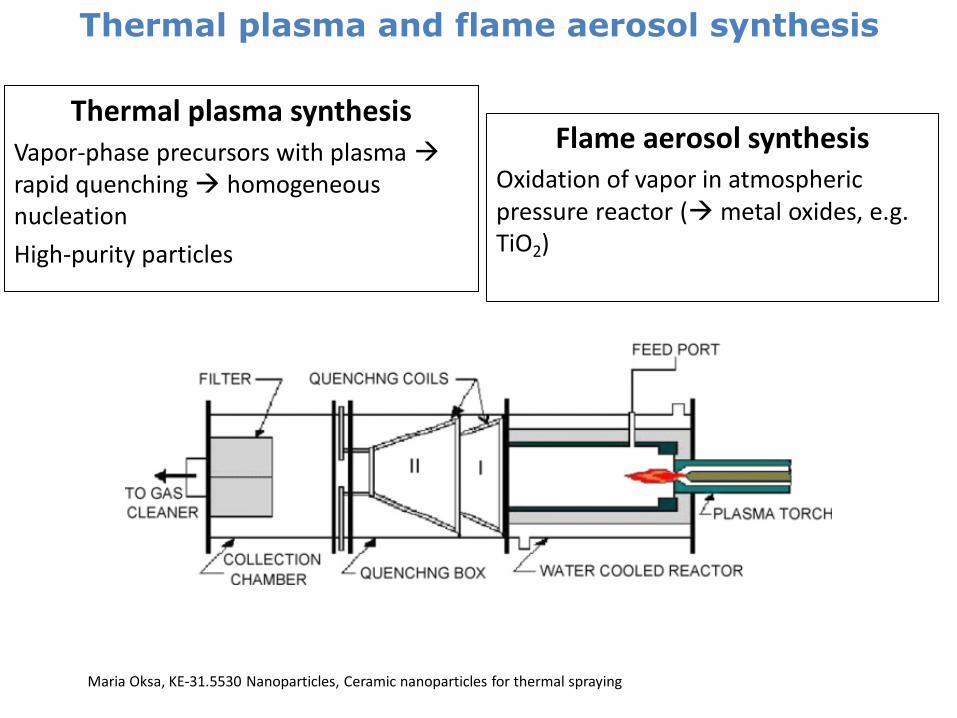
Thermal plasma and flame aerosol synthesis
Maria Oksa, KE-31.5530 Nanoparticles, Ceramic nanoparticles for thermal spraying
Flame aerosol synthesis Oxidation of vapor in atmospheric pressure reactor ( metal oxides, e.g. TiO2)
Thermal plasma synthesis Vapor-phase precursors with plasma rapid quenching homogeneous nucleation
High-purity particles
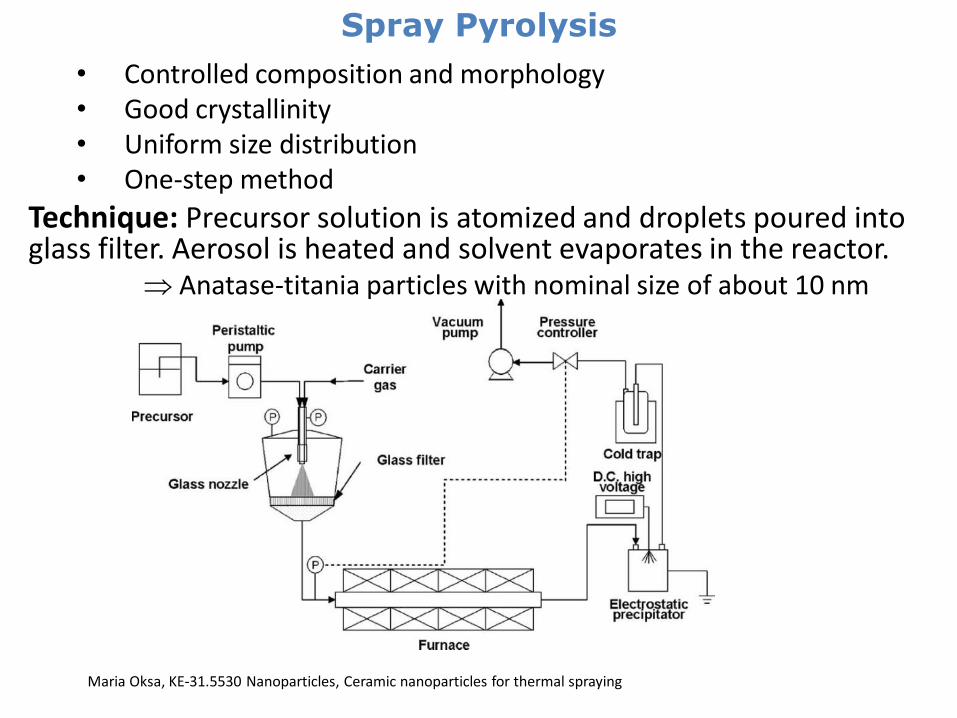
Spray Pyrolysis
Maria Oksa, KE-31.5530 Nanoparticles, Ceramic nanoparticles for thermal spraying
• Controlled composition and morphology • Good crystallinity • Uniform size distribution • One-step method
Technique: Precursor solution is atomized and droplets poured into glass filter. Aerosol is heated and solvent evaporates in the reactor.
Anatase-titania particles with nominal size of about 10 nm
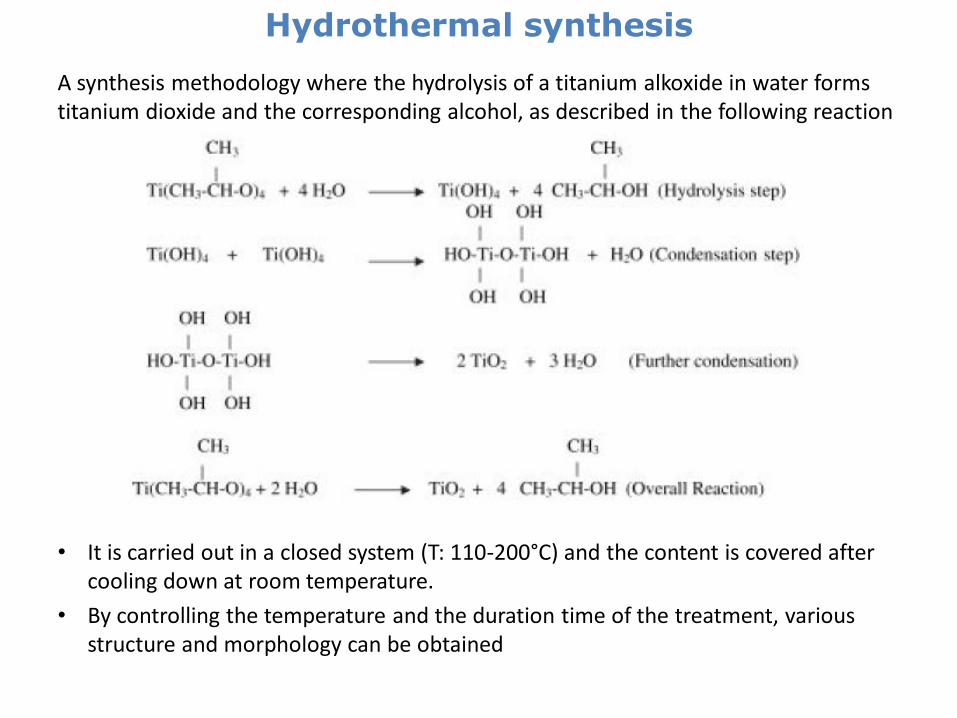
Hydrothermal synthesis
A synthesis methodology where the hydrolysis of a titanium alkoxide in water forms titanium dioxide and the corresponding alcohol, as described in the following reaction
• It is carried out in a closed system (T: 110-200°C) and the content is covered after cooling down at room temperature.
• By controlling the temperature and the duration time of the treatment, various structure and morphology can be obtained
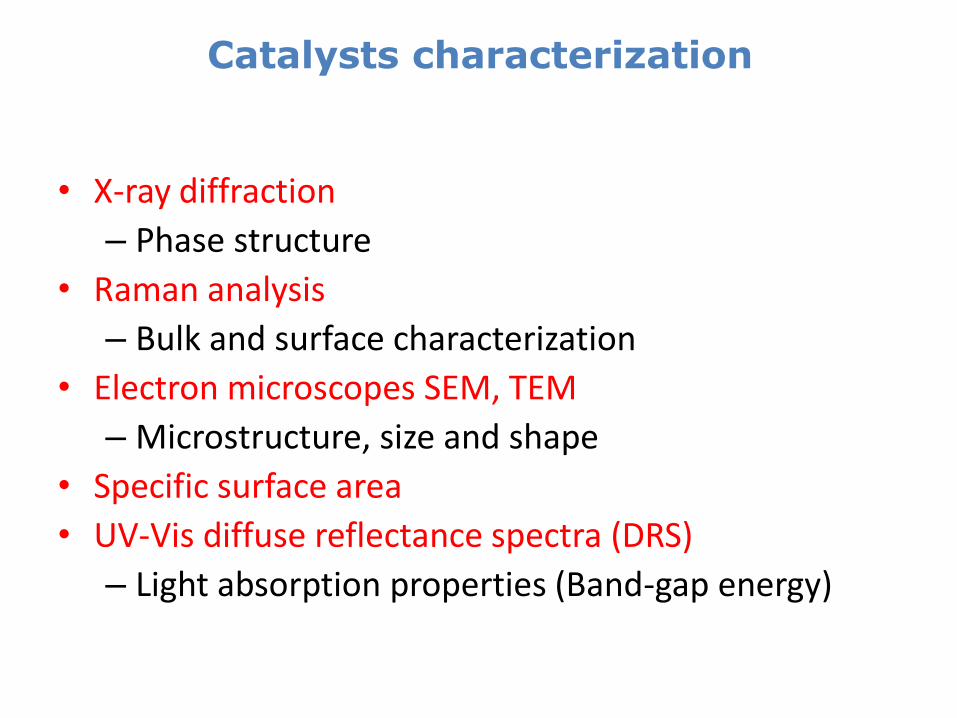
Catalysts characterization
• X-ray diffraction
– Phase structure
• Raman analysis
– Bulk and surface characterization
• Electron microscopes SEM, TEM
– Microstructure, size and shape
• Specific surface area
• UV-Vis diffuse reflectance spectra (DRS)
– Light absorption properties (Band-gap energy)
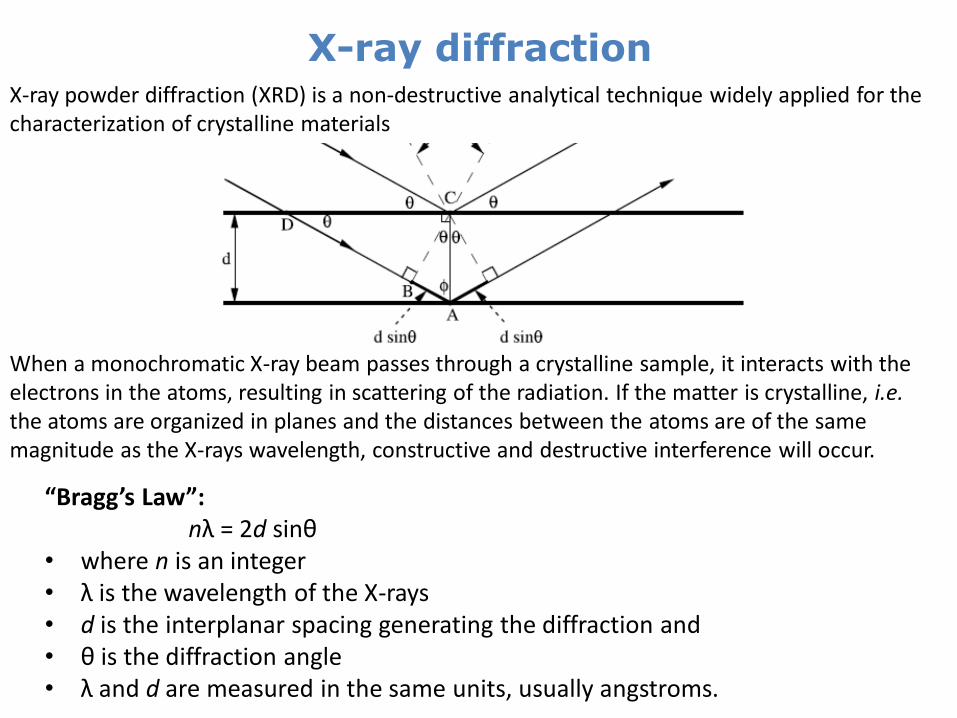
X-ray diffraction X-ray powder diffraction (XRD) is a non-destructive analytical technique widely applied for the characterization of crystalline materials
When a monochromatic X-ray beam passes through a crystalline sample, it interacts with the electrons in the atoms, resulting in scattering of the radiation. If the matter is crystalline, i.e. the atoms are organized in planes and the distances between the atoms are of the same magnitude as the X-rays wavelength, constructive and destructive interference will occur.
“Bragg’s Law”: nλ = 2d sinθ • where n is an integer • λ is the wavelength of the X-rays • d is the interplanar spacing generating the diffraction and • θ is the diffraction angle • λ and d are measured in the same units, usually angstroms.
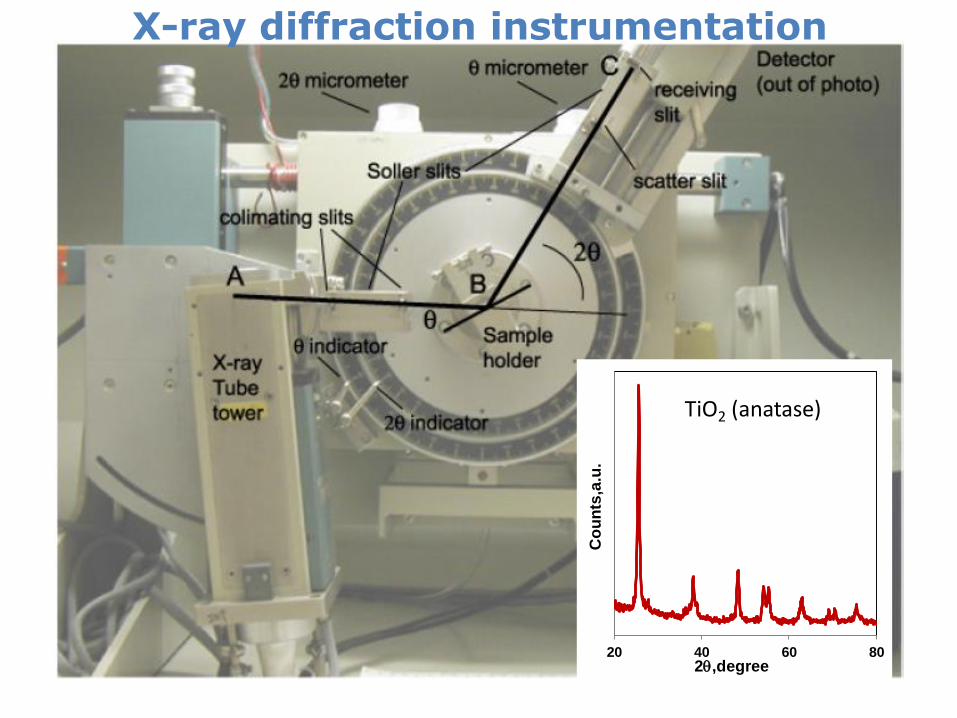
X-ray diffraction instrumentation
20 40 60 80
Co
un
ts,a
.u.
2q,degree
TiO2 (anatase)
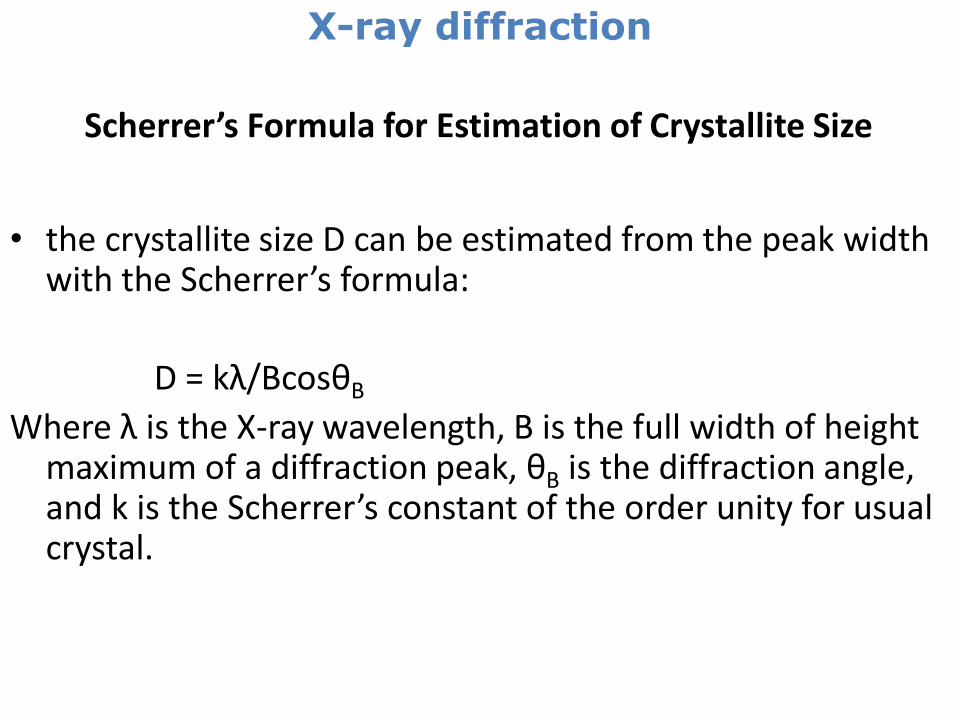
Scherrer’s Formula for Estimation of Crystallite Size
• the crystallite size D can be estimated from the peak width with the Scherrer’s formula:
D = kλ/BcosθB
Where λ is the X-ray wavelength, B is the full width of height maximum of a diffraction peak, θB is the diffraction angle, and k is the Scherrer’s constant of the order unity for usual crystal.
X-ray diffraction
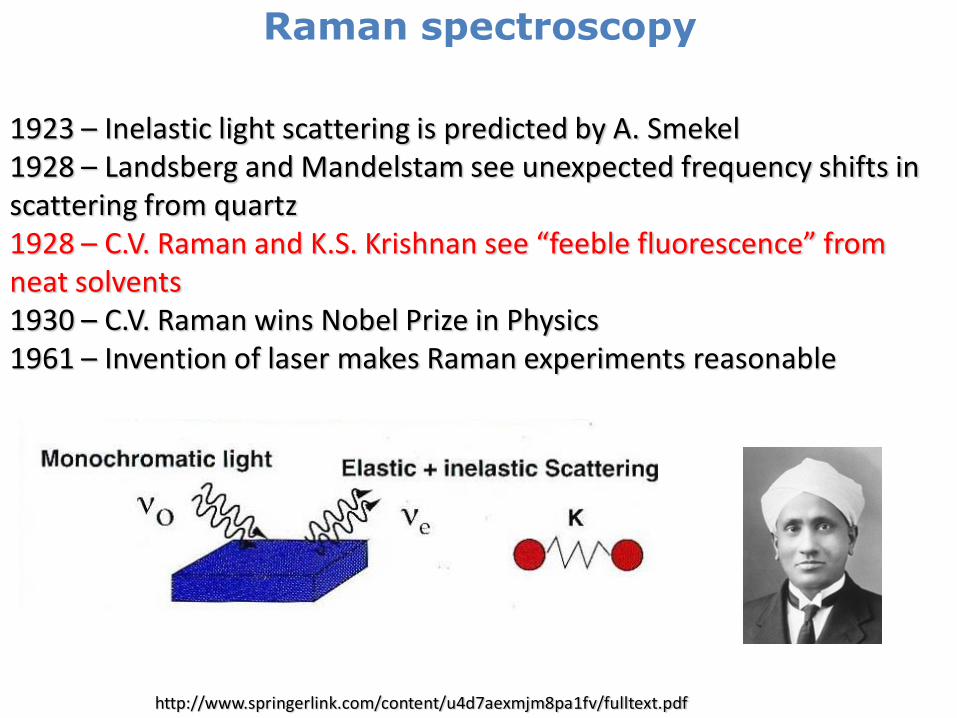
Raman spectroscopy
1923 – Inelastic light scattering is predicted by A. Smekel 1928 – Landsberg and Mandelstam see unexpected frequency shifts in scattering from quartz 1928 – C.V. Raman and K.S. Krishnan see “feeble fluorescence” from neat solvents 1930 – C.V. Raman wins Nobel Prize in Physics 1961 – Invention of laser makes Raman experiments reasonable
http://www.springerlink.com/content/u4d7aexmjm8pa1fv/fulltext.pdf

Raman spectroscopy
Raman spectroscopy is a technique for the identification and quantification of the chemical components of a sample.
When light is scattered by any form of matter, the energies of the majority of the photons are unchanged by the process, which is elastic or Rayleigh scattering. However, about one in one million photons or less, lose or gain energy that corresponds to the vibrational frequencies of the scattering molecules. This can be observed as additional peaks in the scattered light spectrum. The process is known as Raman scattering and the spectral peaks with lower and higher energy than the incident light are known as Stokes and anti-Stokes peaks respectively.
http://www.springerlink.com/content/u4d7aexmjm8pa1fv/fulltext.pdf
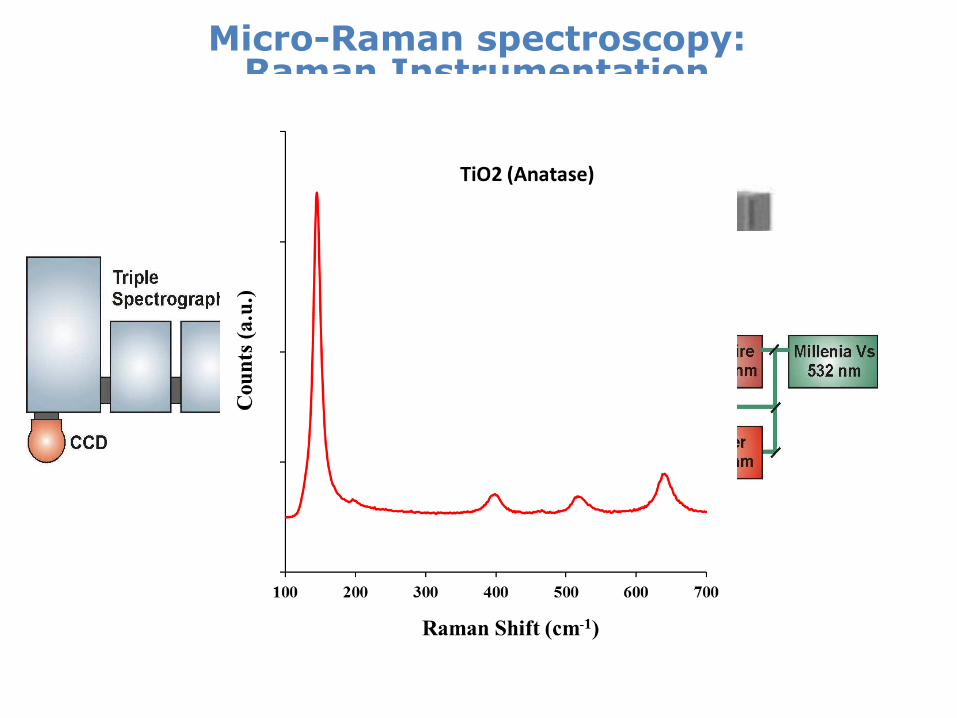
Micro-Raman spectroscopy: Raman Instrumentation
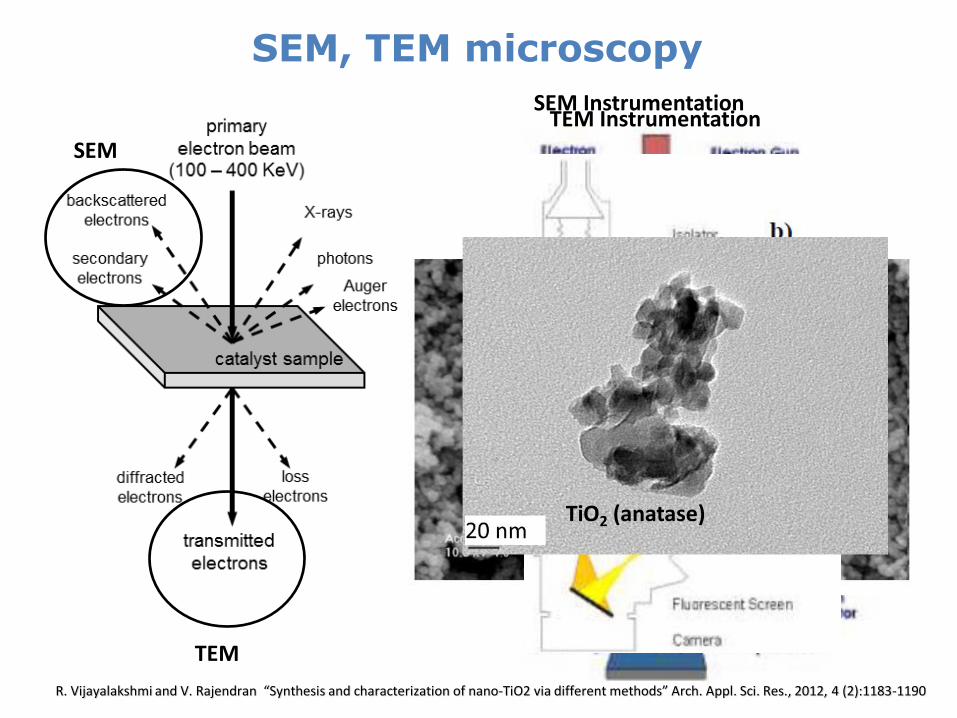
SEM, TEM microscopy
SEM
TEM
SEM Instrumentation
SEM TiO2 (anatase)
R. Vijayalakshmi and V. Rajendran “Synthesis and characterization of nano-TiO2 via different methods” Arch. Appl. Sci. Res., 2012, 4 (2):1183-1190
TEM Instrumentation
TiO2 (anatase)
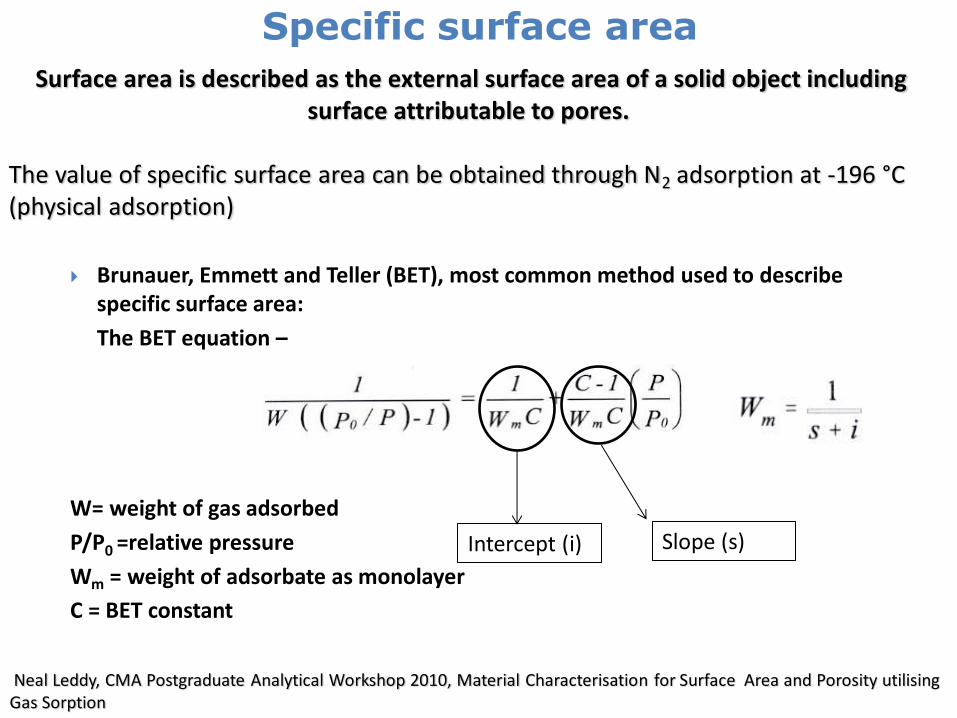
Specific surface area
Surface area is described as the external surface area of a solid object including surface attributable to pores.
The value of specific surface area can be obtained through N2 adsorption at -196 °C (physical adsorption)
Neal Leddy, CMA Postgraduate Analytical Workshop 2010, Material Characterisation for Surface Area and Porosity utilising Gas Sorption
Brunauer, Emmett and Teller (BET), most common method used to describe specific surface area:
The BET equation –
W= weight of gas adsorbed
P/P0 =relative pressure
Wm = weight of adsorbate as monolayer
C = BET constant
Intercept (i) Slope (s)
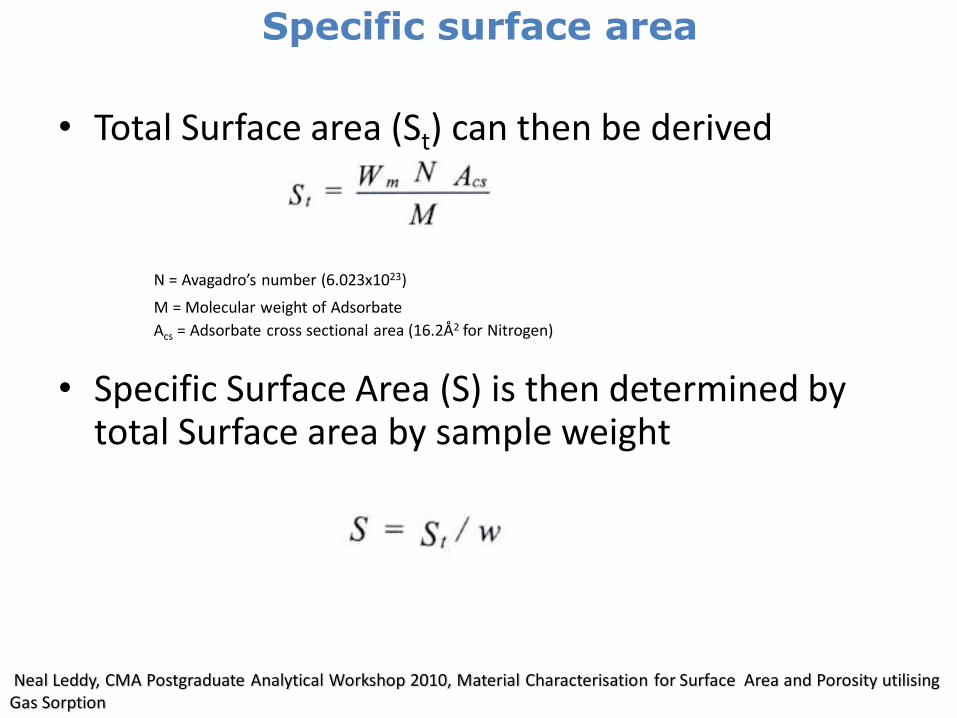
Specific surface area
Neal Leddy, CMA Postgraduate Analytical Workshop 2010, Material Characterisation for Surface Area and Porosity utilising Gas Sorption
• Total Surface area (St) can then be derived
N = Avagadro’s number (6.023x10²³)
M = Molecular weight of Adsorbate
Acs = Adsorbate cross sectional area (16.2Å2 for Nitrogen)
• Specific Surface Area (S) is then determined by total Surface area by sample weight
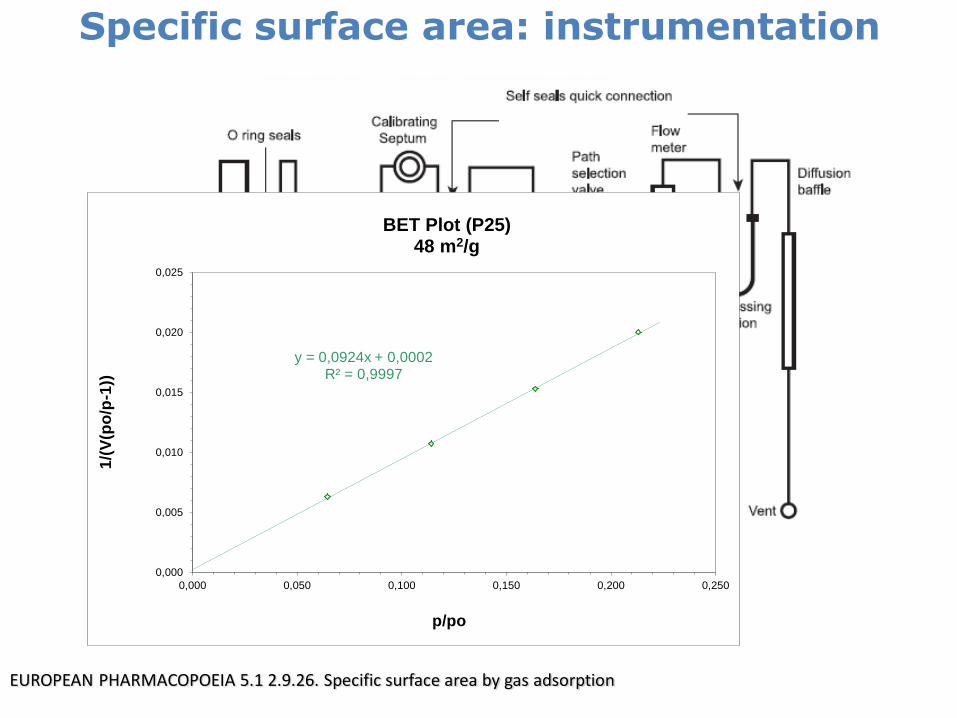
Specific surface area: instrumentation
EUROPEAN PHARMACOPOEIA 5.1 2.9.26. Specific surface area by gas adsorption
y = 0,0924x + 0,0002 R² = 0,9997
0,000
0,005
0,010
0,015
0,020
0,025
0,000 0,050 0,100 0,150 0,200 0,250
1/(
V(p
o/p
-1))
p/po
BET Plot (P25) 48 m2/g
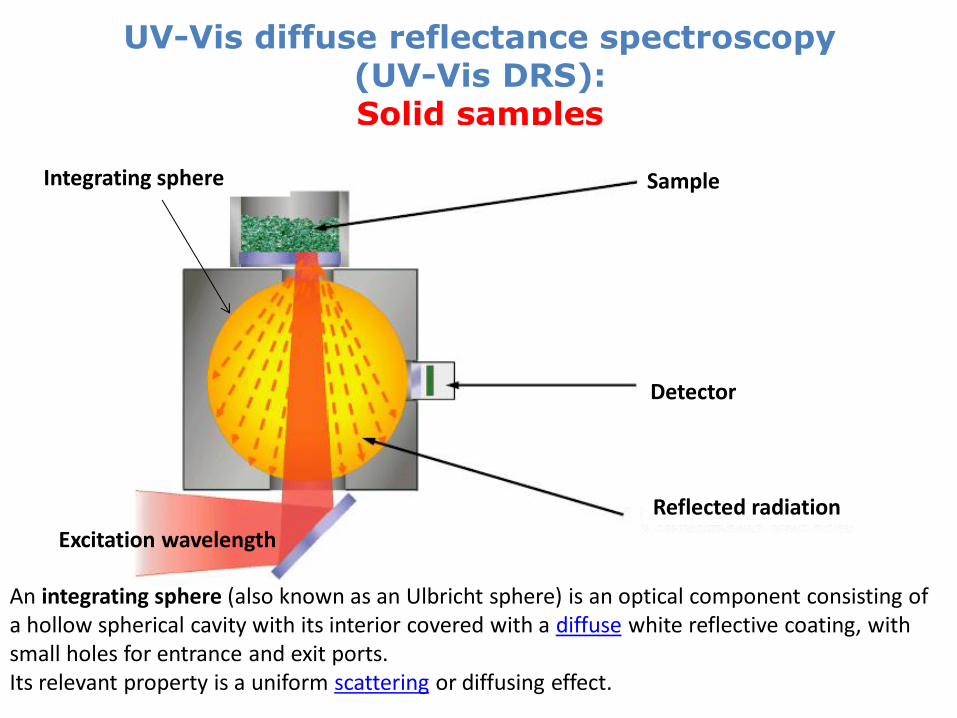
UV-Vis diffuse reflectance spectroscopy (UV-Vis DRS): Solid samples
Sample
Detector
Reflected radiation
An integrating sphere (also known as an Ulbricht sphere) is an optical component consisting of a hollow spherical cavity with its interior covered with a diffuse white reflective coating, with small holes for entrance and exit ports. Its relevant property is a uniform scattering or diffusing effect.
Integrating sphere
Excitation wavelength
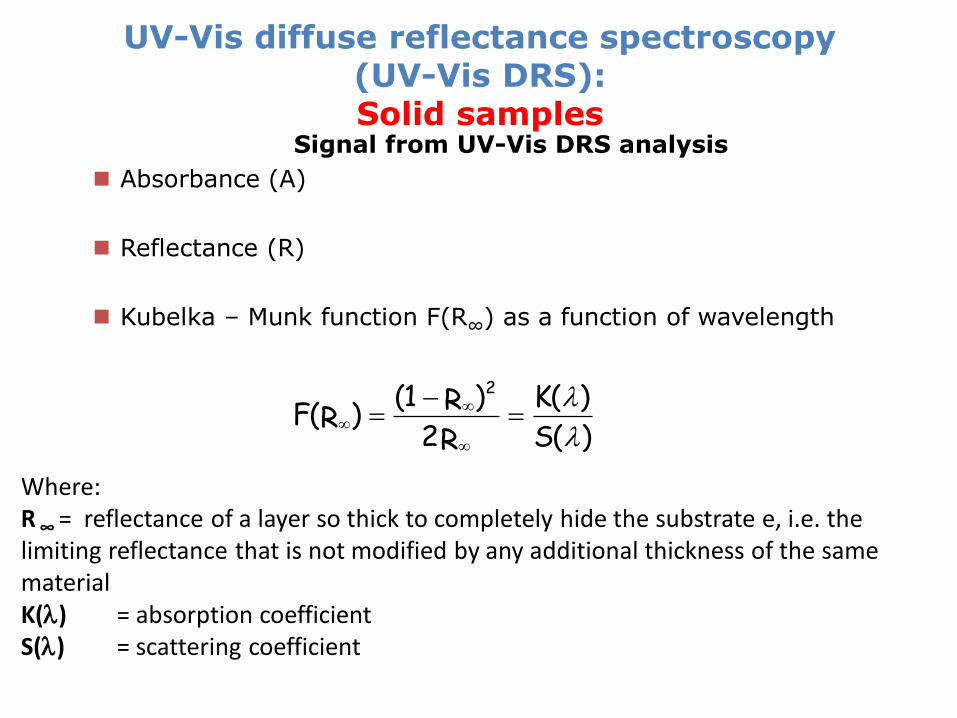
UV-Vis diffuse reflectance spectroscopy (UV-Vis DRS): Solid samples
Signal from UV-Vis DRS analysis
Absorbance (A)
Reflectance (R)
Kubelka – Munk function F(R∞) as a function of wavelength
)S(
)K(
R2
)R(1)RF(
2
Where: R ∞ = reflectance of a layer so thick to completely hide the substrate e, i.e. the limiting reflectance that is not modified by any additional thickness of the same material K() = absorption coefficient S() = scattering coefficient
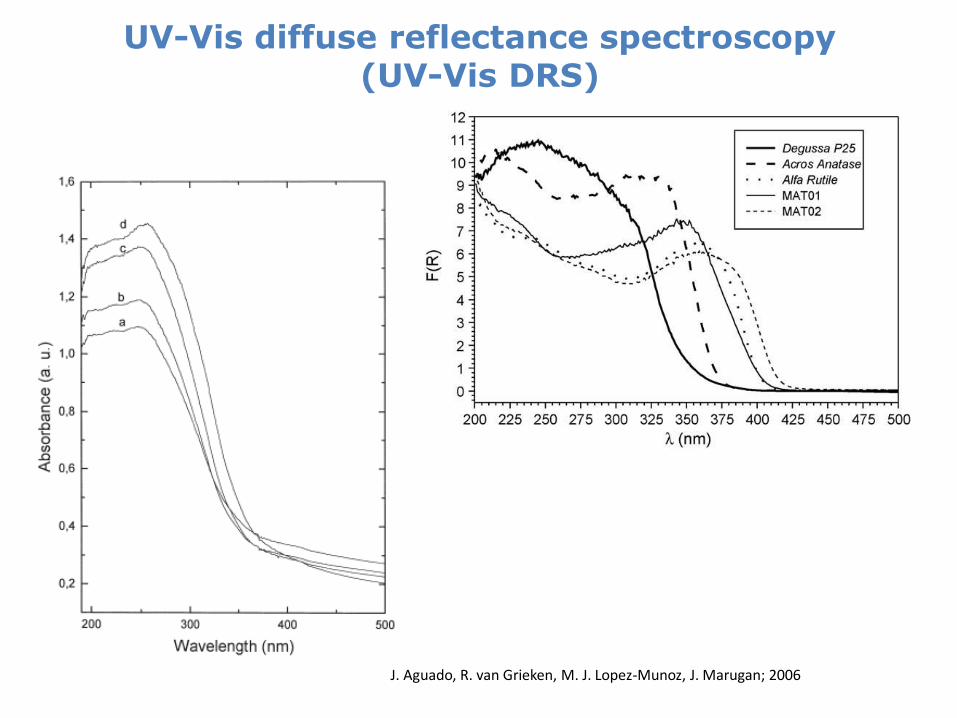
UV-Vis diffuse reflectance spectroscopy (UV-Vis DRS)
J. Aguado, R. van Grieken, M. J. Lopez-Munoz, J. Marugan; 2006
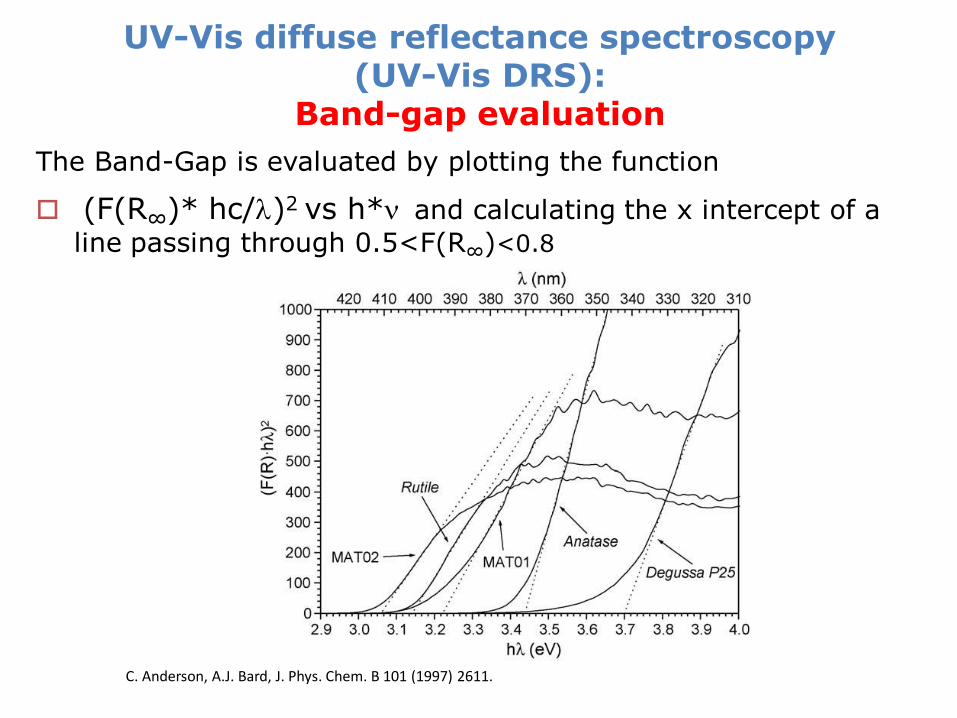
UV-Vis diffuse reflectance spectroscopy (UV-Vis DRS):
Band-gap evaluation The Band-Gap is evaluated by plotting the function
(F(R∞)* hc/)2 vs h*n and calculating the x intercept of a
line passing through 0.5<F(R∞)<0.8
C. Anderson, A.J. Bard, J. Phys. Chem. B 101 (1997) 2611.
Example 1: Sol-gel synthesis of N-doped TiO2
photocatalysts
1. Sacco, O., Stoller, M., Vaiano, V., Ciambelli, P., Chianese, A., and Sannino, D. (2012). "Photocatalytic degradation of organic dyes under visible light on N-doped TiO2 photocatalysts." International Journal of Photoenergy, Volume 2012, Article ID 626759, 8 pages, doi:10.1155/2012/626759. 2. Rizzo, L., Sannino, D., Vaiano, V., Sacco, O., Scarpa, A., and Pietrogiacomi, D. (2014). "Effect of solar simulated N-doped TiO2 photocatalysis on the inactivation and antibiotic resistance of an E. coli strain in biologically treated urban wastewater." Applied Catalysis B: Environmental, 144, 369-378. 3. Vaiano V. , Sacco O., Sannino D., Ciambelli P., (2015) "Photocatalytic removal of spiramycin from wastewater under visible light with N-doped TiO2 photocatalysts”, Chemical Engineering Journal, Pages 3-8
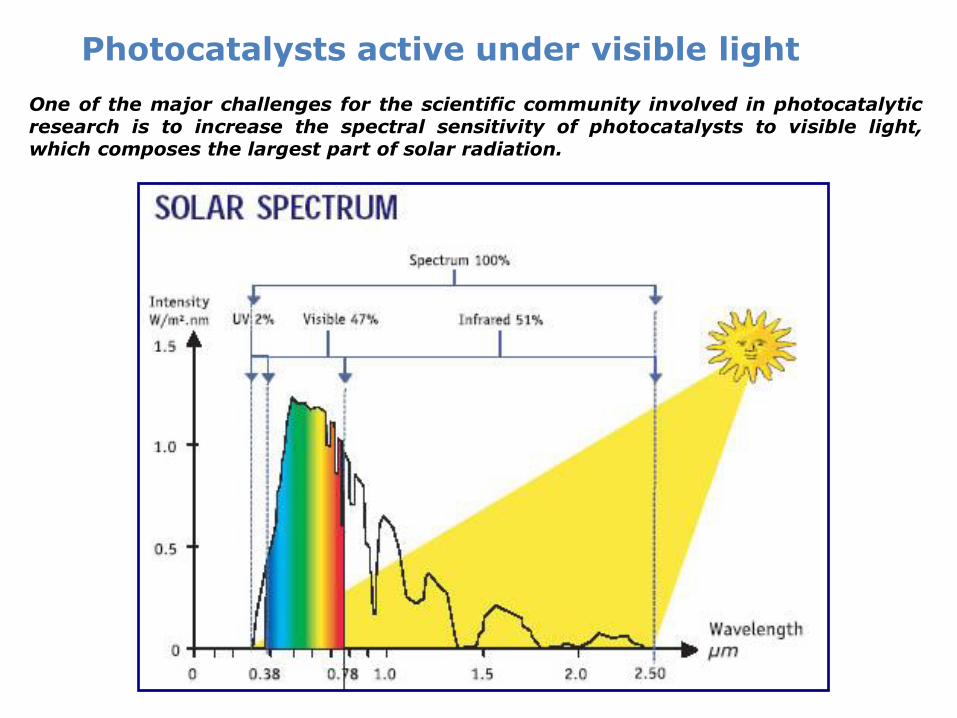
Photocatalysts active under visible light
One of the major challenges for the scientific community involved in photocatalytic research is to increase the spectral sensitivity of photocatalysts to visible light, which composes the largest part of solar radiation.
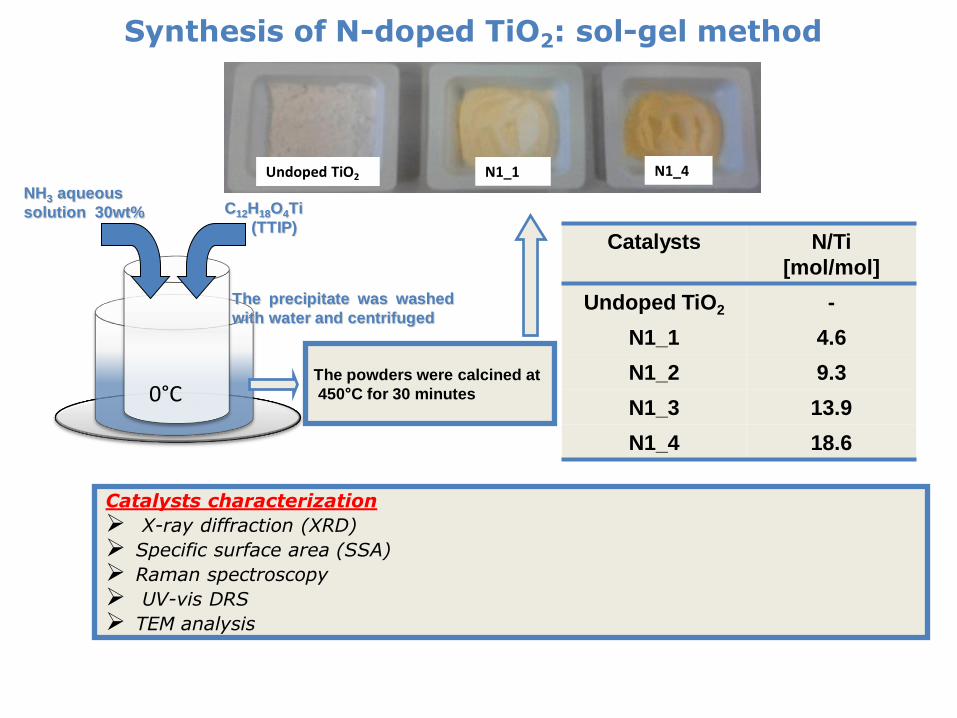
Synthesis of N-doped TiO2: sol-gel method
Catalysts
N/Ti [mol/mol]
Undoped TiO2 -
N1_1 4.6
N1_2 9.3
N1_3 13.9
N1_4 18.6
The powders were calcined at
450°C for 30 minutes
C12H18O4Ti
(TTIP)
NH3 aqueous
solution 30wt%
The precipitate was washed
with water and centrifuged
0°C
Catalysts characterization
X-ray diffraction (XRD)
Specific surface area (SSA)
Raman spectroscopy
UV-vis DRS
TEM analysis
N1_1 N1_4 Undoped TiO2
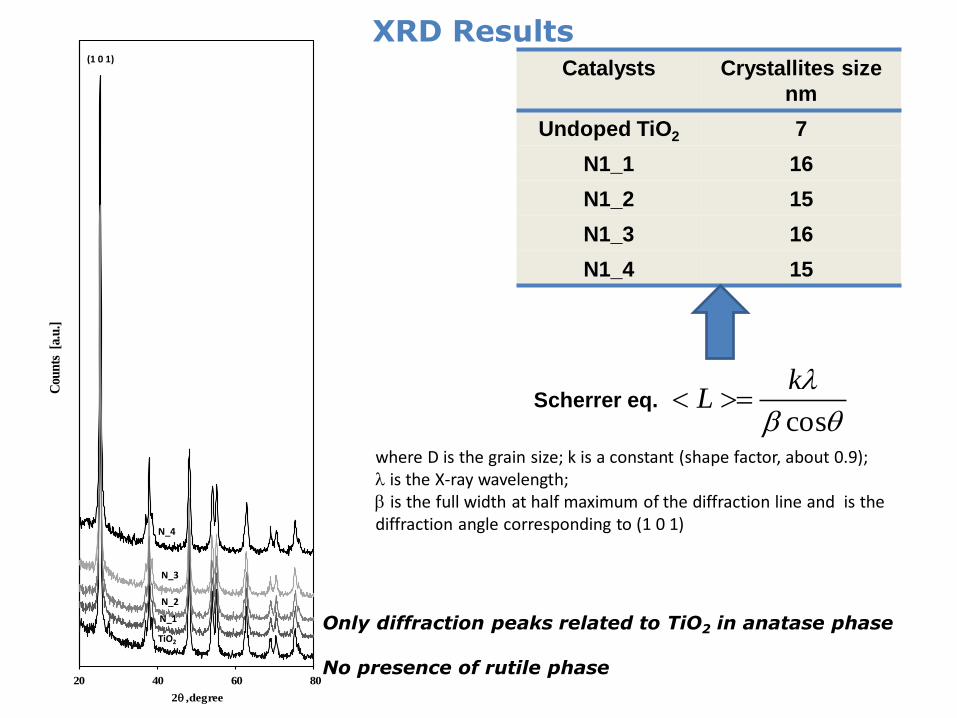
XRD Results Catalysts
Crystallites size
nm
Undoped TiO2 7
N1_1 16
N1_2 15
N1_3 16
N1_4 15
20 40 60 80
Cou
nts
[a.
u.]
2q ,degree
TiO2
N_1
N_2
N_3
N_4
(1 0 1)
q
cos
kL Scherrer eq.
Only diffraction peaks related to TiO2 in anatase phase No presence of rutile phase
where D is the grain size; k is a constant (shape factor, about 0.9); is the X-ray wavelength; is the full width at half maximum of the diffraction line and is the diffraction angle corresponding to (1 0 1)
0
0.4
0.8
1.2
1.6
385 485 585 685
Wavelenghth [nm]
Ku
be
lka
-Mu
nk
N_1
N_2
N_3
N_4
undoped TiO2
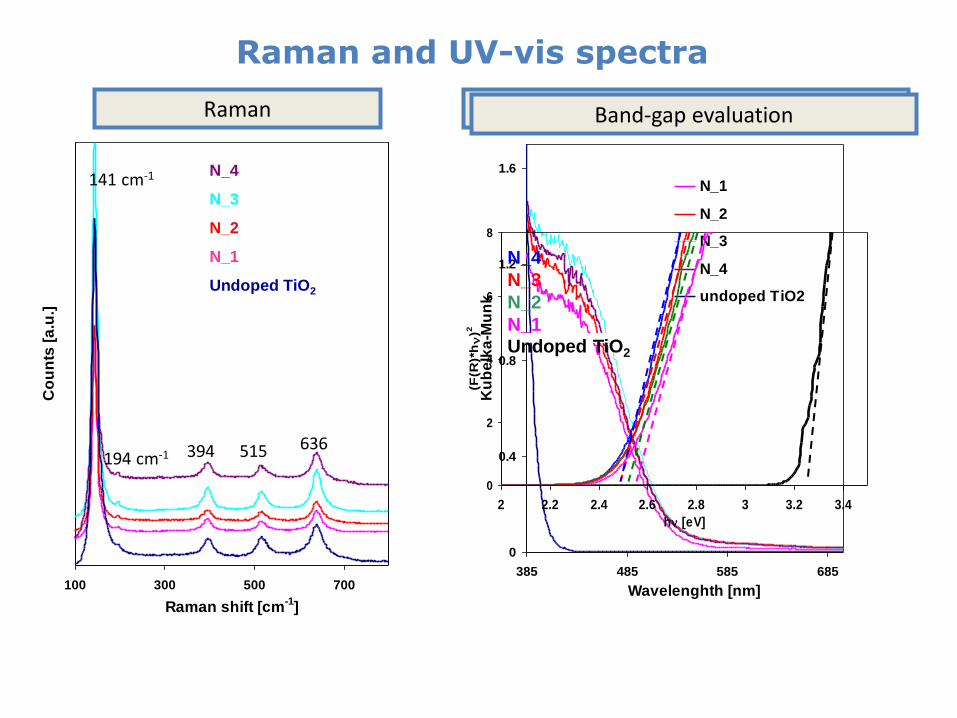
UV-Vis spectra
Raman and UV-vis spectra
100 300 500 700
Raman shift [cm-1
]
Co
un
ts [
a.u
.]
Raman
141 cm-1
194 cm-1 394 636 515
N_4
N_3
N_2
N_1
Undoped TiO2
Band-gap evaluation
0
2
4
6
8
2 2.2 2.4 2.6 2.8 3 3.2 3.4
hn [eV]
(F(R
)*h
n)2
N_4
N_3
N_2
N_1 Undoped TiO2
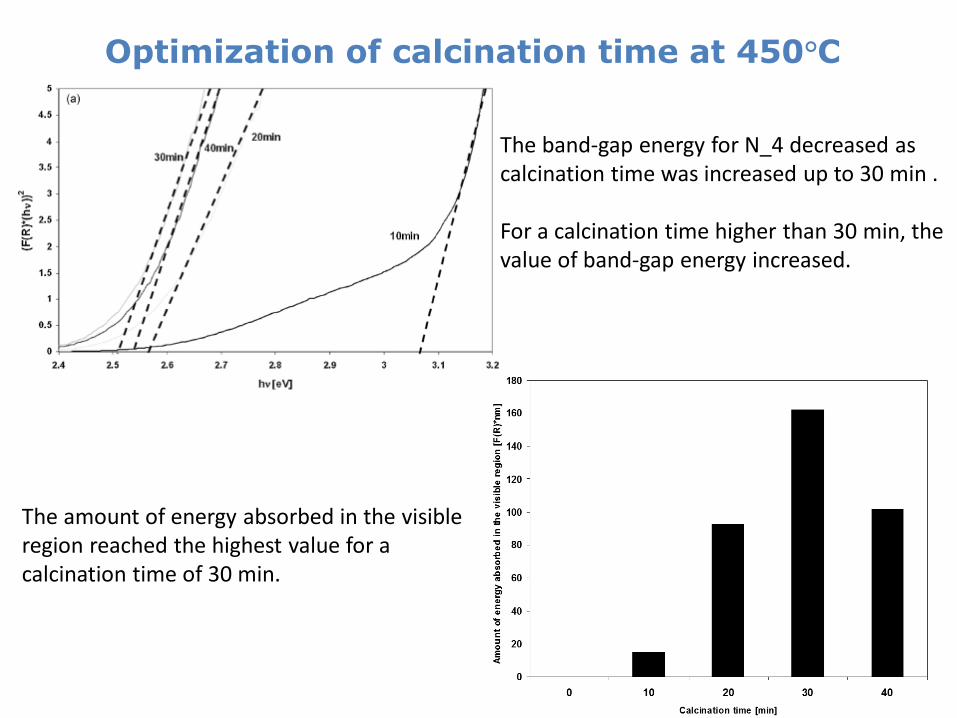
Optimization of calcination time at 450°C
The band-gap energy for N_4 decreased as calcination time was increased up to 30 min . For a calcination time higher than 30 min, the value of band-gap energy increased.
The amount of energy absorbed in the visible region reached the highest value for a calcination time of 30 min.
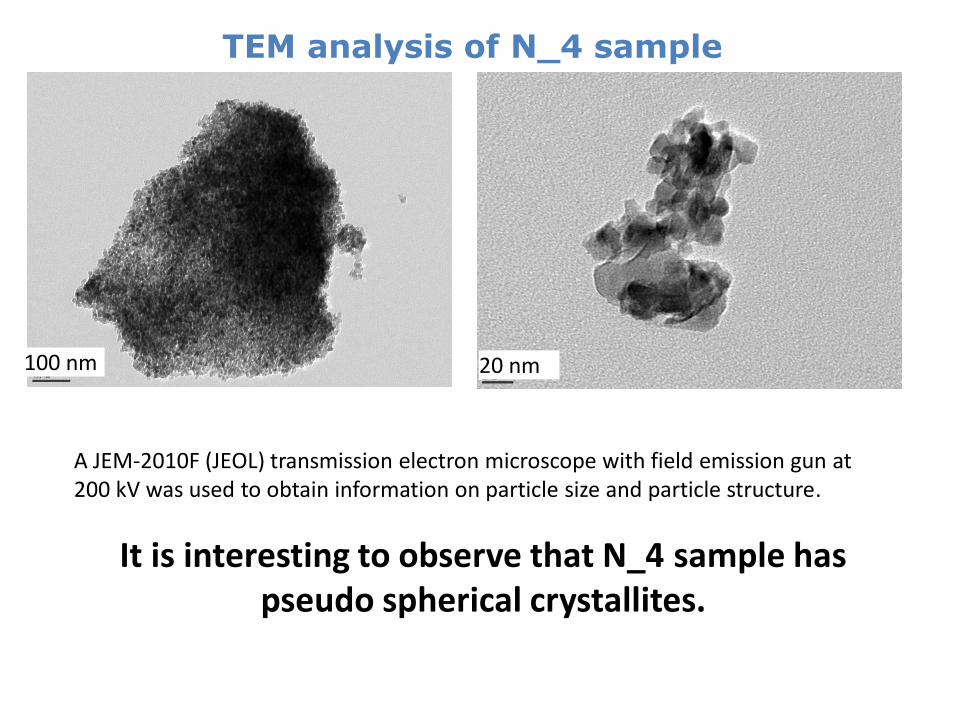
TEM analysis of N_4 sample
100 nm 20 nm
A JEM-2010F (JEOL) transmission electron microscope with field emission gun at 200 kV was used to obtain information on particle size and particle structure.
It is interesting to observe that N_4 sample has pseudo spherical crystallites.
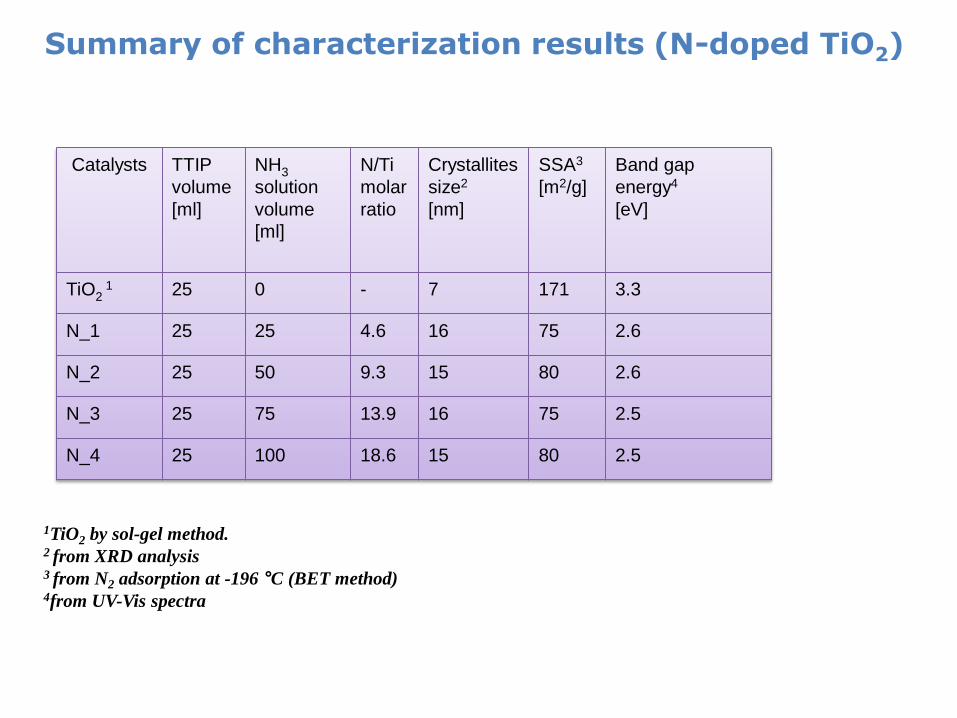
Catalysts TTIP
volume
[ml]
NH3
solution
volume
[ml]
N/Ti
molar
ratio
Crystallites
size2
[nm]
SSA3
[m2/g] Band gap
energy4
[eV]
TiO2 1 25 0 - 7 171 3.3
N_1 25 25 4.6 16 75 2.6
N_2 25 50 9.3 15 80 2.6
N_3 25 75 13.9 16 75 2.5
N_4 25 100 18.6 15 80 2.5
1TiO2 by sol-gel method. 2 from XRD analysis 3 from N2 adsorption at -196 °C (BET method) 4from UV-Vis spectra
Summary of characterization results (N-doped TiO2)
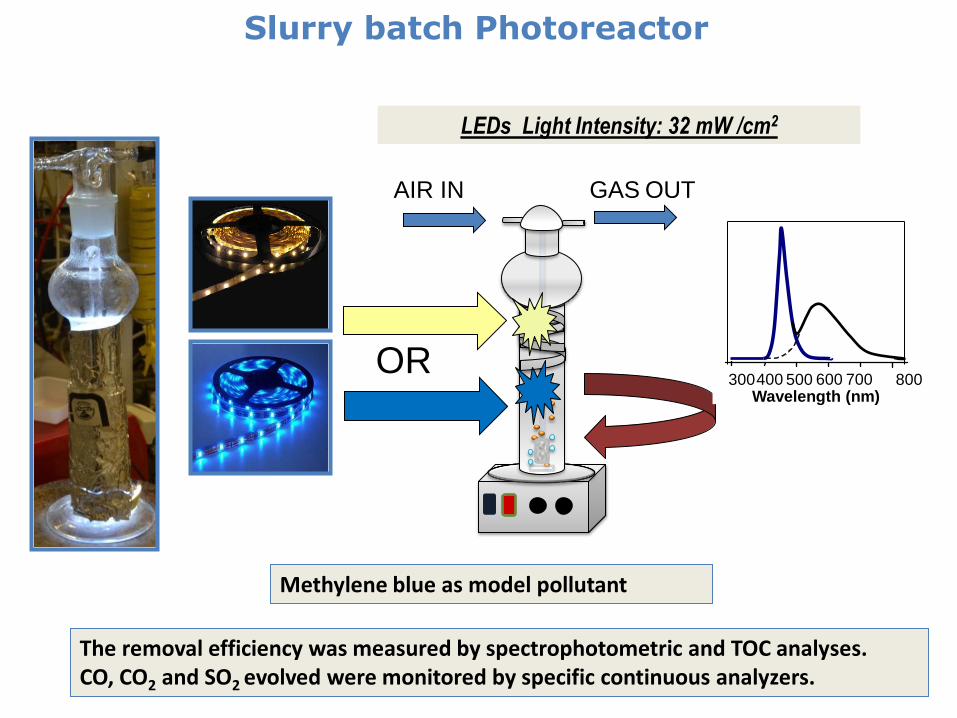
Slurry batch Photoreactor
LEDs Light Intensity: 32 mW /cm2
AIR IN GAS OUT
OR
The removal efficiency was measured by spectrophotometric and TOC analyses. CO, CO2 and SO2 evolved were monitored by specific continuous analyzers.
300 400 500 600 700 800 Wavelength (nm)
Methylene blue as model pollutant
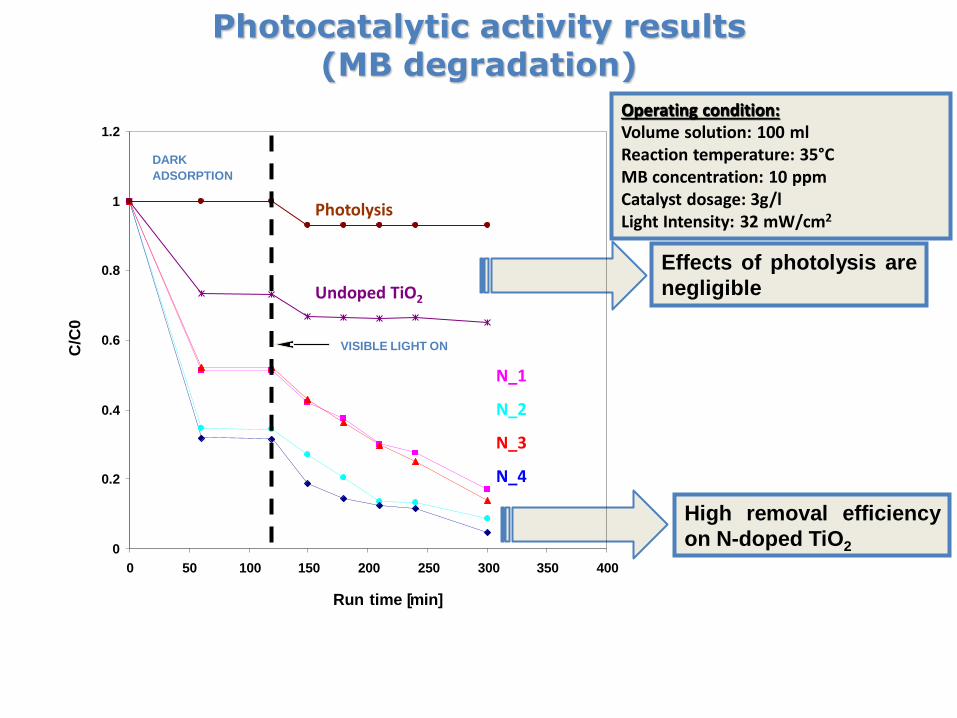
Photocatalytic activity results (MB degradation)
High removal efficiency
on N-doped TiO2
Effects of photolysis are
negligible
Operating condition: Volume solution: 100 ml Reaction temperature: 35°C MB concentration: 10 ppm Catalyst dosage: 3g/l Light Intensity: 32 mW/cm2
0
0.2
0.4
0.6
0.8
1
1.2
0 50 100 150 200 250 300 350 400
Run time [ min ]
C/C
0
DARK
ADSORPTION
VISIBLE LIGHT ON
Undoped TiO2
N_1
N_2
N_3
N_4
Photolysis
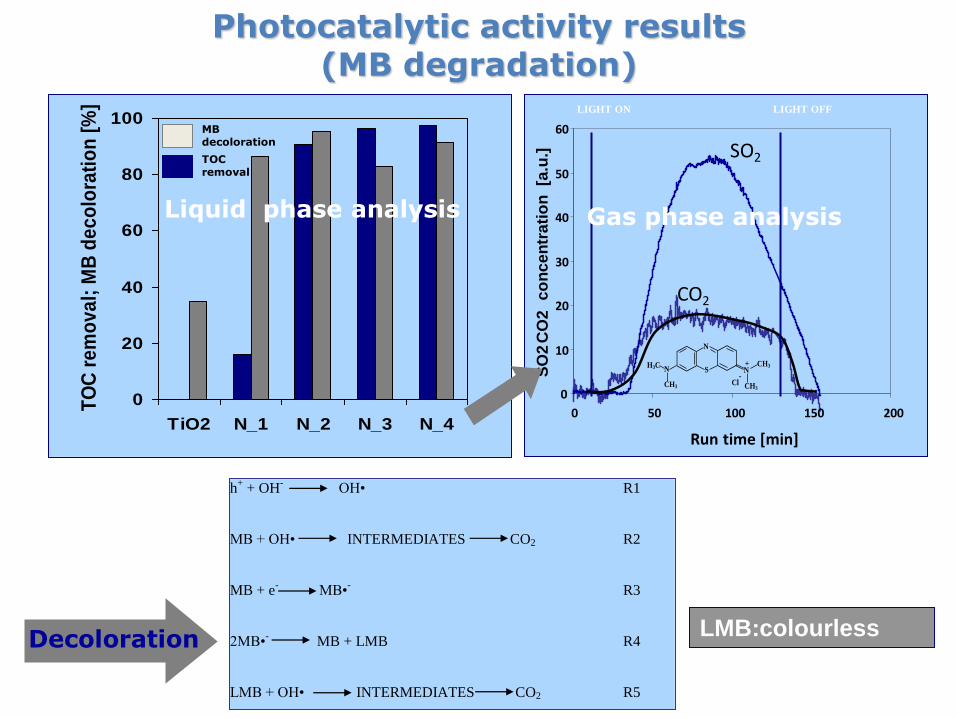
0
10
20
30
40
50
60
0 50 100 150 200
Run time [min]
LIGHT ON LIGHT OFF
SO
2 C
O2
co
nc
en
tra
tio
n
[a.u
.]
Gas phase analysis
N
S N H3C
CH3
N
CH3
CH3 +
Cl-
0
20
40
60
80
100
TiO2 N_1 N_2 N_3 N_4
TO
C r
em
ov
al;
MB
de
co
lora
tio
n [
%]
TOC removal
MB decoloration
h+ + OH
- OH• R1
MB + OH• INTERMEDIATES CO2 R2
MB + e- MB•
- R3
2MB•- MB + LMB R4
LMB + OH• INTERMEDIATES CO2 R5
Liquid phase analysis
Decoloration
SO2
CO2
LMB:colourless
Photocatalytic activity results (MB degradation)
0
0.2
0.4
0.6
0.8
1
1.2
0 1 2 3 4 5 6 7 8 9 10
Run time [hour]
TO
C/T
OC
0
Photolysis blu LEDs
N_4 photocatalyst
Dark
adsorption
white LEDs ON
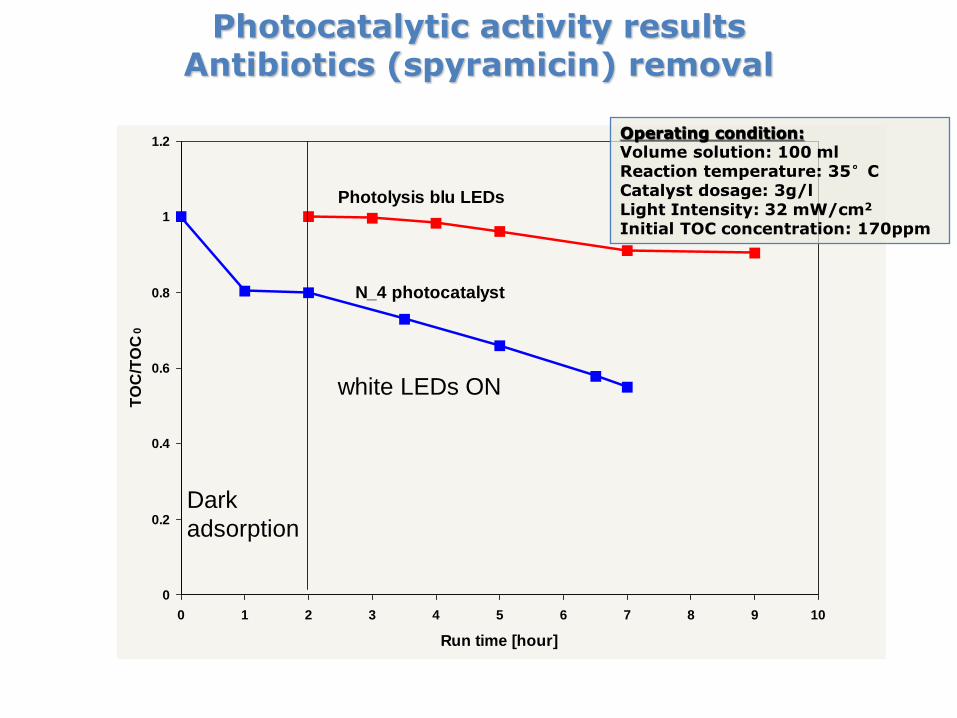
Operating condition: Volume solution: 100 ml Reaction temperature: 35°C Catalyst dosage: 3g/l Light Intensity: 32 mW/cm2
Initial TOC concentration: 170ppm
Photocatalytic removal of emerging contaminants:
Spyramicin photocatalytic activity results under visible light
Photocatalytic activity results Antibiotics (spyramicin) removal
0
1
2
3
4
5
6
7
8
0 10 20 30 40 50 60
log
CFU
100
mL-1
Irradiation time (min)
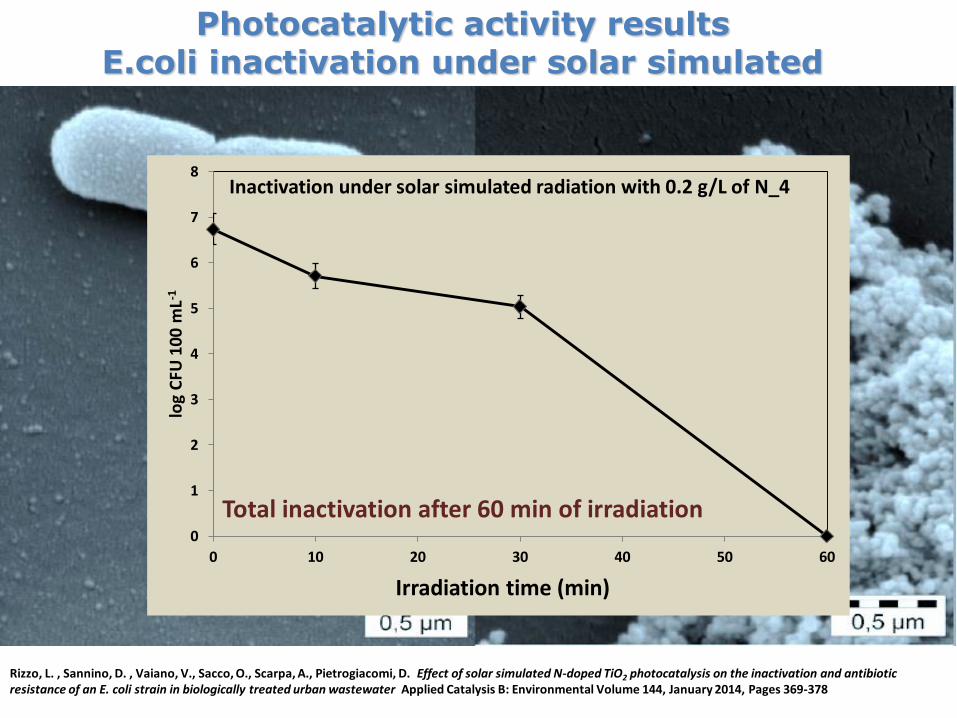
Inactivation under solar simulated radiation with 0.2 g/L of N_4
Total inactivation after 60 min of irradiation
Rizzo, L. , Sannino, D. , Vaiano, V., Sacco, O., Scarpa, A., Pietrogiacomi, D. Effect of solar simulated N-doped TiO2 photocatalysis on the inactivation and antibiotic resistance of an E. coli strain in biologically treated urban wastewater Applied Catalysis B: Environmental Volume 144, January 2014, Pages 369-378
Photocatalytic activity results E.coli inactivation under solar simulated
Example 2: Immobilization of N-doped TiO2 on glass
spheres via sol-gel route
1. Vaiano V. , Sacco O., Sannino D., Ciambelli P., (2015) " Nanostructured N-doped TiO2 coated on glass spheres for the photocatalytic removal of organic dyes under UV or visible light irradiation”, Applied Catalysis B: Environmental, Volume 170-171, Pages 153-161
1. Vaiano V. , Sacco O., Pisano D., Sannino D., Ciambelli P., (2015) "From the design to the development of a continuous fixed bed
photoreactor for photocatalytic degradation of organic pollutants in wastewater”, Chemical Engineering Science, article in press.
Slurry reactor configuration: problems
Disadvantages of catalysts in aqueous suspension are (slurry reactor): •the damages of recirculation pumps • separation of catalyst from reaction solution is needed
A valid solution is the use of immobilized and structured catalyst One of the possible solution to solve this technical problem would be to realize heterogeneous fixed bed reactors, in which the photocatalyst is supported on transparent materials.
Immobilization of N-doped TiO2
There is an important variety of materials that can be used for supporting TiO2. The most studied are that ones based on glass, owing to their low cost and easy availability Only few papers regard N-doped TiO2 /immobilized systems mainly carried out through : 1. sputtering technique 1
2. chemical vapor deposition1.
No study developed a simple sol-gel method that uses ammonia solution as the only doping source. 1. D. Avisar, I. Horovitz, L. Lozzi, F. Ruggieri, M. Baker, M.L. Abel, H. Mamane, Journal of Hazardous Materials. 244-245 (2013) 463-471.
Triton X-100
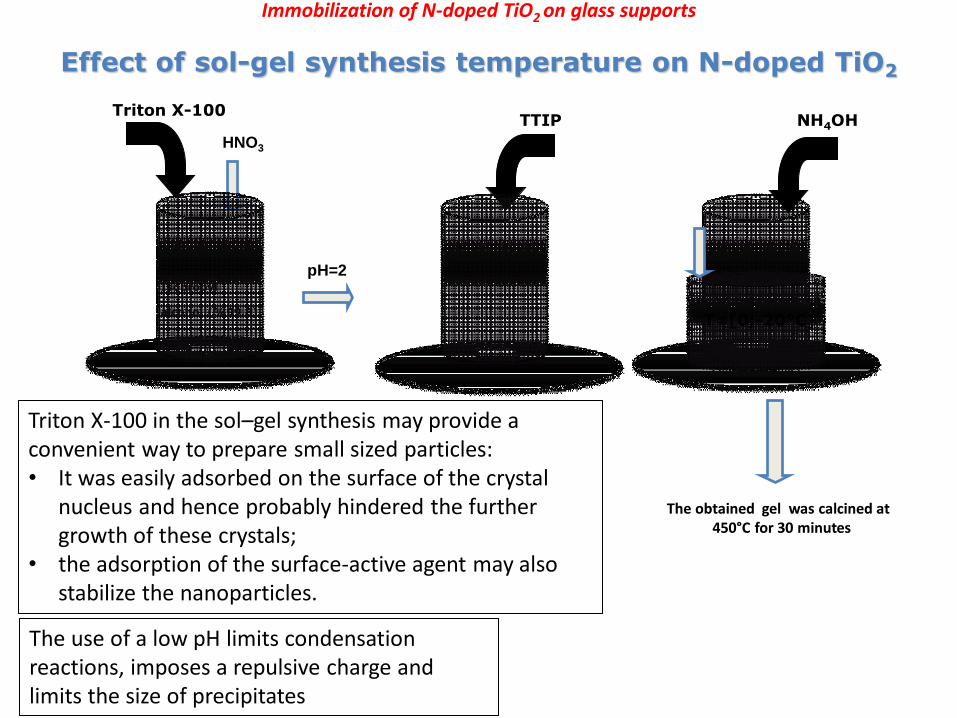
The obtained gel was calcined at 450°C for 30 minutes
İsopropyl
alcohol (%99,8)
HNO3
NH4OH
T=[0;-20°C]
pH=2
TTIP
Immobilization of N-doped TiO2 on glass supports
Effect of sol-gel synthesis temperature on N-doped TiO2
Triton X-100 in the sol–gel synthesis may provide a convenient way to prepare small sized particles: • It was easily adsorbed on the surface of the crystal
nucleus and hence probably hindered the further growth of these crystals;
• the adsorption of the surface-active agent may also stabilize the nanoparticles.
The use of a low pH limits condensation reactions, imposes a repulsive charge and limits the size of precipitates
20 30 40 50 60 70 80
Inte
ns
ity,
a.u
.
2q, degree
0°C
-5°C
-10°C
-15°C
-20°C
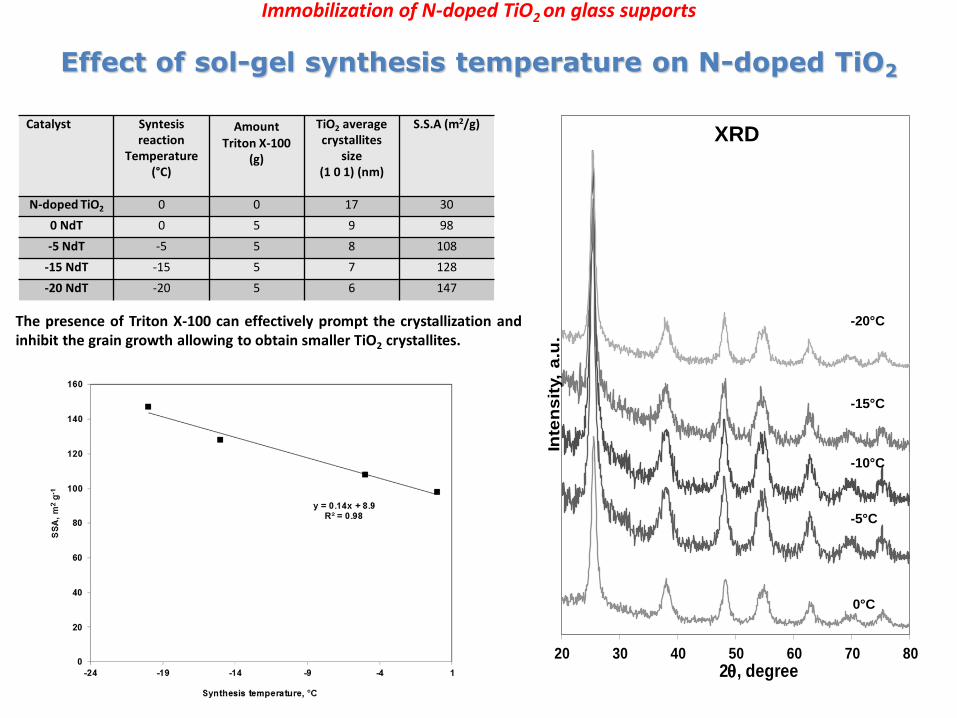
Catalyst Syntesis reaction
Temperature (°C)
Amount Triton X-100
(g)
TiO2 average crystallites
size (1 0 1) (nm)
S.S.A (m2/g)
N-doped TiO2 0 0 17 30
0 NdT 0 5 9 98
-5 NdT -5 5 8 108
-15 NdT -15 5 7 128
-20 NdT -20 5 6 147
XRD
The presence of Triton X-100 can effectively prompt the crystallization and inhibit the grain growth allowing to obtain smaller TiO2 crystallites.
Immobilization of N-doped TiO2 on glass supports
Effect of sol-gel synthesis temperature on N-doped TiO2
20 21 22 23 24 25 26 27 28 29 30
inte
nsi
ty,a
.u.
2q ,degree
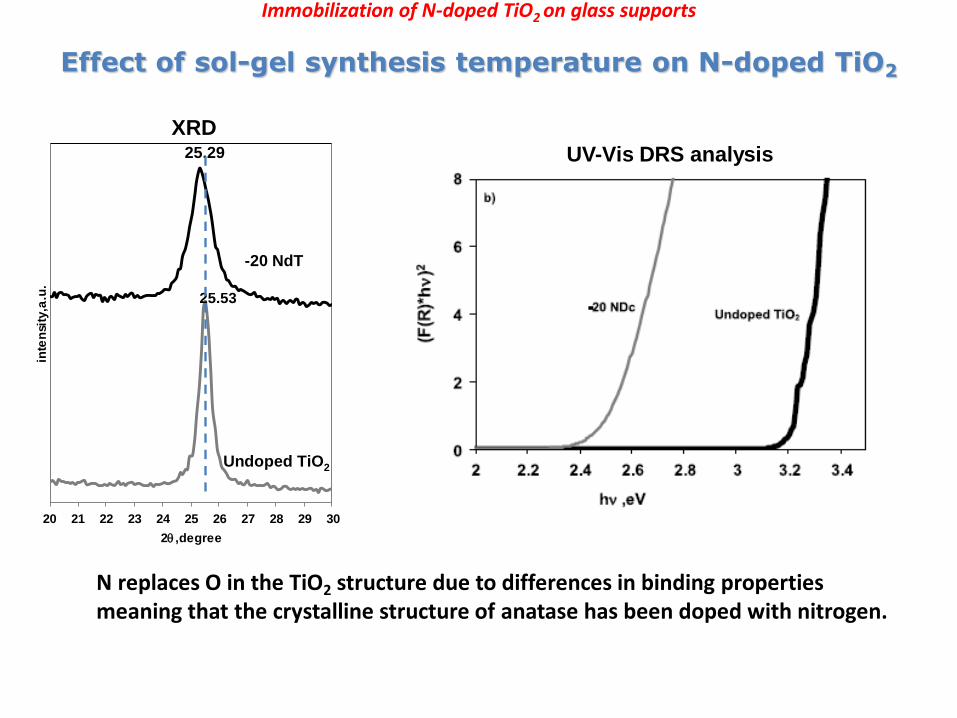
25.29
Undoped TiO2
-20 NdT
XRD
25.53
Immobilization of N-doped TiO2 on glass supports
Effect of sol-gel synthesis temperature on N-doped TiO2
N replaces O in the TiO2 structure due to differences in binding properties meaning that the crystalline structure of anatase has been doped with nitrogen.
UV-Vis DRS analysis
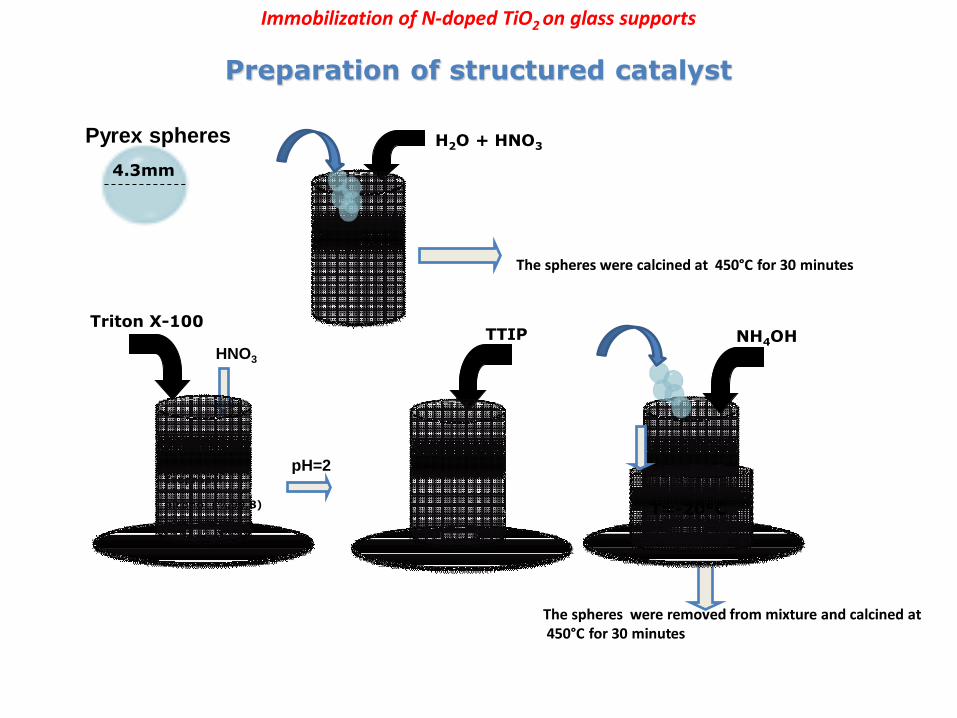
The spheres were removed from mixture and calcined at 450°C for 30 minutes
Immobilization of N-doped TiO2 on glass supports
Preparation of structured catalyst
Triton X-100
İsopropyl
alcohol (%99,8)
HNO3
NH4OH
T=-20°C
pH=2
TTIP
4.3mm
The spheres were calcined at 450°C for 30 minutes
H2O + HNO3 Pyrex spheres
Glass sphere
a)
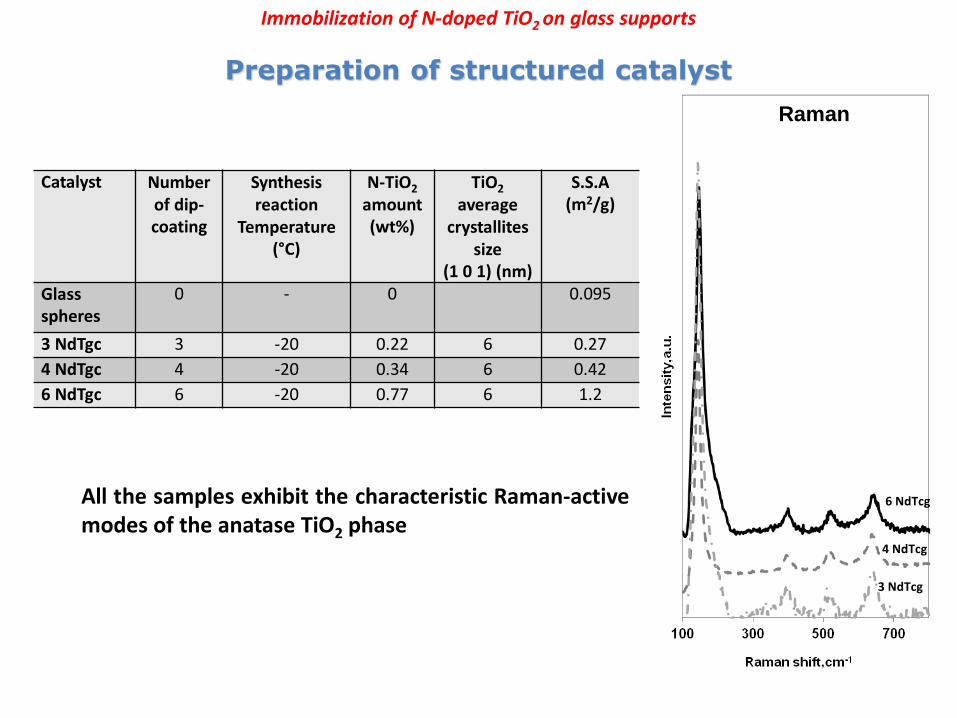
Catalyst Number of dip-coating
Synthesis reaction
Temperature (°C)
N-TiO2 amount (wt%)
TiO2 average
crystallites size
(1 0 1) (nm)
S.S.A (m2/g)
Glass spheres
0 - 0 0.095
3 NdTgc 3 -20 0.22 6 0.27
4 NdTgc 4 -20 0.34 6 0.42
6 NdTgc 6 -20 0.77 6 1.2
Raman
All the samples exhibit the characteristic Raman-active modes of the anatase TiO2 phase
3 NdTcg
4 NdTcg
6 NdTcg
Immobilization of N-doped TiO2 on glass supports
Preparation of structured catalyst
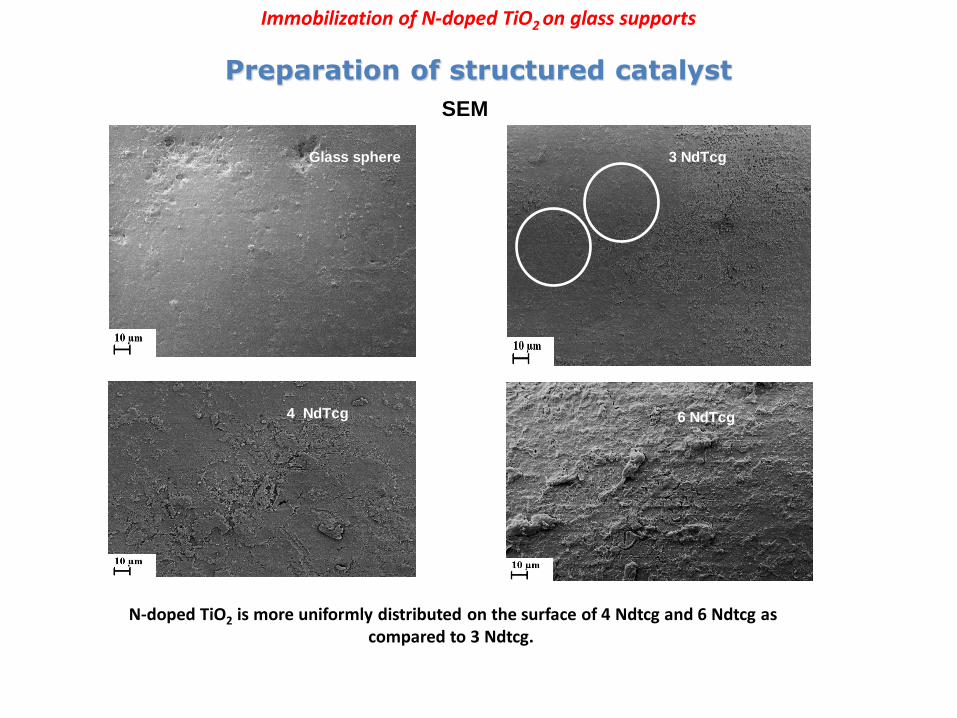
Glass sphere
a)
3 NdTcg
Glass sphere
4 NdTcg
6 NdTcg
SEM
N-doped TiO2 is more uniformly distributed on the surface of 4 Ndtcg and 6 Ndtcg as compared to 3 Ndtcg.
Immobilization of N-doped TiO2 on glass supports
Preparation of structured catalyst
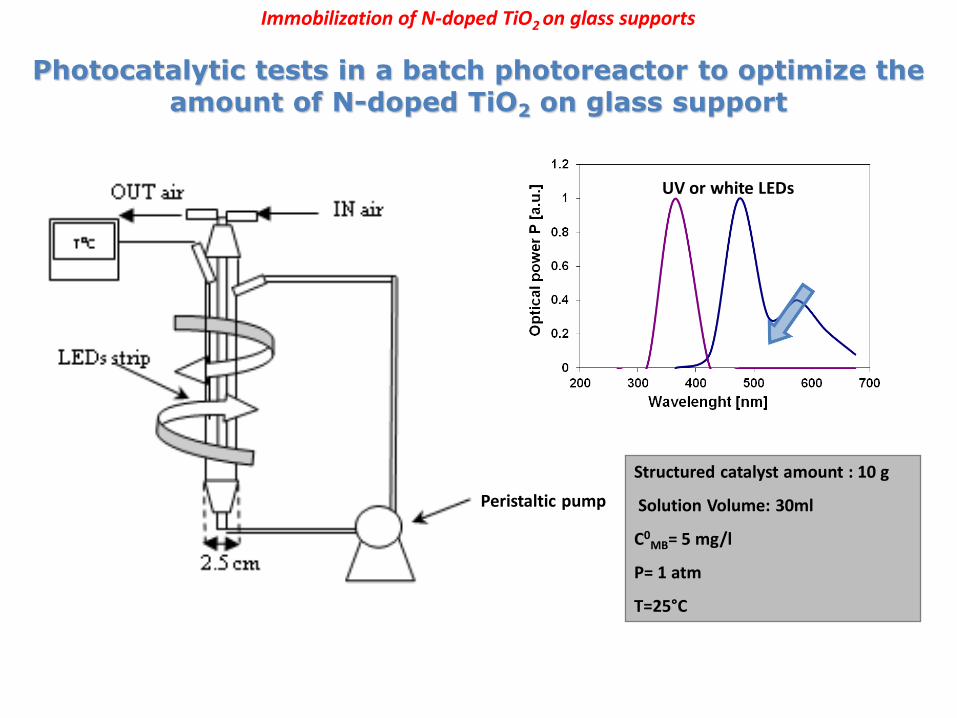
Immobilization of N-doped TiO2 on glass supports
Photocatalytic tests in a batch photoreactor to optimize the amount of N-doped TiO2 on glass support
Peristaltic pump
UV or white LEDs
Structured catalyst amount : 10 g
Solution Volume: 30ml
C0MB= 5 mg/l
P= 1 atm
T=25°C
0,2
0,4
0,6
0,8
1
0 50 100 150 200
C/C
0
Run Time, min
Dark adsorption
UV Light on
Glass spheres
3 NdTgc
4 NdTgc
6 NdTgc
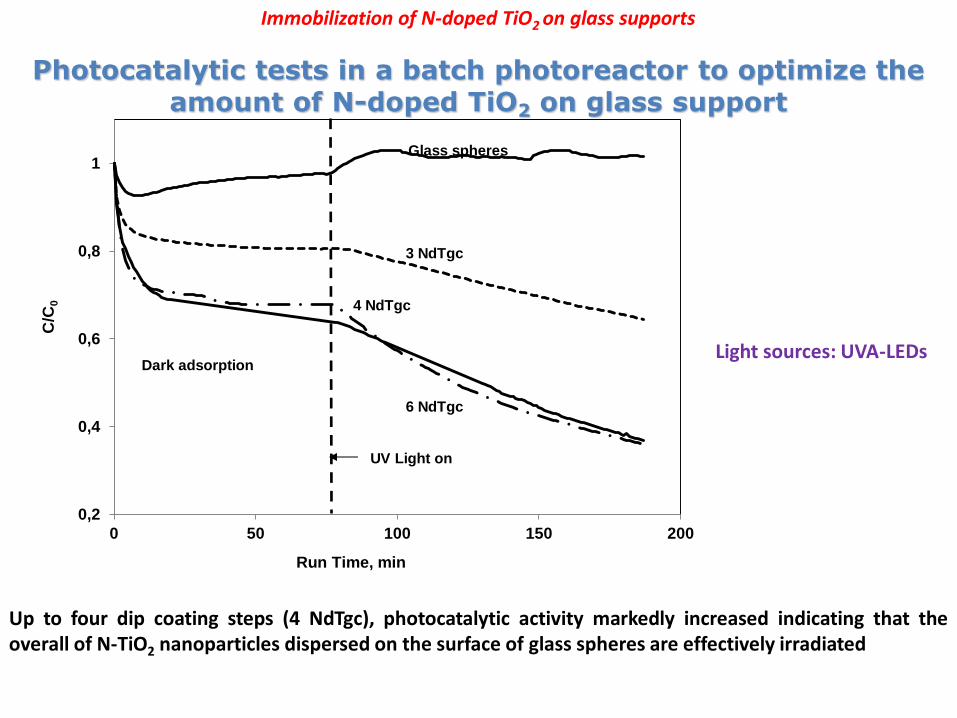
Up to four dip coating steps (4 NdTgc), photocatalytic activity markedly increased indicating that the overall of N-TiO2 nanoparticles dispersed on the surface of glass spheres are effectively irradiated
Immobilization of N-doped TiO2 on glass supports
Photocatalytic tests in a batch photoreactor to optimize the amount of N-doped TiO2 on glass support
Light sources: UVA-LEDs
Immobilization of N-doped TiO2 on glass supports
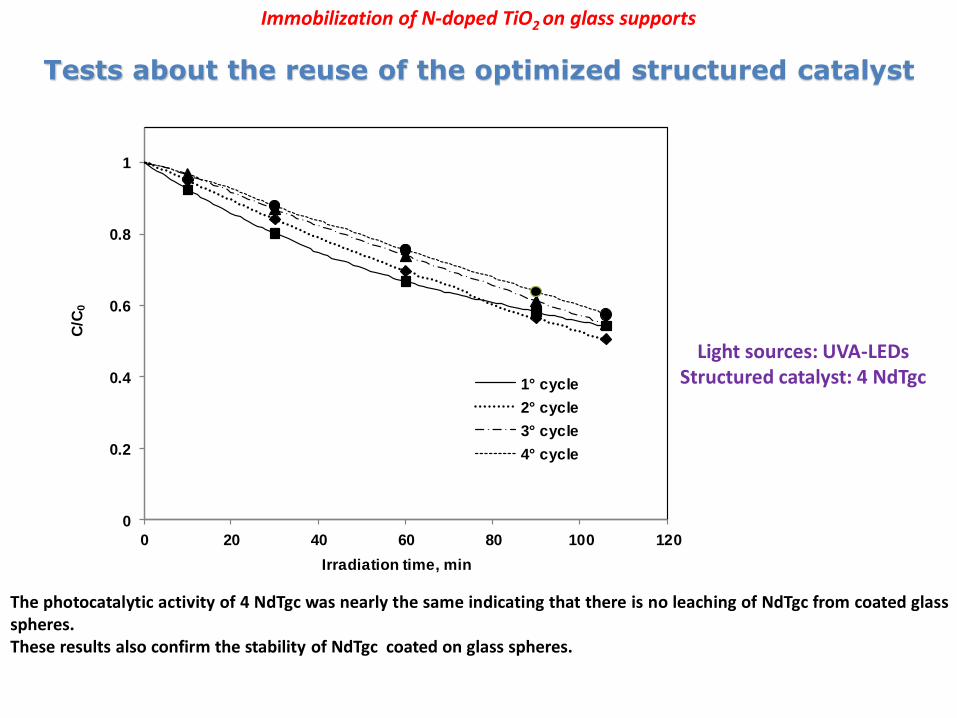
Tests about the reuse of the optimized structured catalyst
The photocatalytic activity of 4 NdTgc was nearly the same indicating that there is no leaching of NdTgc from coated glass spheres. These results also confirm the stability of NdTgc coated on glass spheres.
0
0.2
0.4
0.6
0.8
1
0 20 40 60 80 100 120
C/C
0
Irradiation time, min
1° cycle
2° cycle
3° cycle
4° cycle
Light sources: UVA-LEDs Structured catalyst: 4 NdTgc
Immobilization of N-doped TiO2 on glass supports
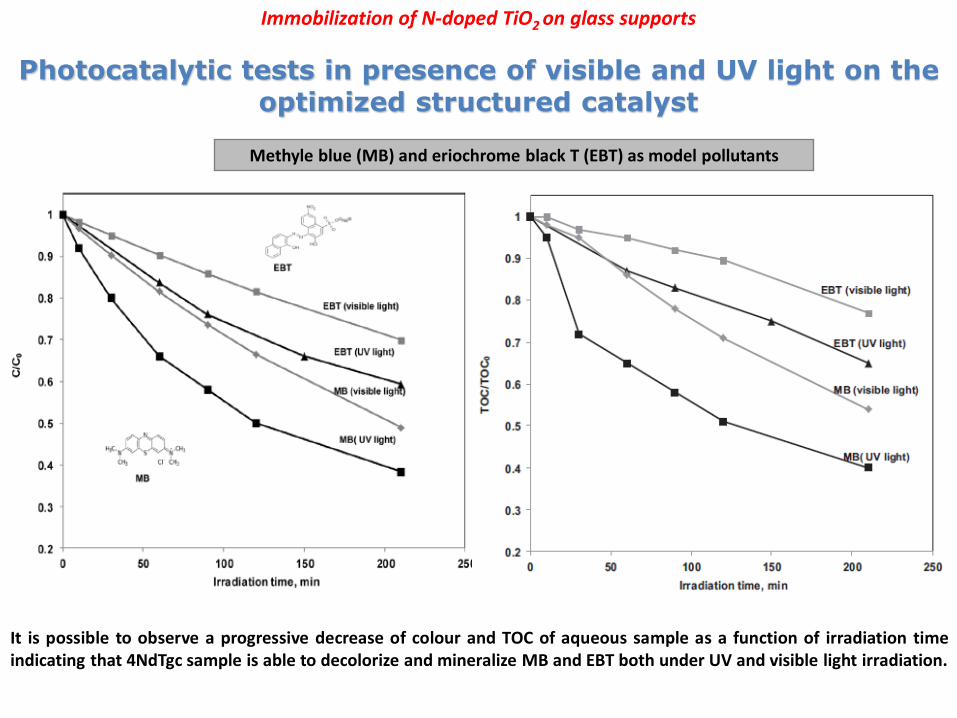
Photocatalytic tests in presence of visible and UV light on the optimized structured catalyst
It is possible to observe a progressive decrease of colour and TOC of aqueous sample as a function of irradiation time indicating that 4NdTgc sample is able to decolorize and mineralize MB and EBT both under UV and visible light irradiation.
Methyle blue (MB) and eriochrome black T (EBT) as model pollutants
Example 3: Long Afterglow Green Phosphors
Functionalized with photocatalysts
1. Sacco O., Vaiano V., Han C., Sannino D., Dionysiou D., Ciambelli P., (2015) " Long Afterglow Green Phosphors Functionalized with Fe-
n Doped Tio2 for the Photocatalytic Removal of Emerging Contaminants ”, Chemical Engineering Transactions, Vol. 43, 2107-2112.
0 500 1000
Em
issio
n s
pectr
um
, a.u
.
Wavelength, nm
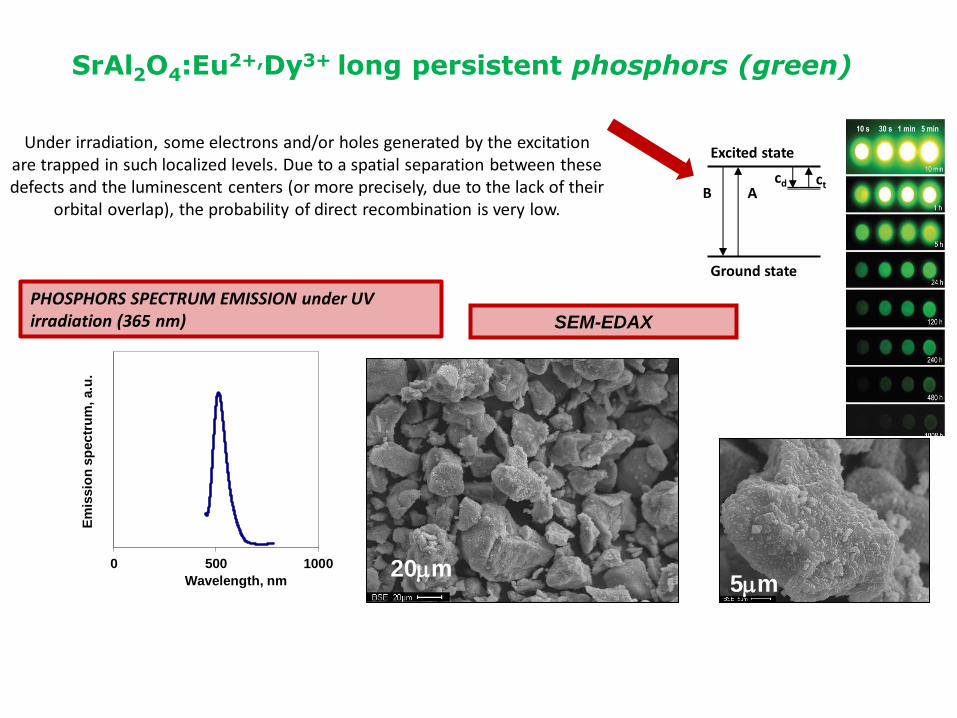
SrAl2O4:Eu2+,Dy3+ long persistent phosphors (green)
SEM-EDAX
5mm 20mm
Excited state
Ground state
A B cd ct
Under irradiation, some electrons and/or holes generated by the excitation are trapped in such localized levels. Due to a spatial separation between these defects and the luminescent centers (or more precisely, due to the lack of their
orbital overlap), the probability of direct recombination is very low.
PHOSPHORS SPECTRUM EMISSION under UV irradiation (365 nm)
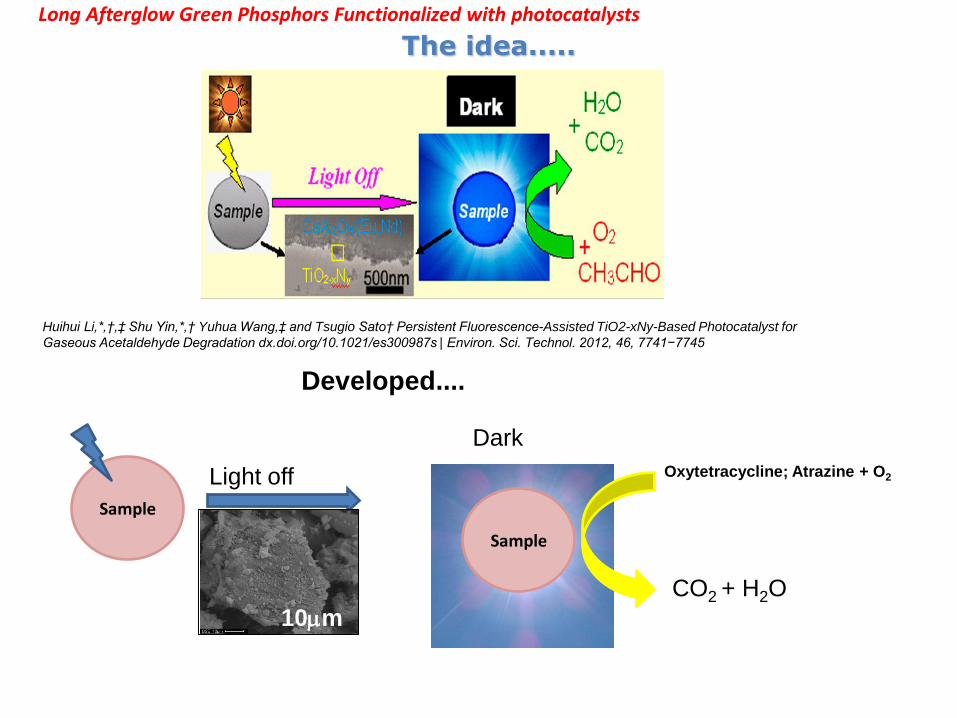
The idea.....
Huihui Li,*,†,‡ Shu Yin,*,† Yuhua Wang,‡ and Tsugio Sato† Persistent Fluorescence-Assisted TiO2-xNy-Based Photocatalyst for
Gaseous Acetaldehyde Degradation dx.doi.org/10.1021/es300987s | Environ. Sci. Technol. 2012, 46, 7741−7745
Sample
Light off
Dark
10mm
Sample
Oxytetracycline; Atrazine + O2
CO2 + H2O
Developed....
Long Afterglow Green Phosphors Functionalized with photocatalysts
Some of the various approaches for making TiO2 effective in visible light are doping TiO2 especially with a metal substance such as Fe
N-TiO2 is an effective photocatalyst when exposed to visible light at wavelength lower than 490 nm In this case, for using the light emitted by green phosphors, it is necessary to formulate a photocatalyst able to work at wavelength lower than 600 nm
LIMITATION
… how to use the photoluminescence of long persistent phosphors as light carriers in the
photocatalytic process?
…development of different photocatalysts…
Fe-N-doped TiO2
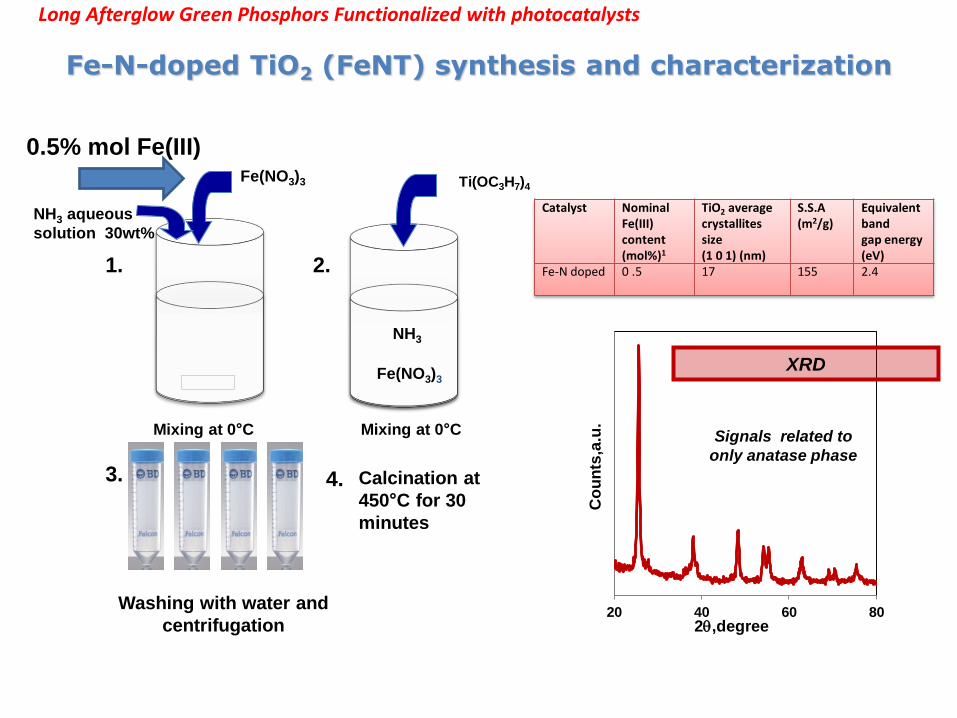
Fe-N-doped TiO2 (FeNT) synthesis and characterization
Calcination at
450°C for 30
minutes
Mixing at 0°C Mixing at 0°C
1. 2.
Washing with water and
centrifugation
3. 4.
Fe(NO3)3
NH3 aqueous
solution 30wt%
Ti(OC3H7)4
Fe(NO3)3
0.5% mol Fe(III)
Catalyst Nominal Fe(III) content (mol%)1
TiO2 average crystallites size (1 0 1) (nm)
S.S.A (m2/g)
Equivalent band gap energy (eV)
Fe-N doped 0 .5 17 155 2.4
NH3
20 40 60 80C
ou
nts
,a.u
.
2q,degree
XRD
Signals related to
only anatase phase
Long Afterglow Green Phosphors Functionalized with photocatalysts
0
0,5
1
1,5
2
2,5
350 400 450 500 550 600 650 700 750 800
Ku
be
lka
Mu
nk
Wavelength [nm]
Fe-N doped TiO2
N- doped TiO2
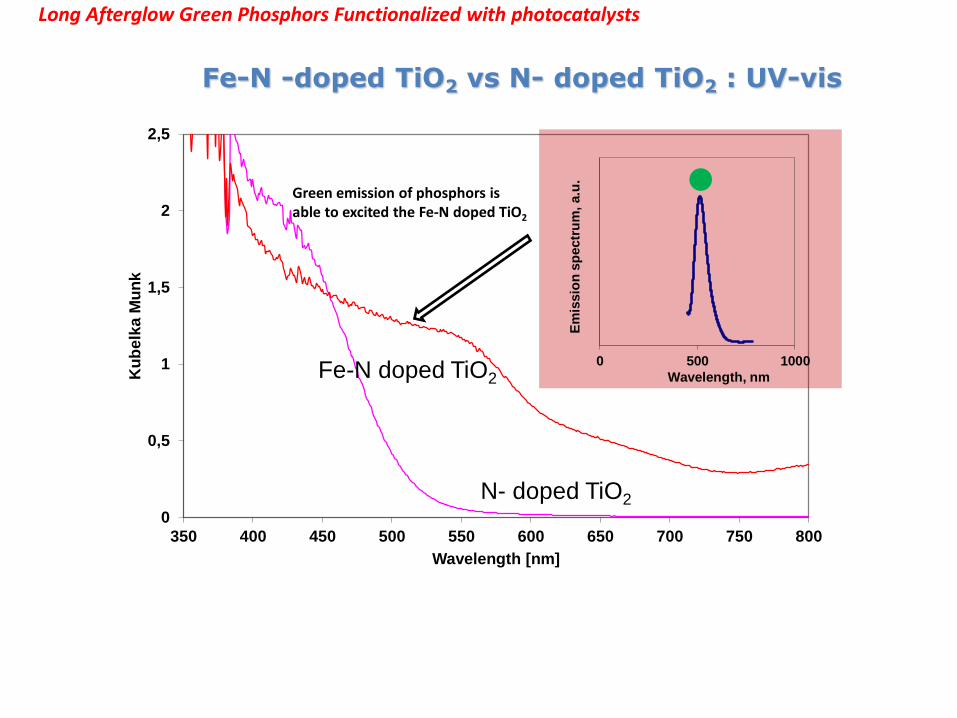
Fe-N -doped TiO2 vs N- doped TiO2 : UV-vis
0 500 1000
Em
issio
n s
pectr
um
, a.u
.
Wavelength, nm
Green emission of phosphors is able to excited the Fe-N doped TiO2
Long Afterglow Green Phosphors Functionalized with photocatalysts
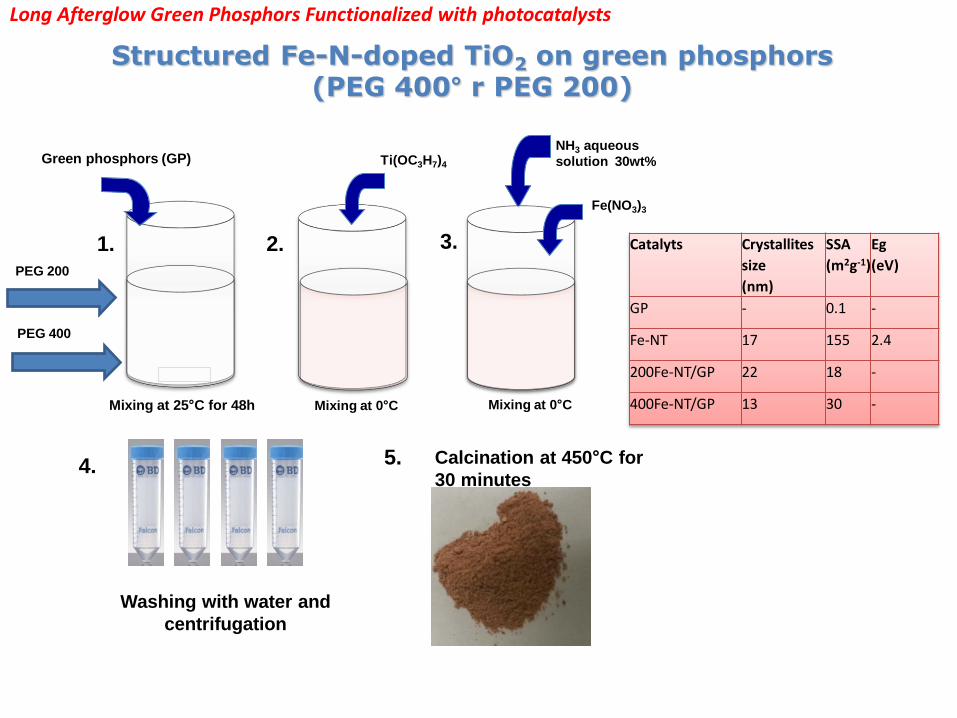
Structured Fe-N-doped TiO2 on green phosphors (PEG 400° r PEG 200)
Calcination at 450°C for
30 minutes
Mixing at 25°C for 48h
1. 2.
Washing with water and
centrifugation
3.
4.
Green phosphors (GP)
Fe(NO3)3
NH3 aqueous
solution 30wt%
Ti(OC3H7)4
Mixing at 0°C
5.
PEG 200
PEG 400
Catalyts Crystallites
size
(nm)
SSA
(m2g-1)
Eg
(eV)
GP - 0.1 -
Fe-NT 17 155 2.4
200Fe-NT/GP 22 18 -
400Fe-NT/GP 13 30 - Mixing at 0°C
Long Afterglow Green Phosphors Functionalized with photocatalysts
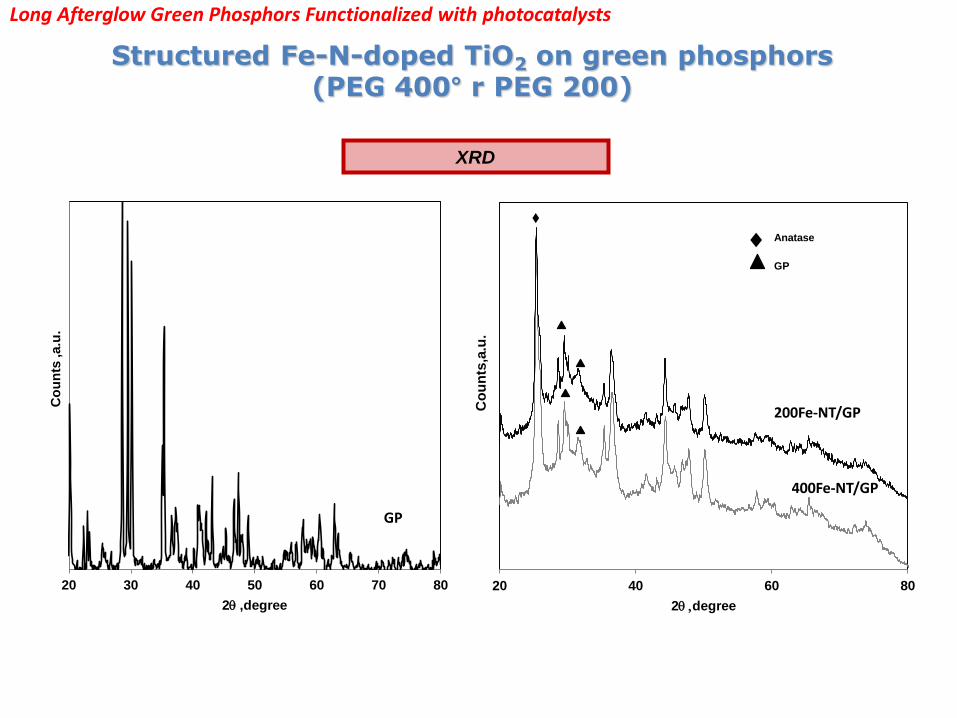
20 40 60 80
Co
un
ts,a
.u.
2q ,degree
20 30 40 50 60 70 80
Co
un
ts ,a.u
.
2q ,degree
Anatase
GP
XRD
200Fe-NT/GP
400Fe-NT/GP
GP
Long Afterglow Green Phosphors Functionalized with photocatalysts
Structured Fe-N-doped TiO2 on green phosphors (PEG 400° r PEG 200)
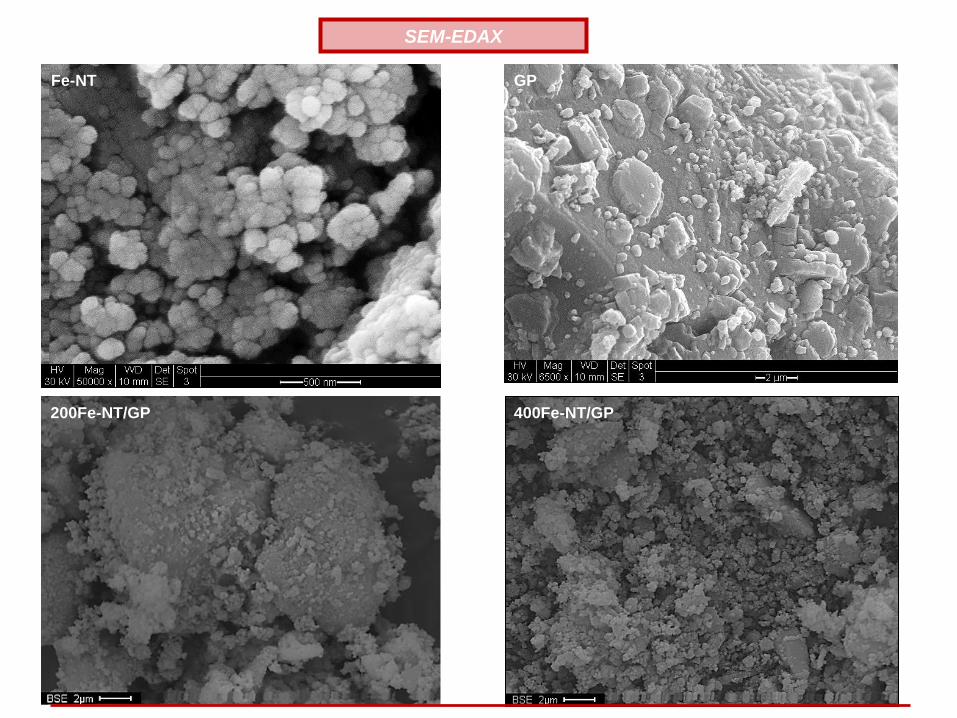
200Fe-NT/GP 400Fe-NT/GP
GP Fe-NT
SEM-EDAX
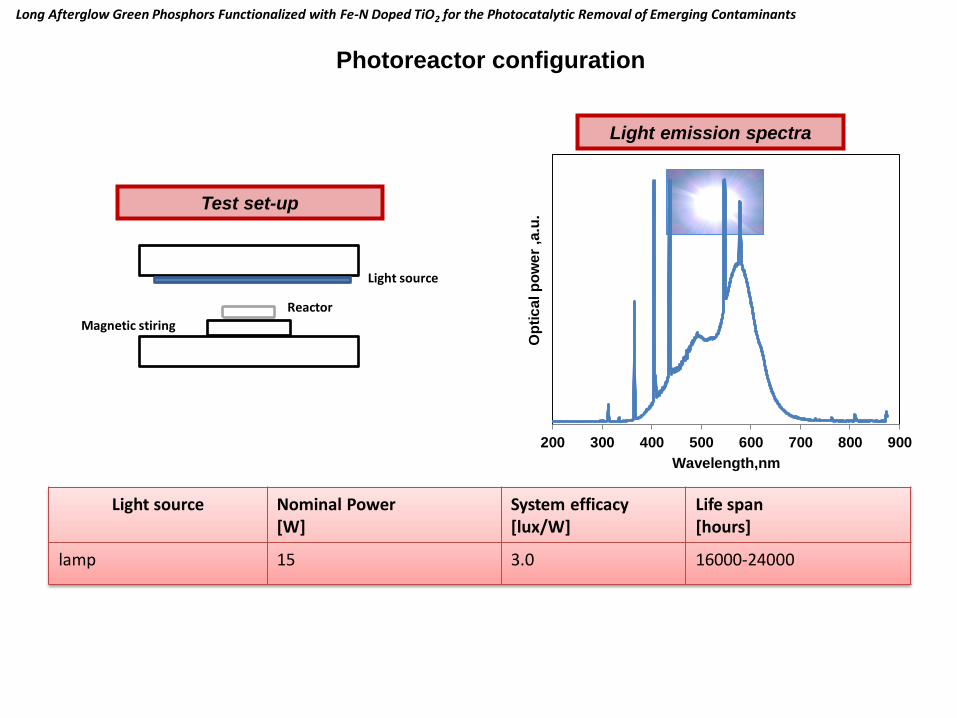
Light source Nominal Power [W]
System efficacy [lux/W]
Life span [hours]
lamp 15 3.0 16000-24000
Photoreactor configuration
200 300 400 500 600 700 800 900
Op
tic
al p
ow
er
,a.u
.
Wavelength,nm
Light source
Reactor
Magnetic stiring
Long Afterglow Green Phosphors Functionalized with Fe-N Doped TiO2 for the Photocatalytic Removal of Emerging Contaminants
Light emission spectra
Test set-up
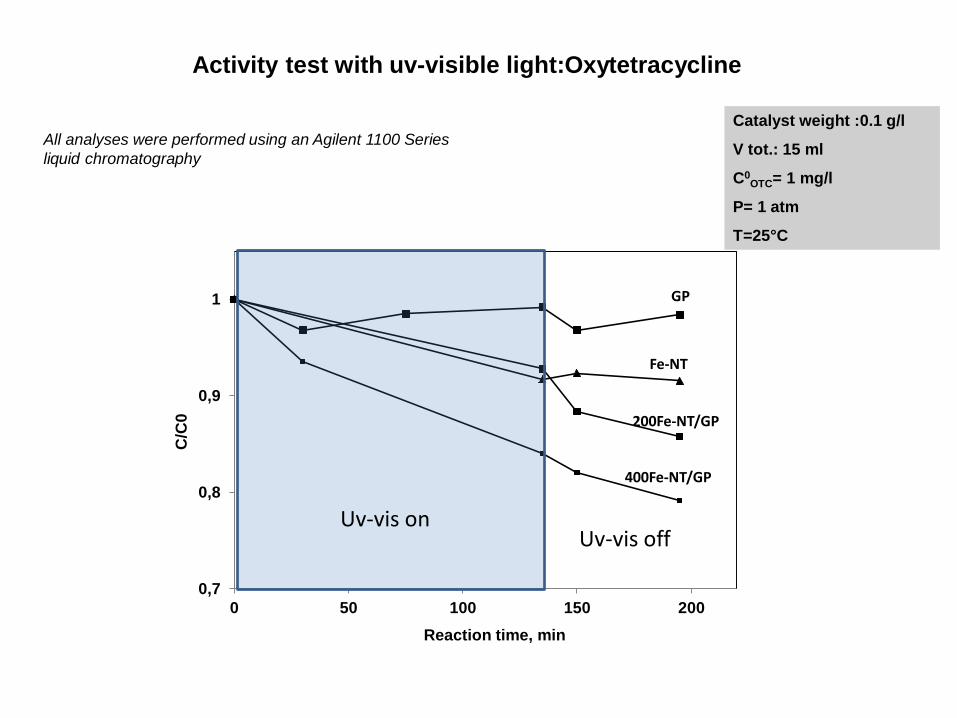
0,7
0,8
0,9
1
0 50 100 150 200
C/C
0
Reaction time, min
Uv-vis on Uv-vis off
200Fe-NT/GP
400Fe-NT/GP
GP
Fe-NT
Catalyst weight :0.1 g/l
V tot.: 15 ml
C0OTC= 1 mg/l
P= 1 atm
T=25°C
Activity test with uv-visible light:Oxytetracycline
All analyses were performed using an Agilent 1100 Series
liquid chromatography

Thanks for your attention