Embed Size (px)
Citation preview
1
University of Richmond Student Managed Investment Fund
2018 - 2019 Annual Report
2
Table of Contents
Letter from the General Manager.................................................................................................................... 3
Overview & History ........................................................................................................................................ 4
SMIF Advisory Board ..................................................................................................................................... 5
SMIF Recruitment and Evaluation Process .................................................................................................... 8
Investment Policy Statement ........................................................................................................................... 9
Economic Overview & Analysis.................................................................................................................... 11
Growth Fund Overview ................................................................................................................................ 18
Growth Fund Attribution Model .................................................................................................................... 20
Growth Holdings ........................................................................................................................................... 21
Value Fund Overview ................................................................................................................................... 39
Value Fund Attribution Model ....................................................................................................................... 41
Value Holdings ............................................................................................................................................. 42
3
Letter from the General Manager
Dear Advisory Board and Robins School Faculty,
I begin this letter with a great sense of pride and gratitude about the University of Richmond Student-Managed
Investment Fund. I am proud not only of our steady performance, but of the diligence displayed by this group
week after week for the past year. I am grateful for the honor of serving as General Manager, and for the
opportunity that was bestowed upon us as members of the Student-Managed Investment Fund.
Throughout the school year, we did an excellent job of stewarding the University’s capital while creating an
engaging and dynamic learning experience for the select group of students who participated in the fund. We
were able to create and test new investment ideas in a challenging and collaborative environment while
tracking against our benchmarks for competitive returns.
The New York City trip we took in September set the stage for this year’s performance. I found that many of
the strategies and security selections shared with us by professionals on that trip resurfaced in later pitches by
SMIF managers. Throughout a year of profound economic and political change in the world around us, this
group faced each new challenge in the market with confidence, courageously holding on to our conviction
buys in the midst of the late 2018 correction, and resisting the temptation to buy in to positions that didn’t
align with our outlook when the market began to tick back up at the beginning of the year.
Dr. Earl’s faculty advising strategy of “throwing us in to the deep end” and allowing us to “learn to swim”
proved effective as we created our own set of expectations and procedures that built on the foundation set by
our chartering documents and the work of previous classes. As a group, we strived for technical excellence
by enforcing an expectation that all financial analysis and valuation models were informed by deep industry
and company research.
In the spring semester, we took a more passive approach to our fund management by deciding against adding
any new positions to the portfolio and opting instead to discover how our existing positions would play out.
We focused a great deal of our efforts in the last couple of months on recruitment and selection. I made it my
personal mission to ensure that we encouraged the best and brightest finance students from across the Robins
School to apply and be a part of the SMIF experience. As you will see in this report, we developed a new
methodology for quantitatively evaluating candidates that I believe will contribute to the perpetual excellence
of the group going forward.
The new managers were selected for their academic achievement, practical finance experience, and technical
knowledge demonstrated through written reports and interviews. I am extremely confident that this group will
set a new standard for what it means to be a Robins School SMIF Manager.
I speak for all of us when I say that we will remember the role of SMIF in our undergraduate education. I hope
this annual report serves as evidence of the accomplishment of the 2018-2019 Student-Managed Investment
Fund, and as an indication that the best is yet to come.
Best Regards,
Jeremy Lacy General Manager
March 28, 2019
4
Overview & History
The Student Managed Investment Fund, also known as SMIF, provides valuable, real-time
experiential learning in security analysis and portfolio management. Managers gain real world
experience in topics and theories that are discussed in the classroom. SMIF is the capstone course to
the investment studies track; a sequence of courses developed by the Finance department over the
past decade.
The Student Managed Investment Fund was created in 1993 by the Board of Trustees with a transfer
of funds from the University’s endowment.
Process
Managers are chosen through a rigorous selection process that encompasses an application, written
research report, and a formal interview. All parts of this selection process are scored quantitatively.
The existing Managers make all selection decisions with oversight from the SMIF faculty advisors.
Once selected, Managers are encouraged to take courses in the “investment track” consisting of
Financial Management, Fixed Income & Derivatives, Investments, and Security Analysis & Portfolio
Management. Students manage the fund from April to April and receive one unit of academic credit
for their participation in the spring semester. Growth and Value fund meetings are held at least once
a week to evaluate the status of the fund and any other administrative duties that are pertinent to its
success.
SMIF is completely equity based and is split into a Growth Fund and a Value Fund. The two funds
are each comprised of seven to nine managers. A General Manager actively participates in both funds
and ensures the professional management of SMIF as a whole.
Managers act as security analysts and portfolio managers. Through many different research sources,
information is gathered in an attempt to lead to a buy or sell decision. Practical investment
knowledge, through field trips, internships, and a close working relationship with market
professionals, enhance the overall educational experience for the SMIF Managers. This generally
includes at least one trip to visit alumni working on Wall Street.
SMIF maintains working relationships with alumni and other professionals in the financial services
industry, acting as mentors for the managers of the portfolio. The managers work with faculty
advisors from the finance department as well as with an Advisory Board consisting of investment
professionals from the local Richmond community.
Each year, SMIF continues to improve and plays a unique role in the finance curriculum. Through
high caliber students, determination, and professional conduct, the Student Managed Investment
Fund will remain one of the most unique and prestigious programs offered at the University of
Richmond.1
1 As denoted in Student Managed Investment Fund Chartering and Historic Documents
5
SMIF Advisory Board Rob Allen Pat O’Hara
Capstone Financial Partners Agincourt Capital Management
Nancy Bagranoff Chris Pearson
University of Richmond Davenport & Co.
Perry A. Corsello, CFA Matt Rosenthal
Virginia Retirement System Aptimy
Christopher Dion Doug Sandler
Lowe, Brockenbough & Co. Riverfront Investment Group
John Earl Mark Schlegel, CFA
University of Richmond TFS Capital
Steve Fisher John Sherman
Virginia Asset Management Scott & Stringfellow
Cederic Fortemps George Smith
Matrix Capital Markets Davenport & Co
Patrick Gallagher Don Steinbrugge
Boxwood Partners Agecroft Partners
Steve Goddard Jerry Stevens
London Company University of Richmond
Chris Haberlin Cody Tafel
Davenport & Co. Thompson, Siegel & Walmsley
Roberta Keller Dennis Tarrant
Alexis Advisors Davenport & Co.
Ashley Long Dan Whitlock
1607 Capital Partners Virginia Retirement Systems
Jeffrey McNeill James Mallory
SunTrust Bank SunTrust Bank
6
Student Managed Investment Fund (SMIF) 2018-2019
Faculty Advisors
Dr. John Earl
Dr. Jerry Stevens
General Manager
Jeremy Lacy
Vice President of Recruitment
Julian Baretta
Growth Fund Managers
Head Manager: Bobby Piluso
Brad Gibson
Christian Berardo
Jack Tierney
Jess Wilson
Kate Schlinke
Keenan Shepard
Luke Knott
Ying Wu
Value Fund Managers
Head Manager: Matt Freda
Casey Begoon
Chilton Gaines
Dennis Smith
Julian Baretta
Pedro Balaban
Rishabh Jain
Ryan McCaffrey
Ryan Pasquali
7
Student Managed Investment Fund (SMIF) 2019-2020
General Manager
Claire Griffiths
Vice President of Recruitment
Alexandra Kohnert
Growth Fund Managers
Head Manager: Sheldon McMeans
Alexandra Kohnert
Andrew Nummy
Bennett Cooper
Blake Goodman
Caleb Michalak
Kathryn Shea
Lexi Serek
Will Gladstone
Value Fund Managers
Head Manager: Ben Smith
Caroline Zerkle
Chris Gilbert
Katrina John
Kirsten Lee
Laughlin Ashe
Marty Durkin
Michael Elliott
Ross Dimchev
8
SMIF Recruitment and Evaluation Process
Overview
The new manager class is the first class to have been recruited using a new quantitative evaluation process
that was proposed by previous managers. We broke the process into 4 steps: Outreach, Application Review,
Equity Research Report and Interviews. The process was designed so that SMIF is able to recruit the most
competitive applicant pool possible. While applicants were evaluated based on set criteria, the criteria were
not released to candidates in an effort to ensure a fair process for all applicants. With the addition of a
comprehensive scoring rubric, a new position was created: Vice President of Recruitment. This individual is
responsible for assisting the General Manager is the organization and running of the entire recruitment
process.
Outreach
This year, the group decided to expand our initial outreach to attempt to reach a more diverse group of
students. The General Manager sent a description of SMIF as well as the application process to all Junior
Finance concentrations in the Robins School. Members attended each section of Investments and
Introduction to Equity Analysis to provide a brief overview of the fund as well as outline the application
process. This year we also presented to Alpha Kappa Psi, Delta Sigma Pi, Women in Business, and Finance
Society.
Application Review
Applicants were first asked to fill out a brief application explaining their reasoning for why they wanted to
join SMIF and they also submitted their resume. Applications were assigned numerical scores based on
GPA, prior experience, future internship plans, and college involvement. Applications were graded by a
small group of SMIF managers and managers were not allowed to grade applications of related applicants
(Greek-life or other student organization affiliations). Applicants were moved to the next step in the process
if they met two criteria: A GPA of at least 3.2 and a grade higher than a B if they had completed
investments.
Equity Research Report
Each qualified applicant was randomly assigned a stock that SMIF currently owns to complete a research
report. They were also assigned a current member to act as a mentor and guide them through the process of
writing a research report. Reports were grade based on quality of content and the logic behind their
investment thesis. Each report was graded by a current manager and managers were prohibited from grading
reports of affiliated individuals. Candidates who completed their research reports were advanced to final
round interviews.
Interviews
Each candidate completed 3 separate interviews designed to simulate a super day as used in the investment
banking industry. Each interview room had a theme: Technical, Markets, and Behavioral. Similarly, each
room consisted of at least 2 current managers who did not share the same Greek life affiliation. Each
manager provided a score out of 4 for each individual and scores were averaged to calculate a single final
score for the candidate’s interview portion of their application. No interview question guide was used or
distributed in an effort to ensure the fairness of the interview process.
Final Selection
Each candidate’s three scores were aggregated to give a single final score out of 100. The 18 candidates
with the highest scores received offers to join SMIF. To select the final candidate, two managers conducted
a second round of interviews of three candidates to eliminate and biasing in score caused by different
reviewers. The 19th manager was selected by these managers.
9
Investment Policy Statement
Investment Philosophy
• The market consistently produces stocks that are incorrectly valued with regard to their fundamentals
• Both the Growth and Value Fund can implement fund-specific strategies to exploit these inefficiencies
through fundamental company analysis
• The fund strives to be educational in purpose; while it is our duty to seek investments we deem to be the
best use of the University endowment’s capital, the goal is to gain greater understanding of the process
behind portfolio management
• Growth fund is benchmarked against the SPYG ETF; Value fund is benchmarked against the SPYV ETF
Investment Process
1. Economic, sector, and company research reveals potentially attractive areas
2. Depending on fund, manager utilizes specific screens for underpriced securities in a specific sector
3. Manager pitches investment thesis to his/her respective fund
4. Fund votes on investment thesis, must receive majority vote to acquire position
5. Investments are continually monitored
Investment Criteria
• Properly executed sector and fundamental analysis reveals upside potential that outweighs downside
risks
• Managers should consider the sustainability of current fundamentals in the specific context of its sector
and industry
• Stocks must be from the Russell 1000 index1
Sell Discipline
• Positions are continually reassessed by the fund as a whole, and are sold if:
• Investment thesis/objective (as specified by manager who pitched it) is achieved
• New information changes risk/return profile of investment
• Stop loss is triggered
1 Note: managers have discussed allocating 10% of each fund devoted to small-cap investment. Currently, no small-cap
investments are held in either portfolio. However, next year’s managers are encouraged to allocate up to 10% of each
fund to small cap investments.
10
• Potentially volatile investments are accompanied by a stop loss that is determined by pitching manager
in the context of the individual investment
• Reassessment is required when holding has reached its targeted holding period
Investment Horizon
Upon takeover of the fund, new managers should reassess all holdings and examine if the investment thesis
remains true. Managers must not compromise holding period to one-year in effort to prop up short-term
performance for annual presentation to the board. Typical value horizons should range from 3-5 years, and
while positions can be liquidated and reallocated if the thesis weakens, decisions should not be made based
on the one-year time horizon of the managers on the fund. Typical growth horizons should range from 6
months - 2 years and should not be hindered by manager turnover.
Portfolio Allocation
• Attempt to diversify sector and individual weightings to manage risk
• Each sector is over or underweighted compared to benchmark based on sector research
• Properly use and monitor the attribution model to ensure that the fund is properly allocated
• Target 12-25 holdings per each side of the fund, with maximum holding as 12.5% of the respective fund
Inactive Trading Period
By nature of the fund, managers are not allowed to trade during the summer period between spring and fall
semester. During this period, cash balance may exceed the 5% barrier. All positions may be guarded by
stop-loss triggers in case of market downturn during the inactive trading period. Stop-loss trigger should be
loose enough to allow for market volatility.
11
Economic Overview & Analysis Part 1: U.S. Economy
The US economy continues to trend upwards as it recently made an impressive milestone for the
longest bull market in history – nine years, eight months, and twelve days. The labor market is tight,
sporting a record level of unemployment and rebounding wage growth. The three major stock indices,
DJIA, NASDAQ, and S&P 500, all reached record highs at the end of September. Since 2015, the Fed
has been raising interest rates from their all-time low of 0.25%. The Fed had a hawkish monetary policy
in 2018 which was intended to combat inflation over the past 3 years of high economic growth,
however, they have since halted this policy, and became dovish. The target Fed Funds rate currently sits
at 2.25%, and the Fed expressed its intention to not raise rates after the next FOMC meeting, but will
continue to evaluate the US Economy.
The unemployment rate has continued to trend downwards from its high in 2009 of 10.13%, reaching
3.8%, a level below the natural rate of unemployment of 4%. This hovers around the lowest level in
nearly fifty years. The economy has added jobs every month since October 2010, a 99-month stretch
that ranks the longest period of job growth on record. With tighter labor markets, theory suggest that
the scarcity of labor supply will push wages higher. Until recently, monthly wage increases persistently
undershot economist expectations. This combination of low unemployment and low wage growth aided
the Fed’s efforts in combating inflation through steady rate hikes. However, in June of 2018, we began
to see the labor slack diminished to a degree (4%) where it finally had upward pressure on wages.
Wage growth is now on pace with the average growth we have seen in past post-recovery periods.
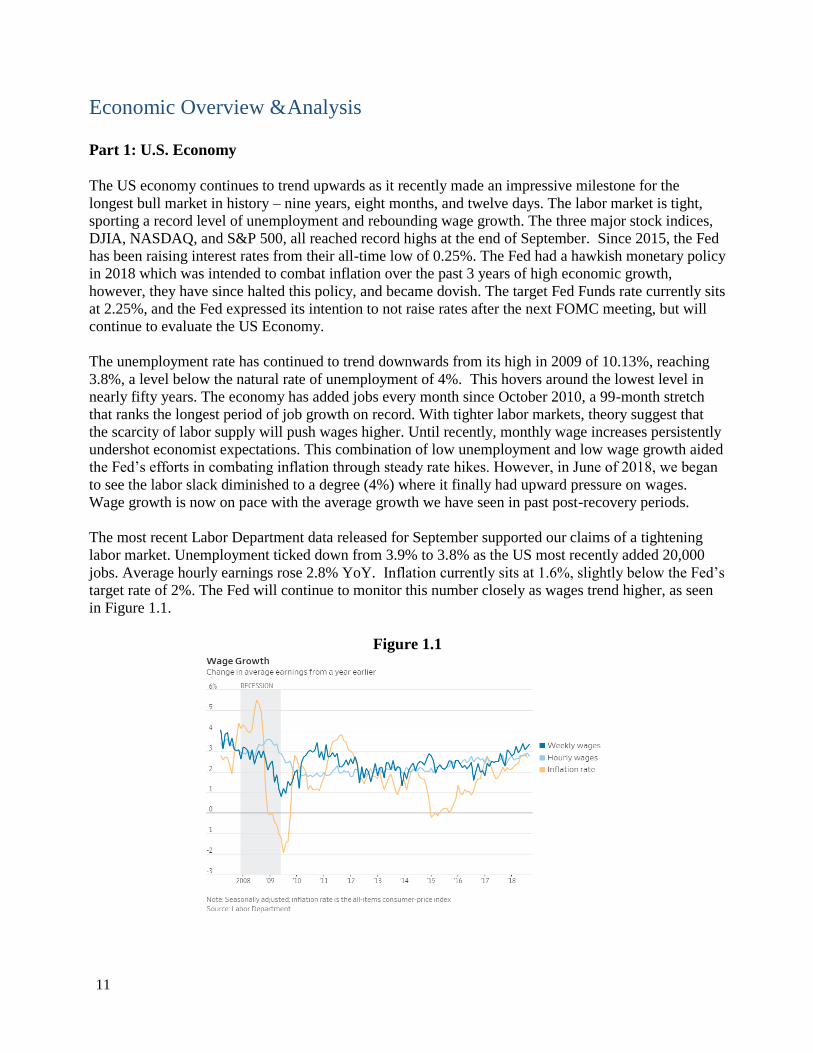
The most recent Labor Department data released for September supported our claims of a tightening
labor market. Unemployment ticked down from 3.9% to 3.8% as the US most recently added 20,000
jobs. Average hourly earnings rose 2.8% YoY. Inflation currently sits at 1.6%, slightly below the Fed’s
target rate of 2%. The Fed will continue to monitor this number closely as wages trend higher, as seen
in Figure 1.1.
Figure 1.1
12
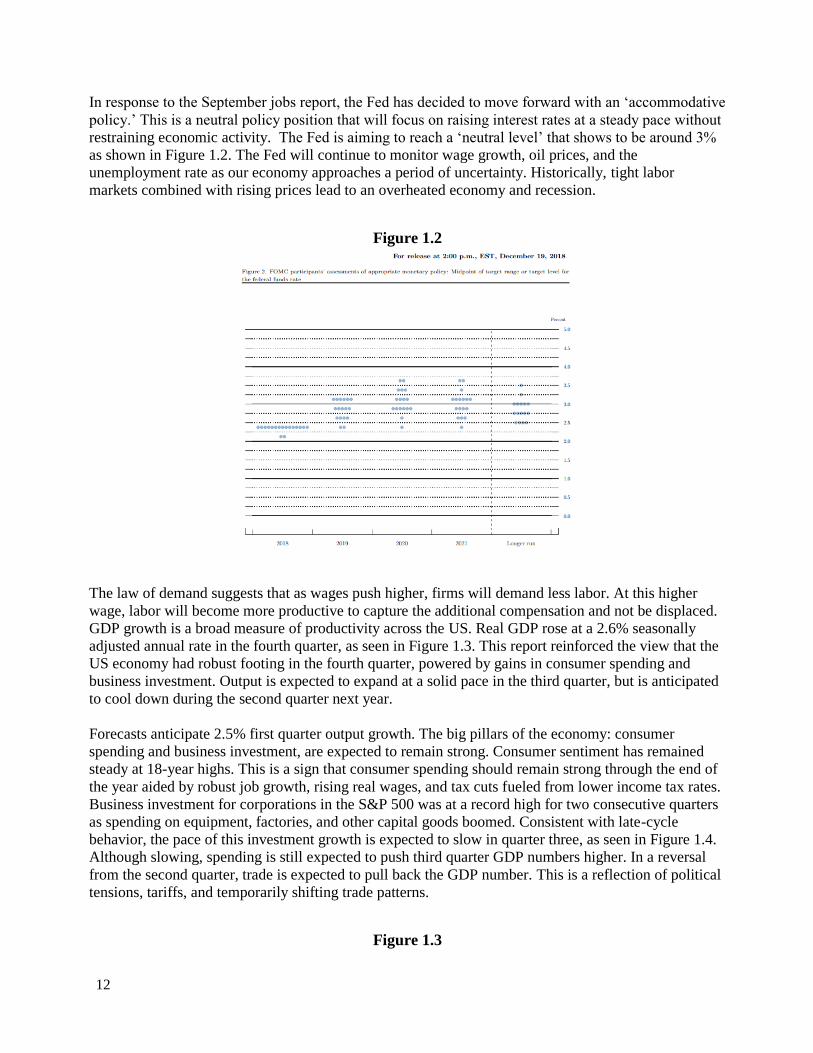
In response to the September jobs report, the Fed has decided to move forward with an ‘accommodative
policy.’ This is a neutral policy position that will focus on raising interest rates at a steady pace without
restraining economic activity. The Fed is aiming to reach a ‘neutral level’ that shows to be around 3%
as shown in Figure 1.2. The Fed will continue to monitor wage growth, oil prices, and the
unemployment rate as our economy approaches a period of uncertainty. Historically, tight labor
markets combined with rising prices lead to an overheated economy and recession.
Figure 1.2
The law of demand suggests that as wages push higher, firms will demand less labor. At this higher
wage, labor will become more productive to capture the additional compensation and not be displaced.
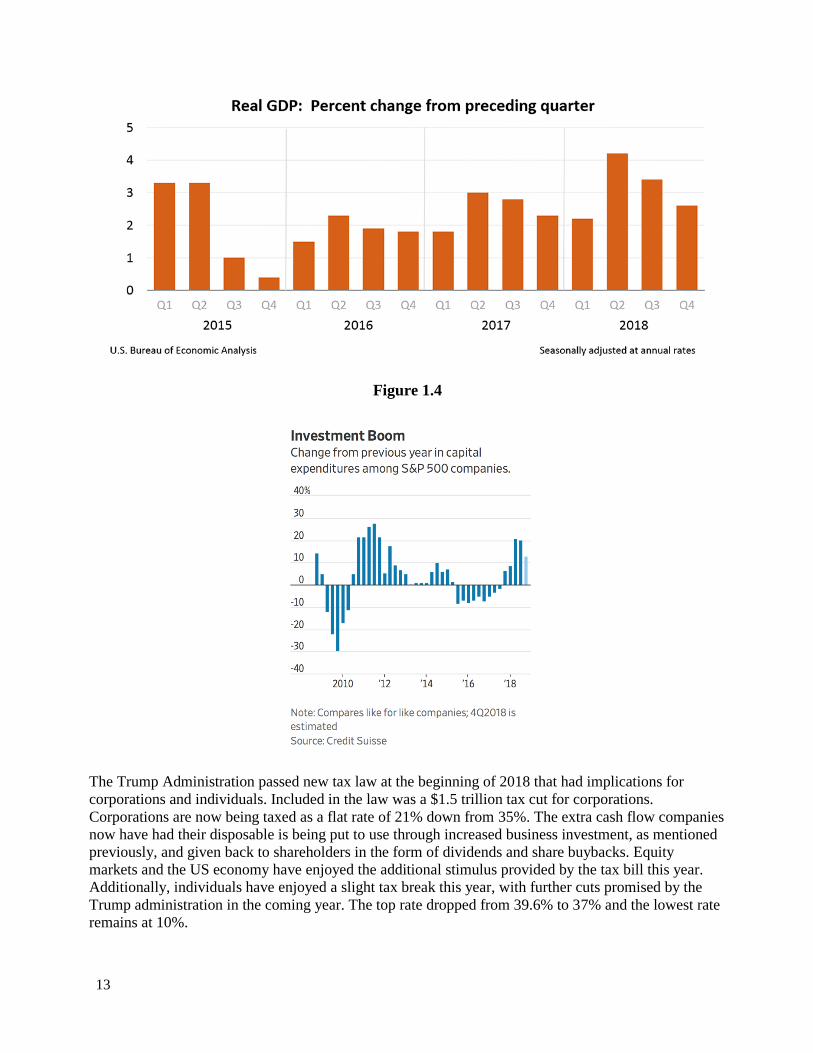
GDP growth is a broad measure of productivity across the US. Real GDP rose at a 2.6% seasonally
adjusted annual rate in the fourth quarter, as seen in Figure 1.3. This report reinforced the view that the
US economy had robust footing in the fourth quarter, powered by gains in consumer spending and
business investment. Output is expected to expand at a solid pace in the third quarter, but is anticipated
to cool down during the second quarter next year.
Forecasts anticipate 2.5% first quarter output growth. The big pillars of the economy: consumer
spending and business investment, are expected to remain strong. Consumer sentiment has remained
steady at 18-year highs. This is a sign that consumer spending should remain strong through the end of
the year aided by robust job growth, rising real wages, and tax cuts fueled from lower income tax rates.
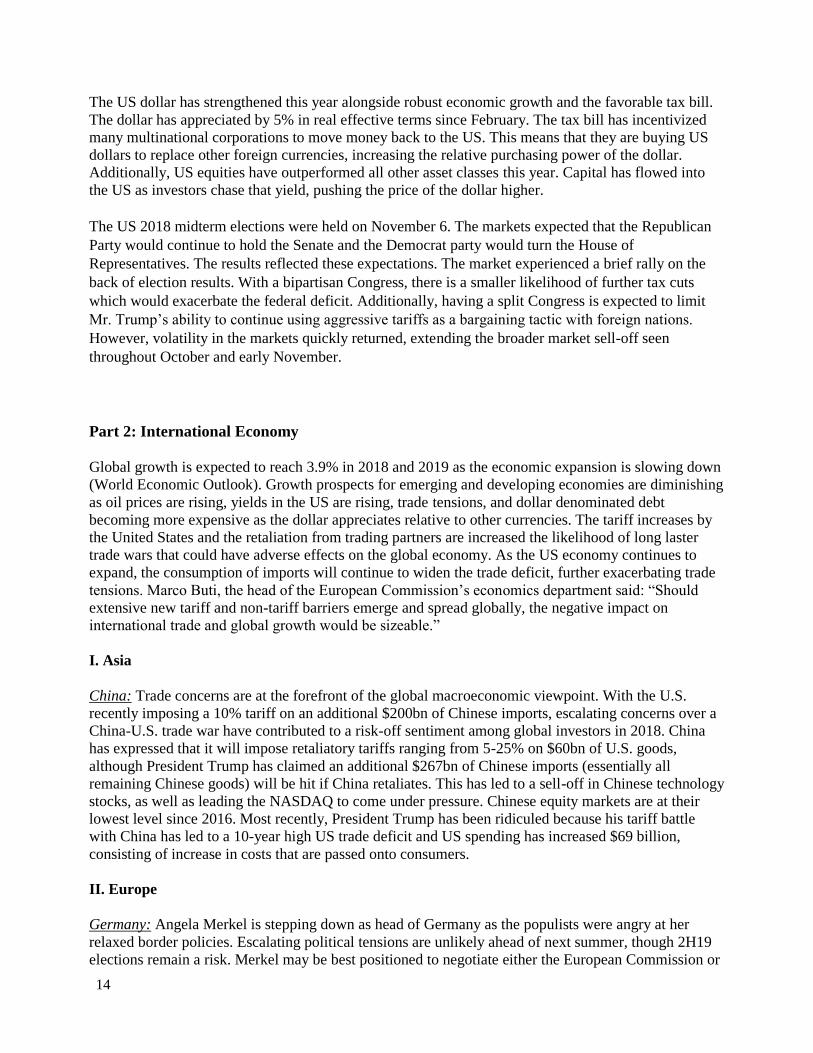
Business investment for corporations in the S&P 500 was at a record high for two consecutive quarters
as spending on equipment, factories, and other capital goods boomed. Consistent with late-cycle
behavior, the pace of this investment growth is expected to slow in quarter three, as seen in Figure 1.4.
Although slowing, spending is still expected to push third quarter GDP numbers higher. In a reversal
from the second quarter, trade is expected to pull back the GDP number. This is a reflection of political
tensions, tariffs, and temporarily shifting trade patterns.
Figure 1.3
13
Figure 1.4
The Trump Administration passed new tax law at the beginning of 2018 that had implications for
corporations and individuals. Included in the law was a $1.5 trillion tax cut for corporations.
Corporations are now being taxed as a flat rate of 21% down from 35%. The extra cash flow companies
now have had their disposable is being put to use through increased business investment, as mentioned
previously, and given back to shareholders in the form of dividends and share buybacks. Equity
markets and the US economy have enjoyed the additional stimulus provided by the tax bill this year.
Additionally, individuals have enjoyed a slight tax break this year, with further cuts promised by the
Trump administration in the coming year. The top rate dropped from 39.6% to 37% and the lowest rate
remains at 10%.
14
The US dollar has strengthened this year alongside robust economic growth and the favorable tax bill.
The dollar has appreciated by 5% in real effective terms since February. The tax bill has incentivized
many multinational corporations to move money back to the US. This means that they are buying US
dollars to replace other foreign currencies, increasing the relative purchasing power of the dollar.
Additionally, US equities have outperformed all other asset classes this year. Capital has flowed into
the US as investors chase that yield, pushing the price of the dollar higher.
The US 2018 midterm elections were held on November 6. The markets expected that the Republican
Party would continue to hold the Senate and the Democrat party would turn the House of
Representatives. The results reflected these expectations. The market experienced a brief rally on the
back of election results. With a bipartisan Congress, there is a smaller likelihood of further tax cuts
which would exacerbate the federal deficit. Additionally, having a split Congress is expected to limit
Mr. Trump’s ability to continue using aggressive tariffs as a bargaining tactic with foreign nations.
However, volatility in the markets quickly returned, extending the broader market sell-off seen
throughout October and early November.
Part 2: International Economy
Global growth is expected to reach 3.9% in 2018 and 2019 as the economic expansion is slowing down
(World Economic Outlook). Growth prospects for emerging and developing economies are diminishing
as oil prices are rising, yields in the US are rising, trade tensions, and dollar denominated debt
becoming more expensive as the dollar appreciates relative to other currencies. The tariff increases by
the United States and the retaliation from trading partners are increased the likelihood of long laster
trade wars that could have adverse effects on the global economy. As the US economy continues to
expand, the consumption of imports will continue to widen the trade deficit, further exacerbating trade
tensions. Marco Buti, the head of the European Commission’s economics department said: “Should
extensive new tariff and non-tariff barriers emerge and spread globally, the negative impact on
international trade and global growth would be sizeable.”
I. Asia
China: Trade concerns are at the forefront of the global macroeconomic viewpoint. With the U.S.
recently imposing a 10% tariff on an additional $200bn of Chinese imports, escalating concerns over a
China-U.S. trade war have contributed to a risk-off sentiment among global investors in 2018. China
has expressed that it will impose retaliatory tariffs ranging from 5-25% on $60bn of U.S. goods,
although President Trump has claimed an additional $267bn of Chinese imports (essentially all
remaining Chinese goods) will be hit if China retaliates. This has led to a sell-off in Chinese technology
stocks, as well as leading the NASDAQ to come under pressure. Chinese equity markets are at their
lowest level since 2016. Most recently, President Trump has been ridiculed because his tariff battle
with China has led to a 10-year high US trade deficit and US spending has increased $69 billion,
consisting of increase in costs that are passed onto consumers.
II. Europe
Germany: Angela Merkel is stepping down as head of Germany as the populists were angry at her
relaxed border policies. Escalating political tensions are unlikely ahead of next summer, though 2H19
elections remain a risk. Merkel may be best positioned to negotiate either the European Commission or
15
the ECB Presidency for a German candidate. Germany’s focus has turned to domestic issues, reducing
political capital and time spent on European issues, indicating that room for compromise with the EU is
more limited now than over the past decade. The potential for change in the German government with
more conservative leadership could mean a tougher stance on Euro area rescue mechanisms if they
become necessary while the ECB is withdrawing policy support. In an effort to solve the trade dispute
with the U.S., German officials say the Merkel government hopes to embrace U.S. natural gas to
perhaps diffuse the Trump Administration’s threats to sanction the proposed Nord Stream 2 gas
pipeline project (that would double Russia’s existing gas export capacity to Germany). With the
Merkel-led German national government faltering and Angela Merkel expected to step down,
uncertainty has reduced market enthusiasm for German securities despite a booming labor market and
subdued inflation.
Italy: New populist coalition is the greatest risk to the Eurozone and at the heart of discourse over
intercepting those crossing the Mediterranean. Concerns over Italian bonds à debt around 130% of
GDP. Italian bonds testing 3% mark. The Italian government faces a November 13 deadline to revise its
2019 draft budget plan and submit it to the European Commission. Italian data continues to come in
soft with GDP stalling in Q3 below consensus expectations of 0.1% qoq. Additionally, October’s PMIs
unveiled weakness in the manufacturing sector, signaling domestic demand slowing. Job creation has
been skewed toward low-quality jobs. These factors hint at the possibility for next year’s GDP
performance may fall short of the Italian government’s forecasts. Further market concerns have been
warranted by the economic outlook for the country becoming more challenging and speculation of
delayed implementations to some spending decisions in the 2019 budget bill.
European Central Bank: Inflation exceeded its 2% target in June, the first time since December 2012,
and accelerated to 2.1% in July. Mostly due to effects of energy prices, but core inflation also reached
1.2% in recent months. The ECB said they will keep interest rates at record-lows for longer as its
weakening economy derailed its plan to withdraw stimulus. The ECB is expected to hold USD $3.2
trillion at the end of 2018 and this level is expected to be held through the forecast period. Headline
inflation is expected to come in at 1.7% this year and 1.4% in 2019, versus consensus and ECB
expectations of 1.7% in both years. For core inflation, 2018 expectations lie at 1.0% and 2019 is left
unchanged at a weak 1.4%.
III. Emerging Markets
Turkey: Recep Tayyip Erdogan has pressured the central bank to keep rates down, but on Sept. 13 it
raised rates by 6.25% to 24%, far exceeding market expectations. The lira has fallen by 40% against the
dollar in 2018 and inflation is nearly 18%. YoY growth in Turkey has slipped 7.4% in Q1 and 5.2% in
the second. 18 of Turkey’s lenders were downgraded by Moody’s. Erdogan faced a coup in 2016; won
a subsequent election then held a referendum to tighten his control.
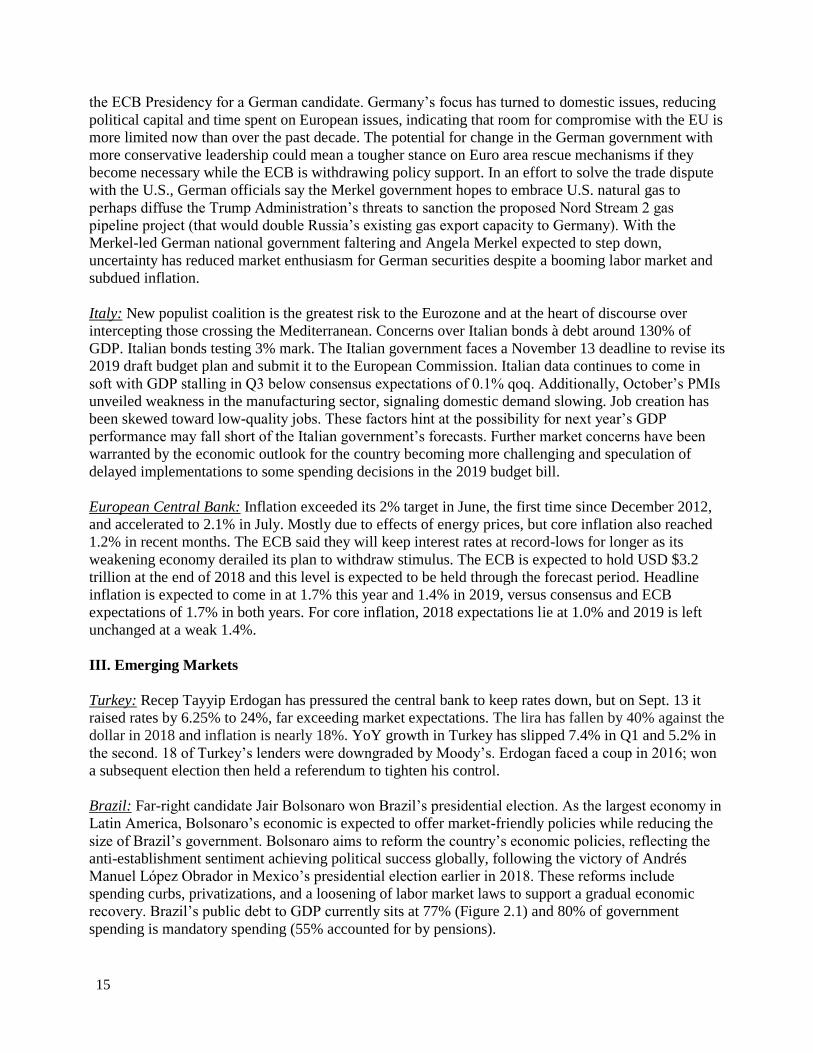
Brazil: Far-right candidate Jair Bolsonaro won Brazil’s presidential election. As the largest economy in
Latin America, Bolsonaro’s economic is expected to offer market-friendly policies while reducing the
size of Brazil’s government. Bolsonaro aims to reform the country’s economic policies, reflecting the
anti-establishment sentiment achieving political success globally, following the victory of Andrés
Manuel López Obrador in Mexico’s presidential election earlier in 2018. These reforms include
spending curbs, privatizations, and a loosening of labor market laws to support a gradual economic
recovery. Brazil’s public debt to GDP currently sits at 77% (Figure 2.1) and 80% of government
spending is mandatory spending (55% accounted for by pensions).
16
Figure 2.1
One of Bolsonaro’s key aims is tackling Brazil’s debt problem through pension reform, halving the
number of government ministries and extending privatization of state enterprises. Brazil’s key
challenge is a growing debt burden that has been bolstered by massive social security obligations.
Investors should be focused on the potential for fiscal savings from any future cuts to benefits
following social security reform. Despite the Brazilian economy recovering from a 2015-2016
recession, Brazilian risk assets have rallied since Bolsonaro’s polling prospects improved ahead of the
first round of the election. The Central Bank of Brazil has been holding rates at a record low of 6.5%
with room to tighten in the face of any inflation scares. Brazil’s longer-term prospects hinge on the new
administration’s progress in addressing government debt levels following the conclusion of a series of
contentious political matches in Latin America.
IV. Middle East
Saudi Arabia: Tensions with Saudi Arabia have escalated over the recent death of Washington Post
journalist Jamal Khashoggi, an outspoken critic of the Saudi government. Additionally, the ongoing
conflict in Yemen as well as President Trump efforts to influence oil prices have strained tensions. Mr.
Trump, seeking to mitigate threats to the U.S. economy following the midterm elections, has pressed
the Saudis and OPEC to keep oil production at current levels, instead criticising oversupplied
conditions that should lead to lower oil prices. These criticisms of the Saudi government come as the
U.S. has ended refueling support for the Saudi-led coalition fighting against Houthi rebels in Yemen.
While Mr. Trump is not expected to impose drastic sanctions over the Khashoggi killing, the Trump
Administration is reportedly considering sanctions on some Saudi officials.
Oil: On November 8, the U.S. crude benchmark fell into bear market territory having fallen 20% from
its October 3 peak of $76.41 per barrel. Following a selloff on fears of growing U.S. output and
weakening global demand, West Texas Intermediate crude hit a low of $55.69 per barrel on November
17
13. A strong dollar, boosted by strength in the U.S. economy and interest rate hikes by the Federal
Reserve, has weighed both on oil prices and the global demand outlook. A stronger dollar makes
commodities such as oil more expensive in international markets by eroding the purchasing power of
currencies that have weakened relative to the dollar. Moreover, the Energy Information Administration
(EIA) has raised estimates for U.S. daily output to 11.60 million barrels per day for the week ended
November 2 due to an apparent increase in production from offshore projects in the Gulf of Mexico
coming online. However, it is unlikely that U.S. production will continue to soar in 2019 given long-
term development cycles, high costs, and a lingering recovery from the last downturn in oil prices.
On the international front, OPEC appears committed to continue production cuts in response to a
weakened global demand forecast. In addition, output has risen materially in several key OPEC nations:
Saudi Arabia has seen an increase from 9.95 million barrels per day to 10.63 million barrels per day;
the U.A.E has seen an increase from 2.85 to 3.16 million barrels per day; Iraq--long seeking to increase
production--has seen output soar from 4.441 to 4.653 million barrels per day; and Russia, though not
part of OPEC, has also witnessed an increase in production. Venezuela’s economy has been in collapse
and the country is not expected to lift oil production--even though 90% of the economy’s revenue is
reliant on production. Iran is largely a wildcard with sanctions recently reenacted in November, though
little impact has been seen thus far. Saudi Aramco announced that it will abandon plans for a ~$70bn
corporate bond sale to fund an ownership stake in SABIC, Saudi Arabia’s national petrochemical
company, due to concerns over uncertainty in the oil market increasing the cost of borrowing and
dampening the demand for Aramco debt. Though it seems unlikely that OPEC will continue to cut
output and allow the United States to absorb global demand, current levels of uncertainty in the market
warrant the recent pullback and suggest volatility will remain high in the near-term.
V. Trade
Trade Talks: The United States reached a trade agreement with Mexico and Canada, revamping the
current agreement called NAFTA. The United States-Mexico-Canada Agreement (USMCA) focused on
logistics surrounding car manufacturing and dairy products. This was an important accomplishment for
the Trump Administration, and the market responded positively to it. Optimism for the German
economy has improved since President Trump agreed to refrain from imposing auto tariffs on the
European cars in an August meeting with European Commission President Jean-Claude Juncker.
Current figures point to 0.5% growth in the German economy in Q3. Both Germany and Italy face high
rates of asylum-seekers entering the country each day.
18
Growth Fund Overview
Growth Fund Philosophy
The Growth Fund’s investment philosophy consists of three foundational principles: market inefficiency, the
supremacy of a top-down approach, and security momentum. We believe that by actively managing our
portfolio we can achieve above-market returns —that is, returns in excess of our benchmark, the S&P 500
Growth Index. We believe that an optimal investing strategy first establishes a broad economic outlook that
identifies industries with exceptional growth potential and follows this with analysis and selection of
individual securities within those favorable industries. Additionally, we believe that rising stock prices tend
to rise further, while falling prices tend to keep falling.
Growth Fund Strategy and Tactics
The Growth Fund’s investment strategies and tactics are rooted in the three foundational principles of our
investment philosophy outlined above. Our managers employ a top-down investment strategy by first conducting
thorough economic analysis of the domestic economy, as well as researching global economic factors that may
impact domestic industries and firms. Some economic factors we have been monitoring this year have included:
foreign and domestic monetary policy, unemployment numbers, oil prices, the Chinese economy, and U.S.
consumer spending. We have also monitored industry factors, including: technological trends, demographics
trends, lifestyle trends, industry regulation, industry life cycle, barriers to entry, substitute products or services,
customer bargaining power, supplier bargaining power, and existing competition.
Once our managers have discerned industries with outstanding growth prospects, they search for the most
advantageous stocks within those industries. The Growth Fund believes in the investing principle of momentum—
that is, we believe that rising stock prices (“winners”) tend to rise further, while falling stock prices (“losers”) tend
to continue falling. Within the industries that we have determined to be favorable, we screen for stocks with recent
high returns. We then employ other techniques and strategies from both fundamental and technical analysis in our
pursuit of excess return.
SMIF ’18-’19 conducted a range of methodologies in order to determine the implied fundamental value of the
firms we invested in including: discounted cash flow analysis, company comparable using a range of multiples
and S&P Normalizations. While growth investing is primarily concerned with the story of the firm and less about
a company’s implied value relative to its current price, we used the valuations to see if we felt the story warranted
a higher implied upside. If we liked a company’s business model, but felt the valuation was above levels we
thought were justified by the story, we would likely turn to other investments. We identified trends in the current
market that would grow as rapid adoption took place such as Genome Sequencing, and sought out firms that were
best positioned to take advantage of that trend. We were less concerned with firms that produced steady cash flow,
and focused more on companies that had extreme top line growth. As growth investors, we were not deterred from
firms that were not profitable.
Buy Decisions and Sell Discipline
We generally predict holding periods of 6 to 18 months as research has shown that this is approximately the period
over which momentum generates excess return. However, we will occasionally make trades based on shorter-term
market views. We endeavor to establish price targets and we continually reassess our positions based on new
economic, industry, and company news. Thus, we make sell decisions when a stock has reached its price target and
our re-evaluation has not changed our view, or when the stock has failed to reach its price target (or even declined)
and our re-evaluation has changed our view.
19
Performance Overview
• Over the past year, our fund has had a return of 10.87%, while our benchmark, the SPDR S&P 500 Growth
Index, returned 9.64%. Our fund outpaced the benchmark by 1.23%.
• Our sector weights are currently: Technology 23.73%, Consumer Discretionary 28.01%, Healthcare 10.06%,
Financials 11.01%, Industrials 9.59%, and Cash 17.61%.
• We are currently overweight Consumer Discretionary by 11.34%, Financials by 5.66% and cash 17.61%.
• We are currently underweight Healthcare by 7.30%, Industrials 0.28%, Technology by 18.03%, and
Consumer Staples 4.21%.
• We currently have zero exposure to the Energy, Real Estate, Utilities, Consumer Staples or Telecom sectors.
• Our best performing positions are: Square Inc. +48.95%, and Abbott Laboratories +36.71%, Netflix
+26.06%, and Estee Lauder +24.74%.
• Some of our worst performing positions were Baidu Inc., Raytheon Company, and Illumina Inc.
• The beta of our portfolio is 0.97.
20
Growth Fund Attribution Model
Attribution Model Overview
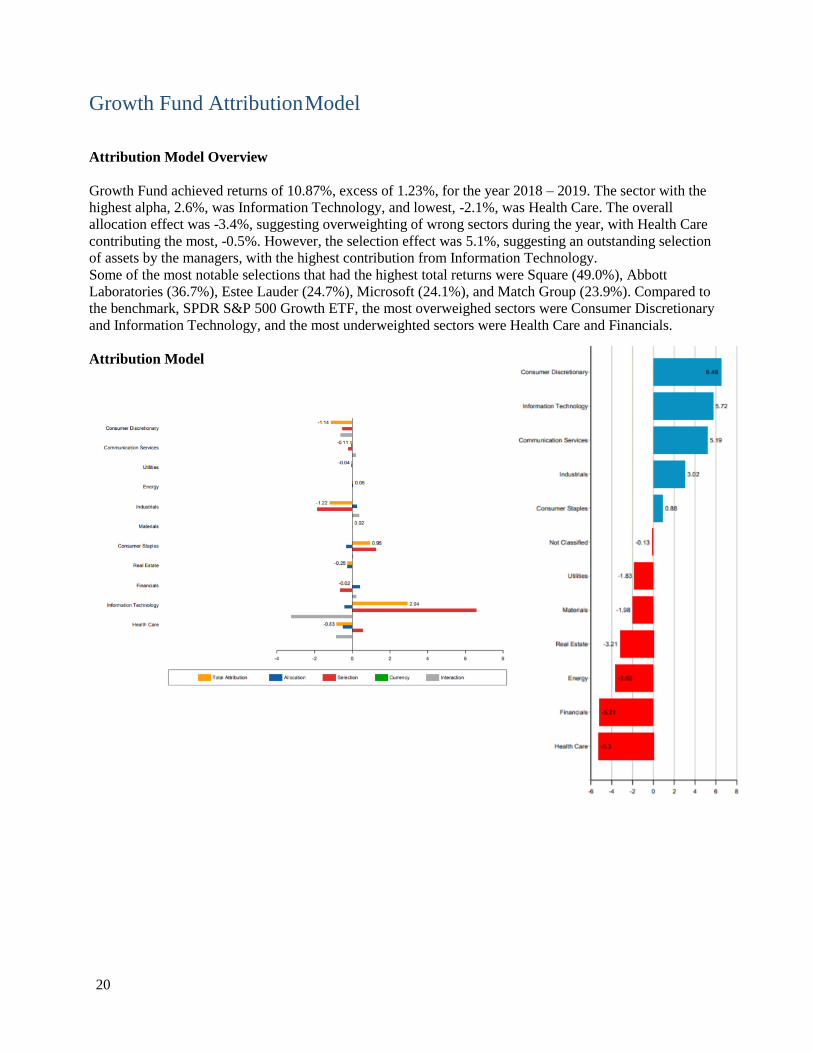
Growth Fund achieved returns of 10.87%, excess of 1.23%, for the year 2018 – 2019. The sector with the
highest alpha, 2.6%, was Information Technology, and lowest, -2.1%, was Health Care. The overall
allocation effect was -3.4%, suggesting overweighting of wrong sectors during the year, with Health Care
contributing the most, -0.5%. However, the selection effect was 5.1%, suggesting an outstanding selection
of assets by the managers, with the highest contribution from Information Technology.
Some of the most notable selections that had the highest total returns were Square (49.0%), Abbott
Laboratories (36.7%), Estee Lauder (24.7%), Microsoft (24.1%), and Match Group (23.9%). Compared to
the benchmark, SPDR S&P 500 Growth ETF, the most overweighed sectors were Consumer Discretionary
and Information Technology, and the most underweighted sectors were Health Care and Financials.
Attribution Model
21
Growth Holdings
Abbott Laboratories
Ticker: ABT
Current Price: $78.22
Purchase Price: $66.80
Company Description
Abbott Laboratories discovers, develops, manufactures, and sells a broad and diversified line of health care
products. It operates through the following segments: Established Pharmaceutical Products, Nutritional
Products, Cardiovascular and Neuromodulation Products, and Diagnostic Products.
Top-Down Reasoning
The health care sector is in a strong position. It has had decent performance over the past 12 months and
this level of performance should continue into 2019. In terms of the balance sheet, firms in the sector are in
a good position with large amounts of cash. Additionally, demand is on the rise for health care products and
services, due to an aging population. Lastly, the sector may see a continued benefit should rate hikes rise.
The healthcare sector has historically outperformed during times of increasing fed rates.
Upside Catalysts:
• Synergies from Recent Acquisitions: The acquisitions of St. Jude and Alere have provided synergies
that helped sales growth of 17% for the quarter yoy and led management to up full year guidance for
EPS. The acquisition of St. Jude in particular helps Abbott in the cardiovascular, diabetes, and
neuromodulation lines of business.
• New Products: New products such as Freestyle Libre and Masters HP rotating heart valve top the list of
the innovative products Abbott has been adding to their offerings.
• Organic growth in 6-7% range with EPS expected to grow in 12-16% range
Downside Risks:
• Slowed Growth in Medical Devices: Lost market share in the cardiac rhythm management space to
competitors Boston Scientific and Medtronic
• Increased competition in molecular diagnostics space
• Regulatory uncertainty within the space poses an issue to the whole sector
Investment Thesis
Favorable conditions within the healthcare industry combined with strong catalysts make Abbott an
attractive investment. The acquisitions of St. Jude and Alere have been paying off thus far, and their organic
growth is strong in the 6-7% range. Their stock is currently sitting at the top of the 52-week range so for that
reason I assign Abbott a hold rating.
22
Adobe Inc.
Ticker: ADBE
Current Price: $255.98
Purchase Price: $215.00
52-Week Range: $277.61/$204.95
Target Price: $275.00
Company Description:
Adobe Systems is a software and services company which helps customers create, distribute, and
manage digital content from the cloud. One of the top publishing software providers, it has been
known for flagship products such as Acrobat, Photoshop, Flash, and Dreamweaver. Adobe serves
customers such as content creators and web application developers with its digital media products,
and marketers, advertisers, publishers, and others with its digital marketing business.
Top-Down Reasoning:
Continued global digitalization and improvements in technology will continue to support the
information technology sector. Adobe benefits from a strong brand name and a continued focus on
research and development in order to diversify and increase revenue streams in a competitive
market.
Upside Catalysts:
• Subscription-based model shift will continue to boost revenues and demand for products
• Strong margins and free cash flow compared to competitors
• Diversification in product portfolio through acquisitions (Magento, Marketo, Allegorithmic)
Downside Risks:
• Technology valuations remain high, and Adobe is no exception with a trailing P/E of 48. While, Adobe
is well positioned with its subscription revenue model and cloud computing to continue to perform well,
a shift into a recession could hurt demand and operating margins.
• Adobe faces heavy competition in the digital marketing space against competitors such as Salesforce
and Oracle.
Investment Thesis:
We believe Adobe’s flagship products, diversification in revenue, and growth resulting from cloud
computing and a SaaS business model make it well-placed to continue to achieve strong growth in earnings.
23
Amazon.com, Inc
Ticker: AMZN
Current Price: $1,620.80
Purchase Price: $1,495.60
52-Week Range: $1,307.00-$2,050.50
Target Price: $2,140
Company Description:
Amazon.com, Inc. is an American electronic commerce and cloud computing company based in
Seattle, Washington. It offers a wide range of products and services through its websites and digital
platforms. The company is internationally diversified with products that include merchandise and
content that it purchases for resale from vendors and those offered by third-party sellers. In
addition, Amazon manufactures and sells a line of electronic devices such as the Alexa and Echo.
Through its recent acquisition, Amazon now owns and operates the Whole Foods Market brand of
grocery stores.
Top-Down Reasoning:
Driven by increased consumer spending and the rapidly growing number of total internet
connections, revenue for the e-commerce industry in the United States is expected to rise at an
annualized rate of 9.2% over the next five years. Global retail e-Commerce market is expected to
witness a high growth on account of favorable attitude towards new shopping channels and is
projected to grow at a CAGR of 10% from 2016 to 2024. The industry is at the growth stage of its
life cycle. At 35.2%, Amazon is the only player with greater than 5% of U.S. market share at the e-
Commerce industry. The global market for public cloud is expected to expedite at a CAGR of
22.78% during 2017 to 2023, a market where 10% of Amazon’s sales come from.
Upside Catalysts:
• Since cloud computing business has been a hot topic, Amazon can take advantage of the
increased demand for SaaS (software as a service).
• Amazon’s strategy of gradually merging online and offline retail can help it not only reshape
the retail landscape but also fend off competition.
• Amazon has built a strong position in the fast-growing market and the high growth are likely to
be sustained over the next few years.
Downside Risks:
• The competition in online retail is heating up.
• While expansion opportunities increase globally, currency continues to have a significantly
negative impact on its e-commerce results.
• Amazon’s global margins is under pressure.
Investment Thesis:
According to its stellar financial performance, proven track record of innovation, and customer-
centric business model, Amazon is expected to grow rapidly in the next few years. The one-year
price target, calculated as the average of an S&P normalization, discount cash flow model and the
analyst estimates, implies a 32% upside at $2,140.
24
Ametek Inc
Ticker: AME
Current Price: $80.96
Purchase Price: $80.55
52-Week Range: $63.14 - $81.92
Target Price: $95.00
Company Description:
Ametek is a global manufacturer of electronic instruments and electromechanical devices in the aerospace,
power, health care and industrial markets. The firm is header quartered in Berwyn, Pennsylvania, and has
150 manufacturing facilities throughout the world. The geographic breakdown of sales is 50% in the U.S.,
25% in Asia, and 25% in Europe. One of the two main divisions, the electronic instruments group (EIG)
creates instruments for oil & gas, automation, aircraft and engine sensors. The other division,
Electromechanical group, creates electrical connectors and heat exchangers for aerospace and defense,
hydraulic pumps, industrial blowers and aviation maintenance.
Top-Down Reasoning:
The U.S economy is growing at a slower rate than the previous few quarters with Q4 2018 GDP growth of
2.6%. In addition, a strong labor market with unemployment at 3.8%, inflation below the Fed’s target of 2%
at 1.5% and interest rates hovering around 2.5%, many U.S. stocks are poised to take advantage of the
strong economy. Despite the slower growth, Ametek’s industry is seeing an uptrend in demand for more
advanced technologies. There has been major consolidation amongst the largest players in the space, with
M&A accounting for the majority of growth in the industry.
Upside Catalyst:
• Management announced a goal to double the company in the next through years through a combination
of organic growth and inorganic growth. The Street as a whole has accepted this plan which is reflected
in the bullish sentiment by equity research analysts and a stock that has performed well in the end of
2018 and beginning of 2019.
• Ametek has historically had a strong acquisition methodology where they looked for strong
management teams and solid cultural fit, operational synergies, and technically differentiated products
and services. Most of their acquisitions have been EPS accretive by the first year.
Downside Risks:
• Inability for management to stick to the goal of doubling the company without putting the company in
financial risk.
• Issue debt to acquire companies resulting in higher leverage and lower coverage ratios which can
negatively affect the company’s liquidity and free cash flow balance.
Investment Thesis:
Ametek Inc. has a goal of doubling its revenue to $8bn by 2022 through both organic and inorganic growth.
The company has been extremely effective in its past acquisitions and will likely continue the trend as it
seeks to acquire companies that offer differentiated products. Historically, it has outperformance its peers in
organic growth and with the acquisition growth, it has been able to expand into other sub-industries much
faster than its peers.
25
Alibaba Group Holding Ltd
Ticker: BABA
Current Price: $175.03
Purchase Price: $181.20
52-Week Range: $129.77-$211.70
Target Price: $230
Company Description:
Alibaba Group Holding Ltd. was founded in 1999 and is based in Hangzhou, the People’s Republic
of China. Alibaba is a Chinese multinational holding company and one of the largest internet
companies in the world. Their subsidiaries provide e-commerce, retail, internet infrastructure, AI,
technology, online financial, and internet content services. Alibaba’s e-commerce and retail service
platforms include Alibaba.com, AliExpress, Taobao, Fliggy Corporate, Tmall, Lazada, and 11
Main. The company provides consumer to consumer and business to consumer, but primarily
provide their solutions for businesses.
Top-Down Reasoning:
China is the largest and most innovative retail e-Commerce market in the world. With a forecasted
CAGR in the double digits, online retailing is expected to grow from 18.4% of total retail sales in
2018 to 25% by 2020. The internet sector is maintaining sales momentum in 2018 on strong
demand for mobile ads and e-commerce goods. Longer-term revenue levers, such as artificial
intelligence, virtual reality and messaging, remain nascent.
Upside Catalysts:
• The Chinese economy has seen great economic growth with a GDP Growth rate of 6.0% in
2019 as compared to 2.4% in the US.
• Alibaba has the most access to the growing Chinese economy where consumers are gaining
more spending power and access to internet.
• Alibaba is invested in expanding into the international market which offers an opportunity for
significant growth beyond just China.
Downside Risks:
• China is predicting a slowdown in growth in 2019 from 6.5% to 6.0%.
• Alibaba has strong competitors such as Amazon, eBay, Baidu, Tencent, and JD.com.
• China has yet to achieve their change to an internet and consumer driven economy which
Alibaba heavily relies on in order to reach its long-term growth potential.
• Aggressive investments and acquisitions in the industry pose uncertainties.
Investment Thesis:
Alibaba dominates the online retail and the cloud computing markets in China which is Asia’s
largest economy and is projected to become the largest economy in the world. Alibaba is
positioned well to capitalize on growth opportunities in both the Chinese and international
economies. With favorable economic outlook, this is a great opportunity to bay rapid growth at a
relatively cheap price. The one-year price target, calculated as the average of three valuation
models and the analyst estimates, implies a 31.4% upside at $230.
26
Baidu Inc.
Ticker: BIDU
Current Price: $166.65
Purchase Price: $230.08
52-Week Range: $153.78-$284.22
Target Price: $220
Company Description:
Baidu, Inc. operates an internet search engine. The Company offers algorithmic search, enterprise
search, news, and image searches, voice assistance, online storage, and navigation services. The
Company attracts over one-third of China’s online advertisement spending, is a global leader in
Artificial Intelligence, and operates China’s number one video streaming service. Although the
Company’s main focus is in China, Baidu also has operations in Brazil, Indonesia, Thailand, and
Japan.
Top-Down Reasoning:
We selected Baidu because it has been a high growth company for many years and operates in the
growing Asian market. It has a unique advantage over its competitors as a company that is thought
of as the “Google of China.”
Upside Catalysts:
• China has the world’s largest Internet user population, at $731 million, and Baidu is the leading
internet search provider with the largest market share in China’s search engine market.
• Baidu’s iQivi video streaming service presents an excellent opportunity for future growth in
video and monetization
• The Chinese government is trying to increase growth with stimulus measures, which may
bolster Chinese companies back to high levels of earnings and stock prices.
• Baidu plans to utilize its strength in search and video to capitalize on AI technology, which is
supported by China’s commitment to lead the future of AI.
Downside Risks:
• Increasing competition from competitors such as Alibaba and Tencent threatens their ability to
dominate the advertising and digital streaming markets.
• Baidu is highly exposed to the Chinese market and, if the trade war between China and the
United States does not end, Baidu’s stock price will continue to drop.
Investment Thesis:
We believe that the company will benefit China’s e-commerce strength and additional emphasis on
online advertising. Its leadership in the search, and video field and entrance into future
technologies such as artificial intelligence will drive the stock price moving forward. We think that
Baidu’s growth is cheaply priced, especially after the recent sell-off of Chinese stocks.
27
Estee Lauder, Inc.
Ticker: EL
Current Price: $160.83
Purchase Price: $126.58
52-Week Range: $121.41 - $163.79
Target Price: $170
Company Description:
Estee Lauder (EL) is one of the world's leading manufacturers and marketers of prestige skin care, makeup,
fragrance and hair care products. EL's products are sold in over 130 countries. Brands include: Estee Lauder,
Clinique, MAC, La Mer, Bobbi Brown, Jo Malone, Origins, Bumble & Bumble, Smashbox, Tom Ford,
Aveda, Too Faced, and Aramis. The company sells its products through department stores, specialty multi-
brand retailers, upscale perfumeries, pharmacies, and salons and spas; freestanding stores; e-commerce
Websites; stores in airports and on cruise ships; in-flight and duty-free shops; and self-select outlets. It has
operations in the Americas, Europe, the Middle East, Africa, and the Asia Pacific. The Estée Lauder
Companies Inc. was founded in 1946 and is based in New York, New York.
Top-Down Reasoning:
Given concern over the possibility of an economic slowdown in 4Q18 and uncertainty regarding global
macroeconomic trade conditions, large-cap, global growth opportunities seem attractive. While remaining
focused on significant possibilities for growth, Estee Lauder remains positioned to capitalize upon a
propensity for consumers to spend on high-end beauty and makeup products during the gift-giving season.
Moreover, EL is a dominant player in high-end fragrance and cosmetic categories sold in more than 150
countries worldwide, giving the company a globally diversified portfolio to access in the event of an
economic downturn. Finally, EL has four brands generating over $1bn revenue; with the namesake Estee
Lauder brand growing 22% in FY18.
Upside Catalysts:
• 20 - 25% of sales attributable to new products / line extensions indicates willingness to adapt to
consumer trends to remain current
• Core brands remain underpenetrated in global distribution
Downside Risks:
• Slowdown in major country markets, especially with outsized exposure to China
• Slow consumer acceptance of new products
• Concerns over weak U.S. department store traffic trends
• Decelerating travel retail with Chinese customs agents implementing tighter controls
Investment Thesis:
Estee Lauder has an enviable portfolio of high-end beauty brands that has led to a wide economic moat in
prestige beauty category with an estimated 15% of the global market share. The company maintains material
pricing power given that skin care consumers are averse to untested products, the its lines have strong brand
recognition and demand for EL high-end products are somewhat inelastic. Moreover, the company is
executing well on its strategy with EL brands’ prestige positioning will serve well in international markets
and U.S. Finally, high-touch services to Estee’s eCommerce platform (how to videos, online beauty
advisors, etc.) will garner heightened brand loyalty.
28
Facebook, Inc.
Ticker: FB
Current Price: $171.26
Purchase Price: $160
Company Description
Facebook, Inc. is the world’s largest online social network, boasting over 2 billion active users. The
Company website allows people to communicate with their family, friends, and coworkers via messaging,
photo sharing, and event-creating features. Facebook Inc. consists primarily of Facebook, Instagram,
Messenger, and WhatsApp. These platforms can be used on mobile devices and on desktops. 90% of
Facebook’s revenue comes from advertising. Facebook has been under a microscope recently after a data
breach in March 2018 followed by investigation by the FTC and push for tighter regulation coming from
Washington.
Top-Down Reasoning
Facebook’s 4Q results easily beat consensus expectations and daily user count grew sequentially in the
largest advertising spending markets (US and Europe) even as the firm remains in the midst of addressing
data security and privacy issues. In addition, Facebook managed to further monetize their users during the
quarter. Further growth by Instagram, IGTV, and stories will continue to attract advertisers to Facebook’s
platform. However, management did not change its 2019 guidance and expects further deceleration in top
line growth. In addition, management expects capital expenditures and expense growth to outpace revenue
growth in 2019. Facebook’s continued growth in ad revenue per user (ARPU) indicates advertiser’s
willingness to pay more for Facebook-placed ads as they expect a higher return on investment from targeted
adds. Going forward, Facebook is expected to have double digit top-line growth going through 2023. With
further investment in R&D, content creation, and date security, it is expected for the company’s operating
margin to decline. Over the next 5 years, CAGR for total revenue is expected to be 17% with an operating
margin of 36%.
Upside Catalysts:
• 5% five-year CAGR in Facebook’s monthly active user due to strong growth in ASIA
• Clear-cut social media leader and the synergies that come with its portfolio
• Over 2 billion monthly active users that spend over 50 mins a day on its apps
Downside Risks:
• Many users are concerned about FB’s many recent and significant breaches
• However, they are investing heavily in data security
• Investors are concerned with growing calls to regulate FB especially in the UK and EU
• Facebook’s main platform losing prominence ore becoming “uncool”
• Instagram and WhatsApp among others are good hedges
Investment Thesis
Facebook is a behemoth of a company that continues to attract the money of advertiser’s due to its highly
engaged users and ability to specifically target customers. It has been a rollercoaster of a year for the company,
but they are finally starting to gain some momentum after their dip this past summer. With the combination
of their main platform ginormous market share and their recently acquired and extremely successfully apps
such as Instagram and WhatsApp, Facebook is poised to continue their dominance.
29
Alphabet Inc.
Ticker: GOOGL
Current Price: $1,149.97
Purchase Price: $1,026.60
52-Week Range: $977.66-$1,291.44
Target Price: $1,380
Company Description:
Alphabet Inc. is an American multinational conglomerate. The Company’s portfolio encompasses
several industries, including technology, life sciences, investment capital, and research. Alphabet’s
subsidiaries include Google Inc. and its Internet Products, such as Access, Calico, Chronical,
Google Ventures, CapitalG, Verily, Waymo, X, and Google Fiber. Alphabet is also engaged in
advertising, sales of digital content, applications and cloud offerings, and sales of hardware
products.
Top-Down Reasoning:
The reason why we screened Google was because of how heavily weighted it was in the
benchmark. Google is a quality name that gives us exposure to technology and emerging markets.
Upside Catalysts:
• Search advertising continues to gain market share of global advertising budgets. Their core
business fuels revenue and profit growth for shareholders in the short-term, and allows the
company to make big bets in other areas in the future.
• Alphabet’s large long-term investments such as Waymo, a self-driving technology development
company, will be a key driver of share growth over the long-term.
• Investments in video content is driving continued monetization at YouTube.
Downside Risks:
• Over 90% of the Company’s net advertising revenue comes from Search, which is being
threatened by mobile and app-based search engines.
• Alphabet’s competes with companies such as Apple and Amazon, who have growing cloud and
consumer-device businesses.
• Rising scrutiny of digital ads and invasion of consumer privacy clouds the future of Google’s
core business and threatens Google’s core business and investor confidence.
Investment Thesis: Alphabet is well positioned for long-term growth and remains top large cap technology pick. Alphabet
dominates the online search market with global market share of above 80%, and has a number of growth
opportunities with, such as its bet on self-driving technology. The Company has built a competitive moat,
which is derived from its scale and network effects.
30
Lululemon Athletica, Inc.
Ticker: LULU
Current Price: $143.59
Purchase Price:
52-Week Range: $77.97-$164.79
Price Target: $189.03
Company Description: Lululemon Athletica is an international designer, distributor and retailer of athletic clothing products based
out of Vancouver, BC, Canada. Their main products include fitness pants, shorts, tops and jackets designed
for both active men and women. The company operates through two segments: 426 company owned stores as
well as direct to consumer online. The company’s revenue is generated through three main geographical
locations: The United States, Canada and China.
Top-Down Reasoning: As the U.S. and much of the rest of the world has been experiencing a cultural shift that places a larger
emphasis on living healthy lives through diet and exercise, a new segment within the apparel industry has
taken form: athleisure. This intersection between workout and casual wear is what Lululemon was founded
on and it is easily the most recognizable name in the segment. Consumer confidence, which is crucial for
companies like Lululemon operating in the consumer discretionary space, was up 7.9% in February from the
month before showing that people feel encouraged about the economy and will likely continue to spend more
on discretionary goods.
Upside Catalysts:
• High growth in their direct to consumer segment with net revenue growing 46% year over year. With the
company relaunching their website at the end of 2017, management expects sales in this segment to grow
from 21.8% currently to 30% by 2020.
• Heavy expansion into the Asia Pacific market has seen sales grow 37% year over year. Management
expects sales from this segment to grow from 11% of total sales currently to 20-25% by 2020.
Downside Catalysts:
• Lululemon sells premium priced products so any economic downturn or recession would negatively
impact the company’s sales and growth potential.
Investment Thesis:
Lululemon is a rapidly growing company that is capitalizing on not only the U.S.’s cultural shift towards
living a healthy lifestyle, but also the world’s shift in that direction. It looks to be in good position to expand
further into online sales and international expansion as it generates strong free cash flow, holds no debt and
has a large amount of retain earnings to fund growth and investments.
31
Microsoft Corporation
Ticker: MSFT
Current Price: $111.00
Purchase Price: $87.20
52-Week Range: $117.25/$87.8
Target Price: $125
Company Description:
Microsoft is a leading technology company. Its signature Windows operating system and Office
suite of productivity software dominate their markets. The company's cloud computing platform,
Azure, is one of the leaders in that burgeoning market. Millions of people interact on LinkedIn, the
business-oriented social network that Microsoft owns. Microsoft's customers range from
individuals and small businesses to the world's biggest companies and government agencies.
Microsoft makes tablets (Surface), game consoles (Xbox), and even laptop computers, and it also
owns Skype, the video meeting service. Geographically, Microsoft's revenue is evenly split
between the US and other countries.
Top-Down Reasoning:
Microsoft is heavily weighted within our benchmark. Continued global digitalization and
improvements in technology will continue to support the information technology sector.
Upside Catalysts:
• Large client base within enterprise segment represents an opportunity for continuation of strong results
across OS, Office, cloud, and database. This segment represents over half of total revenue and is more
profitable than the consumer business.
• Strength in cloud computing revenue through Azure platform which is on the forefront of research and
development in cloud computing.
Downside Risks:
• The server and cloud services business is heavy with competition from mega-cap companies such as
Amazon, Oracle, IBM, Apple and Alphabet. These companies have seen strong growth in the field and
all are expected to continue to push onward and try to increase growth prospects.
• Maturing markets and potential for slowdown in Azure growth.
Investment Thesis:
Microsoft has outpaced other competitors and technology stocks. Growth in Azure cloud-computing services
is incredibly strong and this segment of the business is well positioned to grow, even in the event of a market
downturn. Despite declining PC sales and competition in cloud-computing, Microsoft remains a strong stock
for its existing client relationships, strength in earnings, and foreseeable dividend increases.
32
Match Group
Ticker: MTCH
Current Price: $53.03
Purchase Price: $44.50
52-Week Range: $31.69-$60.91
Target Price: $60
Company Description:
Match Group, Inc. owns and operates subscription-based online dating websites and applications.
The Company offers online dating and matchmaking services. Match Group serves customers
worldwide. Match Group has headroom for growth in the online-dating market, where it enjoys an
almost-monopoly status amid fragmented competition. Tinder is driving sales upside as the
company keeps adding paid options and increases subscribers. Other brands in the Match portfolio
are stabilizing after sales were hurt by a shift to mobile characterized by user churn, competition
and cannibalization.
Top-Down Reasoning:
Global internet companies’ sales growth will likely remain robust in 2019 amid steady demand in
end-markets, including digital ads, e-commerce and cloud services. There is a rise in online dating.
Currently, more than 30% of married couples meet online. Opportunities for growth exist within
the sector, including user-friendly apps, using big data to drive business decisions, cognitive
computing and machine learning.
Upside Catalysts:
• Increasing market space dominance in a growing market.
• The Network Effect: Increased usage and engagement with online dating platforms.
• Tinder’s dominance is expected to maintain and grow in 2019.
• International revenue grew 51% and international subscribers grew 36%.
Downside Risks:
• Cybersecurity threats and tight regulations regarding personal data important factors that make
or break companies in this industry
• Stock option program dilutes bottom line for shareholders.
• Debt and acquisition strategy posts additional risks.
Investment Thesis:
Match Group will continue to exert its influence, exploiting the network effect to block out many
other competitors. Forward thinking new leadership and strong brands will propel Match Group
forward to capitalize on changing lifestyle trends and growth in the online dating market. Given
these prospects, Match Group is a buy that will return substantial positive return. The one-year
price target, calculated as the average of three valuation models and the analyst estimates, implies a
13.14% upside at $60.
33
Netflix, Inc.
Ticker: NFLX
Current Price: $349.60
Purchase Price: $284.08
52-Week Range: $231.23-$423.21
Target Price: $400
Company Description:
Netflix operates an internet subscription service for TV shows, documentaries, and movies. Customers are
able to stream this content onto their internet devices (computers, phones, tablets) or televisions through
their TV provider or game console system. The company is headquartered in Los Gatos, CA and operates on
a global scale, catering to over 190 different countries. 55% of their revenues are sourced from domestic
streaming, while 45% of their revenues are sourced from international streaming.
Top-Down Reasoning:
Moving from Q4 ‘18 to Q1 ‘19, the US economy has proven its continued strength through strong labor
markets and American business. In February, the economy added 20,00 jobs and the unemployment rate fell
to 3.8%. This data gives us no reason to believe that consumers will cut their consumption of online
streaming services through 2019. The streaming industry has continued to expand domestically and globally
as more households transition from cable TV to online services. NFLX currently holds a dominant position
in the streaming industry.
Upside Catalysts:
● Growth of global subscriber base in all regions through localizations of their business and differentiated
content.
● Expansion of content offerings into 2019: larger movie selection, producing of original content, and
release of new seasons of their most popular content.
Downside Risks:
● As a high-growth and FAANG stock, NFLX trades on market movements. Another market correction in
the near future poses a threat for NFLX stock.
● Increased competition entering the streaming industry
● Continued cash burn could keep FCF negative for a longer than projected
Investment Thesis:
Netflix is a strong growth company that has leveraged their flexible business model to outperform their
competitors (traditional TV service providers) during this transitional period to online streaming services.
Their dominant and growing presence in both domestic and foreign markets is projected to continue
increasing their consumer base in the coming years and the introduction of a 5G network would be
advantageous to these efforts. Netflix has been proactive in addressing their areas of weakness and is
expected to become FCF positive in the next 2 years as a result of a growing global demand and higher
subscription prices.
34
Raytheon Company
Ticker: RTN
Current Price: $179.72
Purchase Price:
52-Week Range: $144.27-$229.75
Target Price: $201.57
Company Description: Raytheon Company is a technology company that specializes in defense, homeland security, and other
government markets throughout the world. To support its customers worldwide, Raytheon serves
defense and intelligence markets via five business segments: Integrated Defense Systems (IDS), Missile
Systems (MS), Space and Airborne Systems (SAS), Intelligence, Information and Services (IIS), and
Forcepoint. The US Government accounts for 68% of Raytheon’s sales and it is the Pentagon’s fourth-
largest contractor.
Top-Down Reasoning:
Given that much of the defense and aerospace industry is highly dependent on government contracts, the
main driver of performance is based on defense spending. Because of President Donald Trump’s support
for increased defense spending, the DoD’s budget allocation rose 7.36% to $686 billion in 2019. Also,
given current geopolitical tensions between the U.S. and countries like Russia, Turkey, China and North
Korea, Raytheon is well positioned to capitalize on these tensions through a higher demand for their
products and services.
Upside Catalysts:
• Near record high of $42.4 billion in backlog orders support mid-single-digit revenue growth into the
next decade. Also, 40% of this backlog is made up of international contracts which are often higher-
margin. This is up from 28% in 2012.
• Heightened geopolitical tensions can bode well for well positioned defense stocks in the form of
increased defense spending and orders.
Downside Catalysts:
• A decreased defense budget in 2020 would pose as a headwind for future sales.
• New peace treaties and arms deals between rivaling countries would lower demand for Raytheon’s
products.
Investment Thesis:
Due to Raytheon’s place at the top of a very specialized and profitable industry, strong margins, deep
order backlog, and current geopolitical tensions I believe that Raytheon deserves a Buy rating.
Furthermore, Raytheon has a larger international presence than any of its competitors, leaving it less
exposed to the political uncertainty surrounding the U.S. today. Ultimately, I believe that government
and current macro events will continue to drive the defense sector even higher, with Raytheon well
positioned to experience all of the benefits.
35
Square, Inc.
Ticker: SQ
Current Price: $77.59
Purchase Price: $29.40
52-Week Range: $101.15-$43.72
Target Price: $81.58
Company Description:
Square, Inc. provides payment solutions along with a suite of other business solutions to small- and
medium-sized businesses. Its software assists in processing, receipts, inventory, and reporting. Its personal
app, Cash App, provides person-to-person payment transfer as well as cryptocurrency trading. The Square
Register provides the hardware POS as well as the Software-as-a-Service portion of the payments
processing system. With a 2.75% transaction fee, Square competes with the larger processing firms while
providing agile and high-performing platforms, enabling small business to accept cards transactions where it
may otherwise be too expensive or cumbersome to do so. Jack Dorsey is the CEO of both Square, Inc. and
Twitter, Inc.
Top-Down Reasoning:
The US economy, while showing creeping signs of slowing, is robust and strong. Unemployment continues
to touch historic lows, while GDP and inflation sit near sustainable and Fed-target levels. Low interest rates
support financials like the Square Capital lending arm. Cash App diversifies the firm away from merchant-
only revenue streams, and the firm has room to grow geographically. The firm sits in an attractive position
in attractive industries in a robust domestic economy.
Upside Catalysts:
• Market penetration of small and local merchants that cannot afford processing systems from larger
players
• Mobile app that generates revenue from individual consumers
• Square Capital business lending arm integrates its services and completes full suite of small business
products
Downside Risks:
• Global economic slowdown decreasing consumer spending
• Rise and acceleration of online-only retailers such as Amazon.com which do not use Square’s services
Investment Thesis:
The firm’s comprehensive suite of business offerings and mobile app for individuals will allow for revenue
growth and increasing market penetration. Scale will increase margins, and geographic diversification will
further accelerate top-line growth. The firm sits at the intersection of two of the fastest growing industries
and is a leading player in both: Software-as-a-Service and FinTech.
36
Teradyne, Inc.
Ticker: TER
Current Price: $38.75
Purchase Price: $40.40
52-Week Range: $28.73-$50.68
Target Price: $45
Company Description:
Teradyne is a Massachusetts-based company whose core business entails developing and supplying back-
end testing equipment for semiconductors. In the past few years they have begun to enter the Collaborative
Robot (Cobot) space through recent acquisitions of Universal Robots (2015) and Mobile Industrial Robots
(2018). Teradyne’s main business caters to large companies such as Apple, Samsung, and Qualcomm, while
their newer robotics business caters to companies of all sizes.
Top-Down Reasoning:
The global economy has modernized rapidly in the past decade. Globalization has driven demand for.
Semiconductors are a main component in advanced electronics and communication devices. As developing
nations continue to advance and 5G networking is introduced, the demand for semiconductors will drive
higher. Additionally, as the cost of labor continues to increase, large manufacturers are expect to invest in
collaborative robots over human labor. Strong wage growth in the US economy coupled with low
unemployment rates is expected to drive demand for cobots higher.
Upside Catalysts:
● Continue to build out the Industrial Automation segment through organic and inorganic growth
● New product releases by Apple
● Multiple expansion as TER begins to trade similar to pure play robotics companies
Downside Risks:
● High exposure to Apple (AAPL) - decreased orders would pose supply chain risk
● Competitors entering the Cobot market
● Potential to be bought out by a pure play robotics company (ex. Fanuc)
Investment Thesis:
Teradyne is smartly leveraging their strong core business of manufacturing back-end test equipment to
generate cash reserves that are being reinvested into the company. Through recent acquisitions, Teradyne
has become the lead player in the collaborative robotics business. In 2018, Industrial Automation accounted
for only 16% of TER’s revenues, while by 2020 it should account for closer to 30%. As Teradyne expands
into this high-growth industry, it is expected to see an appreciation in stock price as it increases in value and
experience multiple expansion as it achieves higher growth potential.
37
Illumina, Inc.
Ticker: ILMN
Current Price: $310.68
Purchase Price: $370.01
52-Week Range: $372.61-$225.82
Target Price: $395.00
Company Description:
Illumina, Inc. is the world’s leader in manufacture of machinery used for genetic analysis and DNA
research. Its tools are used by researchers in life sciences and pharmaceuticals whose roles are to
isolate and analyze gene expressions. Beyond manufacture of its machines, Illumina offers direct-
to-consumer services and consumables that offer recurring revenue streams (consumables
accounted for nearly 70% of top line in 2018).
Top-Down Reasoning:
The US economy has grown strongly in the past several years, with positive real GDP growth,
consistent employment growth, and tax cuts. All of these factors play acutely to a run in equities.
The Growth Fund managers adopted a portfolio with little exposure to Healthcare in 2018, and
Illumina offered a play into a niche industry with few players. With stability in top-line growth and
cash flows, the strength of its core businesses allows for an air of insulation from decelerating
growth, while maintaining room for positive yearly gains.
Upside Catalysts:
• Investments in developing technologies through subsidiaries and acquisitions (Pacific
Biosciences purchase for $1.2bn in 2018)
• Direct-to-consumer pervasiveness through Ancestry.com, 23andMe, and other new and
expanding companies
• New best-in-class product launches: NovaSeq (2017) and iSeq (2018)
Downside Risks:
• Accelerated competitive growth in new, agile firms with innovative technologies
• Regulation concerns in healthcare are ever present, with specific regard to data privacy and
insurance reimbursements for genetic testing
• Future sales tied to population growth rate: full genotype sequencing useful in individuals once
in lifetime
Investment Thesis:
Illumina is an industry leader in a rapidly growing industry in the Healthcare sector. With an
impressive R&D budget, the firm is at the forefront of innovation capture and has an ability to both
grow naturally and purchase inorganic growth in M&A. The future of genome sequencing is the
hope that someday each person will have his gene sequenced at birth to help identify and treat
chronic illnesses and to allow treatment research to be earlier and more accurate.
38
Visa, Inc.
Ticker: V
Current Price: $153.75
Purchase Price: $143.91
52-Week Range: $116.03 – 156.82
Target Price: $165.00
Company Description: Visa, Inc. (“V”) is the Western World’s most dominant global player in electronic payments and transaction
processing. Visa licenses its brand via credit and debit cards to member financial institutions that issue
credit and account services to merchants and individuals. Visa makes money by processing transactions on
its ‘VisaNet’ network. Boasting a pervasive international network and robust technological infrastructure
consisting of 16,800 financial institutions, 44 million merchant partners, billions of cards currently in
issuance around the world, and the ability to securely process 60,000 transactions per second, we recognized
the company’s wide moat and future growth prospects as a compelling reason to buy stock in the company.
Top-Down Reasoning: Despite the noise and excitement about potential disruption in this sector, we view the payment processing
industry as a very attractive place to be right now for the established players. Global transaction volume ($),
which drives the industries revenue, is projected to triple from 2016 to 2026 according to the Nilson Report,
with most growth occurring in Asia Pacific and the United States. With the ability transact in ~160
currencies and experience operating in 200+ countries/territories, Visa is the best positioned to continue to
take advantage of the long-term growth in the international economy. In 2017, Visa doubled their merchant
acceptance in India to 2.5 million merchants.
.
Upside Catalysts:
• The consistent transition from paper checks to digital payment systems will be ongoing for the
next decade or more, alone creating estimated revenue growth in the 4-5% range for Visa.
• Rapid expansion in to emerging markets, especially those in the Asia-Pacific and Latin
American regions, will create millions of new customers with first-time access to the
technological infrastructure that makes digital payments possible.
• Revenue model is hedged against local country inflation because it is set as a percentage of the
total transaction value plus a standard fee.
Downside Risks:
• Emergence of new payment technologies such as square and blockchain pose a mild threat to
the business model. It is more likely that they will just force Visa (and their competitors) to
adapt quickly, rather than forcing them out of business.
Investment Thesis: Visa’s tripartite growth strategy – deepen partnerships, drive digital, and expand international access – is
well-developed and has been executed upon well since the installation of Alfred Kelly as CEO in December,
2016. The combination of Visa’s high barriers to entry, competitive position in an attractive market, and
compelling growth strategy justified the decision to buy the stock.
39
Value Fund Overview Value Fund Philosophy
The Value Fund’s philosophy is based on the belief that market inefficiencies exist, and attempt to
take advantage of these inefficiencies by identifying stock prices that we determine as undervalued.
We follow a top-down macroeconomic analytical approach to find undervalued stocks in industries
that have trailed their respective benchmarks. We determine which industries to consider based on
strong macro fundamentals and bright prospects for future performance. Within these industries we
then seek to invest in companies that are undervalued by 5% to 15% when compared to direct
competitors and industry averages. We then take into consideration the undervalued companies that
have also demonstrated strong sales and earnings growth to ensure the companies we have chosen
are not just undervalued, but also good companies with strong financials.
Value Fund Strategy and Tactics
We begin our investment selection using a top-down approach. We develop in-depth analysis of
broad macroeconomic factors and trends through an examination of relevant data, including current
interest rates, monetary policy, unemployment, consumer spending levels, oil prices, and the
political environment, all in an attempt to narrow our analysis to individual sectors. After
determining which industries we want to overweight and underweight in our portfolio, each
manager uses industry specific valuation methods to find companies with a stock that they believe
to be undervalued. When selecting a "value" stock, a manager attempts to value the company
independently of its current market price. This is done by evaluating some of the following metrics:
P/B, P/E, P/S, or whatever metric is most appropriate to value a company within the industry they
are analyzing. These metrics are then compared to industry averages, as well as direct competitors
to determine whether the stock is currently being priced at a seemingly "unfair" discount. Value
investing typically works within a two-to-five-year time frame, therefore we seek to find stocks
with catalysts that fit that invest horizon, despite only having control of the fund for twelve months.
Buy Decisions and Sell Discipline
Once a manager has selected an investment opportunity based on the strategies outlined in the
"Strategy and Tactics" section, the manager continues extensive research into the company and the
stock. Eventually, the manager will create a formal pitch that will be presented to the Value Fund
as a whole. The manager pitching the investment will provide his or her rationale behind the
investment, as well as a target price. If the rest of the managers decide to invest in the stock, it
becomes each managers’ responsibility to closely monitor that stocks performance. Our ultimate
goal is to hold the stock until it reaches its target price, but unexpected circumstances may arise
that lead the managers to liquidate the position early and reinvest into a stock that they believe has
more risk-adjusted upside potential. At each meeting, the managers discuss current trends in the
markets as well as any current events that could have an impact on their holdings. This allows for a
perpetually solid understanding of the holdings in the Value portfolio, as well as any headwinds
that may arise.
40
Value Fund Performance
• Since inheriting the fund at the end of March 2018, the value fund returned 2.42 % loss while
the benchmark, the SPDR S&P 500 Value Index, returned 3.74% during the period. Therefore,
our portfolio trailed the benchmark by 1.33% during the period.
• Sectors held in the value fund’s portfolio cover most of the core GICS sectors, including:
Financials, Healthcare, Energy, Industrials, Consumer Staples, Real Estate, Utilities, Consumer
Discretionary
• Top Performers: DHR, AMT, CELG
• Worst Performers: STZ, CVS, HD
Valuation Technique
As a top-down fund, our portfolio strategy begins with an analysis of the macro economy, its
primary industries and their subindustries. By identifying the promising industries according to our
economic outlook, we analyze the dynamics underlying each industry to find the subindustries in
which we would like to participate. Using comparable ratios, we monitor the universe and deduce
the stocks that appear to be undervalued in their respective industries, which would then be
grounds for further analysis.
SMIF ’18-‘19 Value’s preferred valuation methodology is a multiples comparable analysis when
conditions allow. In complement to our understanding of the industry and market conditions, we
normalize a company’s P/E, P/B, P/S, and P/CF against the S&P 500 over the last 7 years to obtain
an implied share price that helps us determine if the company is over or undervalued compared to
the market. If a company that is in an industry where some specific multiples are more appropriate,
we are also sure to include those metrics in our analysis. This is especially helpful when
considering value relative to comparable companies. We then compare a company’s P/E, P/B, P/S,
and P/CF to its closest competitors and obtain a second implied share price to help us determine if
the company is over or undervalued compared to its industry. Using these two numbers in
conjunction with the 12-month price target of analysts, we are able to arrive at our price target for a
company.
Although we participate in all the primary GICS industries to afford our portfolio satisfactory
diversification, our top-down analysis seeks to find the subindustries likely to outperform. By also
focusing on underpriced stocks within those subindustries, we are able to find opportunities with
strong potential for multiple expansion. The potential for multiple expansion is diligently analyzed
by examining the growth potential underlying both the industry and the company’s earnings. Doing
so, we establish forecasts for the price multiples we employ to derive price targets. Finally, by
weighting a multiple-scenario analysis by their probabilities, we obtain an expectation of the price
and time horizon in which the stock is likely to converge to its intrinsic value. If we then calculate
the internal rate of return and compare it to the expected return on equity, we are able to deduce if
alpha can be generated.
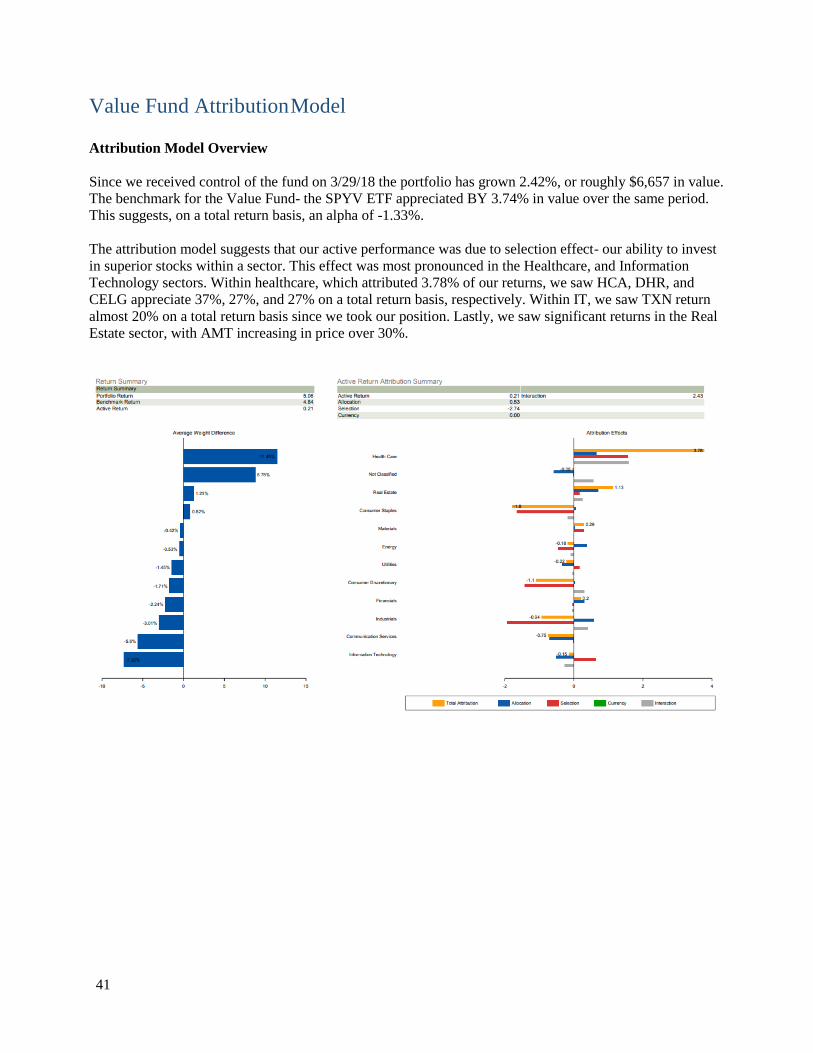
41
Value Fund Attribution Model Attribution Model Overview
Since we received control of the fund on 3/29/18 the portfolio has grown 2.42%, or roughly $6,657 in value.
The benchmark for the Value Fund- the SPYV ETF appreciated BY 3.74% in value over the same period.
This suggests, on a total return basis, an alpha of -1.33%.
The attribution model suggests that our active performance was due to selection effect- our ability to invest
in superior stocks within a sector. This effect was most pronounced in the Healthcare, and Information
Technology sectors. Within healthcare, which attributed 3.78% of our returns, we saw HCA, DHR, and
CELG appreciate 37%, 27%, and 27% on a total return basis, respectively. Within IT, we saw TXN return
almost 20% on a total return basis since we took our position. Lastly, we saw significant returns in the Real
Estate sector, with AMT increasing in price over 30%.
42
Value Holdings
American Tower Corporation Ticker: AMT
Purchase Price: 143.22 Current Price: 188.06
52-Week Range: 133.53-189.48 Price Target: 196.43
Company Description: American Tower Corporation is a REIT that owns, operates, and develops wireless communication towers
in the United States and abroad. The majority of the company’s income comes from large cell carrier
companies leasing antennae space on their towers. AMT collects “rent” similar to a landlord collects rent
from tenants. These leases are generally long term and have built-in escalations. American Tower is the
ideal provider for today’s wireless communication networks.
Top Down Reasoning: Unemployment levels have been below 5% for approximately three years now. This entails that the middle-
lower class now has buyer power and access to goods that they previously did not. One thing that these
people have been spending their extra income on is smartphones. Today over 77% percent of Americans
own smartphones up from 60% in 2015. Not only are these smartphones increasing in quality, but they are
increasing in quality. With the upcoming release of 5G in the United States and 4G networks abroad, the
data being consumed by portable devices is expected to grow at an average CAGR of 31% annually and this
is expected to increase. American Tower, the provider of antennae sites to cellular carriers in a position to
grow substantially in this market of growing data demand.
Upside Catalysts • Long-term guaranteed cash flows with built-in escalations.
• Owns far and away the largest portfolio of towers, will able to see higher returns on their existing towers
in the future
• The increasing use of data links directly to the demand for antennae sites
Downside Risks: • 88% of AMT’s US revenue was generated from the 4 large cell carriers. If there is a merger or one fails
AMT will see large revenue losses
• AMT does not own the land that their towers are on, these landowners have power over AMT when they
must renew their ground leases.
Investment Thesis: Due to the growth in the cell tower industry, and AMT’s dominant position within that industry I believe
that AMT is in a position to see excess returns in the coming years. They have been able to increase both
their revenue, and EBITDA by over 10% for three years in a row now, demonstrating they are ready to
capture the value in this growing market. AMT is aggressively pursuing growth opportunities outside of the
United States as well. I think that because of their international expansion, and the proven growth in data
demand AMT is primed to do well even if the market does not. We believe that the stock still has plenty of
room to grow.
43
Bank of America Corp.
Ticker: BAC
Current Price: $28.55
Inherited Price: $29.99
52-Week Range: $22.66 - $33.05
Target Price: $33.09
Company Description:
Bank of America Corporation, through its subsidiaries, provides banking and financial products
and services for individual consumers, small and middle-market businesses, institutional investors,
large corporations, and governments worldwide. It operates through four segments Consumer
Banking, Global Wealth & Investment Management, Global Banking, and Global Markets.
Top-Down Reasoning:
A position in BAC was pitched by previous managers of the value fund on grounds that gradual
increase of the interest rate (Fed target rate) will allow for companies in the sector to attain larger
spread to maximize profit. Additionally, the former managers were optimistic about US M&A and
capital markets with increased foreign direct investment to the US. We remained bullish on BAC
as this thesis still holds with current Fed chair Jerome Powell’s generally hawkish attitude.
Although rate raises have been put on hold while the economy faces some uncertainty while trade
talks with China are continuing, Powell has expressed a desire to continue these increases once the
dust settles. Furthermore, strong US economic data related to unemployment and consumer
confidence suggest that we can expect consumption to remain robust. Overall, the financial sector
has stabilized after a rough patch as investors appear to be attracted to the lower valuations and
solid balance sheets. The selling of financial stocks appears to have been a bit overdone unless we
are headed into a recession, which does not seem likely.
Upside Catalysts:
• Higher interest rates increase spread
• Favorable regulatory changes
• Improving consumer finances
• Continuous cost saving activities improving bottom line
Downside Risks:
• Highest levels of debt in M&A markets since pre-crisis levels
• Continuously slowed rate hikes
Investment Thesis:
Although we incurred a small loss with BAC during our holding period, we remain confident in the
stock in the long run. With net interest income on a steep incline, core expenses down on the year,
and improved credit quality on the horizon, we still see room for growth. If markets remain
choppy, it will be important to keep an eye on BAC’s top-line growth in order to keep a finger on
the pulse of the stock.
44
Celgene Corporation
Ticker: CELG
Current Price: $88.12
Purchase Price: $$69.58
52-Week Range: $58.59-$95.30
Target Price: $96.86
Company Description:
Based in Summit, New Jersey, Celgene Corporation operates as a global biopharmaceutical company,
focused on the discovery, development, and commercialization of therapies designed to treat cancer and
immune-inflammatory related diseases. CELG’s lead product is Revlimid, designed to treat bone marrow
cancer, which represents two-thirds of their annual sales. CELG also receives royalties on sales of ADHD
drugs Focalin XR and Ritalin, licensed to and sold by global drug maker Novartis. CELG’s two largest
customers are CVS and McKesson, each accounting for 10% of sales. CELG expects to move about 10
novel agents into testing within the next couple of years, and to release data from about 20 phase III trials
within that time period. In early 2019, CELG agreed to be acquired for $74 billion by Bristol-Meyers, in a
combination of stock and cash.
Top-Down Reasoning:
The Biopharmaceutical industry was down roughly 3.06% in 2018, due to drug pricing, competition, and
large macroeconomic events such as brexit issues and trade wars. For large cap Biotech companies, 2019
could see potential growth. As valuations are currently lower, we could see this sector driven by M&A. This
could create an exciting environment, particularly as a value investor. As we continue to see an aging
population, healthcare will also drive this industry. In addition, legislation is expected to provide tax breaks
for Biotech companies, which will help their bottom-line.
Upside Catalysts:
• Acquisition by Bristol-Meyers going through
• Diversification of portfolio through growth of existing drugs
• Key pipeline drugs pending approval will boost revenues and diversify portfolio
Downside Risks:
• Lack of diversification of current portfolio
• FDA approval failures
• Revlimid patent expiration in 2022
Investment Thesis:
CELG is a leading biopharmaceutical company, whose pipeline is current significantly undervalued. With
growth in other drugs and drugs currently in their pipeline, we will see CELG continue to diversify their
portfolio of drugs, to expand revenue growth, driving value to investors.
45
CVS Health Corporation
Ticker: CVS
Current Price: $55.96
Purchase Price: $62.21
52-Week Range: $55.80 - $82.15
Target Price: $74.00 Corporate Description:
CVS Health Corporation is an American retail pharmacy as well as a healthcare company. The firm is headquartered in
Woonsocket, Rhode Island and operates across 49 states, the District of Columbia, Brazil, and Puerto Rico with 9,803
stores. CVS serves approximately 5 million customers daily through its two main segments: Pharmacy Service and
Retail/LTC. Pharmacy Service accounts for 62.19% of the company’s revenue whereas Retail/LTC makes up 37.81%
of sales.
Top-Down Reasoning:
Fourth quarter 2018 U.S GDP growth of 2.6% beat expectations of market analysts. This combined with an
unemployment rate of approximately 4% and high consumer confidence, indicate that the U.S economy continues to be
strong. However, real estate startups have decreased and with the potential for further interest rate increases, several
market participants are wary of a recession in the next year. The healthcare sector is one that can be categorized as a
more defensive industry, with companies that have lower Betas to the overall market. In addition, within the healthcare
sector, CVS is a pharmacy giant with thousands of stores mainly across the east coast of the United States. CVS is
likely to suffer consequences in the case of a future recession, however the firm does not operate with consumer
discretionary spending, in addition to the fact that a large part of its products and services are acquired with insurance
payments. Thus, in case of an economic slowdown, we believe that CVS will be a counter-cyclical security that will be
incredibly valuable to hold in the portfolio. Lastly, the stock price is near its 5-year low currently, and has plenty of
upward potential.
Upside Catalysts:
• Merger with Aetna may prove to add significant value. Recently appointed CIO to oversee the integration of
technology infrastructure to create synergies from the combined firms.
• CVS plans to expand its ecommerce business with an investment of $350 million in 2019.
Downside Risks:
• Further discovery of overpaying for acquisitions. CVS was recently downgraded for paying too much for
Omnicare and if the same occurs with Aetna the stock will suffer.
• Threat of further healthcare expansion from Amazon and other competitors.
• Overall economic slowdown
Investment Thesis:
CVS is a highly regarded, incredibly stable, pharmacy retail company with an extremely experienced management
team. The firm’s stability and positioning within the defensive healthcare sector will provide strong portfolio protection
in case of a recession in the near future. The acquisition of Aetna, combined with positive investments into digital
healthcare by the company also point to CVS’ growth potential. The company is currently trading near its 5-year low
due to a lowering of 2019 estimates and a discovery of overpaying for Omnicare, but we believe that it is vastly
undervalued.
46
Chevron Corporation (CVX)
Current Price: $122.20
52-Week Range: $100.22 - $131.08
Target Price: $140
Recommendation: Hold
Company Description:
Chevron Corporation is an international energy company known for the production and transportation of
crude oil and natural gas. The company is responsible for refining, marketing, and distributing fuels on a
global scale. It is also involved in chemical and mining operations, power generation, and energy services.
Chevron’s global operations explore for and produce oil and oil equivalents, refines them into various fuels
and other end products, and sells them through gas stations, airport fuel depots, and industrial channels. Its
brands include Chevron, Texaco, and Caltex, and comprise 8,000 domestic and 6,000 foreign gas stations
Top-Down Reasoning:
• U.S. oil production remains strong as the nation positions itself as a major exporter. Exploration
expenditures have been lowered due to the high supply outstripping global demand, but the glut of oil in
the United States remains a positive trend for domestic producers.
• Global oil demand is expected to continue to accelerate over the next five years. This growth will be led
by emerging economies due to new infrastructure as well as increased consumption. China and India
will play a major role in this global demand growth.
• Industry focus on long-term objectives such as sustainable and environmentally-friendly energy will
help to develop a clearer future should oil demand begin to permanently decline in the future.
Upside Catalysts:
• Strong upstream portfolio, sees lots of value in its Permian Basin assets, which it predicts will be a
linchpin of growth through 2020.
• Relatively low need for Capex compared to competitors.
• Lowest breakeven oil price required to cover its dividend in the industry ($48/bbl).
Downside Risks:
• Asset portfolio outside the US not as strong.
• Missed earnings have historically led to significant negative reactions towards the stock.
• Continued volatility in oil prices may leave Chevron questioning the value of further oil exploration in
the near future.
Investment Thesis:
Chevron remains a strong American oil producer, with a variety of industry trends working in its favor. It
has valuable upstream assets and a diversified downstream business to mitigate volatility in the production
and sale of oil products. Because of the continuing growth in global oil demand and the recent explosion of
the U.S. oil export market, Chevron is poised to profit off of a low breakeven oil price and valuable portfolio
designed for long-term growth. This exposure to oil remains valuable to the Value Fund portfolio and I am
therefore recommending a hold.
47
Delta Airlines, Inc.
Ticker: DAL
Current Price: $49.58
Purchase Price: $54.46
52-week Range: $45.08 - $61.32
Target Price: $66.14
Company Description:
Delta Air Lines, Inc. is an Atlanta-based airline providing scheduled passenger air travel as well as cargo
and technical services. Delta is one of the largest airlines in the world carrying over 180 million passengers
per year. Their fleet of over 800 aircraft connect 320 destinations across 60 countries and 6 continents. Delta
is a founding member of the SkyTeam alliance allowing Delta customers to connect to a network of 20
airlines with access to over 1,000 destinations across the globe. In the United States, Delta operates out of a
network of hubs including Atlanta, Detroit, Los Angeles, Minneapolis, New York, Salt Lake City, and
Seattle.
Top-Down Reasoning:
Consumer confidence reached all time high levels in 2018 while the global economy continued to expand.
This has allowed Delta to continue to expand capacity without meaningful decreases in utilization rates
while also not sacrificing pricing power. Similarly, the strength in the global economy favors Delta’s
network of code share partners. Chinese mid-class growth continues to allow Delta to maximize its profit of
their west coast hubs as well as their investment in China Eastern Airlines. Late-2018 also saw a decline in
oil prices after they had reached highs near $80 per barrel. The drawback has allowed Delta to return to
margin expansion.
Upside Catalysts:
• Delta’s cabin segmentation efforts should make meaningful impacts on their income statement in FY19
as they begin to rollout new offerings on transatlantic routes.
• One Delta cost initiative combined with their fleet renewal program aims to bring Delta back to margin
expansion in FY19.
• Delta’s continued focus on customer experience will enhance Delta’s pricing power in 2019.
Downside Risks:
• Oil prices rise to 2018 levels leading to margin compression
• A general economic downturn would likely lead to a decline in consumer demand
Investment Thesis:
Delta continues to illustrate why they are considered to be the leading airline in the country. Their
operational performance record over the past 3 years provides investors with the comfort of knowing that
they are investing in a company that has excellent management capable of leading the airline through fleet
renewal with disciplined capital spending and a manageable debt load. A return to margin expansion in Q4
2018 should boost earnings and provide for a solid foundation moving into 2019.
48
Danaher Corporation
Ticker: DHR
Current Price: $125.89
Purchase Price: $97.91
52-Week Range: $94.59 - $128.39
Target Price: $133.00
Corporate Description:
Danaher Corporation is an American conglomerate operating in the areas of design, manufacturing, and marketing of
industrial, healthcare, and consumer products. The firm was founded in 1969 and is headquartered in Washington D.C.
The company operates in four different market segments: Environmental & Applied Solutions, Dental, Life Sciences,
and Diagnostics. Danaher is the parent company to over 20 operating subsidiaries, both within the United States and in
foreign countries.
Top-Down Reasoning:
Fourth quarter 2018 U.S GDP growth of 2.6% beat expectations of market analysts. This combined with an
unemployment rate of approximately 4% and high consumer confidence, indicate that the U.S economy continues to be
strong. However, real estate startups have decreased and with the potential for further interest rate increases, several
market participants are wary of a recession in the next year. The healthcare sector is one that can be categorized as a
more defensive industry, with companies that have lower Betas to the overall market. In addition, within the healthcare
sector, DHR is a globally diversified giant, and is unlikely to suffer extreme consequences in the case of a future
recession. The firm does not operate with consumer discretionary spending, and the growing baby boomer population
only serves to increase its customer base. Thus, in case of an economic slowdown, we believe that DHR will be a
counter-cyclical security that will be incredibly valuable to hold in the portfolio.
Upside Catalysts:
• Danaher has acquired GE’s biopharma business, which generates nearly $3 billion in sales annually.
• The company is involved in industries with secular growth and positive demographic trends as well as a 3-year
beta of 1.05 meaning that it does not pose great systematic risk.
Downside Risks:
• Danaher will now assume responsibility over GE’s biopharma business pension liabilities, which could impact the
firm’s future risk outlook.
• The stock price is close to its 52-week high and fears of overpaying for GE’s biopharma business or that selling its
dental unit were not ideal decisions will hurt the stock price.
• Overall economic slowdown
Investment Thesis:
Danaher is a highly regarded, incredibly stable, globally diversified company with an extremely experienced
management team. The firm’s stability and positioning within the defensive healthcare sector will provide strong
portfolio protection in case of a recession in the near future. The acquisition of GE’s biopharma business, combined
with the trends of deregulation and growing baby boomer population point to the conglomerate’s future growth
potential. The stock is currently trading near its 52-week high but we believe that there is still further room for it to
increase in value.
49
The Walt Disney Company
Listing: DIS
Current Price: $113.19
52 Week as of 4/23/18: $120.20 - $97.68
12-Month Price Target: $133.91
Recommendation: Buy
Corporate Description:
The Walt Disney Company is an entertainment company that conducts operations in media network, studio
entertainment, theme parks and resorts, consumer products and interactive media. The Company produces
motion pictures, television programs, musical recordings, books and magazines. They operate multiple cable
programming services including ESPN, Disney Channels, and ABC, as well as resorts in Florida and
California.
Top-Down Reasoning:
Although global economic growth is expected to slow, it is very unlikely a recession will occur in the United
States. Wage growth remains steady while inflation continues to persist at a low level. Monetary policy is
expected to be unchanged until at least the summer of 2019. Job growth is slowing but the economy is still
operating near full employment. As wage growth outpaces inflation, consumer purchasing power increases.
Overall, the macro-economic environment is one that will benefit Disney.
Upside Catalysts:
• High expectations for Parks & Resorts segment, coinciding with the opening of the immersive “Star Wars”
attraction, Disney’s biggest “single-themed land expansion” ever
• Upcoming 2019 titles for Studio Entertainment segment as well as the closing of the 21st Century Fox
acquisition
• Expanding direct-to-consumer segment with Hulu, Disney+ and ESPN+
Downside Risks:
• Inability to maneuver consumers’ changing preferences (cable cord-cutting)
• Decline in movie attendance tied to increased streaming and rising prices
• Economic downturn or recession leading to less disposable income
Investment Thesis:
Disney had a strong FY 2018 with EPS up 24% for the year. The Studio Entertainment segment generated a
record $3 billion in operating income, which should improve due to its 2019 slate, which includes remakes of
Disney classics, the new Avengers film, and exclusive access to 21st Century Fox titles. Attendance at parks
was up 4% in 2018 while per capita spending at the resorts was up 9%. The new “Star Wars” attraction
opening in FY 2019 is a major catalyst for the Parks & Resorts segment. The Company is now a majority-
owner of Hulu following the Fox acquisition and is also rolling out ESPN+ and Disney+ to expand its
streaming platform portfolio, making it stronger competition to the likes of Netflix and Amazon. Due to its
past financial performance, brand name and future catalysts, Disney earns a buy rating.
50
HCA Healthcare Inc. (HCA)
Current Price: $135.37
52-Week Range: $93.03 - $147.42
Target Price: $151
Recommendation: Hold
Company Description:
A major health services chain in the United States, HCA operates 170 hospitals in the United States and the U.K. These
hospitals act as acute care centers, offering patients treatments related to urgent care, cancer treatment, and outpatient
rehabilitation. The company is responsible for 5% of the U.S.’ hospital services and is highly rated in its healthcare
delivery and performance.
Top–Down reasoning:
The U.S. Healthcare Industry’s change from a fee-for-service to a value-based model will help major hospital chains
develop customer loyalty, brand, and reputation as the industry begins to focus on wellness rather than illness.
Hospital chains with efficient management and room for capital expenditures will be able to capture value from
Electronic Health Records, virtual care, and other novel medical technology. An aging population and growing
prevalence of chronic disease will drive hospitals to develop long-term solutions to keep these expensive
demographics profitable.
Upside Catalysts:
• Increased hospital admission and healthcare needs from the large and aging “Baby Boomer” generation could
greatly improve revenues, especially in HCA’s primary Florida market.
• Continued revenue growth from insured patients as well as lowering service to Medicare/Medicaid
and uninsured patients will drive revenue growth.
• A continuance of management’s disciplined expansion and hospital refurbishment will further HCA’s focus on
quality healthcare delivery through cutting-edge facilities.
• Acquisition of Mission Health should add $175mn in EBITDA beginning in FY 2019
Downside Risks:
• While HCA has been able to lower its revenue from Medicare and Medicaid recipients, it is still a major
percentage of revenue. As these patients are often serviced at a monetary loss, an increase in patient visits from
this demographic could lower revenues. Should HCA’s major markets in Texas or Florida reform Medicaid or
Medicare to provide for more citizens, HCA would likely see major losses.
• HCA’s major exposure to Texas and Florida - roughly 50% of its overall market - leaves it at risk to any changes
in state legislature related to healthcare.
Investment Thesis:
HCA is one of the premier American hospital chains, with strong management and deliberate growth leading to strong
long-term performance. We believe that the hospital’s management will be able to handle the transition to value-based
care and will be able to strategically implement greater electronic health accessories to improve patient outcomes and
streamline care. HCA’s exposure in major markets such as Florida and Texas will help them achieve exposure to older
demographics, which will require more care due to the rise in chronic disease in America. We are confident that HCA
will continue to perform well and provide for its customers and serve as a key investment in the Value portfolio.
51
Home Depot
Listing: HD
Current Price: $191.35
52 Week as of 4/23/18: $158.09 – 215.43
12-Month Price Target: $220.00
Recommendation: Hold
Corporate Description:
Home Depot (“HD”) is a home improvement retailer that sells building materials and home improvement
products. Operating primarily in North America, they are one of the world’s largest home improvement chains
and one of the largest retailers in the U.S. with 2,300 stores in North America and over 40,000 items available.
They target the “do-it-yourself” and professional home improvement markets and have recently begun
offering “do-it-for-me” installation services for things like carpeting and cabinetry. Home Depot has slowly
grown their e-commerce operations through their websites and mobile apps.
Top-Down Reasoning:
There are four primary factors impacting the demand for Home Depot’s products and services: the level of
household formation, home price appreciation, housing turnover, and the age of the housing stock. Home
price appreciation has hovered in the high single digits since 2013 after the turnaround associated with the
financial crisis, supporting incremental investments in the home. Household formation and housing turnover
increases demand for HD’s products and services, and while those numbers have cooled lately, HD has been
able to reap the benefits of a strong housing market. Finally, the biggest macro-driver of sales for Home Depot
is the age of the housing stock – the average age of homes in the U.S. market. As this continues to climb year-
over-year, we suspect that it will create greater demand for the product offering of HD.
Upside Catalysts:
• High barriers to entry - Home Depot is not an “item retailer;” they are a “project retailer.” This insulates
them from much of the disruption that Amazon has caused to American retailers.
• Relatively low competition in market – the only true competitor that Home Depot has is Lowe’s.
Therefore, they own the commanding position in a market that is somewhat of a duopoly.
• Favorable housing market trends including the age of housing stock and average spend per large home
improvement project should provide a tailwind.
Downside Risks:
• Amazon continues to surprise the market with creative disruptions
• Long-term secular trends associated with changing demographics and preferences
• U.S. housing market downturn
Investment Thesis:
Home Depot is a dominant player in a relatively uncompetitive segment of the retail market that is insulated
from most of the traditional disruptions in retail due to the “project retailer” model. The company has a fair
valuation, high barriers to entry, large free cash flow generation, and market saturation.
52
NextEra Energy Inc.
Listing: NEE
Current Price: $188.35
52 Week as of 4/23/18: $189.43 - $152.94
12-Month Price Target: $190.60
Recommendation: Hold
Corporate Description:
NextEra Energy, Inc. provides sustainable energy generation and distribution services. The Company
generates electricity through wind, solar, and natural gas. Through its subsidiaries, NextEra Energy also
operates multiple commercial nuclear power units. The holding company is mainly comprised of Florida
Power & Light (FPL) and NextEra Energy Resources (NEER). They are headquartered in Juno Beach, Florida.
Top-Down Reasoning:
The utility sector performed strongly towards the end of 2018 as investors shifted towards defensive sectors
with high-yielding dividends over concerns of global growth and trade rhetoric. Belief that global economic
growth will continue to slow makes defensive sectors attractive. Due to current inflation levels, the Federal
Reserve is in no rush to hike interest rates. Utilities perform stronger in a low-rate environment. BCA
Research also reported that electricity production has been rising.
IEA growth prospects for renewables depicts a bright future into 2022. They expect renewable electricity
capacity to expand over 43%. This forecast is a 12% increase from the previous year. Wind and solar is
expected to represent more than 80% of global renewable capacity growth in the next five years. The United
States is a strong market for renewables, positioning NextEra nicely in the sector. Despite policy uncertainty,
the U.S. remains the second-largest growth market for renewables.
Upside Catalysts:
• Florida Power & Light serves a historically fast-growing territory, the coastal areas of Florida, with
customers who are relatively captive and price-insensitive users of electricity
• Specialization in wind and solar positions it well in the sector
• Strong reputation – sells at a premium compared to other utilities
Downside Risks:
• Currently overbought
• Potential cut in regulated returns
• Natural disasters
Investment Thesis:
NextEra is a leader in renewables, a space that has attractive growth prospects. It is a safe stock in the sector
due to its reputation and gives the value fund exposure to renewables and utilities, a promising industry to be
invested in with the current macro-economic environment. Florida Power & Light should also benefit from
the growth of the Florida region that they provide services for, as well as the development of four new solar
power plants in 2019. It is currently approaching our 12-month price target, thus receiving a hold rating.
53
Prudential Financial Inc.
Ticker: PRU
Current Price: $94.11
Purchase Price: $91.93
52-Week Range: $75.91 - $111.18
Target Price: $113.73
Company Description:
Prudential Financial Inc. provides financial services throughout the United States and several
locations worldwide. These services are offered through five primary divisions with a total of
$1.4T AUM: (1) International Insurance, (2) US Workplace Solutions, (3) US Individual Life, (4)
Closed Block, and (5) Investment Management.
Top-Down Reasoning:
Given recent market volatility, the life insurance industry stands as an attractive space given its
defensive nature. As a whole, the life insurance space had underperformed the broader market
index throughout 2018 even as interest rates had risen (10-Yr US Treasury up 66 bps since year-
end 2017), breaking a longstanding relationship. Moving forward, valuations are expected to
improve if the industry is able to sustain Q2 median operating ROE of 11.9%. Life insurers with
lower average bond maturities, such as PRU, are expected to see boosted income from their
investment portfolios. Trading at a discount based on P/BV and P/E despite higher ROE, similar
EPS growth potential, and strong business trends, PRU stands an attractive value stock.
Upside Catalysts:
• Aggressive international growth in less competitive regions, specifically Japan and Brazil
• Hedging life insurance risk with pension risk transfers reduces overall business risk and
increases earnings stability, making for a good hold through a volatile market
• Large variable annuity business risk profile expected to improve as sale of non-guaranteed
annuities increase
Downside Risks:
• Persisting mixed business trends leads to 2019 profit pressure
• Substantial operations in Japan expose PRU to uncertain capital market conditions and
demographic trends in the country
• Holding PRU puts us overweight in the insurance/financial services industry
Investment Thesis: PRU leads the industry with a superior ROE of 13.5% and management guidance set for long-term rate of
12-13%. With shares trading essentially at book value, PRU is a value play at current ROE levels that
should gradually grow earnings alongside sizable capital returns to shareholders. This, combined with
interest rates becoming a tailwind, an industry-leading investment management segment (PGIM) gaining
steam, and significant quarterly buybacks scheduled for the upcoming year, solidifies our confidence in
PRU.
54
SL Green Realty Corporation
Ticker: SLG
Current Price: $91.63 (3/8/18)
Purchase Price: $92.85
Target Price: $115
Company Description:
SL Green is a self-managed REIT that finances, acquires, develops, renovates, manages, and leases
commercial properties in New York though primarily office buildings in Manhattan. Not only is Manhattan
the largest office market in the US by far but SL Green is the largest landlord having a 12% market share.
The firm has 49.3 MM SF of aggregate interests, 28.3 MM SF of equity, and 21 MM SF of debt and
preferred equity. SL Green specializes in class B assets, buildings older than 25 years but in desirable
locations and in generally good conditions. SL Green’s business strategy is acquiring class B Manhattan
office buildings or value/core plus buildings and making them into class A or core/trophy assets.
Top Down Reasoning:
Manhattan’s economic fundamental remained strong throughout 2018 which is a key driver of office
demand. The November unemployment rate of 3.3% represented a 650-basis point decline from the peak
rate of 9.8% in January of 2010. In addition, the NY MSA has diversified more than any other area in the
past decade which has given the market less exposure to the cyclical risks of the financial services industry.
In addition, recent headquarters-sized commitments to NYC from companies such as Google display that
this trend is likely to persist if not accelerate in the coming years. These factors should further strain supply
and demand fundamentals and drive long-dormant wage growth. Leasing activity totaled 35.3 MM SF (70%
going to Class A) in 2017 the highest amount since 2014 which helped compress the total vacancy rate by
50 BPS in the 4Q, the lowest since 4Q of 2007.
Upside Catalysts:
• Tenants have been leaving traditional business hubs for trophy spaces in Midtown South and Hudson
Yards which helps with SLG’s developments at One Vanderbilt and One Madison
• One Vanderbilt is going to be the best located/quality building which has led to the highest rents
Downside Risks:
• Hudson Yards is bringing a lot of new development to West Side, but One Vanderbilt is a hedge
• Amazon Fallout is a big loss to NYC but highlights its status as a tech hub
Investment Thesis:
SLG is a great company currently at a fair price lead by an experienced management team. They are also a
very strategic company since as they only operate in one market as they know that market well and believe
it’s the best in the world. They are the best positioned REIT to take advantage of New York’s continued
growth and economic prominence. In theory, their stock should rise as its roughly at a 25% discount to their
actual asset value. While many might view the Amazon fallout as a disaster, it still highlights the city’s
position as a tech hub and the commitment that major companies have made without tax breaks such as
Google.
55
Constellation Brands
Ticker: STZ
Current Price: $168.36
Inherited Price: $227.92
Target Price: $201
Company Description:
Constellation Brands is a prominent international producer and marketer of beer, wine, and spirits with
operations in the U.S., Mexico, New Zealand, Italy, and Canada. It is the third largest beer company in the
U.S. and has many high-end, iconic, and imported brands such as Corona Extra, Corona Light, Modelo
Especial, Modelo Negra, and Pacifico. In addition, they are the global leader in premium wine with brands
such as Robert Mondavi, Clos du Bois, Kim Crawford, Meiomi, Mark West, Franciscan Estate, Ruffino and
The Prisoner. Its premium spirits brands include SVEDKA Vodka, Casa Noble Tequila and High West
Whiskey. 90% of their revenue is from the US.
Top Down Reasoning:
While economic expansion and growth in discretionary income definitely helps STZ, the company’s low
beta and alcohol’s nature as an inelastic good means that they are also fairly resilient during recessions as
well. The company is very susceptible to demographic factors and more specifically the Hispanic population
that is around 40% of the company’s consumer base. The US Hispanic population is expected to grow
almost 100% from 57.47 million in 2016 to 93.88 million in 2045 in addition to also increasing their
discretionary income. Another demographic advantage is that a growing number of millennials drink, beer,
wine, and spirits as these customers spend 6 times their singular counterparts. Millennials also seem to favor
imported and premium brands, most of the components of STZ’s portfolio.
Upside Catalysts:
• Rapid growth in population and incomes of the Hispanic Population
• Millennial’s desire to drink across beverage categories and premium/imported brands
• 6% compounded sales growth projected for next 5 years
• 37% equity stake in Canopy Growth with warrants to increase ownership to more than 50%
• Has returned almost 50% in past 3 months
Downside Risks:
• Reliance on its Mexican beer portfolio and risk of issues with importation
• Size relative to Anheuser-Busch and MillerCoors and their ability to make greater investments in
advertising or acquire additional craft brands
• Generates majority of revenue from US while rivals are more international
Investment Thesis:
Constellation Brands is poised to take advantage of increases in consumer discretionary income while also
being resilient in a recession. Demographics are working in this company’s favor. While the market reacted
negatively to Robert Sands stepping down from CEO and COO Bill Newlands stepping, in I believe this
change is already priced and Newland’s experience combined with Sands becoming executive chair will
lead the company comfortably. Combined with the above reasons and my valuation I put my price target at
$201.
56
Texas Instruments, Inc.
Ticker: TXN
Current Price: $106.92
Purchase Price: $95.04
52-Week Range: $118.48 - $87.70
Target Price: $109
Company Description:
Texas Instruments, Inc. (TI) is a global manufacturer of semiconductors with facilities in North America,
Asia, and Europe. It markets its products to six main industries, namely: industrial, automotive, personal
electronics, communication equipment, enterprise systems, and others (like calculators). It has a diversified
portfolio of products and sells to more than 100 customers.
Top-Down Reasoning:
The semiconductor manufacturing is infamous for going through volatile prices because of oversupply
issues. When data suggested that the downturn had started, the entire industry was punished by the equity
markets. However, analyzing past trends, it seemed that corrections happened within six months and the
prices rebounded strongly. So, we bought TI at a bargain. Another reason for depressed prices was the U.S.
– China trade war. Companies in this industry experienced lower margins because of tariffs (China is a
major consumer of semiconductors), and that caused a stronger sell-off for firms in this industry than in the
overall market. However, because of its unique position TI was not impacted by tariffs.
Upside Catalysts:
• Improving consignment programs which allowed for better forecast of demand (65% of revenue in
2018).
• Higher industrial and automotive demand due to automation and electric vehicles.
Downside Risks:
• Semiconductor industry cycles will continue to happen in the future.
• Majority of the revenue comes from China (44% in 2018) which is prone to political risk and dependent
on China’s economy.
Investment Thesis:
TI is well positioned to grow due to market demand of its products. The firm’s strong balance sheet and
consignment programs will support it in downturns. TI is a strong company with a great diversification, and
we believe the stock should appreciate since the current price doesn’t reflect the fundamentals of the
business and its future growth potential.
57
Unum Group, Inc.
Ticker: UNM
Current Price: $36.89
Purchase Price: $37.80
52-Week Range: $51.33 - $26.76
Target Price: $45
Company Description:
Unum Group is an insurer with business segments in U.S. and U.K. Its products include disability, life,
accident, illness, dental, and vision insurance. Most of Unum’s revenue comes from deals with other firms
that provide insurance for their employees, instead of direct-to-consumer transactions.
Top-Down Reasoning:
As an insurer, rising interest rates in U.S. help improve margins by increasing net interest income. In 2018,
the Fed raised the Federal Funds Rate (FFR) four times to their current level of 2.2 – 2.4% helping push up
net income for banks and insurers. The workforce in U.S. has also experienced a focus shift from just
income to a balance of income and benefits. So, firms need to offer great benefits to retain and hire talented
employees. Firms like Unum offer those services and products to employers.
Upside Catalysts:
• Medical cost inflation in U.S. has far outpaced wage growth, increasing demand for health insurance.
• Shift in demographic preferences and slow rise in wages.
Downside Risks:
• Unum’s closed (discontinued) segment, long-term care, has high expenses and its future redemptions
remain uncertain.
• A slowdown in the world’s economy may cause interest rate volatility making interest rate cut a
possibility.
Investment Thesis:
Excluding the long-term care segment, Unum has done exceptionally well in terms of operations. It has a
strong balance sheet and cash flow generation. The higher interest rates will help the firm increase net
income and support the risky discontinued business. We believe that the stock is unfairly valued and Unum
should reach its price target given its catalysts.
58
Valero Energy Corporation
Ticker: VLO
Current Price: $85.06
Purchase Price: $92.77
52-Week Range: $68.81-$126.98
Target Price: $104.22
Company Description:
Based in San Antonio, Texas, Valero Energy Corporation is an independent petroleum refining and ethanol
producing company that owns and operates 15 refineries in the U.S., Canada, and UK. The company had a
combined throughput capacity of approximately 3.0 million barrels per day in the fourth quarter of 2018.
The company produces conventional gasoline’s distillates, jet fuel, asphalt, petrochemicals, lubricants, and
other refined products as well as diesel fuel, low-sulfur and ultra-low-sulfur diesel fuel, and oxygenates. The
company also owns and operates 11 ethanol plants in the U.S. with a combined production capacity of
approximately 1.4 billion gallons per year.
Top-Down Reasoning:
With Valero’s refining segment accounting for the majority of the firm’s revenue, the price of oil, from a
macroeconomic perspective, will have the greatest impact on the firm. The drastic oversupply of oil in the
global market that was created by large OPEC member outputs and the U.S. becoming nearly self-sufficient
in product pushed the cost of oil lower. This directly benefitted oil refiners, such as Valero, as the firm’s
input costs are lowered. Despite OPEC restrictions placed on production, oil prices have remained relatively
low as CLO has benefited. However, rising tensions in the Middle East pose a risk to current oil prices.
With Valero being the second largest independent U.S. refiner, the company should continue to benefit if oil
prices remain low.
Upside Catalysts:
• Low oil prices in the market allow Valero to decrease input costs and improve margins
• Large refining capacity in the Gulf Coast to help support margins
Downside Risks:
• Increasing oil prices will input costs, and put pressure on margins
• Lower demand for exports
• Potential oversupply of refined product in the broader market
Investment Thesis:
VLO is a leading independent oil refiner, with a great FCF yield, and will be able to leverage its scale to
counteract the negative impact of potentially higher oil prices, which increase VLO’s input cost for refining,
while maintaining throughput levels.


![drnirmalpatel.com · saccus posticus, that extends toward middle ear cleft from the tubo-tympanic recess [2, 5]. The retrotympanum was described for the first time by Steinbrugge](https://img.pdfslide.us/doc/110x75/5ead12c75cc2fb62e040385e/saccus-posticus-that-extends-toward-middle-ear-cleft-from-the-tubo-tympanic-recess.jpg)