Embed Size (px)
Citation preview

UNIVERSITY OF NAIROBI6
SCHOOL OF COMPUTING & INFORMATICS
Applicability of Internet of Things (IoT) to reduce traffic congestion in
Nairobi City, Kenya
By
Lucas John Omollo
P54/72793/2014
Supervisor
Christopher Moturi
______________________________________________________________________________
This Project Report submitted in partial fulfillment of the requirement for the award of Masters
of Science in Information Technology Management of the University of Nairobi
June 2016

ii
Declaration
This project is my original work and to the best of my knowledge this research work has not been
submitted for any other award in any University
Lucas John Omollo: ____________________________ Date: _______________
P54/72793/2014
This project report has been submitted in partial fulfillment of the requirement of the Master of
Science Degree in according of the University of Nairobi with my approval as the University
supervisor
Mr. Christopher Moturi: ____________________________ Date: _______________
School of Computing and Informatics

iii
Abstract
Traffic congestion has been a mounting problem in Nairobi, Kenya, that has resulted from rapidly
increasing population and the flocking of motorized traffic on the limited street network. Some of
traffic concerns are congestions and accidents which have caused a huge waste of time, property
damage and environmental pollution within the city. Therefore, this research involved analysis of
the current traffic conditions in Nairobi, the expected effects of further growth in demand, and a
set of recommendations for how to improve the performance of the street network. From the
analysis, the research pursued an intelligent traffic administration system, centered on Internet of
Things, that has been characterized by low cost, high scalability, high compatibility and easy to
upgrade. After conducting this study, the intelligent traffic administration system could be used by
Cities to replace their traditional traffic management systems therefore reduce road traffic
tremendously. The IoT is based on the Internet, network wireless, sensing and detection
technologies used to comprehend the intelligent recognition on any tagged traffic object by
tracking, monitoring, managing and processing data automatically. The study was cross sectional
with analytical component and through simple random sampling, 200 private car drivers and 12
county parking attendants were selected for the study. The data collection tools utilized included
a structured self-administered questionnaires. Data collected was analyzed using SPSS version 21
and Excel spreadsheet and presented in form of text, tables, graphs and charts. Private cars spent
in the morning an average of 1.6 hours while in the evening they spent an average of 2.0 hours
stuck in the on traffic jam. Although private car drivers were ranked second as the cause of traffic
jam behind matatu drivers, drivers looking for parking lots was consistenty considered to be the
most cause of traffic jam in Nairobi. This was further compounded by the fact that drivers
sometimes failed to identify existing parking lots in town with drivers spending an average of 30
minutes looking for parking lots in the morning thereby effectively rendering parking
identification inconvenient as well as parking payment.

iv
Table of Contents
Declaration ...................................................................................................................................... ii
Abstract .......................................................................................................................................... iii
Table of Contents ........................................................................................................................... iv
List of Tables ................................................................................................................................. vi
List of Figures ............................................................................................................................... vii
Abbreviations ............................................................................................................................... viii
CHAPTER ONE: INTRODUCTION ......................................................................................... 1
1.1 Background ............................................................................................................................... 1
1.2 Statement of the Problem .......................................................................................................... 2
1.3 Objectives of the Study ............................................................................................................. 2
1.4 Research Questions ................................................................................................................... 3
1.5 Significance of the Study .......................................................................................................... 3
CHAPTER 2 :LITERATURE REVIEW ................................................................................... 4
2.1 Traffic Congestion in African Cities ..................................................................................... 4
2.2 Causes of Traffic in Nairobi .................................................................................................. 5
2.3 IoT Background ..................................................................................................................... 8
2.4 IoT Architecture .................................................................................................................... 9
2.5 IoT Technologies ................................................................................................................. 11
2.6 IoT in Transportation Systems ............................................................................................ 15
2.7 Past Technologies related to IoT in Traffic Monitoring ...................................................... 16
2.8 IoT Versus Current traffic conditions in Nairobi ............................................................... 17
2.9 Gap Analysis ....................................................................................................................... 18
2.10 IoT architectures for traffic management ........................................................................... 18
2.11 Proposed IoT Architecture for Nairobi City ........................................................................ 22
CHAPTER 3: METHODOLOGY ............................................................................................ 26
3.1 Research Design .................................................................................................................. 26
3.2 The Study Population, Sample size and sampling techniques ............................................ 26
3.3 Data collection tools and nature of data .............................................................................. 27
3.4 Pilot study ............................................................................................................................ 28
3.5 Data Analysis....................................................................................................................... 28
3.6 Ethical Considerations ......................................................................................................... 29
CHAPTER FOUR: RESULTS AND DISCUSSION ............................................................... 30
4.1 Socio-demographic characteristics ...................................................................................... 30
4.2 Causes of traffic jam in Nairobi .......................................................................................... 31
4.3 Current IoT technologies and Architectures applicable in traffic management ................. 37
4.4 Prototype of sustainable IoT Architecture for parking management in Nairobi ................. 38
CHAPTER FIVE: CONCLUSIONS & RECOMMENDATIONS......................................... 42
5.0 Achievements ...................................................................................................................... 42
5.1 Challenges ........................................................................................................................... 43
5.2 Conclusions and Recommendation ..................................................................................... 43
REFERENCES ............................................................................................................................ 45
APPENDICES ............................................................................................................................. 49
Appendix 1: Consent Form ........................................................................................................... 49

v
Appendix 2: Private Car Drivers Questionnaire ........................................................................... 50
Appendix 3: County Parking Attendants Questionnaire ............................................................... 53
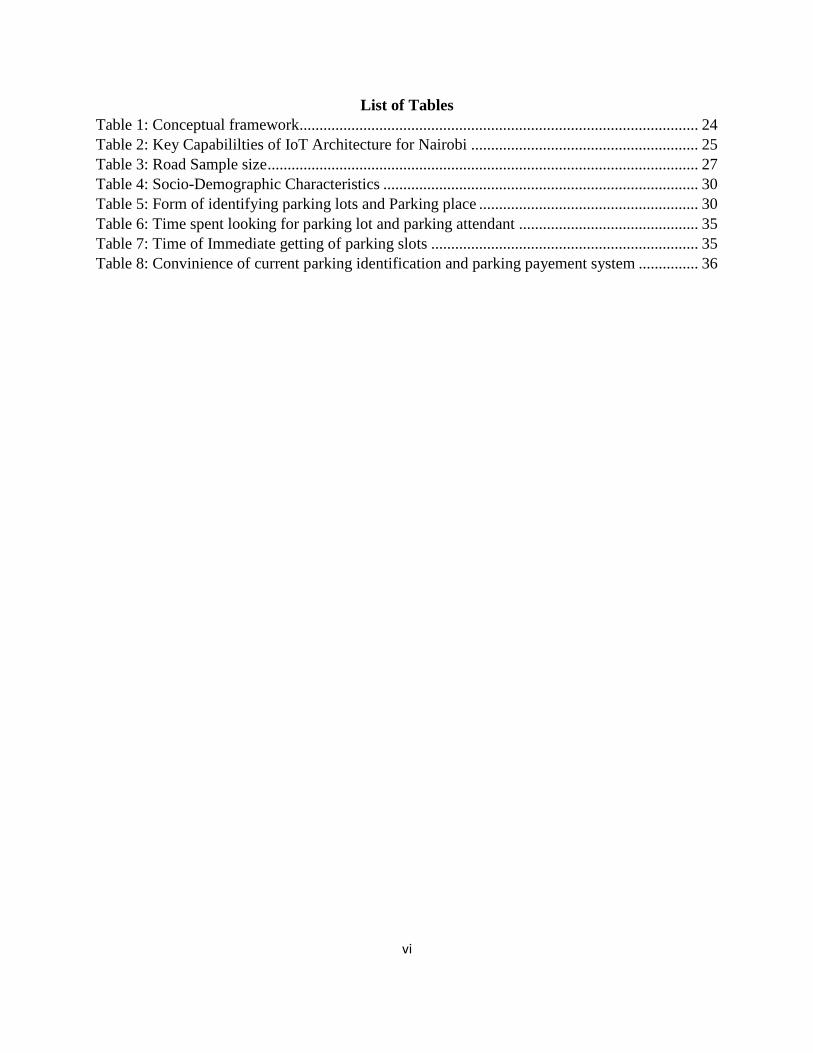
vi
List of Tables
Table 1: Conceptual framework.................................................................................................... 24
Table 2: Key Capabililties of IoT Architecture for Nairobi ......................................................... 25
Table 3: Road Sample size ............................................................................................................ 27
Table 4: Socio-Demographic Characteristics ............................................................................... 30
Table 5: Form of identifying parking lots and Parking place ....................................................... 30
Table 6: Time spent looking for parking lot and parking attendant ............................................. 35
Table 7: Time of Immediate getting of parking slots ................................................................... 35
Table 8: Convinience of current parking identification and parking payement system ............... 36

vii
List of Figures
Figure 1: Internet of Things Ecosystem ........................................................................................................ 8
Figure 2: Expected penetration of connected objects by the year 2020 ........................................................ 9
Figure 3: Six-Layered Architecture of IoT ................................................................................................. 10
Figure 4: RFID Scenario ............................................................................................................................. 12
Figure 5: A typical sensing node................................................................................................................. 13
Figure 6: A typical Cloud Computing Scenario .......................................................................................... 14
Figure 7: IBM Intelligent Transportation high-level architecture ............................................................... 19
Figure 8: Intelligent Transportation System with the IoT by Intel ............................................................. 20
Figure 9: AGT and Cisco Traffic Incident Management Solution Architecture ......................................... 21
Figure 10: Cisco Smart+Connected City Parking ....................................................................................... 22
Figure 11: Time Spent in Traffic Jam ......................................................................................................... 31
Figure 12: Parking fee ................................................................................................................................. 32
Figure 13: Causes of Traffic Jam from Road Users .................................................................................... 33
Figure 14: Causes of Traffic jam ................................................................................................................ 34
Figure 15: Parking Identification ................................................................................................................ 34
Figure 16: Recommendation of timed parking charges .............................................................................. 37
Figure 17: Design Structure Diagram ......................................................................................................... 39
Figure 18: Login, user self –registration, user dashboard .......................................................................... 39
Figure 19: Select a parking place, choose the date, choose time ................................................................ 40
Figure 20: Check the available parking slots .............................................................................................. 41
Figure 21: Booking parking slots ................................................................................................................ 41
Figure 22: Manage Parking Places, Parking Slots and Check real-time bookings Online ......................... 42
Figure 23: Login ......................................................................................................................................... 42

viii
Abbreviations
EPC Electronic Product Code
IoT Internet of Things
ICT Information Communication Technology
IT Information Technology
IP Internet Protocol
RFID Radio-Frequency Identification
TMN Telecommunications Management Network
1
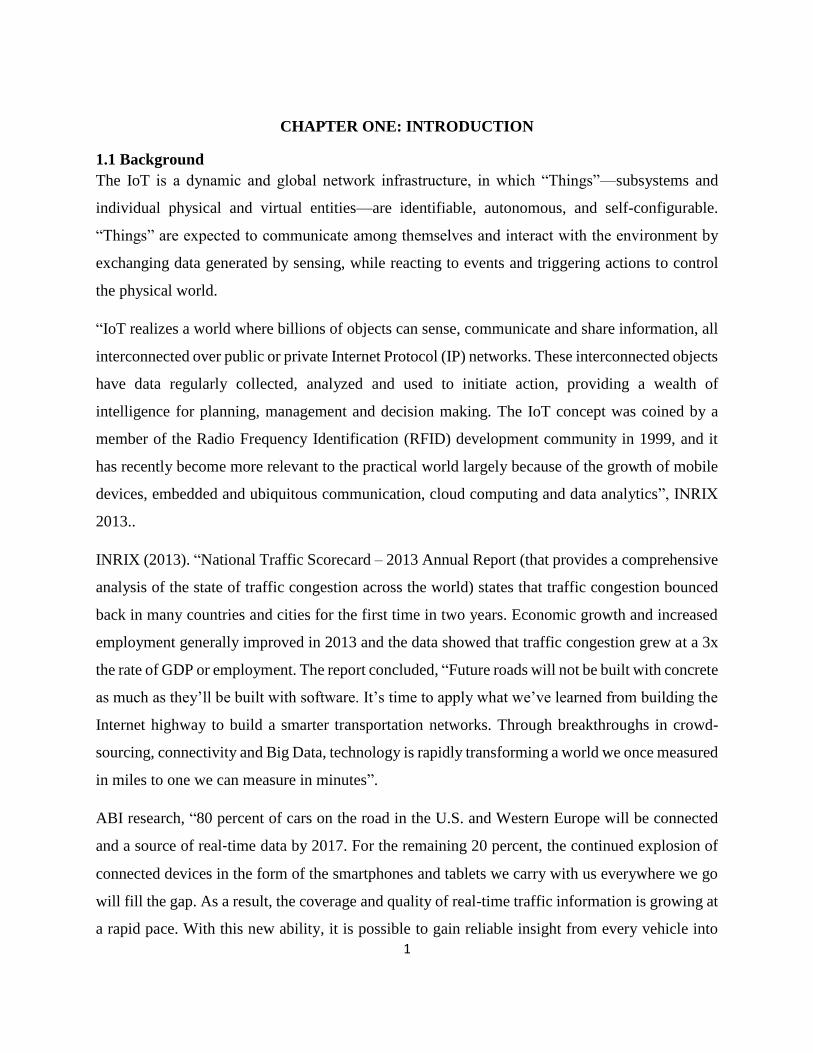
CHAPTER ONE: INTRODUCTION
1.1 Background
The IoT is a dynamic and global network infrastructure, in which “Things”—subsystems and
individual physical and virtual entities—are identifiable, autonomous, and self-configurable.
“Things” are expected to communicate among themselves and interact with the environment by
exchanging data generated by sensing, while reacting to events and triggering actions to control
the physical world.
“IoT realizes a world where billions of objects can sense, communicate and share information, all
interconnected over public or private Internet Protocol (IP) networks. These interconnected objects
have data regularly collected, analyzed and used to initiate action, providing a wealth of
intelligence for planning, management and decision making. The IoT concept was coined by a
member of the Radio Frequency Identification (RFID) development community in 1999, and it
has recently become more relevant to the practical world largely because of the growth of mobile
devices, embedded and ubiquitous communication, cloud computing and data analytics”, INRIX
2013..
INRIX (2013). “National Traffic Scorecard – 2013 Annual Report (that provides a comprehensive
analysis of the state of traffic congestion across the world) states that traffic congestion bounced
back in many countries and cities for the first time in two years. Economic growth and increased
employment generally improved in 2013 and the data showed that traffic congestion grew at a 3x
the rate of GDP or employment. The report concluded, “Future roads will not be built with concrete
as much as they’ll be built with software. It’s time to apply what we’ve learned from building the
Internet highway to build a smarter transportation networks. Through breakthroughs in crowd-
sourcing, connectivity and Big Data, technology is rapidly transforming a world we once measured
in miles to one we can measure in minutes”.
ABI research, “80 percent of cars on the road in the U.S. and Western Europe will be connected
and a source of real‐time data by 2017. For the remaining 20 percent, the continued explosion of
connected devices in the form of the smartphones and tablets we carry with us everywhere we go
will fill the gap. As a result, the coverage and quality of real-time traffic information is growing at
a rapid pace. With this new ability, it is possible to gain reliable insight from every vehicle into

2
the traffic speeds, travel times, and volumes on all roads. Constructing an intelligent traffic system
based on IoT has a number of benefits such improvement of traffic conditions, reduction the traffic
jam and management costs, high reliability, traffic safety and independence of weather
conditions”.
1.2 Statement of the Problem
Urban traffic faces many challenges which are mainly caused by rapid urbanization and an increase
in car ownership which then influence both the flow of traffic and the environment. The main
challenges are traffic congestion, pollution and road accidents. Knoflacher (2006), cities in the
third world countries face traffic congestion which is mainly caused by the following factors:
a) The urban set-up is not compatible with the traffic demands.
b) Inadequate traffic management measures.
c) Flouting of traffic rules by motorists.
d) Inadequate public transport.
Gachanja 2011, “on the demand side 50% of the traffic congestion in Nairobi could be solved by
increasing road capacities and 10.86% by building bypass roads while on the supply side 40.91%
could be solved by shifting to public transport and higher vehicle capacity and 10.70% by
development of multiple centres in Nairobi metro region. Both of these measures especially
increasing road capacities were considered not economically feasible (Gachanja J. , 2015)”. “This
study aims to develop a sustainable traffic management protoype based on IoT and other
technologies to improve traffic conditions and relieve the traffic pressure for the City of Nairobi.
Information generated by traffic IoT and collected on all roads can be presented to travelers and
other users. Through collected real-time traffic data, the system can recognize current traffic
operation, traffic flow conditions and can predict the future traffic flow. By issuing latest real-time
traffic information, the system will help drivers in choosing optimal routes.”
1.3 Objectives of the Study
The research has the following objectives:
a) To identify the major causes of traffic congestion in Nairobi city and other leading African
cities.
b) To review IoT Architectures applicable to traffic congestion management

3
c) To develop a simple prototype of sustainable IoT Architecture for Nairobi city
1.4 Research Questions
a) What are the major causes traffic congestion in Nairobi city and other leading African
cities?
b) What IoT Architectures suite traffic congestion management?
c) How can IoT be applied in managing traffic congestion in Nairobi?
1.5 Significance of the Study
The study provides better understanding about various “Things” in the transport sector that when
connected and are able to communicate could drastically reduce traffic congestion in cities in
Africa. The study explored the major problems encountered by traffic officials and motorists as a
result of traffic congestions in Nairobi then designed an IoT architecture/prototype to reduce
Nairobi traffic by approximately 40%.
4
CHAPTER 2 :LITERATURE REVIEW
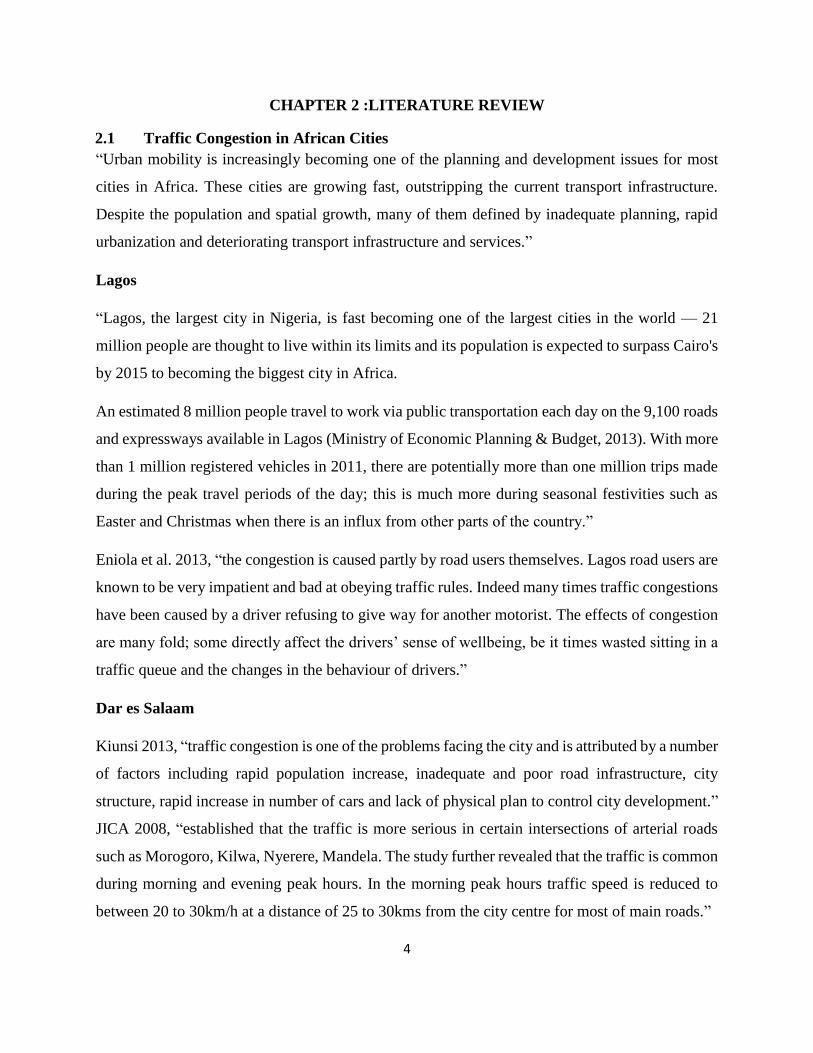
2.1 Traffic Congestion in African Cities
“Urban mobility is increasingly becoming one of the planning and development issues for most
cities in Africa. These cities are growing fast, outstripping the current transport infrastructure.
Despite the population and spatial growth, many of them defined by inadequate planning, rapid
urbanization and deteriorating transport infrastructure and services.”
Lagos
“Lagos, the largest city in Nigeria, is fast becoming one of the largest cities in the world — 21
million people are thought to live within its limits and its population is expected to surpass Cairo's
by 2015 to becoming the biggest city in Africa.
An estimated 8 million people travel to work via public transportation each day on the 9,100 roads
and expressways available in Lagos (Ministry of Economic Planning & Budget, 2013). With more
than 1 million registered vehicles in 2011, there are potentially more than one million trips made
during the peak travel periods of the day; this is much more during seasonal festivities such as
Easter and Christmas when there is an influx from other parts of the country.”
Eniola et al. 2013, “the congestion is caused partly by road users themselves. Lagos road users are
known to be very impatient and bad at obeying traffic rules. Indeed many times traffic congestions
have been caused by a driver refusing to give way for another motorist. The effects of congestion
are many fold; some directly affect the drivers’ sense of wellbeing, be it times wasted sitting in a
traffic queue and the changes in the behaviour of drivers.”
Dar es Salaam
Kiunsi 2013, “traffic congestion is one of the problems facing the city and is attributed by a number
of factors including rapid population increase, inadequate and poor road infrastructure, city
structure, rapid increase in number of cars and lack of physical plan to control city development.”
JICA 2008, “established that the traffic is more serious in certain intersections of arterial roads
such as Morogoro, Kilwa, Nyerere, Mandela. The study further revealed that the traffic is common
during morning and evening peak hours. In the morning peak hours traffic speed is reduced to
between 20 to 30km/h at a distance of 25 to 30kms from the city centre for most of main roads.”

5
Cairo
“The Greater Cairo Metropolitan Area (GCMA), with more than 19 million inhabitants, is host to
more than one-fifth of Egypt’s population. The GCMA is also an important contributor to the
Egyptian economy in terms of GDP and jobs. The population of the GCMA is expected to further
increase to 24 million by 2027, and correspondingly its importance to the economy will also
increase”, (Nakat, Herrera, & Cherkaoui, 2014). “The study found that traffic congestion is a
serious problem in the GCMA with large and adverse effects on both the quality of life and the
economy. In addition to the time wasted standing still in traffic, time that could be put to more
productive uses, congestion results ,in unnecessary fuel consumption, causes additional wear and
tear on vehicles increases harmful emissions lowering air quality, increases the costs of transport
for business, and makes the GCMA an unattractive location for businesses and industry. As the
population of the GCMA continues to increase, traffic congestion is becoming worse and the need
to address this congestion is becoming more urgent.”
2.2 Causes of Traffic in Nairobi
“It is estimated that out of the approximately 2 million registered motor vehicles in Kenya in 2013,
about 60% were located in the Nairobi Metro” (Gachanja J. , 2015). According to a study by
Ndung'u, (2013) the causes of traffic congestion on Jogoo road included too many low capacity
vehicles, poor management by traffic police, roundabouts, indisciplined drivers, inadequate road
space among others. The effects of the congestion comprised of time wastage/lateness, usage of
too much fuel, air and noise pollution, discomfort while inside the vehicle, risk of accidents,
reduced financial returns for businesses and vehicle operators and nuisance in estates and business
areas where motorists traversed as they escaped jam on the main roads. According to Gachanja,
(2015) “traffic control in the Nairobi Metro has been wanting, and it is now believed that some of
the traffic interventions, such as installation of traffic lights in most of the CBD, have not worked
despite enormous resources being put into this and even intervention by traffic officers often leads
to more confusion and more congestion.” Gonzales E. et al 2009, “argue that for a city of roughly
4 million inhabitants, Nairobi has few streets to serve traffic demand with only a handful of roads
linking the radial arterials outside of the central business district (CBD) as shown below.”

6
Fig. 6 The road network in Nairobi is primarily composed of radial routes connecting surrounding
regions to the CBD. The lack of circumferential roads forces many peripheral trips through the
center.
Katahira & Engineers International, 2006 “notes at least 18 intersections are equipped with traffic
signals, although phase timing data was only available for 11 signals. The small number of streets
for carrying automobile, truck, bus, and matatu traffic in Nairobi results in the following
conditions:
Concentration of Vehicles on Limited Infrastructure – Since there are few streets, and most
arterials are radial, vehicular trips between different neighborhoods must share limited
paved street space, concentrating traffic onto the sparse network of major roads. This is
particularly problematic in and around the CBD.
Lack of Redundancy – The connections between the major arterials are few and far
between, so there are usually no more than one or two reasonable routes for any origin-
destination pair. This means that traffic cannot be redistributed to use street infrastructure
more efficiently. Due to the lack of ring roads many peripheral trips must pass through the
CBD which compounds traffic congestion in the center.”

7
Proposed Corrective Mechanisms by Nairobi County
“The Traffic Department, under the umbrella of Nairobi Country developed a Traffic
Decongestion Program whose aim is to relieve the persistent traffic congestion in Nairobi’s central
business district. The program has the long term goal of creating a network of monorails and
truncated buses. In the short term, the following components are proposed for implementation:
1. Increase Uni-Direction (one-way) traffic movement, including along: Moi Avenue,
Koinange Street, Tom Mboya Street, Muindi Mbingu Street, Harambee Avenue, River
Road, Kirinyaga Road, City Hall Way and Parliament Road
2. Create dedicated bus routes and lanes in the central business district
3. Remove on-street parking at the following locations: Moi Avenue, Tom Mboya Street,
Muindi Mbingu Street, Koinange Street, Harambee Avenue, River Road, Kirinyaga Road,
Haile Selassie Avenue
4. Increase the number of multistory car parks, including at the following locations: Sunken
car park, Law courts car park, Hakati car park, Central bus station
5. Create Park and Ride stations to service the following highways: Thika Road, Mombasa
Road, Ngong Road and Waiyaki Way
6. Designate drop off and pick up points on the following roads: Haile Selassie Avenue, Agip
petrol station, Wakulima market area, Railways terminus, St. Peter Clavers – kaka, Moi
Avenue, Between Moi Primary and Jevanjee Gardens, Kencom, Kenyatta Avenue,
Simmers Hotel and Hughes Building
7. Reinforce road reserves on all by bass and ring roads
8. Restrict heavy transit traffic between 07:00-10:00 and 16:00-20:00 on weekdays
9. Allow vehicles with over 60 passengers and standing passengers to use roads within the
NMR
10. Expand the Central Business District to include the following areas:Westlands, Pangani,
Eastleigh into Jogoo Road, Lusaka Road into Nairobi West, Langata Road and Mbagathi
into Hurlingham.
With respect to the above, traffic management using IoT has not been adopted in Nairobi in an
attempt to improve traffic flow in the City.”

8
2.3 IoT Background
“The IoT is a recent communication paradigm that envisions a near future in which the objects of
everyday life will be equipped with micro-controllers, transceivers for digital communication, and
suitable protocol stacks that will make them able to communicate with one another and with the
users, becoming an integral part of the Internet” (Atzori, Iera, & Morabito, 2010).
Evans 2011, “IoT is simply the point in time when more “things or objects” were connected to the
Internet than people. The survey notes that in 2003, there were approximately 6.3 billion people
living on the planet and 500 million devices connected to the Internet which represented less than
one (0.08) device for every person. Based on Cisco IBSG’s definition, IoT didn’t yet exist in 2003
because the number of connected things was relatively small given that ubiquitous devices such as
smartphones were just being introduced.”
“The IoT concept, hence, aims at making the Internet even more immersive and pervasive.
Furthermore, by enabling easy access and interaction with a wide variety of devices such as, for
instance, home appliances, surveillance cameras, monitoring sensors, actuators, displays, vehicles,
and so on, the IoT will foster the development of a number of applications that make use of the
potentially enormous amount and variety of data generated by such objects to provide new services
to citizens, companies, and public administrations. This paradigm indeed finds application in many
different domains, such as home automation, industrial automation, medical aids, mobile health
care, elderly assistance, intelligent energy management and smart grids, automotive, traffic
management and many others”, (Zanella & Vangelista, 2013)
Figure 1: Internet of Things Ecosystem

9
“Explosive growth of smartphones and tablet PCs brought the number of devices connected to the
Internet to 12.5 billion in 2010, while the world’s human population increased to 6.8 billion,
making the number of connected devices per person more than 1 (1.84 to be exact) for the first
time in history. The Internet doubles in size every 5.32 years”, (Evans, 2011). CISCO 2015, “it
has been predicted that by 2015 there will be 25 billion devices, 50 to 100 billion devices by 2020
connected to the Internet.”
Figure 2: Expected penetration of connected objects by the year 2020
2.4 IoT Architecture
With the envisaged growth in IoT where more than 25 Billion “things” are expected to be
connected by 2020, Cisco states that this represents huge numbers that the existing architecture of
Internet with TCP/IP protocols will not handle. Cao, Li and Zhang 2011, “notes that with the rapid
growth of IoT there is need for new open architecture that can address various security and Quality
of Service (QoS) issues as well as support the existing network applications using open protocols.”
Li 2012, “argue that without proper assurance, IoT is not likely to be adopted by many. Therefore
protection of data and privacy of users are key challenges for IoT. More importantly, Chen (2012)
proposes a number of multi-layered security architectures for further development of IoT.”

10
Chen and Deng 2009, “described a three key level architecture of IoT while Suo et al. (2012)
described a four key level architecture. Wu et al. (2010) proposed a five layered architecture using
the best features of the architectures of Internet and Telecommunication management networks
based on TCP/IP and TMN models respectively. Similarly, Zhang, Sun and Cheng (2012) states a
six-layered architecture based on the network hierarchical structure. So generally it’s divided into
six layers as shown in the Fig. 3.”
The six layers of IoT are described below:
Figure 3: Six-Layered Architecture of IoT
Coding Layer
Zhang, Sun and Cheng, 2012, “describes this layer as the foundation of IoT which provides
identification to the objects of interest. They state that it is in this layer where each object is
assigned a unique ID which makes it easy to distinguish the objects.”
Perception Layer
Bandyopadhyay and Sen, 2011, “states that this is the device layer of IoT which gives a physical
meaning to each object. It consists of data sensors in different forms like RFID tags, IR sensors or
other sensor networks which could sense the temperature, humidity, speed and location etc of the
objects. This layer gathers the useful information of the objects from the sensor devices linked

11
with them and converts the information into digital signals which is then passed onto the Network
Layer for further action.”
Network Layer
Zhang, 2011, “states that the purpose of this layer is to receive the useful information in the form
of digital signals from the Perception Layer and transmit it to the processing systems in the
Middleware Layer through the transmission mediums like WiFi, Bluetooth, WiMaX, Zigbee,
GSM, 3G, 4G etc with protocols like IPv4, IPv6, MQTT, DDS etc.”
Middleware Layer
Shen and Liu, 2011, “states that this layer processes the information received from the sensor
devices. It includes the technologies like Cloud computing, Ubiquitous computing which ensures
a direct access to the database to store all the necessary information in it. Using some Intelligent
Processing Equipment, the information is processed and a fully automated action is taken based
on the processed results of the information.”
Application Layer
“This layer realizes the applications of IoT for all kinds of industry, based on the processed data.
Because applications promote the development of IoT so this layer is very helpful in the large scale
development of IoT network (Wu, Lu, Ling, Sun, & Du, 2010). The IoT related applications could
be smart homes, smart transportation, smart planet etc.”
Business Layer
Khan et al. 2012, “states that this layer manages the applications and services of IoT and is
responsible for all the research related to IoT. It generates different business models for effective
business strategies.”
2.5 IoT Technologies
“The development of IoT computing system where digital objects can be uniquely identified and
can be able to think and interact with other objects to collect data for undertaking actions a, requires
the need for a combination of new and effective technologies. He argues that this is only possible
through an integration of different technologies which can make the objects to be identified and

12
communicate with each other (Khoo, 2011). The following relevant technologies can help large-
scale development of IoT applications.”
a. Radio Frequency IDentification (RFID)
Chen, 2012, “RFID is the key technology for making the objects uniquely identifiable. It’s reduced
size and cost makes it integrable into any object. It is a transceiver microchip similar to an
adhesives ticker which could be both active and passive, depending on the type of application.
Active tags have a battery attached to them due to which they are always active and therefore
continuously emit the data signals while Passive tags just get activated when they are triggered.”
In addition, Shen and Liu, 2011, “argue that Active tags are more costly than the Passive tags
however they have a wide range of useful applications. RFID system is composed of readers and
associated RFID tags which emit the identification, location or any other specifics about the object,
on getting triggered by the generation of any appropriate signal (Zhang, Sun, & Cheng, 2012). The
emitted object related data signals are transmitted to the Readers using radio frequencies which
are then passed onto the processors to analyze the data.”
Figure 4: RFID Scenario

13
b. Wireless Sensor Network (WSN)
Atzori, Iera and Morabito, 2010, “ states that WSN is a bi-directional wirelessly connected network
of sensors in a multi-hop fashion, built from several nodes scattered in a sensor field each
connected to one or several sensors which can collect the object specific data such as temperature,
humidity, speed etc and then pass on to the processing equipment. The sensing nodes communicate
in multi-hop manner. Each sensor is a transceiver having an antenna, a micro-controller and an
interfacing circuit for the sensors as a communic7ation, actuation and sensing unit respectively
along with a source of power which could be either battery or any energy harvesting technology.”
However, Shen and Liu, 2011, “has proposed an additional unit for saving the data, named as
Memory Unit which could also be a part of the sensing node. A typical sensing node is shown in
the figure below”:
Figure 5: A typical sensing node
Atzori, Iera and Morabito, 2010, “concludes that WSN technology and RFID technology when
combined together opens up possibilities for even more smart de-vices, for which a number of
solutions have been proposed.”
c. Cloud Computing
Rao et al. 2012, “states that Cloud Computing is an intelligent computing technology in which
number of servers are converged on one cloud platform to allow sharing of resources between each

14
other which can be accessed at any time and any place.” On the other hand, Xiaohui, 2013, “argue
that Cloud computing is the most important part of IoT, which not only converges the servers but
also processes on an increased processing power and analyzes the useful information obtained
from the sensors and even provide good storage capacity. Xiaohui further argues that Cloud
computing interfaced with smart objects using potentially millions of sensors can be of enormous
benefits and can help IoT for a very large scale development.”
Figure 6: A typical Cloud Computing Scenario
d. Networking Technologies
Rao et. Al. 2012, “These technologies are responsible for the connection between the objects, so
it calls for a fast and an effective network to handle a large number of potential devices. For wide-
range transmission network 3G, 4G etc are commonly used. Similarly for a short-range
communication network we use technologies like Bluetooth, WiFi etc.”
e. Nano Technologies

15
Akyildiz and Jornet, 2010, “states that nano technology realizes smaller and improved version of
the things that are interconnected. It can decrease the consumption of a system by enabling the
development of devices in nano meters scale which can be used as a sensor and an actuator just
like a normal device. Such a nano device is made from nano components and the resulting network
defines a new networking paradigm which is Internet of Nano-Things.”
f. Micro-Electro-Mechanical Systems (MEMS) Technologies
“MEMS are a combination of electric and mechanical components working together to provide
several applications including sensing and actuating which are already being commercially used
in many field in the form of transducers and accelerometers etc. MEMS combined with Nano
technologies are a cost-effective solution for improvising the communication system of IoT and
other advantages like size reduction of sensors and actuators, integrated ubiquitous computing
devices and higher range of frequencies etc Lubecke” (Lubecke & Chiao, 1999)
g. Optical Technologies
“Rapid developments in the field of Optical technologies in the form of technologies like Li-Fi
and Cisco’s BiDi optical technology could be a major breakthrough in the development of IoT. Li-
Fi, an epoch-making Visible Light Communication (VLC) technology, will provide a great
connectivity on a higher bandwidth for the ob-jects interconnected on the concept of IoT. Similarly
Bi-Directional (BiDi) technology gives a 40G ethernet for a big data from multi-farious devices of
IoT.”
2.6 IoT in Transportation Systems
Xiao and Wang, 2011, “argues that the development of Internet of things based on EPC code and
RFID reader brings a good opportunity for intelligent traffic monitoring. They state that at first,
EPC assigns a unique electronic code for each traffic tool, ensuring the identification uniqueness
for them similar to license plate. And then, RFID identifies traffic tools automatically to obtain
related data via radio frequency signal. They conclude that the work of the monitoring system
based on RIFD recognition is not affected by night or adverse weather. Therefore, intelligent traffic
monitoring system based on Internet of things has broad prospects of development and expansion
space.

16
Most of the daily life applications that we normally see are already smart but they are unable to
communicate with each other, enabling them to communicate with each other and share useful
information with each other will create a wide range of innovative applications. These emerging
applications with some autonomous capabilities would certainly improve the quality of our lives.
This section presents some of the possible future applications that can be of great advantage in city
transportation ecosystem:”
Smart Traffic System–Cao, Li and Zhang, 2011, “argues that there is a need for a system that can
improve the traffic situation based on the traffic information obtained from objects using IoT
technologies. For such an intelligent traffic monitoring system, automatic identification of
vehicles and other traffic factors is very important for which IoT technologies are needed instead
of using common image processing methods. With IoT, the intelligent traffic monitoring system
will provide a good transportation experience by easing the congestion. The system could have
features for theft-detection, reporting of traffic accidents among others.”
Smart Parking –In a Smart city field study on “intelligent parking lot application using wireless
sensor networks” (Lee, Yoon, & Ghosh, 2008). “Smart parking service is based on road sensors
and intelligent displays that direct motorists along the best path for parking in the city. The benefits
deriving from this service are manifold: faster time to locate a parking slot means fewer CO
emission from the car, less traffic congestion, and happier citizens.
The smart parking service can be directly integrated in the city IoT infrastructure by using the IoT
technologies.”
2.7 Past Technologies related to IoT in Traffic Monitoring
Google 2015, “Google Car which is an initiative to provide a self-driving car experience with real-
time traffic, road conditions, weather and other information exchanges (Google Official Blog), all
due to the concept of IoT.”
Fernandez-Caballero, Gomez and Lopez-Lopez ,2008, “presented a visual application which
allows a study and analysis of traffic behavior on major roads (more specifically freeways and
highways), using as the main surveillance artefact a video camera mounted on a relatively high
place (such as a bridge) with a significant image analysis field.”

17
Tai et al. 2004, “presented an image tracking system and its applications for traffic monitoring and
accident detection at road intersections. Locations of motorcycles as well as automobiles are
obtained in real time using the active contour model approach. Image measurement is further
incorporated with Kalman filtering techniques to track individual vehicle motion.”
Hong, Kwon and Kim, 1999, “presented the design and implementation of a portable, Web-based
network traffic monitoring and analysis system called WebTrafMon, which provides monitoring
and analysis capabilities not only for traffic loads but also for traffic types, sources and
destinations.”
Zhu et al. 1996, “presented a novel approach to automatic traffic monitoring using 2D spatio-
temporal images. A TV camera is mounted above a highway to monitor the traffic through two
slice windows, and a panoramic view image and an epipolar plane image are formed for each
lane.”
2.8 IoT Versus Current traffic conditions in Nairobi
According to Gachanja, (2011), “on the demand side 50% of the traffic congestion in Nairobi could
be solved by increasing road capacities and 10.86% by building bypass roads while on the supply
side 40.91% could be solved by shifting to public transport and higher vehicle capacity and 10.70%
by development of multiple centres in Nairobi metro region. Both of these measures especially
increasing road capacities were considered not economically feasible (Gachanja J. , 2015).
Nairobi, the commercial hub of the second-fastest growing regional economy in Africa, accounts
for about two-thirds of Kenya’s $41 billion annual economic output, which the government
predicts will grow 5.8 percent this year. The crowd is only growing. Kenya’s projected 4.3 percent
annual rate of urbanization from 2010 to 2015, when 12 million of its people will live in urban
areas, is more than double the global average of 2 percent and above the African average of 3.6
percent, United Nations.”
IBM, 2011, “the city’s roads were the world’s fourth-most congested. The World Health
Organization estimates road accidents kill as many as 13,000 Kenyans a year. The government
estimates that traffic jams cost 50 million shillings ($578,000) a day in lost productivity in the city,
a base for General Electric Co. and Google Inc. and home to the UN’s headquarters in Africa.”

18
2.9 Gap Analysis
From the above analysis, traffic congestion is a major problem in most cities in the developing
world where road infrastructure is inadequate. The problem is compounded by lack of real time
information on traffic flows and lack of facilities for optimizing this flow. This paper seeks to
address the problem of gaining real-time data on congestion levels around a heavily congested
African cities using Internet of Things. Nairobi, the capital of Kenya is picked as a case for this
study.
Additionally, it has emerged that Internet of things has not been widely adopted in combating
traffic congestion in these Cities. Traffic jams on most roads could reduce drastically if the city
authorities would welcome adoptions of IoT technologies to combat traffic. In conclusion of the
study, a sustainable intelligent IoT Architecture for traffic management will be proposed for the
City of Nairobi which could subsequently be used by any other African Country.
2.10 IoT architectures for traffic management
2.10.1 IBM Intelligent Traffic Management
“A critical integration point of IBM Intelligent Transportation is the gathering of traffic and event
data from other traffic center systems and field devices based on the increasingly popular Traffic
Management Data Dictionary (TMDD) standard. "Center" subsystems deal with the functions
which include roadway information and reporting, traffic management, archived data
management, and core services (such as administration, authentication, and authorization).”

19
Figure 7: IBM Intelligent Transportation high-level architecture
2.10.2 Intelligent Transportation System with the IoT by Intel
“The solution incorporates technologies from the Internet of Things (IoT) that can connect nearly
anything with an electronics subsystem to the existing Internet infrastructure. Commercial vehicle
terminals securely connect to a cloud-based platform running big data analytics. Intel®
architecture computing platforms products are used to build an end-to-end solution that enhances
the user experience, improves reliability and security, and helps reduce operational costs.”

20
Figure 8: Intelligent Transportation System with the IoT by Intel
2.10.3 AGT and Cisco Traffic Incident Management Solution Architecture
The AGT and Cisco® Traffic Incident Management Solution, “addresses the two most important
traffic challenges facing cities today: road safety and congestion. It helps accurately detect more
incidents, early on, before they become more serious, and enables quicker response by monitoring
and analyzing traffic flow data. The solution stands out with two important innovations: the fusing
of data from multiple sources to identify real incidents and reduce false alarms, and the integration
of multiple applications into one comprehensive solution.
The AGT and Cisco Traffic Incident Management Solution:
Collects data from a variety of sensors and stores it for processing
Fuses, filters, and applies advanced analytics to the collected data to identify the most
relevant information
Visualizes the relevant information using layers to increase situational awareness
Supports a wide variety of other integrated partner applications and analytics”

21
Figure 9: AGT and Cisco Traffic Incident Management Solution Architecture
2.10.4 Cisco Smart Connected City Parking Architecture
Street-line sensors detect the real-time availability of parking spots, while also integrating with
digital meters to identify meter violations. Video cameras enabled with analytics monitor parking
spots and no-parking zones. The system can also track specific vehicle types and report on loading
zone violations. Street-line’s suite of applications for consumers, city officials, and enforcement
officers ensure that the correct information is delivered, at the right time, to the right people for
decisions.

22
Figure 10: Cisco Smart+Connected City Parking
2.11 Proposed IoT Architecture for Nairobi City
I will adopt CISCO’s smart traffic management for this study with little modification to the
architecture. Previous studies have proven that 40% of traffic in cities is caused by drivers circling
looking for a parking space. On this note, I will include parking sensors in the sensing layer bearing
in mind traffic management cannot be separated from parking.
This architecture consist of the following independent variables:
Sensing Layer – “This layer gathers the useful information of the objects from the sensor devices
linked with them and converts the information into digital signals which is then passed onto the
Communication Layer for further action.” It consists of:
Vehicle sensor
Parking sensors
RFID
Cameras
License plate reader
CCTV

23
Communication Layer – This layer receive useful information in the form of digital signals from
sensing layer and transmit it to the data processing layer through the transmission mediums like
Wi-Fi, wired/wireless networks etc.
Data Processing Layer – this Layer receives data from the communication layer and converts it
into useful information which is availed to the road users (open architecture). This data is capable
of supporting many city services and initiatives across a single common infrastructure.
Open infrastructure – consists of city apps/smart services for road users. It can also serve as
open-data to the innovation ecosystem using the open interfaces

24
Table 1: Conceptual framework
Data sources (people, vehicles, roads, parking slots, junctions/service
areas)
Sensing Layer
Vehicle sensor Video camera Fee collection
Parking sensor CCTV License plate reader
RFID
Communication layer
City Wi-fi Wired/wireless access
Data processing layer
Data centers Cloud computing platform
Open infrastructure
Apps/services for city residents
Traffic Reduction
Reduced congestion
Better mobility
Savings in time and fuel
Decrease travel times
Road safety
Environmental impact – reduced CO2
Enhance economic productivity from reduced travel times

25
The key capabilities of this architecture:
Table 2: Key Capabililties of IoT Architecture for Nairobi
Parking Guidance
View real-time parking availability, visually displayed on mobile devices or digital signage
Search for parking spaces based on points of preferences
View parking rates and policy information in advance
Receive voice guidance all the way to the parking space
Pay using a mobile application
Enforcing Parking
Capture all parking events in metered and non-metered spaces
Track payment and overstay violations using sensors and meter integration
Monitor, report live, and enforce no-parking and loading zone violations using
video analytics
Deliver live snapshots of violations to mobile devices to aid enforcement officers
Administration & Analytics
Easily configure and manage sensors, video infrastructure, and policies/rules for parking
violations
Report on parking availability, income, administration, etc.
Provide useful information to assist with pricing decisions

26
CHAPTER 3: METHODOLOGY
Research methodology represents the framework that the researcher used to illustrate the
procedures for collecting data for this study. The methodology for this study involved reseach
design, examining the types of data required and their sources, methods of data collection, data
analysis and presentation techniques.
3.1 Research Design
This study adopted an interpretivist approach in research in order to integrate human interest into
the study. “Moreover, interpretivism studies usually focus on meaning and may employ multiple
methods in order to reflect different aspects of the issue. This approach suited this study because
Interviews and observations which are the most popular primary data collection methods in
interpretivism studies, are crucial to the type of data that will be collected.”
The research strategy used was the descriptive approach since the aim of the study was to develop
a sustainable traffic management architecture based on IoT and other technologies to improve
traffic conditions and relieve the traffic pressure for the City of Nairobi. “A descriptive research
intends to present facts concerning the nature and status of a situation, as it exists at the time of the
study. It is also concerned with the relationships and practices that exist, beliefs and processes that
are ongoing, effects that are being felt, or trends that are developing. Also, such approach tries to
describe present conditions, events or systems based on the impressions or reactions of the
respondents of the research.”
3.2 The Study Population, Sample size and sampling techniques
3.3.1 Population
The study pollution involved the following groups that have been purposively targeted with the
view that they could provide relevant information in relation to the research questions.
a. Road users – this group comprised private cars drivers.
b. Road Network – comprised Mombasa road, Uhuru Highway, Langata Road, Ronald Ngala
Street, University Way, Waiyaki way, Thika Highway, Kenyatta Avenue, River Road, Moi
Avenue, Tom Mboya Street among others

27
3.3.2 Sample Size and Sampling Procedure
According to McGregor & Doya, (2014) the number of vehicle on Nairobi’s roads have more than
doubling since 2012 to 700,000. According to sampling tables drawn by Krejcie & Morgan,
(1970), while carrying out a research whose target population lies between 75,000 and 1,000,000,
a sample size of 384 is considered sufficient, hence 384 road users were targeted in this study.
Because of time and resources constraints the researcher involved half of the minimal sample, that
is 192 private car drivers and 12 county parking attendants in the study. Using all road that connect
to the CBD for the study would present practical challenges. In the light of this, the following 8
key road links serving the CDB will be surveyed. And within each road 24 road users (drivers)
were randomly sampled.
Table 3: Road Sample size
Road Sample size
Uhuru Highway 24
Mombasa Road 24
University Avenue 24
Haile Selassie Avenue 24
City Hall Way 24
Kenyatta Avenue 24
Tom Mboya Street 24
Moi Avenue 24
3.3 Data collection tools and nature of data
This research utilized both primary and secondary data. Primary data were collected via self-
administered questionnaires while secondary data will be obtained via document reviews.
Accurate data on Nairobi traffic congestion was important to define the existing problem hence
assis desing appropriate solution that would address the problem.
3.4.1. Questionnaires
This study was used to obtain important tafffic information from the major road users in Nairobi.
The questionnaires were self-administered. This allowed for responses from the respondents with
varying characteristics, some of whom required further assistance in providing responses.

28
Additionally, closed and open-ended questions were used to determine various individual’s
perception of the traffic congestion in Nairobi.
3.4.2. Document Review
This entailed identifying relevant policy documents from deparments responsible for managing
traffic in Nairobi. They include Kenya Urban Roads Authority, Trafffic Department (Nairobi
County) and Kenya National Highways Authority (KeNHA).
3.4 Pilot study
A pilot study was carried out on two non-study roads to gain insights and clarify issues on the
system needs study instruments constructs.
3.5.1 Validity
According to Mugenda (2008), validity is the degree to which an instrument measures what it
purports to measure. The research concentrated on content validity by performing a pre-test so as
to adjust the research tool to meet the required standards. The results of the study were validated
by reviewing it with other similar researches done.
3.5.2 Reliability
This is a measure of the degree to which a research instrument would yield the same results after
repeated trials (Mugenda, 2008). The reliability of the questionnaire will be established through
split half techniques where the pretest dataset will be split into two equal datasets and the Cronbach
Alpha evaluated. The results indicated a Cronbach Alpha score of 0.73 greater than 0.70 which
was considered to be indicating that the study results were reliable.
3.5 Data Analysis
The study generated both quantitative and qualitative. The researcher went through the
questionnaires carefully and systematically to check for inconsistensies and incompleteness. The
responses obtained were coded, entered and analysed using SPSS version 2.1. Quantitative data
were analysed by use of descriptive statistics involving the mean/median, frequencies and
percentages and results presented in graphs and charts. Qualitative data were analysed using
content and thematic analysis and themes developed.

29
3.6 Ethical Considerations
Prior to data collection exercise, the respondents were informed of what the research was about,
its tentative research goals and objectives. Additionally, all respondents were guaranteed
confidentiality during this process. Data collected was kept confidentail and be used only for
purposes of this research. Approval to conduct data among parking attendant was sought from the
Nairobi County government.

30
CHAPTER FOUR: RESULTS AND DISCUSSION
This chapter presents the study findings relative to the study objectives. Seld administered
questionnaires were used to collect data from the respondents.
4.1 Socio-demographic characteristics
The total sample size for the survey was 212, 200 were private car drivers while 12 were county
parking attendants. Male composed majority of the respondents 85% private car drivers and 75%
county parking attendants. Majority (53.5%) of the private car driver respondents had attained
university/college education while majority (66.7%) of the county parking attendants had attained
secondary level of education. 38% of the private car attendants and 41.7% of the county parking
attendants were aged between 30 and 39 years.
Table 4: Socio-Demographic Characteristics
Characteristics Categories Private car drivers County Parking attendants
Frequency Percent (N = 200) Frequency Percent (N = 12)
Gender Male 170 85.0 9 75.0
Female 30 15.0 3 25.0
Education
level
University/College 107 53.5 3 25.0
Secondary 86 43.0 8 66.7
Primary 5 2.5 1 8.3
None 2 1.0 0 .0
Age categories
30-39 76 38.0 5 41.7
40-49 56 28.0 4 33.3
20-29 37 18.5 1 8.3
50-59 20 10.0 2 16.7
>59 11 5.5 - -
Slightly over half of the respondents identified parking spots by driving around while majority
(70.1%) parked their cars on on-street parking.
Table 5: Form of identifying parking lots and Parking place
Frequency Percent
Form of identifying parking lots in town
Driving around 103 51.5%
Parking attendants 50 25.0%
Booking in-advance 29 14.5%
Parking boys 18 9.0%

31
Parking place.
On-street parking 138 70.1%
Off-street parking 33 16.8%
Private parking 24 12.2%
Other 2 1.0%
4.2 Causes of traffic congestion in Nairobi
38.7% of the private cars spent between one and two hours in the traffic jam in the morning with
an average of 1.6 hours of the morning time spent on traffic jam while an equal number (35.9%)
of private car drivers spent 1-2 hours and 2-3 hours in traffic jam in the evening with an average
of 2.0 hours of the evening time spent on traffic jam. Cummulatively, drivers spent an average of
3.6(±0.3) hours stack in traffic jam both in the evening and in the morning. This findings were
similar to the IBM Commuter Pain Survey where it was found out that 45% of drivers in Nairobi
said they had been stuck in traffic for three hours or more (IBM, 2011).
Figure 11: Time Spent in Traffic Jam
As shown in the scatter plot, most drivers were paying Kshs. 300 irrespective of the amount of
time they park their cars.
7.8
35.9 35.9
14.1
6.3
010
2030
40
Per
cent
0 1 2 3 4 5Amount of evening time spent in traffic jam
19.1
38.7
30.9
11.3
010
2030
40
Per
cent
0 1 2 3 4Amount of Morning time spent in traffic jam

32
Figure 12: Parking fee
To determine the major causes of traffic jams in Nairobi both the county parking attendants and
private car attendants were asked to rank the causers (individuals) of traffic jam from 1 (most) to
4(least) and the situation that causes traffic jam from 1(most) to 5(least)least.
From Figure 13, both private car drivers and county parking attendants considered matatu car
drivers as the most causers of traffic jams in Nairobi, private car drivers were ranked the second
causers of traffic jams while traffic polic and county council askaris/parking attendants were
ranked third and forth respectively. Similar findings were made in the report by Transport and
Urban Decongestion Committee report in which it was reported that in order of bearing greatest
responsibility of causing traffic jams matatus (75%), private vehicles(71%), pedestrians (55%),
minibuses (48%), heavy commercial vehicles(46%), mkokotenis (45%), and motor bikes(38%)
(Nairobi City County, 2014). “This can be explained by the fact that motor cars have increased at
a faster rate of 7% than buses and mini-buses (5%), which implies that personal vehicles are
becoming more popular as a mode of transport in the country and especially in Nairobi” (Gachanja
J. , 2015). This finding was similar to the assertions that private car ownership and absence of a
public transport system are the major causes of traffic gridlocks in Nairobi; although the current
traffic volume may be managed for a time but with increasing car ownership, it will recur (Kebari,
2015)
05
10
15
20
25
Park
ing tim
e.
0 100 200 300 400 500Parking fee.
33
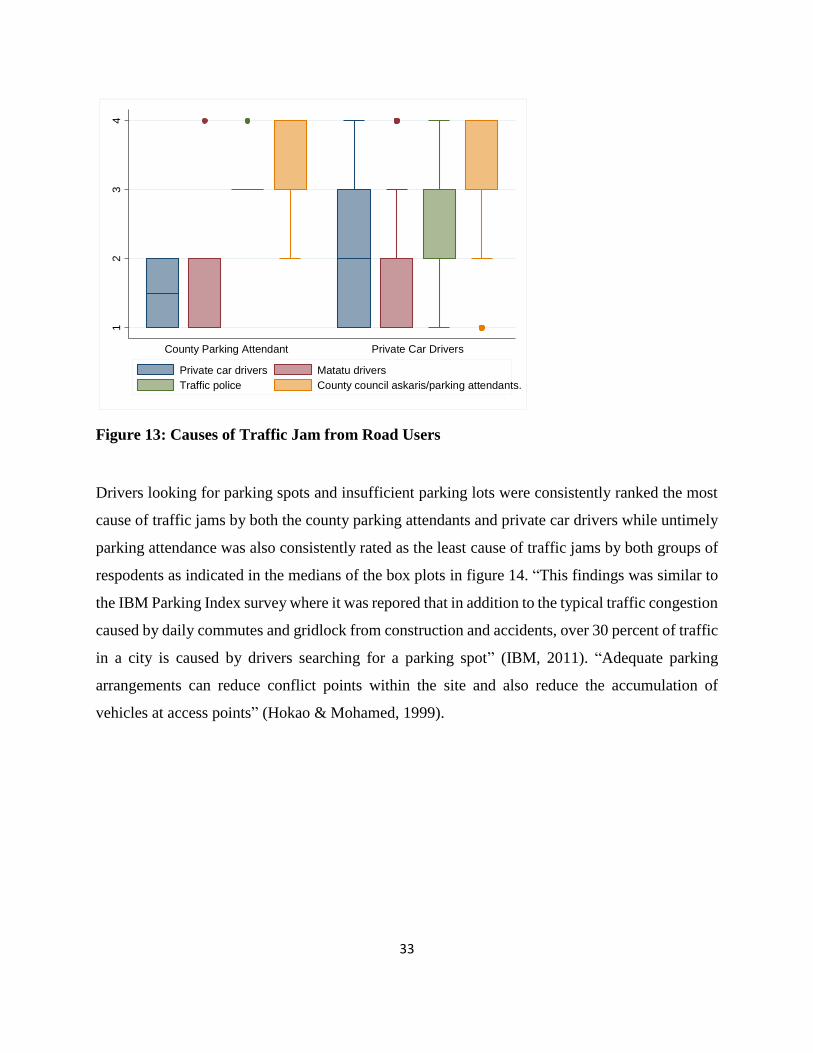
Figure 13: Causes of Traffic Jam from Road Users
Drivers looking for parking spots and insufficient parking lots were consistently ranked the most
cause of traffic jams by both the county parking attendants and private car drivers while untimely
parking attendance was also consistently rated as the least cause of traffic jams by both groups of
respodents as indicated in the medians of the box plots in figure 14. “This findings was similar to
the IBM Parking Index survey where it was repored that in addition to the typical traffic congestion
caused by daily commutes and gridlock from construction and accidents, over 30 percent of traffic
in a city is caused by drivers searching for a parking spot” (IBM, 2011). “Adequate parking
arrangements can reduce conflict points within the site and also reduce the accumulation of
vehicles at access points” (Hokao & Mohamed, 1999).
12
34
County Parking Attendant Private Car Drivers
Private car drivers Matatu drivers
Traffic police County council askaris/parking attendants.

34
Figure 14: Causes of Traffic jam
41.7% of the parking attendants thought that drivers sometimes fail to identify available parking
lots and a similar proportion thought that drivers where encountering challenges in identifying
parking spots. According to the IBM Parking Index survey in Nairobi 76% of the drivers reported
not reaching their intended destination because they gave up looking for parking (IBM, 2011).
“And in the IBM’s recommendation they suggested parking systems in the city could be
automated, alerting commuters to open spaces in the city and minimising time spent searching for
traffic” (Mbuvi, 2012).
Figure 15: Parking Identification
12
34
5
County Parking Attendant Private Car Drivers
Drivers looking for parking spots Disregard to traffic rules and traffic lighting
Insufficient parking spots On-street parking
Untimely parking attendance
0.0% 10.0% 20.0% 30.0% 40.0% 50.0%
Never
Rarely
Sometimes
Always
16.7%
16.7%
41.7%
25.0%
16.7%
33.3%
41.7%
8.3%
Drivers failing to identifyavailable parking lots
Drivers encounteringchallenges of identifying aparking spot

35
Drivers in the mid morning spent 30 minutes looking for parking spots in town while drivers in
the early morning spent 12 minutes to walk from the parking spot to their workplaces. Kruskal
wallis test (p-value = 105 and .831) indicated that drivers spent similar amount of time looking for
parking spots and similar amount of time walking from parking spot to place of work irrespective
of the time a driver drives to town. Drivers averagely spent 10 minutes to look for parking attendant
to pay for the parking lots. “These findings were similar to the IBM Parking survey in which they
found out that on average drivers in Nairobi spent 31.7 minutes in their longest search for a parking
spot where 13% reported driving around for more than one hour for a parking spot within the last
year”, (IBM, 2011). This could be attributed to the fact that most commuters try to access jobs
and socio-economic opportunities at the same time on an 8:00 a.m.–5:00 p.m. daily schedule
therefore spend similar times irrespective of the time of the day (Gachanja J. , 2015). Similar
assertions were made by Kinyanjui and Kahonge (2013) in which they reported that sometimes,
the time spent looking for the attendant is significant and most drivers dread leaving their cars
before they pay the parking fee due to the consequences which include having your vehicle locked
or even towed which in turn attracts heavy penalties. Parking space need to be provided close to
the motorist’s place of work to avoid walking a longer distance which will prompt driving hence
the increase in traffic in the Central Business District (CBD) (Mudzengerere & Madiro, 2013).
Table 6: Time spent looking for parking lot and parking attendant
Time of driving to
town
Time spent looking
for parking spot
Walking time from parking
to work place.
Time spent looking for
parking attendant
Early morning 15 12 10
Morning 20 10 10
Mid morning 30 10 10
Afternoon 20 10 8
Drivers driving to town in the early in the morning always/sometimes got parking spots
immediately they arrived in town, drivers in the morning sometimes got parking spots
immediately, drivers in the mid morning rarely got parking spots immediately while drivers in the
afternoon sometimes got parking spots immediately.
Table 7: Time of Immediate getting of parking slots

36
Time of
driving to
town
Immediately time of get parking slots
Always Sometimes Rarely Never
Frequency Percent Frequency Percent Frequency Percent Frequency Percent
Early
morning 14 42.4% 14 42.4% 4 12.1% 1 3.0%
Morning 23 22.3% 58 56.3% 20 19.4% 2 1.9%
Mid
morning 3 13.6% 9 40.9% 10 45.5% 0 0.0%
Afternoon 5 12.2% 19 46.3% 16 39.0% 1 2.4%
Both county parking attendants (83.3%) and private car drivers (62%) majorly considered the
current system of parking identification as inconvenient and similarly both county parking
attendants (75%) and private car drivers (77.4%) majorly considered the current system of parking
payment as inconvenient. These findings were contrary to the assertions that the current payment
system was convenient as one can have the parking fee paid for by another remotely and saved
time to the customer as they do not need to look for the attendant to pay for parking (Ogut, 2015).
This could be attributed to the fact that the current system did not provide real time parking
information but only provided for payments, which was considered to be the most desirable feature
parking management system according to 83.3% of employees Lulu East Africa, a company
providing parking services in Nairobi, this was followed by mobile payment with 71.7% (Muema,
Kyambo, Kyambo, Kirichu, & Senagi, 2014).
Table 8: Convinience of current parking identification and parking payement system
Respondent current system of parking identification current parking payment system
Convenient Not convenient Convenient Not convenient
Frequency Percent Frequency Percent Frequency Percent Frequency Percent
County
Parking
Attendant
10 83.3% 2 16.7% 9 75.0% 3 25.0%
Private Car
Drivers 124 62.0% 76 38.0% 154 77.4% 45 22.6%
Majority (79.9%) of the private car drivers recommended that the amount of money to be charged
should depend on the amount of time one spend in the parking lot.

37
Figure 16: Recommendation of timed parking charges
4.3 Current IoT technologies and Architectures applicable in traffic management
From review of literature, the study adopted the six-layered architecture based on the network
hierarchical structure developed by Cheng et al. (2012) involving the coding, perception, network,
middleware, application and business layers.
Coding Layer “provided the foundation identification to the objects of interest by assigning a
unique ID which makes it easy to distinguish the objects where the cars and the parking lots were
allocated unique IDs. Perception Layer is the device layer of IoT which gives a physical meaning
to each object consisting of data sensors in different forms like RFID tags, IR sensors or other
sensor networks which could sense the speed and location of the objects and thereby convert the
collected information about the devices linked into digital signals which is then passed onto the
Network Layer for further action; the cars were fitted with number plates with sensors and sensors
were also mounted on parking lots. Network Layer receive information and transmit it to the
processing systems in the Middleware Layer through the transmission mediums like WiFi,
Bluetooth, WiMaX, Zigbee, GSM, 3G, 4G etc with protocols like IPv4, IPv6, MQTT, DDS etc in
this case data was transmitted using WiFi. Middleware Layer processes the information received
from the sensor devices. It includes the technologies like Cloud computing, Ubiquitous computing
which ensures a direct access to the database to store all the necessary information in it, in this
case ubiquitous computing was adopted to automate information processing. Application Layer
realizes the applications of IoT for all kinds of industry, based on the processed data where in this
case consisted of smart parking. Business Layer manages the applications and services of IoT and
in this case consisted of back-end management.”
79.9%
20.1%
Recommendation of timed parking charges
Recommend
Don't recommend

38
4.4 Prototype of sustainable IoT Architecture for parking management in Nairobi
Based on the analysis in the previous sections it was clear that current parking systems was one of
the significant causes of traffic congestion in Nairobi. It was in this regard that the researcher
recommended the applicability of IoT in alleviating the situation. Due to time and financial
constraints, the researcher demonstrated the application of smart parkig using IoT and not the the
entire IoT infrastructure.
4.4.1 Smartparking Application
4.4.1.1. Problem
The research established that drivers in Nairobi find it difficult in locating available or nearest
parking slots place. This has resulted into increased traffic congestions, increased emissions of
CO2 from the extra fuel consumption, and the inability to park your car at the most convenient
location (possible nearest to the intended station of work).
4.4.1.2. Solution
After analysis of different solutions being used to improve the transportation system of Nairobi,
thte research established a gap caused by available systems working in isolation making it difficult
to share information in real time. The research recommended the use of Internet of Things whereby
the transportation systems (parking slots, cars, county traffic management, highways) will be
connected using sensors to the internet and as a result are able to share crucial data enabling drivers
to make the best decisions.
The smart parking solution (below) will enable drivers reserve the most convenient parking slots
before they get to town hence reduce time taken searching for parking slots. Secondly, drivers will
be able to pay parking fees only for the duration they spend as opposed to the current flat rate of
Kshs. 300. Third, the system will help Nairobi County in law enforcement by making it easy to
establish overdue cars and their location. Also, the system will be able to carry out data analytics
inorder to advise different users on availability of parking slots based on their past preferences.
4.4.1.3. Development Language

39
The central hub was developed on PHP using CodeIgnitor framework while the mobile phone was
developed in Android programming language to target Android mobile phones due to their mass
coverage in the city.
4.4.1.4. Development Methodology
The researcher used the Agile development method, where every module is designed, coded and
tested with the users before proceeding to the next module.
4.4.1.5. Design Structure Diagram
4.4.2 Mobile – Android Interface
Figure 18: Login, user self –registration, user dashboard
User Mobile app
Smartparking hub
Registers,
logins
Reservations, registrations
Figure 17: Design Structure Diagram

40
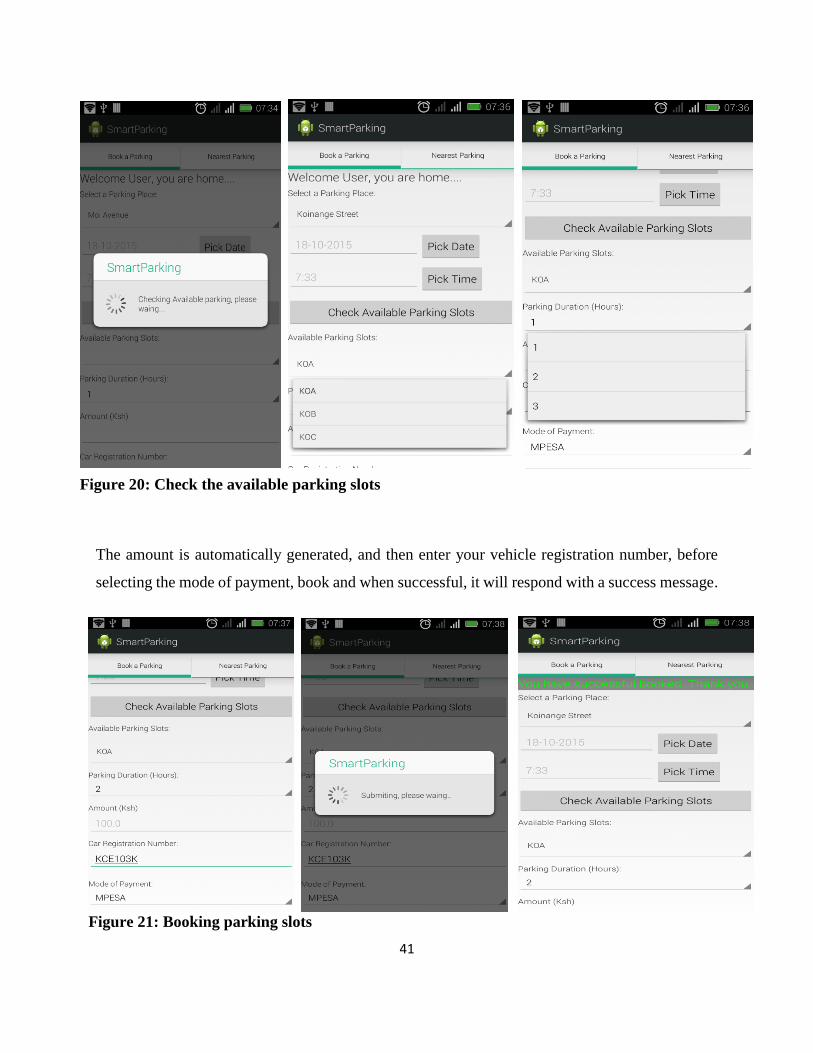
Check the available parking slots within the selected parking place above, System checks and
produces a drop down list of the parking slots. The first two prefix stands for the place and the
numbering of the slots are A, B, C onwards as below, Pick the duration of parking:
Figure 19: Select a parking place, choose the date, choose time
41
The amount is automatically generated, and then enter your vehicle registration number, before
selecting the mode of payment, book and when successful, it will respond with a success message.
Figure 20: Check the available parking slots
Figure 21: Booking parking slots

42
4.4.3 Web Interface
This is used for the administration purposes, for adding, updating, deleting parking places, parking
slots and their various charges.
Login, should you forget your password you will be able to reset it and manage users of the system.
CHAPTER FIVE: CONCLUSIONS & RECOMMENDATIONS
This chapter summarizes the research findings made in the study in form of study conclusion while
also presenting the recommendations made.
5.0 Achievements
Based on the study findings the researcher concludes as follows:
1. Cummulatively, drivers spent an average of 3.6(±0.3) hours stack in traffic jam both in the
evening and in the morning. Although private car drivers were ranked second as the cause
of traffic jam behind matatu drivers, drivers looking for parking lots was consistenty
considered to be the most cause of traffic jam in Nairobi. This was further compounded by
Figure 23: Login
Figure 22: Manage Parking Places, Parking Slots and Check real-time bookings Online

43
the fact that drivers sometimes failed to identify existing parking lots in town with drivers
spending an average of 30 minutes looking for parking lots in the morning thereby
effectively rendering parking identification inconvenient as well as parking payment.
2. Although IoT has not been adopted in solving traffic jams in Nairobi, the reseach designed
an IoT prototype to help in parking management.
3. For the full scale adoption of IoT in parking management, the system required data sensors
(RFID tags) to give location of the cars in the parking lots, WIFI with IPv4 or IPv6 for
receiving and transmitting information regarding the cars parked, cloud computing
technologies to process the information as well as back-end management for the entire
system.
4. The prototype was presented to a sample of road users through which the researcher got
these comments:
a. Integrate Google maps to locate the most convenient parking slot
b. Customize parking search based on points of interest and personal preferences
c. Get push notifications on town parking patterns especially times of major functions
in the city
d. Receive voice guidance all the way to the parking space
e. Track payment and overstay violations using sensors and meter integration
5.1 Challenges
The researcher in exploring ways of leveraging on Internet of Things (IoT) to combating road
traffic in African Cities: a case for Nairobi City, Kenya encountered the following challenges:
1. There was non-existance of sensored car number plates to be used by vehicles, however,
there are plans to launch smart number plates within the country.
2. The researcher could not verify the adoption IoT because of the prohibitive costs associated
with the hardwares required.
5.2 Conclusions and Recommendation
From the study, it was evident that traffic congestion was a major problem that affect major cities
in Africa. Nairobi, the capital of Kenya has experienced traffic congestions as a result of limited
road infrastructure, increase rate of urbanization and rising number of cars in the city. From the

44
analysis in the previous sections it was clear that current parking systems was one of the significant
causes of traffic congestion in Nairobi that contributed to approximately 40% of the city’s traffic
congestions. The research developed a prototype based on Internet of Things to help improve
parking management in Nairobi by gaining real-time data on available parking slots.
Based on the study conclusions the researcher recommends future studies to areas below:
1. Risks of using IoT in smart parking
2. How IoT can be applied to measure effects of traffic congestion e.g. pollution
3. The best model of applying IoT in traffic management
4. Leveraging on IoT to enhance city security/surveillance
45
REFERENCES
Akyildiz, I., & Jornet, J. (2010, December). The Internet of nano-things. Wireless
Communications, IEEE, 17(6), 58 - 63.
Atzori, L., Iera, A., & Morabito, G. (2010, October 28). The internet of things: A survey.
Computer Networks, 54(15), 2787–2805.
Bandyopadhyay, D., & Sen, J. (2011). Internet of Things - Applications and Challenges in
Technology and Standardization. Wireless Personal Communications, 58(1), 49-69.
Cao, Y., Li, W., & Zhang, J. (2011). Real-time traffic information collectingand monitoring
system based on the internet of things. Pervasive Computing and Applications (ICPCA),
2011 6th International Conference on (pp. 45 - 49). IEEE.
Chen, C.-L., & Deng, Y.-Y. (2009, December). Conformation of EPC Class 1 Generation 2
standards RFID system with mutual authentication and privacy protection. Engineering
Applications of Artificial Intelligence, 22(8), 1284–1291.
Eniola, O. J., Njoku, k., Seun, A. E., & Okoko, E. (2013). Traffic Management Problems in
Lagos: A Focus on Alaba International Market Road, Ojo, Lagos State Nigeria. Journal
of Economics and Sustainable Development, 4(4), 144-153.
Evans, D. (2011). The Internet of Things: How the Next Evolution of the Internet Is Changing .
San Jose, CA: Cisco Internet Business Solutions Group (IBSG).
Fernandez-Caballero, A., Gomez, F. J., & Lopez-Lopez, J. (2008). Road-traffic monitoring by
knowledge-driven static and dynamic image analysis. Expert Systems with Applications,
35(2008), 701–719.
Gachanja, J. (2015). Mitigating Road Traffic Congestion in the Nairobi Metropolitan Region.
Naiobi: KIPPRA.
Gachanja, J. N. (2011). Evaluating the impact of road traffic congestion mitigation measures in
Nairobi Metropolitan Region. The Kenya Institute for Public Policy Research and
Analysis (KIPPRA), Infrastructure and Economic Services Division.
Hokao, K., & Mohamed, S. S. (1999). Traffic Impact Mitigation For New Developments: A Way
To Reduce Traffic Congestion In Major Cities.
Hong, J., Kwon, S., & Kim, J.-Y. (1999). WebTrafMon: Web-based Internet/Intranet network
traffic monitoring and analysis system. Computer Communication, 22(1999), 1333–1342.
IBM. (2011). Frustration Rising: IBM 2011 Global Commuter Pain Survey. IBM.
IBM. (2011, September 28). IBM Global Parking Survey: Drivers Share Worldwide Parking
Woes. Retrieved October 28, 2015, from IBM: https://www-
03.ibm.com/press/us/en/pressrelease/35515.wss

46
JICA. (2008). Dar es Salaam Policy and System Development Master Plan. Development Study
(M/P), Dar es Salaam.
Kebari, O. J. (2015, September 24). The Phenomenal Traffic of Nairobi. Retrieved October 28,
2015, from Opinion Hub: http://www.opinionhub.co.ke/tag/nairobi-traffic-jams/
Khan, R., Khan, S. U., Zaheer, R., & Khan, S. (2012). Future Internet: The Internet of Things
Architecture,Possible Applications and Key Challenges. Frontiers of Information
Technology (FIT), 2012 10th International Conference on (pp. 257 - 260). IEEE.
Khoo, B. (2011). RFID as an Enabler of the Internet of Things: Issues of Security and Privacy in
Internet of Things. Internet of Things (iThings/CPSCom), 2011 International Conference
on and 4th International Conference on Cyber, Physical and Social Computing (pp. 709-
712). IEEE.
Kinyanjui, K. E., & Kahonge, A. M. (2013, January). Mobile Phone –Based Parking System.
International Journal of Information Technology, Control and Automation (IJITCA),
3(1), 23-37.
Kiunsi, R. B. (2013, January 28). A Review of Traffic Congestion in Dar es Salaam City from
the Physical Planning Perspective. Journal of Sustainable Development, 6(2), 94-103.
Knoflacher, H. (2006, October). A new way to organize parking: The key to a successful
sustainable transport system for the future. Environment and Urbanisation journal, 18(2),
387-400.
Krejcie, R. V., & Morgan, D. W. (1970). Determining Sample Size for Research Activiities.
Educational And Psychological Measurement, 30(38), 607-610.
Lee, S., Yoon, D., & Ghosh, A. (2008). ntelligent parking lot application using wireless sensor
networks. Collaborative Technologies and Systems, 2008. CTS 2008. International
Symposium on (pp. 48 - 57). IEEE.
Li, L. (2012). Study of Security Architecture in the Internet ofThings. Measurement, Information
and Control (MIC), 2012 International Conference on. 1, pp. 374 - 377. IEEE.
Lubecke, V., & Chiao, J.-C. (1999). MEMS technologiesfor enabling high frequency
communications circuits. Telecommunications in Modern Satellite, Cable and
Broadcasting Services, 1999. 4th International Conference on. IEEE.
Mbuvi, D. (2012, May 14). IBM Smarter Cities recommendations for Nairobi promise smoother
traffic in 90 days. CIO East Africa.
McGregor, S., & Doya, D. M. (2014, March 26). Traffic Costs Nairobi $570,000 a Day as No. 2
Africa Hub. (J. Hertling, & P. Richardson, Eds.) Bloomberg Business.

47
Ministry of Economic Planning & Budget. (2013). The Socio-economic Costs of Traffic
Congestion in Lagos. Ministry of Economic Planning & Budget, Economic Intelligence
Unit. Lagos: Lagos State Ministry of Economic Planning and Budget (MEPB).
Mudzengerere, F. H., & Madiro, V. (2013). Sustainable Urban Traffic Management in Third
World Cities: The Case of Bulawayo City in Zimbabwe. Journal of Sustainable
Development in Africa, 15(2), 186-200.
Muema, J. K., Kyambo, B., Kyambo, B., Kirichu, C., & Senagi, K. (2014). Assessment of the
Adoption of Mobile Parking Management System in the Parking Industry in Nairobi
County: A Case of Lulu East Africa. International Journal of Computer Applications
Technology and Research, 3(10), 617 - 625.
Mugenda, A. G. (2008). Social science research conception. Nairobi: Applied Research and
Training Services.
Nairobi City County. (2014). Transport and Urban Decongestion Committee report. Interim
Report, Nairobi County Transport and Urban Decongestion Committee, Nairobi.
Nakat, Z., Herrera, S., & Cherkaoui, Y. (2014). Cairo Traffic Congestion Study. Washington Dc:
The World Bank Group.
Ndung'u, B. (2013). An Investigation into the Traffic Flow Problems on Jogoo Road, Nairobi.
Thesis, University of Nairobi, Department of Urban and Regiional Planning.
Ogut, C. A. (2015). Cashless Priced Parking in Nairobi: Conclave of Champion Cities of Asia &
Africa Clean Air & Sustainable Mobility. Roads, Public Works & Transport. Nairobi:
Nairobi City County.
Rao, B., Saluia, P., Sharma, N., Mittal, A., & Sharma, S. (2012). Cloud computing for Internet of
Things & sensing based applications. Sensing Technology (ICST), 2012 Sixth
International Conference on (pp. 374 - 380). IEEE.
Shen, G., & Liu, B. (2011). The visions, technologies,applications and security issues of Internet
of Things. E -Business and E -Government (ICEE), 2011 International Conference on
(pp. 1-4). IEEE.
Suo, H., Wan, J., Zou, C., & Liu, J. (2012). Security in the Internet of Things: A Review.
Computer Science and Electronics Engineering (ICCSEE), 2012 International
Conference on. 3, pp. 648 - 651. IEEE .
Tai, J.-C., Tseng, S.-T., Lin, C.-P., & Song, K.-T. (2004, June 1). Real-time image tracking for
automatic traffic monitoring and enforcement applications. Image and Vision Computing,
22(6), 485–501.
Wu, M., Lu, T.-J., Ling, F.-Y., Sun, J., & Du, H.-Y. (2010). Research on the architecture of
Internet of Things. Advanced Computer Theory and Engineering (ICACTE), 2010 3rd
International Conference on. 5, pp. V5-484 - V5-487. IEEE.

48
Xiao, L., & Wang, Z. (2011, June). Internet of Things: a New Application for Intelligent Traffic
Monitoring System. Journal of Networks, 6(6), 887-894.
Xiaohui, X. (2013). Study on Security Problems and Key Technologies of The Internet of
Things. Computational and Information Sciences (ICCIS), 2013 Fifth International
Conference on (pp. 407 - 410 ). IEEE.
Zanella, A., & Vangelista, L. (2013). Internet of Things for Smart Cities. EEE Internet of Things
Journal, 2327-4662.
Zhang, M., Sun, F., & Cheng, X. (2012). Architecture of Internet of Things and its Key
Technology Integration based-on RFID. Computational Intelligence and Design (ISCID),
2012 Fifth International Symposium on (Volume:1 ). 1, pp. 294 - 297. IEEE.
Zhang, Y. (2011). Technology framework of the Internet of Things and its application. Electrical
and Control Engineering (ICECE), 2011 International Conference on (pp. 4109 - 4112).
IEEE.
Zhu, Z., Yang, B., Xu, G., & Shi, D. (1996). VISATRAM: a real-time vision system for
automatic traffic monitoring. Applications of Computer Vision, 1996. WACV '96.,
Proceedings 3rd IEEE Workshop on (pp. 162 - 167 ). IEEE.

49
APPENDICES
Appendix 1: Consent Form
APPENDIX I: INFORMED CONSENT FORM
I am Lucas, a Masters of Science in Information Technology Management of the University of Nairobi. I
am conducting a research on Leveraging Internet of Things (IoT) in combating road traffic in African Cities:
a case for Nairobi City, Kenya. You have been randomly selected to assist in this research by responding to
the questionnaire intended for this research. Note that you are not supposed to indicate your name anywhere
and the information you provide will be treated with utmost confidentiality and will be used for the purpose
of this research only.
It is anticipated that the research will take one hour of your time and the research questions includes those
related causes of traffic jam, parking identification and parking payment. The questionnaire is divided into
four sections which address the above factors and socio demographic characteristics.
Note that it is expected of you to complete all the questions to enhance validity and reliability of the findings
however you may skip any questions you are not comfortable with. It is your right to stop your participation
in the research at any time. There are no risks associated with participation and no financial benefits.
Findings from the study will help in designing and testing a parking system with the aim of reducing time
spent looking for parking and therefore reduce traffic jams in Nairobi.
Respondent Agreement
The research has been explained to me and I voluntarily consent to participate. I have had an opportunity
for my questions to be answered.
_____________________________ ___________________
Interviewer signature Date

50
Appendix 2: Private Car Drivers Questionnaire
Section A: Socio-demographic characteristics
Questionnaire Number:…………………… Signature of Respondent: ……………………….
Street: Uhuru Highway { } Mombasa Road { } University Avenue { } Haile Selassie { }
City Hall Way { } Kenyatta Avenue { } Tom Mboya Street { } Moi Avenue { }
1. Age in complete years…………….
2. Gender
a. Male [ ]
b. Female [ ]
3. Education level
a. University/College [ ]
b. Secondary [ ]
c. Primary [ ]
d. None [ ]
4. How many years have you been driving frequently to Nairobi CBD? …..
5. How many days in a week do you drive and park in town on average? ………
Section B: Identification of Parking
6. How do you normally identify parking lots in town?
a. Parking attendants [ ]
b. Parking boys [ ]
c. Booking in-advance [ ]
d. Driving around [ ]
7. At what time do you normal drive to town? ……..
8. At this time how often do you immediately get parking slots while at your place of
choice?
a. Always [ ]
b. Sometimes [ ]
c. Rarely [ ]
d. Never [ ]
9. How long on average do you normally spend looking for a parking spot? (in minutes)
……..

51
10. How much do you normally walk from the parking spot to your work place? (in minutes)
…………
11. Do you find your current system of parking identification convenient?
a. Yes [ ]
b. No [ ]
12. If no, why do you say so?
……………………………………………………………………………………………....
................................................................................................................................................
13. At what time of the day do you find it easy to find easy to locate a parking spot during the
week day?
a. Morning [ ]
b. Mid-day [ ]
c. Evening [ ]
d. Night [ ]
Section c: Payment of parking
14. Where do you normally park your car?
a. On-street parking [ ]
b. Off-street parking [ ]
c. Private parking [ ]
d. Other (Specify) ……………………………………………………………………
15. On average how long do you park your car? ...........................................
16. How much do you pay for the parking in a day? KShs............................
17. How long do you take to locate a parking attendant (County Parking attendants)?
................................
18. Do you find the current parking payment system convenient?
a. Yes [ ]
b. No [ ]
19. If no, why do you say so?
………………………………………………………………………………………………
………………………………………………………………………………………………
20. Would you recommend parking charges to be based on amount of time spent on the
parking lot?
a. Yes [ ]
b. No [ ]

52
Section D: Causes of Traffic
21. Typically in a week day how long do you spend stuck in a traffic jam in the:
a. Morning …………….
b. Evening ……………..
22. In an order of ranking from 1 (most) to 4(least), who according to you are the main
causers of traffic snarl ups in town?
a. Private car drivers [ ]
b. Matatu drivers [ ]
c. Traffic police [ ]
d. County council askaris/parking atttendants. [ ]
23. In a ranked order from 1 (most) to 5(least) rank the following causes of traffic jams in
town?
a. Drivers looking for parking spots [ ]
b. Disregard to traffic rules and traffic lighting [ ]
c. Insufficient parking spots [ ]
d. On-street parking [ ]
e. Untimely parking attendance [ ]

53
Appendix 3: County Parking Attendants Questionnaire
Section A: Socio-demographic characteristics
Questionnaire Number:…………………… Signature of Respondent: ……………………….
Street: Uhuru Highway { } Mombasa Road { } University Avenue { } Haile Selassie { }
City Hall Way { } Kenyatta Avenue { } Tom Mboya Street { } Moi Avenue { }
1. Age in complete years…………….
2. Gender
a. Male [ ]
b. Female [ ]
3. Education level
a. University/College [ ]
b. Secondary [ ]
c. Primary [ ]
d. None [ ]
4. How many years have you been a parking attendant in Nairobi? …………..
5. How many parking slots are you in charge of?..........................
6. On average in a day how many cars are parked in these parking lots in a week day?
…………………..
Section B: Identification of Parking
7. How frequent do drivers encounter challenges of identifying a parking spot within your
jurisdiction?
a. Always [ ]
b. Sometimes [ ]
c. Rarely [ ]
d. Never [ ]
8. On average how frequent do you think parking slots are available but drivers fail to
identify them?
a. Always [ ]
b. Sometimes [ ]
c. Rarely [ ]
d. Never [ ]
9. How do you know the number of parking slots available at any given time?
a. Physical inspection [ ]
b. Counting number of receipts [ ]
c. Other (specify)………………

54
10. Do you think the above system is convenient to you?
a. Yes [ ]
b. No [ ]
11. If no, why say so?
................................................................................................................................................
................................................................................................................................................
Section c: Payment of parking
12. How do you charge cars parked within your jurisdiction?
a. Fixed rate [ ]
b. Timed parking [ ]
c. Other (specify) …………………………………………………………..
13. During the last one week, how many cars have defaulted on paying parking within your
area of jurisdiction?................................................
14. Do you think the current system of paying for parking is convenient to you?
a. Yes [ ]
b. No [ ]
15. If no, why do you say so?
................................................................................................................................................
...............................................................................................................................................
Section D: Causes of Traffic
16. In an order of ranking from 1 (most) to 4(least), who according to you are the main
causers of traffic snarl ups in town?
a. Private car drivers [ ]
b. Matatu drivers [ ]
c. Traffic police [ ]
d. County council askaris/parking attendants. [ ]
17. In a ranked order from 1 (most) to 5(least) rank the following causes of traffic jams in
town?
a. Drivers looking for parking spots [ ]
b. Disregard to traffic rules and traffic lighting[ ]
c. Insufficient parking spots [ ]
d. On-street parking [ ]
e. Untimely parking attendance [ ]