Embed Size (px)
Citation preview

University of Minnesota Duluth
Department of Civil Engineering Writing Guide
Last updated on January 25, 2015
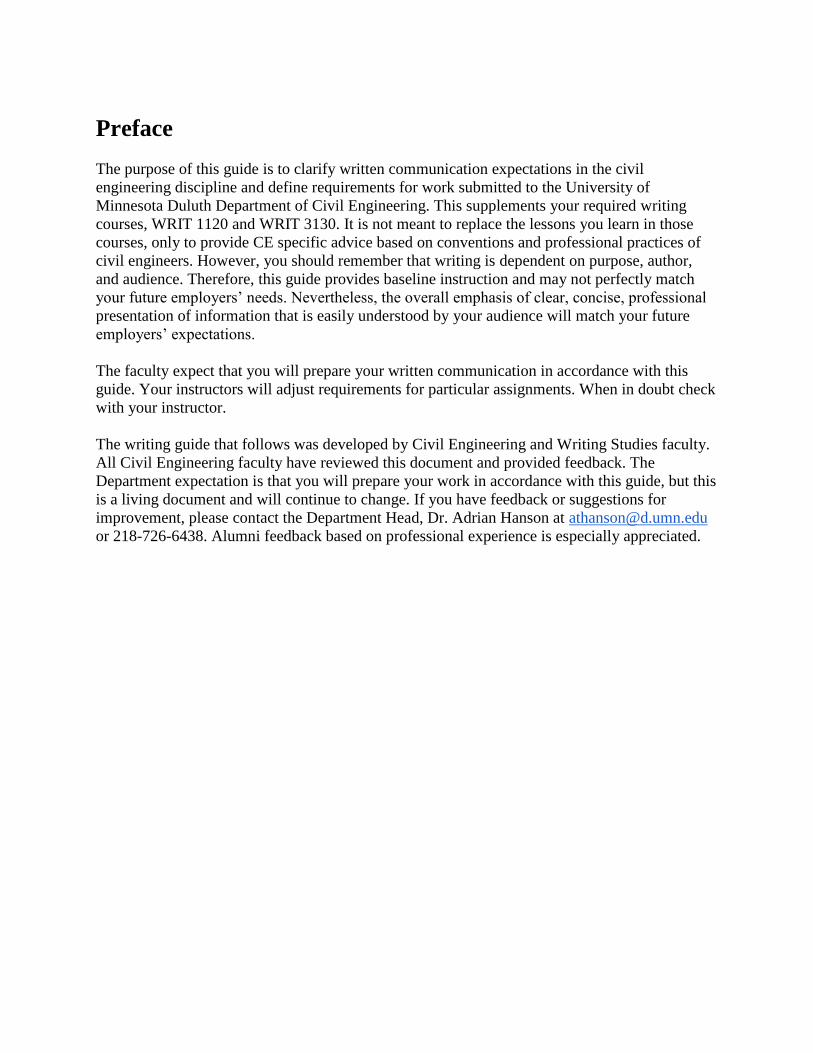
Preface
The purpose of this guide is to clarify written communication expectations in the civil
engineering discipline and define requirements for work submitted to the University of
Minnesota Duluth Department of Civil Engineering. This supplements your required writing
courses, WRIT 1120 and WRIT 3130. It is not meant to replace the lessons you learn in those
courses, only to provide CE specific advice based on conventions and professional practices of
civil engineers. However, you should remember that writing is dependent on purpose, author,
and audience. Therefore, this guide provides baseline instruction and may not perfectly match
your future employers’ needs. Nevertheless, the overall emphasis of clear, concise, professional
presentation of information that is easily understood by your audience will match your future
employers’ expectations.
The faculty expect that you will prepare your written communication in accordance with this
guide. Your instructors will adjust requirements for particular assignments. When in doubt check
with your instructor.
The writing guide that follows was developed by Civil Engineering and Writing Studies faculty.
All Civil Engineering faculty have reviewed this document and provided feedback. The
Department expectation is that you will prepare your work in accordance with this guide, but this
is a living document and will continue to change. If you have feedback or suggestions for
improvement, please contact the Department Head, Dr. Adrian Hanson at [email protected]
or 218-726-6438. Alumni feedback based on professional experience is especially appreciated.
Table of Contents
Contents
Reports
Elements of Reports in Civil Engineering
Figures
Tables
Equations
References and Citations
Sample Memo
Professional Emails
Homework
General Rubric
Reports
The purpose of a civil engineering report is generally to inform your audience, although some
reports may describe or argue. This may include presenting design results, proposing a solution
to a problem, or presenting research results.
Print your work on a high quality printer. Format your writing in 11- or 12-point Times New
Roman font (this paragraph is written in 12-point Times New Roman). Single-space within
paragraphs and double-space between paragraphs. Margins should be 1-inch on all sides.
Number each page except the first and staple or clip multiple pages. Label each section with the
appropriate heading. Reports may have a title page, a title at the top of the first page, or other
formats for presenting the title. See your instructor for details about particular assignments.
Of course, you should be sure that your writing is grammatically correct, that each paragraph has
a topic sentence at the beginning, and that the writing meets readability criteria (topics are in
subject position, paragraphs include more than one sentence, do not start sentences with numbers
or acronyms, etc.). College Writing and Advanced Writing provide more guidance on these
topics.
Elements of Report in Civil Engineering
(Italics mean the element could be optional)
Executive Summary/Abstract/…
This section provides a condensed overview of the motivation for the report, problem which
gave rise to the work, technical objectives of the project, the methodology/procedures, the results
or findings, and the conclusions and recommendations. These terms will be defined in the
following sections. This may be a single paragraph or several pages depending on the nature of
the report. If you have questions, see your instructor for more details.
There is an important distinction between the executive summary and the sections that follow in
the report. The executive summary contains sufficient information such that an informed reader
can read it and generally understand conclusions of the report. It contains enough information
that a less well-informed reader can get the general sense of the report contents, then easily find
specific information in the sections that follow. The rest of the report includes the motivation,
problem, work/technical objectives, but with more detail than the executive summary, such that
less well-informed readers can get more information than was included here.
Introduction
The purpose of the introduction is to orient the audience to the project and prepare the reader to
understand the rest of the report. It includes the following components:
· Motivation, but with more detail than the summary. The motivation is why you conducted the
work
· Problem or need which gave rise to the work, but with more detail than the summary. The
problem is the specific problem or question your report seeks to answer.
· Technical objectives of the work, but with more detail than the summary. The technical
objective of the research/test/design is the technical measures that need to be determined in order
to answer the client’s question.
· Document purpose statement [i.e. “The purpose of this document is to present the methods,
findings, conclusions and recommendations.”]
· Contents statement. [i.e., a description of what will follow]
Background/Literature Review/…
The purpose of this section is to familiarize your audience with context necessary to understand
the reason you chose your methodology. Use tabular or graphical summaries whenever possible.
See the sections in this guide on figures, tables, and equations for more detail. This section is
often omitted in laboratory reports.
This section may include subsections, depending on the length of the report and the depth of
discussion. You may include:
· A summary of previous research leading to your work
· A description of permits and/or regulations
· An explanation of constraints affecting the project
Methods
This section presents a description of testing material and methodology. The methodology or
procedures are the specific tasks done to achieve the technical objectives.
An example of description of testing material for soils is a description of the sample as in a field
or visual examination using geologic or common names, if known. This component of the
methods section may not apply to design or research reports.
The methodology must be valid and specifically explained so that it can be replicated. For
experimental work, ASTM standard numbers and titles (explained in more detail during CE 3xxx
level classes) or a brief synopsis are usually adequate for standard civil engineering testing.
Detailed experimental procedures can be included as an attachment. For reports describing non-
experimental work, a description of your design or research process is appropriate. Use figures,
tables, and equations as appropriate.
Data Results and Analysis
The purpose of this section is to present specific data generated by the methodology and an
analysis or interpretation of the data. This material is typically summarized in the report proper
with details of experimental results or example calculations from a design process presented in
an appendix. Use tabular or graphical summaries whenever possible. See the sections in this
guide on figures, tables, and equations for more detail.
You should explain the meaning of the results in regard to the technical objectives. The results
are the findings that determine the technical measures. This section may include subsections,
depending on the length of the report and the depth of discussion. You should include:
· A discussion of the relation of the results to the technical objectives
· Important correlations (if any)
· Errors, if they significantly affect conclusions
· Your conclusion and the reasons for your conclusion. The conclusions are the answers to
problem; they may be indeterminate if the results are not conclusive. If the error is significant,
there cannot be an answer to the client’s problem based on these results.
· Your recommendations and reasons for your recommendations. The recommendations are
additional points the audience should have to achieve to solve the problem.
Conclusions and Recommendations
Provide statements of what you have found out in regard to both technical objectives and the
problem which gave rise to the work. They present your best professional judgment of the
reliability and limits of your conclusions and recommendations. There should be no new content
in this section. This section is a restatement of what has already appeared in the report.
Recommendations may answer the problem, endorse some action, or make some statement
related to the process that is not addressed in the original work requested. There should be no
new content in this section. This section is a restatement of what has already appeared in the
report.
References
The reference page should include articles, text books, ASTM standards, lab manuals, or any
other reference used to complete the work. Follow the format shown in the reference section of
this manual.
Appendices
If you have appendices, you must refer to each of them in the course of the report proper.
Begin with a separate page, listing each section and the figures or tables appearing in each
section. The sections of the appendices should be arranged in the order they were referenced in
the report. An index should be included in the appendix cover page. The first page of each
section should begin with a label for that section.
Material of a highly detailed nature should be attached in an appendix. Depending on the project,
the documentation could include:
· Raw data
· Sample calculations
· Unusually detailed graphs (Standard graphs that summarize the results go in the main body of

the report.)
· Detailed test descriptions and any major modifications to the standard test procedures.
Figures
The purpose of figures is to present a great deal of information in an easily accessible way.
Figures are usually a more efficient means of conveying technical information than describing
the same information in words.
When using a figure, be sure to reference the table in the text prior to the inclusion of the table.
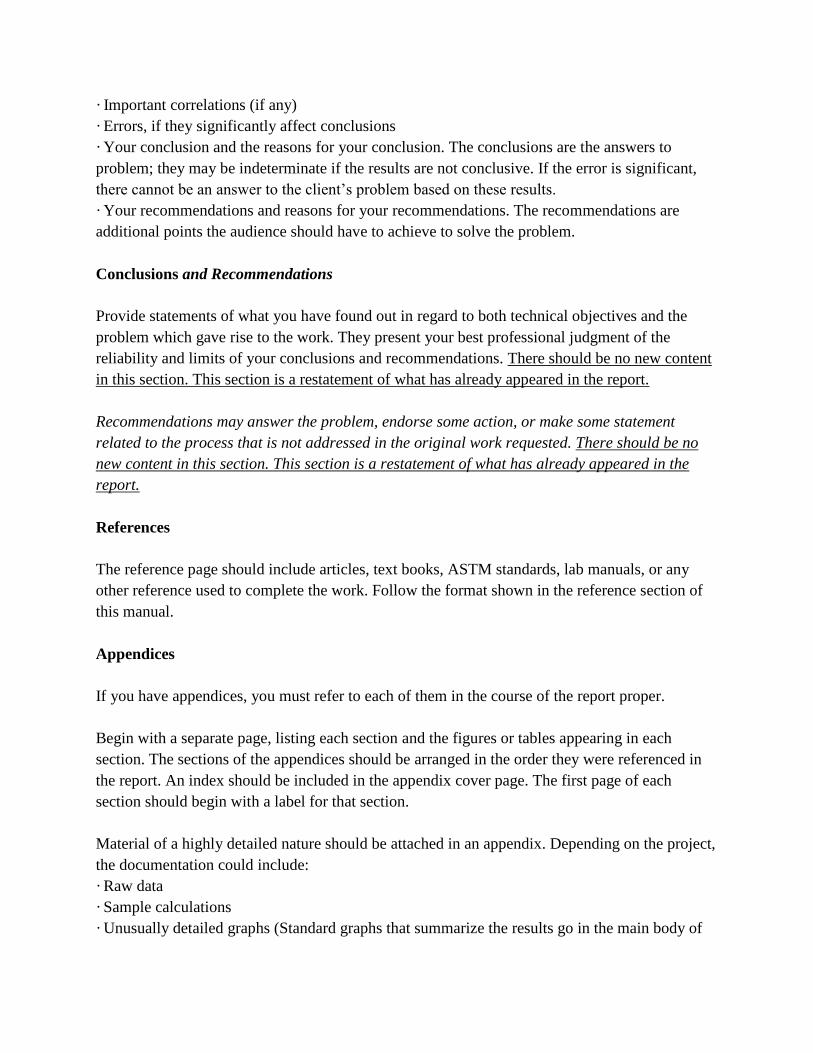
Refer to the figure by the number assigned to it. For example, Figure 1 shows an example of how
graphs should be presented. It is important to explain the relevance of the figure in the text and
also to give the reader context. Key points on graphs include:
· Measured data should appear as a point. Relationships from theory or trends appear as solid
lines without visible data points.
· If data points plot near one another, plotting the points as hollow shapes allows the audience to
distinguish one point from another, while filled points hide other data.
· Color is a good way to distinguish between different data sets on one plot, but remember that
your documents may be printed in black-and-white. When possible, ensure that your audience
can understand your plot without color.
· Lines between data points imply knowledge of behavior between measured points. Ensure that
this is case before choosing to connect data points.
· Grid lines can be distracting. Ensure that grid lines are necessary before including them in your
plots.
· At times, labels may help the audience interpret the data. For example, highlighting a measured
point or point on a trend may draw your audience’s attention to the main point of the figure.
When including labels, ensure that they are legible, neat, and professional in appearance. Do not
clutter the figure with labels.
· Without labeled axes, figures do not help the audience understand your data. The American
Society of Civil Engineers (ASCE) convention for labeling axes is: Property, symbol (units).
Some of your textbooks label axes with only a symbol and units. Depending on your audience,
this may be appropriate; however, for work in this department, follow ASCE convention.
· Ensure an appropriate number of significant figures. Too many significant figures implies a
level of detail your data may not support.
· The font type in your axis label should match the font in the rest of your report and should be
large enough to guarantee ease of reading.
· Axes stand out and present a cleaner figure if the axes are black, some software packages (i.e.
Excel) default to a gray axis. If necessary, change the axis color to black.
· ASCE convention is for tick marks to appear on the inside of the axis. It is acceptable, but not
required, for major unit tick marks to cross the axis. Avoid using outside tick marks.
· You should only include legends when necessary. For example, the example data in this section
should not include a legend as it contains only one stress-strain relationship. If you need to
present results from several types of clay, a legend would be appropriate.
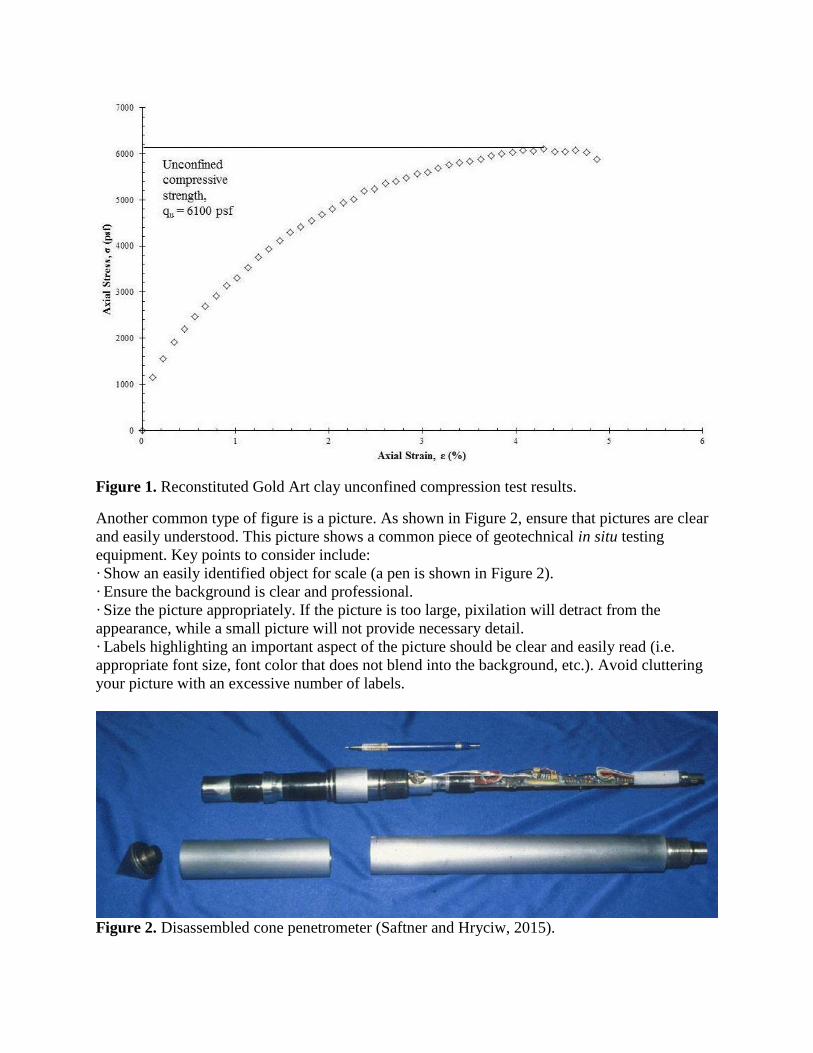
Figure 1. Reconstituted Gold Art clay unconfined compression test results.
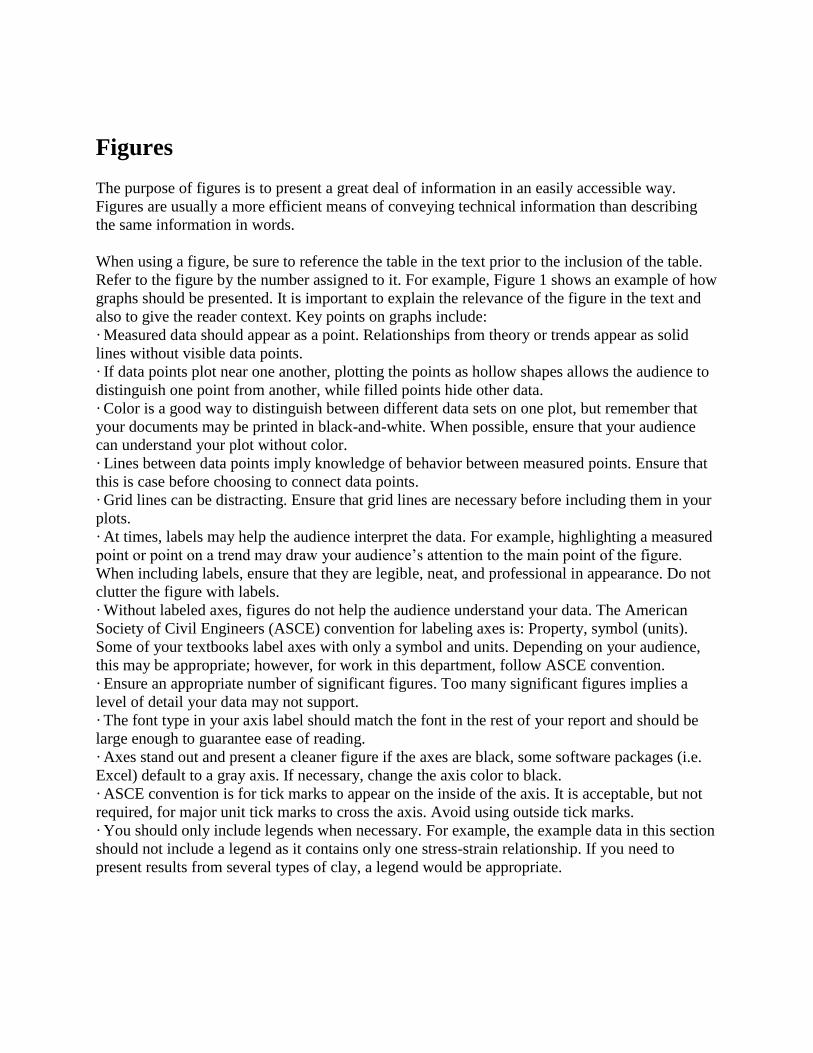
Another common type of figure is a picture. As shown in Figure 2, ensure that pictures are clear
and easily understood. This picture shows a common piece of geotechnical in situ testing
equipment. Key points to consider include:
· Show an easily identified object for scale (a pen is shown in Figure 2).
· Ensure the background is clear and professional.
· Size the picture appropriately. If the picture is too large, pixilation will detract from the
appearance, while a small picture will not provide necessary detail.
· Labels highlighting an important aspect of the picture should be clear and easily read (i.e.
appropriate font size, font color that does not blend into the background, etc.). Avoid cluttering
your picture with an excessive number of labels.
Figure 2. Disassembled cone penetrometer (Saftner and Hryciw, 2015).
You may need to present engineering drawings, including diagrams of equipment or drawings
produced in a CAD program. Figure 3 shows an example of an equipment diagram from an
ASTM standard. Important points to highlight in this figure include:
· Size the drawing so all parts of the drawing are easily understood.
· Ensure that the font size in all labels is legible.
Figure 3. Limits on load rod alignment for the cyclic triaxial test (ASTM D 5311-92, 2004).
Other Considerations
You should explain and reference all figures before the figure appears in your document. You
should not assume that the audience will understand the figure before you explain it. Refer to the
figures presented in this document and notice that each was introduced and explained prior to its
appearance in the document.
Figures should not contain titles. A caption should follow your figure. If a figure contains
content that is not your work, you need to sort the original source, as shown in Figures 2 and 3. It
may be appropriate to cite the work in the legend or the caption. Refer to the section of this
writing guide describing references for more details.

Tables
The purpose of putting a table in a document is to improve the reader’s understanding of the
information presented. Tables offer a quick and easy way to present information that could
otherwise be lost in the text. However, it is important to give adequate consideration to the
necessity of the table. If it is not simplifying the relay of information, then it is not necessary.
When using a table, be sure to reference the specific table in the text prior to the inclusion of the
table. Note that tables and figures are numbered separately (Table 1, Table 2, Table 3, etc.).
Refer to the table by the number assigned to it. For example, Table 1 shows the annual snowfall
for three Minnesota cities from the winters of 2010-11 through 2013-14. It can be seen from
Table 1 that Two Harbors gets on average more than ten inches of snow than either Duluth or
Cloquet. It is important to explain the relevance of the table in the text.
Table 1. Annual snowfall in Duluth, Two Harbors and Cloquet, MN from 2010-2014 (Harrison,
2004).
Snowfall [in]
City 2010-11 2011-12 2012-13 2013-14 Average
Duluth 85 73 95 101 88.5
Two Harbors 94 82 114 121 102.8
Cloquet 79 69 101 99 87
It is also very important to include any necessary references for the data in your table. These can
be included in the caption, as shown in Table 1. Each table should have its own caption that
includes both the table number and a brief caption explaining the contents of the table. The
caption should be written such that the table could stand alone, without the rest of the text and
still make sense. Captions for tables typically go above the table.
Formatting of the tables is up to the author; however, consistency and organization are needed.
Consistency means that all of the tables in a document should be arranged in a similar manner,
with similar headings, titles, captions, font, font size, bold, italic, underlined text, double lines or
darker lines, etc. The tables should be numbered and labeled consistently as well and in order of
their appearance. Each column should have a heading that includes units.
Equations
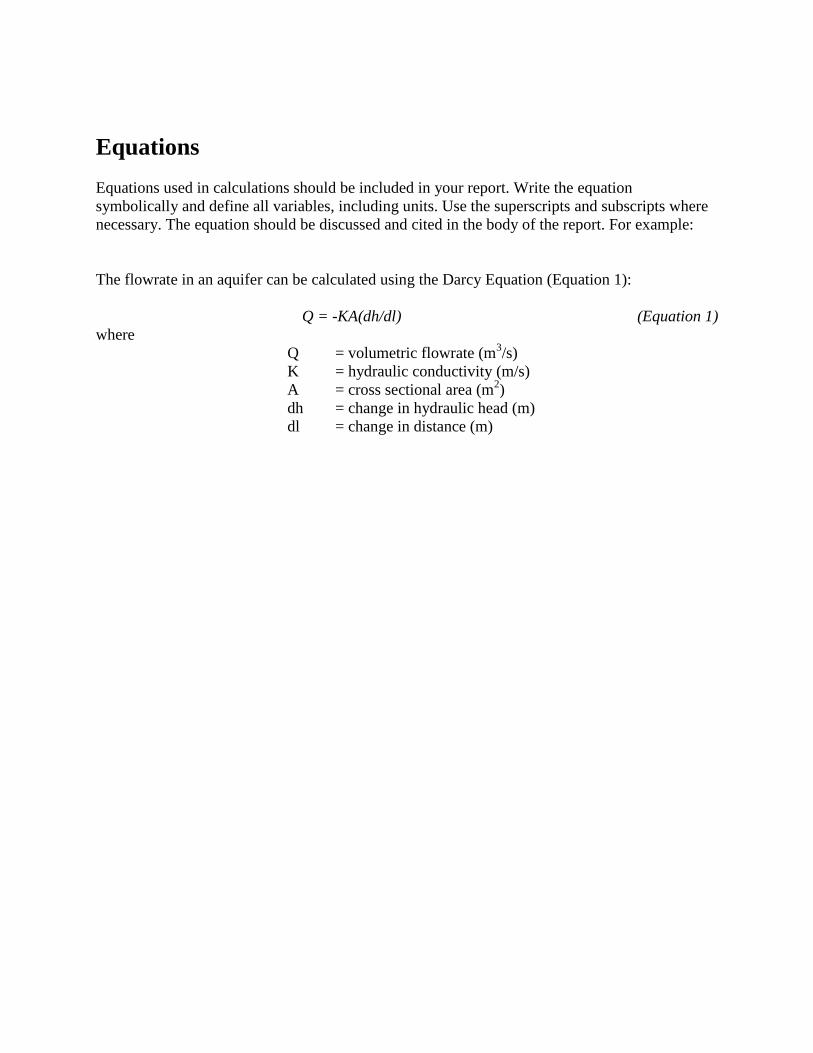
Equations used in calculations should be included in your report. Write the equation
symbolically and define all variables, including units. Use the superscripts and subscripts where
necessary. The equation should be discussed and cited in the body of the report. For example:
The flowrate in an aquifer can be calculated using the Darcy Equation (Equation 1):
Q = -KA(dh/dl) (Equation 1)
where
Q = volumetric flowrate (m3/s)
K = hydraulic conductivity (m/s)
A = cross sectional area (m2)
dh = change in hydraulic head (m)
dl = change in distance (m)
References and Citations
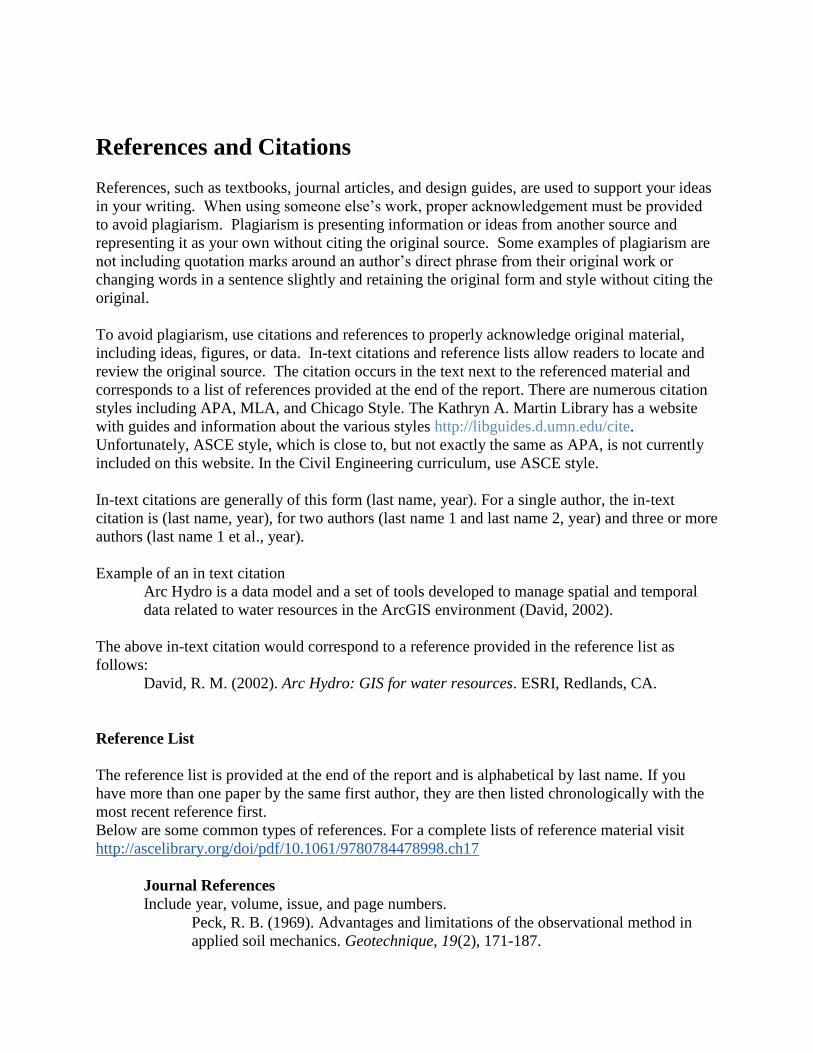
References, such as textbooks, journal articles, and design guides, are used to support your ideas
in your writing. When using someone else’s work, proper acknowledgement must be provided
to avoid plagiarism. Plagiarism is presenting information or ideas from another source and
representing it as your own without citing the original source. Some examples of plagiarism are
not including quotation marks around an author’s direct phrase from their original work or
changing words in a sentence slightly and retaining the original form and style without citing the
original.
To avoid plagiarism, use citations and references to properly acknowledge original material,
including ideas, figures, or data. In-text citations and reference lists allow readers to locate and
review the original source. The citation occurs in the text next to the referenced material and
corresponds to a list of references provided at the end of the report. There are numerous citation
styles including APA, MLA, and Chicago Style. The Kathryn A. Martin Library has a website
with guides and information about the various styles http://libguides.d.umn.edu/cite.
Unfortunately, ASCE style, which is close to, but not exactly the same as APA, is not currently
included on this website. In the Civil Engineering curriculum, use ASCE style.
In-text citations are generally of this form (last name, year). For a single author, the in-text
citation is (last name, year), for two authors (last name 1 and last name 2, year) and three or more
authors (last name 1 et al., year).
Example of an in text citation
Arc Hydro is a data model and a set of tools developed to manage spatial and temporal
data related to water resources in the ArcGIS environment (David, 2002).
The above in-text citation would correspond to a reference provided in the reference list as
follows:
David, R. M. (2002). Arc Hydro: GIS for water resources. ESRI, Redlands, CA.
Reference List
The reference list is provided at the end of the report and is alphabetical by last name. If you
have more than one paper by the same first author, they are then listed chronologically with the
most recent reference first.
Below are some common types of references. For a complete lists of reference material visit
http://ascelibrary.org/doi/pdf/10.1061/9780784478998.ch17
Journal References
Include year, volume, issue, and page numbers.
Peck, R. B. (1969). Advantages and limitations of the observational method in
applied soil mechanics. Geotechnique, 19(2), 171-187.
Books
Include author, book title, publisher, the publisher’s location, and chapter title and
inclusive page numbers if only a section of the book is used.
Hibbeler, R. C., and Tan, K. H. (2009). Structural analysis. Prentice Hall, Upper
Saddle River, NJ.
Web Pages
Include author, year of publication or last revision, title of “page,” title of the complete
work, Web address enclosed within angle brackets, and date material downloaded.
American Society of Civil Engineers (2014). “Author-Date References.”
<http://www.asce.org/Audience/Authors,--Editors/Books/General-Book-
Information/Author-Date-References/> (Sept. 15, 2014).
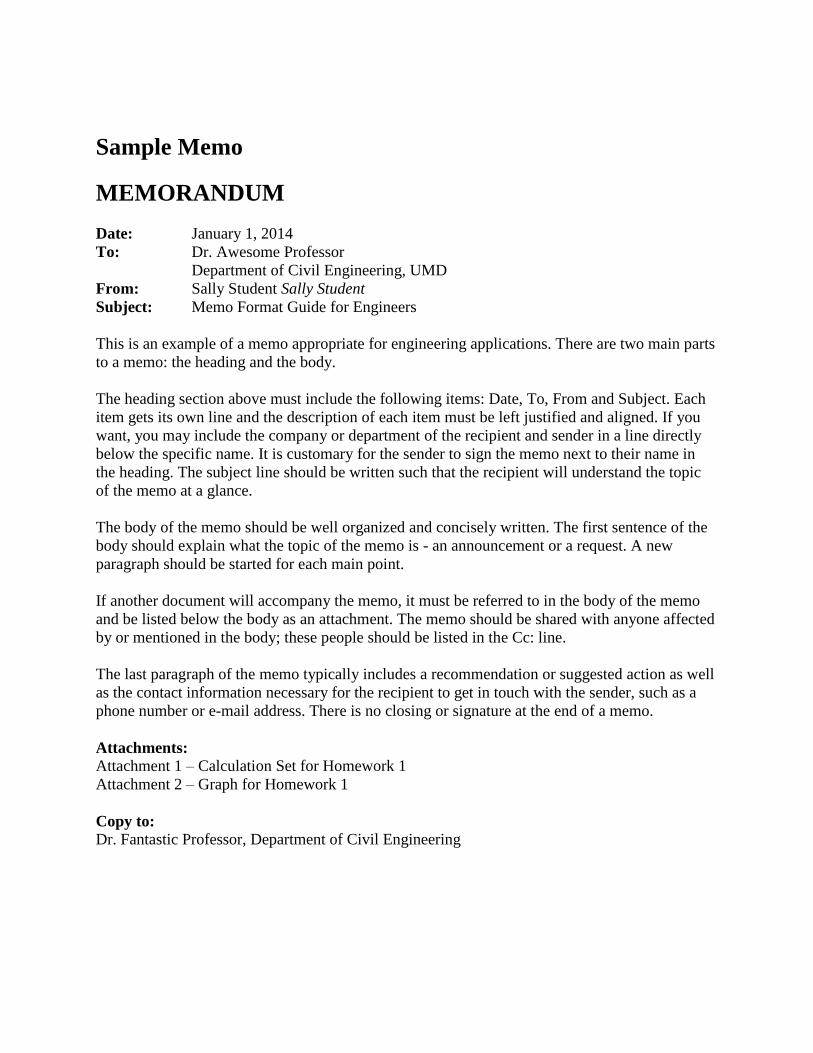
Sample Memo
MEMORANDUM
Date: January 1, 2014
To: Dr. Awesome Professor
Department of Civil Engineering, UMD
From: Sally Student Sally Student
Subject: Memo Format Guide for Engineers
This is an example of a memo appropriate for engineering applications. There are two main parts
to a memo: the heading and the body.
The heading section above must include the following items: Date, To, From and Subject. Each
item gets its own line and the description of each item must be left justified and aligned. If you
want, you may include the company or department of the recipient and sender in a line directly
below the specific name. It is customary for the sender to sign the memo next to their name in
the heading. The subject line should be written such that the recipient will understand the topic
of the memo at a glance.
The body of the memo should be well organized and concisely written. The first sentence of the
body should explain what the topic of the memo is - an announcement or a request. A new
paragraph should be started for each main point.
If another document will accompany the memo, it must be referred to in the body of the memo
and be listed below the body as an attachment. The memo should be shared with anyone affected
by or mentioned in the body; these people should be listed in the Cc: line.
The last paragraph of the memo typically includes a recommendation or suggested action as well
as the contact information necessary for the recipient to get in touch with the sender, such as a
phone number or e-mail address. There is no closing or signature at the end of a memo.
Attachments: Attachment 1 – Calculation Set for Homework 1
Attachment 2 – Graph for Homework 1
Copy to: Dr. Fantastic Professor, Department of Civil Engineering
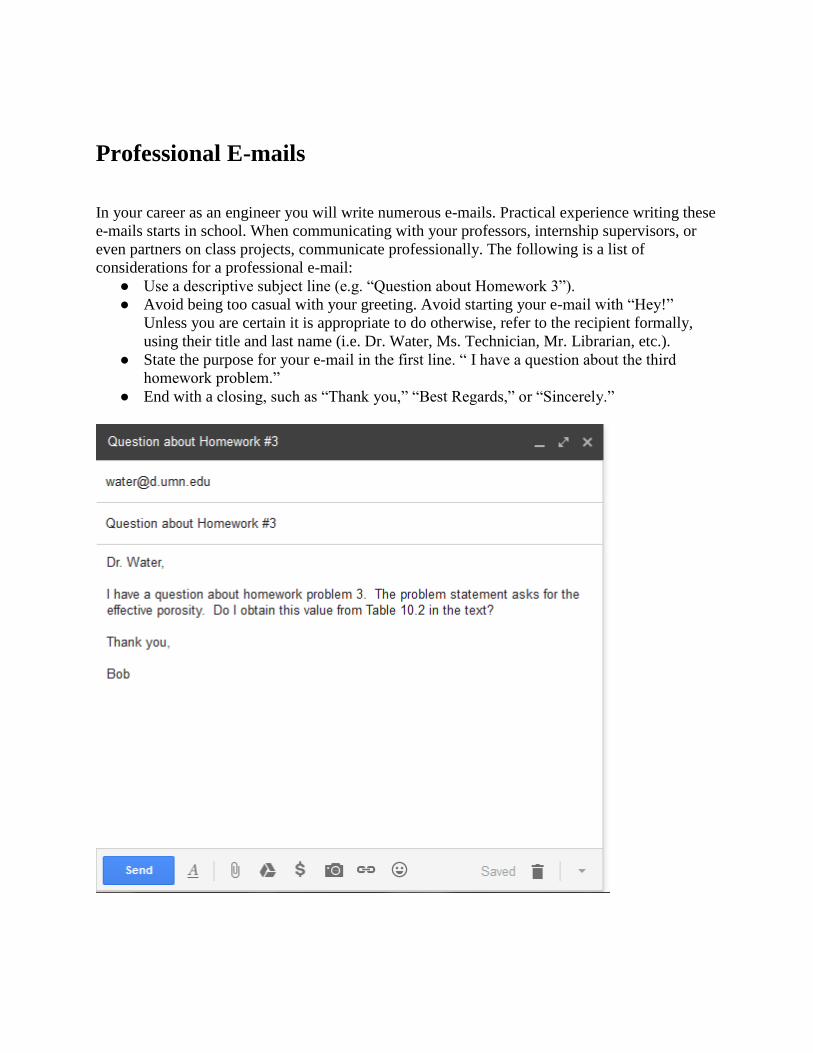
Professional E-mails
In your career as an engineer you will write numerous e-mails. Practical experience writing these
e-mails starts in school. When communicating with your professors, internship supervisors, or
even partners on class projects, communicate professionally. The following is a list of
considerations for a professional e-mail:
● Use a descriptive subject line (e.g. “Question about Homework 3”).
● Avoid being too casual with your greeting. Avoid starting your e-mail with “Hey!”
Unless you are certain it is appropriate to do otherwise, refer to the recipient formally,
using their title and last name (i.e. Dr. Water, Ms. Technician, Mr. Librarian, etc.).
● State the purpose for your e-mail in the first line. “ I have a question about the third
homework problem.”
● End with a closing, such as “Thank you,” “Best Regards,” or “Sincerely.”
Homework
All homework must be on engineering paper with a maximum of one problem per page. Each
page should include the student’s name, class title and number (CE XXXX), the date, homework
set and problem number. Each page should also be numbered.
Begin each problem with a detailed description of the problem; copied directly from the
assignment sheet if necessary, this information should be labeled as “Given.” If a diagram or
drawing is given, it should be recreated using a straight edge and it should include all details.
Next, clearly indicate the purpose of the problem, what you are being asked to find. This should
be labeled as “Find.”
Finally, your solution should be labeled as such (“Solution”) and should be presented in a way
that is easy to follow. If you are using a formula derived in class or in a text, write out the
formula in its basic form (using variables) before plugging in your numbers. Do not skip steps
and give each new equation or step a line of its own. Always use units and significant figures. If
another diagram is necessary for you to complete the solution, draw it, again using a straight
edge and label all dimensions and properties.
When a requested answer is reached, be sure to clearly indicate it with a straight-edge box drawn
around it.
The purpose of homework is not only for you to practice applying engineering concepts, but also
to get in the habit of presenting your work in a clear and orderly manner so that other people can
follow what you are doing. This is a critical skill you must master as an engineer.
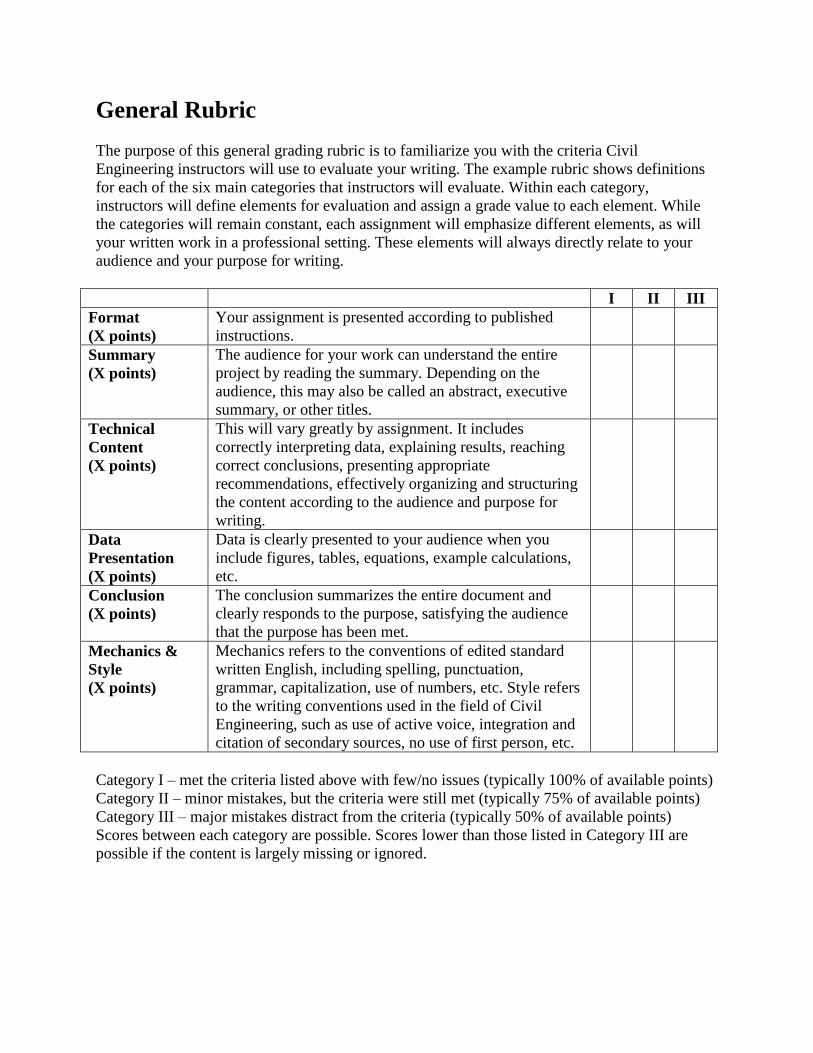
General Rubric
The purpose of this general grading rubric is to familiarize you with the criteria Civil
Engineering instructors will use to evaluate your writing. The example rubric shows definitions
for each of the six main categories that instructors will evaluate. Within each category,
instructors will define elements for evaluation and assign a grade value to each element. While
the categories will remain constant, each assignment will emphasize different elements, as will
your written work in a professional setting. These elements will always directly relate to your
audience and your purpose for writing.
I II III
Format
(X points)
Your assignment is presented according to published
instructions.
Summary
(X points)
The audience for your work can understand the entire
project by reading the summary. Depending on the
audience, this may also be called an abstract, executive
summary, or other titles.
Technical
Content
(X points)
This will vary greatly by assignment. It includes
correctly interpreting data, explaining results, reaching
correct conclusions, presenting appropriate
recommendations, effectively organizing and structuring
the content according to the audience and purpose for
writing.
Data
Presentation
(X points)
Data is clearly presented to your audience when you
include figures, tables, equations, example calculations,
etc.
Conclusion
(X points)
The conclusion summarizes the entire document and
clearly responds to the purpose, satisfying the audience
that the purpose has been met.
Mechanics &
Style
(X points)
Mechanics refers to the conventions of edited standard
written English, including spelling, punctuation,
grammar, capitalization, use of numbers, etc. Style refers
to the writing conventions used in the field of Civil
Engineering, such as use of active voice, integration and
citation of secondary sources, no use of first person, etc.
Category I – met the criteria listed above with few/no issues (typically 100% of available points)
Category II – minor mistakes, but the criteria were still met (typically 75% of available points)
Category III – major mistakes distract from the criteria (typically 50% of available points)
Scores between each category are possible. Scores lower than those listed in Category III are
possible if the content is largely missing or ignored.
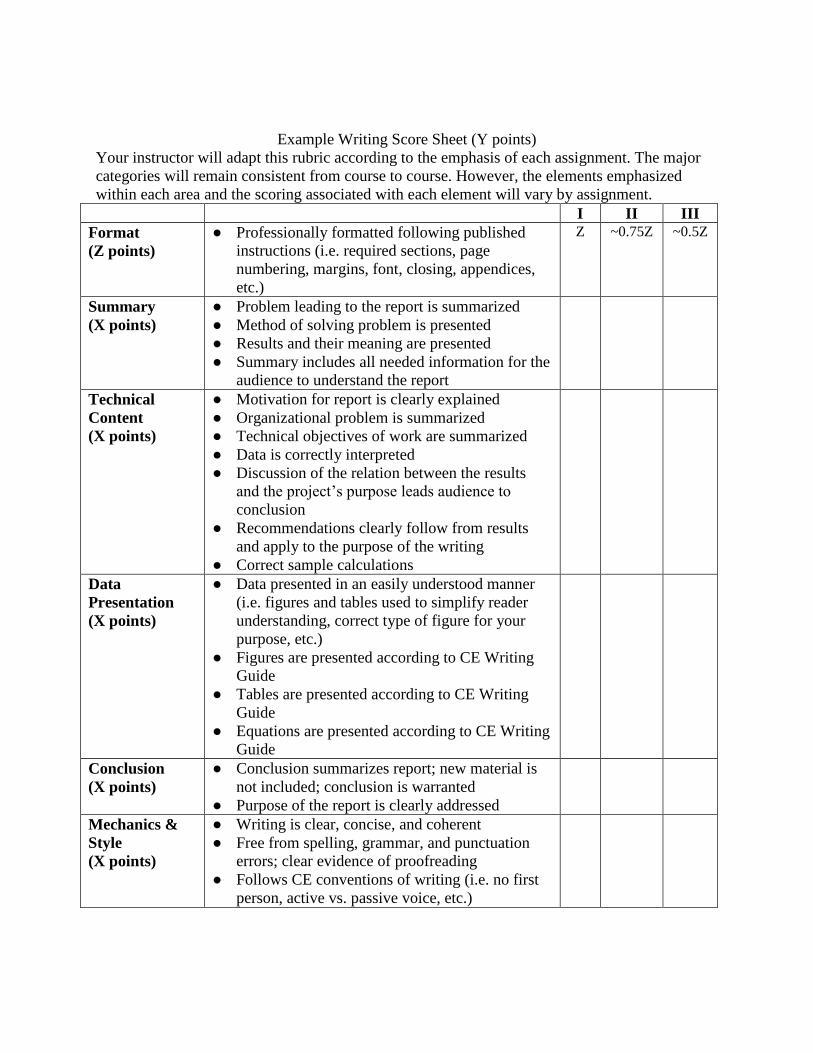
Example Writing Score Sheet (Y points)
Your instructor will adapt this rubric according to the emphasis of each assignment. The major
categories will remain consistent from course to course. However, the elements emphasized
within each area and the scoring associated with each element will vary by assignment.
I II III
Format
(Z points)
● Professionally formatted following published
instructions (i.e. required sections, page
numbering, margins, font, closing, appendices,
etc.)
Z ~0.75Z ~0.5Z
Summary
(X points)
● Problem leading to the report is summarized
● Method of solving problem is presented
● Results and their meaning are presented
● Summary includes all needed information for the
audience to understand the report
Technical
Content
(X points)
● Motivation for report is clearly explained
● Organizational problem is summarized
● Technical objectives of work are summarized
● Data is correctly interpreted
● Discussion of the relation between the results
and the project’s purpose leads audience to
conclusion
● Recommendations clearly follow from results
and apply to the purpose of the writing
● Correct sample calculations
Data
Presentation
(X points)
● Data presented in an easily understood manner
(i.e. figures and tables used to simplify reader
understanding, correct type of figure for your
purpose, etc.)
● Figures are presented according to CE Writing
Guide
● Tables are presented according to CE Writing
Guide
● Equations are presented according to CE Writing
Guide
Conclusion
(X points)
● Conclusion summarizes report; new material is
not included; conclusion is warranted
● Purpose of the report is clearly addressed
Mechanics &
Style
(X points)
● Writing is clear, concise, and coherent
● Free from spelling, grammar, and punctuation
errors; clear evidence of proofreading
● Follows CE conventions of writing (i.e. no first
person, active vs. passive voice, etc.)