Embed Size (px)
Citation preview
INA
INA
nstitut füranostrukturtechnologie undnalytik
Practical training ellipsometry
Lab training nanosensorics
Supervisor:
Uh-Myong Ha
Version:
December 22, 2014
University of Kassel
Contents
1 Introduction 3
2 Fundamentals 4
2.1 Polarized light . . . . . . . . . . . . . . . . . . . . . . . . . . . . . . . . . 4
2.2 The Ellipsometer principle . . . . . . . . . . . . . . . . . . . . . . . . . . . 7
2.2.1 Measuring bulk materials . . . . . . . . . . . . . . . . . . . . . . . 8
2.2.2 Measuring thin films . . . . . . . . . . . . . . . . . . . . . . . . . . 8
3 Procedure 9
4 Getting the results 11
4.1 Task 1: Calculating n of the glas substrate . . . . . . . . . . . . . . . . . 11
4.2 Task 2: Measuring the silicium wafer samples . . . . . . . . . . . . . . . . 13
4.3 Checklist for lab report . . . . . . . . . . . . . . . . . . . . . . . . . . . . 14
Bibliography 15
2
1 Introduction
Ellipsometry is a non-invasive and non destructive measurement method, which enables
to obtain refractive index, layer thickness and absorption coefficient of a thin layer. The
relative change of polarization of light hitting a sample surface is measured and can give
information about the sample properties.
The resolution of ellipsometry regarding thickness is very precise and enables measuring
thickness < 1 nm and refractive index error from 0.001 to 0.01 [1].
In this lab experiment you should measure one glas substrate and two different silicium
wafer samples. In the protocol you should calculate the refractive index based on the
incident angle and the angles of polarizer/analyzer and compare it with the determined
value via ellipsometer software.
3
2 Fundamentals
2.1 Polarized light
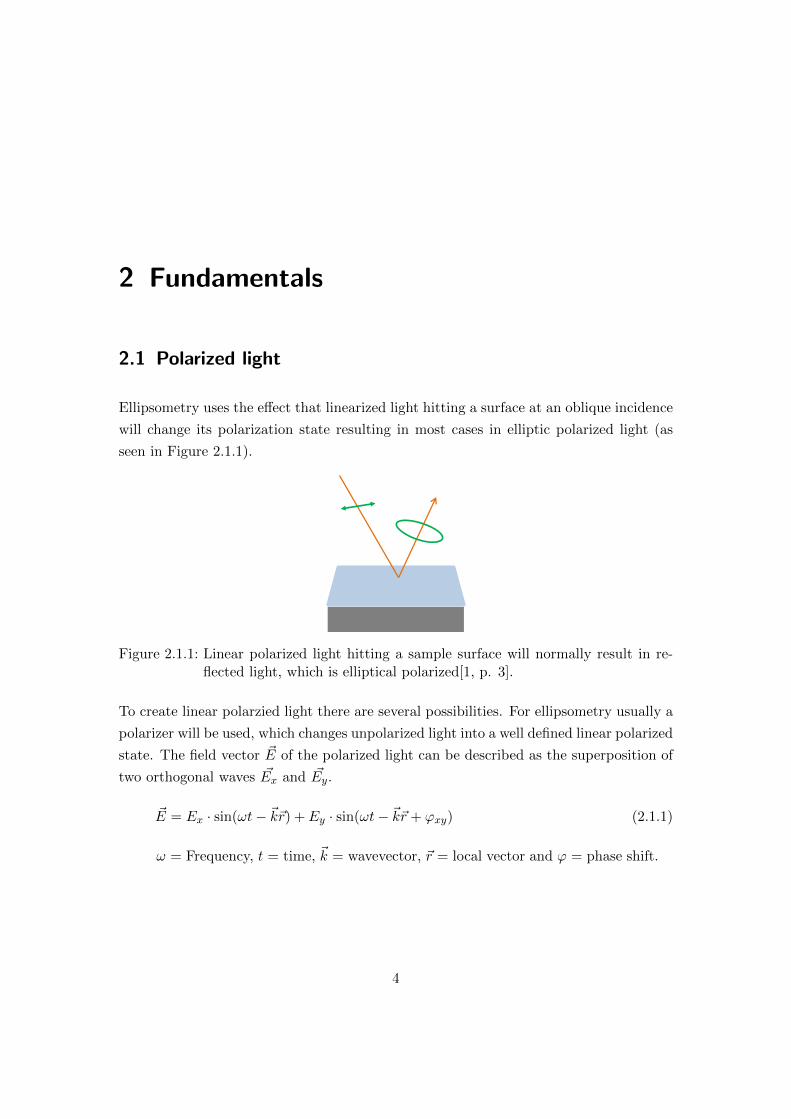
Ellipsometry uses the effect that linearized light hitting a surface at an oblique incidence
will change its polarization state resulting in most cases in elliptic polarized light (as
seen in Figure 2.1.1).
Figure 2.1.1: Linear polarized light hitting a sample surface will normally result in re-flected light, which is elliptical polarized[1, p. 3].
To create linear polarzied light there are several possibilities. For ellipsometry usually a
polarizer will be used, which changes unpolarized light into a well defined linear polarized
state. The field vector ~E of the polarized light can be described as the superposition of
two orthogonal waves ~Ex and ~Ey.
~E = Ex · sin(ωt− ~k~r) + Ey · sin(ωt− ~k~r + ϕxy) (2.1.1)
ω = Frequency, t = time, ~k = wavevector, ~r = local vector and ϕ = phase shift.
4
2 Fundamentals
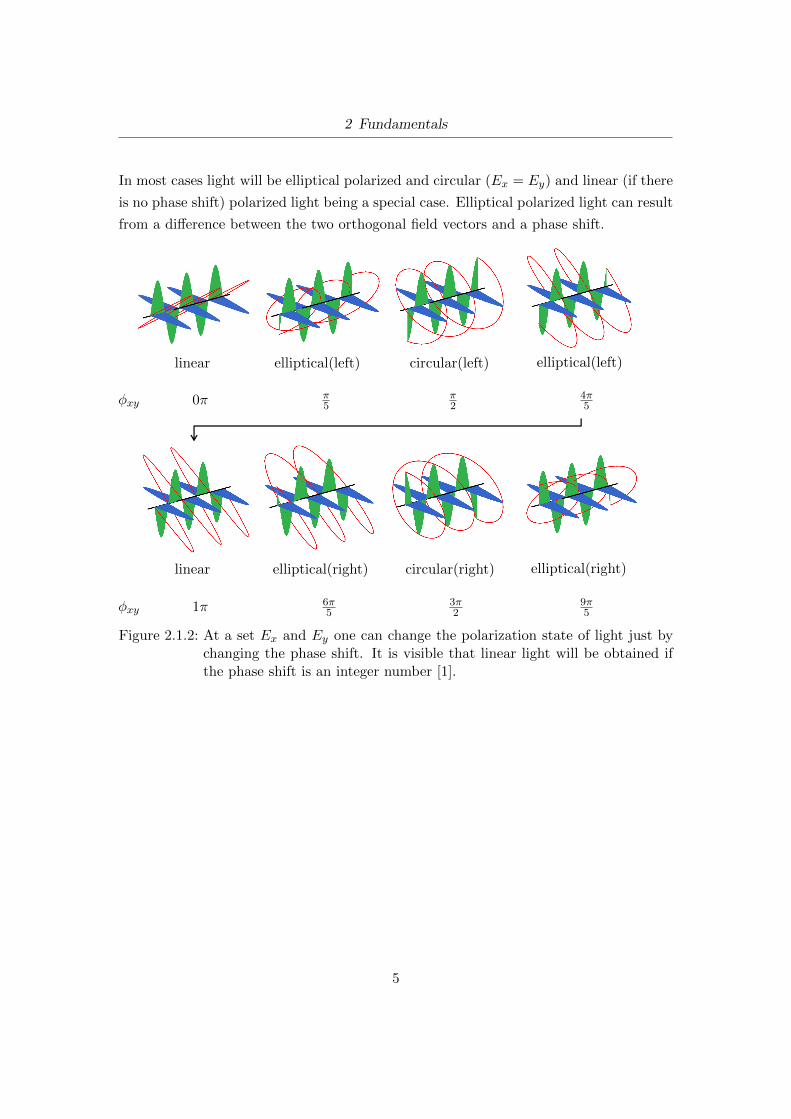
In most cases light will be elliptical polarized and circular (Ex = Ey) and linear (if there
is no phase shift) polarized light being a special case. Elliptical polarized light can result
from a difference between the two orthogonal field vectors and a phase shift.
linear elliptical(right)elliptical(right) circular(right)
linear elliptical(left) circular(left) elliptical(left)
0π π5
π2
4π5
1π 6π5
9π5
3π2
φxy
φxy
Figure 2.1.2: At a set Ex and Ey one can change the polarization state of light just bychanging the phase shift. It is visible that linear light will be obtained ifthe phase shift is an integer number [1].
5
2 Fundamentals
ψ
Ep
Es
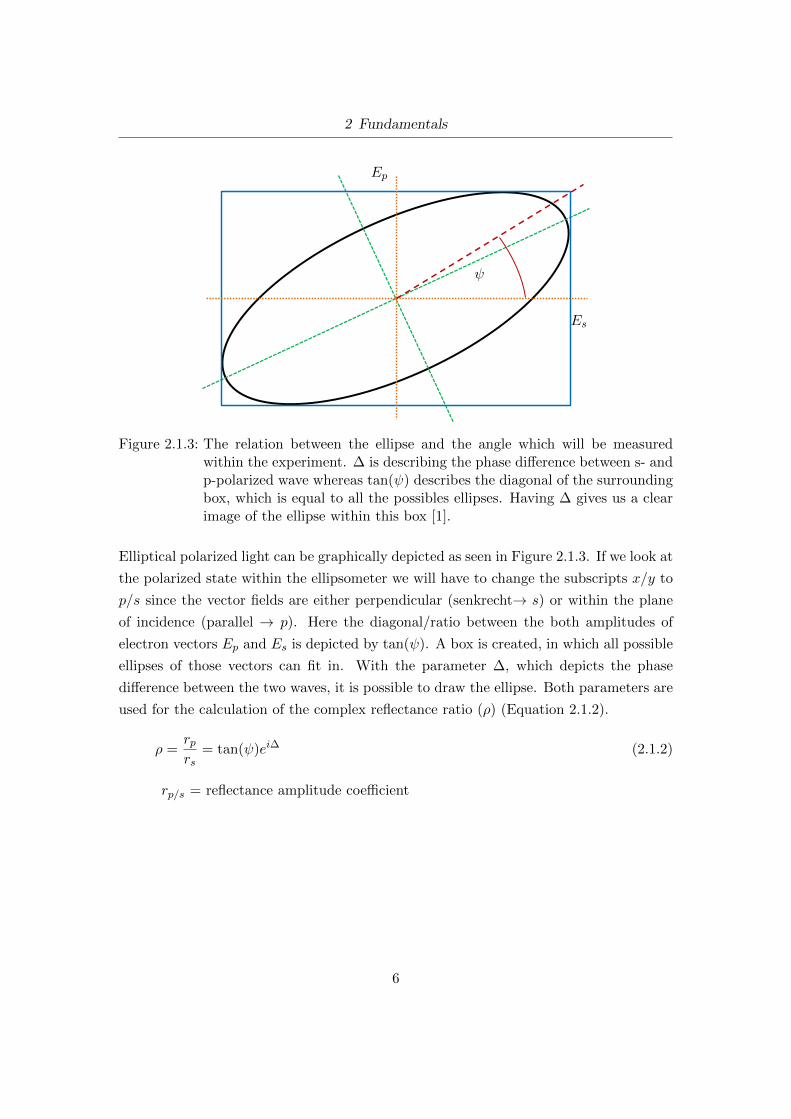
Figure 2.1.3: The relation between the ellipse and the angle which will be measuredwithin the experiment. ∆ is describing the phase difference between s- andp-polarized wave whereas tan(ψ) describes the diagonal of the surroundingbox, which is equal to all the possibles ellipses. Having ∆ gives us a clearimage of the ellipse within this box [1].
Elliptical polarized light can be graphically depicted as seen in Figure 2.1.3. If we look at
the polarized state within the ellipsometer we will have to change the subscripts x/y to
p/s since the vector fields are either perpendicular (senkrecht→ s) or within the plane
of incidence (parallel → p). Here the diagonal/ratio between the both amplitudes of
electron vectors Ep and Es is depicted by tan(ψ). A box is created, in which all possible
ellipses of those vectors can fit in. With the parameter ∆, which depicts the phase
difference between the two waves, it is possible to draw the ellipse. Both parameters are
used for the calculation of the complex reflectance ratio (ρ) (Equation 2.1.2).
ρ =rprs
= tan(ψ)ei∆ (2.1.2)
rp/s = reflectance amplitude coefficient
6
2 Fundamentals
2.2 The Ellipsometer principle
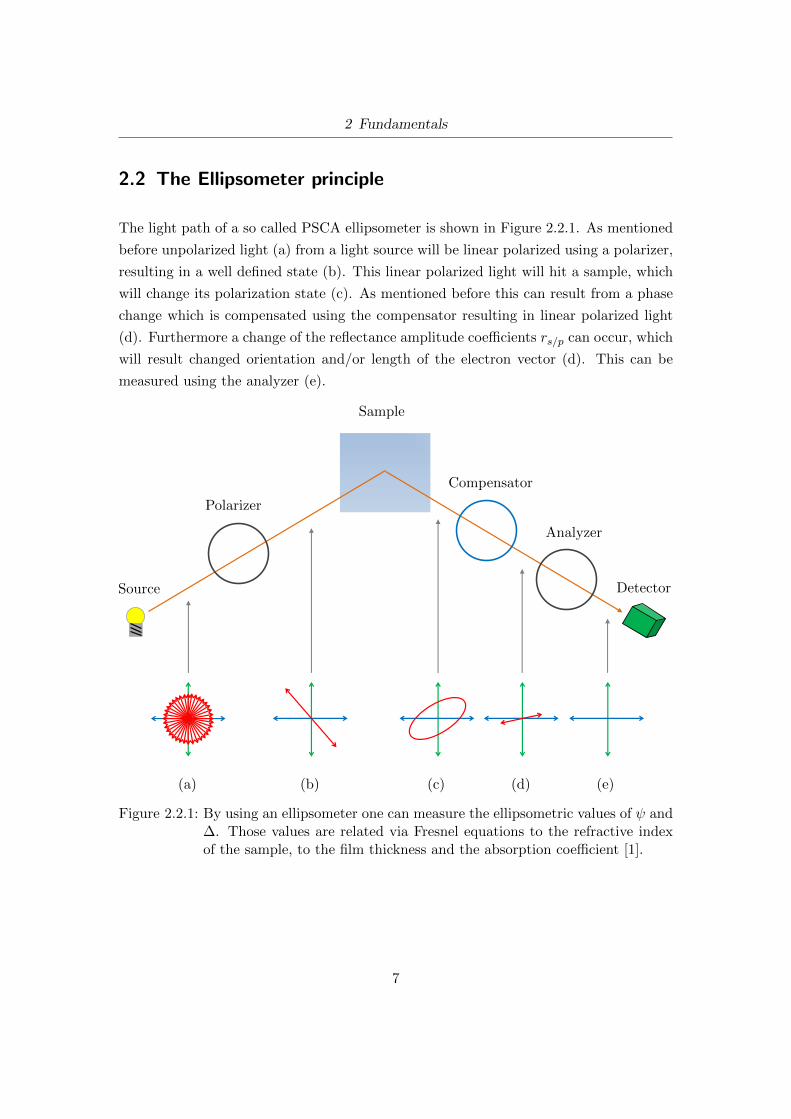
The light path of a so called PSCA ellipsometer is shown in Figure 2.2.1. As mentioned
before unpolarized light (a) from a light source will be linear polarized using a polarizer,
resulting in a well defined state (b). This linear polarized light will hit a sample, which
will change its polarization state (c). As mentioned before this can result from a phase
change which is compensated using the compensator resulting in linear polarized light
(d). Furthermore a change of the reflectance amplitude coefficients rs/p can occur, which
will result changed orientation and/or length of the electron vector (d). This can be
measured using the analyzer (e).
Source
Polarizer
Compensator
Analyzer
Detector
Sample
(a) (b) (c) (d) (e)
Figure 2.2.1: By using an ellipsometer one can measure the ellipsometric values of ψ and∆. Those values are related via Fresnel equations to the refractive indexof the sample, to the film thickness and the absorption coefficient [1].
7
2 Fundamentals
2.2.1 Measuring bulk materials
To measure the refractive index n of a bulk material the incidence angle of the light
source as well the ratio of rs/p has to be known. Based on these parameters it is possible
to calculate n by using the Fresnel equations [2].
2.2.2 Measuring thin films
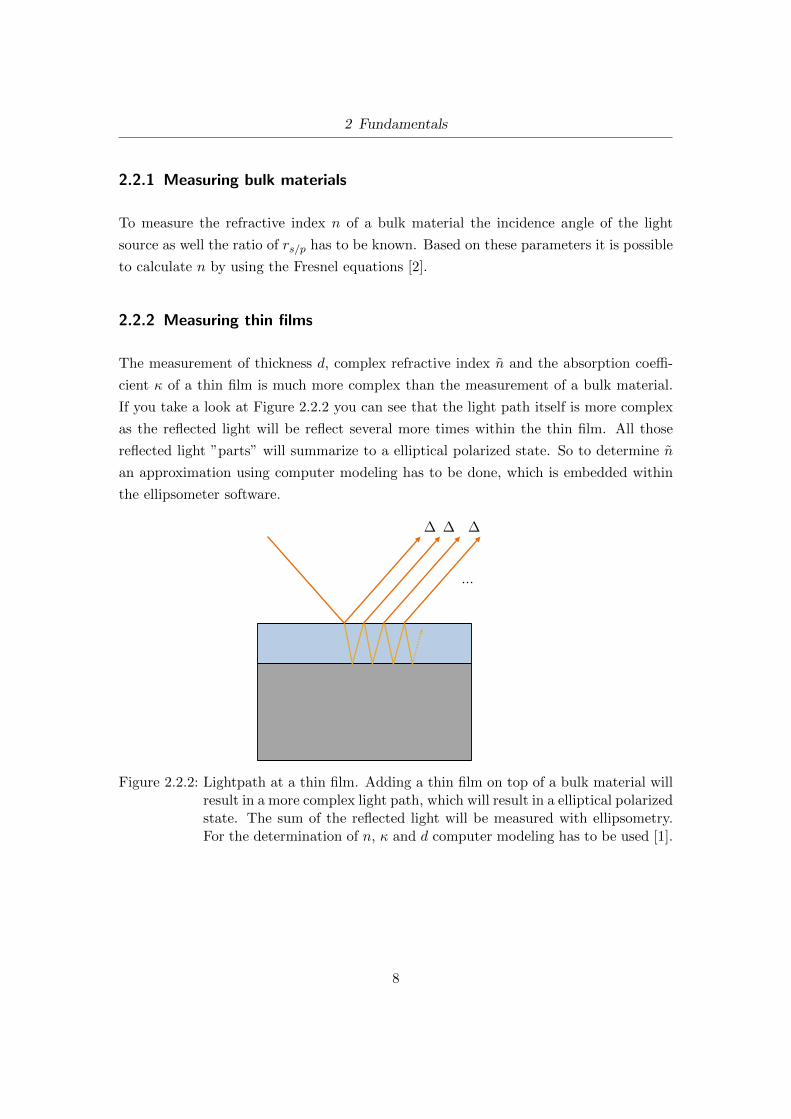
The measurement of thickness d, complex refractive index n and the absorption coeffi-
cient κ of a thin film is much more complex than the measurement of a bulk material.
If you take a look at Figure 2.2.2 you can see that the light path itself is more complex
as the reflected light will be reflect several more times within the thin film. All those
reflected light ”parts” will summarize to a elliptical polarized state. So to determine n
an approximation using computer modeling has to be done, which is embedded within
the ellipsometer software.
∆ ∆ ∆
...
Figure 2.2.2: Lightpath at a thin film. Adding a thin film on top of a bulk material willresult in a more complex light path, which will result in a elliptical polarizedstate. The sum of the reflected light will be measured with ellipsometry.For the determination of n, κ and d computer modeling has to be used [1].
8
3 Procedure
Safety tips:
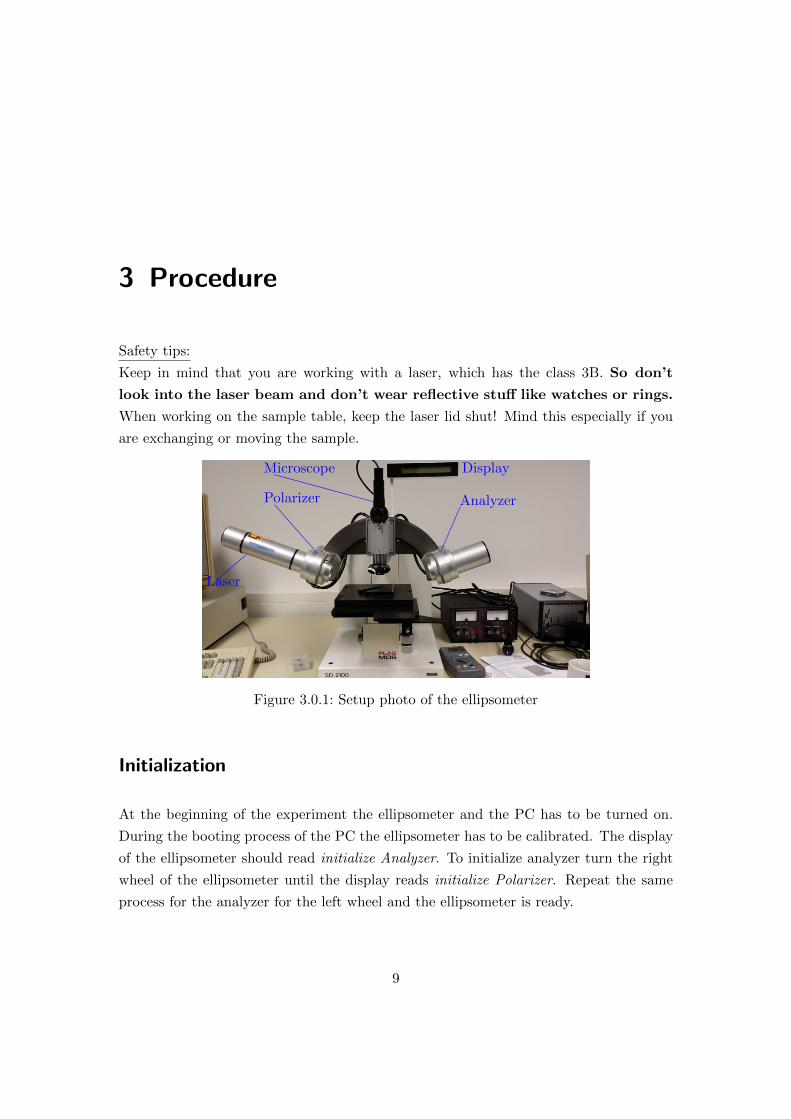
Keep in mind that you are working with a laser, which has the class 3B. So don’t
look into the laser beam and don’t wear reflective stuff like watches or rings.
When working on the sample table, keep the laser lid shut! Mind this especially if you
are exchanging or moving the sample.
DisplayMicroscope
Laser
AnalyzerPolarizer
Figure 3.0.1: Setup photo of the ellipsometer
Initialization
At the beginning of the experiment the ellipsometer and the PC has to be turned on.
During the booting process of the PC the ellipsometer has to be calibrated. The display
of the ellipsometer should read initialize Analyzer. To initialize analyzer turn the right
wheel of the ellipsometer until the display reads initialize Polarizer. Repeat the same
process for the analyzer for the left wheel and the ellipsometer is ready.
9
3 Procedure
Measuring the glas substrate
While the laser lid is shut put the glas substrate on the sample table. Open now the
laser shutter and align it so that the laser spot is hitting the substrate. What follows
now is the fine alignment of the sample table. To achieve that one has to turn on the
microscope light and by looking through the microscope align two crosses until both are
overlapping. After the successful alignment the microscope light has to be turned off.
Finally check if the reflected laser light hits the photodiode on the analyzer side.
During the actual measurement the polarizer and the analyzer has to be aligned so that
light intensity shown on the ellipsometer display is minimal. The measurement has to
be conducted on the photodiode quadrant Q2 and Q4. A detailed explanation of the
measurement process will be conducted during the experiment.
For the glas substrate the incident angle of the laser as well the angles of the polarizer
and the analyzer has to be noted down (see subsection 2.2.1). Furthermore use the
ellipsometer software to calculate n and write it down.
Measuring the silicium wafer samples
After the measurement of the glas substrate a blank silicium wafer substrate will be
measured like the glas substrate. Save the refractive index of the wafer substrate within
the ellipsometer software. Following this is the measurement of two different wafer
samples. Keep in mind to shut the laser lid during the exchange of the samples. Using
the ellipsometer software calculate n, κ and d (see subsection 2.2.2).
10
4 Getting the results
Within the results part of the lab report the task is to calculate n of the measured glas
substrate and compare it with the value of the ellipsometer software. Furthermore you
should write down the determined values for n, κ and d of the silicium wafer samples.
4.1 Task 1: Calculating n of the glas substrate
n1n2
p
s
α α
β
Laser Photodetectory
~EAnalyzer
xa
P
y
A
xp
~EPolarizer
(a) (b) (c)
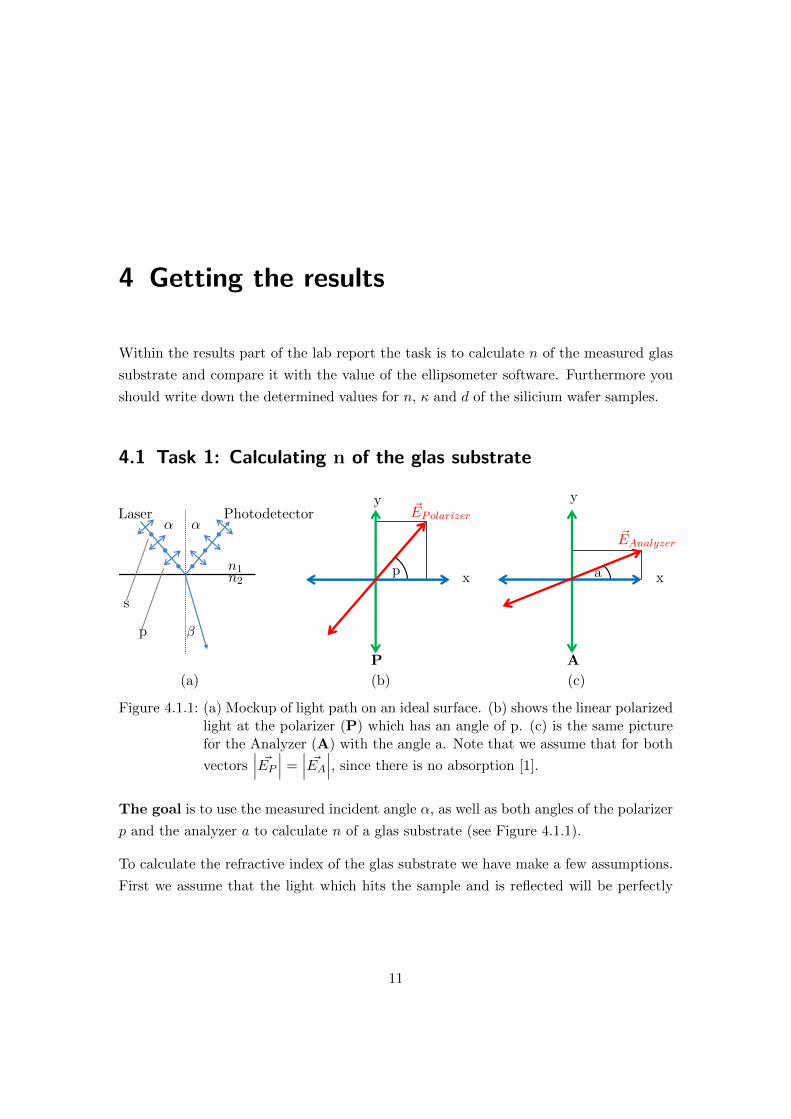
Figure 4.1.1: (a) Mockup of light path on an ideal surface. (b) shows the linear polarizedlight at the polarizer (P) which has an angle of p. (c) is the same picturefor the Analyzer (A) with the angle a. Note that we assume that for both
vectors∣∣∣ ~EP ∣∣∣ =
∣∣∣ ~EA∣∣∣, since there is no absorption [1].
The goal is to use the measured incident angle α, as well as both angles of the polarizer
p and the analyzer a to calculate n of a glas substrate (see Figure 4.1.1).
To calculate the refractive index of the glas substrate we have make a few assumptions.
First we assume that the light which hits the sample and is reflected will be perfectly
11
4 Getting the results
linear (as in Figure 4.1.1 (b) and (c)). Additionally we assume there are no absorption
effects so that there is no phase transition for the reflection. To simplify the calculation
we furthermore assume that n is only real and that the interface is perfect.
The change of ~E after the reflection off the glas substrate can be measured by measuring
both angles p and a at the minimum intensity.
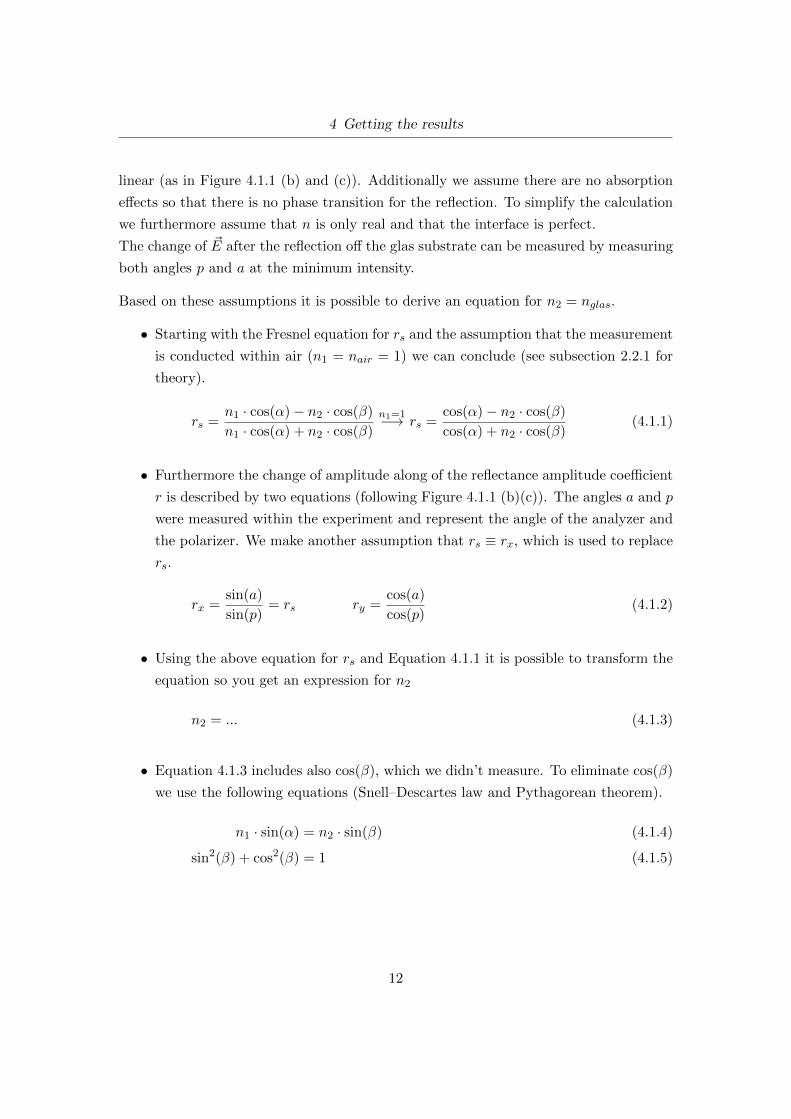
Based on these assumptions it is possible to derive an equation for n2 = nglas.
• Starting with the Fresnel equation for rs and the assumption that the measurement
is conducted within air (n1 = nair = 1) we can conclude (see subsection 2.2.1 for
theory).
rs =n1 · cos(α)− n2 · cos(β)
n1 · cos(α) + n2 · cos(β)
n1=1−→ rs =cos(α)− n2 · cos(β)
cos(α) + n2 · cos(β)(4.1.1)
• Furthermore the change of amplitude along of the reflectance amplitude coefficient
r is described by two equations (following Figure 4.1.1 (b)(c)). The angles a and p
were measured within the experiment and represent the angle of the analyzer and
the polarizer. We make another assumption that rs ≡ rx, which is used to replace
rs.
rx =sin(a)
sin(p)= rs ry =
cos(a)
cos(p)(4.1.2)
• Using the above equation for rs and Equation 4.1.1 it is possible to transform the
equation so you get an expression for n2
n2 = ... (4.1.3)
• Equation 4.1.3 includes also cos(β), which we didn’t measure. To eliminate cos(β)
we use the following equations (Snell–Descartes law and Pythagorean theorem).
n1 · sin(α) = n2 · sin(β) (4.1.4)
sin2(β) + cos2(β) = 1 (4.1.5)
12
4 Getting the results
• At the end you should have an equation which should include a square root.
• Compare the calculated value for nglas with the measured value of nglas.
For the discussions part you should explain what creates the difference between the
calculated value and the measured value of nglas. Additionally explain what error sources
could contribute to the calculated value.
4.2 Task 2: Measuring the silicium wafer samples
In this part you should write down the measured refractive index for the silicium sub-
strate. The measured complex refractive index, absorption coefficient and thickness has
to be written down. Furthermore explain in this part why you measured a blank silicium
substrate at the beginning of second measurement.
In the discussion part please make assumptions based on the determined values for
thickness and refractive index, which material was used as a thin layer. For further
information look at http://refractiveindex.info/ and compare your values.
13
4 Getting the results
4.3 Checklist for lab report
# Please write down an description of what you did in the experiment within the lab
report.
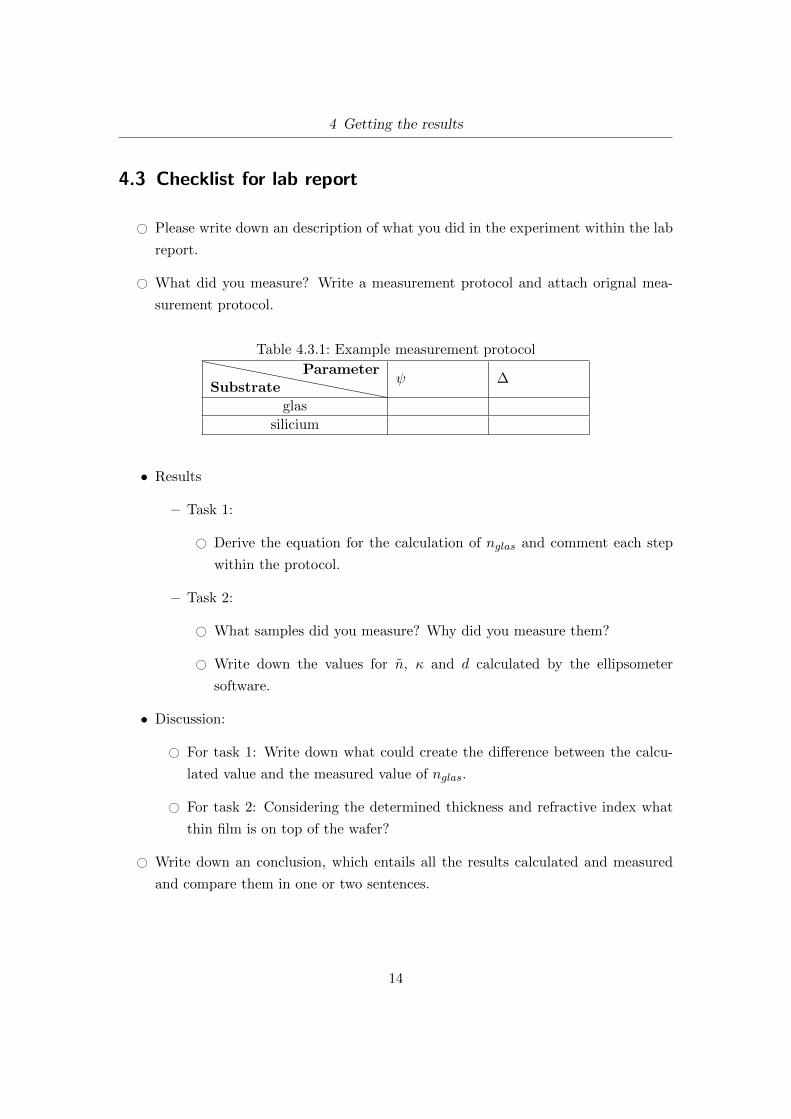
# What did you measure? Write a measurement protocol and attach orignal mea-
surement protocol.
Table 4.3.1: Example measurement protocol
SubstrateParameter
ψ ∆
glas
silicium
• Results
– Task 1:
# Derive the equation for the calculation of nglas and comment each step
within the protocol.
– Task 2:
# What samples did you measure? Why did you measure them?
# Write down the values for n, κ and d calculated by the ellipsometer
software.
• Discussion:
# For task 1: Write down what could create the difference between the calcu-
lated value and the measured value of nglas.
# For task 2: Considering the determined thickness and refractive index what
thin film is on top of the wafer?
# Write down an conclusion, which entails all the results calculated and measured
and compare them in one or two sentences.
14
Bibliography
[1] Dr. Thomas Kusserow. Nanosensorics: 05-Ellipsometry: 05-Ellipsometry, 15.12.2014.
URL http://te.ina-kassel.de/index.php/nanosensorics_en.html.
[2] J.Ph.PIEL. Introduction to ellipsometry, 07.10.2008. URL https://cmi.epfl.ch/
metrology/files/Sopra%20GES%205E/Introduction%20to%20ellipsometry.pdf.
[3] Jesper Jung, Jakob Bork, Tobias Holmgaard, Niels Anker Kortbek. Ellipsometry.
PhD thesis, AALBORG UNIVERSITY, Aalborg Øst, 21.12/004. URL http://
homes.nano.aau.dk/kp/Ellipsometry/main.pdf.
15