Embed Size (px)
Citation preview

University of Kansas
S. Gogineni, P. Kanagaratnam, R. Parthasarathy, V. Ramasami & D.
BraatenThe University of Kansas
Wideband Radars for Mapping of Near Surface
Internal Layers to Estimate Accumulation Rate
University of Kansas
Outline •Introduction•Background•Systems Description•Results•Conclusions
University of Kansas
Introduction• Sea level rose by about 15 cm over the last
century.• Thermal expansion of the ocean• Melting of mountain glaciers• Contribution from polar ice sheets
• There is a large uncertainty in polar ice sheets’ contribution.
• Accurate mass balance determination is essential to determining their contribution.• Volumetric method• Flux method

University of Kansas
Introduction
• Volumetric method
• Measure change in surface elevation – Satellite radar and laser Altimeters
– NASA ICESAT -- January 03.– ESA CRYOSAT -- 2003 or 2004.
• Interpretation of the data from these missions requires additional information. • Spatial and temporal variation of
accumulation rate.

University of Kansas
Introduction
• Flux approach• Measure net input and ouput
– Snow accumulation– Ice loss
– Melting– Calving
• Both methods need information on the accumulation rate.– Snow pits and ice cores
– Limited coverage

University of Kansas
Introduction—GREENLAND ACCUMULATION MAP
Bales et al., 2001
Cores or pits on the Greenland ice sheet.
Small variance where there are large numbers of cores or pits.
Large variance in areas with significant change
Difficult to operate in margins of the ice sheet
University of Kansas
Introduction— Systems
• We developed two radar systems to map near-surface internal layers for estimating accumulation rate.• Surface-based system
– Center frequency = 1.25 GHz– 10 cm resolution
• Airborne system– Center frequency = 750 MHz.– 60 cm resolution
University of Kansas
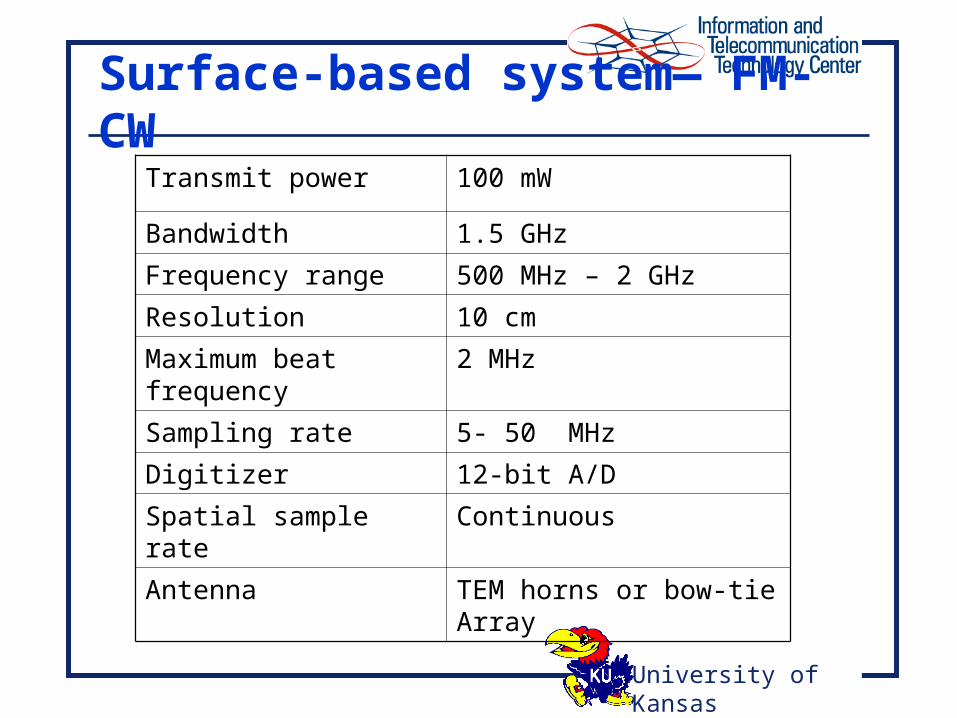
Surface-based system— FM-CW
Transmit power 100 mW
Bandwidth 1.5 GHz
Frequency range 500 MHz – 2 GHz
Resolution 10 cm
Maximum beat frequency
2 MHz
Sampling rate 5- 50 MHz
Digitizer 12-bit A/D
Spatial sample rate Continuous
Antenna TEM horns or bow-tie Array

University of Kansas
Systems—Airborne Radar
• We used surface-based measurements to determine optimum radar parameters
• Constraint• No interference
to navigation and communication equipment
System specifications
Frequency 600 –900 MHz
Sweep Time 100 ms
PRF 2 kHz
Transmit Power 1 W
Number of Coherent Integrations
100
Antennas TEM Horns
A/D Dynamic Range 12 bit, 74 dB
Sampling Rate 50 MHz

University of Kansas
System Description— Airborne Radar
University of Kansas
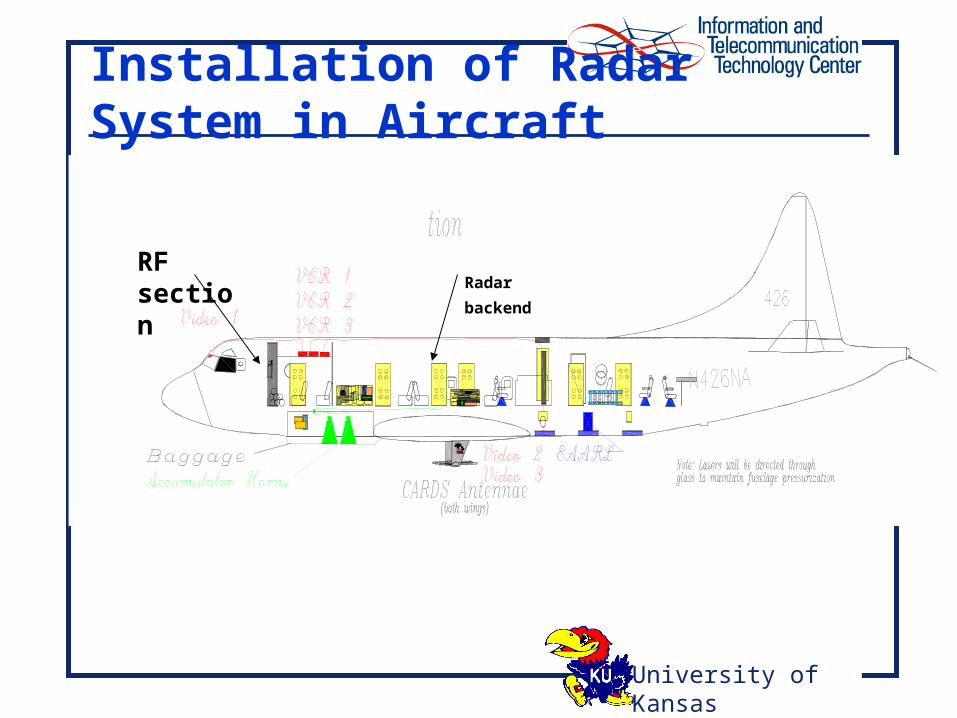
Installation of Radar System in Aircraft
Radar
backend
RF section

University of Kansas
Results

University of Kansas
Results—Matching with core data• We simulated
idealized radar response using core data
• Matched layers qualitatively.
• Radar data were collected in 2002 and core data in 1995. We had to account for this difference. • A source of error.
University of Kansas
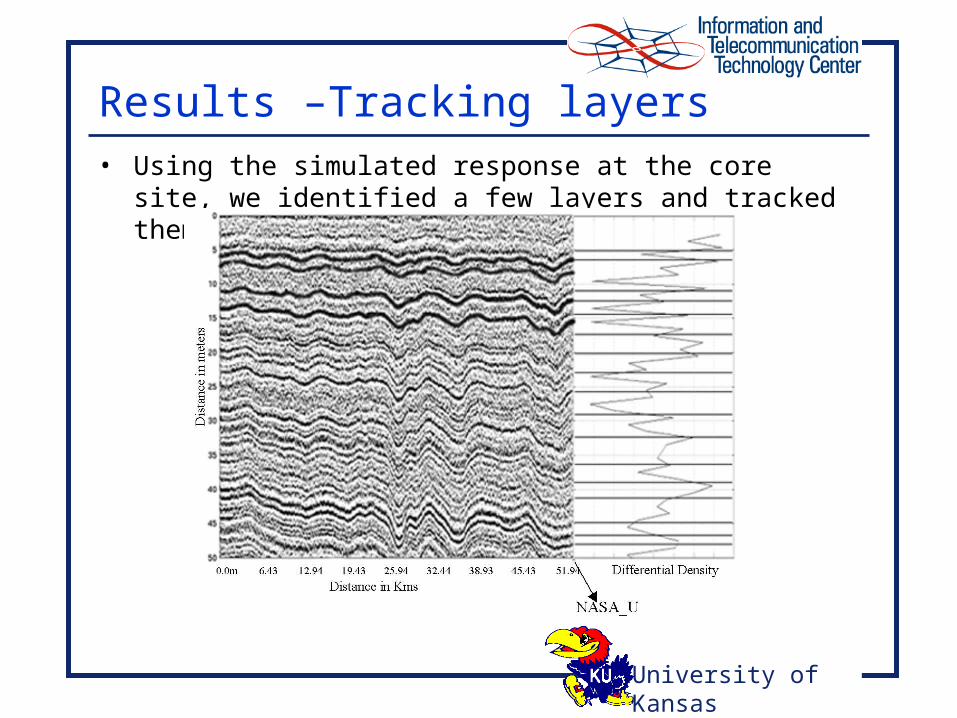
Results –Tracking layers• Using the simulated response at the core site, we
identified a few layers and tracked them
University of Kansas
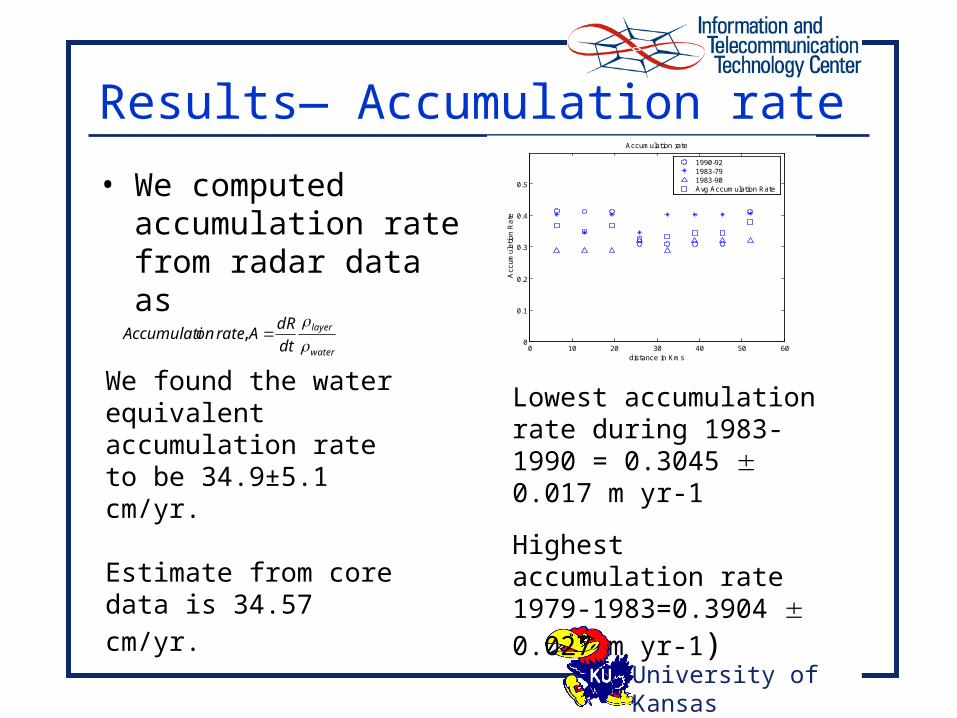
Results— Accumulation rate
• We computed accumulation rate from radar data as
water
layer
dt
dRArateonAccumulati
,
We found the water equivalent accumulation rate to be 34.9±5.1 cm/yr.
Estimate from core data is 34.57 cm/yr.
0 10 20 30 40 50 600
0.1
0.2
0.3
0.4
0.5
Ac
cu
mu
lati
on
Ra
te
distance in Kms
Accumulation rate
1990-921983-791983-90Avg Accumulation Rate
Lowest accumulation rate during 1983-1990 = 0.3045 0.017 m yr-1
Highest accumulation rate 1979-1983=0.3904 0.027 m yr-1)

University of Kansas
Conclusions
• We designed and developed two wideband radars for mapping near surface internal layers in glacial ice.
• We showed that we can estimate accumulation rate.
• Data will be distributed through the web in about six months.
• More accurate simulations• System point spread function• Incorporate volume and surface scattering
— noise.• Develop data inversion algorithms


![Report on Normalization Approach for +2 Marks Across …jeexiiscore_normal/Joshi_committee... · The Ramasami Committee report [Appendix A] was discussed in the 4th meeting of the](https://img.pdfslide.us/doc/110x75/5b6034827f8b9a81168b7eed/report-on-normalization-approach-for-2-marks-across-jeexiiscorenormaljoshicommittee.jpg)