Embed Size (px)
Citation preview
University of IcelandInstitute of Economic Studies
Fish as a heterogeneous product.
By
Dadi Kristofersson
Decomposing the price of fish
IntroductionFishing is an economic activity aimed at
satisfying the whishes of consumers to consume fish.
Fish is heterogeneous with a number of attributes
Consumers have preferences for attributes and the value of fish is to a large extent determined by its attributes.
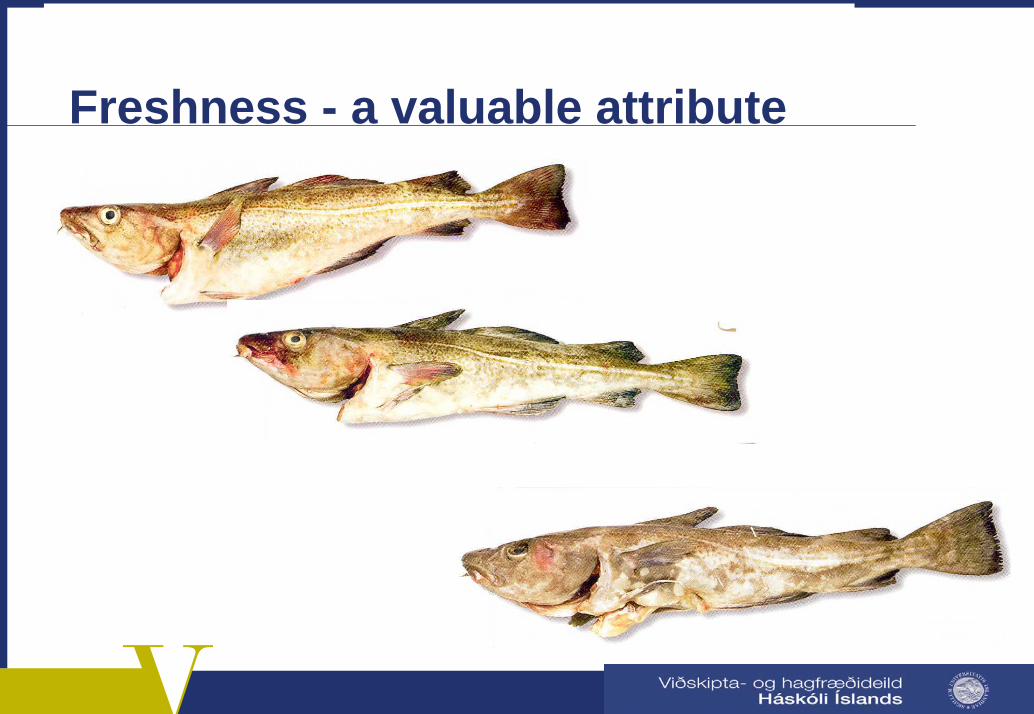
Freshness - a valuable attribute
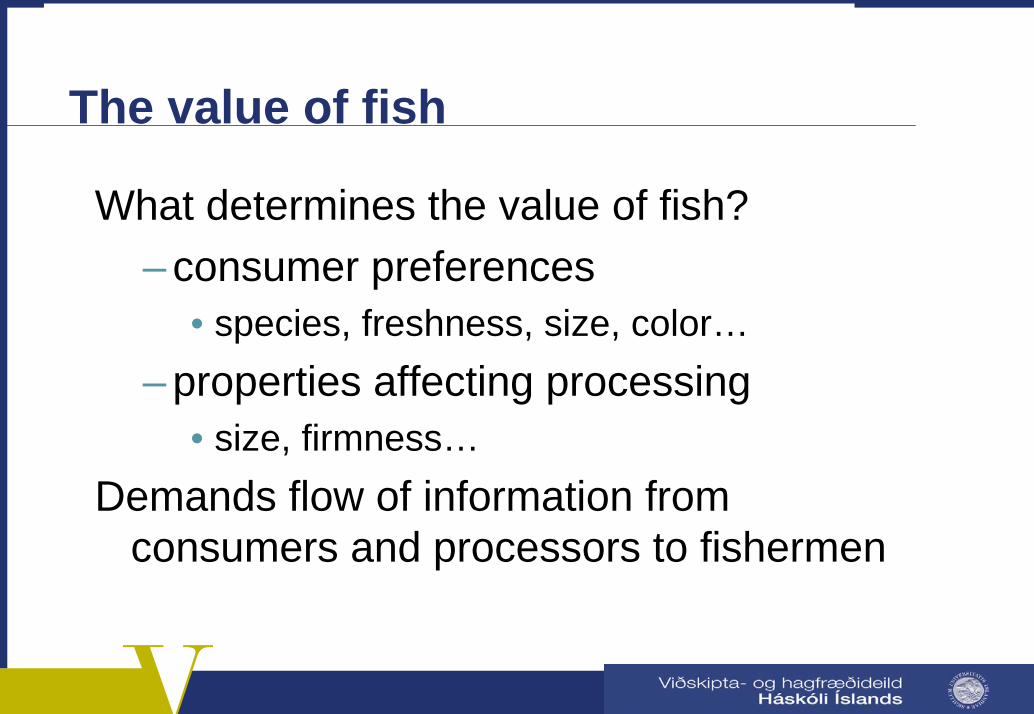
The value of fish
What determines the value of fish?– consumer preferences
• species, freshness, size, color…– properties affecting processing
• size, firmness…Demands flow of information from
consumers and processors to fishermen
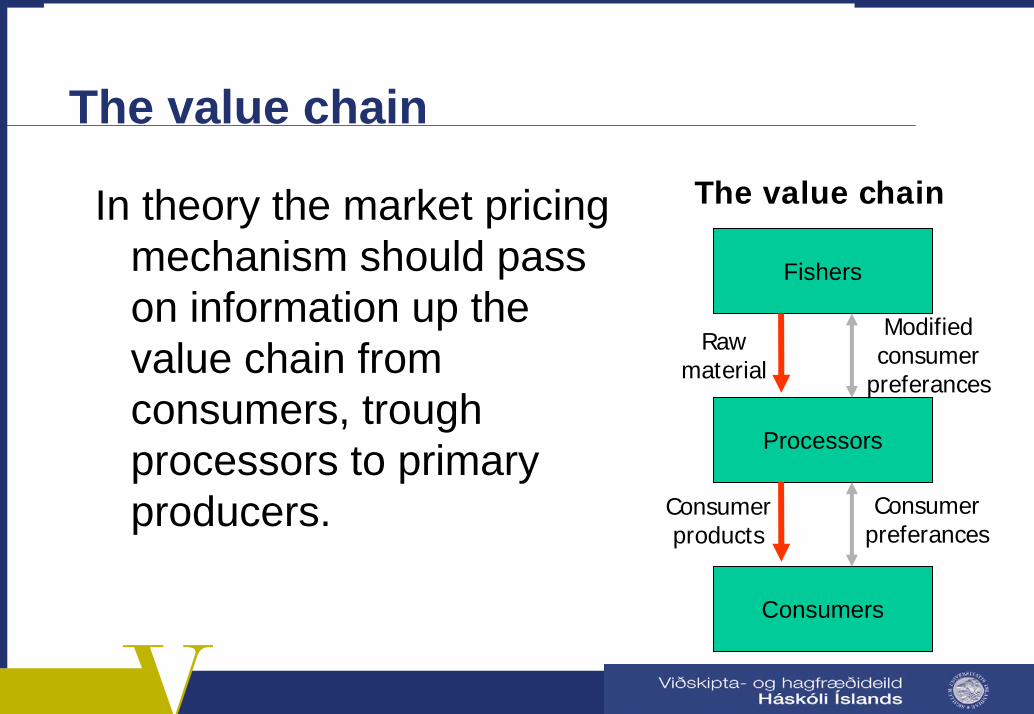
The value chainThe value chainIn theory the market pricing
mechanism should pass on information up the value chain from consumers, trough processors to primary producers.
Fishers
Processors
Consumers
Rawmaterial
Consumerproducts
Consumerpreferances
Modifiedconsumer
preferances
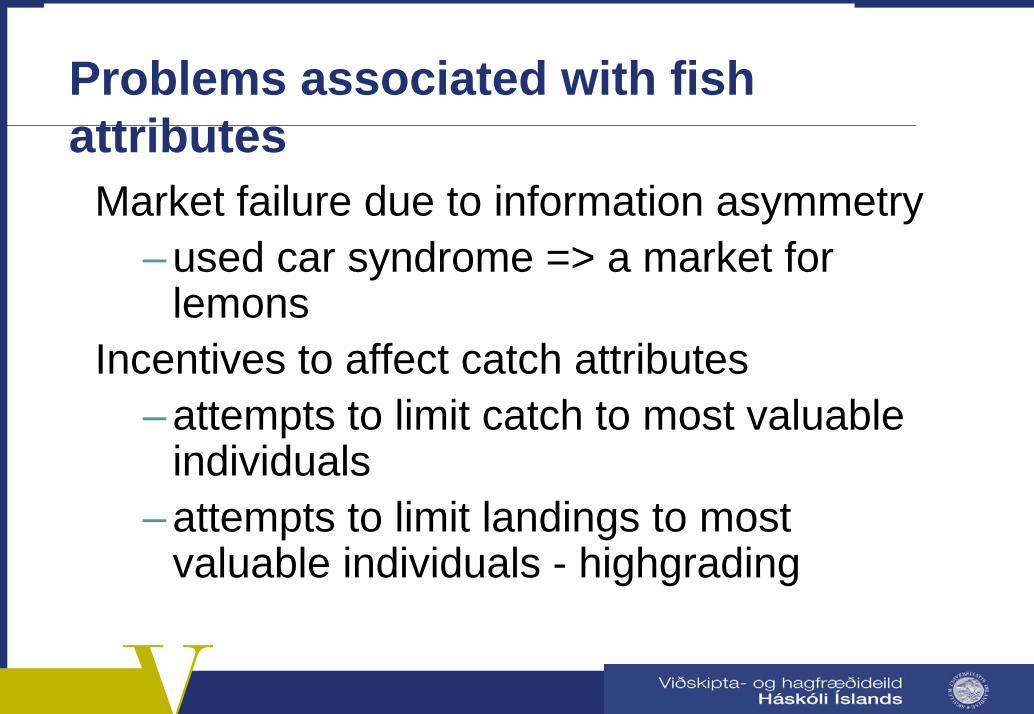
Problems associated with fish attributes
Market failure due to information asymmetry– used car syndrome => a market for
lemonsIncentives to affect catch attributes
– attempts to limit catch to most valuable individuals
– attempts to limit landings to most valuable individuals - highgrading
First problem - information asymmetry
Inaccurate description of attributes and costly confirmation of quality lead to an information asymmetry in the market. – The fisher knows more about the attributes of
the fish than the buyerInformation asymmetry increases the quantity of
low-quality goods sold at the expense of high quality goods. – Low quality producers are able to take
advantage of lower production cost

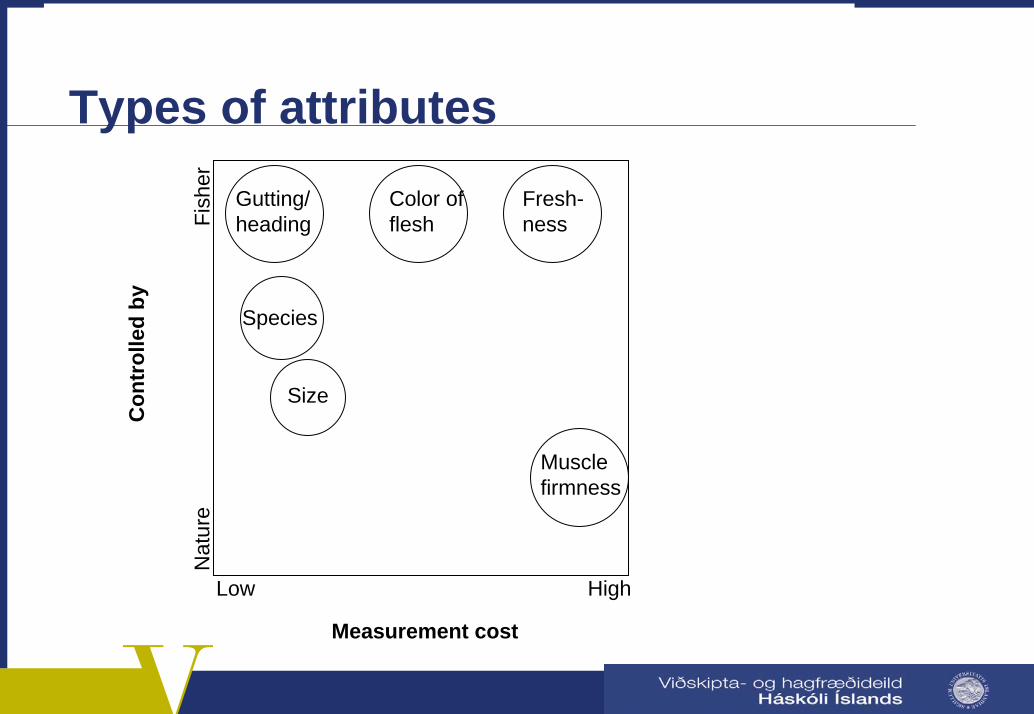
Types of attributes
Measurement cost
Con
trol
led
by
Low High
Nat
ure
Fish
erGutting/heading
Fresh-ness
Species
Size
Musclefirmness
Color offlesh
Second problem – supply of attributesEspecially concerns sizeTargeting by gear or location choice
Non-targeted individuals have increased probability of reaching sexual maturity=> breeding for a smaller fish– rents from the whole fishery reduce
Highgrading by discarding less valuable catch– mortality of discarded fish high so no effects
on mortality rate– rents lost in non landed catch + data fouling
Case study – Icelandic fish auctions
Auctions started in 1987Sell about 100.000 tons each yearValue about 14 billion ISKLocations around Iceland but one central
auction on the internet
Registered attributes
Size classGuttingStorage classGutting and/or storage methodVesselLocationLot size
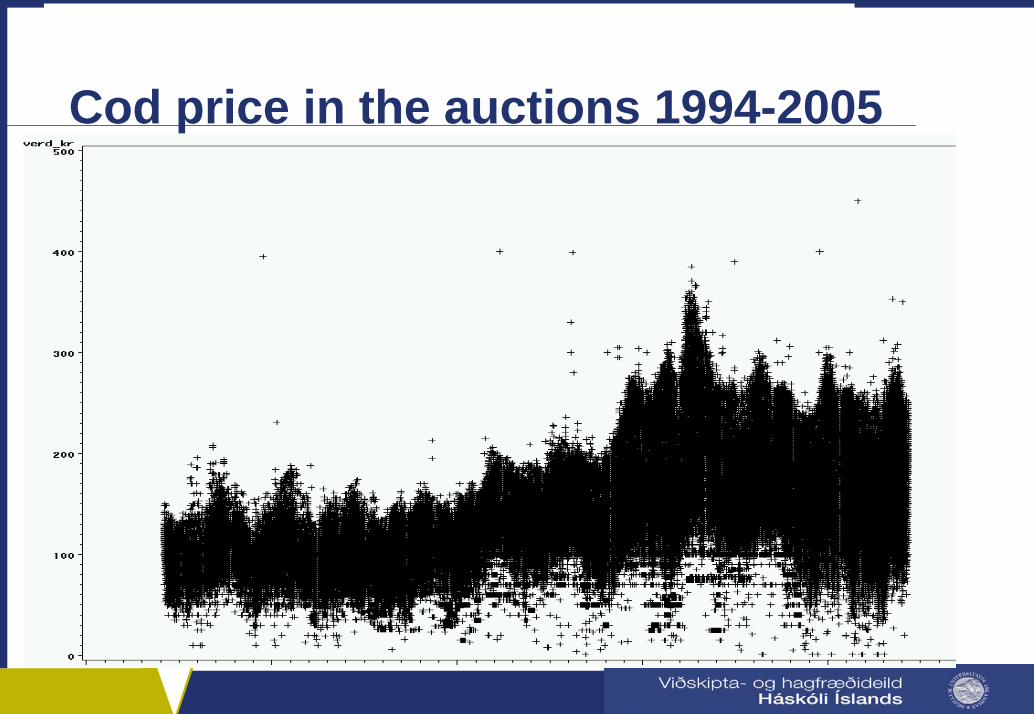
Cod price in the auctions 1994-2005
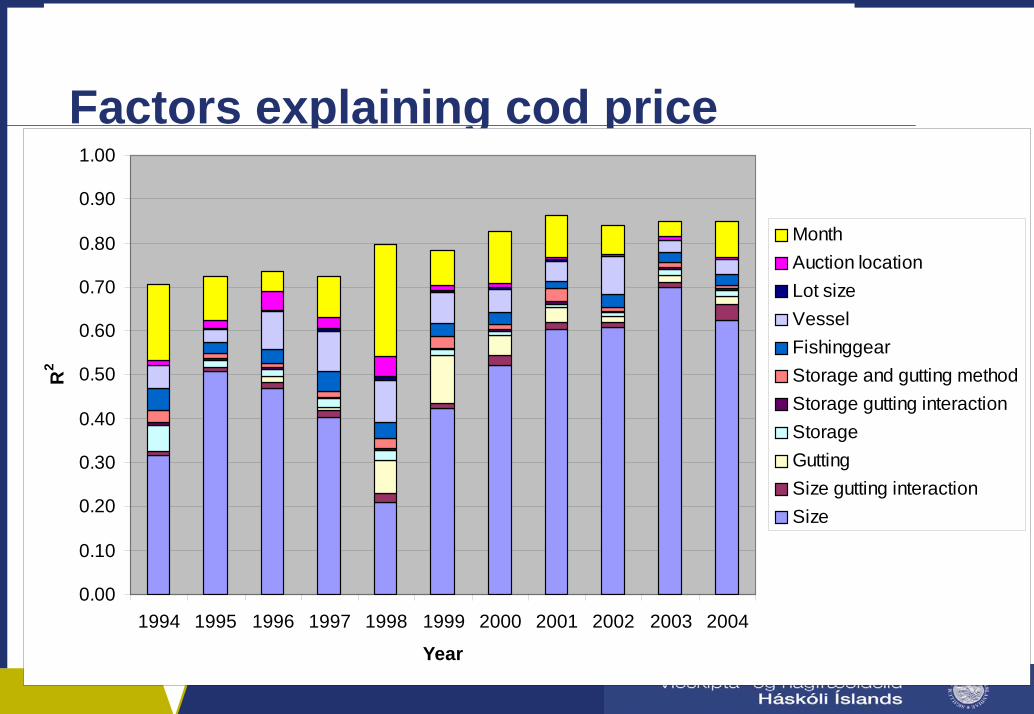
Factors explaining cod price
0.00
0.10
0.20
0.30
0.40
0.50
0.60
0.70
0.80
0.90
1.00
1994 1995 1996 1997 1998 1999 2000 2001 2002 2003 2004
Year
R2
MonthAuction locationLot sizeVesselFishinggearStorage and gutting methodStorage gutting interactionStorageGuttingSize gutting interactionSize
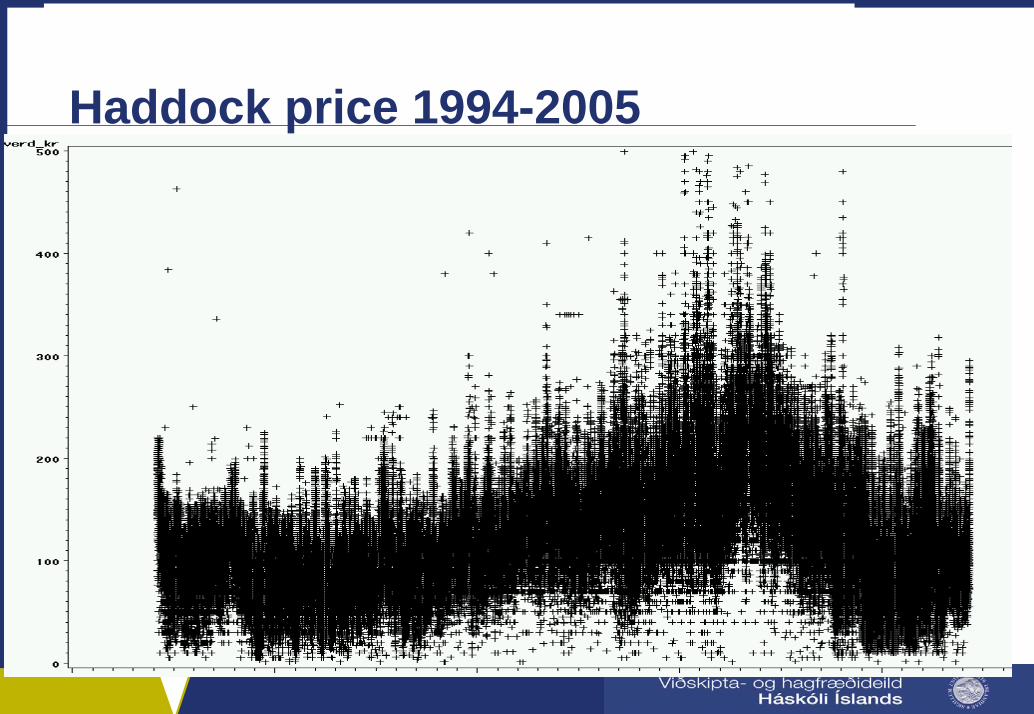
Haddock price 1994-2005
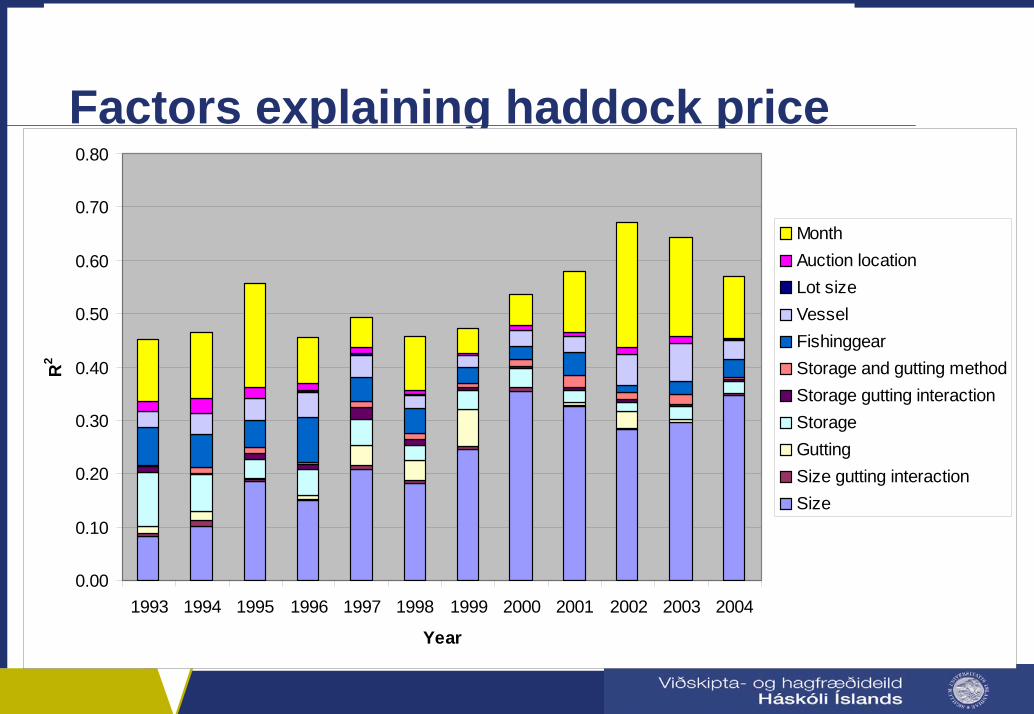
Factors explaining haddock price
0.00
0.10
0.20
0.30
0.40
0.50
0.60
0.70
0.80
1993 1994 1995 1996 1997 1998 1999 2000 2001 2002 2003 2004
Year
R2
MonthAuction locationLot sizeVesselFishinggearStorage and gutting methodStorage gutting interactionStorageGuttingSize gutting interactionSize
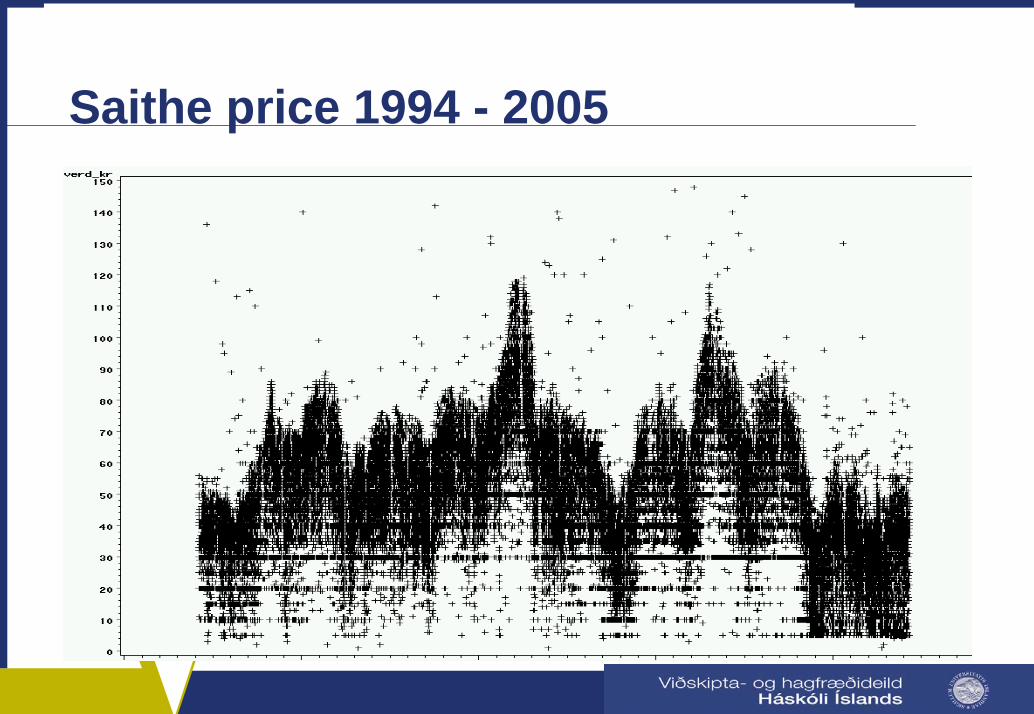
Saithe price 1994 - 2005
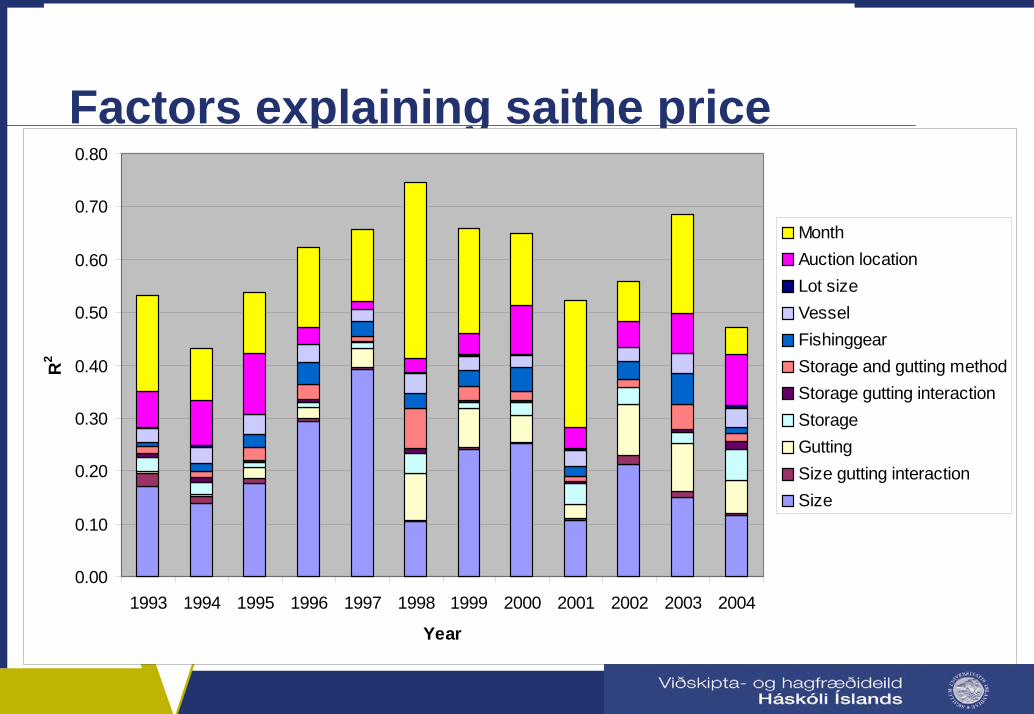
Factors explaining saithe price
0.00
0.10
0.20
0.30
0.40
0.50
0.60
0.70
0.80
1993 1994 1995 1996 1997 1998 1999 2000 2001 2002 2003 2004
Year
R2
MonthAuction locationLot sizeVesselFishinggearStorage and gutting methodStorage gutting interactionStorageGuttingSize gutting interactionSize
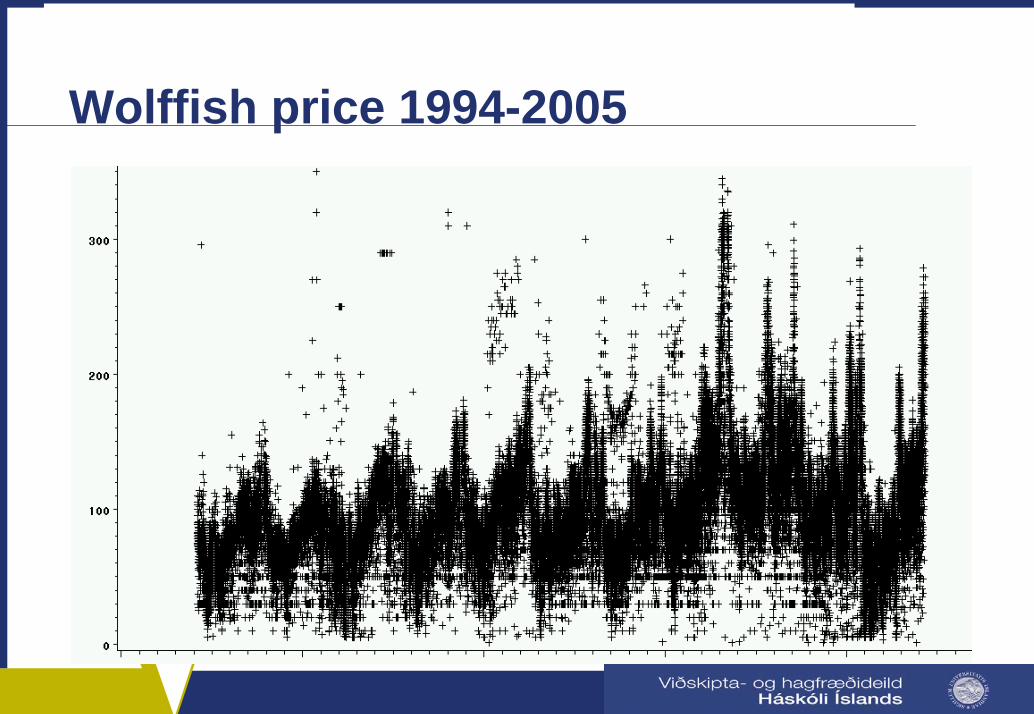
Wolffish price 1994-2005
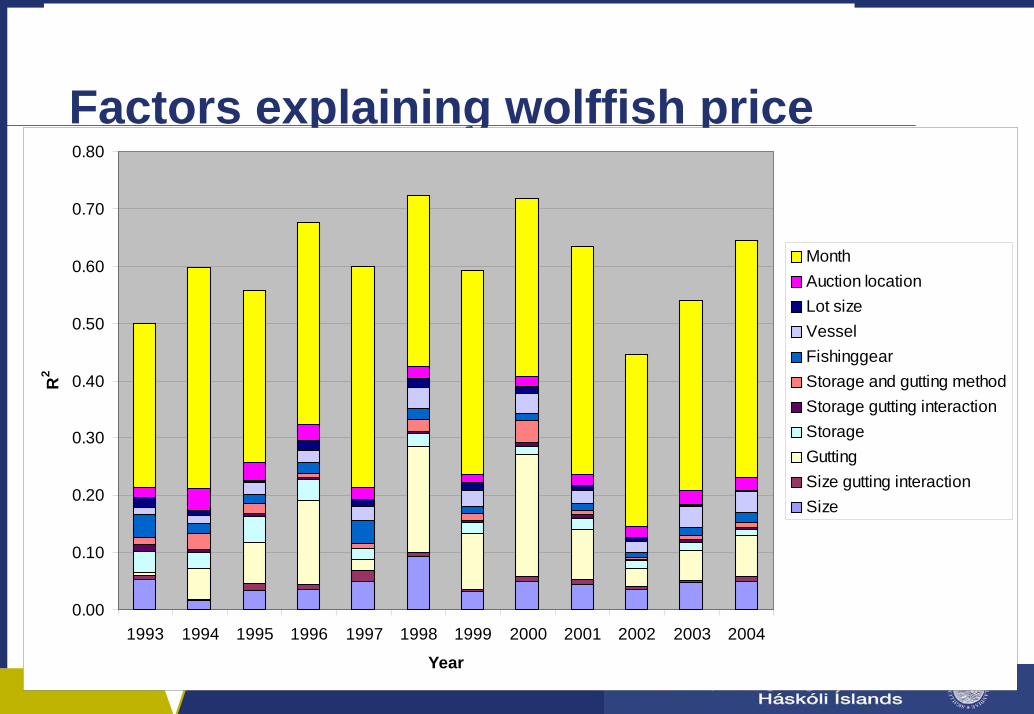
Factors explaining wolffish price
0.00
0.10
0.20
0.30
0.40
0.50
0.60
0.70
0.80
1993 1994 1995 1996 1997 1998 1999 2000 2001 2002 2003 2004
Year
R2
MonthAuction locationLot sizeVesselFishinggearStorage and gutting methodStorage gutting interactionStorageGuttingSize gutting interactionSize
Valuable attributes
Very high degree of explained price variation– attributes affect price
Size, gutting and month of the year most important– varying degree of importance of attributes
compared to seasonal patterns cod>haddock>saithe>wolffish
Indications of information asymmetry
Easily measured attributes most important– size, gutting, time of year
Storage less important than vessel numberVessel number maybe a personal guarantee of
quality => some information asymmetry– improvements in quality registration may
reduce unexplained varianceStill a small proportion left of unexplained variation
Types of attributes
Measurement cost
Con
trol
led
by
Low High
Nat
ure
Fish
erGutting/heading
Fresh-ness
Species
Size
Musclefirmness
Color offlesh
Indications of highgrading
The incentives is most definitely there
Development of the importance of size indicates an increased incentive for cod and haddock
We need to look more closely at data
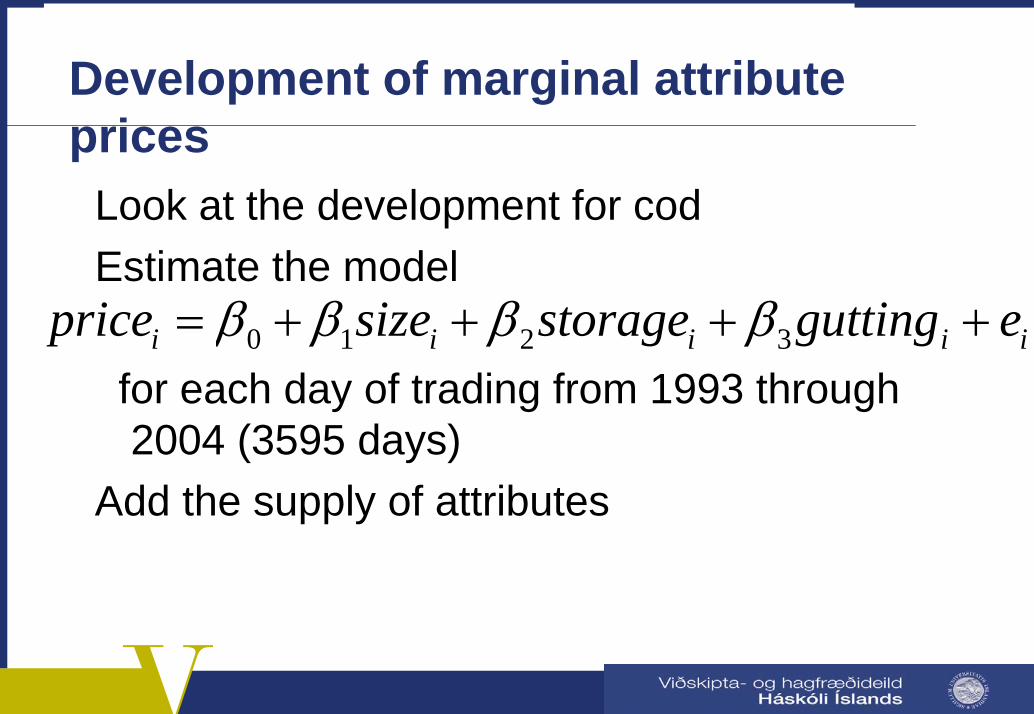
Development of marginal attribute prices
Look at the development for codEstimate the model
for each day of trading from 1993 through 2004 (3595 days)
Add the supply of attributes
0 1 2 3i i i i iprice size storage gutting eβ β β β= + + + +
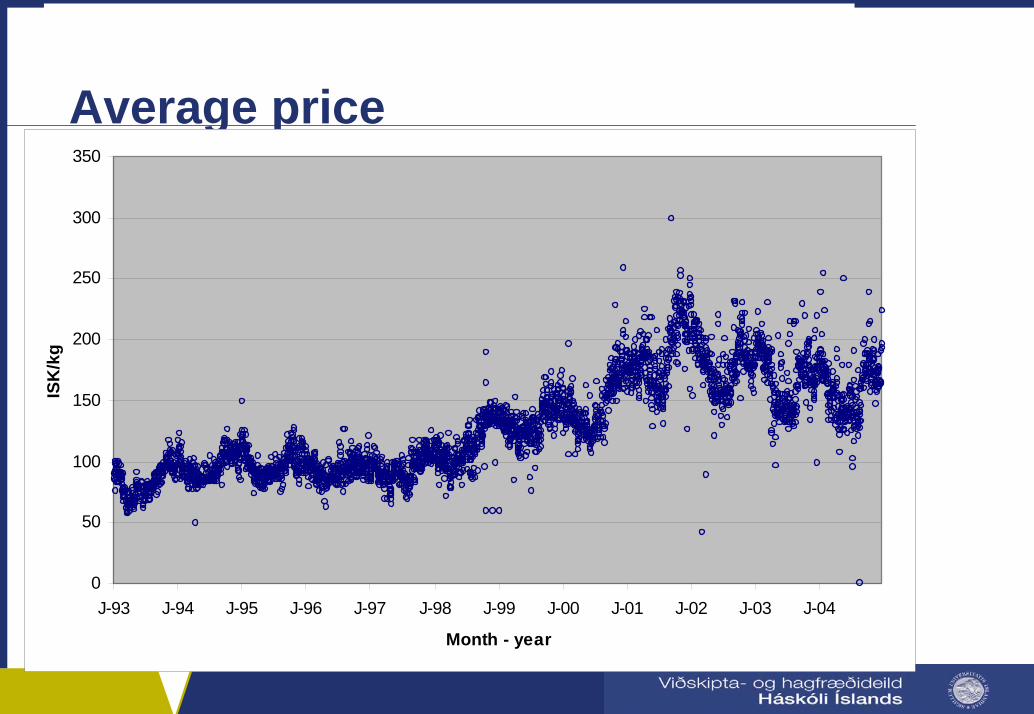
Average price
0
50
100
150
200
250
300
350
J-93 J-94 J-95 J-96 J-97 J-98 J-99 J-00 J-01 J-02 J-03 J-04
Month - year
ISK
/kg
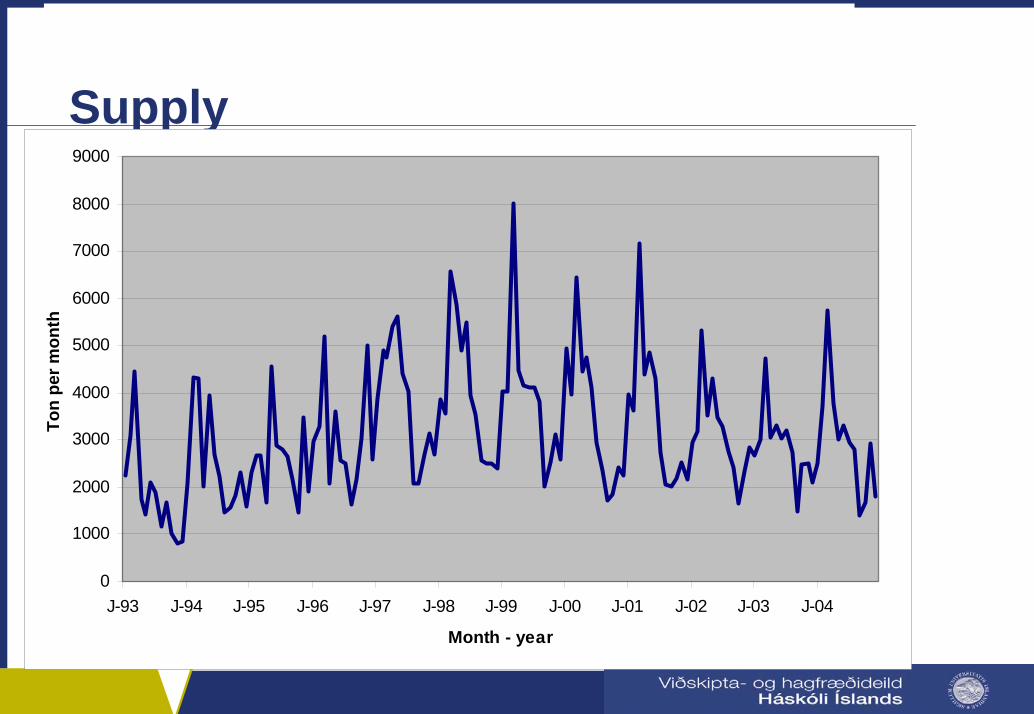
Supply
0
1000
2000
3000
4000
5000
6000
7000
8000
9000
J-93 J-94 J-95 J-96 J-97 J-98 J-99 J-00 J-01 J-02 J-03 J-04
Month - year
Ton
per m
onth
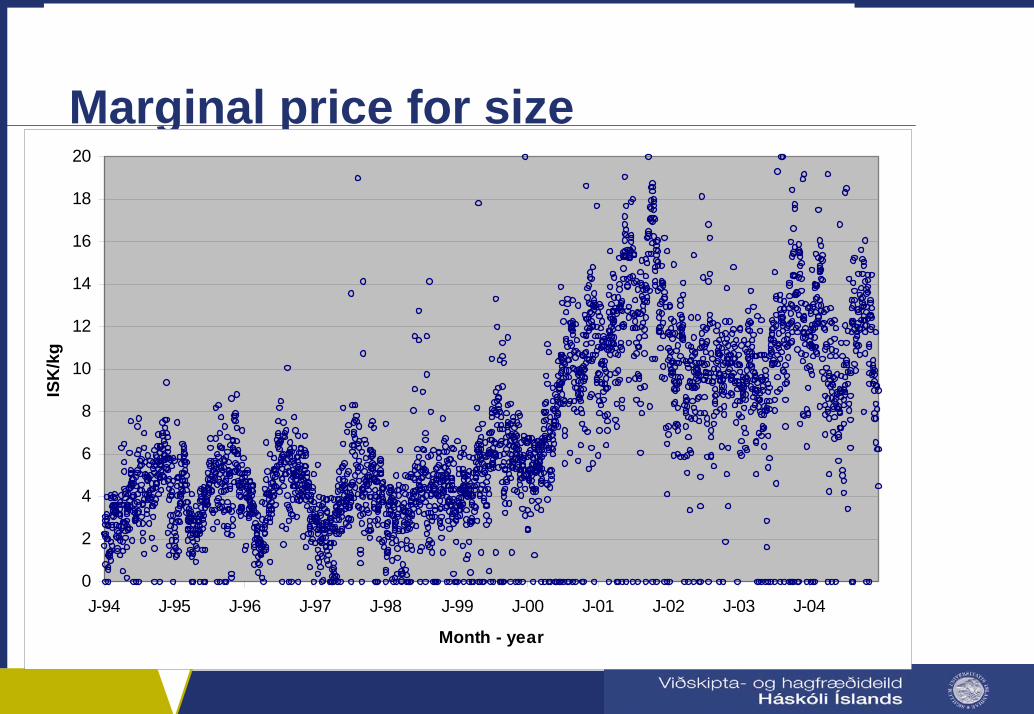
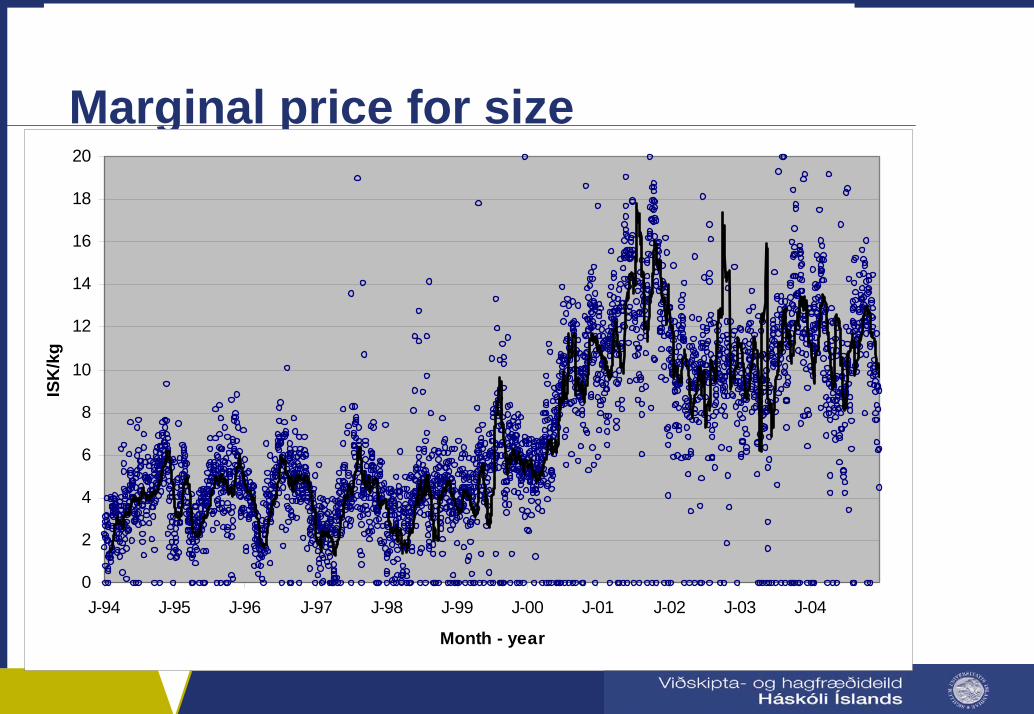
Marginal price for size
0
2
4
6
8
10
12
14
16
18
20
J-94 J-95 J-96 J-97 J-98 J-99 J-00 J-01 J-02 J-03 J-04
Month - year
ISK
/kg
Marginal price for size
0
2
4
6
8
10
12
14
16
18
20
J-94 J-95 J-96 J-97 J-98 J-99 J-00 J-01 J-02 J-03 J-04
Month - year
ISK
/kg
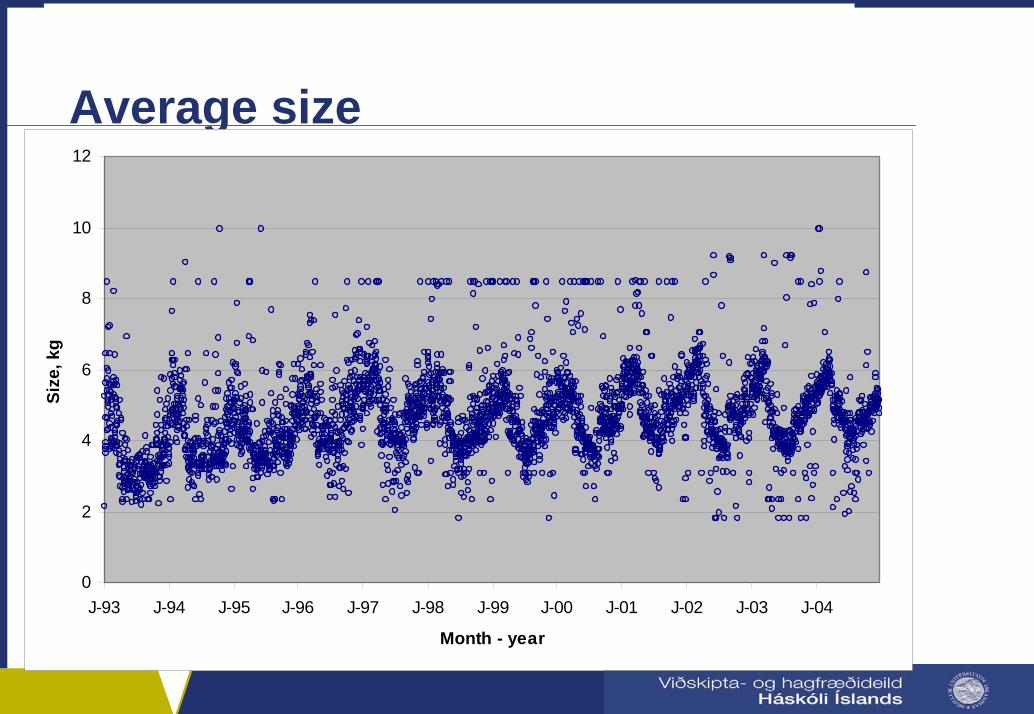
Average size
0
2
4
6
8
10
12
J-93 J-94 J-95 J-96 J-97 J-98 J-99 J-00 J-01 J-02 J-03 J-04
Month - year
Size
, kg
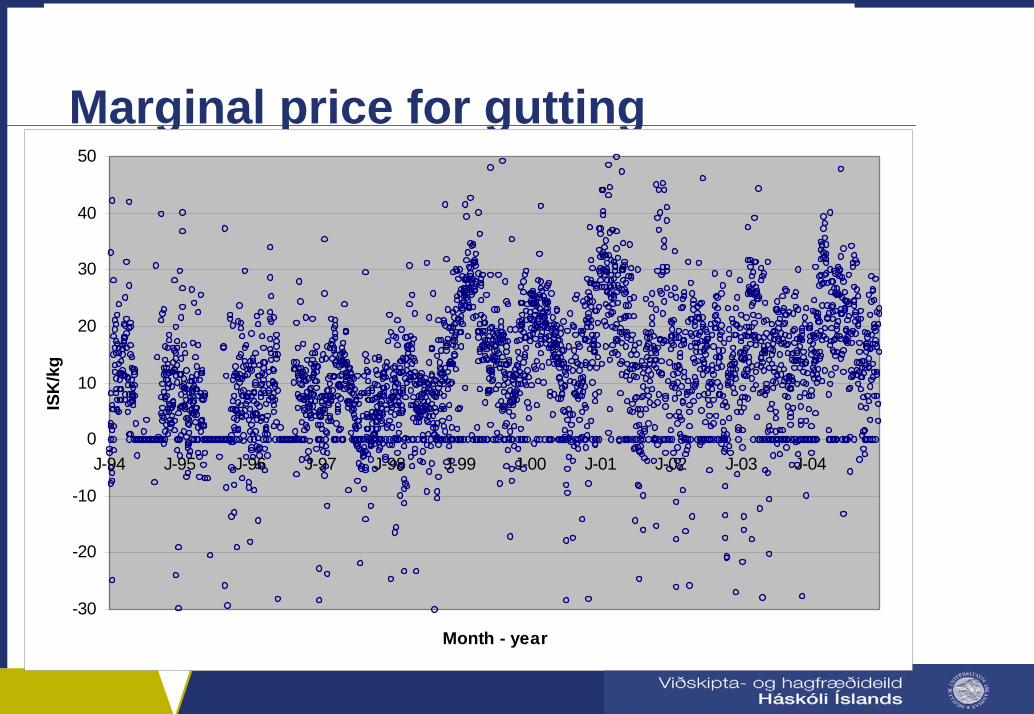
Marginal price for gutting
-30
-20
-10
0
10
20
30
40
50
J-94 J-95 J-96 J-97 J-98 J-99 J-00 J-01 J-02 J-03 J-04
Month - year
ISK
/kg
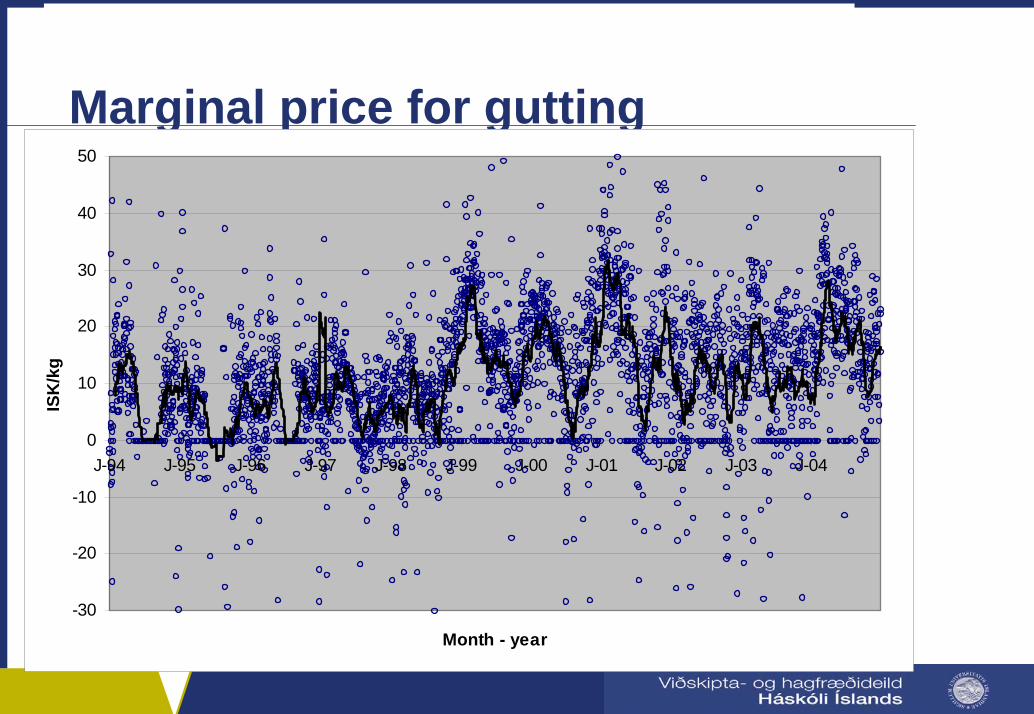
Marginal price for gutting
-30
-20
-10
0
10
20
30
40
50
J-94 J-95 J-96 J-97 J-98 J-99 J-00 J-01 J-02 J-03 J-04
Month - year
ISK
/kg
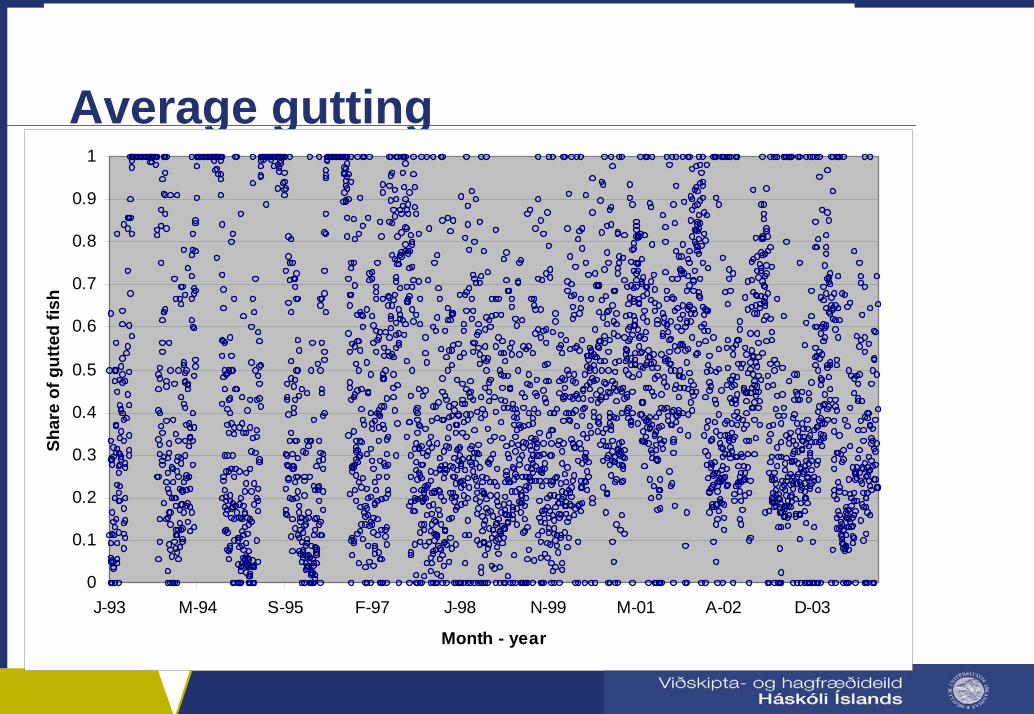
Average gutting
0
0.1
0.2
0.3
0.4
0.5
0.6
0.7
0.8
0.9
1
J-93 M-94 S-95 F-97 J-98 N-99 M-01 A-02 D-03
Month - year
Shar
e of
gut
ted
fish
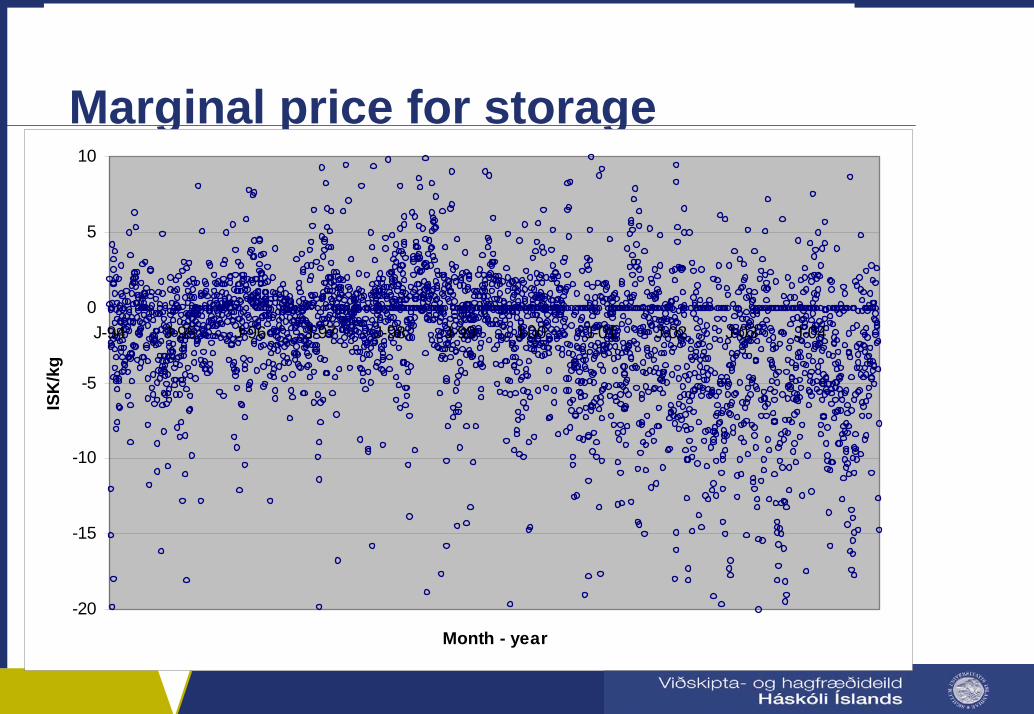
Marginal price for storage
-20
-15
-10
-5
0
5
10
J-94 J-95 J-96 J-97 J-98 J-99 J-00 J-01 J-02 J-03 J-04
Month - year
ISK
/kg
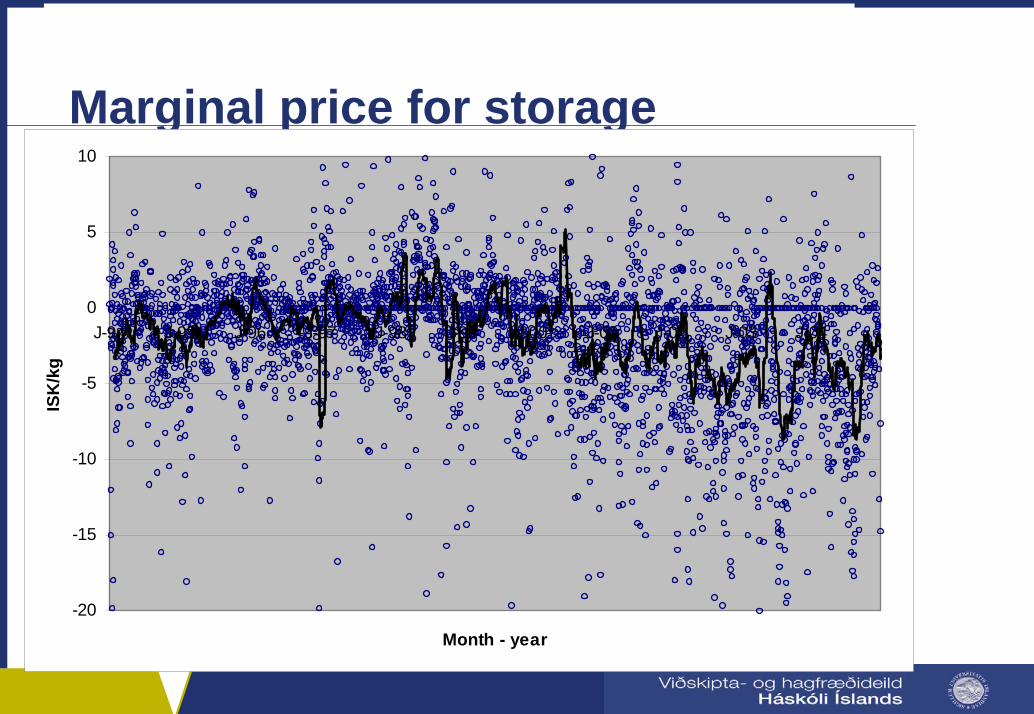
Marginal price for storage
-20
-15
-10
-5
0
5
10
J-94 J-95 J-96 J-97 J-98 J-99 J-00 J-01 J-02 J-03 J-04
Month - year
ISK
/kg
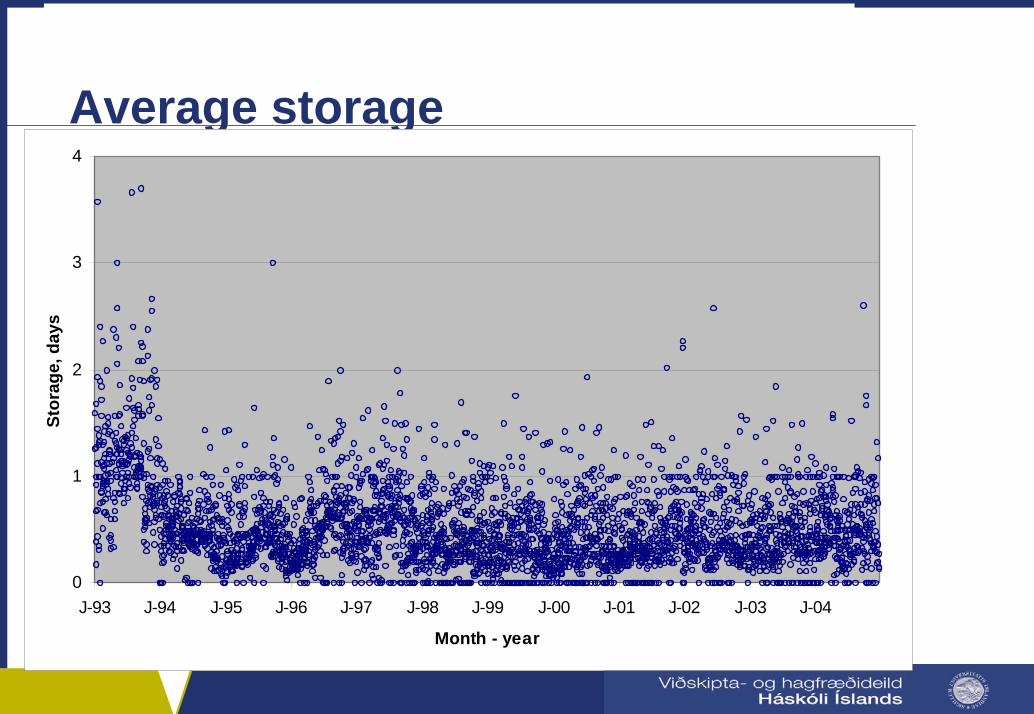
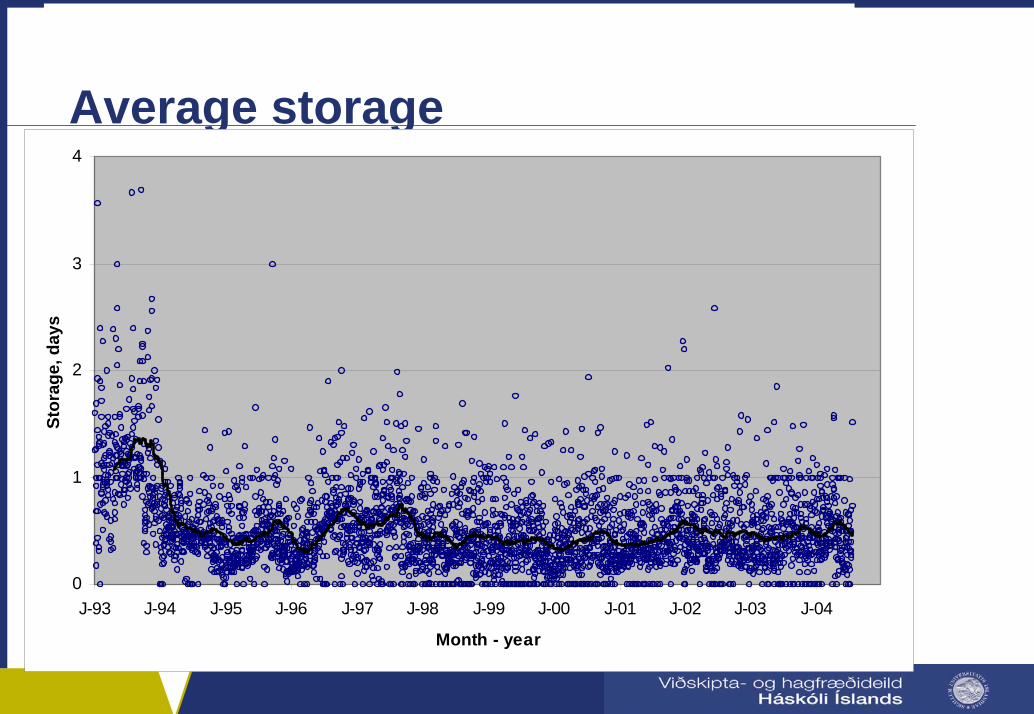
Average storage
0
1
2
3
4
J-93 J-94 J-95 J-96 J-97 J-98 J-99 J-00 J-01 J-02 J-03 J-04
Month - year
Stor
age,
day
s
Average storage
0
1
2
3
4
J-93 J-94 J-95 J-96 J-97 J-98 J-99 J-00 J-01 J-02 J-03 J-04
Month - year
Stor
age,
day
s
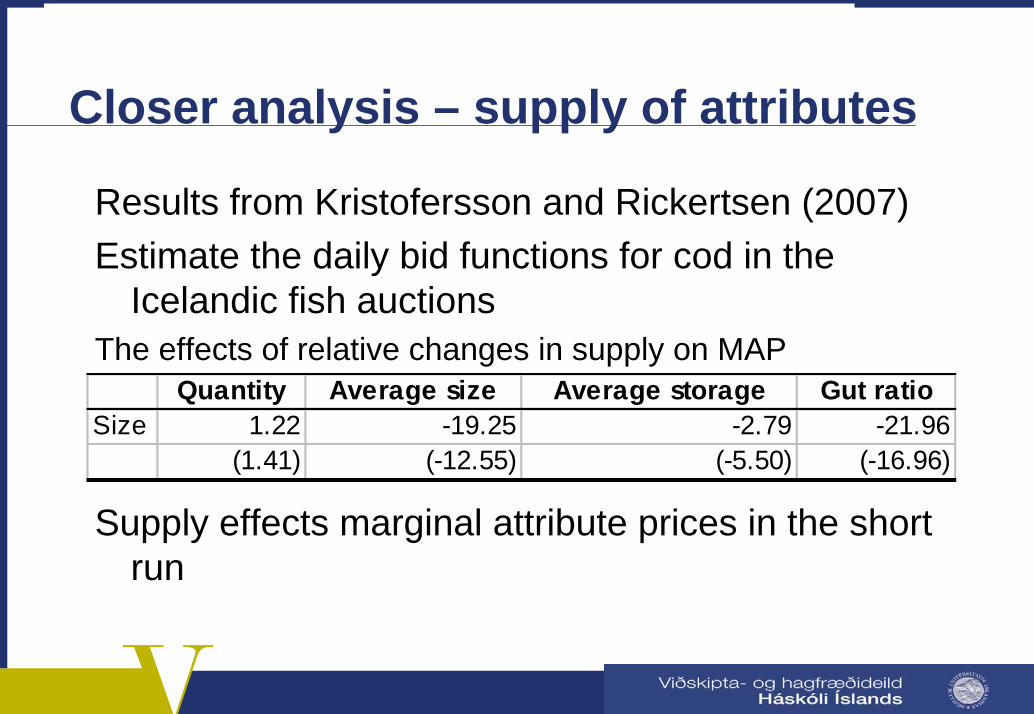
Closer analysis – supply of attributes
Results from Kristofersson and Rickertsen (2007)Estimate the daily bid functions for cod in the
Icelandic fish auctionsThe effects of relative changes in supply on MAP
Supply effects marginal attribute prices in the short run
Quantity Average size Average storage Gut ratioSize 1.22 -19.25 -2.79 -21.96
(1.41) (-12.55) (-5.50) (-16.96)
Closer analysis - highgrading
Results from Kristofersson and Rickertsen (in review)
Estimate the upper limit of discards under the hypothesis that fishing technology is completely inflexible with respect to size
Test for price induces highgrading and simulate discard rates
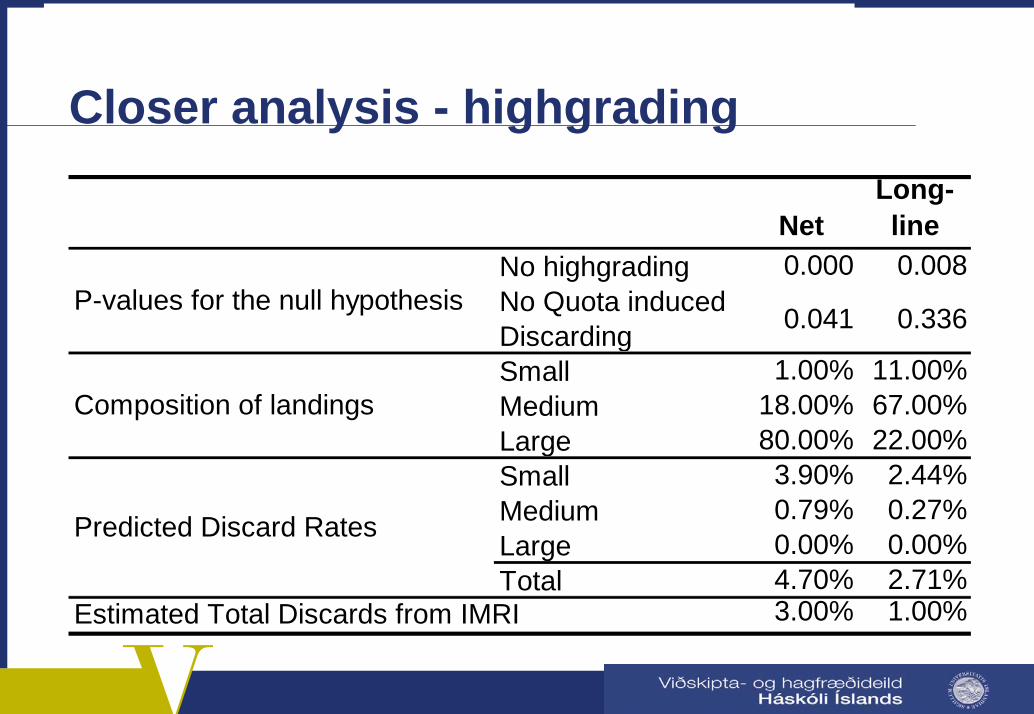
Closer analysis - highgrading
NetLong-line
No highgrading 0.000 0.008No Quota induced Discarding 0.041 0.336
Small 1.00% 11.00%Medium 18.00% 67.00%Large 80.00% 22.00%Small 3.90% 2.44%Medium 0.79% 0.27%Large 0.00% 0.00%Total 4.70% 2.71%
3.00% 1.00%
Composition of landings
Predicted Discard Rates
P-values for the null hypothesis
Estimated Total Discards from IMRI
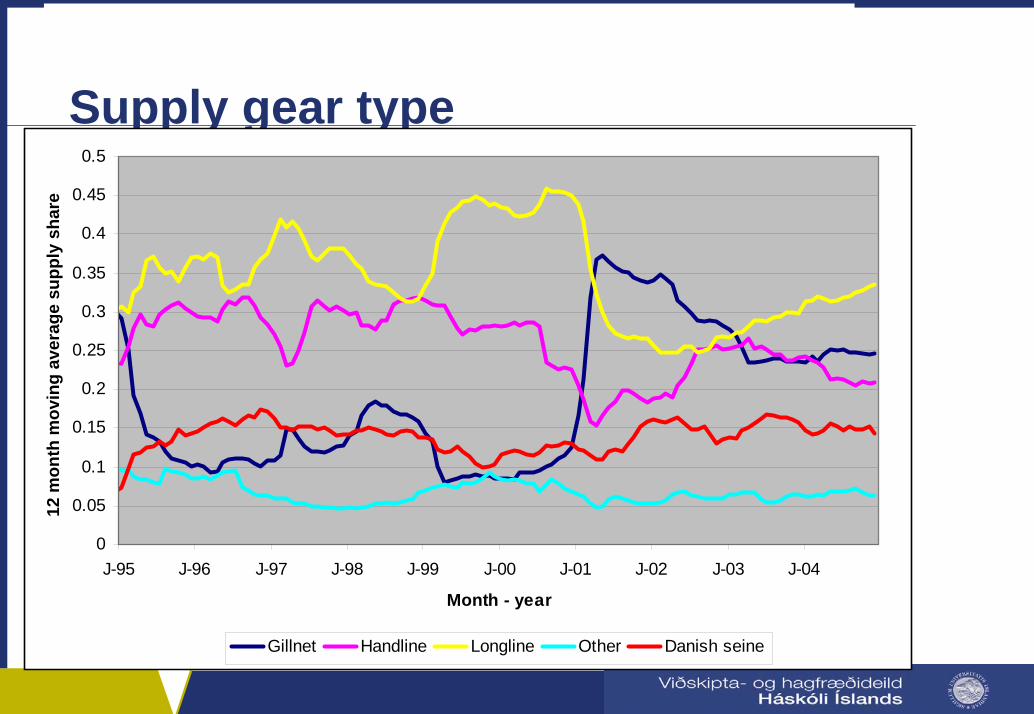
Supply gear type
0
0.05
0.1
0.15
0.2
0.25
0.3
0.35
0.4
0.45
0.5
J-95 J-96 J-97 J-98 J-99 J-00 J-01 J-02 J-03 J-04
Month - year
12 m
onth
mov
ing
aver
age
supp
ly s
hare
Gillnet Handline Longline Other Danish seine
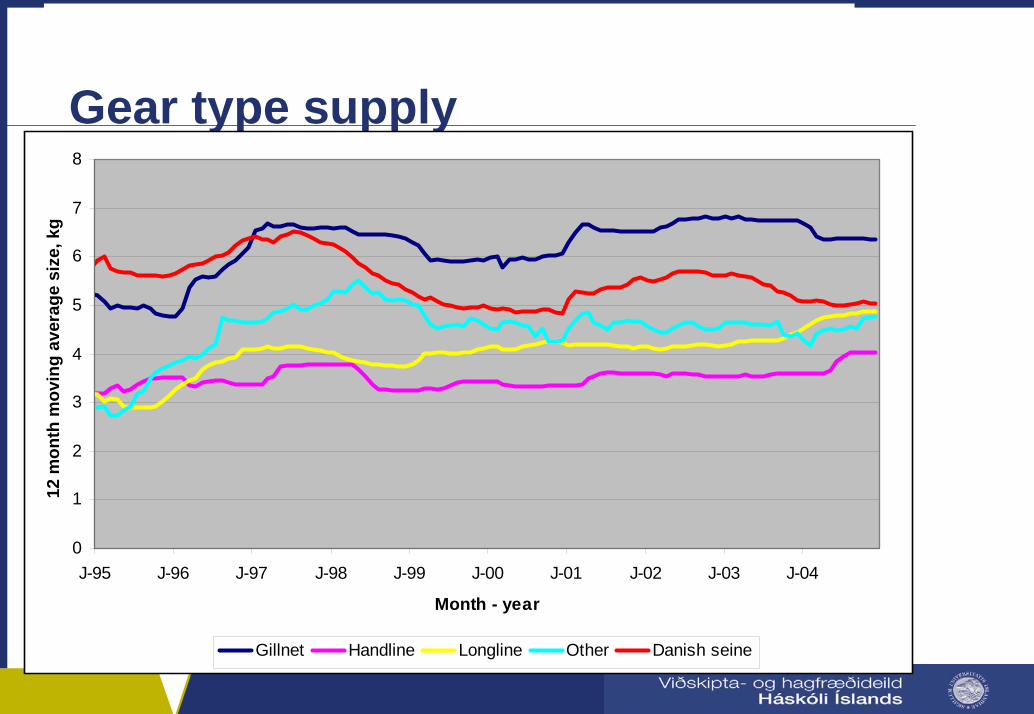
Gear type supply
0
1
2
3
4
5
6
7
8
J-95 J-96 J-97 J-98 J-99 J-00 J-01 J-02 J-03 J-04
Month - year
12 m
onth
mov
ing
aver
age
size
, kg
Gillnet Handline Longline Other Danish seine
Indications
Development of average storage indicates increased focus on freshness–not consistent with a market for
lemonsVessel and seasonal effect indicates
that information system can be improved
IndicationsSize effect clear
–seasonal supply–affected by supply
A clear incentive and some evidence of it having an effect on average sizes–some highgrading–some change in catch composition
Conclusions
Large variability in the price of fishMost of the variability can be explained by
information on fish and fishing season– Price mostly affected by easily
measurable attributes– Limited evidence for information
asymmetry
ConclusionsLarge incentives to highgrade or target large cod
and haddock– Some evidence that fishermen have
responded to these incentives• some highgrading• some targeting
The fish auctions are a well functioning market system for a very heterogeneous product
…but there is room for improvement

The End


![12 Studies Op. 60. [Op. 60] - Free-scores.com · FERNANDO SOR 12 STUDIES FOR GUITAR Op. 60 THE GUITAR SCHOOL - ICELAND . &](https://img.pdfslide.us/doc/110x75/60b83205df371646584f5f00/12-studies-op-60-op-60-free-fernando-sor-12-studies-for-guitar-op-60-the.jpg)