Embed Size (px)
Citation preview
University of Groningen
Rhegmatogenous retinal detachmentvan de Put, Mathijs
IMPORTANT NOTE: You are advised to consult the publisher's version (publisher's PDF) if you wish to cite fromit. Please check the document version below.
Document VersionPublisher's PDF, also known as Version of record
Publication date:2014
Link to publication in University of Groningen/UMCG research database
Citation for published version (APA):van de Put, M. (2014). Rhegmatogenous retinal detachment: incidence, risk factors, postoperative recovery& vision related quality of life [S.l.]: [S.n.]
CopyrightOther than for strictly personal use, it is not permitted to download or to forward/distribute the text or part of it without the consent of theauthor(s) and/or copyright holder(s), unless the work is under an open content license (like Creative Commons).
Take-down policyIf you believe that this document breaches copyright please contact us providing details, and we will remove access to the work immediatelyand investigate your claim.
Downloaded from the University of Groningen/UMCG research database (Pure): http://www.rug.nl/research/portal. For technical reasons thenumber of authors shown on this cover page is limited to 10 maximum.
Download date: 01-07-2018
Chapter 6
Postoperative vision-related quality of life in
macula-off rhegmatogenous retinal detachment
and its relation to visual function
Submitted
Mathijs A.J. van de Put¹,2, Lisette Hoeksema¹,2, Wouter Wanders¹,
Ilja M. Nolte3, Johanna M.M. Hooymans1,2, Leonoor I. Los1,2
1 Department of Ophthalmology, University of Groningen, University Medical Center Groningen, Groningen, the Netherlands.
2 W.J. Kolff Institute, Graduate School of Medical Sciences, University of Groningen, Groningen, the Netherlands.3 Department of Epidemiology, University of Groningen, University Medical
Center Groningen, Groningen, the Netherlands.
VandePut.indd 93 4-11-2014 14:15:52
94 | Chapter 6
ABSTRACT
Objective: To determine the vision-related quality of life (VR-QOL) after surgery for macula-off
rhegmatogenous retinal detachment (RRD) in relation to visual acuity, contrast acuity, and color
vision.
Methods: In a prospective observational study, we included 55 patients with a macula-off RRD.
Best corrected visual acuity (BCVA), color vision (color confusion indices (CCI) saturé and desaturé)
and contrast acuity were measured at 12 months postoperatively in both the RRD eye and the
fellow control eye, and the 25-item National Eye Institute Visual Function Questionnaire (NEI
VFQ-25) was filled out.
Results: Operated and fellow control eyes differed significantly in mean LogMAR BCVA
(P < 0.0001), median Log contrast acuity (P < 0.0001), saturated CCI (P = 0.009), and desaturated
CCI (P = 0.016). Significant correlations were observed between the NEI VFQ-25 overall composite
score and postoperative LogMAR BCVA (R = -0.551, P < 0.0001), contrast acuity (R = 0.472,
P < 0.0001), saturated CCI (R = -0.315, P = 0.023), and desaturated CCI (R = -0.283, P = 0.044).
Conclusions: A lower VR-QOL was highly correlated to a worse postoperative BCVA and contrast
acuity and to a lesser extent to color vision disturbances.
VandePut.indd 94 4-11-2014 14:15:52
6
Postoperative vision related quality of life 95
INTRODUCTION
Rhegmatogenous retinal detachment (RRD), which refers to a detachment of the neurosensory
retina from the underlying retinal pigment epithelium due to a defect in the retina,[1] occurs with
an incidence of 18.2/100,000 people/year in the Netherlands.[2] With surgical intervention, the
detached neuroretina can be reattached to the retinal pigment epithelium in more than 95% of
cases.[3-5] In spite of this high anatomic success rate, functional recovery is often compromised,[6-12]
especially when the macula was detached during the RRD, which happens in about 50% of cases. [2]
Not only best corrected visual acuity (BCVA) is compromised in these cases, other aspects of
central visual function are also compromised after macula-off RRD.[11,13-14] Two modifiable factors
are crucial in the recovery of visual function in these cases.[4,8,15-17] One is the pre-operative duration
of the macular detachment (i.e. a longer duration will result in a lower visual acuity (VA), and
a worse recovery of color vision),[4,8,17] and the preoperative height of the macular detachment
(i.e. an increase in height will result in a lower postoperative BCVA).[15-17] Non-modifiable
factors influencing the postoperative recovery of visual function include age, refractive error, and
preoperative VA.[4,14]
Previous studies identified a strong relation between postoperative visual function and post-
operative vision-related quality of life (VR-QOL) as measured by the National Eye Institute Visual
Functioning Questionnaire-25 (NEI VFQ-25) in patients operated on for various vitreoretinal
disorders, including RRD.[18-25] The NEI VFQ-25 ocular composite score and subscores are further
explained in the Methods. Zou et al. showed that postoperative quality of life is worse in macula-
off compared to macula-on RRD.[18] In Okamoto’s study, postoperative BCVA differed significantly
between macula-on and macula-off RRD, while scores on the NEI VFQ-25 were similar in both
groups of patients.[20] Surprisingly, that study indicated that a worse post-operative contrast acuity
was related to a lower score on the NEI VFQ-25 questionnaire, whereas a low post-operative VA
was not.[20]
We could not find previous studies addressing post-operative quality of life specifically in macula-
off RRD patients in relation to BCVA, contrast acuity and color vision. Therefore, the purpose of
the present study is to determine the postoperative VR-QOL after macula-off RRD one year after
successful reattachment of the retina, and to assess which aspects of postoperative visual function
(VA, contrast acuity, or color vision) are most closely related herewith. In addition, we evaluated
whether pre-operative, intra-operative, and postoperative factors are associated with a difference in
postoperative VR-QOL.
VandePut.indd 95 4-11-2014 14:15:52
96 | Chapter 6
METHODS
Study design
We conducted a prospective observational study in patients with a first presentation of macula-off
RRD who had an attached retina at 12 months after the first surgical procedure. Reattachment
was obtained by one or more surgical procedures. The research protocol was approved by the
University Medical Center Groningen (UMCG) review board ethics committee, and was carried
out in accordance with the tenets of the declaration of Helsinki. The study was registered with the
Dutch Trial Register (NTR839). All patients were operated on at the ophthalmology department
of the UMCG. The study was carried out over a three-year period (February 1, 2007 - February 1,
2010).
Study population
Adult patients visiting the ophthalmology department of the UMCG with a first presentation of
unilateral macula-off RRD of 24 hours to 6 weeks duration were invited to participate in this
study. Included in the study were patients of 18 years and older who had given their written
informed consent. Patients had to be able to pinpoint their drop in VA to a specific 24-hour period
in case of a 24-hour to 1 week macular detachment, and to a period of less than one week in case
of a macular detachment of one to six weeks. The cut-off point of ≤ 1 week or > 1 week is conform
the available literature.[11,13] Patients with macular detachment of more than 6 weeks duration were
excluded, because they are considered rare, and yield a worse prognosis.[9] Surgery was performed
within 24-72 hours after presentation at the ophthalmology department. Excluded were patients
with a history of congenital or acquired pathology with an effect on visual function in one or both
eyes (with the exception of congenital defects in color vision), or pathology observed at presentation
after their macula-off RRD that could influence post-operative VA.
Preoperative measurements
We acquired the following patients’ characteristics: age, gender, affected eye, ophthalmic history
and family history for RRD. In addition, we scored the number of retinal quadrants detached at
presentation, and the presence, and grade of PVR.[26] Using standardised protocols, the refractive
error and BCVA using the Early Treatment of Diabetic Retinopathy Study (ETDRS) chart were
determined in the affected and fellow control eye.[27] All VA measurements were converted to
logMAR equivalents of ETDRS acuity for analysis. Light perception or hand movements were
coded as logMAR VA of 3.0.
Duration and height of macular detachment were determined using the following scoring system.
Macula-off RRDs of less than one week duration were scored per day, and of more than one week
duration they were scored as 11 days (1-2 weeks duration), 18 days (2-3 weeks duration), 25 days
(3-4 weeks duration), 32 days (4-5 weeks duration), and 39 days (5-6 weeks duration), respectively.
VandePut.indd 96 4-11-2014 14:15:52
6
Postoperative vision related quality of life 97
To measure the height of the detachment at the position of the central macula by ultrasonography,
the relative positions of the central macula and the optic nerve head were determined before
performing ultrasonography. For this purpose, digital fundus photographs of both eyes were
made using the TRC-50 IX fundus camera (Topcon 9B ltd. UK). On both fundus photographs,
the distance between the optic nerve head and fovea was measured using the software package
IMAGEnet2000 2.53. The measured distance in the affected eye was used to determine the central
position of the macula and at this position the height of the macular detachment was measured by
ultrasonography. In those cases (i.e. bullous retinal detachment), in which the measurement of the
distance between the macula and optic nerve head could not be performed on the photograph of
the affected eye, the measurement of this distance in the fellow eye was used.[28] In each patient, two
measurements were made with the patient in an upright position (as this represents the position
most patients would have taken for most of the time before presentation during the day) and the
average of both measurements was used for further analysis.
Surgical procedure (intraoperative data)
Based on clinical presentation, patients were either operated on by an external procedure (i.e.
encircling band and / or buckle) or by 20 Gauge TPPV (with or without an encircling band). In
TPPV cases, either a short acting tamponade (i.e. sulphur hexafluoride gas (SF6)) or a long acting
tamponade (i.e. octafluorpropane (C3F8) or silicone oil) was used. Collected data refer to the first
surgical procedure in all cases.
Postoperative measurements
Visual function
At 12 months postoperatively, we measured BCVA using the ETDRS chart,[27] contrast acuity
using the Pelli Robson chart,[29] Farnsworth D-15 saturated, and Lanthoni desaturated color
confusion indexes (CCI).[30] All measurements were done in the affected and fellow control eye.
Information on postoperative success (i.e. primary or secondary) was acquired. Also, the number of
surgical procedures needed to obtain an attached retina, were recorded.
Quality of life
At 12 months postoperatively, patients were requested to self-administer the validated Dutch
version[25] of the NEI VFQ-25 to assess their VR-QOL.[21-25] This questionnaire has been developed
by the research and development corporation (RAND), and funded by the NEI. The NEI VFQ-25
comprises 25 items that require the patient to assess the influence of visual disability and visual
symptoms on generic health domains such as emotional well-being and social functioning, in
addition to task-oriented domains related to daily visual functioning. Each item is assigned to
one of the following twelve subscales: general health, general vision, ocular pain, near activities,
VandePut.indd 97 4-11-2014 14:15:52
98 | Chapter 6
distance activities, vision specific social functioning, vision specific mental health, vision specific
role difficulties, vision specific dependency, driving, color vision, and peripheral vision.[21-25] Each
subscale consists of a minimum of one and a maximum of four items. We used the standard
algorithm to calculate the scale scores. The subscales are 0 to 100 points, where 100 indicates the
highest possible function or minimal subjective impairment. The NEI VFQ-25 overall composite
score (OCS) is calculated as the unweighted average response to all items, excluding the question
on general health.
Cataract
Because of an increased risk of cataract development after TPPV, which may influence postoperative
measurements, we scored the level of cataract using the lens opacities classification system III
(LOCS III) in both eyes at pre-determined post-operative intervals.[31] In addition, BCVA was
assessed at those time points, and in case of a visually significant cataract (n = 26 eyes) a cataract
extraction was performed before the 12 months measurement.
Statistical analyses
Data were analysed using SPSS software package, version 16.0 (Chicago, Illinois, USA). A one-
tailed paired Student’s t-test (we expect worse visual function in the operated eye) or Wilcoxon
signed rank test was used to explore statistical differences in visual function parameters between
operated and fellow control eyes depending on the distribution of the variable. Spearman’s
correlation coefficients were calculated to explore significant correlations between the different
postoperative visual function parameters. The relationships between age, preoperative factors,
postoperative visual function tests (LogMAR VA, Log contrast acuity, saturated and desaturated
CCI) and the NEI VFQ-25 scores were examined using Spearman’s correlation coefficients. To
determine differences in NEI VFQ-25 OCS and subscores in subgroups we used a Mann-Whitney
U test in case of two groups or a Kruskal-Wallis test in case of more than two groups. In the latter
case post-hoc analyses were performed for pairwise comparisons between subgroups.
All tests were considered statistically significant at a p-value of less than 0.05, except for the
Kruskal-Wallis post-hoc analysis, for which a significance threshold of 0.05 divided by the number
of groups was used.
VandePut.indd 98 4-11-2014 14:15:52
6
Postoperative vision related quality of life 99
RESULTS
Study characteristics
RRD-study
A total of 56 patients gave their written informed consent and were included. In 46 patients
retinal re-attachment was obtained after one surgical procedure, whereas ten patients had one or
more re-detachments. One patient died during the study period and was therefore excluded from
analysis. In all remaining 55 patients, the retina was still surgically attached twelve months after
the initial surgical procedure. Missing data further consisted of: visual function tests at 12 months
(n=1), saturated (n=2) and desaturated (n=3) CCI, because of color blindness (n=2) and unknown
reasons (n=1).
Table 1 summarizes the preoperative data on general patient characteristics and type of surgery.
Briefly, the mean age was 60.4 years, more male than female patients were included (2.7:1),
right and left eyes were equally involved, and most eyes were phakic (67.3%). A TPPV was most
frequently chosen as the primary surgical procedure (n=45 (81.8%)). This was combined with an
encircling band in about half the cases (n=27). Data on refractive error could reliably be obtained
in phakic eyes (n=37). In pseudophakic patients, data on refractive error prior to cataract extraction
were not available in 18 eyes. These were coded as missing data. In case of known refractive error,
no significant associations with visual function or NEI VFQ-25 scores were observed.
Table 1: Preoperative patient characteristics, lens status, and type of surgery
Characteristics Number (%) Mean age ± SD Scleral buckling / TPPV (%)Total 55 (100.0) 60.4 ± 11.2 10 (18.2) / 45 (81.8)Male 40 (72.7) 61.4 ± 9.8 5 (12.5) / 35 (87.5)Female 15 (27.3) 57.8 ± 14.4 5 (33.3) / 10 (66.7)Phakic 37 (67.3) 59.5 ± 8.3 10 (27.0) / 27 (73.0)Pseudophakic 18 (32.7) 62.2 ± 15.8 0 (0.0) / 18 (100.0)SD: Standard deviation, TPPV: Trans pars plana vitrectomy.
Postoperative BCVA, Log contrast acuity, saturated and desaturated CCI in operated eyes were
significantly worse than in fellow control eyes (Table 2). We observed high correlations between
postoperative LogMAR BCVA, log contrast acuity, saturated, and desaturated CCI’s (Table 3).
VandePut.indd 99 4-11-2014 14:15:53
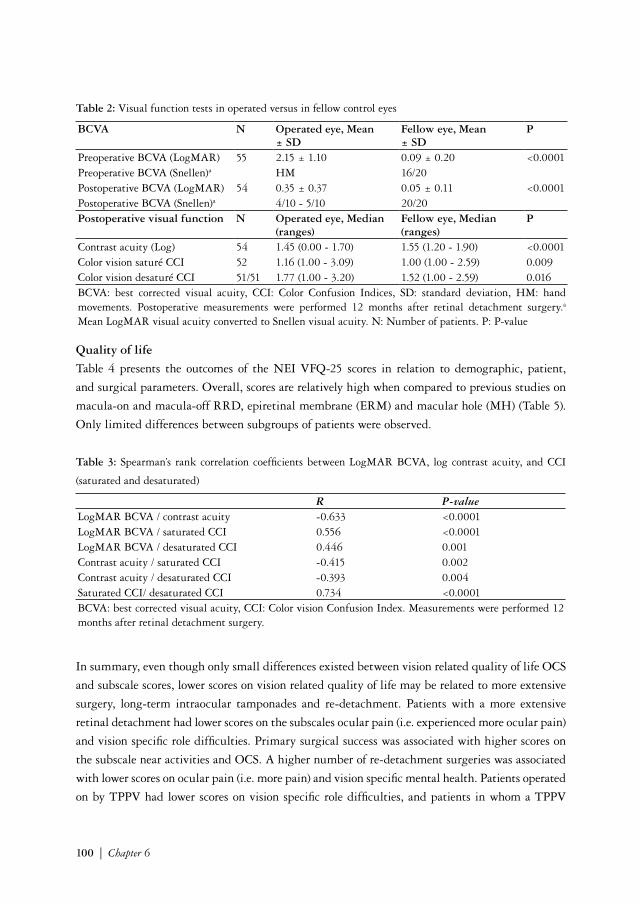
100 | Chapter 6
Table 2: Visual function tests in operated versus in fellow control eyes
BCVA N Operated eye, Mean ± SD
Fellow eye, Mean ± SD
P
Preoperative BCVA (LogMAR) 55 2.15 ± 1.10 0.09 ± 0.20 <0.0001Preoperative BCVA (Snellen)a HM 16/20Postoperative BCVA (LogMAR) 54 0.35 ± 0.37 0.05 ± 0.11 <0.0001Postoperative BCVA (Snellen)a 4/10 - 5/10 20/20Postoperative visual function N Operated eye, Median
(ranges)Fellow eye, Median (ranges)
P
Contrast acuity (Log) 54 1.45 (0.00 - 1.70) 1.55 (1.20 - 1.90) <0.0001Color vision saturé CCI 52 1.16 (1.00 - 3.09) 1.00 (1.00 - 2.59) 0.009Color vision desaturé CCI 51/51 1.77 (1.00 - 3.20) 1.52 (1.00 - 2.59) 0.016BCVA: best corrected visual acuity, CCI: Color Confusion Indices, SD: standard deviation, HM: hand movements. Postoperative measurements were performed 12 months after retinal detachment surgery.a Mean LogMAR visual acuity converted to Snellen visual acuity. N: Number of patients. P: P-value
Quality of life
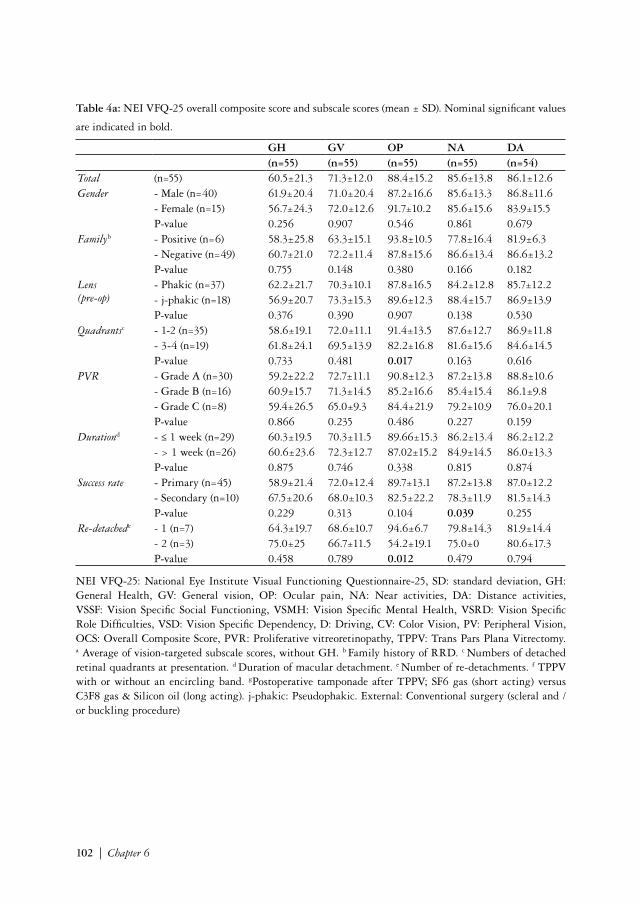
Table 4 presents the outcomes of the NEI VFQ-25 scores in relation to demographic, patient,
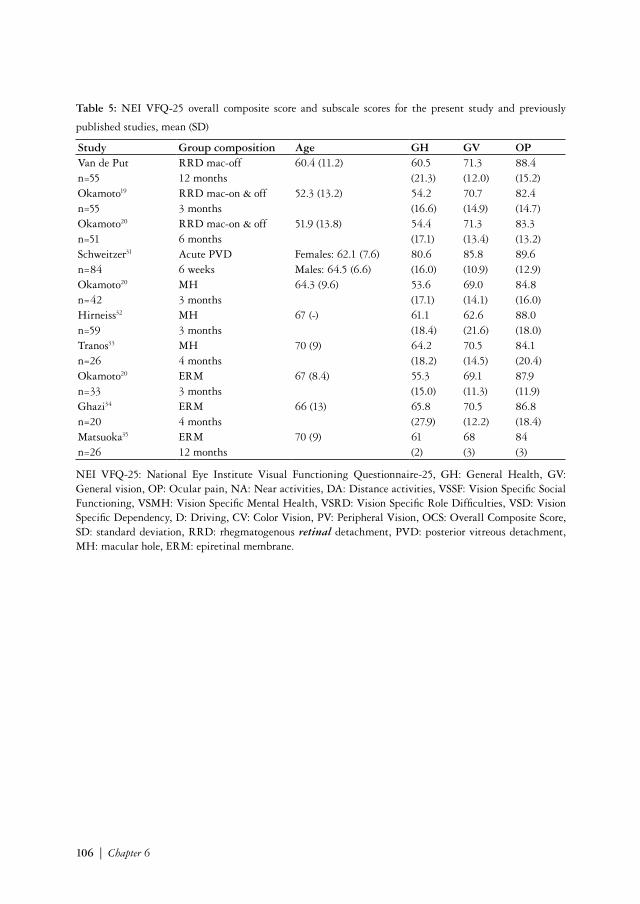
and surgical parameters. Overall, scores are relatively high when compared to previous studies on
macula-on and macula-off RRD, epiretinal membrane (ERM) and macular hole (MH) (Table 5).
Only limited differences between subgroups of patients were observed.
Table 3: Spearman’s rank correlation coefficients between LogMAR BCVA, log contrast acuity, and CCI
(saturated and desaturated)
R P-valueLogMAR BCVA / contrast acuity -0.633 <0.0001LogMAR BCVA / saturated CCI 0.556 <0.0001LogMAR BCVA / desaturated CCI 0.446 0.001Contrast acuity / saturated CCI -0.415 0.002Contrast acuity / desaturated CCI -0.393 0.004Saturated CCI/ desaturated CCI 0.734 <0.0001BCVA: best corrected visual acuity, CCI: Color vision Confusion Index. Measurements were performed 12 months after retinal detachment surgery.
In summary, even though only small differences existed between vision related quality of life OCS
and subscale scores, lower scores on vision related quality of life may be related to more extensive
surgery, long-term intraocular tamponades and re-detachment. Patients with a more extensive
retinal detachment had lower scores on the subscales ocular pain (i.e. experienced more ocular pain)
and vision specific role difficulties. Primary surgical success was associated with higher scores on
the subscale near activities and OCS. A higher number of re-detachment surgeries was associated
with lower scores on ocular pain (i.e. more pain) and vision specific mental health. Patients operated
on by TPPV had lower scores on vision specific role difficulties, and patients in whom a TPPV
VandePut.indd 100 4-11-2014 14:15:53
6
Postoperative vision related quality of life 101
was combined with an encircling band scored higher on vision specific mental health. Patients
receiving a shorter acting gas tamponade (SF6) instead of longer acting gas tamponade (C3F8) or
silicone oil were observed to have higher scores on general vision, ocular pain, near activities, vision
specific mental health, driving and on the OCS. Preoperatively pseudophakic patients (RRD eye
or fellow eye) had higher scores on the vision specific mental health subscale than phakic patients.
Table 6 provides information on the Spearman’s correlation coefficients of age, preoperative factors,
and postoperative visual function tests and NEI VFQ-25 outcomes. In general, worse outcomes of
visual function tests are correlated with lower NEI VFQ-25 scores. Correlations between BCVA
or contrast acuity and NEI VFQ-25 scores were more numerous and stronger than those between
color vision and NEI VFQ-25 scores.
VandePut.indd 101 4-11-2014 14:15:53
102 | Chapter 6
Table 4a: NEI VFQ-25 overall composite score and subscale scores (mean ± SD). Nominal significant values
are indicated in bold.
GH GV OP NA DA VSSF VSMH VSRD VSD D CV PV OCSa
(n=55) (n=55) (n=55) (n=55) (n=54) (n=55) (n=55) (n=55) (n=55) (n=45) (n=50) (n=53) (n=55)Total (n=55) 60.5±21.3 71.3±12.0 88.4±15.2 85.6±13.8 86.1±12.6 98.4±4.8 87.6±14.7 88.2±16.2 98.3±5.4 84.2±17.1 97.0±13.0 91.0±16.3 88.9±7.9Gender - Male (n=40) 61.9±20.4 71.0±20.4 87.2±16.6 85.6±13.3 86.8±11.6 97.8±5.6 87.7±15.1 87.2±15.9 97.9±6.2 87.1±15.4 96.4±15.0 91.5±16.7 88.4±84
- Female (n=15) 56.7±24.3 72.0±12.6 91.7±10.2 85.6±15.6 83.9±15.5 100.0±0.0 87.5±14.0 90.8±17.3 99.4±2.2 75.0±19.7 98.3±6.5 90.0±15.8 89.8±6.8P-value 0.256 0.907 0.546 0.861 0.679 0.116 0.899 0.314 0.396 0.052 0.939 0.574 0.777
Familyb - Positive (n=6) 58.3±25.8 63.3±15.1 93.8±10.5 77.8±16.4 81.9±6.3 97.9±5.1 83.3±10.9 87.5±15.8 100.0±0.0 83.3±18.0 100.0±0.0 83.4±25.8 85.24±9.0- Negative (n=49) 60.7±21.0 72.2±11.4 87.8±15.6 86.6±13.4 86.6±13.2 98.5±4.9 88.1±15.1 88.3±16.4 98.1±5.7 84.3±17.3 96.6±13.8 92.0±14.8 89.18±7.8P-value 0.755 0.148 0.380 0.166 0.182 0.653 0.148 0.788 0.327 0.854 0.514 0.467 0.19
Lens (pre-op)
- Phakic (n=37) 62.2±21.7 70.3±10.1 87.8±16.5 84.2±12.8 85.7±12.2 98.7±4.9 84.8±16.0 88.2±16.4 97.8±6.4 82.8±18.2 97.7±9.6 90.0±16.3 88.2±7.8- j-phakic (n=18) 56.9±20.7 73.3±15.3 89.6±12.3 88.4±15.7 86.9±13.9 97.9±4.8 93.4±9.5 88.2±16.3 99.5±2.0 86.9±15.0 95.6±18.2 93.1±16.7 89.9±8.3P-value 0.376 0.390 0.907 0.138 0.530 0.370 0.012 0.960 0.258 0.451 0.980 0.331 0.212
Quadrantsc - 1-2 (n=35) 58.6±19.1 72.0±11.1 91.4±13.5 87.6±12.7 86.9±11.8 99.3±2.9 90.6±9.6 92.1±13.6 98.8±3.6 85.4±18.1 96.9±13.8 90.4±17.4 90.0±6.7- 3-4 (n=19) 61.8±24.1 69.5±13.9 82.2±16.8 81.6±15.6 84.6±14.5 96.7±7.0 82.9±20.6 80.3±18.3 97.4±7.8 81.6±15.7 97.1±12.1 91.7±14.9 86.4±9.8P-value 0.733 0.481 0.017 0.163 0.616 0.084 0.181 0.011 0.630 0.288 0.960 0.970 0.319
PVR - Grade A (n=30) 59.2±22.2 72.7±11.1 90.8±12.3 87.2±13.8 88.8±10.6 99.2±3.2 91.0±8.6 88.3±14.6 98.6±3.8 86.3±13.3 96.3±15.0 90.0±18.1 89.6±6.5- Grade B (n=16) 60.9±15.7 71.3±14.5 85.2±16.6 85.4±15.4 86.1±9.8 96.9±7.2 87.9±11.7 88.3±18.5 99.5±2.1 80.8±22.2 96.4±13.4 90.0±15.8 88.1±9.0- Grade C (n=8) 59.4±26.5 65.0±9.3 84.4±21.9 79.2±10.9 76.0±20.1 98.4±4.4 75.8±28.8 85.9±19.4 94.8±11.7 81.3±26.7 100.0±0.0 96.4±9.4 86.4±11.2P-value 0.866 0.235 0.486 0.227 0.159 0.440 0.347 0.848 0.400 0.955 0.737 0.650 0.899
Durationd - ≤ 1 week (n=29) 60.3±19.5 70.3±11.5 89.66±15.3 86.2±13.4 86.2±12.2 99.1±4.6 90.1±10.8 88.4±14.1 98.3±4.01 84.1±17.6 95.4±17.0 92.9±13.4 89.2±7.1- > 1 week (n=26) 60.6±23.6 72.3±12.7 87.02±15.2 84.9±14.5 86.0±13.3 97.6±5.0 84.9±18.0 88.0±15.5 98.4±6.7 84.3±16.9 98.9±5.2 89.0±19.2 88.2±8.9P-value 0.875 0.746 0.338 0.815 0.874 0.075 0.244 0.708 0.322 0.934 0.620 0.628 0.781
Success rate - Primary (n=45) 58.9±21.4 72.0±12.4 89.7±13.1 87.2±13.8 87.0±12.2 98.6±4.8 89.9±10.9 88.1±15.1 98.7±3.5 87.2±12.9 97.0±13.8 92.1±15.0 89.9±6.7- Secondary (n=10) 67.5±20.6 68.0±10.3 82.5±22.2 78.3±11.9 81.5±14.3 97.5±5.3 77.5±24.0 88.8±21.6 96.7±10.5 67.9±27.4 96.9±8.8 86.1±22.0 83.3±10.9P-value 0.229 0.313 0.104 0.039 0.255 0.333 0.072 0.506 0.865 0.085 0.440 0.480 0.053
Re-detachede - 1 (n=7) 64.3±19.7 68.6±10.7 94.6±6.7 79.8±14.3 81.9±14.4 98.2±4.7 88.4±10.5 91.1±23.6 100.0±0.0 75.0±27.6 95.0±11.2 92.9±18.9 88.1±8.0- 2 (n=3) 75.0±25 66.7±11.5 54.2±19.1 75.0±0 80.6±17.3 95.8±7.2 52.1±29.5 83.3±19.1 88.9±19.2 50.0±23.6 100.0±0.0 62.5±17.7 72.0±8.8P-value 0.458 0.789 0.012 0.479 0.794 0.513 0.027 0.207 0.127 0.241 0.439 0.054 0.053
NEI VFQ-25: National Eye Institute Visual Functioning Questionnaire-25, SD: standard deviation, GH: General Health, GV: General vision, OP: Ocular pain, NA: Near activities, DA: Distance activities, VSSF: Vision Specific Social Functioning, VSMH: Vision Specific Mental Health, VSRD: Vision Specific Role Difficulties, VSD: Vision Specific Dependency, D: Driving, CV: Color Vision, PV: Peripheral Vision, OCS: Overall Composite Score, PVR: Proliferative vitreoretinopathy, TPPV: Trans Pars Plana Vitrectomy. a Average of vision-targeted subscale scores, without GH. b Family history of RRD. c Numbers of detached retinal quadrants at presentation. d Duration of macular detachment. e Number of re-detachments. f TPPV with or without an encircling band. gPostoperative tamponade after TPPV; SF6 gas (short acting) versus C3F8 gas & Silicon oil (long acting). j-phakic: Pseudophakic. External: Conventional surgery (scleral and / or buckling procedure)
VandePut.indd 102 4-11-2014 14:15:53
6
Postoperative vision related quality of life 103
Table 4a: NEI VFQ-25 overall composite score and subscale scores (mean ± SD). Nominal significant values
are indicated in bold.
GH GV OP NA DA VSSF VSMH VSRD VSD D CV PV OCSa
(n=55) (n=55) (n=55) (n=55) (n=54) (n=55) (n=55) (n=55) (n=55) (n=45) (n=50) (n=53) (n=55)Total (n=55) 60.5±21.3 71.3±12.0 88.4±15.2 85.6±13.8 86.1±12.6 98.4±4.8 87.6±14.7 88.2±16.2 98.3±5.4 84.2±17.1 97.0±13.0 91.0±16.3 88.9±7.9Gender - Male (n=40) 61.9±20.4 71.0±20.4 87.2±16.6 85.6±13.3 86.8±11.6 97.8±5.6 87.7±15.1 87.2±15.9 97.9±6.2 87.1±15.4 96.4±15.0 91.5±16.7 88.4±84
- Female (n=15) 56.7±24.3 72.0±12.6 91.7±10.2 85.6±15.6 83.9±15.5 100.0±0.0 87.5±14.0 90.8±17.3 99.4±2.2 75.0±19.7 98.3±6.5 90.0±15.8 89.8±6.8P-value 0.256 0.907 0.546 0.861 0.679 0.116 0.899 0.314 0.396 0.052 0.939 0.574 0.777
Familyb - Positive (n=6) 58.3±25.8 63.3±15.1 93.8±10.5 77.8±16.4 81.9±6.3 97.9±5.1 83.3±10.9 87.5±15.8 100.0±0.0 83.3±18.0 100.0±0.0 83.4±25.8 85.24±9.0- Negative (n=49) 60.7±21.0 72.2±11.4 87.8±15.6 86.6±13.4 86.6±13.2 98.5±4.9 88.1±15.1 88.3±16.4 98.1±5.7 84.3±17.3 96.6±13.8 92.0±14.8 89.18±7.8P-value 0.755 0.148 0.380 0.166 0.182 0.653 0.148 0.788 0.327 0.854 0.514 0.467 0.19
Lens (pre-op)
- Phakic (n=37) 62.2±21.7 70.3±10.1 87.8±16.5 84.2±12.8 85.7±12.2 98.7±4.9 84.8±16.0 88.2±16.4 97.8±6.4 82.8±18.2 97.7±9.6 90.0±16.3 88.2±7.8- j-phakic (n=18) 56.9±20.7 73.3±15.3 89.6±12.3 88.4±15.7 86.9±13.9 97.9±4.8 93.4±9.5 88.2±16.3 99.5±2.0 86.9±15.0 95.6±18.2 93.1±16.7 89.9±8.3P-value 0.376 0.390 0.907 0.138 0.530 0.370 0.012 0.960 0.258 0.451 0.980 0.331 0.212
Quadrantsc - 1-2 (n=35) 58.6±19.1 72.0±11.1 91.4±13.5 87.6±12.7 86.9±11.8 99.3±2.9 90.6±9.6 92.1±13.6 98.8±3.6 85.4±18.1 96.9±13.8 90.4±17.4 90.0±6.7- 3-4 (n=19) 61.8±24.1 69.5±13.9 82.2±16.8 81.6±15.6 84.6±14.5 96.7±7.0 82.9±20.6 80.3±18.3 97.4±7.8 81.6±15.7 97.1±12.1 91.7±14.9 86.4±9.8P-value 0.733 0.481 0.017 0.163 0.616 0.084 0.181 0.011 0.630 0.288 0.960 0.970 0.319
PVR - Grade A (n=30) 59.2±22.2 72.7±11.1 90.8±12.3 87.2±13.8 88.8±10.6 99.2±3.2 91.0±8.6 88.3±14.6 98.6±3.8 86.3±13.3 96.3±15.0 90.0±18.1 89.6±6.5- Grade B (n=16) 60.9±15.7 71.3±14.5 85.2±16.6 85.4±15.4 86.1±9.8 96.9±7.2 87.9±11.7 88.3±18.5 99.5±2.1 80.8±22.2 96.4±13.4 90.0±15.8 88.1±9.0- Grade C (n=8) 59.4±26.5 65.0±9.3 84.4±21.9 79.2±10.9 76.0±20.1 98.4±4.4 75.8±28.8 85.9±19.4 94.8±11.7 81.3±26.7 100.0±0.0 96.4±9.4 86.4±11.2P-value 0.866 0.235 0.486 0.227 0.159 0.440 0.347 0.848 0.400 0.955 0.737 0.650 0.899
Durationd - ≤ 1 week (n=29) 60.3±19.5 70.3±11.5 89.66±15.3 86.2±13.4 86.2±12.2 99.1±4.6 90.1±10.8 88.4±14.1 98.3±4.01 84.1±17.6 95.4±17.0 92.9±13.4 89.2±7.1- > 1 week (n=26) 60.6±23.6 72.3±12.7 87.02±15.2 84.9±14.5 86.0±13.3 97.6±5.0 84.9±18.0 88.0±15.5 98.4±6.7 84.3±16.9 98.9±5.2 89.0±19.2 88.2±8.9P-value 0.875 0.746 0.338 0.815 0.874 0.075 0.244 0.708 0.322 0.934 0.620 0.628 0.781
Success rate - Primary (n=45) 58.9±21.4 72.0±12.4 89.7±13.1 87.2±13.8 87.0±12.2 98.6±4.8 89.9±10.9 88.1±15.1 98.7±3.5 87.2±12.9 97.0±13.8 92.1±15.0 89.9±6.7- Secondary (n=10) 67.5±20.6 68.0±10.3 82.5±22.2 78.3±11.9 81.5±14.3 97.5±5.3 77.5±24.0 88.8±21.6 96.7±10.5 67.9±27.4 96.9±8.8 86.1±22.0 83.3±10.9P-value 0.229 0.313 0.104 0.039 0.255 0.333 0.072 0.506 0.865 0.085 0.440 0.480 0.053
Re-detachede - 1 (n=7) 64.3±19.7 68.6±10.7 94.6±6.7 79.8±14.3 81.9±14.4 98.2±4.7 88.4±10.5 91.1±23.6 100.0±0.0 75.0±27.6 95.0±11.2 92.9±18.9 88.1±8.0- 2 (n=3) 75.0±25 66.7±11.5 54.2±19.1 75.0±0 80.6±17.3 95.8±7.2 52.1±29.5 83.3±19.1 88.9±19.2 50.0±23.6 100.0±0.0 62.5±17.7 72.0±8.8P-value 0.458 0.789 0.012 0.479 0.794 0.513 0.027 0.207 0.127 0.241 0.439 0.054 0.053
NEI VFQ-25: National Eye Institute Visual Functioning Questionnaire-25, SD: standard deviation, GH: General Health, GV: General vision, OP: Ocular pain, NA: Near activities, DA: Distance activities, VSSF: Vision Specific Social Functioning, VSMH: Vision Specific Mental Health, VSRD: Vision Specific Role Difficulties, VSD: Vision Specific Dependency, D: Driving, CV: Color Vision, PV: Peripheral Vision, OCS: Overall Composite Score, PVR: Proliferative vitreoretinopathy, TPPV: Trans Pars Plana Vitrectomy. a Average of vision-targeted subscale scores, without GH. b Family history of RRD. c Numbers of detached retinal quadrants at presentation. d Duration of macular detachment. e Number of re-detachments. f TPPV with or without an encircling band. gPostoperative tamponade after TPPV; SF6 gas (short acting) versus C3F8 gas & Silicon oil (long acting). j-phakic: Pseudophakic. External: Conventional surgery (scleral and / or buckling procedure)
VandePut.indd 103 4-11-2014 14:15:53
104 | Chapter 6
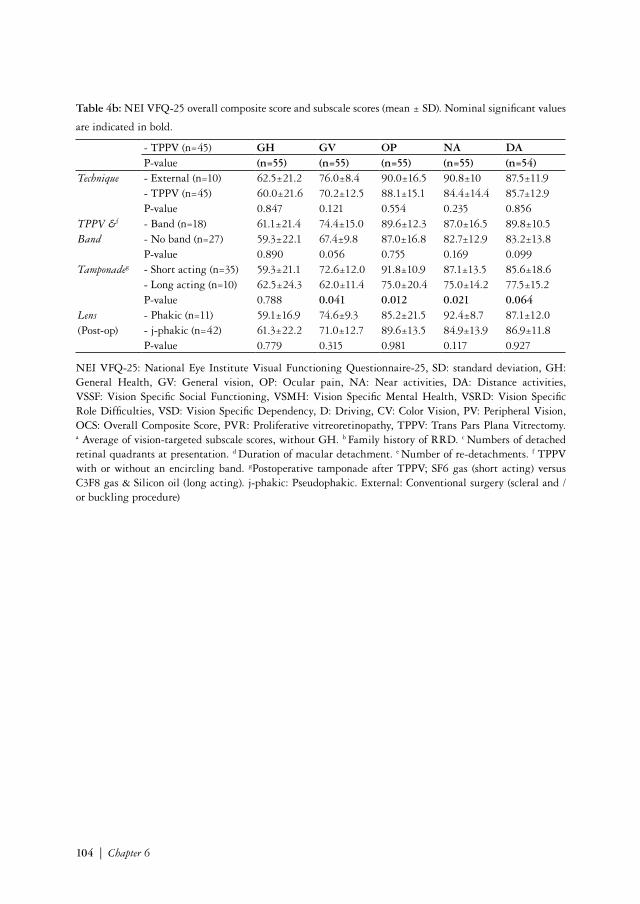
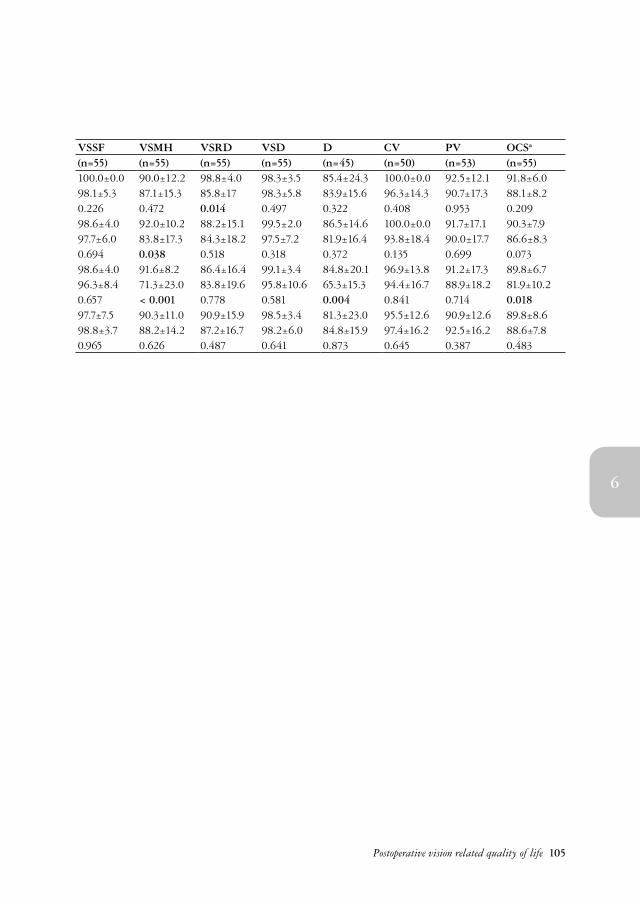
Table 4b: NEI VFQ-25 overall composite score and subscale scores (mean ± SD). Nominal significant values
are indicated in bold.
- TPPV (n=45) GH GV OP NA DA VSSF VSMH VSRD VSD D CV PV OCSa
P-value (n=55) (n=55) (n=55) (n=55) (n=54) (n=55) (n=55) (n=55) (n=55) (n=45) (n=50) (n=53) (n=55)Technique - External (n=10) 62.5±21.2 76.0±8.4 90.0±16.5 90.8±10 87.5±11.9 100.0±0.0 90.0±12.2 98.8±4.0 98.3±3.5 85.4±24.3 100.0±0.0 92.5±12.1 91.8±6.0
- TPPV (n=45) 60.0±21.6 70.2±12.5 88.1±15.1 84.4±14.4 85.7±12.9 98.1±5.3 87.1±15.3 85.8±17 98.3±5.8 83.9±15.6 96.3±14.3 90.7±17.3 88.1±8.2P-value 0.847 0.121 0.554 0.235 0.856 0.226 0.472 0.014 0.497 0.322 0.408 0.953 0.209
TPPV &f - Band (n=18) 61.1±21.4 74.4±15.0 89.6±12.3 87.0±16.5 89.8±10.5 98.6±4.0 92.0±10.2 88.2±15.1 99.5±2.0 86.5±14.6 100.0±0.0 91.7±17.1 90.3±7.9Band - No band (n=27) 59.3±22.1 67.4±9.8 87.0±16.8 82.7±12.9 83.2±13.8 97.7±6.0 83.8±17.3 84.3±18.2 97.5±7.2 81.9±16.4 93.8±18.4 90.0±17.7 86.6±8.3
P-value 0.890 0.056 0.755 0.169 0.099 0.694 0.038 0.518 0.318 0.372 0.135 0.699 0.073Tamponadeg - Short acting (n=35) 59.3±21.1 72.6±12.0 91.8±10.9 87.1±13.5 85.6±18.6 98.6±4.0 91.6±8.2 86.4±16.4 99.1±3.4 84.8±20.1 96.9±13.8 91.2±17.3 89.8±6.7
- Long acting (n=10) 62.5±24.3 62.0±11.4 75.0±20.4 75.0±14.2 77.5±15.2 96.3±8.4 71.3±23.0 83.8±19.6 95.8±10.6 65.3±15.3 94.4±16.7 88.9±18.2 81.9±10.2P-value 0.788 0.041 0.012 0.021 0.064 0.657 < 0.001 0.778 0.581 0.004 0.841 0.714 0.018
Lens - Phakic (n=11) 59.1±16.9 74.6±9.3 85.2±21.5 92.4±8.7 87.1±12.0 97.7±7.5 90.3±11.0 90.9±15.9 98.5±3.4 81.3±23.0 95.5±12.6 90.9±12.6 89.8±8.6(Post-op) - j-phakic (n=42) 61.3±22.2 71.0±12.7 89.6±13.5 84.9±13.9 86.9±11.8 98.8±3.7 88.2±14.2 87.2±16.7 98.2±6.0 84.8±15.9 97.4±16.2 92.5±16.2 88.6±7.8
P-value 0.779 0.315 0.981 0.117 0.927 0.965 0.626 0.487 0.641 0.873 0.645 0.387 0.483
NEI VFQ-25: National Eye Institute Visual Functioning Questionnaire-25, SD: standard deviation, GH: General Health, GV: General vision, OP: Ocular pain, NA: Near activities, DA: Distance activities, VSSF: Vision Specific Social Functioning, VSMH: Vision Specific Mental Health, VSRD: Vision Specific Role Difficulties, VSD: Vision Specific Dependency, D: Driving, CV: Color Vision, PV: Peripheral Vision, OCS: Overall Composite Score, PVR: Proliferative vitreoretinopathy, TPPV: Trans Pars Plana Vitrectomy. a Average of vision-targeted subscale scores, without GH. b Family history of RRD. c Numbers of detached retinal quadrants at presentation. d Duration of macular detachment. e Number of re-detachments. f TPPV with or without an encircling band. gPostoperative tamponade after TPPV; SF6 gas (short acting) versus C3F8 gas & Silicon oil (long acting). j-phakic: Pseudophakic. External: Conventional surgery (scleral and / or buckling procedure)
VandePut.indd 104 4-11-2014 14:15:53
6
Postoperative vision related quality of life 105
Table 4b: NEI VFQ-25 overall composite score and subscale scores (mean ± SD). Nominal significant values
are indicated in bold.
- TPPV (n=45) GH GV OP NA DA VSSF VSMH VSRD VSD D CV PV OCSa
P-value (n=55) (n=55) (n=55) (n=55) (n=54) (n=55) (n=55) (n=55) (n=55) (n=45) (n=50) (n=53) (n=55)Technique - External (n=10) 62.5±21.2 76.0±8.4 90.0±16.5 90.8±10 87.5±11.9 100.0±0.0 90.0±12.2 98.8±4.0 98.3±3.5 85.4±24.3 100.0±0.0 92.5±12.1 91.8±6.0
- TPPV (n=45) 60.0±21.6 70.2±12.5 88.1±15.1 84.4±14.4 85.7±12.9 98.1±5.3 87.1±15.3 85.8±17 98.3±5.8 83.9±15.6 96.3±14.3 90.7±17.3 88.1±8.2P-value 0.847 0.121 0.554 0.235 0.856 0.226 0.472 0.014 0.497 0.322 0.408 0.953 0.209
TPPV &f - Band (n=18) 61.1±21.4 74.4±15.0 89.6±12.3 87.0±16.5 89.8±10.5 98.6±4.0 92.0±10.2 88.2±15.1 99.5±2.0 86.5±14.6 100.0±0.0 91.7±17.1 90.3±7.9Band - No band (n=27) 59.3±22.1 67.4±9.8 87.0±16.8 82.7±12.9 83.2±13.8 97.7±6.0 83.8±17.3 84.3±18.2 97.5±7.2 81.9±16.4 93.8±18.4 90.0±17.7 86.6±8.3
P-value 0.890 0.056 0.755 0.169 0.099 0.694 0.038 0.518 0.318 0.372 0.135 0.699 0.073Tamponadeg - Short acting (n=35) 59.3±21.1 72.6±12.0 91.8±10.9 87.1±13.5 85.6±18.6 98.6±4.0 91.6±8.2 86.4±16.4 99.1±3.4 84.8±20.1 96.9±13.8 91.2±17.3 89.8±6.7
- Long acting (n=10) 62.5±24.3 62.0±11.4 75.0±20.4 75.0±14.2 77.5±15.2 96.3±8.4 71.3±23.0 83.8±19.6 95.8±10.6 65.3±15.3 94.4±16.7 88.9±18.2 81.9±10.2P-value 0.788 0.041 0.012 0.021 0.064 0.657 < 0.001 0.778 0.581 0.004 0.841 0.714 0.018
Lens - Phakic (n=11) 59.1±16.9 74.6±9.3 85.2±21.5 92.4±8.7 87.1±12.0 97.7±7.5 90.3±11.0 90.9±15.9 98.5±3.4 81.3±23.0 95.5±12.6 90.9±12.6 89.8±8.6(Post-op) - j-phakic (n=42) 61.3±22.2 71.0±12.7 89.6±13.5 84.9±13.9 86.9±11.8 98.8±3.7 88.2±14.2 87.2±16.7 98.2±6.0 84.8±15.9 97.4±16.2 92.5±16.2 88.6±7.8
P-value 0.779 0.315 0.981 0.117 0.927 0.965 0.626 0.487 0.641 0.873 0.645 0.387 0.483
NEI VFQ-25: National Eye Institute Visual Functioning Questionnaire-25, SD: standard deviation, GH: General Health, GV: General vision, OP: Ocular pain, NA: Near activities, DA: Distance activities, VSSF: Vision Specific Social Functioning, VSMH: Vision Specific Mental Health, VSRD: Vision Specific Role Difficulties, VSD: Vision Specific Dependency, D: Driving, CV: Color Vision, PV: Peripheral Vision, OCS: Overall Composite Score, PVR: Proliferative vitreoretinopathy, TPPV: Trans Pars Plana Vitrectomy. a Average of vision-targeted subscale scores, without GH. b Family history of RRD. c Numbers of detached retinal quadrants at presentation. d Duration of macular detachment. e Number of re-detachments. f TPPV with or without an encircling band. gPostoperative tamponade after TPPV; SF6 gas (short acting) versus C3F8 gas & Silicon oil (long acting). j-phakic: Pseudophakic. External: Conventional surgery (scleral and / or buckling procedure)
VandePut.indd 105 4-11-2014 14:15:53
106 | Chapter 6
Table 5: NEI VFQ-25 overall composite score and subscale scores for the present study and previously
published studies, mean (SD)
Study Group composition Age GH GV OP NA DA VSSF VSMH VSRD VSD D CV PV OCSVan de Put RRD mac-off 60.4 (11.2) 60.5 71.3 88.4 85.6 86.1 98.4 87.6 88.2 98.3 84.2 97.0 91.0 88.9n=55 12 months (21.3) (12.0) (15.2) (13.8) (12.6) (4.8) (14.7) (16.2) (5.4) (17.1) (13.0) (16.3) (7.9)Okamoto19 RRD mac-on & off 52.3 (13.2) 54.2 70.7 82.4 75.3 75.6 88.2 77.5 78.5 87.2 75.5 94.0 72.2 79.6n=55 3 months (16.6) (14.9) (14.7) (17.3) (16.9) (14.9) (18.4) (24.3) (17.3) (24.0) (10.8) (21.0) (14.2)Okamoto20 RRD mac-on & off 51.9 (13.8) 54.4 71.3 83.3 76.6 76.3 89.2 78.2 79.2 88.1 77.0 94.1 72.5 80.3n=51 6 months (17.1) (13.4) (13.2) (16.1) (15.8) (13.5) (17.2) (22.0) (15.3) (22.0) (10.7) (20.2) (12.5)Schweitzer31 Acute PVD Females: 62.1 (7.6) 80.6 85.8 89.6 89.6 94.4 99.1 91.8 95.7 99.4 87.9 99.1 95.5 93.5n=84 6 weeks Males: 64.5 (6.6) (16.0) (10.9) (12.9) (10.9) (8.3) (3.4) (9.8) (8.6) (3.0) (14.6) (6.1) (11.1) (6.2)Okamoto20 MH 64.3 (9.6) 53.6 69.0 84.8 70.2 72.2 82.7 76.6 78.6 85.7 78.6 85.7 75.8 79.2n=42 3 months (17.1) (14.1) (16.0) (18.8) (19.4) (15.6) (14.1) (21.8) (19.2) (12.6) (19.2) (19.3) (13.0)Hirneiss32 MH 67 (-) 61.1 62.6 88.0 71.3 80.0 84.7 88.5 71.1 88.7 66.8 92.1 85.8 79.1n=59 3 months (18.4) (21.6) (18.0) (20.4) (20.1) (18.6) (19.8) (28.2) (18.7) (30.5) (10.4) (20.5) (15.4)Tranos33 MH 70 (9) 64.2 70.5 84.1 77.2 81.1 92.1 74.7 74.5 88.8 82.6 95.8 88.3 82.4n=26 4 months (18.2) (14.5) (20.4) (22.8) (20.8) (17.5) (27.4) (26.6) (19.5) (29.3) (13.2) (20.1) (14.1)Okamoto20 ERM 67 (8.4) 55.3 69.1 87.9 71.0 73.4 83.0 78.4 76.5 88.9 76.0 89.4 72.7 78.5n=33 3 months (15.0) (11.3) (11.9) (18.2) (16.0) (9.3) (13.1) (20.0) (11.0) (16.9) (12.5) (17.0) (8.4)Ghazi34 ERM 66 (13) 65.8 70.5 86.8 74.6 79.4 94.7 79.5 80.6 91.2 88.0 92.1 86.1 83.3n=20 4 months (27.9) (12.2) (18.4) (24.4) (18.3) (12.7) (22.7) (26.5) (17.0) (8.4) (11.9) (23.0) (15.5)Matsuoka35 ERM 70 (9) 61 68 84 78 77 85 78 85 90 71 89 71 81n=26 12 months (2) (3) (3) (2) (3) (2) (4) (3) (3) (4) (3) (4) (2)
NEI VFQ-25: National Eye Institute Visual Functioning Questionnaire-25, GH: General Health, GV: General vision, OP: Ocular pain, NA: Near activities, DA: Distance activities, VSSF: Vision Specific Social Functioning, VSMH: Vision Specific Mental Health, VSRD: Vision Specific Role Difficulties, VSD: Vision Specific Dependency, D: Driving, CV: Color Vision, PV: Peripheral Vision, OCS: Overall Composite Score, SD: standard deviation, RRD: rhegmatogenous retinal detachment, PVD: posterior vitreous detachment, MH: macular hole, ERM: epiretinal membrane.
VandePut.indd 106 4-11-2014 14:15:54
6
Postoperative vision related quality of life 107
Table 5: NEI VFQ-25 overall composite score and subscale scores for the present study and previously
published studies, mean (SD)
Study Group composition Age GH GV OP NA DA VSSF VSMH VSRD VSD D CV PV OCSVan de Put RRD mac-off 60.4 (11.2) 60.5 71.3 88.4 85.6 86.1 98.4 87.6 88.2 98.3 84.2 97.0 91.0 88.9n=55 12 months (21.3) (12.0) (15.2) (13.8) (12.6) (4.8) (14.7) (16.2) (5.4) (17.1) (13.0) (16.3) (7.9)Okamoto19 RRD mac-on & off 52.3 (13.2) 54.2 70.7 82.4 75.3 75.6 88.2 77.5 78.5 87.2 75.5 94.0 72.2 79.6n=55 3 months (16.6) (14.9) (14.7) (17.3) (16.9) (14.9) (18.4) (24.3) (17.3) (24.0) (10.8) (21.0) (14.2)Okamoto20 RRD mac-on & off 51.9 (13.8) 54.4 71.3 83.3 76.6 76.3 89.2 78.2 79.2 88.1 77.0 94.1 72.5 80.3n=51 6 months (17.1) (13.4) (13.2) (16.1) (15.8) (13.5) (17.2) (22.0) (15.3) (22.0) (10.7) (20.2) (12.5)Schweitzer31 Acute PVD Females: 62.1 (7.6) 80.6 85.8 89.6 89.6 94.4 99.1 91.8 95.7 99.4 87.9 99.1 95.5 93.5n=84 6 weeks Males: 64.5 (6.6) (16.0) (10.9) (12.9) (10.9) (8.3) (3.4) (9.8) (8.6) (3.0) (14.6) (6.1) (11.1) (6.2)Okamoto20 MH 64.3 (9.6) 53.6 69.0 84.8 70.2 72.2 82.7 76.6 78.6 85.7 78.6 85.7 75.8 79.2n=42 3 months (17.1) (14.1) (16.0) (18.8) (19.4) (15.6) (14.1) (21.8) (19.2) (12.6) (19.2) (19.3) (13.0)Hirneiss32 MH 67 (-) 61.1 62.6 88.0 71.3 80.0 84.7 88.5 71.1 88.7 66.8 92.1 85.8 79.1n=59 3 months (18.4) (21.6) (18.0) (20.4) (20.1) (18.6) (19.8) (28.2) (18.7) (30.5) (10.4) (20.5) (15.4)Tranos33 MH 70 (9) 64.2 70.5 84.1 77.2 81.1 92.1 74.7 74.5 88.8 82.6 95.8 88.3 82.4n=26 4 months (18.2) (14.5) (20.4) (22.8) (20.8) (17.5) (27.4) (26.6) (19.5) (29.3) (13.2) (20.1) (14.1)Okamoto20 ERM 67 (8.4) 55.3 69.1 87.9 71.0 73.4 83.0 78.4 76.5 88.9 76.0 89.4 72.7 78.5n=33 3 months (15.0) (11.3) (11.9) (18.2) (16.0) (9.3) (13.1) (20.0) (11.0) (16.9) (12.5) (17.0) (8.4)Ghazi34 ERM 66 (13) 65.8 70.5 86.8 74.6 79.4 94.7 79.5 80.6 91.2 88.0 92.1 86.1 83.3n=20 4 months (27.9) (12.2) (18.4) (24.4) (18.3) (12.7) (22.7) (26.5) (17.0) (8.4) (11.9) (23.0) (15.5)Matsuoka35 ERM 70 (9) 61 68 84 78 77 85 78 85 90 71 89 71 81n=26 12 months (2) (3) (3) (2) (3) (2) (4) (3) (3) (4) (3) (4) (2)
NEI VFQ-25: National Eye Institute Visual Functioning Questionnaire-25, GH: General Health, GV: General vision, OP: Ocular pain, NA: Near activities, DA: Distance activities, VSSF: Vision Specific Social Functioning, VSMH: Vision Specific Mental Health, VSRD: Vision Specific Role Difficulties, VSD: Vision Specific Dependency, D: Driving, CV: Color Vision, PV: Peripheral Vision, OCS: Overall Composite Score, SD: standard deviation, RRD: rhegmatogenous retinal detachment, PVD: posterior vitreous detachment, MH: macular hole, ERM: epiretinal membrane.
VandePut.indd 107 4-11-2014 14:15:54

108 | Chapter 6
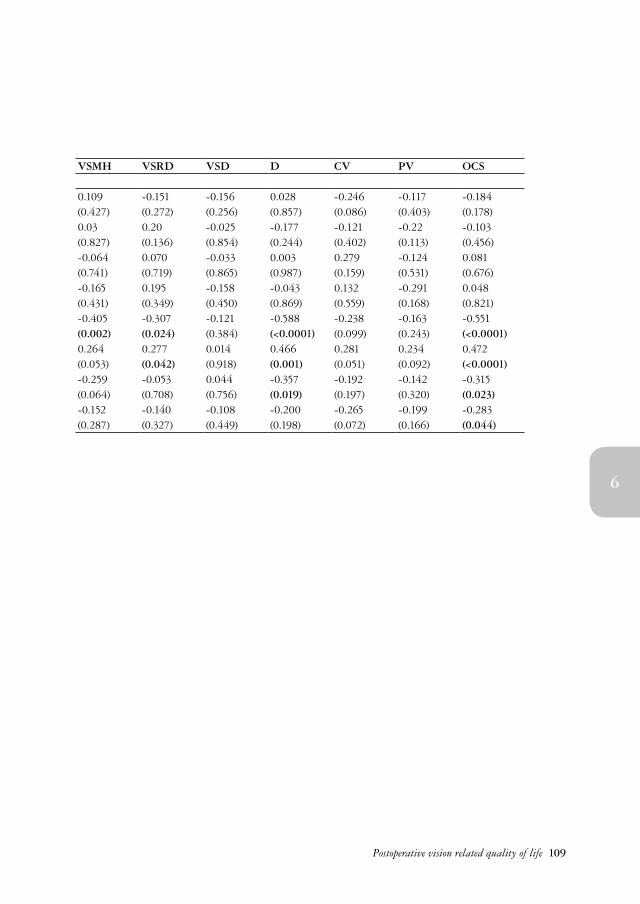
Table 6: Spearman’s rank correlation coefficients between age, preoperative factors (height and duration of
retinal detachment), LogMAR BCVA, contrast acuity, CCI (saturated and desaturated), and NEI VFQ-25
subscale scores and OCS. Nominal significant values are indicated in bold.
GH GV OP NA DA VSSF VSMH VSRD VSD D CV PV OCSR (P-value)
Age (years) (n=55) -0.099 -0.098 0.136 -0.005 -0.186 -0.225 0.109 -0.151 -0.156 0.028 -0.246 -0.117 -0.184(0.473) (0.479) (0.323) (0.969) (0.179) (0.098) (0.427) (0.272) (0.256) (0.857) (0.086) (0.403) (0.178)
Heighta (upright) (n=55) -0.151 -0.043 -0.08 -0.238 -0.148 -0.189 0.03 0.20 -0.025 -0.177 -0.121 -0.22 -0.103(0.271) (0.753) (0.562) (0.08) (0.287) (0.167) (0.827) (0.136) (0.854) (0.244) (0.402) (0.113) (0.456)
Durationb (n=29) 0.320 0.253 -0.016 -0.127 -0.088 0.082 -0.064 0.070 -0.033 0.003 0.279 -0.124 0.081≤ 7 days (0.090) (0.186) (0.935) (0.513) (0.657) (0.672) (0.741) (0.719) (0.865) (0.987) (0.159) (0.531) (0.676)Durationb (n=25) 0.142 -0.108 -0.035 -0.106 -0.234 -0.165 -0.165 0.195 -0.158 -0.043 0.132 -0.291 0.048> 7 days ≤ 6 weeks (0.499) (0.609) (0.870) (0.613) (0.260) (0.431) (0.431) (0.349) (0.450) (0.869) (0.559) (0.168) (0.821)LogMAR BCVA (n=54) -0.196 -0.391 -0.304 -0.517 -0.317 -0.196 -0.405 -0.307 -0.121 -0.588 -0.238 -0.163 -0.551
(0.155) (0.003) (0.026) (<0.0001) (0.021) (0.157) (0.002) (0.024) (0.384) (<0.0001) (0.099) (0.243) (<0.0001)Contrast acuity (n=54) 0.058 0.394 0.142 0.470 0.349 0.287 0.264 0.277 0.014 0.466 0.281 0.234 0.472
(0.677) (0.003) (0.305) (<0.0001) (0.010) (0.036) (0.053) (0.042) (0.918) (0.001) (0.051) (0.092) (<0.0001)Saturated CCI (n=52) -0.129 -0.278 -0.268 -0.233 -0.174 -0.248 -0.259 -0.053 0.044 -0.357 -0.192 -0.142 -0.315
(0.363) (0.046) (0.055) (0.096) (0.221) (0.076) (0.064) (0.708) (0.756) (0.019) (0.197) (0.320) (0.023)Desaturated CCI (n=52) -0.099 -0.207 -0.136 -0.138 -0.162 -0.029 -0.152 -0.140 -0.108 -0.200 -0.265 -0.199 -0.283
(0.488) (0.145) (0.342) (0.332) (0.261) (0.842) (0.287) (0.327) (0.449) (0.198) (0.072) (0.166) (0.044)
NEI VFQ-25: National Eye Institute Visual Functioning Questionnaire-25, GH: General Health, GV: General vision, OP: Ocular pain, NA: Near activities, DA: Distance activities, VSSF: Vision Specific Social Functioning, VSMH: Vision Specific Mental Health, VSRD: Vision Specific Role Difficulties, VSD: Vision Specific Dependency, D: Driving, CV: Color Vision, PV: Peripheral Vision, OCS: Overall Composite Score. BCVA: best corrected visual acuity, CCI: Color vision Confusion Index.a Height of the retinal detachment in prone position. b Duration of macular detachment.
VandePut.indd 108 4-11-2014 14:15:54
6
Postoperative vision related quality of life 109
Table 6: Spearman’s rank correlation coefficients between age, preoperative factors (height and duration of
retinal detachment), LogMAR BCVA, contrast acuity, CCI (saturated and desaturated), and NEI VFQ-25
subscale scores and OCS. Nominal significant values are indicated in bold.
GH GV OP NA DA VSSF VSMH VSRD VSD D CV PV OCSR (P-value)
Age (years) (n=55) -0.099 -0.098 0.136 -0.005 -0.186 -0.225 0.109 -0.151 -0.156 0.028 -0.246 -0.117 -0.184(0.473) (0.479) (0.323) (0.969) (0.179) (0.098) (0.427) (0.272) (0.256) (0.857) (0.086) (0.403) (0.178)
Heighta (upright) (n=55) -0.151 -0.043 -0.08 -0.238 -0.148 -0.189 0.03 0.20 -0.025 -0.177 -0.121 -0.22 -0.103(0.271) (0.753) (0.562) (0.08) (0.287) (0.167) (0.827) (0.136) (0.854) (0.244) (0.402) (0.113) (0.456)
Durationb (n=29) 0.320 0.253 -0.016 -0.127 -0.088 0.082 -0.064 0.070 -0.033 0.003 0.279 -0.124 0.081≤ 7 days (0.090) (0.186) (0.935) (0.513) (0.657) (0.672) (0.741) (0.719) (0.865) (0.987) (0.159) (0.531) (0.676)Durationb (n=25) 0.142 -0.108 -0.035 -0.106 -0.234 -0.165 -0.165 0.195 -0.158 -0.043 0.132 -0.291 0.048> 7 days ≤ 6 weeks (0.499) (0.609) (0.870) (0.613) (0.260) (0.431) (0.431) (0.349) (0.450) (0.869) (0.559) (0.168) (0.821)LogMAR BCVA (n=54) -0.196 -0.391 -0.304 -0.517 -0.317 -0.196 -0.405 -0.307 -0.121 -0.588 -0.238 -0.163 -0.551
(0.155) (0.003) (0.026) (<0.0001) (0.021) (0.157) (0.002) (0.024) (0.384) (<0.0001) (0.099) (0.243) (<0.0001)Contrast acuity (n=54) 0.058 0.394 0.142 0.470 0.349 0.287 0.264 0.277 0.014 0.466 0.281 0.234 0.472
(0.677) (0.003) (0.305) (<0.0001) (0.010) (0.036) (0.053) (0.042) (0.918) (0.001) (0.051) (0.092) (<0.0001)Saturated CCI (n=52) -0.129 -0.278 -0.268 -0.233 -0.174 -0.248 -0.259 -0.053 0.044 -0.357 -0.192 -0.142 -0.315
(0.363) (0.046) (0.055) (0.096) (0.221) (0.076) (0.064) (0.708) (0.756) (0.019) (0.197) (0.320) (0.023)Desaturated CCI (n=52) -0.099 -0.207 -0.136 -0.138 -0.162 -0.029 -0.152 -0.140 -0.108 -0.200 -0.265 -0.199 -0.283
(0.488) (0.145) (0.342) (0.332) (0.261) (0.842) (0.287) (0.327) (0.449) (0.198) (0.072) (0.166) (0.044)
NEI VFQ-25: National Eye Institute Visual Functioning Questionnaire-25, GH: General Health, GV: General vision, OP: Ocular pain, NA: Near activities, DA: Distance activities, VSSF: Vision Specific Social Functioning, VSMH: Vision Specific Mental Health, VSRD: Vision Specific Role Difficulties, VSD: Vision Specific Dependency, D: Driving, CV: Color Vision, PV: Peripheral Vision, OCS: Overall Composite Score. BCVA: best corrected visual acuity, CCI: Color vision Confusion Index.a Height of the retinal detachment in prone position. b Duration of macular detachment.
VandePut.indd 109 4-11-2014 14:15:54
110 | Chapter 6
DISCUSSION
In our study on patients with macula-off RRD, NEI VFQ-25 OCS and subscale scores were
relatively high with a mean OCS of 88.5. The best possible score on each question was 100 and
the second best 75 or 80. This means that most patients scored between the best and second best
score. Although the scores were somewhat lower than those in a normal working population and
in a population with posterior vitreous detachment (PVD),[32,37] they were higher when compared
to other studies addressing NEI VFQ-25 scores in RRD patients (Table 5).[19-20] However, it is
difficult to directly compare the results of our study to the results of others, because of differences
in study design.
For example, Okamoto et al.[19-20] who included macula-on and off patients observed lower NEI
VFQ-25 scores than we did.[19-20] Possible explanations for this are that they had a shorter follow-
up time of 6 months, that cataract may have developed in patients operated on by TPPV, and that
different methods were used to perform visual function tests. Remarkably, in Okamoto’s study,
patients were younger and the subgroup of macula-off RRD patients was smaller, whereas that
study excluded patients with PVR and re-detachment.[19-20] Since these factors are associated with a
better postoperative VA, and VA in their study was higher than in ours, one would have expected
the NEI VFQ-25 OCS and subscores to be higher in their study.[19-20]
We observed correlations between NEI VFQ-25 OCS, and subscale scores and postoperative
BCVA, contrast acuity and post-operative CCI. All tested postoperative visual function parameters
were highly correlated with each other. This suggests that BCVA, contrast acuity, and color vision
represent interdependent aspects of macular function. However, our observations suggest that – of
all tested variables – postoperative BCVA and contrast acuity in the RRD-eye are the most
important determinants of postoperative VR-QOL.
In contrast to postoperative visual functioning, other patient and surgery related aspects showed
very few correlations with NEI VFQ-25 outcomes. Correlations observed related to more extensive
surgery, long-term intraocular tamponades and re-detachment. We identified that preoperatively
pseudophakic patients (RRD eye or fellow eye) had higher scores on the vision specific mental
health subscale than phakic patients. The mental health subscale consists of questions about
troubling thoughts about the future and the eyesight. Perhaps, patients with a history of cataract
extraction do not have to worry about undergoing a cataract extraction anymore.
Visual acuity
We observed a significant correlation between post-operative BCVA and NEI VFQ-25 OCS and
the subscale scores general vision, ocular pain, near activities, distance activities, mental health,
role difficulties and driving. In contrast, Okamoto et al. did not find such a relationship.[20] This
might have been due to differences in study design, since they included relatively younger patients
VandePut.indd 110 4-11-2014 14:15:54
6
Postoperative vision related quality of life 111
with macula-on and macula-off RRD. This difference is underlined by the higher postoperative
VA in the study by Okamoto et al.[20]
Generally, VA is considered as a major determinant of VR-QOL. This has been suggested in
studies on macular hole, epiretinal membrane and diabetic retinopathy.[34-35,38] Ophthalmologists
consider post-operative expectations of VA when developing treatment strategies. However, VA
may not always predict other aspects of visual function and NEI VFQ-25 scores are not always
primarily correlated with VA, as was shown in previous studies on RRD.[20]
Contrast acuity
In line with the study by Okamoto et al., we observed a significant correlation between contrast
acuity and NEI VFQ-25 OCS.[20] In that study, the correlation between contrast acuity and the OCS
differed between measurements with different types of charts, thus underlining the importance
of the test method.[20] In a general population, reduced contrast sensitivity was associated with
self-reported vision related disabilities, and it was associated with difficulties in performing tasks
requiring distance judgments, such as night driving, and mobility.[39] This supports the correlation
found in our study between diminished contrast acuity and a lower score on the NEI VFQ-25
subscores general vision, near activities, distance activities, vision related social functioning, vision
related role difficulties, and driving.
Color vision
Although we observed significant correlations between reduced CCI and VR-QOL parameters,
we did not find any papers on a possible relation between both aspects. The observed correlations
were small, and we therefore assume that unilateral, mild color vision defects have less impact on
patients’ well-being and visual functioning than unilateral defects in VA and contrast acuity. Also,
it could be that the fellow eye compensates better for the defect in color vision in the affected eye
than it does for the other two aspects of visual functioning.
Previously, we observed that both the duration and the height of macular detachment have a
profound effect on the postoperative recovery of visual function, particularly BCVA and CCI[17]
In the present study, we observed that BCVA is highly correlated to VR-QOL. Even though we
failed to demonstrate a direct correlation between the height of the macular detachment and
NEI VFQ-25 scores, it might be clinically relevant to evaluate whether posturing of macula-
off RRD patients would have a positive effect on postoperative BCVA and VR-QOL. The goal
thereof would be to prevent a progression of a shallow detachment to a bullous one or to diminish
submacular fluid in an already bullous one.
Limitations
Our study highlights important aspects of the postoperative VR-QOL in macula-off RRD
patients. Some limitations include a possible selection bias towards highly motivated patients,
VandePut.indd 111 4-11-2014 14:15:54
112 | Chapter 6
because they would have been more likely to have participated in this study. In addition, the
studied population is modest. Our sample size is considered adequate for overall analyses,[40] but it
may be too limited for all subgroup analyses, resulting in an underreporting of possibly relevant
associations. In addition, our analyses were performed on the postoperative visual function (BCVA,
contrast acuity, saturated and desaturated CCI) in the RRD eye. The overall good visual function
in the contralateral eye may have compensated for the defects in the RRD eye to a variable extent
with regard to the different aspects of visual function. This may have mitigated the observed
relations with VFQ outcomes to a variable extent.
CONCLUSION
At 12 months postoperatively, BCVA, contrast acuity, and CCI’s in macula-off RRD eyes were still
significantly worse for the operated eyes compared to their fellow control eyes. A lower VR-QOL
(OCS and subscores) had the highest correlation with a worse postoperative BCVA and contrast
acuity (in the RRD-eye). Although less pronounced, postoperative color vision disturbances
(saturated and desaturated CCI) were significantly correlated with the NEI VFQ-25 OCS.
VandePut.indd 112 4-11-2014 14:15:54

6
Postoperative vision related quality of life 113
REFERENCES
1. D’Amico DJ. (2008) Primary retinal detachment. N Engl J Med. 359: 2346-2354.
2. Van de Put MAJ, Hooymans JMM, Los LI; The Dutch Rhegmatogenous Retinal Detachment
Study Group. (2013) The incidence of rhegmatogenous retinal detachment in the Netherlands.
Ophthalmology. 120: 616–622.
3. Sharma T, Challa JK, Ravishankar KV, Murugesan R. (1994) Scleral buckling for retinal detachment:
predictors for anatomic failure. Retina. 14: 338-343.
4. Tani PT, Robertson DM, Langworthy A. Prognosis for central vision and anatomic reattachment in
rhegmatogenous retinal detachment with macula detached. (1981) Am J Ophthalmol. 92: 611-620.
5. Pastor JC, Fernández I, Rodríguez de la Rúa E, et al. (2008) Surgical outcomes for primary
rhegmatogenous retinal detachments in phakic and pseudophakic patients: the Retina 1 Project –
report 2. Br J Ophthalmol. 92: 378-382.
6. Grizzard WS, Hilton GF, Hammer ME, Taren D. (1994) A multivariate analysis of anatomic success
of retinal detachments treated with scleral buckling. Graefes Arch Clin Exp Ophthalmol. 232: 1-7.
7. Burton TC. (1982) Recovery of visual acuity after retinal detachment involving the macula. Trans Am
Ophthalmol Soc. 80: 475-497.
8. Mitry D, Awan MA, Borooah S, et al. (2012) Long term visual acuity and the duration of macular
detachment: findings from a prospective population based study. Br J Ophthalmol. 00: 1-4.
9. Diederen RMH, La Heij AC, Kessels AGH, et al. (2007) Scleral buckling surgery after macula-off
retinal detachment; worse visual outcome after more than 6 days. Ophthalmology. 114: 705-709.
10. Hassan TS, Sarrafizadeh R, Ruby AJ, et al. (2002) The effect of duration of macular detachment on
results after the scleral buckle repair of primary, macula-off retinal detachments Ophthalmology. 109:
146-152.
11. Özgür S, Esgin H. (2007) Macular function of successfully repaired macula-off retinal detachments
Retina. 27: 359-364.
12. Ross WH, Kozy DW. (1998) Visual recovery in macula-off rhegmatogenous retinal detachments.
Ophthalmology. 105; 2149-2153.
13. Anderson C, Sjöstrand J. (1981) Contrast sensitivity and central vision in reattached macula. Acta
Ophthalmol. 59: 161-169.
14. Kreissig I, Lincoff B, Witassek B, et al. (1981) Color vision and other parameters of macular function
after reattachment. Dev Ophthalmol. 12: 77-85.
15. Ross WH, Lavina A, Russel M, Maberley D. (2005) The correlation between height of macular
detachment and visual outcome in macula-off retinal detachments of ≤ 7days’ duration. Ophthalmology.
112: 1213-1217.
16. Mowatt L, Tarin S, Nair RG, et al. (2010) Correlation of visual recovery with macular height in
macula-off retinal detachments. Eye. 24: 323-327.
VandePut.indd 113 4-11-2014 14:15:54
114 | Chapter 6
17. Van de Put MAJ, Croonen D, Nolte IM, et al. (2014) Postoperative recovery of visual function after
macula-off rhegmatogeneous retinal detachment. PlosOne. 9:6:e99787.
18. Zou H, Zhang X, Xu X, et al. (2011) Vision-related quality of life and self-related satisfaction outcomes
of rhegmatogenous retinal detachment surgery: three-year prospective study. Plos One 6: e28597.
19. Okamoto F, Okamoto Y, Fukuda S, et al. (2010) Vision-related quality of life and visual function after
vitrectomy for various vitreoretinal disorders. Invest Ophthalmol Vis Sci. 51: 744-751.
20. Okamoto F, Okomota Y, Hiraoka T, Oshika T. (2008) Vision-related quality of life and visual function
after retinal detachment surgery. Am J Ophthalmol. 146: 85-90.
21. Van der Sterre GW, van de Graaf ES, Verezen CA, et al. (2013) National Eye Institute visual
functioning questionnaire – 25; Dutch Consensus Translation (VFQ-25/NL) http://www.erasmusmc.
nl/mage/publicaties/aanvullingen/3503529?lang. Accessed December 24, 2013.
22. Maguire M. (2004) Complications of age-related macular degeneration prevention trial research
group. Baseline characteristics, the 25-item National eye institute visual functioning questionnaire,
and their associations in the complications of age-related macular degeneration prevention trial
(CAPT). Ophthalmology. 111: 1307-1316.
23. Mangione CM, Berry S, Spritzer K, et al. (1998) Identifying the content area for the 51-item National
Eye Institute visual function questionnaire. Arch Ophthalmol. 116: 227-233.
24. Mangione CM, Lee PP, Pitts J, et al. (1998) Psychometric properties of the National Eye Institute
visual function questionnaire (NEI-VFQ). NEI-VFQ field test investigators. Arch Ophthalmol. 116:
1496-1504.
25. Mangione CM, Lee PP, Guiterrez PR, et al. (2001) Development of the 25-item National Eye Institute
visual function questionnaire. Arch Ophthalmol. 119: 1050-1058.
26. Hilton G, Machemer R, Michels R, et al. The retina society terminology committee. (1983) The
classification of retinal detachment with proliferative vitreoretinopathy. Ophthalmology 90: 121-125.
27. Rosser DA, Cousens SN, Murdoch IE, et al. (2003) How sensitive to clinical change are ETDRS
logMAR visual acuity measurements? Invest Ophthalmol Vis Sci. 44: 3278-3281.
28. Van de Put MAJ, Nayebi F, Croonen D, et al. (2013) Design and validation of a method to determine
the position of the fovea by using the nerve-head to fovea distance of the fellow eye. PlosOne 8: e62518.
29. Mantyjarvi M, Laitinen T. (2001) Normal values for the Pelli-Robson contrast sensitivity test.
J Cataract Refract Surg. 27: 261-266.
30. Bowman KJ. (1982) A method for quantitative scoring of the Farnsworth panel D-15. Acta Ophthalmol.
60: 907.
31. Chylack LT Jr., Wolfe JK, Singer DM, et al. (1993) The Lens Opacities Classification System III. The
Longitudinal Study of Cataract Study Group. Arch Ophthalmol. 111: 831-836.
32. Schweitzer KD, Eneh AA, Hurst J, Bona MD, Rahim KJ, Sharma S. (2011) Visual function analysis
in acute posterior vitreous detachment. Can J Ophthalmol. 46: 232-236.
33. Hirneiß C, Neubauer AS, Gass CA, et al. (2007) Visual quality of life after macular hole surgery:
outcome and predictive factors. Br J Ophthalmol. 91: 481-484.
VandePut.indd 114 4-11-2014 14:15:54
6
Postoperative vision related quality of life 115
34. Tranos PG, Ghazi-Nouri SM, Rubin GS, et al. (2004) Visual function and subjective perception of
visual ability after macular hole surgery. Am J Ophthalmol. 138: 995-1002.
35. Ghazi-Nouri SM, Tranos OG, Rubin GS, et al. (2006) Visual function and quality of life following
vitrectomy and epiretinal membrance peel surgery. Br J Ophthalmol. 90: 559-562.
36. Matsuoka Y, Tanito M, Takai Y, et al. (2012) Visual function and vision-related quality of life after
vitrectomy for epiretinal membranes: a 12 month follow-up study. Invest Opthalmol Vis Sci. 53:
3054-3058.
37. Hirneiss C, Schmid-Tannwald C, Kernt M, et al. (2010) The NEI VFQ-25 vision-related quality of
life and prevalence of eye disease in a working population. Graefes Arch Clin Exp Ophthalmol. 248:
85-92.
38. Klein R, Moss SE, Klein BE, et al. (2001) The NEI=VFQ-25 in people with long-term type 1 diabetes
mellitus: the Wisconsin Epidemiologic Study of Diabetic Retinopathy. Arch Ophthalmol. 119: 733-
740.
39. Rubin GS, Roche KB, Prasada-Rao P, Fried LP. (1994) Visual impairment and disability in older
adults. Optom Vis Sci. 71: 750-760.
40. Mangione CM. (2013) NEI-VFQ Scoring Algorithm – August 2000. Version 2000. http://www.nei.
nih.gov/resources/visionfunction/manual_cm2000.pdf. Accessed December 24, 2013.
VandePut.indd 115 4-11-2014 14:15:54

VandePut.indd 116 4-11-2014 14:15:54


![l O Journal of Clinical & Experimental C …...developing rhegmatogenous retinal detachment [1-3]. Left untreated, a chronic retinal detachment can lead to complications such as proliferative](https://img.pdfslide.us/doc/110x75/5e6881d4802d47373f0932ef/l-o-journal-of-clinical-experimental-c-developing-rhegmatogenous-retinal.jpg)