Embed Size (px)
Citation preview
University of Groningen
Physical and Chemical Speciation of Iron in the Polar OceansThuróczy, Charles-Edouard
IMPORTANT NOTE: You are advised to consult the publisher's version (publisher's PDF) if you wish to cite fromit. Please check the document version below.
Document VersionPublisher's PDF, also known as Version of record
Publication date:2011
Link to publication in University of Groningen/UMCG research database
Citation for published version (APA):Thuróczy, C-E. (2011). Physical and Chemical Speciation of Iron in the Polar Oceans. s.n.
CopyrightOther than for strictly personal use, it is not permitted to download or to forward/distribute the text or part of it without the consent of theauthor(s) and/or copyright holder(s), unless the work is under an open content license (like Creative Commons).
The publication may also be distributed here under the terms of Article 25fa of the Dutch Copyright Act, indicated by the “Taverne” license.More information can be found on the University of Groningen website: https://www.rug.nl/library/open-access/self-archiving-pure/taverne-amendment.
Take-down policyIf you believe that this document breaches copyright please contact us providing details, and we will remove access to the work immediatelyand investigate your claim.
Downloaded from the University of Groningen/UMCG research database (Pure): http://www.rug.nl/research/portal. For technical reasons thenumber of authors shown on this cover page is limited to 10 maximum.
Download date: 26-02-2022
55
1164
1165
1166
Chapter 4 1167
1168
1169
Observation of consistent trends 1170
in the organic complexation of dissolved iron 1171
in the Atlantic sector of the Southern Ocean 1172
1173
1174
1175
1176
This chapter is adapted from: Thuróczy, C.-E., Gerringa, L.J.A., Klunder, M.B., Laan, 1177
P., De Baar, H.J.W., 2011a. Observation of consistent trends in the organic 1178
complexation of dissolved iron in the Atlantic sector of the Southern Ocean. Deep-Sea 1179
Research II. doi: 10.1016/j.dsr2.2011.01.002. 1180
Chapter 4: Atlantic Sector of the Southern Ocean 1/2
56
1181
1182
Abstract 1183
1184
Organic complexation of dissolved iron (DFe) was investigated in the Atlantic sector 1185
of the Southern Ocean in order to understand the distribution of Fe over the whole 1186
water column. The total concentration of dissolved organic ligands ([Lt]) measured by 1187
voltammetry ranged between 0.54 and 1.84 Eq of nM Fe whereas the conditional 1188
binding strength (K’) ranged between 1021.4 and 1022.8. For the first time, trends in Fe- 1189
organic complexation were observed in an ocean basin by examining the ratio 1190
([Lt]/[DFe]), defined as the organic ligand concentration divided by the dissolved Fe 1191
concentration. The [Lt]/[DFe] ratio indicates the saturation state of the natural ligands 1192
with Fe; a ratio near 1 means saturation of the ligands leading to precipitation of Fe. 1193
Reversely, high ratios mean Fe depletion and show a high potential for Fe 1194
solubilisation. In surface waters where phytoplankton is present low dissolved Fe and 1195
high variable ligand concentrations were found. Here the [Lt]/[DFe] ratio was on 1196
average 4.4. It was especially high (5.6-26.7) in the HNLC (High Nutrient, Low 1197
Chlorophyll) regions, where Fe was depleted. The [Lt]/[DFe] ratio decreased with 1198
depth due to increasing dissolved Fe concentrations and became constant below 450 1199
m, indicating a steady state between ligand and Fe. Relatively low [Lt]/[DFe] ratios 1200
(between 1.1 and 2.7) existed in deep water north of the Southern Boundary, 1201
facilitating Fe precipitation. The [Lt]/[DFe] ratio increased southwards from the 1202
Southern Boundary on the Zero Meridian and from east to west in the Weddell Gyre 1203
due to changes both in ligand characteristics and in dissolved iron concentration. High 1204
[Lt]/[DFe] ratio expresses Fe depletion versus ligand production in the surface. The 1205
decrease with depth reflects the increase of [DFe] which favours scavenging and (co-) 1206
precipitation, whereas a horizontal increase in the deep waters results from an 1207
increasing distance from Fe sources. This increase in the [Lt]/[DFe] ratio at depth 1208
shows the very resistant nature of the dissolved organic ligands. 1209
1. Introduction 1210
Chapter 4: Atlantic Sector of the Southern Ocean 1/2
57
The presence and availability of iron (Fe) is vital for life in the ocean. This trace 1211
nutrient is used by most organisms in seawater including phytoplankton in the 1212
euphotic zone. Phytoplankton is not only the base of the food web; it is also largely 1213
responsible for the fixation of dissolved carbon dioxide and the production of 1214
dissolved oxygen. Iron is used in phytoplankton cells in different locations and 1215
processes (Sunda et al. 1991 and 2001), notably in photosynthesis (photosystems) and 1216
in enzymes (e.g. nitrate-reductase). Due to its low concentration in seawater, iron is a 1217
limiting factor of primary production (Martin and Gordon, 1988, Martin et al., 1991; 1218
De Baar et al., 1990 and 1995; Buma et al., 1991; Coale et al., 1996; Fitzwater et al., 1219
1996; Timmermans et al., 1998, 2001 and 2004), especially in HNLC (High Nutrient, 1220
Low Chlorophyll, Martin et al., 1991) regions such as those in the Southern Ocean. 1221
Iron is used in the surface by phytoplankton but also over the whole water column by 1222
microbial communities (Bacteria and Archaea; Tortell et al., 1996 and 1999) 1223
responsible for the degradation and remineralisation of sinking organic matter. Iron is 1224
found in seawater at concentrations above those determined by the solubility product 1225
(Kuma et al., 1996; Millero, 1998). This is due to Fe binding organic ligands. Indeed 1226
95 to 99.9 % of the dissolved Fe is strongly complexed by natural organic ligands 1227
(Gledhill and Van Den Berg, 1994; Rue and Bruland, 1995; Wu and Luther, 1995; 1228
Nolting et al., 1998; Powell and Donat, 2001) allowing Fe to remain in solution, yet 1229
possibly limiting its availability for direct biological uptake. 1230
The knowledge of the chemistry of Fe is important to understand its cycle in the 1231
world ocean which determines its distribution over the water column. The distribution 1232
of Fe in the oceans is controlled by its sources (aerosols deposition to the surface 1233
ocean, upwelling, ice melting and hydrothermal events), and by competition between 1234
processes which stabilise and remove it. Organic complexation stabilises Fe in 1235
seawater by keeping it in solution thus increasing its residence time. Fe removal is 1236
mainly caused by precipitation as oxy-hydroxides, adsorption onto large particles or 1237
colloid aggregation. (Alldredge et al., 1993; Wells et al., 1993, 1994 and 2000; 1238
Kepkay et al., 1994; Logan et al., 1995; Wu et al., 2001; Cullen et al., 2006). 1239
The work presented here forms part of the GEOTRACES program 1240
(www.geotraces.org, Geotraces Science Plan, 2006). As part of this program, the 1241
Chapter 4: Atlantic Sector of the Southern Ocean 1/2
58
distribution of Fe along the Zero Meridian (Klunder et al., 2011) and several other 1242
trace elements, including dissolved aluminium and manganese (Middag et al., 2011a 1243
and 2011b), were also investigated. 1244
This study describes the organically complexed state of Fe over the whole water 1245
column and the observed changes in the Fe chemistry when passing from the Sub- 1246
Antarctic Ocean into the Weddell Gyre (HNLC regions). With the knowledge of the 1247
Fe chemistry and of the organically complexed Fe in the whole water column, the 1248
processes controlling the Fe distribution in the world oceans can be better understood. 1249
1250
2. Description of the Southern Ocean 1251
2.1. General aspects of the Southern Ocean 1252
Many special aspects of the Southern Ocean give it a unique status. First of all, it is 1253
the only ocean with a permanent water flow around the globe (Antarctic Circumpolar 1254
Current, ACC), and the only ocean that communicates directly with the Atlantic 1255
Ocean, the Pacific Ocean and the Indian Ocean. The Southern Ocean is a key place for 1256
the deep water formation and thus for thermohaline circulation (Carmack, 1977; 1257
Mantyla and Reid, 1983; Foldvik and Gammelrød, 1988; Orsi et al., 1999). 1258
1259
2.2. Fronts and zones 1260
Several fronts (Figure 1) separate the Southern Ocean in different zones (Pollard et 1261
al., 2002). The bottom topography contributes in maintaining the division of these 1262
zones with ridges separating different basins. Along the Zero Meridian, the Sub- 1263
Tropical Front (STF) with a surface salinity of 34.8 (Whitworth and Nowlin, 1987) 1264
and a temperature of 10-12ºC at 200 m depth separates warmer South Atlantic Surface 1265
Water (SASW) from the cooler and fresher Sub-Antarctic Surface Water (SAASW) in 1266
the Sub-Antarctic Zone (SAZ). Southwards, the Sub-Antarctic Front (SAF) separates 1267
the SAZ from the Polar Frontal Zone (PFZ) with a drop in salinity (Whitworth and 1268
Nowlin, 1987). During the ANTXXIV/3 cruise the SAF was located north of station 1269
103 at ~46ºS (Figure 1). The PF is defined by a temperature of 2ºC at 200 m (Pollard 1270
et al., 2002) and was located at 50º16’S just north of station 107. The Antarctic Zone 1271
(AAZ) is located on the Bouvet Triple Junction region (Atlantic-Indian Ridge which 1272
Chapter 4: Atlantic Sector of the Southern Ocean 1/2
59
separates the South Atlantic Basin and the Weddell Basin) and is delimited 1273
northwards by the Polar Front (PF) and southwards by the Southern Boundary (SB). 1274
The SB was located between 55º30’S and 56ºS on the Zero Meridian. The eastwards 1275
flowing ACC is found between the SAF and the SB. The Weddell Gyre is located 1276
between the SB and the Antarctic continent (Pollard et al., 2002). 1277
1278
2.3. Water masses 1279
2.3.1. Along the Zero Meridian 1280
At the surface, the South Atlantic Surface Water (SASW, warm >12ºC, Whitworth 1281
and Nowlin, 1987) is found north of the STF and the Sub-Antarctic Surface Water 1282
(SSW) is found in the SAZ. The North Atlantic Deep Water (NADW, colder and more 1283
saline) flows along the bottom in the SAZ and PFZ. The Antarctic Intermediate Water 1284
(AAIW) flows northwards between the NADW and the surface water north of the PF. 1285
In the AAZ, the Circumpolar Deep Water is the main water mass present and is 1286
divided into the Upper Circumpolar Deep Water (UCDW) and the Lower Circumpolar 1287
Deep Water (LCDW). South of the SB (55ºS), in the Weddell Gyre the Antarctic 1288
Surface Water (AASW) coming from the ice melting during the summer (<5ºC) and 1289
the Antarctic deep water (colder and more saline) are found. This last water mass is 1290
divided into 3 separated water masses (Carmack and Foster, 1975; Fahrbach et al., 1291
2004; Klatt et al., 2005), the Warm Deep Water (WDW) between ~200-1000 m with 1292
positive temperatures, the Weddell Sea Deep Water (WSDW, temperatures between 1293
0ºC and -0.7ºC) and the Weddell Sea Bottom Water (WSBW, temperature below - 1294
0.7ºC). 1295
1296
2.3.2. In the Weddell Gyre 1297
The Weddell Sea is an important region in the Southern Ocean because it is the main 1298
location where the Antarctic bottom water is formed (Klatt et al., 2005). The cold 1299
surface water sinks along the continental slope of the Antarctic Peninsula towards the 1300
bottom and circulates eastwards along the North Weddell Ridge and the Southern 1301
Indian Ridge. The Weddell Gyre is limited westwards by the Antarctic Peninsula 1302
(60ºW) and extends eastwards along the North Weddell Ridge (60ºS) and along the 1303
Chapter 4: Atlantic Sector of the Southern Ocean 1/2
60
Southwest Indian Ridge (50-55ºS) until the Enderby Basin at 30ºE (Deacon, 1979; 1304
Gouretski and Danilov, 1993). The circulation of the water in the Weddell Gyre is 1305
cyclonic. The Weddell Sea is mainly constituted of the WDW, WSDW and WSBW. 1306
On top is the surface water (SW) about 100-200 m thick, with negative temperatures 1307
due to sea-ice melting. 1308
1309
2.3.3. Through the Drake Passage 1310
The Drake Passage is a relatively narrow pathway between South America and the 1311
Antarctic Peninsula where the Antarctic Circumpolar Current and the South Pacific 1312
Currents converge. In this passage, the ACC is the main water mass present and is 1313
divided into the UCDW and the LCDW. The South Pacific Deep Water (SPDW), 1314
dense and characterised by high concentration of SiO4, is also found (Sievers et al., 1315
1984). The Weddell Sea Bottom Water is also found in the Drake Passage. After 1316
bypassing the Antarctic Peninsula, the WSBW follows the bottom topography and 1317
circulates westwards along the continental slope in the Drake Passage. 1318
1319
3. Additional details on the materials and methods 1320
3.1. Cruise track and sampling strategy 1321
The ANT XXIV/3 expedition onboard R.V. Polarstern started from Cape Town, 1322
South Africa (February 2008), going south-westwards and reached the Zero Meridian 1323
at ~50ºS (Figure 1). The Sub-Tropical Front (STF), the Sub-Antarctic Front (SAF), 1324
the Polar Front (PF) and the Southern boundary of the Antarctic Circumpolar Current 1325
(SB in the present study) were successively crossed on the Zero Meridian. The 1326
Southern Boundary is also called SBdy in the Drake Passage by others (Barré et al., 1327
2008). The expedition continued across the Weddell Sea to King Georges Island, and 1328
finally traversed the Drake Passage until arrival in Punta Arenas, Chile (April 2008). 1329
1330
Chapter 4: Atlantic Sector of the Southern Ocean 1/2
61
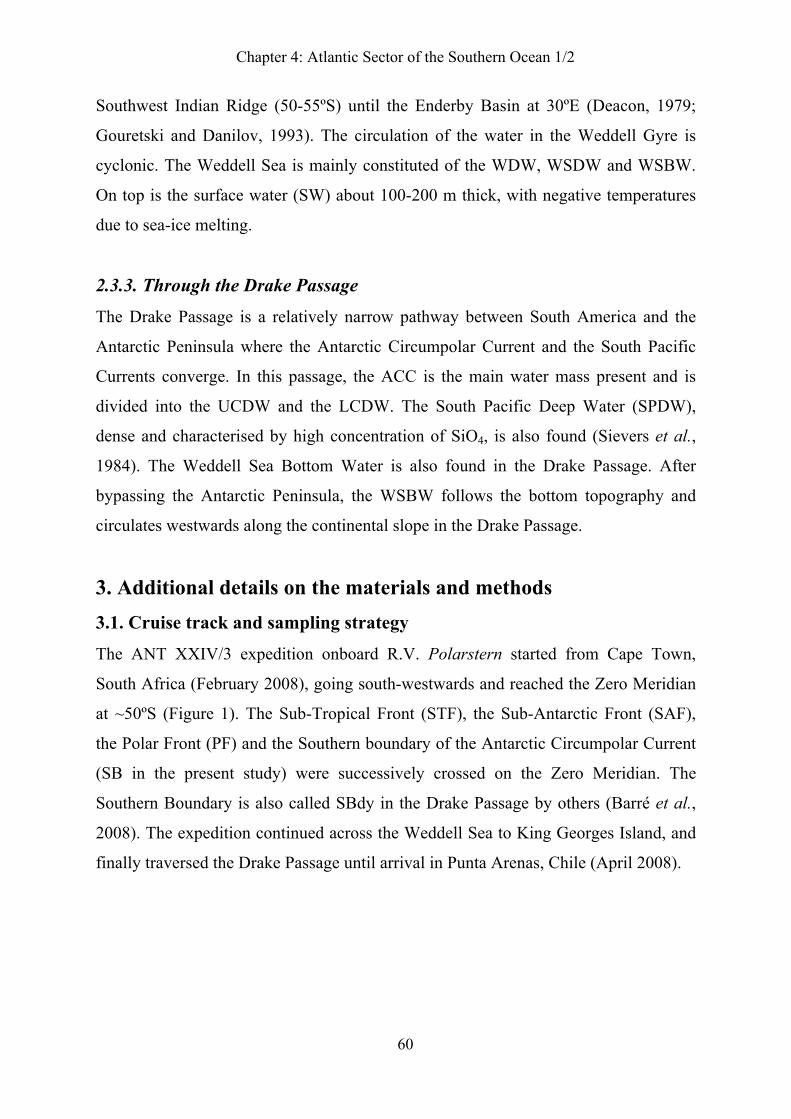
1331 Figure 1: Chart of the Atlantic sector of the Southern Ocean and location of the fronts 1332
and zones. The 10 stations sampled for this study are indicated by large black dots 1333
with station numbers. The small grey dots represent the additional stations also 1334
sampled with the titanium frame from NIOZ. The dashed line delimits the Weddell 1335
Gyre. STF = Sub-Tropical Front; SAF = Sub-Antarctic Front; PF = Polar Front; SB 1336
= Southern Boundary; SAZ = Sub-Antarctic Zone (St. 101); PFZ = Polar Frontal 1337
Zone (St. 103); AAZ = Antarctic Zone (St. 107); ACC = Antarctic Circumpolar 1338
Current; Weddell Gyre (St. 128, 131, 163, 178, 193 and 210. 1339
1340
Overall 10 stations were sampled (Figure 1), for a total of 82 samples: 7 stations 1341
along the Zero Meridian, 2 stations in the Weddell Sea and 1 station in the Drake 1342
Passage. Station 101 was located in the SAZ (42.34ºS), station 103 in the PFZ (46ºS), 1343
station 107 in the AAZ south of the PF (50.27ºS). Stations 128 (58ºS), 131 (59ºS), 163 1344
(67ºS) and 178 (69.4ºS) were situated in the eastern part of Weddell Gyre on the Zero 1345
Meridian. The stations 193 and 210 were taken in the Weddle Sea. The station 244 1346
was located north of the PF in the Drake Passage (between 57º41’S and 57º51’S) and 1347
south of the SAF. Each sample was taken at judiciously chosen depths in order to 1348
sample all the different water masses present. 1349
Chapter 4: Atlantic Sector of the Southern Ocean 1/2
62
1350
3.2. Fluorescence 1351
Fluorescence, given in arbitrary unit (a.u.), was obtained from the NIOZ CTD sensor 1352
installed on the titanium frame. It corresponds to chlorophyll-a and is an indicator of 1353
phytoplankton abundance in seawater (Kiefer et al., 1973; Babin et al., 1996). Note 1354
that we discuss the layer where the fluorescence is >0.1 a.u. as the euphotic layer (this 1355
chapter and next chapters). The euphotic layer is defined as the depth range where the 1356
measured Photosynthetic Active Radiation (PAR) is more than 1 % of the incoming 1357
PAR at the sea surface (i.e. from sea surface until the 1% light depth) and is slightly 1358
different to the depth where the fluorescence was >0.1 a.u.. We did so to combine the 1359
influence of the light irradiance and of the presence of phytoplankton. 1360
1361
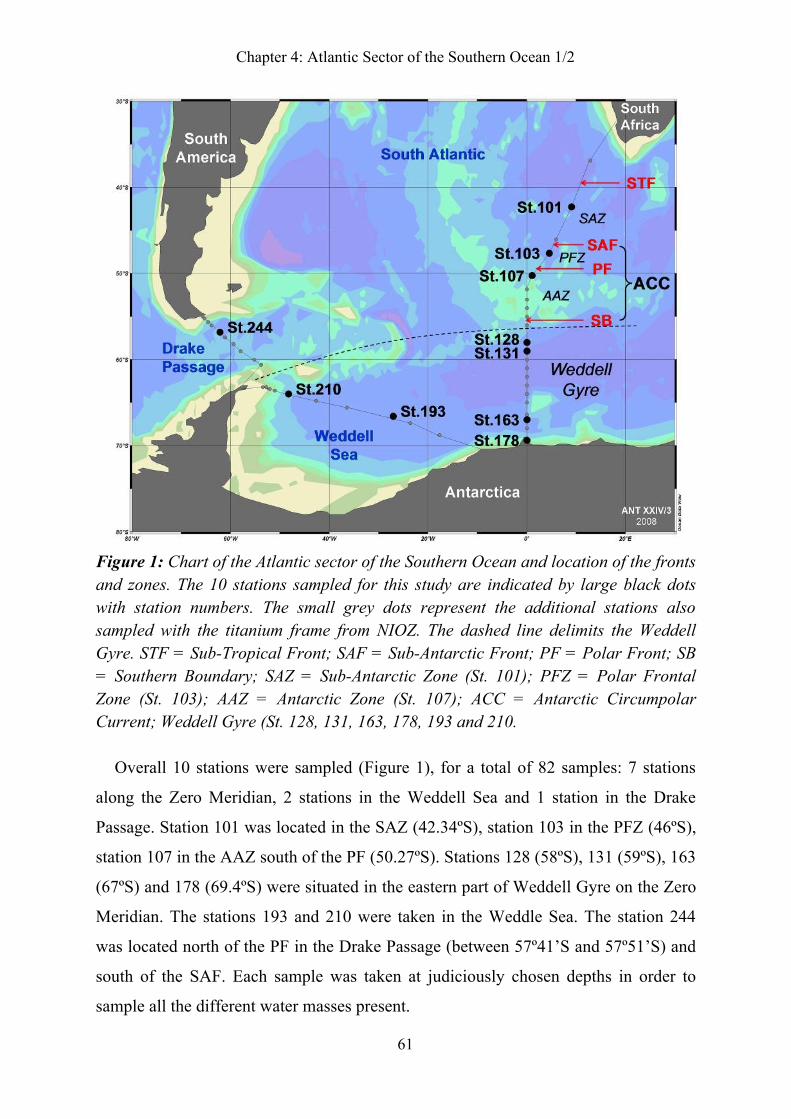
Table 1: Averaged fluorescence (arbitrary unit, a.u.) in the surface layer per station. 1362
Standard deviations (S.D.), the number of samples (n) and the maximum depth (m) 1363
where fluorescence > 0.1 a.u. are shown. 1364
Stations Fluorescence (a.u.) S.D. n Maximum depth (m)
101 0.41 0.21 6 100
103 0.59 0.26 5 75
107 0.30 0.02 6 100
128 0.27 0.04 5 90
131 0.11 0.01 4 100
163 0.94 0.51 6 100
178 1.01 0.97 7 140
193 0.42 0.17 6 100
210 0.16 0.01 4 50
244 0.24 0.02 7 100
Relatively high values in surface waters corresponding to a chlorophyll maximum 1365
at about 50 m depth (euphotic zone) and a decrease with depth towards the aphotic 1366
zone were observed. At station 178 the fluorescence could even be detected at ~140 m 1367
depth. 1368
Table 1 shows the average of fluorescence in the surface layer per station when it 1369
was > 0.1 a.u.. Stations 101 and 103 had relatively high fluorescence compared to 1370
stations 131 and 210 where lower fluorescence was recorded. Close to the ice edge 1371
Chapter 4: Atlantic Sector of the Southern Ocean 1/2
63
(St. 163 and 178) the highest fluorescence of all stations was measured due to a 1372
phytoplankton bloom. 1373
1374
4. Results 1375
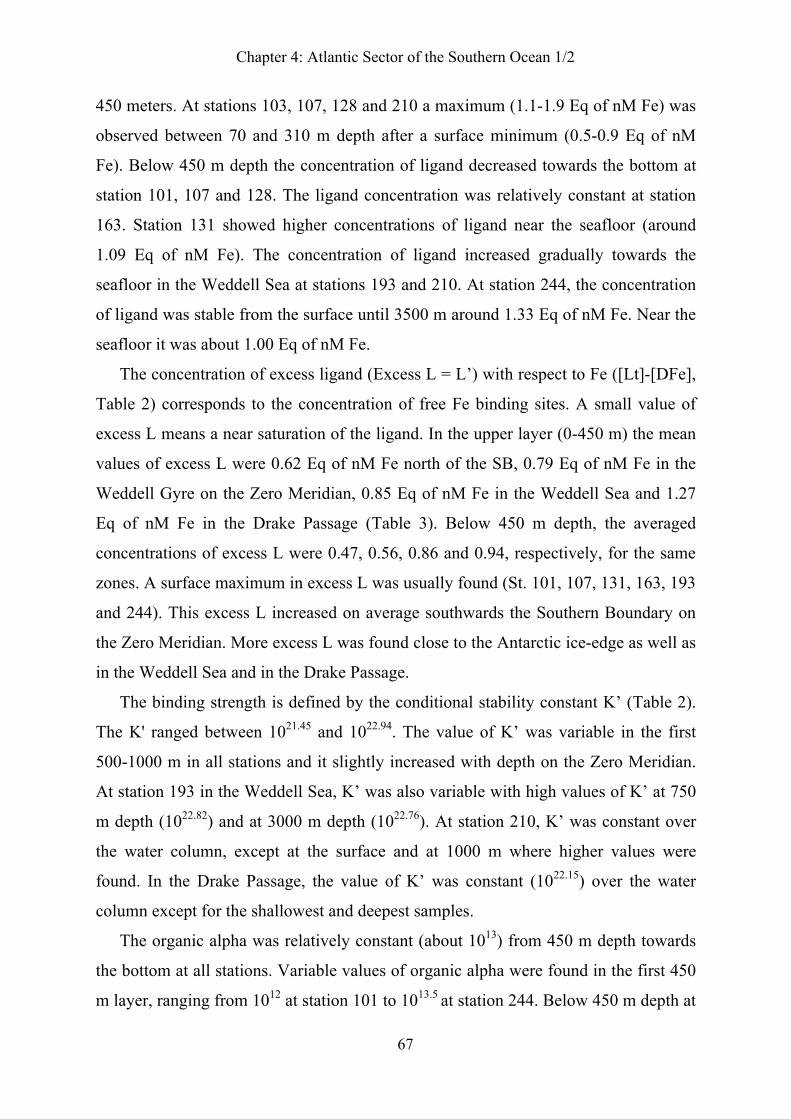
4.1. Dissolved Fe distribution 1376
The concentrations of dissolved Fe along the Zero Meridian (Figure 2 and Table 2) 1377
from the same expedition are shown in detail by Klunder et al. (2011). At the stations 1378
presented here, the concentration of dissolved Fe was always below the nano-molar 1379
level and showed a nutrient-like vertical profile. 1380
With a surface minimum at all stations (between 0.02 and 0.19 nM) the 1381
concentration of dissolved Fe increased with depth with a maximum just above the 1382
seafloor (St. 163: 0.58 nM; St. 193: 0.59 nM), or became more or less constant below 1383
500-1000 m (St. 101: 0.63 nM; St. 103: 0.56 nM; St. 131: 0.36 nM; St. 244: 0.40 nM). 1384
Station 107 located south of the PF showed variability in the concentrations of 1385
dissolved Fe in the upper layers (0-450 m). It remained constant below 450 m at ~0.55 1386
nM. At station 128 a steep increase was found from the surface until 450 m (until 0.76 1387
nM) followed by a minimum at 1000 m (0.35 nM), and by a second maximum at 2500 1388
m (0.68 nM) and a decrease towards the bottom. Two samples were taken at station 1389
178 in the upper water at 137 and 451 m depth with 0.08 and 0.17 nM of Fe, 1390
respectively. Station 210 close to the Antarctic Peninsula slope had a maximum 1391
concentration of Fe between 1000 and 1500 m (0.46 nM) ascribed to hydrothermal 1392
input (Klunder et al., 2011). 1393
1394
1395
1396
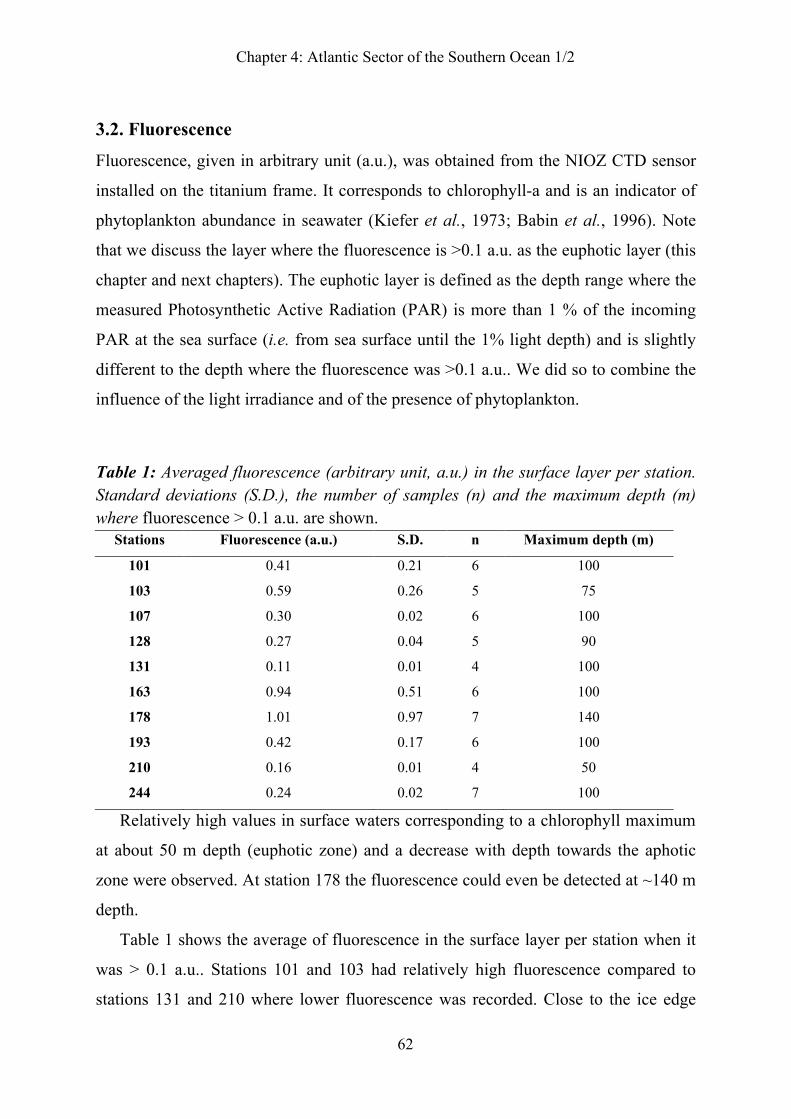
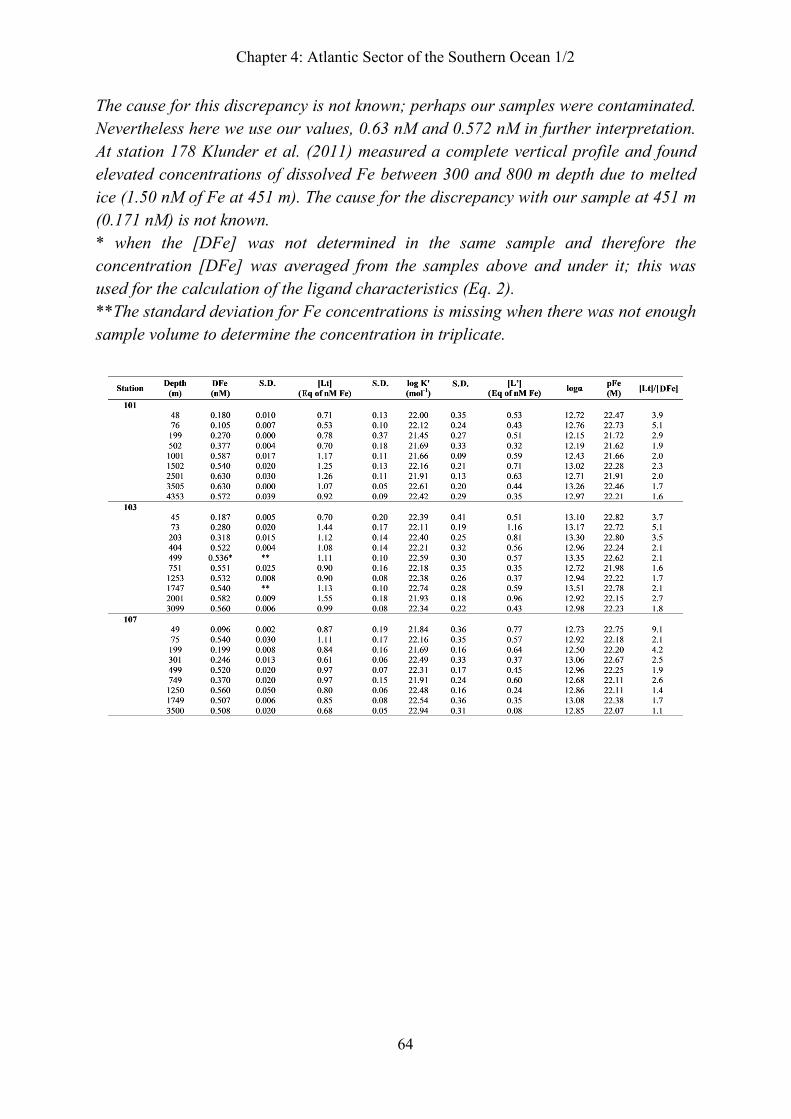
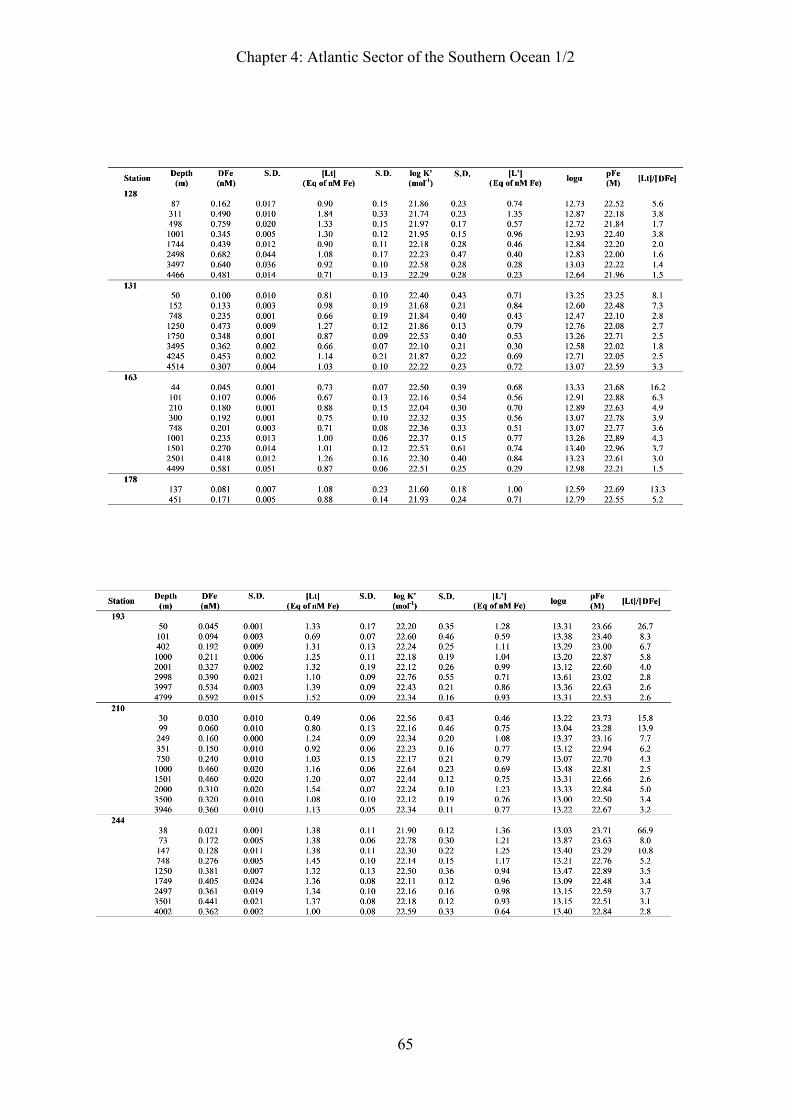
Table 2 (Below and next page): Dissolved Fe and the characteristics of the dissolved 1397
Fe binding ligands of all samples. Dissolved Fe concentrations [DFe] are in nM (± 1398
standard deviations). Concentrations of the ligand [Lt] and the excess ligand [L’] are 1399
in Eq of nM Fe (± standard deviations). Conditional stability constants K’ are in mol-1 1400
with standard deviations. 1401
At station 101 the deepest samples collected at 3505 m and 4353 m had higher values 1402
of dissolved Fe, 0.630 nM and 0.572 nM, respectively, as compared with the duplicate 1403
sub-samples reported by Klunder et al. (2011), 0.401 nM and 0.280 nM, respectively. 1404
Chapter 4: Atlantic Sector of the Southern Ocean 1/2
64
The cause for this discrepancy is not known; perhaps our samples were contaminated. 1405
Nevertheless here we use our values, 0.63 nM and 0.572 nM in further interpretation. 1406
At station 178 Klunder et al. (2011) measured a complete vertical profile and found 1407
elevated concentrations of dissolved Fe between 300 and 800 m depth due to melted 1408
ice (1.50 nM of Fe at 451 m). The cause for the discrepancy with our sample at 451 m 1409
(0.171 nM) is not known. 1410
* when the [DFe] was not determined in the same sample and therefore the 1411
concentration [DFe] was averaged from the samples above and under it; this was 1412
used for the calculation of the ligand characteristics (Eq. 2). 1413
**The standard deviation for Fe concentrations is missing when there was not enough 1414
sample volume to determine the concentration in triplicate. 1415
1416
1417 1418
Chapter 4: Atlantic Sector of the Southern Ocean 1/2
65
1418
1419
1420
1421
1422
1423
1424 1425
1426
Chapter 4: Atlantic Sector of the Southern Ocean 1/2
66
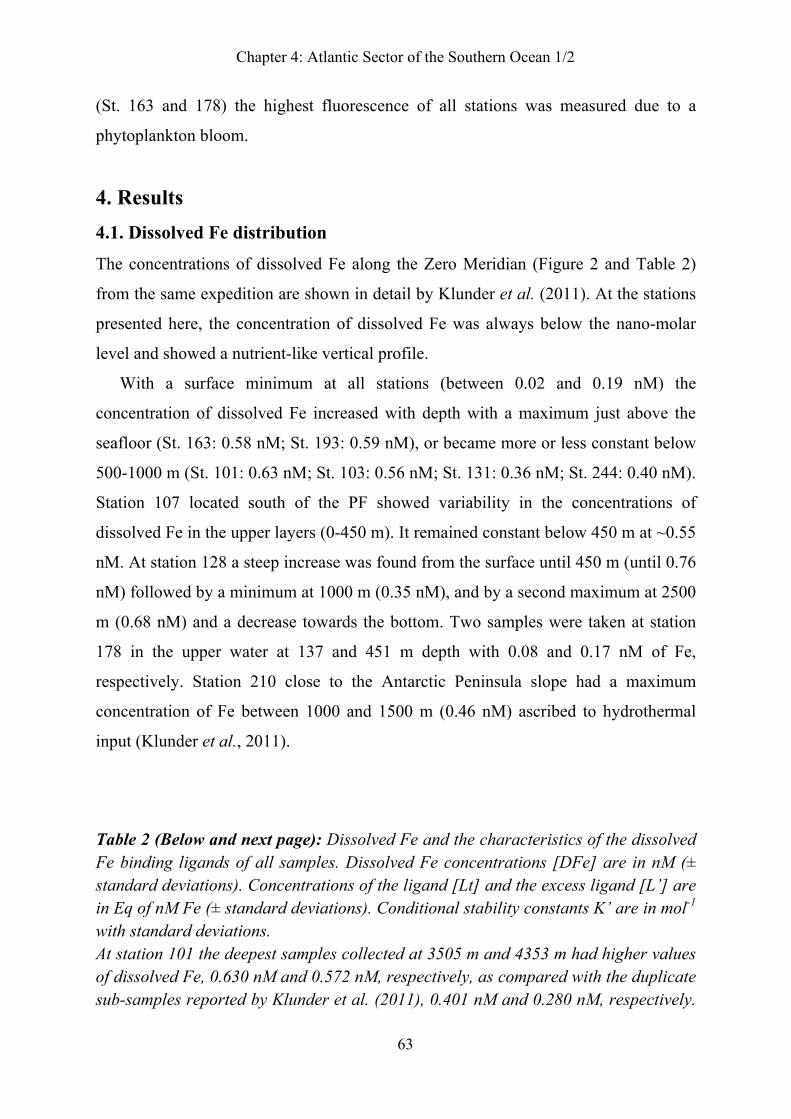
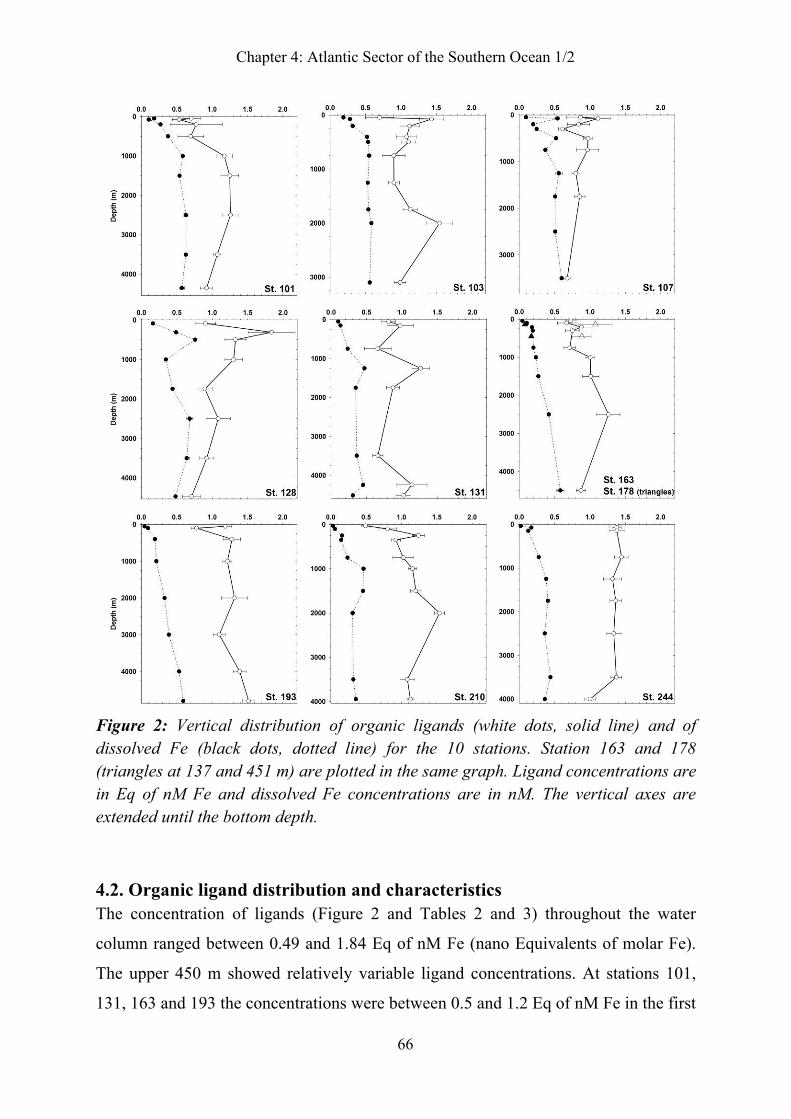
1427 Figure 2: Vertical distribution of organic ligands (white dots, solid line) and of 1428
dissolved Fe (black dots, dotted line) for the 10 stations. Station 163 and 178 1429
(triangles at 137 and 451 m) are plotted in the same graph. Ligand concentrations are 1430
in Eq of nM Fe and dissolved Fe concentrations are in nM. The vertical axes are 1431
extended until the bottom depth. 1432
1433
1434
4.2. Organic ligand distribution and characteristics 1435
The concentration of ligands (Figure 2 and Tables 2 and 3) throughout the water 1436
column ranged between 0.49 and 1.84 Eq of nM Fe (nano Equivalents of molar Fe). 1437
The upper 450 m showed relatively variable ligand concentrations. At stations 101, 1438
131, 163 and 193 the concentrations were between 0.5 and 1.2 Eq of nM Fe in the first 1439
Chapter 4: Atlantic Sector of the Southern Ocean 1/2
67
450 meters. At stations 103, 107, 128 and 210 a maximum (1.1-1.9 Eq of nM Fe) was 1440
observed between 70 and 310 m depth after a surface minimum (0.5-0.9 Eq of nM 1441
Fe). Below 450 m depth the concentration of ligand decreased towards the bottom at 1442
station 101, 107 and 128. The ligand concentration was relatively constant at station 1443
163. Station 131 showed higher concentrations of ligand near the seafloor (around 1444
1.09 Eq of nM Fe). The concentration of ligand increased gradually towards the 1445
seafloor in the Weddell Sea at stations 193 and 210. At station 244, the concentration 1446
of ligand was stable from the surface until 3500 m around 1.33 Eq of nM Fe. Near the 1447
seafloor it was about 1.00 Eq of nM Fe. 1448
The concentration of excess ligand (Excess L = L’) with respect to Fe ([Lt]-[DFe], 1449
Table 2) corresponds to the concentration of free Fe binding sites. A small value of 1450
excess L means a near saturation of the ligand. In the upper layer (0-450 m) the mean 1451
values of excess L were 0.62 Eq of nM Fe north of the SB, 0.79 Eq of nM Fe in the 1452
Weddell Gyre on the Zero Meridian, 0.85 Eq of nM Fe in the Weddell Sea and 1.27 1453
Eq of nM Fe in the Drake Passage (Table 3). Below 450 m depth, the averaged 1454
concentrations of excess L were 0.47, 0.56, 0.86 and 0.94, respectively, for the same 1455
zones. A surface maximum in excess L was usually found (St. 101, 107, 131, 163, 193 1456
and 244). This excess L increased on average southwards the Southern Boundary on 1457
the Zero Meridian. More excess L was found close to the Antarctic ice-edge as well as 1458
in the Weddell Sea and in the Drake Passage. 1459
The binding strength is defined by the conditional stability constant K’ (Table 2). 1460
The K' ranged between 1021.45 and 1022.94. The value of K’ was variable in the first 1461
500-1000 m in all stations and it slightly increased with depth on the Zero Meridian. 1462
At station 193 in the Weddell Sea, K’ was also variable with high values of K’ at 750 1463
m depth (1022.82) and at 3000 m depth (1022.76). At station 210, K’ was constant over 1464
the water column, except at the surface and at 1000 m where higher values were 1465
found. In the Drake Passage, the value of K’ was constant (1022.15) over the water 1466
column except for the shallowest and deepest samples. 1467
The organic alpha was relatively constant (about 1013) from 450 m depth towards 1468
the bottom at all stations. Variable values of organic alpha were found in the first 450 1469
m layer, ranging from 1012 at station 101 to 1013.5 at station 244. Below 450 m depth at 1470
Chapter 4: Atlantic Sector of the Southern Ocean 1/2
68
the stations north of the SB and in the north part of the Weddell Gyre (until station 1471
131) the values of organic alpha were smaller than 1013. Below 450 m depth at the 1472
stations close to the Antarctic ice edge, in the Weddell Sea and in the Drake Passage 1473
the values of organic alpha were larger than 1013 due to higher excess L in these 1474
regions. 1475
Relatively low pFe values (Table 2) corresponding to relatively high Fe3+ 1476
concentrations are due to lower organic alpha values and thus either weaker ligands or 1477
lower concentrations of excess L. At stations 101 until 131, pFe decreased from 22.5- 1478
23 at the surface to approximately 22 at 450 m depth and remained constant towards 1479
the bottom. At stations 163, 193, 210 and 244, a decrease in pFe from 23.7-23.8 at the 1480
surface to 22.2-22.5 near the seafloor was found. 1481
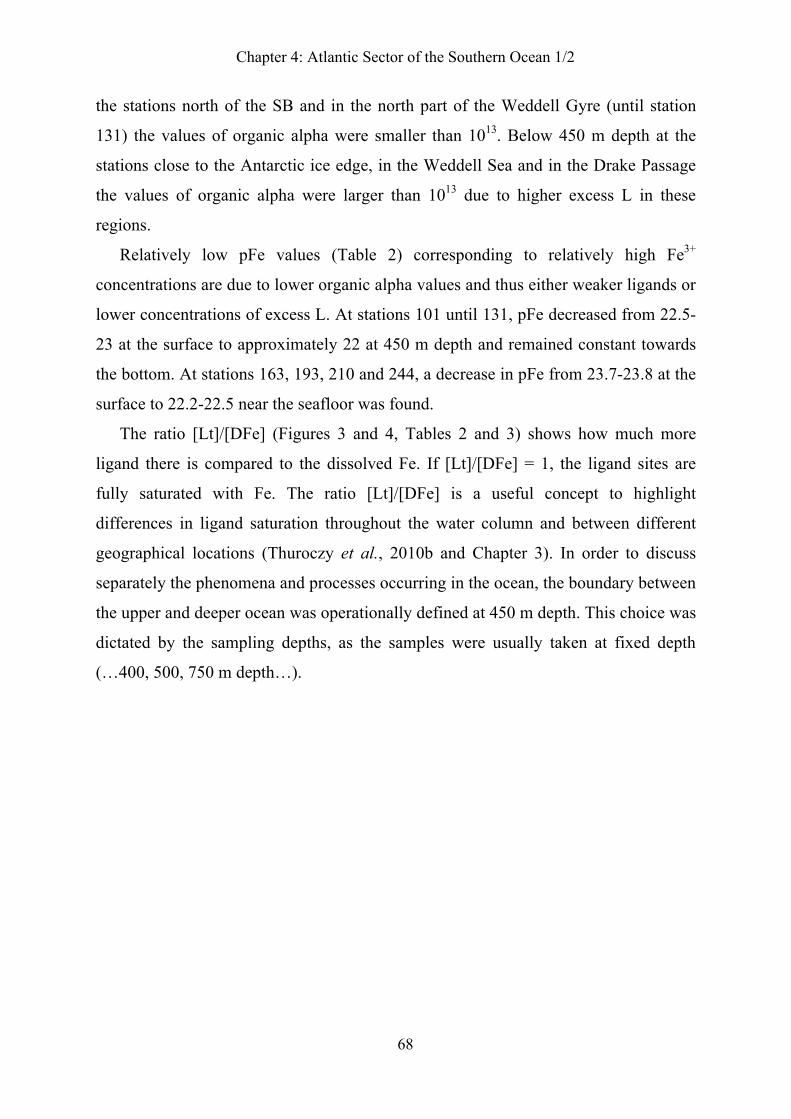
The ratio [Lt]/[DFe] (Figures 3 and 4, Tables 2 and 3) shows how much more 1482
ligand there is compared to the dissolved Fe. If [Lt]/[DFe] = 1, the ligand sites are 1483
fully saturated with Fe. The ratio [Lt]/[DFe] is a useful concept to highlight 1484
differences in ligand saturation throughout the water column and between different 1485
geographical locations (Thuroczy et al., 2010b and Chapter 3). In order to discuss 1486
separately the phenomena and processes occurring in the ocean, the boundary between 1487
the upper and deeper ocean was operationally defined at 450 m depth. This choice was 1488
dictated by the sampling depths, as the samples were usually taken at fixed depth 1489
(…400, 500, 750 m depth…). 1490
1491
Chapter 4: Atlantic Sector of the Southern Ocean 1/2
69
1492 Figure 3: Ratio values of [Lt]/[DFe]. A: North of the SB; B: Weddell Gyre on the 1493
Zero Meridian; C: Weddell Sea; D: Drake Passage. The dotted line marks exact 1494
saturation of the ligand with [Lt]/[DFe] = 1. Note the different scales on the 1495
horizontal axis for the ratio values. 1496
1497
Chapter 4: Atlantic Sector of the Southern Ocean 1/2
70
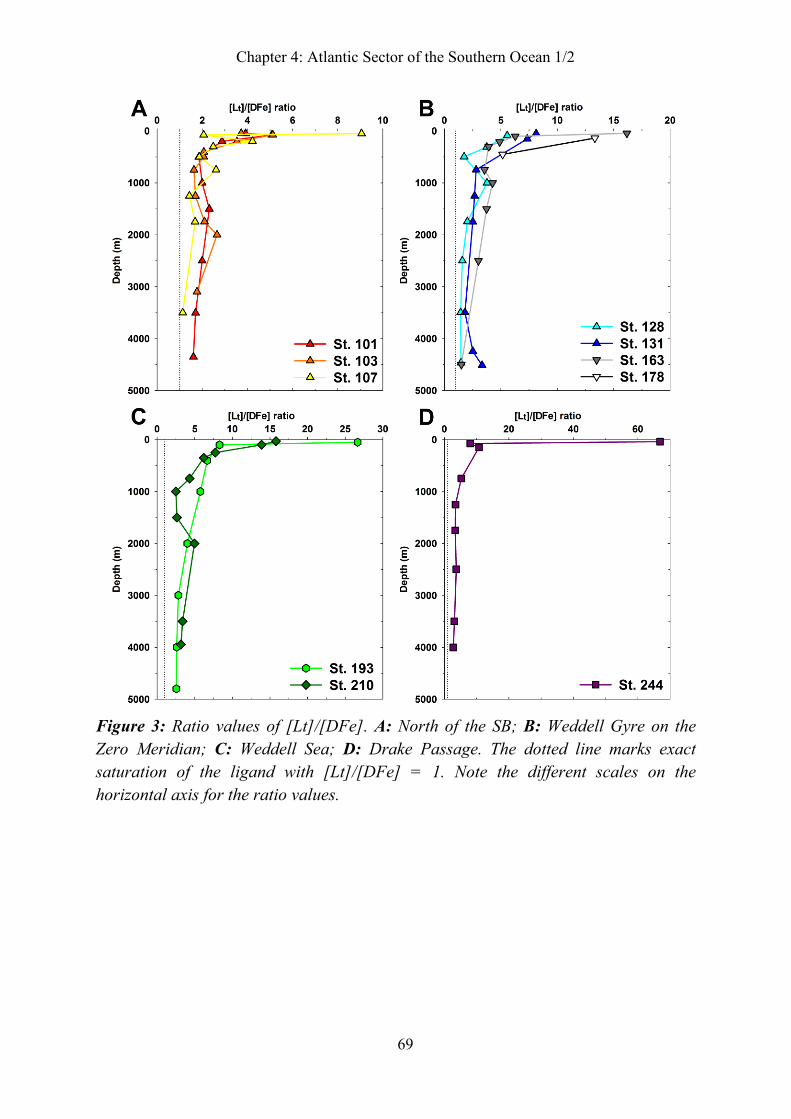
Table 3: Average and standard deviation of [Lt] (Eq of nM Fe), [DFe] (nM), [L’] (Eq 1497
of nM Fe) and the ratio [Lt]/[DFe] per station and per zone. A: in the upper layer (0- 1498
450 m). B: in the deeper part of the ocean (below 450 m depth). C: subdivision of the 1499
upper layer for [Lt]/[DFe]: samples from the surface are shown separately from those 1500
in the euphotic layer (where fluorescence > 0.1 a.u., surface sample included) and in 1501
the layer below it until 450 m depth (Intermediate layer). 1502
* indicates large standard deviation (Station 244) due to the extremely high surface 1503
ratio [Lt]/[DFe] (66.9) compared to the value below this. 1504
1505 1506
1507 1508
1509 1510
A trend was seen in the [Lt]/[DFe] ratio with depth in the water column. High 1511
[Lt]/[DFe] ratio values were found at the surface with a decrease until 450 m (Figures 1512
3 and 4, Table 3). The upper layer (0-450 m) was characterised by low dissolved Fe 1513
Chapter 4: Atlantic Sector of the Southern Ocean 1/2
71
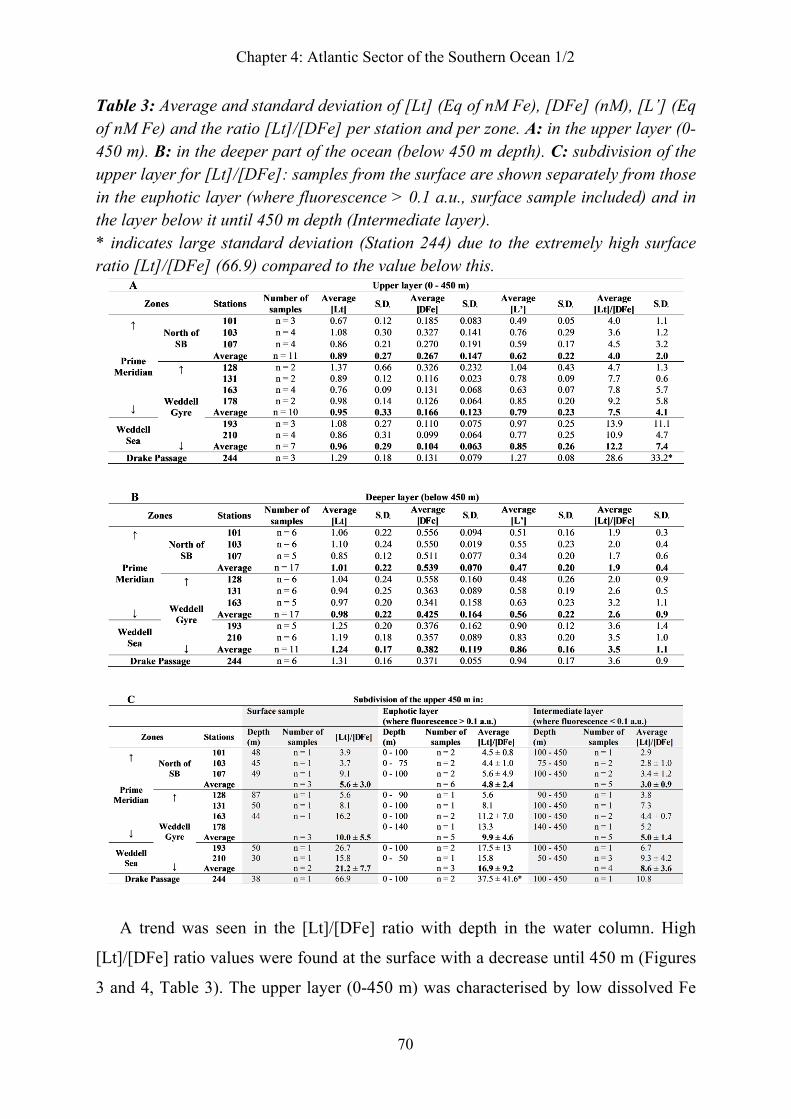
concentrations (surface minima) and variable ligand concentrations. To highlight the 1514
steep decrease of the ratio [Lt]/[DFe] from the upper layer downwards, the ratios of 1515
the samples from the surface, i.e. the samples where phytoplankton grew 1516
(fluorescence > 0.1 a.u., Table 1) and of the layer underneath until 450 m depth 1517
(fluorescence < 0.1 a.u.) are shown separately in Table 3C. 1518
Below 450 m depth the ratios [Lt]/[DFe] were lower and more constant with depth. 1519
This deeper part appeared to be a relatively stable environment (constant 1520
concentrations of dissolved Fe and of ligand) where degradation and remineralisation 1521
of the organic matter were the dominant chemical processes. A trend in [Lt]/[DFe] 1522
between geographical locations was also seen (Figures 3 and 4, Table 3). The ratio 1523
values [Lt]/[DFe] increased on average over the whole water column southwards the 1524
Southern Boundary on the Zero Meridian and from east to west in the Weddell Gyre. 1525
1526
1527 Figure 4: Values of [Lt]/[DFe] per station. On the left side: surface values of 1528
[Lt]/[DFe]. On the right side: averaged values of [Lt]/[DFe] with standard 1529
deviations in the layer below 450 m depth. Station 178 is not shown here since only 2 1530
samples were taken (137 m and 451 m depth). 1531
1532
1533
Chapter 4: Atlantic Sector of the Southern Ocean 1/2
72
5. Discussion 1533
5.1. Comparison with literature 1534
The ligand concentrations presented here are similar to the 0.4 and 1.4 Eq of nM Fe 1535
reported for the upper 1000 m at 2 stations close to the ice edge at 0º and 10ºW by 1536
Boye et al. (2001) and along the 20ºE in the ACC. Surface water (until 100 m depth) 1537
ligand and Fe concentrations published by Boye et al. (2005) from the EisenEx 1538
experiment were also comparable at 0.5-0.7 Eq of nM Fe and 0.05 nM, respectively. 1539
In addition, similar Fe speciation was estimated (between 0.5 and 1.5 Eq of nM Fe) 1540
for the Kerguelen Archipelago Plateau in the Southern Ocean by Gerringa et al. 1541
(2008), with the exception of the deepest samples. These higher ligand concentrations 1542
at depth were attributed to the influence of the sediments. Only at station 131 were the 1543
ligand concentrations found below 4000 m similar to those measured by Gerringa et 1544
al. (2008). 1545
The K’ values for the entire water column calculated by Gerringa et al. (2008) 1546
using the same method were lower (< 1022) than the K’ values estimated here (mainly 1547
> 1022). At 55º49’S-6º1’E Croot et al. (2004b) found, below a surface minimum (1 Eq 1548
of nM Fe), a decrease in the concentration of ligand from 2.5 Eq of nM Fe at 30 m 1549
depth to 1.2 Eq of nM Fe at 400 m. This result is comparable to station 128 located in 1550
the same area. The K’ values found by Croot et al. (2004b) were also similar (around 1551
1022) to those found here in the upper 400 m. The dissolved organic ligand 1552
characteristics observed during the present study and by others (Powell and Donat, 1553
2001; Gerringa et al., 2008) did not indicate differences between water masses. 1554
1555
5.2. Upper layer of the ocean (0-450 m) 1556
The trend of an increasing [Lt]/[DFe] ratio in the upper waters (Tables 3A and 3C, 1557
Figure 4) from north to south on the Zero Meridian and from east to west in the 1558
Weddell Gyre probably reflects the existing phytoplankton regimes (Sub-Antarctic 1559
region and HNLC region). The high surface ratio confirms the importance of 1560
phytoplankton in increasing the ratio [Lt]/[DFe], by Fe uptake and probably ligand 1561
production. Both the concentrations of dissolved Fe and of ligands explain the 1562
difference in ratios [Lt]/[DFe], lower north of the SB and higher in the Weddell Gyre. 1563

Chapter 4: Atlantic Sector of the Southern Ocean 1/2
73
Within the Weddell Gyre, the increase in [Lt]/[DFe] ratio from east to west was due to 1564
a decrease in the concentration of dissolved Fe only. Lower concentrations of 1565
dissolved Fe were found in the Weddell Sea proper (0.10 nM, n = 7) as compared to 1566
those found in the Weddell Gyre on the Zero Meridian (0.17 nM, n = 10). The 1567
concentrations of ligand and excess L were relatively constant in the Weddell Gyre. 1568
The values of organic alpha and pFe also showed a trend in the upper layer between 1569
geographical locations. The increase of organic alpha from north to south on the Zero 1570
Meridian and from east to west in the Weddell Gyre was due to an increase in excess 1571
L, whereas the increase in pFe value in the upper layer was due to a decrease of the 1572
dissolved Fe concentration and an increase of the organic alpha. Station 244, located 1573
in the Drake Passage, showed the highest [Lt]/[DFe] ratio at the surface caused by 1574
both a high ligand concentration relative to a very low dissolved Fe concentration 1575
(0.021 nM). The trend of the ratio [Lt]/[DFe] between geographical locations is seen 1576
in the ratio [Lt]/[DFe] of the surface samples (0-50 m) (Table 3C), but also in the 1577
euphotic layer (fluorescence > 0.1 a.u.) and in the layer below this (fluorescence < 0.1 1578
a.u.). 1579
The high [Lt]/[DFe] at the surface can be explained by the uptake of Fe and 1580
production of ligands (relatively high and variable ligand concentrations) by 1581
phytoplankton in the euphotic layer and by the microbial activity degrading the non- 1582
resistant ligands (Rue and Bruland, 1997; Tortell et al., 1999; Boye and Van Den 1583
Berg, 2000; Croot et al., 2001; Gerringa et al., 2006). The ligand concentration 1584
represents the difference between the production and the degradation of the Fe- 1585
binding molecules (Boye et al., 2001). 1586
The stations were located in regions influenced by different “regimes” in terms of 1587
primary production. The regime in the surface waters at stations 101, 103 and 107 1588
(Sub-Antarctic region) is thus very different from the other stations. Relatively low 1589
[Lt]/[DFe] ratio values were found at these stations. Relatively high fluorescence was 1590
measured here and Fe was not a limiting factor for phytoplankton growth at these 3 1591
stations. Moreover, the dissolved organic ligand concentration was lower here. This 1592
indicated that there was no (need for) production of ligands like siderophores by 1593
prokaryotes. 1594
Chapter 4: Atlantic Sector of the Southern Ocean 1/2
74
The stations located in the HNLC regions (128, 131, 163, 178, 193 and 210) had 1595
low dissolved Fe concentrations and relatively constant ligand concentrations, 1596
resulting in higher [Lt]/[DFe] ratio values. Near the edge of the Antarctic ice sheet 1597
even higher [Lt]/[DFe] ratio values were found. Here a phytoplankton bloom was 1598
clearly observed by high fluorescence at station 163 and 178 (Table 1): a source of Fe 1599
was apparently available since the bloom had started. The melting of the Antarctic ice- 1600
sheet, its calving icebergs and of the seasonal sea-ice was shown to be a source of 1601
dissolved Fe in seawater by Klunder et al. (2011). This extra Fe was consumed 1602
resulting in low dissolved Fe concentrations. Here, the ligand concentration was 1603
relatively constant and was not responsible for the high [Lt]/[DFe] ratio values. 1604
However, in the Weddell Sea, even higher ratios [Lt]/[DFe] were found at the surface, 1605
whereas, the fluorescence in the water was low. Low dissolved Fe concentrations 1606
occurring here explained this high ratio [Lt]/[DFe]. The low dissolved Fe 1607
concentration might be caused by a phytoplankton bloom in the recent past or more 1608
probably Fe is taken up by phytoplankton living in the sea-ice. The Weddell Sea is 1609
known to be a productive area with high biological diversity supported by the growth 1610
of phytoplankton in the sea-ice (Arrigo et al., 1997; Flores, 2009). So, even if 1611
relatively low fluorescence was measured in the water, Fe consumption should be 1612
high. 1613
The particulate fraction, an important part of the Fe cycle, is still missing in the 1614
present study and should help to explain the processes occurring in the upper ocean. 1615
Adsorption sites on suspended particles compete with empty ligand sites in the 1616
dissolved fraction for Fe (Thuróczy et al, 2010b and Chapter 3). The adsorption on 1617
suspended particles followed by aggregation and downward settling of these particles 1618
is deemed to be responsible for the removal of Fe by scavenging. 1619
1620
5.3. Deeper part of the ocean (below 450 m) 1621
Below 450 m depth, the values of [Lt]/[DFe] were low and constant with depth. Like 1622
the upper layer (0-450 m depth), the deeper part of the water column also showed a 1623
geographical trend: an increase of the ratio [Lt]/[DFe] southwards the Southern 1624
Boundary on the Zero Meridian and from east to west in the Weddell Gyre. 1625
Chapter 4: Atlantic Sector of the Southern Ocean 1/2
75
The difference between Zero Meridian and Weddell Sea was due to a lower 1626
concentration of ligand (1.00 of Eq of nM Fe, n = 34; versus 1.24 Eq of nM Fe, n = 1627
11, respectively). The southward decrease in dissolved Fe concentration on the Zero 1628
Meridian was due to an absence of Fe sources (Klunder et al., 2011). Moreover, 1629
excess L increased southwards along the Zero Meridian, thus reinforcing the same 1630
trend in [Lt]/[DFe]. Within the Weddell Gyre, the increase of [Lt]/[DFe] ratios from 1631
east to west was caused by both the concentrations of dissolved Fe (decrease) and the 1632
ligand concentration (increase). Obviously the excess ligand concentration also 1633
increased from east to west in the Weddell Gyre resulting in the increase of organic 1634
alpha value and combined with the decrease in the dissolved Fe concentration, an 1635
increase in pFe. Finally, the relatively high ratios of [Lt]/[DFe] in the deep part of the 1636
Drake Passage were due to high concentrations of ligand (1.31 Eq of nM Fe, n = 6) 1637
and remarkably constant excess L with depth. 1638
The ratio [Lt]/[DFe] was constant below 450 m. Hunter and Boyd (2007) 1639
suggested that Fe-binding ligands in the deep ocean are refractory humic materials 1640
that originate from degradation of organic matter in the surface layer. The degradation 1641
would generate ligand functional groups in the deep ocean (Kuma et al., 1996; Chen 1642
et al., 2003) where only one dominant group of ligands is present (Rue and Bruland, 1643
1995; Hunter and Boyd, 2007). The ligand characteristics found in the deep ocean in 1644
our samples were indeed relatively constant with depth (constant pFe and organic 1645
alpha reflecting an equilibrium between ligands, precipitation and adsorption of Fe) or 1646
showed a slight vertical trend, with increasing depth a decrease of excess L, and slight 1647
increase of K’ value (Tables 2 and 3; Figures 2, 3 and 4). The ligand characteristics in 1648
the deep ocean reflect either a balance between production and degradation of 1649
dissolved organic ligands or a constant very refractory type/group of ligands. If 1650
constant production of ligands by microbial activity with depth exists (Reid et al., 1651
1993) it must be balanced by a constant degradation of ligands (Powell and Donat, 1652
2001). Witter and Luther (1998) showed with a kinetic approach a change in the 1653
formation rate of Fe-ligand complexes and consequently the change of the 1654
dissociation rate (slower in the deep). They suggested that very slow degradation of 1655
ligands results in long residence time of the ligands (up to 1000 yr). Our data could 1656
Chapter 4: Atlantic Sector of the Southern Ocean 1/2
76
confirm this statement since the southward flowing water is depleted in Fe but not in 1657
ligand: Our study showed a uniform concentration of dissolved organic ligand and a 1658
rather uniform K’ in deep waters, causing constant organic alpha and pFe values, not 1659
suggesting transformation of ligand characteristics with time as suggested by Witter 1660
and Luther (1998). Since the trend in [Lt]/[DFe] ratio in the deep waters between 1661
geographical locations (Figures 1, 3 and 4, Table 3) was a consequence of what 1662
happened in the surface layer, the export of particulate organic matter is important. 1663
Knowledge of Fe in other size fractions, like the particulate fraction from unfiltered 1664
water and different colloidal size fractions would help to understand which processes 1665
control the ligands and the Fe distribution in the deep ocean. 1666
1667
6. Conclusions 1668
Overall the observed trends in [Lt]/[DFe] ratio values with depth and geographical 1669
location were consistent with the changes in ligand characteristics (excess L, organic 1670
alpha and resulting pFe) but showed a much clearer trend than the separate other 1671
parameters and confirmed that the ratio [Lt]/[DFe] is a reliable concept to study the 1672
chemistry of Fe in the oceans. This study has shown clear differences between upper 1673
waters (until 450 m depth), influenced by the presence of the phytoplankton, and 1674
deeper waters (below 450 m depth) in dissolved organic ligand characteristics and in 1675
the distribution of dissolved Fe. These high ratios (3.7-66.9) at the surface decreased 1676
to a nearly constant value below 450 m (1.7-3.6). Both the upper (0-450 m) and 1677
deeper (below 450 m) parts of the ocean showed an increasing trend southwards. In 1678
the upper 450 m this trend reflected the increasing depletion of Fe resulting in HNLC 1679
waters with increasing distance from Fe sources. However, the ligands also showed an 1680
increasing trend southwards showing that they are very resistant to degradation. In the 1681
upper layer of the Weddell Gyre, the increase in [Lt]/[DFe] ratio values from east to 1682
west is due to a decrease in dissolved Fe concentrations. In the deeper waters of the 1683
Weddell Gyre it is due to both the increase of ligand and the decrease of dissolved Fe 1684
concentrations. In the deep waters (below 450 m depth) a steady state between 1685
dissolved organic ligand and dissolved Fe was found at any location reflecting a 1686
balance between production and degradation of the organic matter. With the increase 1687

Chapter 4: Atlantic Sector of the Southern Ocean 1/2
77
of dissolved Fe concentrations with depth, the ligand sites for binding Fe are getting 1688
filled, and even almost saturated (North of the SB on the Zero Meridian). This near- 1689
saturation is deemed to be consistent with the precipitation of Fe as insoluble 1690
oxyhydroxide and its removal to the deep ocean. It confirms the important role of the 1691
organic ligands in keeping Fe in the soluble phase, thus avoiding its precipitation, and 1692
increasing its residence time in the water column. In the deeper layer (> 450 m) the 1693
increase in the [Lt]/[DFe] ratio is caused by a decrease in dissolved Fe concentrations 1694
only. A consistent trend in [Lt]/[DFe] values, at various depths and locations, is in 1695
itself impressive since nobody, to our knowledge, ever found clear trends in ligand 1696
characteristics other than a general decrease in ligand concentration with depth. 1697
However, the explanation is not still completely clear. The competition in the overall 1698
Fe budget between stabilisation by organic ligands and the removal by scavenging 1699
(adsorption onto particulate matter and colloid aggregation with or without oxidative 1700
precipitation) needs to be taken into account in order to better understand the Fe cycle 1701
in the ocean. 1702
1703

78
1703