Embed Size (px)
Citation preview

University of Groningen
Multicentric Validation of Proteomic Biomarkers in Urine Specific for Diabetic NephropathyAlkhalaf, Alaa; Zurbig, Petra; Bakker, Stephanus; Bilo, Henk; Cerna, Marie; Fischer, Christine;Fuchs, Sebastian; Janssen, Bart; Medek, Karel; Mischak, HaraldPublished in:PLoS ONE
DOI:10.1371/journal.pone.0013421
IMPORTANT NOTE: You are advised to consult the publisher's version (publisher's PDF) if you wish to cite fromit. Please check the document version below.
Document VersionPublisher's PDF, also known as Version of record
Publication date:2010
Link to publication in University of Groningen/UMCG research database
Citation for published version (APA):Alkhalaf, A., Zurbig, P., Bakker, S. J. L., Bilo, H. J. G., Cerna, M., Fischer, C., ... PREDICTIONS Grp(2010). Multicentric Validation of Proteomic Biomarkers in Urine Specific for Diabetic Nephropathy. PLoSONE, 5(10), [13421]. DOI: 10.1371/journal.pone.0013421
CopyrightOther than for strictly personal use, it is not permitted to download or to forward/distribute the text or part of it without the consent of theauthor(s) and/or copyright holder(s), unless the work is under an open content license (like Creative Commons).
Take-down policyIf you believe that this document breaches copyright please contact us providing details, and we will remove access to the work immediatelyand investigate your claim.
Downloaded from the University of Groningen/UMCG research database (Pure): http://www.rug.nl/research/portal. For technical reasons thenumber of authors shown on this cover page is limited to 10 maximum.
Download date: 30-09-2018

Multicentric Validation of Proteomic Biomarkers in UrineSpecific for Diabetic NephropathyAlaa Alkhalaf1,2, Petra Zurbig3*, Stephan J. L. Bakker1, Henk J. G. Bilo1,2, Marie Cerna4, Christine
Fischer5, Sebastian Fuchs6, Bart Janssen5, Karel Medek4, Harald Mischak3,7, Johannes M. Roob8, Kasper
Rossing9, Peter Rossing9, Ivan Rychlık10, Harald Sourij11, Beate Tiran12, Brigitte M. Winklhofer-Roob6,
Gerjan J. Navis1, for the PREDICTIONS Group"
1 Department of Internal Medicine, University Medical Center Groningen, University of Groningen, Groningen, The Netherlands, 2 Diabetes Centre, Isala Clinics, Zwolle,
The Netherlands, 3 Mosaiques diagnostics GmbH, Hannover, Germany, 4 Department of General Biology and Genetics, Third Faculty of Medicine, Charles University,
Prague, Czech Republic, 5 Institute of Human Genetics, Medical Faculty Heidelberg, University of Heidelberg, Heidelberg, Germany, 6 Human Nutrition & Metabolism
Research and Training Center, Institute of Molecular Biosciences, Karl Franzens University of Graz, Graz, Austria, 7 Faculty of Medicine, BHF Glasgow Cardiovascular
Research Centre, University of Glasgow, Glasgow, United Kingdom, 8 Clinical Division of Nephrology and Hemodialysis, Department of Internal Medicine, Medical
University of Graz, Graz, Austria, 9 Steno Diabetes Center, Gentofte, Denmark, 10 Second Department of Internal Medicine, Third Faculty of Medicine, Charles University,
Prague, Czech Republic, 11 Division of Endocrinology and Nuclear Medicine, Department of Internal Medicine, Medical University of Graz, Graz, Austria, 12 Clinical
Institute of Medical and Chemical Laboratory Diagnostics, Medical University of Graz, Graz, Austria
Abstract
Background: Urine proteome analysis is rapidly emerging as a tool for diagnosis and prognosis in disease states. Fordiagnosis of diabetic nephropathy (DN), urinary proteome analysis was successfully applied in a pilot study. The validity ofthe previously established proteomic biomarkers with respect to the diagnostic and prognostic potential was assessed on aseparate set of patients recruited at three different European centers. In this case-control study of 148 Caucasian patientswith diabetes mellitus type 2 and duration $5 years, cases of DN were defined as albuminuria .300 mg/d and diabeticretinopathy (n = 66). Controls were matched for gender and diabetes duration (n = 82).
Methodology/Principal Findings: Proteome analysis was performed blinded using high-resolution capillary electrophoresiscoupled with mass spectrometry (CE-MS). Data were evaluated employing the previously developed model for DN. Uponunblinding, the model for DN showed 93.8% sensitivity and 91.4% specificity, with an AUC of 0.948 (95% CI 0.898-0.978). Of65 previously identified peptides, 60 were significantly different between cases and controls of this study. In ,10% of casesand controls classification by proteome analysis not entirely resulted in the expected clinical outcome. Analysis of patient’ssubsequent clinical course revealed later progression to DN in some of the false positive classified DN control patients.
Conclusions: These data provide the first independent confirmation that profiling of the urinary proteome by CE-MS canadequately identify subjects with DN, supporting the generalizability of this approach. The data further establish urinarycollagen fragments as biomarkers for diabetes-induced renal damage that may serve as earlier and more specific biomarkersthan the currently used urinary albumin.
Citation: Alkhalaf A, Zurbig P, Bakker SJL, Bilo HJG, Cerna M, et al. (2010) Multicentric Validation of Proteomic Biomarkers in Urine Specific for DiabeticNephropathy. PLoS ONE 5(10): e13421. doi:10.1371/journal.pone.0013421
Editor: Massimo Federici, University of Tor Vergata, Italy
Received April 19, 2010; Accepted September 13, 2010; Published October 20, 2010
Copyright: � 2010 Alkhalaf et al. This is an open-access article distributed under the terms of the Creative Commons Attribution License, which permitsunrestricted use, distribution, and reproduction in any medium, provided the original author and source are credited.
Funding: This work was supported by the Commission of the European Communities, 6th Framework Programme Priority 1, Life Sciences, Genomics andBiotechnology for Health, LSHM-CT-2005-018733, acronym PREDICTIONS (PREvention of DIabetic ComplicaTIONS) and was partially supported by the EuropeanCommunity’s 7th Framework Programme to the SysKID consortium, (HEALTH-F2-2009-241544). HM and PZ were partially supported by mosaiques diagnosticsGmbH (MoD) (www.mosaiques-diagnostics.com). Furthermore, the Czech participants were supported in part also by a Czech grant VZ MSM 0021620814.Investigators from the co-sponsoring institution (MoD) were involved in study design, data production and analysis, and interpretation of the results. Otherfunders had no role in study design, data collection and analysis, decision to publish, or preparation of the manuscript.
Competing Interests: H. Mischak is co-founder and a shareholder of mosaiques diagnostics GmbH (Hannover, Germany). P. Zurbig is an employee of mosaiquesdiagnostics GmbH. P. Rossing has served as a consultant to Merck, Bristol-Myers Squibb and AstraZeneca, has received research grants from Novartis and hasbeen a member of speakers bureaus sponsored by Novartis, Boehringer Ingelheim, and Sanofi-Aventis. This does not alter the authors’ adherence to all the PLoSONE policies on sharing data and materials.
* E-mail: [email protected]
" Membership of the PREDICTIONS Group is provided in the Acknowledgments.
Introduction
Diabetic nephropathy (DN) is a leading cause of morbidity and
mortality in patients with diabetes mellitus [1]. Accurate diagnostic
tools are important, not only for the allocation of preventive
measures but also to better unravel the complex pathogenesis of
DN. Current clinical biomarkers used to diagnose diabetic kidney
disease, urinary albumin excretion and glomerular filtration rate,
are subject to considerable measurement variability [2], and are
heterogeneous as to prognostic impact [3]. Whereas albuminuria
is broadly used as a renal biomarker, its specificity is still subject of
debate [4]. Moreover, urinary albumin excretion and glomerular
PLoS ONE | www.plosone.org 1 October 2010 | Volume 5 | Issue 10 | e13421
filtration rate (GFR) are also affected in non-diabetic renal disease,
and accordingly not specific for diabetic nephropathy [5]. As such
their potential to detect and monitor the specific pathogenetic
processes involved in diabetic nephropathy is limited. Further-
more, especially GFR, but also albuminuria are late stage
biomarkers, only indicative after substantial organ damage [6].
Alternative non-invasive diagnostic methods, that may enable
detection of DN at an earlier stage, and/or with higher accuracy,
would be beneficial for clinical management of diabetic patients,
as well as for pathogenetic studies aimed at further deciphering
pathophysiology, and identifying targets for intervention. Potential
sources for such biomarkers may be urinary proteins and/or
peptides, as these should display significant changes at an early
state of disease, displaying initial pathophysiological changes in the
kidney [7].
Proteome analysis using capillary electrophoresis coupled mass
spectrometry (CE-MS) has recently emerged as a powerful tool to
define biomarkers that enable diagnosis [8,9], prognosis [10],
assessment of therapeutic intervention [11], and monitoring of
specific pathogenetic pathways. The different technological
considerations, both with respect to samples and technological
platform have recently been discussed and reviewed [12–15]. We
have focused on urinary proteome analysis as the urinary
proteome has been found to be quite stable [16,17] and contains
an array of low molecular weight proteins and peptides that can be
analyzed without the need for additional manipulation such as
proteolytic digests [18].
Recent studies demonstrated that urinary proteome analysis
enables the definition of biomarkers specific for chronic kidney
disease (CKD) [12,19] and for DN [1,20]. These might prove
valuable in clinical practice. As a first step, however, confirmation
of the diagnostic value of these markers in a controlled study in
independent clinical centers, different from the ones that were
involved in the identification of the biomarkers, has to be
obtained. Such rigid independent confirmation is required prior
to any further development, investigating e.g. prognostic value, to
clearly support the validity and reliability of the biomarkers and
biomarker-based models [21]. In the past, confirmation of
potential disease-associated biomarkers has often failed (e.g.
[22,23]), hence this step is of the outmost importance. Therefore,
we aimed to validate identified biomarkers and a biomarker-based
model for DN that was described previously in an independent
blinded set of samples [1], collected prospectively in multiple
centers not involved in the original identification of biomarkers to
rule out any center-based bias.
To ease data interpretation, a case-control set-up was chosen.
The low molecular proteome of diabetes mellitus type 2 patients
with normoalbuminuria (controls) and matched diabetes patients
with diabetic nephropathy (cases) was analyzed in a blinded study
(PREDICTIONS study) by capillary electrophoresis-mass spec-
trometry (CE-MS), and samples were successful classified using the
previously defined biomarker model.
Methods
Ethics StatementThe study was conducted according to the requirements of the
Declaration of Helsinki, the protocol was approved by the respective
Ethical review boards of the participating centers (Medical Ethics
Committees of the Isala Clinics in Zwolle and of the University
Medical Center in Groningen, the Ethics Committee of Third
Faculty of Medicine, Charles University at Prague, and the Ethics
Committee of the Medical University of Graz), and written
informed consent was obtained from all patients.
Settings and participantsThe study was set up as a cross-sectional case-control study,
cases being type 2 diabetes patients with nephropathy, controls
being type 2 diabetes patients without nephropathy. Patients aged
35–75 with type 2 diabetes with a documented duration of
diabetes of $5 years were eligible. Diagnosis of diabetes was
established in accordance with the WHO criteria, by the
following: fasting plasma glucose $7.0 mmol/l, a two-hour value
in an oral glucose tolerance test $11.1 mmol/l, or random plasma
glucose $11.1 mmol/l in the presence of symptoms. Type 2
diabetes was diagnosed by lack of criteria for type 1 diabetes.
Inclusion criteria for cases were: albuminuria .300 mg/d and
known overt diabetic retinopathy. Retinopathy is requested to be
present is to ensure that albuminuria is the consequence of diabetic
nephropathy rather than a non-diabetic glomerulopathy. A renal
biopsy would be the gold standard to discriminate between
diabetic nephropathy and a non-diabetic glomerulopathy, but a
renal biopsy is nearly never taken in diabetic patients and several
studies have indicated that the request for retinopathy being
present is a good alternative for discrimination between diabetic
nephropathy and non-diabetic glomerulopathy in type 2 diabetic
patients with albuminuria [24–26]. Exclusion criteria were end
stage renal failure, known causes of renal failure other than
diabetes and non-Caucasian ethnic origin. Controls were matched
within center for gender and diabetes duration. Exclusion criteria
for controls were micro-albuminuria, non-Caucausian ethnic
origin, and in case of use of RAAS-blocking medication, unknown
albuminuria status prior to start of treatment. Patients were
prospectively recruited from the outpatient clinics for diabetes and
nephrology in three participating centers, located in Zwolle (The
Netherlands), Graz (Austria), and Prague (Czech Republic),
respectively.
Sample collection and preparationThe second urine of the morning was collected as described [27]
and stored frozen below 220uC. A 0.7 mL aliquot was thawed
immediately before use and diluted with 0.7 mL 2 M urea,
10 mM NH4OH containing 0.02% SDS. In order to remove high
molecular weight polypeptides, samples were filtered using
Centrisart ultracentrifugation filter devices (20 kDa molecular
weight cut-off; Sartorius, Goettingen, Germany) at 3,000 g until
1.1 mL of filtrate was obtained. Subsequently, filtrate was desalted
using PD-10 column (GE Healthcare, Sweden) equilibrated in
0.01% NH4OH in HPLC-grade water. Finally, samples were
lyophilized and stored at 4uC. Shortly before CE-MS analysis,
lyophilisates were resuspended in HPLC-grade water to a final
protein concentration of 0.8 mg/mL checked by BCA assay
(Interchim, Montlucon, France).
CE-MS analysisCE-MS analysis was performed as described [27], using a P/
ACE MDQ capillary electrophoresis system (Beckman Coulter,
Fullerton, USA) on-line coupled to a Micro-TOF MS (Bruker
Daltonic, Bremen, Germany). Data acquisition and MS acquisi-
tion methods were automatically controlled by the CE via contact-
close-relays. Spectra were accumulated every 3 s, over a range of
m/z 350 to 3000 Th. Accuracy, precision, selectivity, sensitivity,
reproducibility, and stability are described in detail elsewhere
[27,28]. The average recovery of sample in the preparation
procedure was ,85% and the limit of detection was ,1 fmol.
Mass resolution was above 8,000 enabling resolution of mono-
isotopic mass signals for z#6. After charge deconvolution, mass
accuracy was ,25 ppm for monoisotopic resolution and ,100
ppm for unresolved peaks (z.6). The analytical precision of the
Proteomics for DN Diagnosis
PLoS ONE | www.plosone.org 2 October 2010 | Volume 5 | Issue 10 | e13421
set-up was assessed by (a) reproducibility achieved for repeated
measurement of the same replicate and (b) by the reproducibility
achieved for repeated preparation and measurement of the same
urine sample. To ensure high data consistency, a minimum of 950
peptides/proteins had to be detected with a minimal MS
resolution of 8,000 in a minimal migration time interval of 10
minutes.
Data processingMass spectral ion peaks representing identical molecules at
different charge states were deconvoluted into single masses using
MosaiquesVisu software [29]. Both CE-migration time and ion
signal intensity (amplitude) show variability, mostly due to different
amounts of salt and peptides in the sample and are consequently
normalized. Reference signals of 1770 urinary polypeptides are
used for CE-time calibration by local regression. For normaliza-
tion of analytical and urine dilution variances, MS signal
intensities are normalized relative to 29 ‘‘housekeeping’’ peptides
generally present in at least 90% of all urine samples with small
relative standard deviation, as described in detail recently [28]. For
calibration, local regression is performed. The obtained peak lists
characterize each polypeptide by its molecular mass [Da],
normalized CE migration time [min] and normalized signal
intensity. All detected peptides were deposited, matched, and
annotated in a Microsoft SQL database allowing further statistical
analysis.
Classification model of DNData of the current samples were tested against the previously
developed biomarker model for DN [1]. Rossing et al. defined and
validated models for the differentiation of diabetic patients type 1
with macroalbuminuria and normoalbuminuria after CE-MS
analysis. Among these diabetes patients, 102 urinary biomarkers
differed significantly between patients with normoalbuminuria and
DN. For reduction of the number of variables, a ‘‘take-one-out’’
procedure was used, decreasing the number of biomarkers to 65
without losing performance in the classification. A support vector
machine (SVM) biomarker model with these 65 polypeptides
identified patients with DN in blinded data set of 70 individuals
(35 cases and 35 controls) with 100% sensitivity and 97%
specificity (AUC = 0.994).
SVM-based classification on the urinary peptidome was
performed using MosaCluster software (version 1.7.0) [30]. This
software tool allows the classification of samples in the high-
dimensional parameter space by using support vector machine
(SVM) learning. For this purpose, MosaCluster generates
polypeptide models, which rely on polypeptides displaying
statistically significant differences when comparing data from
patients with a specific disease to controls or other diseases,
respectively. Each of these polypeptides represents one dimension
in the n-dimensional parameter space [9,31–33]. SVM views a
data point (probands plasma sample) as a p-dimensional vector (p
numbers of protein used), and it attempts to separate them with a
(p-1) dimensional hyperplane. There are many hyperplanes that
might classify the data. However, maximum separation (margin)
between the two classes is of additional interest, and therefore, the
hyperplane with the maximal distance from the hyperplane to the
nearest data point is selected. All marker proteins are used without
any weighting to build up the n-dimensional classification space
and to display the data set in the classification space. Classification
is performed by determining the Euclidian distance of the data set
to the n-1 dimensional maximal margin hyperplane (absolute
value of the normal vector) and the direction of the vector (class 1
or class 2).
Statistical analysisSensitivity and specificity of the previously defined biomarker
models, and 95% confidence intervals (95% CI) were calculated
using receiver operating characteristic (ROC) plots (MedCalc
version 8.1.1.0, MedCalc Software, Belgium, www.medcalc.be)
[34]. Furthermore, Mann-Whitney test (for independent samples)
was performed to receive Box-Whisker-Plots with this software.
Statistical significance was assumed at p,0.05. For analysis of
differences of individual peaks between cases and controls,
statistical significance was assumed at p,0.001 to account for
multiple testing. For the correlation analysis of each peptide
biomarker, Rank correlation was used with Spearman’s rank
correlation coefficient (Spearman’s r) (MedCalc version 8.1.1.0,
MedCalc Software, Belgium, www.medcalc.be). For biomarker
definition, polypeptides that were found in more than 70% of the
samples in at least one of the two groups (DN or non-DN) were
considered. This pre-defined set of polypeptides was further
validated by randomly excluding 30% of available samples. This
bootstrapping procedure was repeated up to 10 times. Further on,
mutilvariate statistic methods (e.g., Benjamini-Hochberg) were
applied for selection refinement.
Sequencing of peptidesCandidate biomarkers from urine were sequenced using CE-
MS/MS or LC-MS/MS as recently described [35].
Raw data files were either converted into dta-files (RAW files
generated by ion traps from Thermo Fisher Scientific) with the use
of DTA Generator [36,37] or into mgf-files (data derived from
MALDI-TOF and Q-TOF analyses) with the use of DataAnalysis
(version 4.0; Bruker Daltonik). All resultant MS/MS data were
submitted to MASCOT (www.matrixscience.com; release num-
ber: 2.3.01) for a search against human entries (20,295 sequences)
in the Swiss-Prot database (Swiss-Prot number 2010.06) without
any enzyme specificity and with up to one missed cleavage. No
fixed modification was selected, and oxidation products of
methionine, proline, and lysine residues were set as variable
modifications. Accepted parent ion mass deviation was 0.5 Da (20
ppm for all Orbitrap spectra); accepted fragment ion mass
deviation was 0.7 Da. Only search results with a MASCOT
peptide score equally or higher as the MASCOT score threshold
were included (see table S3a). Additionally, ion coverage was
controlled to be related to main spectral fragment features (b/y or
c/z ion series) (see also figure S1). For further validation of
obtained peptide identifications, the strict correlation between
peptide charge at pH 2 and CE-migration time was utilized to
minimize false-positive identification rates [38,39]. As depicted in
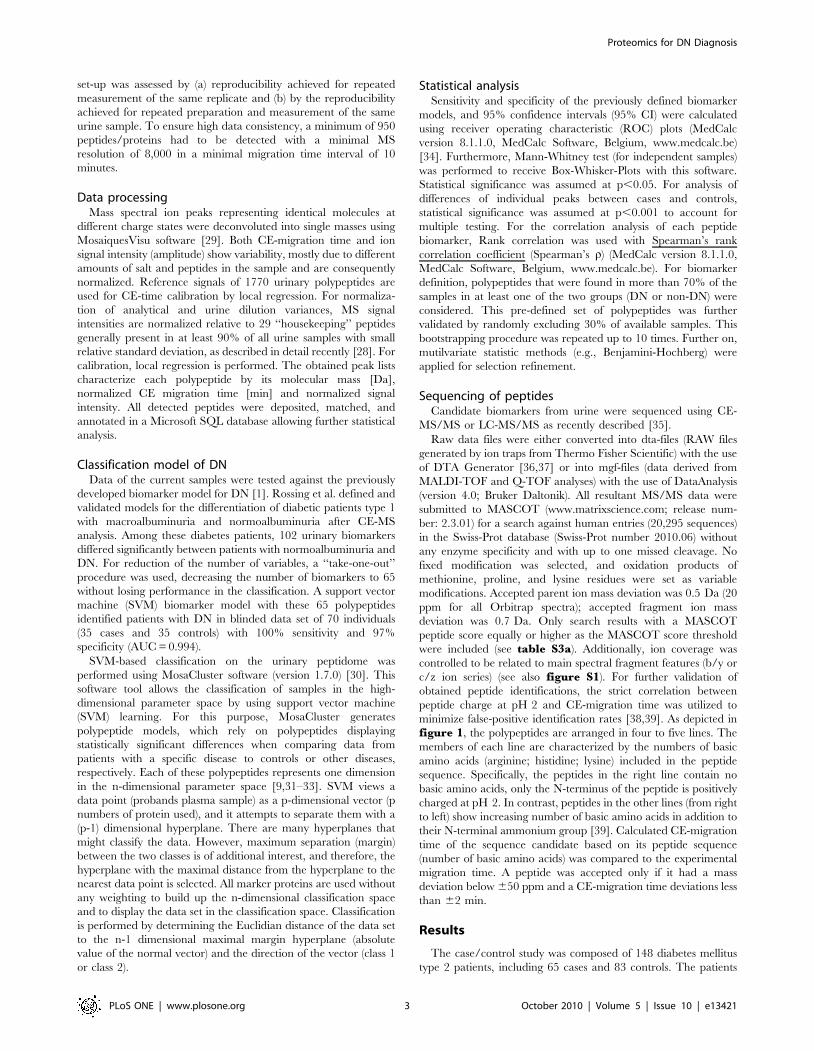
figure 1, the polypeptides are arranged in four to five lines. The
members of each line are characterized by the numbers of basic
amino acids (arginine; histidine; lysine) included in the peptide
sequence. Specifically, the peptides in the right line contain no
basic amino acids, only the N-terminus of the peptide is positively
charged at pH 2. In contrast, peptides in the other lines (from right
to left) show increasing number of basic amino acids in addition to
their N-terminal ammonium group [39]. Calculated CE-migration
time of the sequence candidate based on its peptide sequence
(number of basic amino acids) was compared to the experimental
migration time. A peptide was accepted only if it had a mass
deviation below 650 ppm and a CE-migration time deviations less
than 62 min.
Results
The case/control study was composed of 148 diabetes mellitus
type 2 patients, including 65 cases and 83 controls. The patients
Proteomics for DN Diagnosis
PLoS ONE | www.plosone.org 3 October 2010 | Volume 5 | Issue 10 | e13421
were well-matched for age, gender and diabetes duration. Blood
pressure was significantly higher, and creatinine clearance
significantly lower in cases (all p,0.05). Albuminuria was by
definition present in cases, and absent in control. All samples were
analyzed with CE-MS. For 145 urine samples (64 cases and 81
controls) of this study population high quality CE-MS data sets
were obtained. The data obtained from 3 samples did not pass
quality control and were excluded from the subsequent analysis.
Patient characteristics and classification scores of the proteome
analysis are presented in table 1. The data on all relevant
peptides detected in the 145 samples are listed in table S1.
Rossing et al. defined and validated models for the differenti-
ation of diabetic patients type 1 with macroalbuminuria and
normoalbuminuria after CE-MS analysis [1]. A support vector
machine biomarker model (SVM-BM) composed of 65 of these
biomarkers identified DN in blinded data set with 100% sensitivity
and 97% specificity. This ‘DN model’, was applied to the collected
‘case and control’ samples of the PREDICTIONS study cohort.
The scoring of all individual samples using the biomarker model is
given in table S2. After evaluation of the blinded samples, all data
were reported to the central study database for further evaluation
and subsequent unblinding. After unblinding, accuracy of
prediction was assessed. The complete polypeptide profiles and
the DN-specific panels are depicted in figure 1 exemplarily for
one patient with and one without DN.
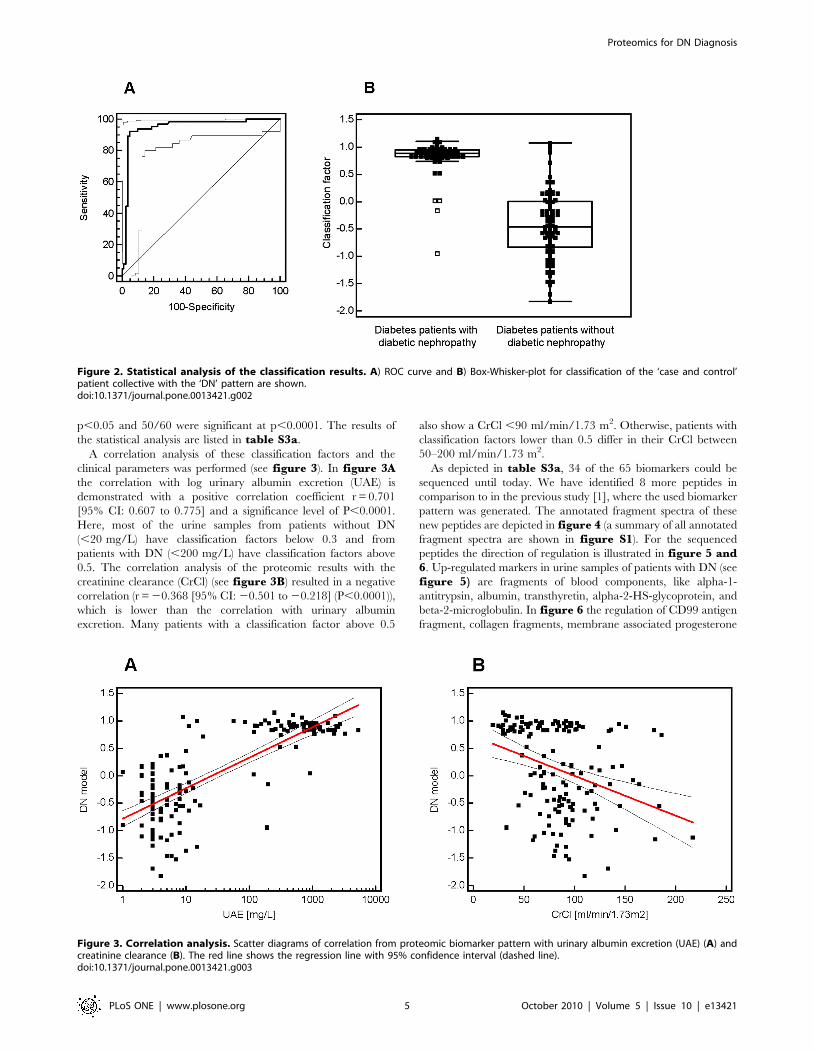
Classification of the ‘case/control’ urine samples with this ‘DN
biomarker model’ was accomplished with sensitivity of 93.8% and
specificity of 91.4%. The AUC value in the ROC-analysis was
0.948 [95% CI: 0.898 to 0.978] (see figure 2A). As depicted in the
Box-and-Whisker plot in figure 2B, this classification resulted in
a significant (P,0.0001) difference of the median classification
factor between patients with DN (0.889 [95% CI: 0.843 to 0.924])
and patients without DN (20.461 [95%uCI: 20.592 to 20.255]).
The classification results are shown in table S2 (‘DN model’).
Of the 65 previously defined differentially expressed peptides
[1], in the current study 92.3% (60 markers) could be confirmed as
being significantly different in this PREDICTIONS cohort
between diabetic patients with DN and diabetic controls at
Figure 1. Polypeptide patterns of exemplarily urine samples. The upper panel shows polypeptide patterns of all peptides, which are in theurinary proteome from one patient with (ID: 37908) and one patient without DN (ID: 37907). The lower panel shows distinct peptides of the DNmodel of these patients urine sample. Each polypeptide is defined by its CE-migration time (x-axis, minutes), mass (y-axis, kDa), and signal intensity (z-axis). The molecular mass is indicated on the left, the normalized migration time is indicated on the bottom.doi:10.1371/journal.pone.0013421.g001
Table 1. Patient characteristics (means 6 SD) of the PREDICTIONS cohort.
n M/F Age [year] Duration DM [yr] SBP [mmHg] DBP [mmHg] UAE [mg/L] CrCl [ml/min/1.73 m2]
cases 64 44/20 64610 1768 143621 78612 9536931 72640
controls 81 47/34 62611 1666 133615 74611 664 94632
M/F: male/female ratio; SBP: systolic blood pressure; DBP: diastolic blood pressure; UAE: urinary albumin excretion; CrCl: creatinine clearance estimated by Cockroft-Gault equation.doi:10.1371/journal.pone.0013421.t001
Proteomics for DN Diagnosis
PLoS ONE | www.plosone.org 4 October 2010 | Volume 5 | Issue 10 | e13421
p,0.05 and 50/60 were significant at p,0.0001. The results of
the statistical analysis are listed in table S3a.
A correlation analysis of these classification factors and the
clinical parameters was performed (see figure 3). In figure 3Athe correlation with log urinary albumin excretion (UAE) is
demonstrated with a positive correlation coefficient r = 0.701
[95% CI: 0.607 to 0.775] and a significance level of P,0.0001.
Here, most of the urine samples from patients without DN
(,20 mg/L) have classification factors below 0.3 and from
patients with DN (,200 mg/L) have classification factors above
0.5. The correlation analysis of the proteomic results with the
creatinine clearance (CrCl) (see figure 3B) resulted in a negative
correlation (r = 20.368 [95% CI: 20.501 to 20.218] (P,0.0001)),
which is lower than the correlation with urinary albumin
excretion. Many patients with a classification factor above 0.5
also show a CrCl ,90 ml/min/1.73 m2. Otherwise, patients with
classification factors lower than 0.5 differ in their CrCl between
50–200 ml/min/1.73 m2.
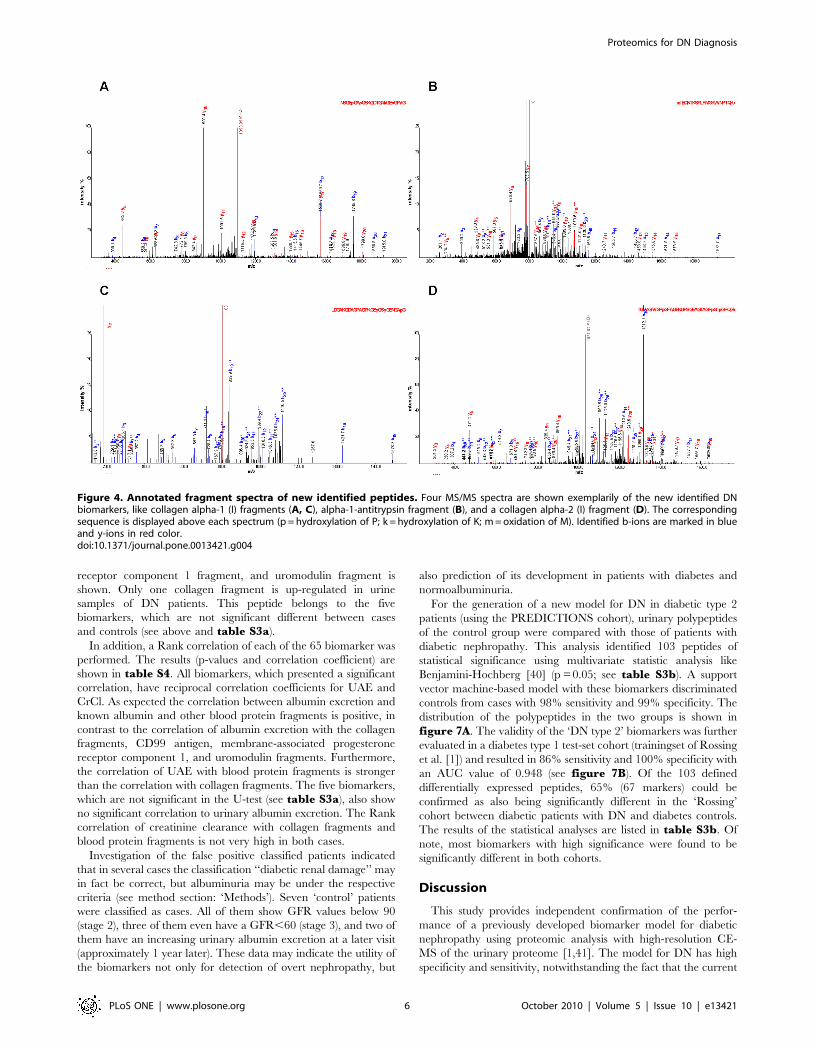
As depicted in table S3a, 34 of the 65 biomarkers could be
sequenced until today. We have identified 8 more peptides in
comparison to in the previous study [1], where the used biomarker
pattern was generated. The annotated fragment spectra of these
new peptides are depicted in figure 4 (a summary of all annotated
fragment spectra are shown in figure S1). For the sequenced
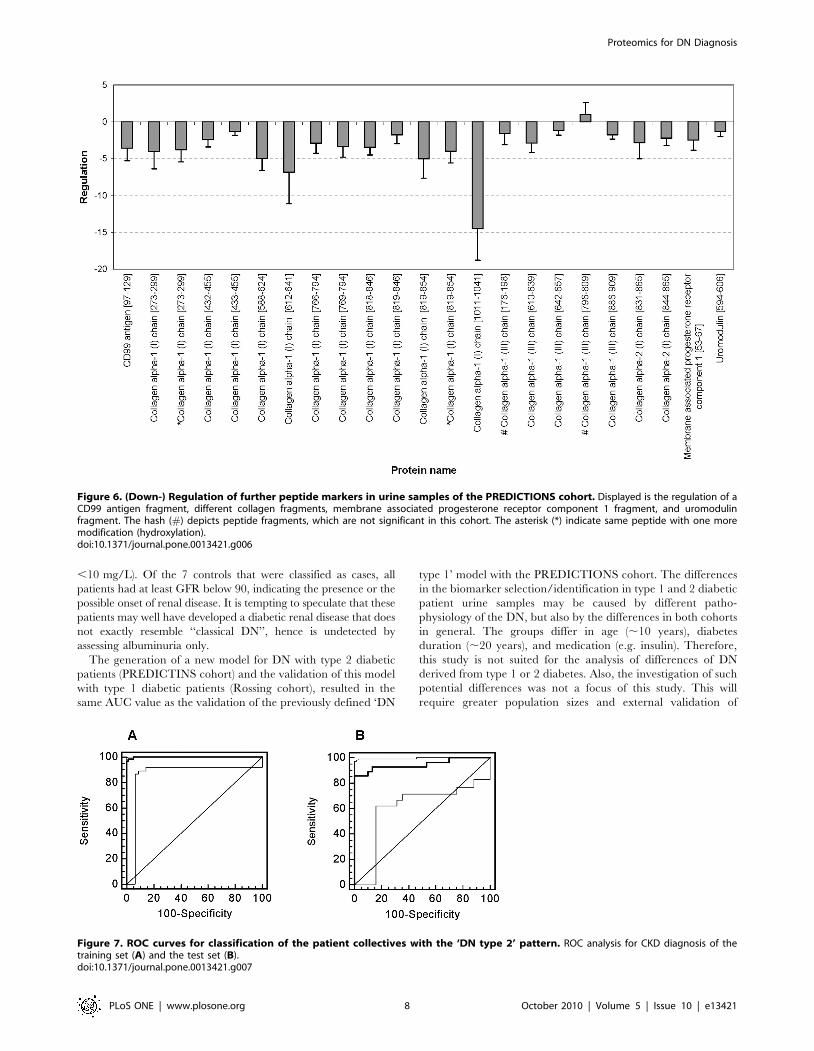
peptides the direction of regulation is illustrated in figure 5 and6. Up-regulated markers in urine samples of patients with DN (see
figure 5) are fragments of blood components, like alpha-1-
antitrypsin, albumin, transthyretin, alpha-2-HS-glycoprotein, and
beta-2-microglobulin. In figure 6 the regulation of CD99 antigen
fragment, collagen fragments, membrane associated progesterone
Figure 2. Statistical analysis of the classification results. A) ROC curve and B) Box-Whisker-plot for classification of the ‘case and control’patient collective with the ‘DN’ pattern are shown.doi:10.1371/journal.pone.0013421.g002
Figure 3. Correlation analysis. Scatter diagrams of correlation from proteomic biomarker pattern with urinary albumin excretion (UAE) (A) andcreatinine clearance (B). The red line shows the regression line with 95% confidence interval (dashed line).doi:10.1371/journal.pone.0013421.g003
Proteomics for DN Diagnosis
PLoS ONE | www.plosone.org 5 October 2010 | Volume 5 | Issue 10 | e13421
receptor component 1 fragment, and uromodulin fragment is
shown. Only one collagen fragment is up-regulated in urine
samples of DN patients. This peptide belongs to the five
biomarkers, which are not significant different between cases
and controls (see above and table S3a).
In addition, a Rank correlation of each of the 65 biomarker was
performed. The results (p-values and correlation coefficient) are
shown in table S4. All biomarkers, which presented a significant
correlation, have reciprocal correlation coefficients for UAE and
CrCl. As expected the correlation between albumin excretion and
known albumin and other blood protein fragments is positive, in
contrast to the correlation of albumin excretion with the collagen
fragments, CD99 antigen, membrane-associated progesterone
receptor component 1, and uromodulin fragments. Furthermore,
the correlation of UAE with blood protein fragments is stronger
than the correlation with collagen fragments. The five biomarkers,
which are not significant in the U-test (see table S3a), also show
no significant correlation to urinary albumin excretion. The Rank
correlation of creatinine clearance with collagen fragments and
blood protein fragments is not very high in both cases.
Investigation of the false positive classified patients indicated
that in several cases the classification ‘‘diabetic renal damage’’ may
in fact be correct, but albuminuria may be under the respective
criteria (see method section: ‘Methods’). Seven ‘control’ patients
were classified as cases. All of them show GFR values below 90
(stage 2), three of them even have a GFR,60 (stage 3), and two of
them have an increasing urinary albumin excretion at a later visit
(approximately 1 year later). These data may indicate the utility of
the biomarkers not only for detection of overt nephropathy, but
also prediction of its development in patients with diabetes and
normoalbuminuria.
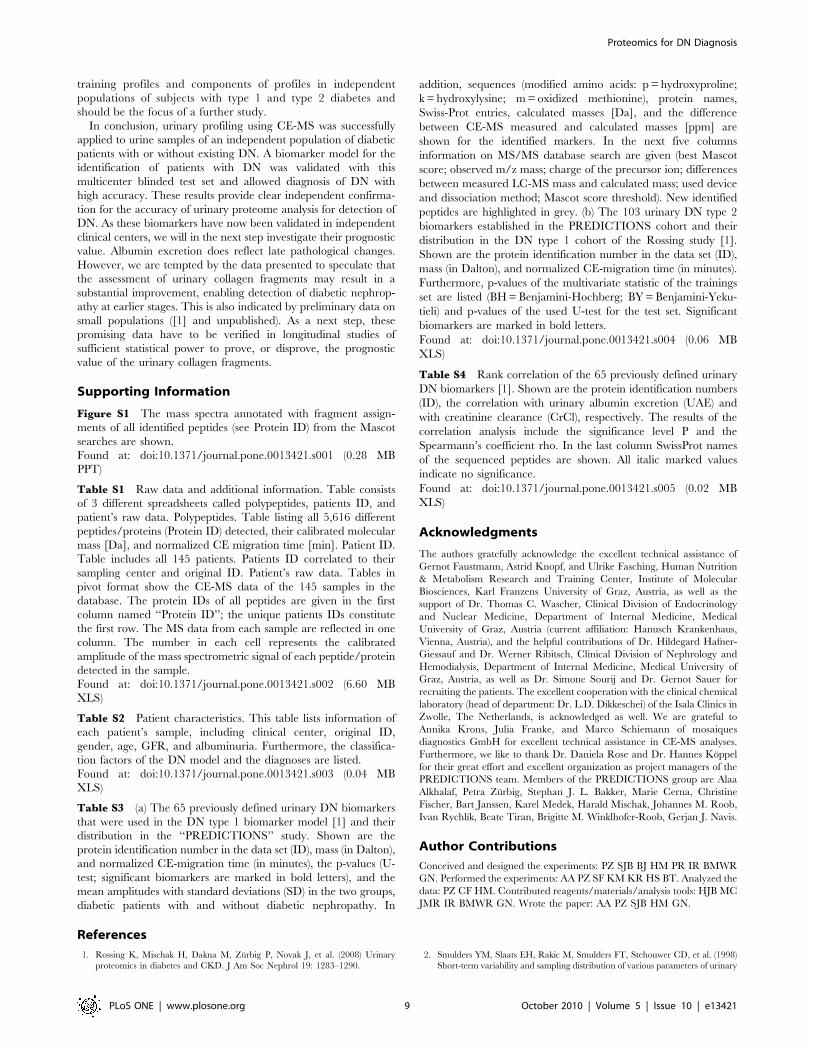
For the generation of a new model for DN in diabetic type 2
patients (using the PREDICTIONS cohort), urinary polypeptides
of the control group were compared with those of patients with
diabetic nephropathy. This analysis identified 103 peptides of
statistical significance using multivariate statistic analysis like
Benjamini-Hochberg [40] (p = 0.05; see table S3b). A support
vector machine-based model with these biomarkers discriminated
controls from cases with 98% sensitivity and 99% specificity. The
distribution of the polypeptides in the two groups is shown in
figure 7A. The validity of the ‘DN type 2’ biomarkers was further
evaluated in a diabetes type 1 test-set cohort (trainingset of Rossing
et al. [1]) and resulted in 86% sensitivity and 100% specificity with
an AUC value of 0.948 (see figure 7B). Of the 103 defined
differentially expressed peptides, 65% (67 markers) could be
confirmed as also being significantly different in the ‘Rossing’
cohort between diabetic patients with DN and diabetes controls.
The results of the statistical analyses are listed in table S3b. Of
note, most biomarkers with high significance were found to be
significantly different in both cohorts.
Discussion
This study provides independent confirmation of the perfor-
mance of a previously developed biomarker model for diabetic
nephropathy using proteomic analysis with high-resolution CE-
MS of the urinary proteome [1,41]. The model for DN has high
specificity and sensitivity, notwithstanding the fact that the current
Figure 4. Annotated fragment spectra of new identified peptides. Four MS/MS spectra are shown exemplarily of the new identified DNbiomarkers, like collagen alpha-1 (I) fragments (A, C), alpha-1-antitrypsin fragment (B), and a collagen alpha-2 (I) fragment (D). The correspondingsequence is displayed above each spectrum (p = hydroxylation of P; k = hydroxylation of K; m = oxidation of M). Identified b-ions are marked in blueand y-ions in red color.doi:10.1371/journal.pone.0013421.g004
Proteomics for DN Diagnosis
PLoS ONE | www.plosone.org 6 October 2010 | Volume 5 | Issue 10 | e13421

study was done in subjects with type 2 diabetes, whereas the
population used for development of the model for diagnosis of
diabetic nephropathy had diabetic mellitus type 1. These findings
clearly indicate that the applied peptide pattern allowed diabetes-
type independent classification of diabetic nephropathy.
For most of the peptides in the ‘DN model’, the difference
between the cases and controls reached a high level of statistical
significance, with p-values ,0.0001, demonstrating the high
selectivity of the urinary proteome analysis. The fact that 92%
of the markers included in the ‘DN model’ were also significant in
the PREDICTIONS cohort supports a valid strategy of marker
selection in the Rossing study [1].
When distinguishing patients with DN from normoalbuminuric
diabetic patients, the distribution of the classification factors in the
control group (patients without DN) was broader than in the case
group (see figures 2B and 3A). This may be explained by the
existence of early stages of DN, in the absence of any clinical
symptoms yet. The arrangement of the case and control group was
performed based on classical urine analyses (urinary albumin
excretion rate).
Identification of the specific peptides in the biomarker model
may allow better insights in patho-physiological pathways involved
in renal damage in general, and specific pathways for renal
damage in diabetes. The regulation of the sequenced biomarkers
in the ‘DN model’, as reported here, shows a consistent pattern
that is apparently specific for DN. The up-regulation of the serum
protein fragments and the down-regulation of the collagen
fragments in the urine is a consistent feature of DN, as also
discussed in detail in the literature (see [6]). Furthermore, the
correlation analysis confirms these findings. As expected, the
correlation of the biomarkers with UAE and with CrCl resulted in
reciprocal values.
Thousand-fold up-regulation of blood-derived protein frag-
ments in urine (see figure 3B) is expected in the light of
substantial glomerular damage that results in albuminuria. Hence,
this likely does not reflect better or earlier markers. The presence
of high amounts of these proteins likely indicates an insufficiency
of readsorption or altered glomerular permeability of the kidney,
implying an existing damage. In contrast, changes in the collagen
metabolism may be closely linked to early renal damage in patients
with diabetes and may help to provide information for the
prognosis and monitoring of DN [1]. Type I and III collagens
alpha-1 are main components of renal interstitial fibrosis [42]. It is
tempting to speculate that the decrease in urinary collagen
fragments reflects decreased collagen breakdown, and hence a
propensity to progressive fibrotic lesions. However, the origin of
the urinary collagen fragments cannot be determined from the
current data and must be investigated in further studies. The
differential excretion of uromodulin fragments gains additional
interest from the recently reported association between genetic
variation in the coding for uromodulin with susceptibility to CKD
[43]. Finally, altered collagen metabolism appears to be involved
in non-diabetic CKD as well, albeit with a differential excretory
pattern. The patho-physiological impact of this finding deserves
further exploration.
Investigation of the few cases where the classification factors of
the DN model did not coincide with the clinical diagnosis suggests
that several of these may in fact not be incorrectly classified by the
DN model, but the clinical assessment of the patient was not
correct (see also figure 3A: classification factor .0.3 and UAE
Figure 5. Up-regulation of blood derived protein fragments in urine samples of the PREDICTIONS cohort. Displayed is the regulation ofalpha-1-antitrypsin fragments, an alpha-2-HS glycoprotein fragment, a beta-2-microglobulin fragment, serum albumin fragments, and a transthyretinfragment. The asterisk (*) indicate same peptide with one more modification (oxidation).doi:10.1371/journal.pone.0013421.g005
Proteomics for DN Diagnosis
PLoS ONE | www.plosone.org 7 October 2010 | Volume 5 | Issue 10 | e13421
,10 mg/L). Of the 7 controls that were classified as cases, all
patients had at least GFR below 90, indicating the presence or the
possible onset of renal disease. It is tempting to speculate that these
patients may well have developed a diabetic renal disease that does
not exactly resemble ‘‘classical DN’’, hence is undetected by
assessing albuminuria only.
The generation of a new model for DN with type 2 diabetic
patients (PREDICTINS cohort) and the validation of this model
with type 1 diabetic patients (Rossing cohort), resulted in the
same AUC value as the validation of the previously defined ‘DN
type 1’ model with the PREDICTIONS cohort. The differences
in the biomarker selection/identification in type 1 and 2 diabetic
patient urine samples may be caused by different patho-
physiology of the DN, but also by the differences in both cohorts
in general. The groups differ in age (,10 years), diabetes
duration (,20 years), and medication (e.g. insulin). Therefore,
this study is not suited for the analysis of differences of DN
derived from type 1 or 2 diabetes. Also, the investigation of such
potential differences was not a focus of this study. This will
require greater population sizes and external validation of
Figure 6. (Down-) Regulation of further peptide markers in urine samples of the PREDICTIONS cohort. Displayed is the regulation of aCD99 antigen fragment, different collagen fragments, membrane associated progesterone receptor component 1 fragment, and uromodulinfragment. The hash (#) depicts peptide fragments, which are not significant in this cohort. The asterisk (*) indicate same peptide with one moremodification (hydroxylation).doi:10.1371/journal.pone.0013421.g006
Figure 7. ROC curves for classification of the patient collectives with the ‘DN type 2’ pattern. ROC analysis for CKD diagnosis of thetraining set (A) and the test set (B).doi:10.1371/journal.pone.0013421.g007
Proteomics for DN Diagnosis
PLoS ONE | www.plosone.org 8 October 2010 | Volume 5 | Issue 10 | e13421
training profiles and components of profiles in independent
populations of subjects with type 1 and type 2 diabetes and
should be the focus of a further study.
In conclusion, urinary profiling using CE-MS was successfully
applied to urine samples of an independent population of diabetic
patients with or without existing DN. A biomarker model for the
identification of patients with DN was validated with this
multicenter blinded test set and allowed diagnosis of DN with
high accuracy. These results provide clear independent confirma-
tion for the accuracy of urinary proteome analysis for detection of
DN. As these biomarkers have now been validated in independent
clinical centers, we will in the next step investigate their prognostic
value. Albumin excretion does reflect late pathological changes.
However, we are tempted by the data presented to speculate that
the assessment of urinary collagen fragments may result in a
substantial improvement, enabling detection of diabetic nephrop-
athy at earlier stages. This is also indicated by preliminary data on
small populations ([1] and unpublished). As a next step, these
promising data have to be verified in longitudinal studies of
sufficient statistical power to prove, or disprove, the prognostic
value of the urinary collagen fragments.
Supporting Information
Figure S1 The mass spectra annotated with fragment assign-
ments of all identified peptides (see Protein ID) from the Mascot
searches are shown.
Found at: doi:10.1371/journal.pone.0013421.s001 (0.28 MB
PPT)
Table S1 Raw data and additional information. Table consists
of 3 different spreadsheets called polypeptides, patients ID, and
patient’s raw data. Polypeptides. Table listing all 5,616 different
peptides/proteins (Protein ID) detected, their calibrated molecular
mass [Da], and normalized CE migration time [min]. Patient ID.
Table includes all 145 patients. Patients ID correlated to their
sampling center and original ID. Patient’s raw data. Tables in
pivot format show the CE-MS data of the 145 samples in the
database. The protein IDs of all peptides are given in the first
column named ‘‘Protein ID’’; the unique patients IDs constitute
the first row. The MS data from each sample are reflected in one
column. The number in each cell represents the calibrated
amplitude of the mass spectrometric signal of each peptide/protein
detected in the sample.
Found at: doi:10.1371/journal.pone.0013421.s002 (6.60 MB
XLS)
Table S2 Patient characteristics. This table lists information of
each patient’s sample, including clinical center, original ID,
gender, age, GFR, and albuminuria. Furthermore, the classifica-
tion factors of the DN model and the diagnoses are listed.
Found at: doi:10.1371/journal.pone.0013421.s003 (0.04 MB
XLS)
Table S3 (a) The 65 previously defined urinary DN biomarkers
that were used in the DN type 1 biomarker model [1] and their
distribution in the ‘‘PREDICTIONS’’ study. Shown are the
protein identification number in the data set (ID), mass (in Dalton),
and normalized CE-migration time (in minutes), the p-values (U-
test; significant biomarkers are marked in bold letters), and the
mean amplitudes with standard deviations (SD) in the two groups,
diabetic patients with and without diabetic nephropathy. In
addition, sequences (modified amino acids: p = hydroxyproline;
k = hydroxylysine; m = oxidized methionine), protein names,
Swiss-Prot entries, calculated masses [Da], and the difference
between CE-MS measured and calculated masses [ppm] are
shown for the identified markers. In the next five columns
information on MS/MS database search are given (best Mascot
score; observed m/z mass; charge of the precursor ion; differences
between measured LC-MS mass and calculated mass; used device
and dissociation method; Mascot score threshold). New identified
peptides are highlighted in grey. (b) The 103 urinary DN type 2
biomarkers established in the PREDICTIONS cohort and their
distribution in the DN type 1 cohort of the Rossing study [1].
Shown are the protein identification number in the data set (ID),
mass (in Dalton), and normalized CE-migration time (in minutes).
Furthermore, p-values of the multivariate statistic of the trainings
set are listed (BH = Benjamini-Hochberg; BY = Benjamini-Yeku-
tieli) and p-values of the used U-test for the test set. Significant
biomarkers are marked in bold letters.
Found at: doi:10.1371/journal.pone.0013421.s004 (0.06 MB
XLS)
Table S4 Rank correlation of the 65 previously defined urinary
DN biomarkers [1]. Shown are the protein identification numbers
(ID), the correlation with urinary albumin excretion (UAE) and
with creatinine clearance (CrCl), respectively. The results of the
correlation analysis include the significance level P and the
Spearmann’s coefficient rho. In the last column SwissProt names
of the sequenced peptides are shown. All italic marked values
indicate no significance.
Found at: doi:10.1371/journal.pone.0013421.s005 (0.02 MB
XLS)
Acknowledgments
The authors gratefully acknowledge the excellent technical assistance of
Gernot Faustmann, Astrid Knopf, and Ulrike Fasching, Human Nutrition
& Metabolism Research and Training Center, Institute of Molecular
Biosciences, Karl Franzens University of Graz, Austria, as well as the
support of Dr. Thomas C. Wascher, Clinical Division of Endocrinology
and Nuclear Medicine, Department of Internal Medicine, Medical
University of Graz, Austria (current affiliation: Hanusch Krankenhaus,
Vienna, Austria), and the helpful contributions of Dr. Hildegard Hafner-
Giessauf and Dr. Werner Ribitsch, Clinical Division of Nephrology and
Hemodialysis, Department of Internal Medicine, Medical University of
Graz, Austria, as well as Dr. Simone Sourij and Dr. Gernot Sauer for
recruiting the patients. The excellent cooperation with the clinical chemical
laboratory (head of department: Dr. L.D. Dikkeschei) of the Isala Clinics in
Zwolle, The Netherlands, is acknowledged as well. We are grateful to
Annika Krons, Julia Franke, and Marco Schiemann of mosaiques
diagnostics GmbH for excellent technical assistance in CE-MS analyses.
Furthermore, we like to thank Dr. Daniela Rose and Dr. Hannes Koppel
for their great effort and excellent organization as project managers of the
PREDICTIONS team. Members of the PREDICTIONS group are Alaa
Alkhalaf, Petra Zurbig, Stephan J. L. Bakker, Marie Cerna, Christine
Fischer, Bart Janssen, Karel Medek, Harald Mischak, Johannes M. Roob,
Ivan Rychlık, Beate Tiran, Brigitte M. Winklhofer-Roob, Gerjan J. Navis.
Author Contributions
Conceived and designed the experiments: PZ SJB BJ HM PR IR BMWR
GN. Performed the experiments: AA PZ SF KM KR HS BT. Analyzed the
data: PZ CF HM. Contributed reagents/materials/analysis tools: HJB MC
JMR IR BMWR GN. Wrote the paper: AA PZ SJB HM GN.
References
1. Rossing K, Mischak H, Dakna M, Zurbig P, Novak J, et al. (2008) Urinary
proteomics in diabetes and CKD. J Am Soc Nephrol 19: 1283–1290.
2. Smulders YM, Slaats EH, Rakic M, Smulders FT, Stehouwer CD, et al. (1998)
Short-term variability and sampling distribution of various parameters of urinary
Proteomics for DN Diagnosis
PLoS ONE | www.plosone.org 9 October 2010 | Volume 5 | Issue 10 | e13421
albumin excretion in patients with non-insulin-dependent diabetes mellitus. J Lab
Clin Med 132: 39–46.
3. Stehouwer CD, Yudkin JS, Fioretto P, Nosadini R (1998) How heterogeneous is
microalbuminuria in diabetes mellitus? The case for ‘benign’ and ‘malignant’
microalbuminuria. Nephrol Dial Transplant 13: 2751–2754.
4. Levey AS, Cattran D, Friedman A, Miller WG, Sedor J, et al. (2009) Proteinuria
as a surrogate outcome in CKD: report of a scientific workshop sponsored by theNational Kidney Foundation and the US Food and Drug Administration.
Am J Kidney Dis 54: 205–226.
5. Julian BA, Suzuki H, Suzuki Y, Tomino Y, Spasovski G, et al. (2009) Sources ofUrinary Proteins and their Analysis by Urinary Proteomics for the Detection of
Biomarkers of Disease. Proteomics Clin Appl 3: 1029–1043.
6. Rossing K, Mischak H, Rossing P, Schanstra JP, Wiseman A, et al. (2008) The
urinary proteome in diabetes and diabetes-associated complications: new ways to
assess disease progression and evaluate therapy. Proteomics Clin Appl 2:997–1007.
7. Zurbig P, Decramer S, Dakna M, Jantos J, Good DM, et al. (2009) The humanurinary proteome reveals high similarity between kidney aging and chronic
kidney disease. Proteomics 9: 2108–2117.
8. Julian BA, Wittke S, Novak J, Good DM, Coon JJ, et al. (2007) Electrophoretic
methods for analysis of urinary polypeptides in IgA-associated renal diseases.
Electrophoresis 28: 4469–4483.
9. Weissinger EM, Wittke S, Kaiser T, Haller H, Bartel S, et al. (2004) Proteomic
patterns established with capillary electrophoresis and mass spectrometry fordiagnostic purposes. Kidney Int 65: 2426–2434.
10. Decramer S, Wittke S, Mischak H, Zurbig P, Walden M, et al. (2006) Predicting
the clinical outcome of congenital unilateral ureteropelvic junction obstruction innewborn by urinary proteome analysis. Nat Med 12: 398–400.
11. Rossing K, Mischak H, Parving HH, Christensen PK, Walden M, et al. (2005)Impact of diabetic nephropathy and angiotensin II receptor blockade on urinary
polypeptide patterns. Kidney Int 68: 193–205.
12. Fliser D, Novak J, Thongboonkerd V, Argiles A, Jankowski V, et al. (2007)Advances in urinary proteome analysis and biomarker discovery. J Am Soc
Nephrol 18: 1057–1071.
13. Good DM, Thongboonkerd V, Novak J, Bascands JL, Schanstra JP, et al. (2007)
Body Fluid Proteomics for Biomarker Discovery: Lessons from the Past Hold the
Key to Success in the Future. J Proteome Res 6: 4549–4555.
14. Goodsaid F, Bandow JE, Mischak H (2007) Grand Rounds in Proteomics at the
FDA. Proteomics Clin Appl 1: 1526–1531.
15. Lescuyer P, Hochstrasser D, Rabilloud T (2007) How Shall We Use the
Proteomics Toolbox for Biomarker Discovery? J Proteome Res 6: 3371–3376.
16. Schaub S, Wilkins J, Weiler T, Sangster K, Rush D, et al. (2004) Urine proteinprofiling with surface-enhanced laser-desorption/ionization time-of-flight mass
spectrometry. Kidney Int 65: 323–332.
17. Theodorescu D, Wittke S, Ross MM, Walden M, Conaway M, et al. (2006)
Discovery and validation of new protein biomarkers for urothelial cancer: aprospective analysis. Lancet Oncol 7: 230–240.
18. Mischak H, Julian BA, Novak J (2007) High-resolution proteome/peptidome
analysis of peptides and low-molecular-weight proteins in urine. Proteomics ClinAppl 1: 792–804.
19. Varghese SA, Powell TB, Budisavljevic MN, Oates JC, Raymond JR, et al.(2007) Urine biomarkers predict the cause of glomerular disease. J Am Soc
Nephrol 18: 913–922.
20. Rao PV, Lu X, Standley M, Pattee P, Neelima G, et al. (2007) Proteomicidentification of urinary biomarkers of diabetic nephropathy. Diabetes Care 30:
629–637.
21. Knepper MA (2009) Common sense approaches to urinary biomarker study
design. J Am Soc Nephrol 20: 1175–1178.
22. McLerran D, Grizzle WE, Feng Z, Thompson IM, Bigbee WL, et al. (2008)SELDI-TOF MS whole serum proteomic profiling with IMAC surface does not
reliably detect prostate cancer. Clin Chem 54: 53–60.
23. Baggerly KA, Morris JS, Coombes KR (2002) Reproducibility of SELDI-TOF
protein patterns in serum: comparing datasets from different experiments.Bioinformatics 20: 777–785.
24. Huang F, Yang Q, Chen L, Tang S, Liu W, et al. (2007) Renal pathological
change in patients with type 2 diabetes is not always diabetic nephropathy: areport of 52 cases. Clin Nephrol 67: 293–297.
25. Parving HH, Gall MA, Skott P, Jorgensen HE, Lokkegaard H, et al. (1992)Prevalence and causes of albuminuria in non-insulin-dependent diabetic
patients. Kidney Int 41: 758–762.
26. Wong TY, Choi PC, Szeto CC, To KF, Tang NL, et al. (2002) Renal outcomein type 2 diabetic patients with or without coexisting nondiabetic nephropathies.
Diabetes Care 25: 900–905.27. Haubitz M, Good DM, Woywodt A, Haller H, Rupprecht H, et al. (2009)
Identification and Validation of Urinary Biomarkers for Differential Diagnosisand Evaluation of Therapeutic Intervention in ANCA associated Vasculitis. Mol
Cell Proteomics 8: 2296–2307.
28. Jantos-Siwy J, Schiffer E, Brand K, Schumann G, Rossing K, et al. (2009)Quantitative Urinary Proteome Analysis for Biomarker Evaluation in Chronic
Kidney Disease. J Proteome Res 8: 268–281.29. Neuhoff N, Kaiser T, Wittke S, Krebs R, Pitt A, et al. (2004) Mass spectrometry
for the detection of differentially expressed proteins: a comparison of surface-
enhanced laser desorption/ionization and capillary electrophoresis/massspectrometry. Rapid Communications in Mass Spectrometry 18: 149–156.
30. Wittke S, Fliser D, Haubitz M, Bartel S, Krebs R, et al. (2003) Determination ofpeptides and proteins in human urine with capillary electrophoresis–mass
spectrometry, a suitable tool for the establishment of new diagnostic markers.J Chromatogr A 1013: 173–181.
31. Girolami M, Mischak H, Krebs R (2007) Analysis of complex, multidimensional
datasets. Drug Discov Today: Technologies 3: 12–19.32. Yang ZR (2004) Biological applications of support vector machines. Brief
Bioinform 5: 328–338.33. Yang ZR, Chou KC (2004) Bio-support vector machines for computational
proteomics. Bioinformatics 20: 735–741.
34. DeLeo JM (1993) Receiver operating characteristic laboratory (ROCLAB):Software for developing decision strategies that account for uncertainty. pp
318–325.35. Good DM, Zurbig P, Argiles A, Bauer HW, Behrens G, et al. (2010) Naturally
occurring human urinary peptides for use in diagnosis of chronic kidney disease.Mol Cell Proteomics in press.
36. Good DM, Wenger CD, McAlister GC, Bai DL, Hunt DF, et al. (2009) Post-
acquisition ETD spectral processing for increased peptide identifications. J AmSoc Mass Spectrom 20: 1435–1440.
37. Good DM, Wenger CD, Coon JJ (2010) The effect of interfering ions on searchalgorithm performance for electron-transfer dissociation data. Proteomics 10:
164–167.
38. Zurbig P, Renfrow MB, Schiffer E, Novak J, Walden M, et al. (2006) Biomarkerdiscovery by CE-MS enables sequence analysis via MS/MS with platform-
independent separation. Electrophoresis 27: 2111–2125.39. Williams BJ, Russell WK, Russell DH (2007) Utility of CE-MS data in protein
identification. Anal Chem 79: 3850–3855.40. Benjamini Y, Hochberg Y (1995) Controlling the false discovery rate: a practical
and powerful approach to multiple testing. J Royal Stat Soc B (Methodological)
57: 125–133.41. Snell-Bergeon JK, Maahs DM, Ogden LG, Kinney GL, Hokanson JE, et al.
(2009) Evaluation of urinary biomarkers for coronary artery disease, diabetes,and diabetic kidney disease. Diabetes Technol Ther 11: 1–9.
42. Soylemezoglu O, Wild G, Dalley AJ, MacNeil S, Milford-Ward A, et al. (1997)
Urinary and serum type III collagen: markers of renal fibrosis. Nephrol DialTransplant 12: 1883–1889.
43. Kottgen A, Glazer NL, Dehghan A, Hwang SJ, Katz R, et al. (2009) Multipleloci associated with indices of renal function and chronic kidney disease. Nat
Genet 41: 712–717.
Proteomics for DN Diagnosis
PLoS ONE | www.plosone.org 10 October 2010 | Volume 5 | Issue 10 | e13421