Embed Size (px)
Citation preview
University of Groningen
Income distribution across ethnic groups in MalaysiaSaari, Mohd
IMPORTANT NOTE: You are advised to consult the publisher's version (publisher's PDF) if you wish to cite fromit. Please check the document version below.
Document VersionPublisher's PDF, also known as Version of record
Publication date:2015
Link to publication in University of Groningen/UMCG research database
Citation for published version (APA):Saari, M. (2015). Income distribution across ethnic groups in Malaysia: applying social accounting matricesGroningen: University of Groningen, SOM research school
CopyrightOther than for strictly personal use, it is not permitted to download or to forward/distribute the text or part of it without the consent of theauthor(s) and/or copyright holder(s), unless the work is under an open content license (like Creative Commons).
Take-down policyIf you believe that this document breaches copyright please contact us providing details, and we will remove access to the work immediatelyand investigate your claim.
Downloaded from the University of Groningen/UMCG research database (Pure): http://www.rug.nl/research/portal. For technical reasons thenumber of authors shown on this cover page is limited to 10 maximum.
Download date: 11-02-2018

Income Distribution across Ethnic Groups in Malaysia
Applying Social Accounting Matrices
M. Yusof Saari
Publisher: University of Groningen, Groningen, The Netherlands
Printed by: Ipskamp Drukkers, B.V.
ISBN: 978-90-367-7673-8
978-90-367-7672-1 (e-book) © 2015 M. Yusof Saari All rights reserved. No part of this publication may be reproduced, stored in a retrieval system of any nature, or transmitted in any form or by any means, electronic, mechanical, now known or hereafter invented, including photocopying or recording, without prior written permission of the publisher.
Income Distribution across Ethnic Groups in
Malaysia
Applying Social Accounting Matrices
PhD thesis
to obtain the degree of PhD at the University of Groningen on the authority of the
Rector Magnificus Prof. E. Sterken and in accordance with
the decision by the College of Deans
This thesis will be defended in public on
Thursday 19 March 2015 at 12.45 hours
by
Mohd Yusof Saari
born on 21 August 1979 in Perak, Malaysia

Supervisor Prof. H.W.A. Dietzenbacher
Co-supervisor Dr. B. Los
Assessment committee Prof. M. Llop Llop Prof. J. Oosterhaven Prof. D. Roland-Holst
To my parents
Hidup memerlukan pengorbananan. Pengorbanan memerlukan perjuangan.
Perjuangan menentukan kejayaan. Kejayaan pula akan menentukan kebahagiaan.
Jangan impikan kejayaan tanpa berusaha mencapainya.
To Az Zahrawaani, Daniel, Danish and Durrah
Kejayaan ini dipenuhi dengan seribu macam kemanisan tetapi untuk mencapainya perlu seribu macam kepahitan.
Kalau tidak kerana semalam kita telah berusaha, bersabar dan berdoa, belum tentu hari ini kita akan berada di sini.

Acknowledgments
This dissertation is the end of my long and solitary journey to obtain a Ph.D. degree
from the University of Groningen, the Netherlands. At the beginning, many colleagues
and friends from my home university (Department of Economics, Universiti Putra
Malaysia) asked me why I had chosen the University of Groningen for my Ph.D. study.
This may seem a somewhat uncommon destination indeed, because most of the staff
members pursue their Ph.D. in economics in the United States, the United Kingdom,
or Australia. My answer was simple: “I am looking for a “guru” in input-output
analysis.” In addition, the University of Groningen offers a research-based Ph.D.
program which would certainly benefit my home university in its attempt to increase
the quality of research and the number of publications. In that respect, I expected to
learn a lot in Groningen that could be beneficial for my home university. Another
question that I received was: “How is Groningen city?” I had no idea. The only
information I had then was about Fandi Ahmad, a Singaporean football player, who
played for FC Groningen in the 1990s. After living in Groningen for four years (2006-
2010), I can say that it is a great city to study and live in. Ik hou van Groningen.
This dissertation is a collection of self-contained papers, the drafts of which
were written between December 2006 and December 2010 at the Faculty of Economics
and Business of the University of Groningen. This dissertation would not have
appeared in its present form without the kind assistance and support from many
people. It is a true honor and pleasure to acknowledge them here.
It has been a great experience to work under the supervision of two well-known
input-output experts, Erik Dietzenbacher and Bart Los. With his enthusiasm,
inspiration, and great efforts in explaining things clearly and simply, Erik made input-
output analyses fun for me. He has provided excellent guidance from the beginning
until the completion of this dissertation. Bart is an enduring source of innovative and
critical thinking. He gave me the inspiration to create the novel aspects of my
research, which certainly has improved its quality. Both of them have provided
extensive efforts in reading and editing drafts of the papers. Apart from the scientific
writing experiences that I learned from them, I believe that Erik and Bart have
succeeded in transforming me in three aspects: (i) from an unfocused to a focused
worker; (ii) from a standard Malaysian researcher to an international researcher; and
(iii) from publishing in “local” journals to publishing in social science citation indexed
journals. Apart from research guidance, Erik also taught me “how to make life easy”
while Bart trained me “to become a good badminton player”. This additional knowledge
sharing has certainly made my life colorful and enjoyable.
I would like to express my gratitude to the members of the assessment
committee (beoordelingscommissie), Jan Oosterhaven, Maria Llop and David Roland-
Holst for their willingness to read this dissertation. Their valuable comments and
suggestions have certainly further improved the quality of this dissertation.
This study would not have been possible without the support and assistance
from various government agencies in Malaysia. The financial means provided jointly by
Universiti Putra Malaysia and the Ministry of Higher Education Malaysia were crucial
for the completion of this study. The strong support from the Economic Planning Unit
Malaysia has made this study feasible. Data supply and guidance provided by the
Department of Statistics Malaysia have in many ways facilitated my research.
I owe my deepest gratitude to the members of Research School SOM, Martin
Land, Rina Koning, Ellen Nienhuis, Arthur de Boer and Astrid Beerta for their legal
and administrative support. The assistance of Rina and Ellen in organizing the
translation of the dissertation summary in Dutch is highly appreciated.

I am indebted to many colleagues who have read my papers or commented on
my presentations in Groningen. Among them are Jan Oosterhaven, Bert Steenge, Dirk
Stelder, Marcel Timmer, Dirk Bezemer and Robert Inklaar. Also several colleagues
outside Groningen (who I met personally at conferences or virtually via e-mail
communication) have provided their valuable comments and suggestions. I have
benefited in particular from Jeffery Round, Graham Pyatt, Geoffrey J.D. Hewings,
Michael L. Lahr, Gülay Günlük-Şenesen, Kurt Kratena, David L. Ryan, Manuel
Frondel and Henry Thompson. Furthermore, it has always been a pleasure to have
communications beyond academic discourse with other Ph.D. colleagues: Umed
Temurshoev, Xuemei Jiang, Maaike Bouwmeester, Jiansuo Pei, Quanrun Chen,
Janneke Pieters, Abdul Azeez Erumban, Gaaitzen de Vries, Lewis Lishemoi, Kadek
Dian Sutrisma Artha, Peter van Santen, and Anna Samaryna.
Finally, my heartfelt thanks to my wife, Az Zahrawaani, who has tolerated my
inordinate demand for time over the past few years. I think the best way of expressing
my gratitude is by dedicating this book to her.


Contents
Chapter 1: Introduction 1
1.1 Ethnic Plurality and Economic Duality in Malaysia 1
1.2 Income Inequality and Ethnic Riots in Malaysia 4
1.3 Research on the Links between Economic Growth and (Ethnic) Inequality 7
1.4 Outline 10
References 13
Chapter 2: Construction of a New Social Accounting Matrix and Analysis of
Income Distribution 15
2.1 Introduction 15
2.2 Structure of the SAM for Malaysia, 2000 18
2.2.1 General structure 18
2.2.2 Disaggregation for Income Distribution Analysis 22
2.3 The Top-Down Approach 24
2.4 Data Requirements and Problems 27
2.4.1 Data requirements 27
2.4.2 Problems related to data 29
2.5 Results and Discussion 31
2.5.1 Distribution of household income 32
2.5.2 Inequality in the labor market 37
2.5.3 Summary of most important findings 43
2.6 A Comparison of the Income Distributions in 1970 and 2000 44
2.6.1 The situation in 1970 45
2.6.2 The changes between 1970 and 2000 47
2.7 Concluding Remarks 49
References 51
Appendix 54

Chapter 3: Sources of Income Growth and Inequality, 1970-2000 57
3.1 Introduction 57
3.2 Economic Policies, Growth and Income Inequality, 1970-2000 59
3.3 Social Accounting Matrices and Deflation Procedures 67
3.3.1 The 1970 and 2000 SAMs 67
3.3.2 Deflation procedures 71
3.4 Structural Decomposition Analyses 74
3.4.1 Decomposition of the changes in income 74
3.4.2 Decomposition of the changes in employment 80
3.4.3 Decomposition of the change in Theil’s inequality index 81
3.5 Results and Discussion 82
3.5.1 Decomposing changes in income per capita 82
3.5.2 Decomposing changes in household incomes and labor incomes 85
3.5.3 Decomposing changes in labor income inequality 92
3.5.4 Decomposing changes in production and employment 96
3.6 Concluding Remarks 99
References 103
Appendices 106
Chapter 4: Production interdependencies and poverty reduction 109
4.1 Introduction 109
4.2 Growth and Poverty across Ethnic Groups 112
4.3 Methodology 115
4.3.1 Decomposition of output growth 115
4.3.2 Linking the multiplier decomposition analysis to poverty 122
4.4 Data Sources 125
4.5 Results and Discussions 127
4.5.1 Impacts on aggregate poverty 127
4.5.2 Decomposition of poverty impacts 135
4.6 Concluding Remarks 140
References 142
Appendices 146
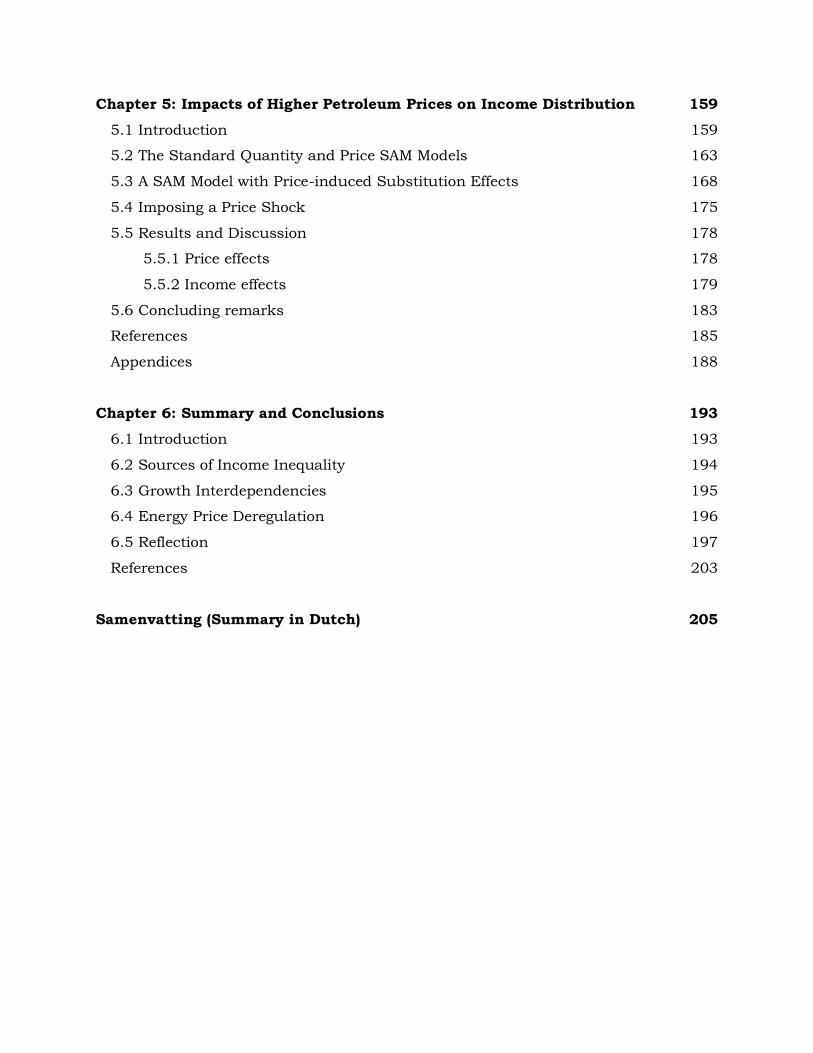
Chapter 5: Impacts of Higher Petroleum Prices on Income Distribution 159
5.1 Introduction 159
5.2 The Standard Quantity and Price SAM Models 163
5.3 A SAM Model with Price-induced Substitution Effects 168
5.4 Imposing a Price Shock 175
5.5 Results and Discussion 178
5.5.1 Price effects 178
5.5.2 Income effects 179
5.6 Concluding remarks 183
References 185
Appendices 188
Chapter 6: Summary and Conclusions 193
6.1 Introduction 193
6.2 Sources of Income Inequality 194
6.3 Growth Interdependencies 195
6.4 Energy Price Deregulation 196
6.5 Reflection 197
References 203
Samenvatting (Summary in Dutch) 205
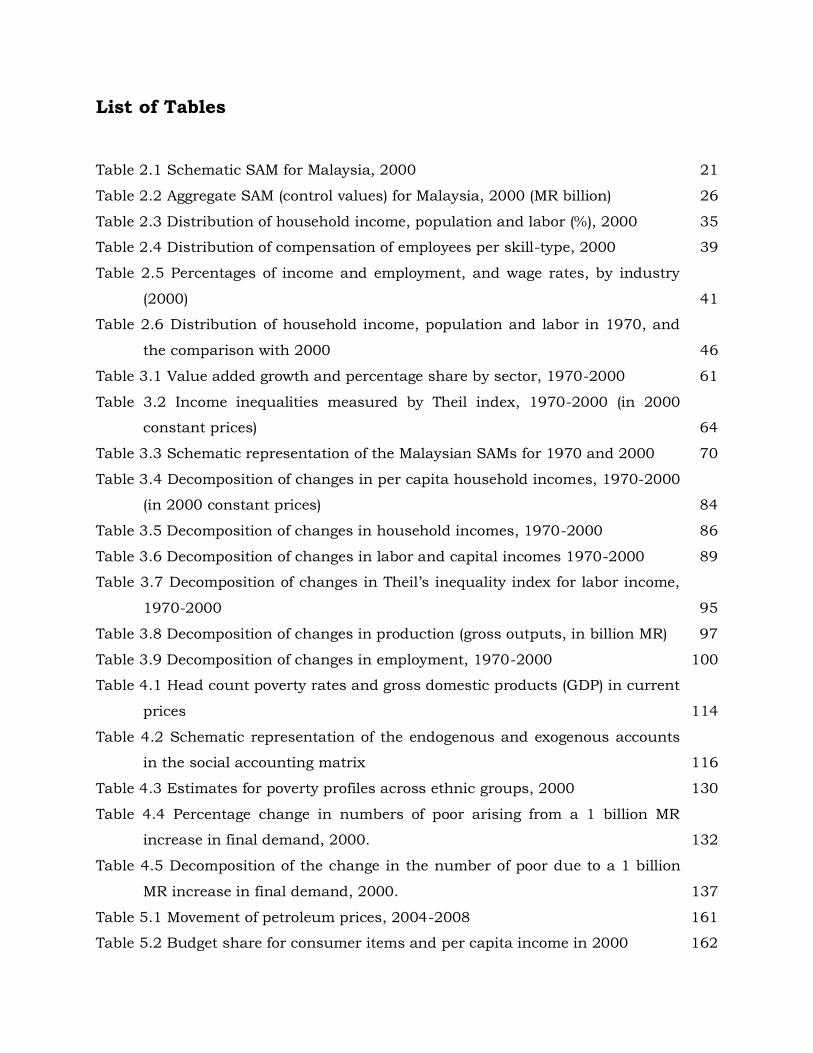
List of Tables
Table 2.1 Schematic SAM for Malaysia, 2000 21
Table 2.2 Aggregate SAM (control values) for Malaysia, 2000 (MR billion) 26
Table 2.3 Distribution of household income, population and labor (%), 2000 35
Table 2.4 Distribution of compensation of employees per skill-type, 2000 39
Table 2.5 Percentages of income and employment, and wage rates, by industry
(2000) 41
Table 2.6 Distribution of household income, population and labor in 1970, and
the comparison with 2000 46
Table 3.1 Value added growth and percentage share by sector, 1970-2000 61
Table 3.2 Income inequalities measured by Theil index, 1970-2000 (in 2000
constant prices) 64
Table 3.3 Schematic representation of the Malaysian SAMs for 1970 and 2000 70
Table 3.4 Decomposition of changes in per capita household incomes, 1970-2000
(in 2000 constant prices) 84
Table 3.5 Decomposition of changes in household incomes, 1970-2000 86
Table 3.6 Decomposition of changes in labor and capital incomes 1970-2000 89
Table 3.7 Decomposition of changes in Theil’s inequality index for labor income,
1970-2000 95
Table 3.8 Decomposition of changes in production (gross outputs, in billion MR) 97
Table 3.9 Decomposition of changes in employment, 1970-2000 100
Table 4.1 Head count poverty rates and gross domestic products (GDP) in current
prices 114
Table 4.2 Schematic representation of the endogenous and exogenous accounts
in the social accounting matrix 116
Table 4.3 Estimates for poverty profiles across ethnic groups, 2000 130
Table 4.4 Percentage change in numbers of poor arising from a 1 billion MR
increase in final demand, 2000. 132
Table 4.5 Decomposition of the change in the number of poor due to a 1 billion
MR increase in final demand, 2000. 137
Table 5.1 Movement of petroleum prices, 2004-2008 161
Table 5.2 Budget share for consumer items and per capita income in 2000 162

Table 5.3 Schematic representation of endogenous and exogenous accounts in
the SAM 164
Table 5.4 Income and per capita income effects of rising petroleum price 180
List of Figures
Figure 1.1 Map of Malaysia 2
Figure 1.2 Poverty rates and per capita income gaps, 1957-2005 6
Figure 4.1a Contribution of the initial effect on poverty reduction across rural
groups (%) 137
Figure 4.1b Contribution of the initial effect on poverty reduction across urban
groups (%) 138
Figure 5.1 The nested structure of the production functions 171
Figure 5.2 Correlation between changes in price and energy intensity 179