Embed Size (px)
Citation preview
University of Groningen
How to escape from a tense situationFolgering, Jozef Hendrik Arnold
IMPORTANT NOTE: You are advised to consult the publisher's version (publisher's PDF) if you wish to cite fromit. Please check the document version below.
Document VersionPublisher's PDF, also known as Version of record
Publication date:2005
Link to publication in University of Groningen/UMCG research database
Citation for published version (APA):Folgering, J. H. A. (2005). How to escape from a tense situation: Bacterial mechanosensitive channelsGroningen: s.n.
CopyrightOther than for strictly personal use, it is not permitted to download or to forward/distribute the text or part of it without the consent of theauthor(s) and/or copyright holder(s), unless the work is under an open content license (like Creative Commons).
Take-down policyIf you believe that this document breaches copyright please contact us providing details, and we will remove access to the work immediatelyand investigate your claim.
Downloaded from the University of Groningen/UMCG research database (Pure): http://www.rug.nl/research/portal. For technical reasons thenumber of authors shown on this cover page is limited to 10 maximum.
Download date: 04-05-2018

Summary
95
(V); (= (RT / V) ln a)
Bacterial mechanosensation: lessons and challenges Joost H.A. Folgering, Ana A. Arteni, Johanna M. Kuiper, Jan B.F.N. Engberts
and Bert Poolman Abbreviations: ABC, ATP-binding cassette; GUV, Giant Unilamellar Vesicle; FCS, Fluorescence Correlation Spectroscopy; LUV, Large Unilamellar Vesicle; AC, alternating current; AFM, Atomic Force Microsopy; DOPE, L-α-dioleoyl phosphatidylethanolamine; DOPC, 1,2-dioleoyl-sn-glycero-3-phosphatidylcholine; CCD, charge-coupled device; DIC, differential interference contrast; MTSET, [2-(trimethylammonium)ethyl] methanethiosulfonate; FRET, fluorescence resonance energy transfer Introduction All cells in nature are surrounded by a lipid membrane that is semi-permeable. This means they allow passage of water and small hydrophobic molecules into and out of the cell, but block diffusion of large and hydrophilic molecules like ions and sugars (Fig 1A). The cell volume is determined by the mechanic and elastic properties of the cell envelope, that is, the membrane in combination with an internal and/or external skeleton and by the water activities inside and outside the cell. The turgor pressure is the hydrostatic pressure difference that balances the internal and external osmolyte concentrations. The relation can be summarized as follows:
The equation relates turgor pressure (∆π) of the cell with the water activity outside and inside the cell (ao and ai, respectively); the partial molal volume of the solvent R is the gas-constant and T is the absolute temperature; π
is the osmotic pressure. Water activity of the internal and external environment of the cell is inversely related to the osmolyte concentrations (ci and co; 1). If the solute concentration outside the cell increases (hyperosmotic stress), the external water activity will decrease, and there will be a net efflux of water from the cell. Also, the turgor pressure will decrease and ultimately the cell will plasmolyse (when Δπ = 0; Fig. 1B; 2). A decrease in cell volume will increase the crowding of the cytoplasm, which in turn may cause aggregation of the proteins and so affect essential processes in the cell. Bacteria will generally respond to this type of stress by importing and/or synthesizing compatible solutes (1, 3 and 4), and thereby counteract the loss of water and the accompanying decrease in volume and turgor pressure. The most important transporter for the uptake of compatible solutes in Lactococcus lactis is the ATP binding cassette (ABC) transporter OpuA, which transports glycine betaine at the expense of ATP. OpuA is activated when the ionic strength of the cytoplasm increases as a result of volume decrease, the ion-sensing activity of OpuA is dependent on the presence of charged lipids (5-7). The actual osmosensing domain of the protein has recently been identified and corresponds to a specific, so-called CBS-domain
∆π = π i – πo = (RT / V) ln (ao / ai) ≈ RT (ci - co)

Chapter 6
96
(this domain was first identified in the cystathionine-β-synthase protein, hence it is called CBS) that interacts with the cell membrane (8).
Figure 1: In their natural environments bacteria are often challenged by osmotic stress. (A) Osmostatic conditions correspond to osmolarities of the medium optimal for growth when exogenous osmoprotectants are absent. When the concentration of osmolytes in the environment increases, the bacteria become (B) hyper-osmotically stressed and lose water. If, on the other hand, the external medium is diluted the cell becomes (C) hypo-osmotically stressed and water will flow into the cell. The adaptation mechanisms of the cell to counteract the negative effects of these stresses are discussed in the text. Arrows indicate the (net) flow of water immediately after the stress is imposed.
Rapidly increasing external osmolarities are often encountered by bacteria in nature, for instance during droughts. High medium osmolarities are exploited in biotechnological applications, for instance, the growth of microorganisms in food products to inhibit spoilage. The reverse process, i.e., the rapid decrease of the external osmolarity is also common in natural environments (e.g., dilution of the external osmolyte concentrations by rainfall). In those situations, water will diffuse into the cell, increasing the cell volume. However, the cell membrane and surrounding cell-wall cannot be stretched without limit, neither can it be synthesized at a rate fast enough to keep up with the volume increase. Initially this would mean that the turgor pressure will increase but, eventually, if the cell is not protected, it will lyse (Fig. 1C). The Mechanosensitive channel of Large (MscL) conductance is one of the proteins that actually protect the bacterial cell against lysis. The channel works like a pressure relief valve; it opens near the lytic tension of the membrane and allows osmolytes and water to flow out of the cell, thereby decreasing the cell volume and relieving the membrane tension. Even though OpuA and MscL both have functions in the process of cell volume regulation, their mode of regulation is very different. Whereas OpuA is

Summary
97
activated by an electrostatic switching mechanism involving protein-lipid headgroup interactions, MscL is activated by a change in the lateral pressure (profile) of the membrane. The lateral pressure is composed of the components of the interactions between the various membrane constituents, specifically the derivative of their Gibbs free energy with respect to area. The lateral pressure profile is the depth-dependent distribution of lateral stresses within the membrane (9). Here, we have used the lateral pressure profile as a description of the lateral stresses in lipid membranes. The lateral pressure can be influenced by the asymmetric bending or thinning of the membrane. When activated the turnover of transporters like OpuA is around 1-10 glycine betaine molecules translocated per second, whereas MscL in the open state allows the flow of 108-109 ions per second. The ion-flux through MscL results in a current that is measurable at the level of individual channel molecules. The MscL channel is the main research topic of this thesis. The set-up used to study the channel is described in detail in Text-box 1. Historical perspective As described in chapter 1, the road to finding the conditions under which single channel activities could be studied started over 250 years ago with Galvani and Volta trying to elucidate why frog leg muscles would contract in reaction to a physical stimulus. Only after the realization that biological cells are surrounded by a membrane, the knowledge of Galvani and Volta could be applied and explained. It became possible to measure potentials across and later even currents through membranes, both in rest and during muscle contraction. It even became possible to measure the current through the muscle cell membrane. However, the current measurements always represented the activity of an ensemble of channels. It was not until the 1970s, that the patch clamp technique and the black lipid membrane system allowed the study of individual ion channel activities (10). Text-box 1:
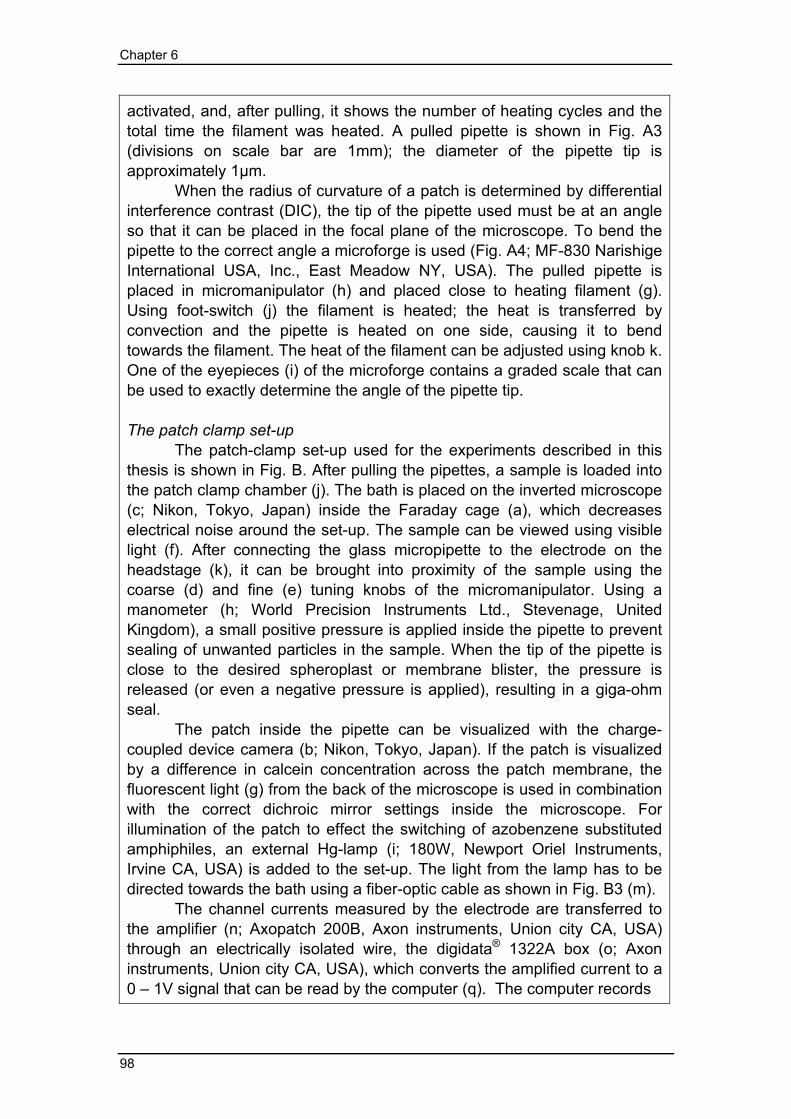
Preparing patch pipettes Before patching of a sample one needs to prepare the glass microelectrodes. The micropipettes were pulled from 100μL borosilicate glass capillaries (2-000-200; Drummond Scientific Company, Broomall PA, USA) using the P-97 Micropipette puller (Fig. A1 and details shown in A2; Sutter Instruments Company, Novato CA, USA). The capillaries were positioned using slidebars (d) and heated with a heating filament (c). When the glass is warm enough, the sliding bars pull on the capillary, thereby elongating and thinning it. When the movement of the sliding bars exceeds a preprogrammed value, the heating is stopped and the glass and heating filament are air cooled, using compressed (a) and dried air (b). The heating cycle can now be restarted. The temperature of the filament, the maximal speed of the sliding bar, the cooling time and the number of heating cycles can all be programmed (f). The display (e) shows the pulling program that is
Chapter 6
98
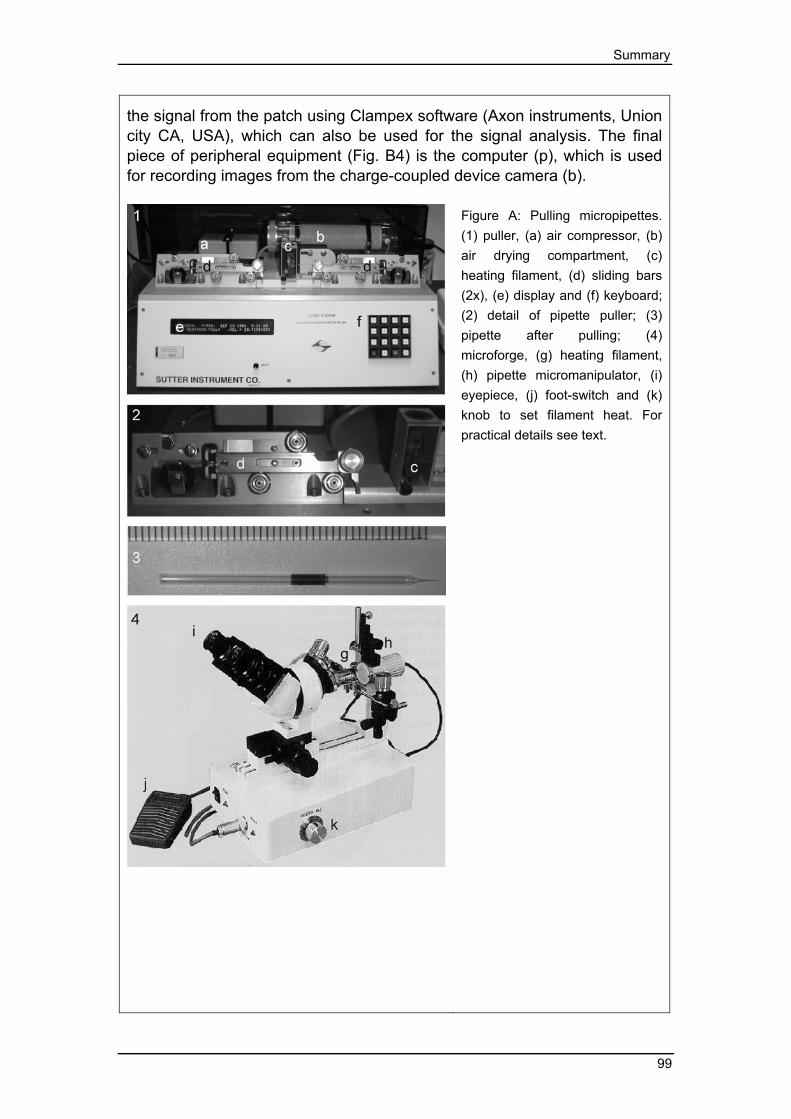
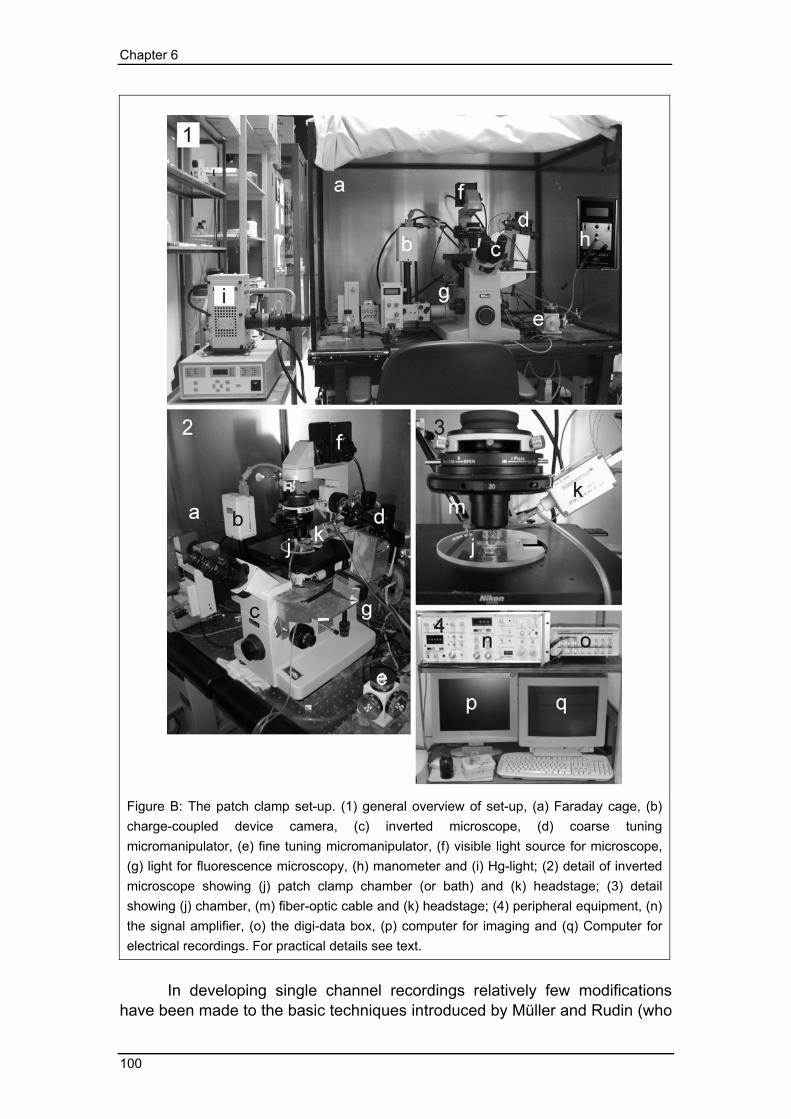
activated, and, after pulling, it shows the number of heating cycles and the total time the filament was heated. A pulled pipette is shown in Fig. A3 (divisions on scale bar are 1mm); the diameter of the pipette tip is approximately 1μm. When the radius of curvature of a patch is determined by differential interference contrast (DIC), the tip of the pipette used must be at an angle so that it can be placed in the focal plane of the microscope. To bend the pipette to the correct angle a microforge is used (Fig. A4; MF-830 Narishige International USA, Inc., East Meadow NY, USA). The pulled pipette is placed in micromanipulator (h) and placed close to heating filament (g). Using foot-switch (j) the filament is heated; the heat is transferred by convection and the pipette is heated on one side, causing it to bend towards the filament. The heat of the filament can be adjusted using knob k. One of the eyepieces (i) of the microforge contains a graded scale that can be used to exactly determine the angle of the pipette tip. The patch clamp set-up The patch-clamp set-up used for the experiments described in this thesis is shown in Fig. B. After pulling the pipettes, a sample is loaded into the patch clamp chamber (j). The bath is placed on the inverted microscope (c; Nikon, Tokyo, Japan) inside the Faraday cage (a), which decreases electrical noise around the set-up. The sample can be viewed using visible light (f). After connecting the glass micropipette to the electrode on the headstage (k), it can be brought into proximity of the sample using the coarse (d) and fine (e) tuning knobs of the micromanipulator. Using a manometer (h; World Precision Instruments Ltd., Stevenage, United Kingdom), a small positive pressure is applied inside the pipette to prevent sealing of unwanted particles in the sample. When the tip of the pipette is close to the desired spheroplast or membrane blister, the pressure is released (or even a negative pressure is applied), resulting in a giga-ohm seal. The patch inside the pipette can be visualized with the charge-coupled device camera (b; Nikon, Tokyo, Japan). If the patch is visualized by a difference in calcein concentration across the patch membrane, the fluorescent light (g) from the back of the microscope is used in combination with the correct dichroic mirror settings inside the microscope. For illumination of the patch to effect the switching of azobenzene substituted amphiphiles, an external Hg-lamp (i; 180W, Newport Oriel Instruments, Irvine CA, USA) is added to the set-up. The light from the lamp has to be directed towards the bath using a fiber-optic cable as shown in Fig. B3 (m). The channel currents measured by the electrode are transferred to the amplifier (n; Axopatch 200B, Axon instruments, Union city CA, USA) through an electrically isolated wire, the digidata® 1322A box (o; Axon instruments, Union city CA, USA), which converts the amplified current to a 0 – 1V signal that can be read by the computer (q). The computer records
Summary
99
the signal from the patch using Clampex software (Axon instruments, Union city CA, USA), which can also be used for the signal analysis. The final piece of peripheral equipment (Fig. B4) is the computer (p), which is used for recording images from the charge-coupled device camera (b).
Figure A: Pulling micropipettes. (1) puller, (a) air compressor, (b) air drying compartment, (c) heating filament, (d) sliding bars (2x), (e) display and (f) keyboard; (2) detail of pipette puller; (3) pipette after pulling; (4) microforge, (g) heating filament, (h) pipette micromanipulator, (i) eyepiece, (j) foot-switch and (k) knob to set filament heat. For practical details see text.
Chapter 6
100
Figure B: The patch clamp set-up. (1) general overview of set-up, (a) Faraday cage, (b) charge-coupled device camera, (c) inverted microscope, (d) coarse tuning micromanipulator, (e) fine tuning micromanipulator, (f) visible light source for microscope, (g) light for fluorescence microscopy, (h) manometer and (i) Hg-light; (2) detail of inverted microscope showing (j) patch clamp chamber (or bath) and (k) headstage; (3) detail showing (j) chamber, (m) fiber-optic cable and (k) headstage; (4) peripheral equipment, (n) the signal amplifier, (o) the digi-data box, (p) computer for imaging and (q) Computer for electrical recordings. For practical details see text.
In developing single channel recordings relatively few modifications have been made to the basic techniques introduced by Müller and Rudin (who

Summary
101
introduced black lipid membrane technique) and Neher and Sackmann (who introduced the patch clamp technique). The improvements were mainly directed towards a higher signal to noise ratio, which was accomplished by the use of better amplifiers and improvements in the membrane seal. The membrane seal was improved by using micropipettes made from borosilicate glass, but also by decreasing the size of the pipette opening. Smaller pipette openings, and the resulting smaller patches led to a lower influence of membrane capacitive currents (in the order of ~ 1pA) on the channel current recording (11). Recently, developments have been directed towards high-throughput systems, which allow fast screening of channel activity in multiple patches in parallel and their in response to ligands or other stimuli. The first systems to be used as on-site user-friendly bio-sensors (12) and high-throughput drug-screening facilities (13) are now available. One area that seems to be underexposed is the use of the patch clamp technique in combination with other biophysical or biochemical methods. In chapter 3, we explore the possibilities of using proteo-GUVs for fluorescence correlation spectroscopy and patch clamp analysis, but other combinations of techniques seem possible and will be discussed further under ”Giant Unilamellar Vesicles”. Using a modification of the patch clamp technique developed by Naher and Sackmann (14), the mechanosensitive channels of large and small conductance have been identified and characterized. The proteins responsible for these activities have also been crystallized to obtain structural insights into the functioning of the channel. However, the structure of only one conformation is available for each channel: for MscL (15), the (partially) closed conformation; for MscS (16), the (largely) open conformation. Ever since the structure of MscL has been available, researchers have attempted to link function to specific α-amino acid residues in the protein (17-20). An important recent result involves the assembly of the channel from split polypeptides. Oligomers of the N-terminal half, containing transmembrane helix 1 (TM 1), were able to form tension-insensitive channels. Oligomers assembled from the C-terminal part, containing transmembrane helix 2 (TM 2), were not able to form functional channels. However, if the two channel halves were expressed together, a fully functional channel was formed. The only difference with wild-type MscL was a higher gating tension for the channel made of the two split polypeptides. This work nicely showed that TM 1 is involved in channel formation, whereas TM 2 seems to play a major role in sensing the tension in the membrane (21). Two applications of the MscL channel were discussed in chapter 1. The first application concerns the development of liposomal drug delivery systems, where the channel facilitates diffusion of hydrophilic compounds (e.g. anti-tumor drugs) across the membrane (22). A similar (channel-independent) application, based on polymer chemistry has recently been described (23). The polymers composed of poly(sodium 4-styrenesulfonate) and poly(allylamine hydrochloride) were mixed with the drug of interest, a stabilizer (4-(dimethylamino)pyridine) and gold particles of around 6nm in
Chapter 6
102
diameter. The particle was subsequently coated with a single lipid bilayer, and the resulting capsules could be activated by 10ns light pulses from a near-infrared laser, which melted the gold-polymer particles and released the encapsulated drug. The second application involved the engineering of MscL to a pore with a metal-binding site, which essentially converted MscL to a ligand gated channel. This result shows that it is possible to add functionality to MscL, which may aid the further development of biosensors based on this channel (24). A major challenge for the future is the elucidation at high resolution of the open conformation of MscL. Currently, several models for channel gating based on the closed structure and molecular modeling are available. Even though it is a powerful technique, modeling of molecular dynamics is always dependent on the parameters that are entered into the model by the experimenter. The open conformation would provide an end-point for the modeling of the gating mechanism. A mutant that can be locked in the open state is available, but so far, no crystals have been obtained using this mutant (25). Characterisation of the mechanosenstive channels from Lactococcus lactis Chapter 2 describes the identification and characterization of MscL and MscS from Lactococcus lactis. Both channels have properties similar to those previously reported for the corresponding E. coli proteins. MscS from L. lactis is the third characterized MscS-like channel and the second from a Gram-positive bacterium. An unexpected finding was that even though both mscL and mscS are expressed (at least at the level of mRNA), efflux of glycine betaine from L. lactis seems to be mediated mainly by MscL. This was confirmed by patch clamp measurements on membranes from an MscL disruption strain, in which mechanosensitive channel activity was no longer observed. However, when the MscS channel was produced in Escherichia coli, it did form functional mechanosensitive channels. As the mRNA for the MscS protein was normally produced, one would expect the protein to be synthesized by the cell, which leaves the question of how and why MscS activity in L. lactis is down-regulated. In a recent paper by Akitake et al. (26), it has been described that the activity of MscS from E. coli is influenced by the membrane potential. It is however unlikely that this parameter is the cause for the failure to detect any MscS activity in L. lactis, because, when the protein was heterologously produced in E. coli, channel activity was readily observed. Obviously, more research on the regulation of MscS synthesis and activity is required. Giant Unilamellar Vesicles Membrane protein studies are often carried out in so-called proteoliposomes. Frequently the formation of proteoliposomes involves the use of purified detergent-solubilized protein and detergent-destabilized liposomes, followed by removal of the detergent molecules (by dilution, dialysis or adsorption to polystyrene beads). Proteoliposomes have a
Summary
103
diameter of ~ 200nm and are called Large Unilamellar Vesicles (or LUVs). Although these LUVs are very useful for the analysis of transport across liposomal membranes, they are too small for techniques such as patch clamp or single molecule spectroscopy. In chapter 3, a method is presented for the preparation of Giant Unilamellar Vesicles (or GUVs), ranging in diameter from 5 to 50μm, into which a number of membrane proteins (MscL, OppA and LacS) have been successfully incorporated. Formation of GUVs is not a new in the sense of forming pure lipid vesicles (27-30). However, functional incorporation of membrane proteins in these GUVs is a challenge, as it requires the conservation of functional integrity of the membrane proteins, that is, during the de- and rehydration steps of the GUV formation process. This problem was overcome by the addition of low amounts of sucrose (or trehalose). These co-solvents are thought to stabilize proteins through hydrogen bonding with the polar groups of proteins during dehydration (31). When (proteo)liposomes prepared from unsaturated lipids are dried the transition temperature (TM) increases by 70-80°C (32). This means that the lipids go from a liquid crystalline to a gel phase, which causes lateral phase separation and may cause protein aggregation. Thus, sucrose most likely also plays a role by preventing this lateral phase separation (and presumably protein aggregation) by maintaining the membrane in the liquid crystalline phase; the sugars lower the TM during drying with about 70°C (32). The sugar molecules exert this effect (replacing the evaporating water) by hydrogen-bonding to the lipid headgroups, thereby maintaining the spacing between the headgroups and preventing the membrane from going from the liquid-crystalline to the gel phase. The interactions of sucrose with the proteins and the maintenance of the liquid-crystalline phase of the membrane are most probably the determining factors for the stabilization of the studied proteins. However, while these co-solvents stabilized the proteins during dehydration, they inhibited fusion of the lipid membranes and thereby the formation of GUVs, when using conventional rehydration procedures (both in the presence and absence of divalent cations). This problem was largely overcome by the application of an AC electrical field (~ 6V/cm, 10Hz) during the rehydration process. The formed GUVs have been successfully used in FCS, patch clamp and biochemical assays (Chapter 3). It has also been possible to prepare proteo-GUVs at low co-solvent concentrations in the absence of an AC electrical field, provided anionic lipids were present in the proteoliposomes (33). Still, if one would like to use GUVs in a high osmolarity medium, it is advisable to rehydrate proteo-GUVs in the presence of a high-concentration of co-solvents to prevent the liposomes from collapsing upon transfer to a high osmolarity medium. In these cases, the AC electrical field is required for proteo-GUV formation. A potentially important development would be the combination of fluorescence microscopy and electrophysiology. For supported lipid bilayers, in which the support was sealed to the bottom of a chamber containing a buffer, such a set-up has already been realized. After placing the chamber inside a larger buffer-filled chamber, electrodes were placed in the inner

Chapter 6
104
smaller chamber and outer larger chamber, and single channel currents could be measured. For FCS measurements, the lens of the confocal scanning microscope was submerged in the inner chamber (34). A similar set-up could be envisioned with GUVs. The added value would be that by using a fluorescent dye, different lipid domains (rafts), and possibly the partitioning of fluorescently-labeled proteins in these domains, can be observed by confocal scanning. By patching specific membrane domains, the channel functioning in the different lipid environments could be determined. If one of the electrodes would be inserted into the proteo-GUV (using a micropipette), the set-up would no longer require the use of the support and matching chamber combination.
Figure 2: Dependence of MscL open probability on membrane tension for two lipid compositions. MscL from E. coli was reconstituted in liposomes with DOPC:DOPE at a ratio of 3:1 (●) or 1:3 (■). The shift in tension dependence shows that more energy is required to open MscL when the fraction of the non-bilayer forming lipid DOPE is increased. Graph after (35).
GUVs have also contributed to the analysis of the effect of lipid head-group composition on the MscL open probability. Previously, this was done by de- and rehydration of MscL proteoliposomes prepared from the desired lipid composition. However, the yield of membrane blisters suitable for forming giga-ohm seals is low and highly dependent on lipid composition of the membrane. Although the effect of variations in the DOPE:DOPC lipid ratio on the MscL open probability has been reported (Fig. 2 and 35), it is experimentally demanding to obtain these results. With a success rate of GUV formation of nearly 100%, it is now possible to prepare and study proteo-GUVs with a range of lipid compositions. Unfortunately, the next step in the process of patch clamp analysis is not straightforward and makes it laborious to obtain complete data-sets. The remaining problem relates to the stability of the membranes inside the pipette. To obtain open probability curves, it is
Summary
105
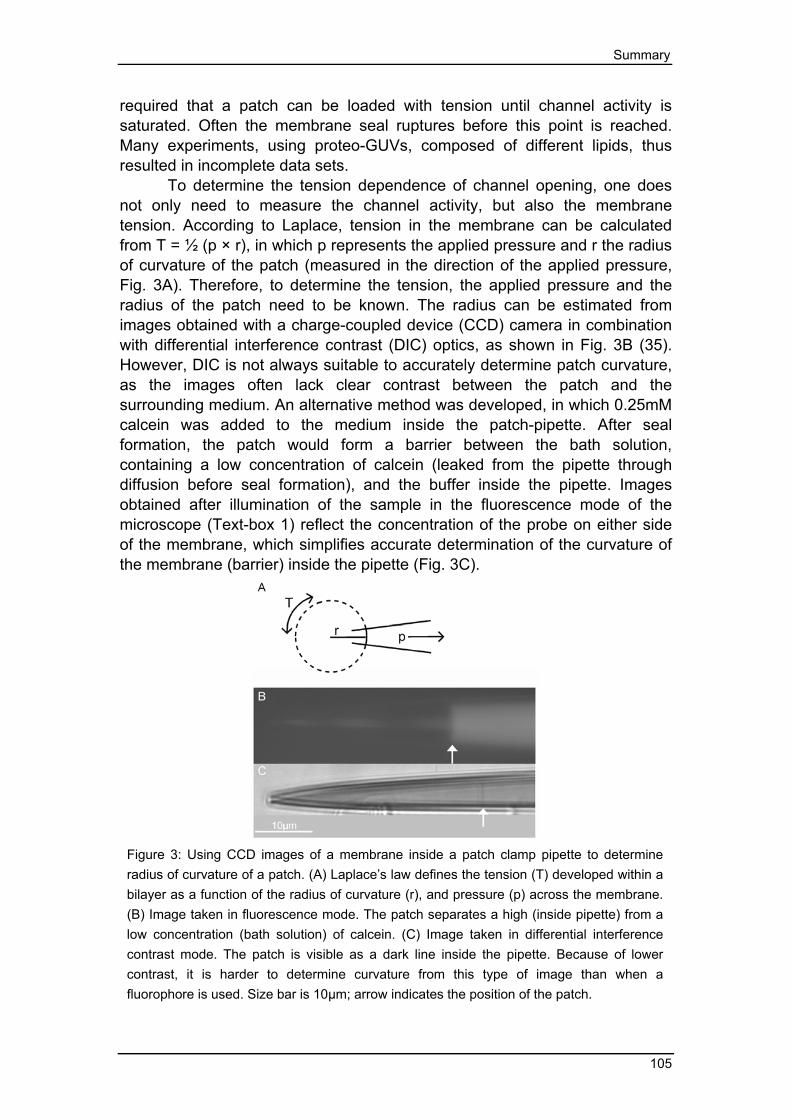
required that a patch can be loaded with tension until channel activity is saturated. Often the membrane seal ruptures before this point is reached. Many experiments, using proteo-GUVs, composed of different lipids, thus resulted in incomplete data sets. To determine the tension dependence of channel opening, one does not only need to measure the channel activity, but also the membrane tension. According to Laplace, tension in the membrane can be calculated from T = ½ (p × r), in which p represents the applied pressure and r the radius of curvature of the patch (measured in the direction of the applied pressure, Fig. 3A). Therefore, to determine the tension, the applied pressure and the radius of the patch need to be known. The radius can be estimated from images obtained with a charge-coupled device (CCD) camera in combination with differential interference contrast (DIC) optics, as shown in Fig. 3B (35). However, DIC is not always suitable to accurately determine patch curvature, as the images often lack clear contrast between the patch and the surrounding medium. An alternative method was developed, in which 0.25mM calcein was added to the medium inside the patch-pipette. After seal formation, the patch would form a barrier between the bath solution, containing a low concentration of calcein (leaked from the pipette through diffusion before seal formation), and the buffer inside the pipette. Images obtained after illumination of the sample in the fluorescence mode of the microscope (Text-box 1) reflect the concentration of the probe on either side of the membrane, which simplifies accurate determination of the curvature of the membrane (barrier) inside the pipette (Fig. 3C).
Figure 3: Using CCD images of a membrane inside a patch clamp pipette to determine radius of curvature of a patch. (A) Laplace’s law defines the tension (T) developed within a bilayer as a function of the radius of curvature (r), and pressure (p) across the membrane. (B) Image taken in fluorescence mode. The patch separates a high (inside pipette) from a low concentration (bath solution) of calcein. (C) Image taken in differential interference contrast mode. The patch is visible as a dark line inside the pipette. Because of lower contrast, it is harder to determine curvature from this type of image than when a fluorophore is used. Size bar is 10μm; arrow indicates the position of the patch.
Chapter 6
106
After full data-sets have been obtained, the tension dependence of the channel, in combination with pressure profile data (obtained from molecular modeling) for the MscL-containing membranes composed of different lipids, may help elucidate the osmosensing mechanism of MscL. In this respect, the mutants in the outward facing rim of MscL, seemingly involved in tension sensing (36), may be useful for such an analysis. Switchable lipid mimic Not only the lipid head-group properties determine the membrane lateral pressure profile and thereby the open probability of the MscL channel. Also, the packing of the lipid tails influence the profile in the membrane. Combining the heretofore described method of GUV formation with a lipid mimic with a switchable tail provided a method to modulate the lateral pressure profile within a single patch. Chapter 4 shows that 4-Azo-5P in a matrix of DOPC, switches from a trans to a cis conformation upon illumination with light at 365nm. With 20mol% of 4-Azo-5P in the membrane, the alteration of the membrane properties were large enough to increase the open probability of the MscL channel 4-fold. Not only could the channel be activated in this way, but when light with a wavelength > 400nm was used, the process was reversed and the open probability decreased. The azobenzene-substituted amphiphiles might be used in future studies to further analyze the sensing moiety of MscL. Chapter 4 deals with a switch in the centre of the lipid tail. However, one could consider using similar mimics with the switchable azo-moiety closer to the lipid headgroup or closer to the center of the membrane bilayer (37). This could provide information on the depth in the membrane where MscL senses membrane tension. However, using the currently available azobenzene-substituted amphiphiles may not be optimal for this type of experiment as the trans conformation has a tendency to form H-aggregates during bilayer formation (37). One solution to this problem may be the synthesis of genuine phospholipids with the azobenzene moieties at different positions in the lipid tail. Unfortunately, it was not possible to open MscL by switching the azobenzene-substituted amphiphiles from trans to cis alone. This problem was overcome by applying a small additional negative pressure in the patch pipette. A number of alternative approaches to make the light-dependent switching more effective were considered. One was increasing the mol% of azobenzene-substituted amphiphiles in the membrane, but previous studies had shown that this would result in leaky membranes upon switching (37). Alternatively, a lipid mimic with a single tail was considered as this would introduce asymmetric membrane bending in the membrane (38-40), that is, when it is added to one side of the membrane (and assuming slow transmembrane flip-flop). This bending together with the switch might result in a strong enough perturbation of the membrane tension to result in MscL activity without additional negative pressure. Although the amphipath has been synthesized (41), the patch clamp experiments still have to be carried out. Not only asymmetric bending, but also thinning of the membrane is
Summary
107
known to increase the open probability of MscL, so a 4-Azo-5P in combination with lipids of shorter tail lengths is another possibility to consider. Finally, one could mix 4-Azo-5P, 4-Azo-6P and 4-Azo-9P, with their switching moieties at different positions in the lipid tail, to elicit MscL activity without additional negative pressure. A combination of these azobenzene-substituted amphipaths may also minimize the tendency of the molecules to form H-aggregates.
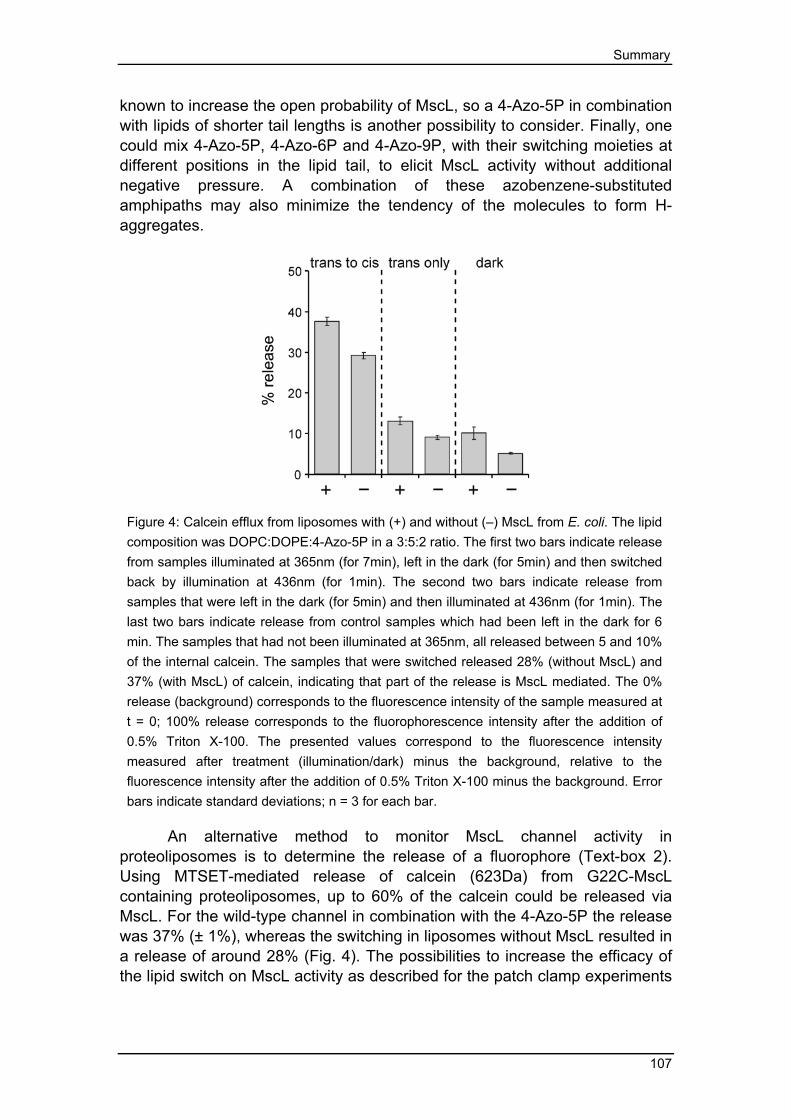
Figure 4: Calcein efflux from liposomes with (+) and without (–) MscL from E. coli. The lipid composition was DOPC:DOPE:4-Azo-5P in a 3:5:2 ratio. The first two bars indicate release from samples illuminated at 365nm (for 7min), left in the dark (for 5min) and then switched back by illumination at 436nm (for 1min). The second two bars indicate release from samples that were left in the dark (for 5min) and then illuminated at 436nm (for 1min). The last two bars indicate release from control samples which had been left in the dark for 6 min. The samples that had not been illuminated at 365nm, all released between 5 and 10% of the internal calcein. The samples that were switched released 28% (without MscL) and 37% (with MscL) of calcein, indicating that part of the release is MscL mediated. The 0% release (background) corresponds to the fluorescence intensity of the sample measured at t = 0; 100% release corresponds to the fluorophorescence intensity after the addition of 0.5% Triton X-100. The presented values correspond to the fluorescence intensity measured after treatment (illumination/dark) minus the background, relative to the fluorescence intensity after the addition of 0.5% Triton X-100 minus the background. Error bars indicate standard deviations; n = 3 for each bar.
An alternative method to monitor MscL channel activity in proteoliposomes is to determine the release of a fluorophore (Text-box 2). Using MTSET-mediated release of calcein (623Da) from G22C-MscL containing proteoliposomes, up to 60% of the calcein could be released via MscL. For the wild-type channel in combination with the 4-Azo-5P the release was 37% (± 1%), whereas the switching in liposomes without MscL resulted in a release of around 28% (Fig. 4). The possibilities to increase the efficacy of the lipid switch on MscL activity as described for the patch clamp experiments
Chapter 6
108
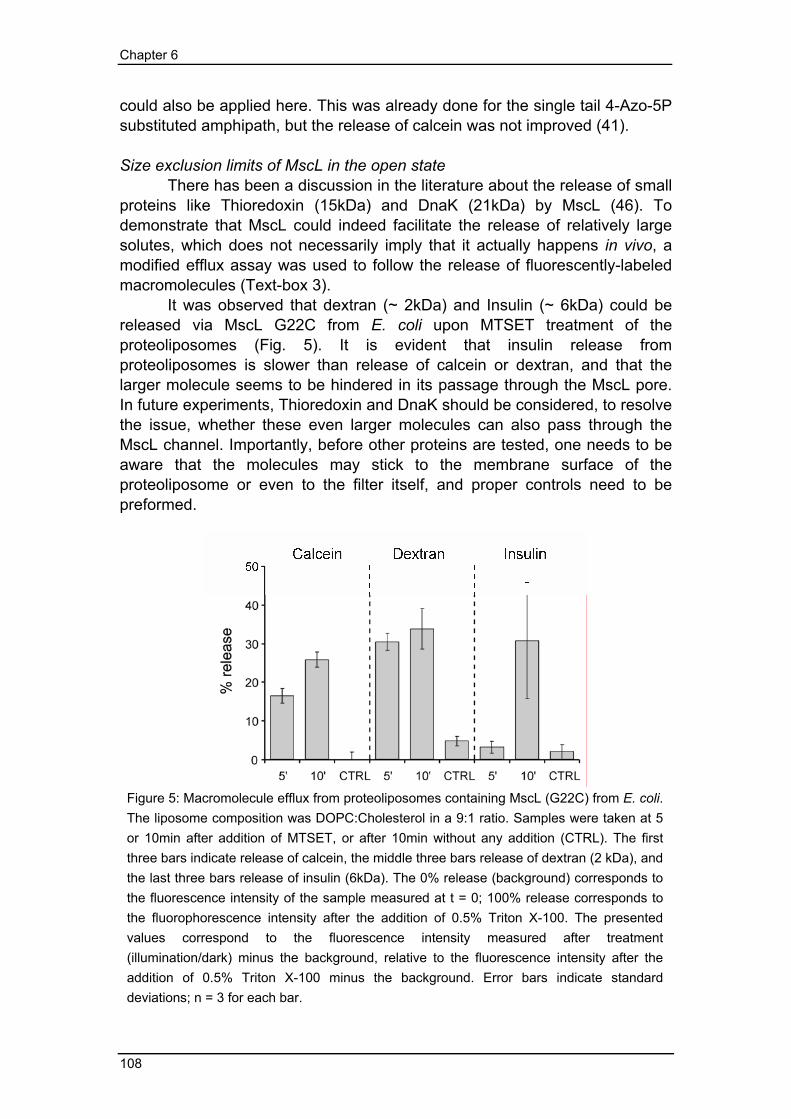
could also be applied here. This was already done for the single tail 4-Azo-5P substituted amphipath, but the release of calcein was not improved (41). Size exclusion limits of MscL in the open state There has been a discussion in the literature about the release of small proteins like Thioredoxin (15kDa) and DnaK (21kDa) by MscL (46). To demonstrate that MscL could indeed facilitate the release of relatively large solutes, which does not necessarily imply that it actually happens in vivo, a modified efflux assay was used to follow the release of fluorescently-labeled macromolecules (Text-box 3). It was observed that dextran (~ 2kDa) and Insulin (~ 6kDa) could be released via MscL G22C from E. coli upon MTSET treatment of the proteoliposomes (Fig. 5). It is evident that insulin release from proteoliposomes is slower than release of calcein or dextran, and that the larger molecule seems to be hindered in its passage through the MscL pore. In future experiments, Thioredoxin and DnaK should be considered, to resolve the issue, whether these even larger molecules can also pass through the MscL channel. Importantly, before other proteins are tested, one needs to be aware that the molecules may stick to the membrane surface of the proteoliposome or even to the filter itself, and proper controls need to be preformed.
Figure 5: Macromolecule efflux from proteoliposomes containing MscL (G22C) from E. coli. The liposome composition was DOPC:Cholesterol in a 9:1 ratio. Samples were taken at 5 or 10min after addition of MTSET, or after 10min without any addition (CTRL). The first three bars indicate release of calcein, the middle three bars release of dextran (2 kDa), and the last three bars release of insulin (6kDa). The 0% release (background) corresponds to the fluorescence intensity of the sample measured at t = 0; 100% release corresponds to the fluorophorescence intensity after the addition of 0.5% Triton X-100. The presented values correspond to the fluorescence intensity measured after treatment (illumination/dark) minus the background, relative to the fluorescence intensity after the addition of 0.5% Triton X-100 minus the background. Error bars indicate standard deviations; n = 3 for each bar.

Summary
109
Text-box 2: Release of calcein from MscL proteoliposomes (calcein efflux assay)
This method was developed in close collaboration with Robert Friesen from BioMaDe Technology Foundation. For experimental details see (42). In brief: proteoliposomes containing MscL were prepared as described (43). Calcein (final concentration of 25mM) was included by rapid-freezing (liquid nitrogen) and slow-thawing of the proteoliposomes. The external free calcein was removed by size exclusion column chromatography, using Sephadex G75 resin and isoosmotic wash buffer (10mM potasium phosphate, pH 8, 150mM NaCl, 1mM EDTA). For detection of fluorophore release, a 10-15µl proteoliposome fraction was placed in 2-4ml of wash buffer. Activity was measured as the increase in fluorescence upon calcein dequenching after release through the channel. Fluorescence was monitored at 520nm (slit-width 5nm; excitation at 490nm slit-width 2nm) using a SLM 500 spectrofluorometer. Release was expressed as percentage of the value obtained after lysing the proteoliposomes by the addition of 0.5% Triton X-100 (final concentration) and background subtraction.
Triggering release of calcein through MscL activation was performed in two ways:
1) It has been demonstrated that MscL can be activated by introduction of a charge at the pore constriction site. This has been achieved through modification by MTSET of a cysteine introduced at position 22 (44, 45). Using the G22C mutant of MscL from E. coli, the release of calcein from an MTSET-modified sample was up to 60% higher than the release from a non-treated sample.
2) Alternatively, MscL in proteoliposomes containing 20mol% of 4-Azo-5P can be activated by light (chapter 4). In this case activation occurs through illumination at 365nm for 7 min in the presence of 1mM tetracaine. Tetracaine was added to overcome the problem that 20mol% of 4-Azo-5P alone was not sufficient to activate MscL. Tetracaine causes asymmetric bending of the membrane which decreases the energy barrier required for MscL opening (39). The concentration of tetracaine was chosen such that opening of MscL in the dark was minimal. After illumination, the samples were left in the dark for 5min to allow maximal release of calcein through the channel. To create an end-point to the release, the activation was reversed by illumination for 60s using light at 436nm. To compensate for the effect of the second illumination, control samples were left in the dark for 6min before measuring; to compensate for the effect of the 60s illumination at 436nm, samples were left in the dark for 5min and then illuminated at 436nm for 1min. An additional control involved the use of liposomes, not containing MscL, prepared via the same reconstitution procedure as the proteoliposomes. These liposomes were subjected to the same illumination schemes.

Chapter 6
110
Text-box 3: Release of macromolecules Release of macromolecules from MscL containing proteoliposomes was monitored with carboxy-fluorescein-labeled proteins or dextrans that were included in the proteoliposome lumen. As the concentration of these probes was not high enough for self quenching, the liberated probes had to be separated from the proteoliposomes. This was done by filtration of the proteoliposomes over 200nm nitrocellulose filters. The release was determined as a percentage of the total amount of fluorophore labeled macromolecule inside the proteoliposomes; the 100% value was obtained by lysing the proteoliposomes with 0.5% Triton X-100 (final concentration) and background subtraction.
Pentamer The final chapter of this thesis deals with a structural aspect of MscL. It has been shown that MscL from Mycobacterium tuberculosis has a pentameric arrangement of its subunits (16). In this thesis, we show that in vivo MscL from E. coli also assumes a pentameric quaternary structure. For future studies, it is important to purify and functionally reconstitute the pentameric tandem construct. Two relatively simple adaptations to the purification method described in chapter 5 should be considered to prevent protein aggregation and/or degradation. Firstly, the fused gene construct could be transferred to L. lactis, where the machinery for protein synthesis might be better capable of coping with the stress associated with membrane protein amplification. Secondly, one could consider preparing longer linkers between the sub-units, thereby diminishing potential folding problems that may arise from the two-amino acid linkers that were used (also see discussion of chapter 5). Introduction of a protein cleavage site in these linkers would enable cleavage of the subunits after reconstitution, which might release potential strain in the subunit interactions as a result of the short linkers. The channel would still be formed from the same originally linked subunits, assuming that subunits are not exchanged between channels once they are assembled in the membrane. Using the covalently linked pentameric construct (or the complex after specific proteolytic cleavage), mutations could be introduced into individual subunits so that only one (rather than five) substitution is present per channel. This could, for instance, be used to determine the number of charges (MTSET molecules) required to open the MscL (G22C) from E. coli, which would provide an estimate of the strength of electronic repulsion needed for channel gating. Alternatively, a donor-acceptor pair (e.g., a single Trp combined with single Cys labeled with a coumarin-derived fluorophore (e.g. Alexa 350) as a fluorescence acceptor (47)) could be used to obtain distance information of the channel in the open and closed conformations by using fluorescence resonance energy transfer (FRET). Also, fluorophores could be linked to the
Summary
111
constriction site of the channel and passage of acceptor / quencher molecules could be monitored. Conclusions In the past decade a lot of information has been gathered on the structure, function and mechanism of MscL. Even so many questions remain about the actual gating mechanism of the channel. Application of MscL in drug delivery systems also requires further insight into the channel functioning. Other challenges can be found in the functioning of MscS and MscK, the regulation of channel expression, and the importance of protein lipid interactions. Ultimately, many of these questions rely on the availability of high-resolution structures of the channels in the closed, partially open, and fully open conformation.

Chapter 6
112
Reference List 1. Poolman, B., Blount, P., Folgering, J.H.A., Friesen, R.H., Moe, P.C.
and van der Heide,T.H. (2002) Mol. Microbiol. 44, 889-902 2. Csonka, L.N. and Hanson, A.D. (1991) Annu. Rev. Microbiol. 45, 569-
606 3. Morbach, S. and Kramer, R. (2002) Chembiochem. 3, 384-97 4. Wood, J.M., Bremer, E., Csonka, L.N., Kraemer, R., Poolman, B., van
der, H.T. and Smith, L.T. (2001) Comp. Biochem. Physiol. A Mol. Integr. Physiol. 130, 437-60.
5. van der Heide,T. and Poolman,B. (2000) J. Bacteriol. 182, 203-6 6. van der Heide,T., Stuart,M.C., and Poolman,B. (2001) EMBO J. 20,
7022-32 7. Poolman, B., Spitzer, J.J. and Wood, J. (2004) Biochim. Biophys. Acta
1666, 88-104 8. Biemans-Oldehinkel, E. and Poolman, B (2005) to be published 9. Cantor, R.S. (1999) Biophys. J. 76, 2625-39 10. Picolini, M. (1998) Brain Res. Bull. 46, 381-407 11. Auerbach, A. and Sachs, F. (1984) Ann. Rev. Biophys. Bioeng. 13,
269-302 12. www.nanion.de 13. www.axon.com 14. Neher, E. and Sakmann, B. (1976) Nature 260, 799-802 15. Chang, G., Spencer, R.H., Lee, A.T., Barclay, M.T. and Rees, D.C.
(1998) Science 282, 2220-6 16. Bass, R.B., Strop, P., Barclay, M. and Rees, D.C. (2002) Science 298,
1582-7 17. Blount, P., Schroeder, M.J. and Kung, C. (1997) J. Biol. Chem. 1997
272, 32150-7 18. Blount, P., Sukharev, S.I., Schroeder, M.J., Nagle, S.K. and Kung, C.
(1996) Proc. Natl. Acad. Sci. USA 93, 11652-7 19. Maurer, J.A. and Dougherty, D.A. (2003) J. Biol. Chem. 278, 21076-82 20. Yoshimura, K., Batiza, A., Schroeder, M., Blount, P. and Kung, C.
(1999) Biophys. J. 77, 1960-72 21. Park, K.H., Berrier, C., Martinac, B. and Ghazi, A. (2004) Biophys. J.
86, 2129-36 22. www.biomade.nl/channel.htm 23. Radt, B., Smith, T.A. and Caruso, F. (2004) Adv. Mater. 16, 2184-9 24. Iscla, I., Levin, G., Wray, R., Reynolds, R. and Blount, P. (2004)
Biophys. J. 87, 3172-80 25. Shapovalov, G., Bass, R., Rees, D.C. and Lester, H.A. (2003) Biophys.
J. 84, 2357-65 26. Akitake, B., Anishkin, A. and Sukharev, S. (2005) J. Gen. Physiol. 125,
143-54 27. Angelova, M.I., Soléau, S., Méléard, Ph., Faucon, J.F. and Bothorel, P.
(1992) Progr. Colloid Polym. Sci. 89, 127-31
Summary
113
28. Akashi, K., Miyata, H., Itoh, H., and Kinosita, K.Jr. (1996) Biophys. J. 71, 3242-50
29. Akashi, K., Miyata, H., Itoh, H. and Kinosita, K.Jr. (1998) Biophys. J. 74, 2973-82
30. Korlach, J., Schwille, P., Webb, W.W. and Feigenson, G.W. (1999) Proc. Natl. Acad. Sci. USA 96, 8461-6
31. Crowe, J., Crowe, L.M., Carpenter, J.F., Rudolph, A.S., Wistrom, C.A., Spargo, B.J. and Anchordoguy, T.J (1988) Biochim. Biophys. Acta 947, 367-84
32. Ricker, J.V., Tsvetkova, N.M., Wolkers, W.F., Leidy, C., Tablin, F., Longo, M. and Crowe, J.H. (2003) Biohys. J. 84, 3045-51 (JHC personal communication)
33. Doeven, M.K., Folgering, J.H., Krasnikov, V., Geertsma, E.R., van den Bogaart, G. and Poolman, B. (2005) Biophys. J. 88, 1134-42
34. Hemmler, R., Böse, G.,Wagner, R. and Peters, R. (2005) Biophys. J. 88, 4000-7
35. Moe, P.C. and Blount, P. (2002) Biophysical Chemistry: Membranes and Proteins (Ed: Templer, R.H. and Leatherbarrow, R.) 199-207
36. Yoshimura K, Nomura T, Sokabe M. (2004) Biophys. J. 86, 2113-20 37. Kuiper, J.M. and Engberts, J.B.F.N. (2004) Langmuir 20, 1152-60 38. Perozo, E., Kloda, A., Cortes, D.M. and Martinac, B. (2002) Nat. Struct.
Biol. 9, 696-703 39. Elmore, D.E. and Dougherty, D.A. (2003) Biophys. J. 85, 1512-24 40. Martinac, B., Adler, J. and Kung, C. (1990) Nature 348, 261-3 41. Kuiper, J.M. and Engberts, J.B.F.N. (2005) Chapter 5: Single tailed
azobenzene-substituted phosphates Ph.D. Thesis 107-126 42. Koçer, A., Walko, M., Meijberg, W. and Feringa, B.L. (2005) Science in
press 43. Folgering, J.H.A., Moe, P.C., Schuurman-Wolters, G.K., Blount, P. and
Poolman, B. (2005) J. Biol. Chem. 280, 8784-92 44. Batiza,A.F., Kuo,M.M., Yoshimura,K., and Kung,C. (2002) Proc. Natl.
Acad. Sci. USA 99, 5643-8 45. Yoshimura,K., Batiza,A., and Kung,C. (2001) Biophys. J. 80, 2198-206 46. Vazquez-Laslop, N., Lee, H., Hu, R. and Neyfakh, A.A. (2001)
J.Bacteriol. 183, 2399-404 47. probes.invitrogen.com/handbook/sections/0203.html

Chapter 6
114