Embed Size (px)
Citation preview
University of Groningen
Hollow fiber membrane contactor as a gas-liquid model contactorDindore, V. Y.; Brilman, D. W. F.; Versteeg, G. F.
Published in:Chemical Engineering Science
DOI:10.1016/j.ces.2004.07.129
IMPORTANT NOTE: You are advised to consult the publisher's version (publisher's PDF) if you wish to cite fromit. Please check the document version below.
Document VersionPublisher's PDF, also known as Version of record
Publication date:2005
Link to publication in University of Groningen/UMCG research database
Citation for published version (APA):Dindore, V. Y., Brilman, D. W. F., & Versteeg, G. F. (2005). Hollow fiber membrane contactor as a gas-liquid model contactor. Chemical Engineering Science, 60(2), 467-479.https://doi.org/10.1016/j.ces.2004.07.129
CopyrightOther than for strictly personal use, it is not permitted to download or to forward/distribute the text or part of it without the consent of theauthor(s) and/or copyright holder(s), unless the work is under an open content license (like Creative Commons).
Take-down policyIf you believe that this document breaches copyright please contact us providing details, and we will remove access to the work immediatelyand investigate your claim.
Downloaded from the University of Groningen/UMCG research database (Pure): http://www.rug.nl/research/portal. For technical reasons thenumber of authors shown on this cover page is limited to 10 maximum.
Download date: 18-04-2020
Chemical Engineering Science 60 (2005) 467–479
www.elsevier.com/locate/ces
Hollow fiber membrane contactor as a gas–liquid model contactor
V.Y. Dindorea, D.W.F. Brilmanb, G.F. Versteega,∗aDesign and Development of Industrial Processes, Faculty of Chemical Technology, University of Twente, P.O. Box 217, 7500 AE, Enschede, The
NetherlandsbSasol Technology Netherlands B.V., Hallenweg 5, 7522 NB Enschede, The Netherlands
Received 30 January 2004; received in revised form 8 July 2004; accepted 27 July 2004Available online 6 October 2004
Abstract
Microporous hollow fiber gas–liquid membrane contactors have a fixed and well-defined gas–liquid interfacial area. The liquid flowthrough the hollow fiber is laminar, thus the liquid side hydrodynamics are well known. This allows the accurate calculation of thefiber side physical mass transfer coefficient from first principles. Moreover, in the case of gas–liquid membrane contactor, the gas–liquidexposure time can be varied easily and independently without disturbing the gas–liquid interfacial area. These features of the hollow fibermembrane contactor make it very suitable as a gas–liquid model contactor and offer numerous advantages over the conventional modelcontactors. The applicability and the limitations of this novel model contactor for the determination of physico-chemical properties ofnon-reactive and reactive gas–liquid systems are investigated in the present work. Absorption of CO2 into water and into aqueous NaOHsolutions are chosen as model systems to determine the physico-chemical properties for non-reactive and reactive conditions, respectively.The experimental findings for these systems show that a hollow fiber membrane contactor can be used successfully as a model contactorfor the determination of various gas–liquid physico-chemical properties. Moreover, since the membrane contactor facilitates indirectcontact between the two phases, the application of hollow fiber model contactor can possibly be extended to liquid–liquid systems and/orheterogeneous catalyzed gas–liquid systems.� 2004 Elsevier Ltd. All rights reserved.
Keywords:Absorption; Mass transfer; Membranes; Membrane contactor; Model contactor; Multiphase reactors
1. Introduction
A separation or production process using absorption in-volves transfer of one or more species from the gaseousphase to the liquid phase. In general, the absorption pro-cess can be categorized as a physical absorption or achemical absorption. In the case of physical absorptionthe gaseous solute is physically dissolved in the liq-uid phase, whereas in the case of chemical absorptionthe gaseous solute reacts chemically in the liquid phase.To design an absorption system using either physical orchemical absorption, detailed information is required onthe diffusivities and the solubilities of the gaseous so-lutes in the liquid bulk as well as on the reaction rate
∗ Corresponding author. Tel.: +31-53-489-3327; fax: +31-53-489-4774.E-mail address:[email protected](G.F. Versteeg).
0009-2509/$ - see front matter� 2004 Elsevier Ltd. All rights reserved.doi:10.1016/j.ces.2004.07.129
kinetics. Various laboratory scale gas–liquid model contac-tors are used for acquiring this information and for discern-ing the controlling mechanism in the process of mass trans-fer accompanied by chemical reactions. In these model con-tactors the interfacial area is generally known so that themass transfer coefficient can be calculated from the rate ofabsorption. The laboratory scale model contactors may beclassified into two categories:
(1) Absorbers for which the fluid dynamics of the liquidphase are well understood.
(2) Absorbers which reproduce, on a laboratory scale, thecharacteristics of industrial absorbers.
The first category includes model contactors like the lam-inar jet apparatus, the wetted wall column and the rotatingdrum contactor. In these types of contactors the physicalmass transfer coefficient can be estimated theoretically.
468 V.Y. Dindore et al. / Chemical Engineering Science 60 (2005) 467–479
Table 1Comparative evaluation of model contactors
Property Hollow fiber Laminar jet Wetted wall Stirred cell
G–L exposure 0.01–10 0.001–0.1 0.1–2 0.06–10time (s)
kL (m s−1) 1.0 × 10⁻⁴–1.0 × 10⁻⁵ 1.6 × 10⁻³–1.6 × 10⁻⁴ 1.6 × 10⁻⁴–3.6 × 10⁻⁵ 1.6 × 10⁻⁵–2.1 × 10⁻⁴
Interface Orientation free Vertical Vertical Horizontalorientation
Typical liquid use ≈ 1000 ≈ 5000 ≈ 5000 ≈ 500×10−6 m3/expt.
Limitations Wetting of Laborious Laborious Unknownmembrane hydrodynamics
Liquid–Liquid Possible Not possible Not possible Possiblesystem
Operation mode Continuous Continuous Continuous Batchw.r.t. liquid phase
The second category includes the disc tower, the multiple-sphere absorber and the stirred cell contactor. In these typesof contactors, the physical mass transfer coefficient has to bedetermined using non-reactive systems. In general, the firstcategory model contactors are used to determine the reactionkinetics and physical properties of gas–liquid system andsecond category contactors are usually used to simulate theindustrial contactors. The details on these types of contactorsare given in the literature (Danckwerts, 1970).A comparativeevaluation of these types of contactors in terms of achiev-able contact time and mass transfer coefficients is givenin Table 1.
Membrane gas–liquid contactors have a fixed and knownmass transfer area, i.e. the physical area of the membrane(Kreulen et al., 1993). This feature of membrane contac-tors allows easy adaptation of membrane contactors intogas–liquid model contactors to determine the reaction kinet-ics and physical properties of the gas–liquid system as wellas to simulate the industrial absorbers. For example, a flatsheet microporous membrane can be used in the stirred cellto fix the gas liquid interface. This allows use of higher stir-ring speeds in the liquid phase without disturbing the inter-facial area, thus widening the operating range of the stirredcell contactor. Microporous hollow fiber membrane modulescan also be conveniently converted into a model contactor.The operation of such a hollow fiber model contactor closelyresembles to that of the laminar jet apparatus. The optimizedhollow fiber membrane model contactor offers several ad-vantages over the conventional model contactors. Since theliquid flow through the hollow fiber is usually laminar, theliquid side hydrodynamics are well known. This allows theaccurate calculation of the physical mass transfer coefficientfrom first principles. In the case of conventional model con-tactors in which liquid phase is in continuous mode, e.g.laminar jet and wetted wall column, the entrance and the exit
effects affect the determination of the flow patterns and theexact mass transfer area. This limitation is easily eliminatedin the hollow fiber membrane model contactor by provid-ing sufficient entrance length for laminar velocity profile todevelop before exposing the liquid to the gaseous solute. Inthe case of the stirred cell apparatus, convection current setnear the gas–liquid interface due to temperature variationor concentration variation (initiated if the saturated solutionis denser the pure solvent) results into an unstable system.These convection currents can have significant influence onthe measurement of the diffusivities and solubilities. Theseconvection currents can be eliminated using narrow hollowfiber membranes.Versteeg and van Swaaij (1988)has suc-cessfully applied the method of absorption of a gas into aliquid contained in a narrow tube to determine the gas diffu-sivities. Thus the hollow fiber membrane contactor is largelyfree of hydrodynamic constraints.
In the present study, the general applicability of a hollowfiber membrane contactor as model contactor is explored.Initially, physical absorption of carbon dioxide into waterwas carried out to study the performance of the system atshorter contact times and to optimize the system. Absorp-tion of carbon dioxide into aqueous sodium hydroxide waschosen as a model system to test the applicability for themeasurement of chemical and physical parameters for reac-tive systems.
2. Theory
The rate of absorption of a solute ‘A’ into an absorbingliquid based on first principle is given by the Fick’s law:
JA = −DA(
�CA�x
)G.L interface
. (1)
V.Y. Dindore et al. / Chemical Engineering Science 60 (2005) 467–479 469
However, this procedure is not applicable in most of thecases due to the laborious work required to determine theexact concentration gradient near the gas–liquid interface.Hence, a more simple approach of mass transfer coefficientis used:
JA = kL(CA,i − CA,L). (2)
The mass transfer coefficient can be estimated accuratelyif the exact hydrodynamics near the interface is known. Inthe case of a liquid flowing through the hollow fiber, theliquid flow is in the laminar region (forRe <2100) regionhence the hydrodynamic conditions near the interface arewell known and the liquid side mass transfer coefficient canbe calculated from the analogy of Leveque’s solution forheat transfer (Leveque, 1928).
For Gz<10, Sh= kLd
DA= 3.67. (3)
For Gz>20, Sh= 1.62
(VLd
2
DAL
)1/3
= 1.62(Gz)1/3. (4)
Kreulen et al. (1993)presented a fitted correlation that isvalid over the intermediate range of Graetz numbers(Gz)
(Graetz, 1883).
Sh= 3√
3.673 + 1.623Gz. (5)
In Eq. (2),CA,L is the mixing cup (analogous to averagebulk) concentration of ‘A’ averaged over the length of thehollow fiber. For laminar flow of liquid through a hollowfiber, with a fully developed velocity profile, the mixing cupconcentration of ‘A’ in the liquid, at any axial distancezfrom the liquid inlet side of the fiber, is given as follows(Kreulen et al., 1993):
Cm,z = CA,i
[1 − exp
(−4kLz
VLd
)]. (6)
The average centerline bulk concentration of ‘A’ (CA,L)in the fiber can be obtained from the integration ofCm,zover the length of the fiber:
CA,L = CA,i
L
{L+ VLd
4kL
[exp
(−4kLL
VLd
)− 1
]}. (7)
The absorption flux over the length of the fiber can becalculated using Eqs. (2) and (7) if the physical propertiesof the system are known. Conversely, it is also possible todetermine the physical properties of the non-reactive systemsfrom experimental measurements of the absorption flux.
In the case of chemical absorption, the absorption flux isenhanced due to chemical reaction and the average absorp-tion flux is given by
JA = EkL(CA,i − CA,L). (8)
The enhancement factor ‘E ’ describes the effect ofchemical reaction on the mass transfer rate. Generally the
enhancement factor(E) is defined as the ratio of absorptionflux in presence of chemical reaction to the absorption fluxin absence of chemical reaction for identical mass transferdriving force. Several approximate solutions to predict theenhancement factor(E), based on the different mass trans-fer models, are available in the literature and are applicableover a wide range of process conditions with reactions ofdiffering complexity and chemical solute loading. However,all the models assume the presence of a well-mixed liquidbulk adjacent to the mass transfer zone (relatively large com-pared to the diffusion zone). This may not be the case forthe gas absorption into the liquid flowing through a hollowfiber, especially for smaller diameters. In such cases, de-pending upon the gas–liquid contact time, the mass transferzone in the liquid phase of the hollow fiber may actuallyextend up to the axis of the fiber and the centerline concen-tration may be disturbed. An additional feature in the gasabsorption into a liquid flowing in a hollow fiber is the pres-ence of a velocity profile in the liquid side mass transferzone.Kumar (2002)used a modified approximate solutionto predict the enhancement factor for gas absorption withsecond-order chemical reaction in a liquid flowing througha hollow fiber. The application of the modified approximatesolution was limited to relatively high values of Graetz num-ber. However, rigorous numerical solutions are required todetermine the enhancement factor at low Graetz numbersand for complex reactions. The measurement of the absorp-tion flux in different absorption regimes and comparing itwith the approximate-analytical or numerical solutions al-lows the determination of the chemical and physical prop-erties for the reactive systems.
3. Numerical model
For the reactive absorption of a gas in a liquid flowingthrough a microporous hollow fiber, the differential massbalance for any species ‘i’ present in the liquid phase isgiven by
vz�Ci�z
=Di
[1
r
��r
(r
�Ci�r
)]− Si. (9)
In arriving at Eq. (9), the diffusion in axial direction wasneglected and axis-symmetry of the hollow fiber was as-sumed. ‘S’ is the source term due to the chemical reaction.Since the liquid flow inside the fiber is laminar, the velocityprofile in the radial direction is given by
vz = 2VL
(1 −
( rR
)2). (10)
The system of partial differential Eq. (9) requires initialand boundary conditions in the axial and radial directionsrespectively
at z= 0; for all r; Ci = Ci,0. (11)
470 V.Y. Dindore et al. / Chemical Engineering Science 60 (2005) 467–479
At the centre of the fiber the concentration profile is sym-metric which results in the boundary condition Eq. (12):
at r = 0; for z>0;(
�Ci�r
)= 0. (12)
For a non-volatile liquid phase component flowingthrough the fiber, the boundary condition at the gas–liquidinterface is given by Eq. (13):
at r = R; for z>0;(
�Ci�r
)i �=A
= 0. (13)
At the gas–liquid interface, i.e. the membrane or fiber wallmass transfer of the gas phase solute ‘A’ to the liquid phaseoccurs, which is described by Eq. (14):
−DA(
�CA�r
)= kext(CA,G,bulk − CA,G,i). (14)
The external mass transfer coefficient(kext) is a lumpedparameter comprising of the resistances to mass transportof species ‘A’ due to the gas phase and the microporousmembrane;
1
kext= 1
kG+ 1
kM. (15)
The set of partial differential equations (the number de-pends on the number of chemical species involved in thereaction scheme) was solved numerically using a techniquedescribed byVersteeg et al. (1989). The concentration pro-file of the absorbed gas ‘A’ in the liquid phase was obtainedfrom the solution of the mass balance equations. The lo-cal absorption flux of ‘A’ along the length of the fiber wassubsequently calculated using Fick’s law. The average ab-sorption flux ‘〈JA〉’ was obtained from the integration of thelocal fluxes along the length of the fiber:
〈JA〉 = 1
L
∫ L
0JA(z)dz. (16)
The exact numerical enhancement factor is defined as theratio of the absorption rate/flux of a gas in the liquid in thepresence of a chemical reaction to the absorption rate/fluxin the absence of a reaction:
Enum = 〈JA,Chem〉num
〈JA,Phys〉num. (17)
It should be noted that the definition for the enhancementfactor in Eq. (8) traditionally applies to a situation where thedriving force (of solute ‘A’) for mass transfer is identicalin the presence as well as in the absence of a chemicalreaction. However, the above conditions may not be satisfiedfor long gas–liquid contact times in a membrane contactor(or at low Graetz numbers). In these situations, there willbe a significant concentration ofA in the liquid ‘bulk’ forthe case of physical absorption. Nevertheless, this definitionwill be used to calculate the overall enhancement factor fora membrane contactor.
4. Characterization of hollow fiber model contactor
As discussed in the previous sections, because ofwell-defined flow pattern and known mass transfer area, thehollow fiber membrane contactor can be used to determinevarious physico-chemical properties. In this section, theapplicability of this new model contactor for the differentabsorption regimes is analysed. The possibility of using sim-plified equations under the limiting cases is also explored.
4.1. Physical absorption
In general, diffusion coefficients of gases in inert liquidsare obtained by means of the Taylor capillary method or thediaphragm cell method. However, these methods are timeconsuming and require considerable quantities of the liquidand the gas. A more rapid and reliable determination of thediffusivity of the gas into the solution is possible using thehollow fiber model contactor.
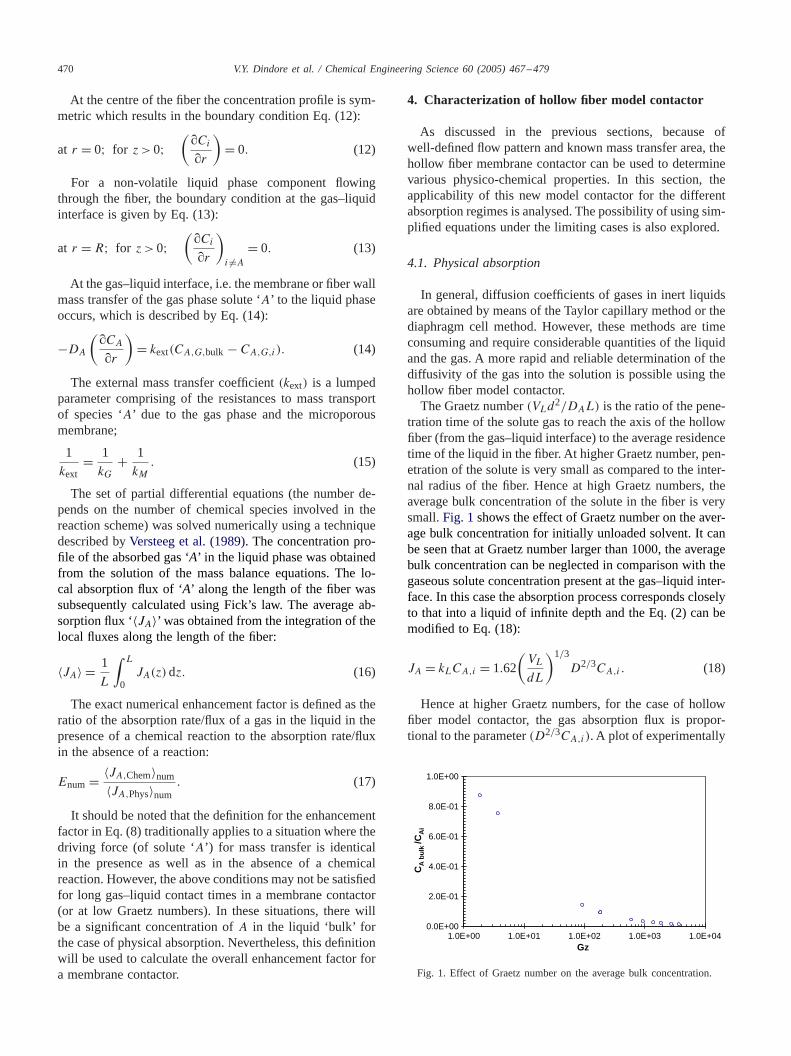
The Graetz number(VLd2/DAL) is the ratio of the pene-tration time of the solute gas to reach the axis of the hollowfiber (from the gas–liquid interface) to the average residencetime of the liquid in the fiber. At higher Graetz number, pen-etration of the solute is very small as compared to the inter-nal radius of the fiber. Hence at high Graetz numbers, theaverage bulk concentration of the solute in the fiber is verysmall.Fig. 1shows the effect of Graetz number on the aver-age bulk concentration for initially unloaded solvent. It canbe seen that at Graetz number larger than 1000, the averagebulk concentration can be neglected in comparison with thegaseous solute concentration present at the gas–liquid inter-face. In this case the absorption process corresponds closelyto that into a liquid of infinite depth and the Eq. (2) can bemodified to Eq. (18):
JA = kLCA,i = 1.62
(VL
dL
)1/3
D2/3CA,i . (18)
Hence at higher Graetz numbers, for the case of hollowfiber model contactor, the gas absorption flux is propor-tional to the parameter(D2/3CA,i). A plot of experimentally
0.0E+00
2.0E-01
4.0E-01
6.0E-01
8.0E-01
1.0E+00
1.0E+00 1.0E+01 1.0E+02 1.0E+03 1.0E+04Gz
CA
bu
lk /C
Ai
Fig. 1. Effect of Graetz number on the average bulk concentration.
V.Y. Dindore et al. / Chemical Engineering Science 60 (2005) 467–479 471
0.0E+00
5.0E-04
1.0E-03
1.5E-03
2.0E-03
2.5E-03
3.0E-03
0 10 20 30 40 50 60
1.62(VL/Ld)1/3
J (m
ol m
-2s-1
)
1.0E-05
1.0E-04
Ind
ivid
ual
slo
pe
d=0.6 mmd=1 mmd=0.6 mmd=1 mm
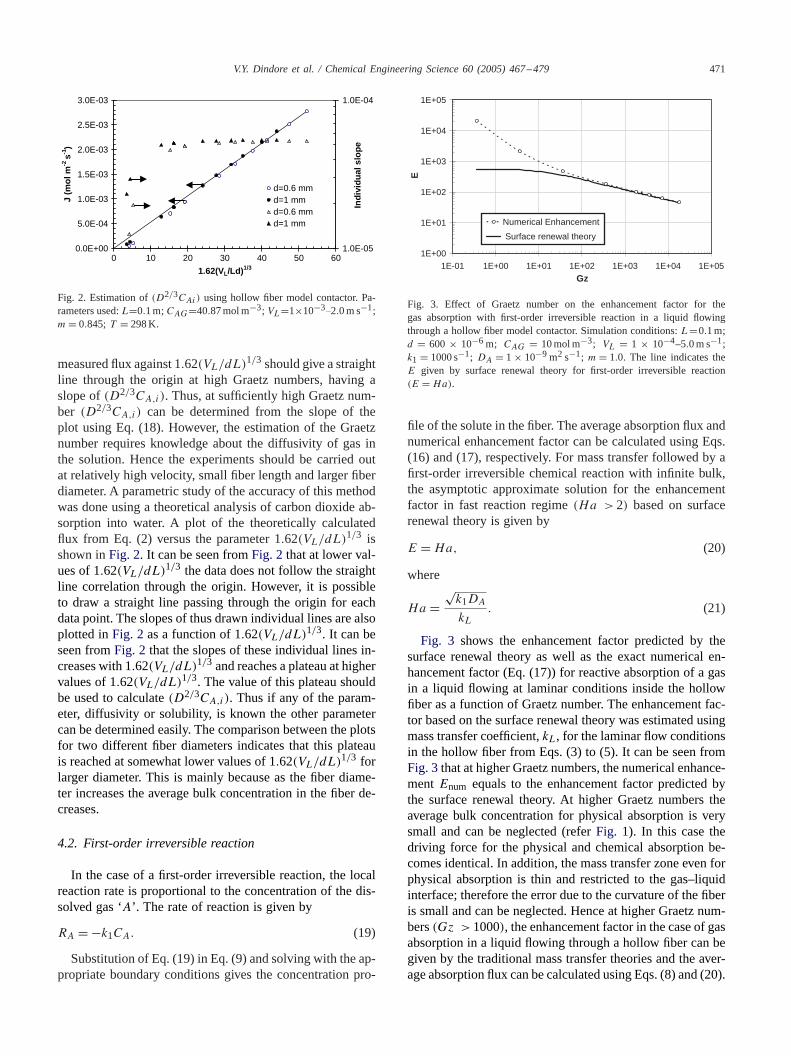
Fig. 2. Estimation of(D2/3CAi) using hollow fiber model contactor. Pa-rameters used:L=0.1 m;CAG=40.87 mol m−3; VL=1×10−3.2.0 m s−1;m= 0.845; T = 298 K.
measured flux against 1.62(VL/dL)1/3 should give a straightline through the origin at high Graetz numbers, having aslope of(D2/3CA,i). Thus, at sufficiently high Graetz num-ber (D2/3CA,i) can be determined from the slope of theplot using Eq. (18). However, the estimation of the Graetznumber requires knowledge about the diffusivity of gas inthe solution. Hence the experiments should be carried outat relatively high velocity, small fiber length and larger fiberdiameter. A parametric study of the accuracy of this methodwas done using a theoretical analysis of carbon dioxide ab-sorption into water. A plot of the theoretically calculatedflux from Eq. (2) versus the parameter 1.62(VL/dL)1/3 isshown inFig. 2. It can be seen fromFig. 2 that at lower val-ues of 1.62(VL/dL)1/3 the data does not follow the straightline correlation through the origin. However, it is possibleto draw a straight line passing through the origin for eachdata point. The slopes of thus drawn individual lines are alsoplotted inFig. 2 as a function of 1.62(VL/dL)1/3. It can beseen fromFig. 2 that the slopes of these individual lines in-creases with 1.62(VL/dL)1/3 and reaches a plateau at highervalues of 1.62(VL/dL)1/3. The value of this plateau shouldbe used to calculate(D2/3CA,i). Thus if any of the param-eter, diffusivity or solubility, is known the other parametercan be determined easily. The comparison between the plotsfor two different fiber diameters indicates that this plateauis reached at somewhat lower values of 1.62(VL/dL)1/3 forlarger diameter. This is mainly because as the fiber diame-ter increases the average bulk concentration in the fiber de-creases.
4.2. First-order irreversible reaction
In the case of a first-order irreversible reaction, the localreaction rate is proportional to the concentration of the dis-solved gas ‘A’. The rate of reaction is given by
RA = −k1CA. (19)
Substitution of Eq. (19) in Eq. (9) and solving with the ap-propriate boundary conditions gives the concentration pro-
1E+00
1E+01
1E+02
1E+03
1E+04
1E+05
1E-01 1E+00 1E+01 1E+02 1E+03 1E+04 1E+05
Gz
E
Numerical Enhancement
Surface renewal theory
Fig. 3. Effect of Graetz number on the enhancement factor for thegas absorption with first-order irreversible reaction in a liquid flowingthrough a hollow fiber model contactor. Simulation conditions:L=0.1 m;d = 600 × 10−6 m; CAG = 10 mol m−3; VL = 1 × 10⁻⁴–5.0 m s−1;k1 = 1000 s−1; DA = 1 × 10⁻⁹ m2 s−1; m= 1.0. The line indicates theE given by surface renewal theory for first-order irreversible reaction(E =Ha).
file of the solute in the fiber. The average absorption flux andnumerical enhancement factor can be calculated using Eqs.(16) and (17), respectively. For mass transfer followed by afirst-order irreversible chemical reaction with infinite bulk,the asymptotic approximate solution for the enhancementfactor in fast reaction regime(Ha >2) based on surfacerenewal theory is given by
E =Ha, (20)
where
Ha =√k1DA
kL. (21)
Fig. 3 shows the enhancement factor predicted by thesurface renewal theory as well as the exact numerical en-hancement factor (Eq. (17)) for reactive absorption of a gasin a liquid flowing at laminar conditions inside the hollowfiber as a function of Graetz number. The enhancement fac-tor based on the surface renewal theory was estimated usingmass transfer coefficient,kL, for the laminar flow conditionsin the hollow fiber from Eqs. (3) to (5). It can be seen fromFig. 3that at higher Graetz numbers, the numerical enhance-mentEnum equals to the enhancement factor predicted bythe surface renewal theory. At higher Graetz numbers theaverage bulk concentration for physical absorption is verysmall and can be neglected (referFig. 1). In this case thedriving force for the physical and chemical absorption be-comes identical. In addition, the mass transfer zone even forphysical absorption is thin and restricted to the gas–liquidinterface; therefore the error due to the curvature of the fiberis small and can be neglected. Hence at higher Graetz num-bers(Gz >1000), the enhancement factor in the case of gasabsorption in a liquid flowing through a hollow fiber can begiven by the traditional mass transfer theories and the aver-age absorption flux can be calculated using Eqs. (8) and (20).
472 V.Y. Dindore et al. / Chemical Engineering Science 60 (2005) 467–479
1.E+00
1.E+01
1.E+02
1.E+03
1.E+04
1.E+05
1.0E-02 1.0E-01 1.0E+00 1.0E+01 1.0E+02 1.0E+03Ha
E E = Ha
Surface renewal theor
k1=0.01
k1=0.1
k1=1
k1=10
k1=100
k1=1000
k1=10000
y
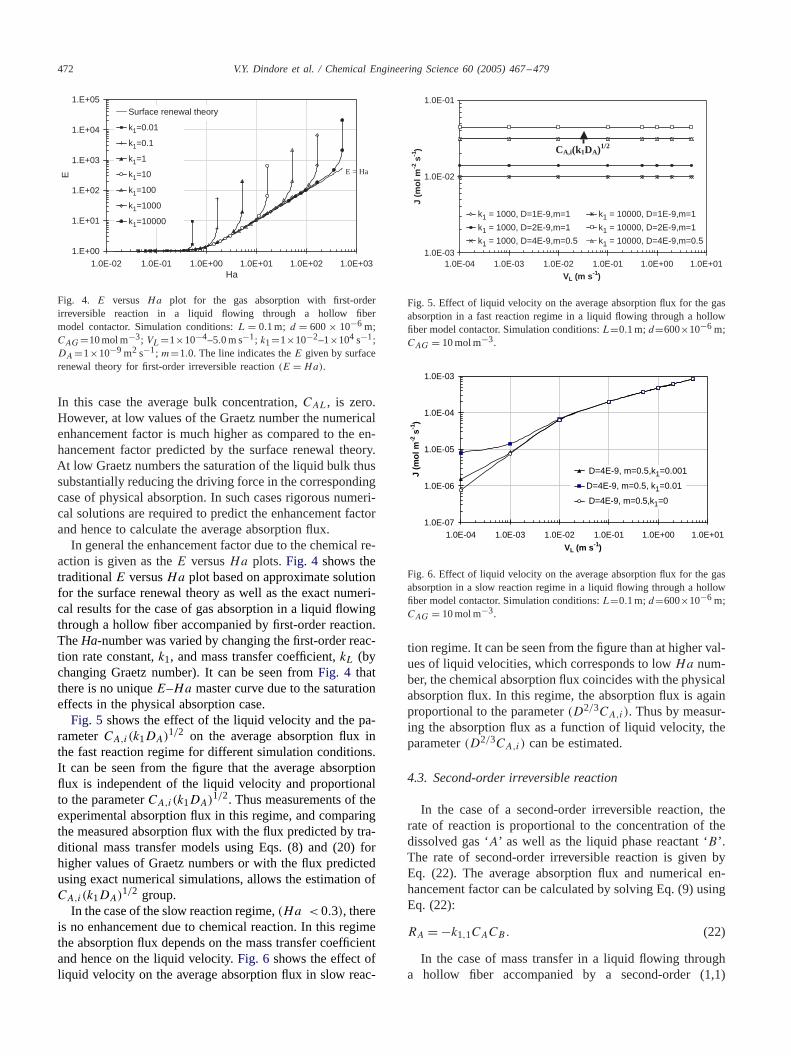
Fig. 4. E versus Ha plot for the gas absorption with first-orderirreversible reaction in a liquid flowing through a hollow fibermodel contactor. Simulation conditions:L = 0.1 m; d = 600× 10−6 m;CAG=10 mol m−3; VL=1×10⁻⁴–5.0 m s−1; k1=1×10⁻²–1×10⁴ s−1;DA=1×10⁻⁹ m2 s−1; m=1.0. The line indicates theE given by surfacerenewal theory for first-order irreversible reaction(E =Ha).
In this case the average bulk concentration,CAL, is zero.However, at low values of the Graetz number the numericalenhancement factor is much higher as compared to the en-hancement factor predicted by the surface renewal theory.At low Graetz numbers the saturation of the liquid bulk thussubstantially reducing the driving force in the correspondingcase of physical absorption. In such cases rigorous numeri-cal solutions are required to predict the enhancement factorand hence to calculate the average absorption flux.
In general the enhancement factor due to the chemical re-action is given as theE versusHa plots.Fig. 4 shows thetraditionalE versusHa plot based on approximate solutionfor the surface renewal theory as well as the exact numeri-cal results for the case of gas absorption in a liquid flowingthrough a hollow fiber accompanied by first-order reaction.TheHa-number was varied by changing the first-order reac-tion rate constant,k1, and mass transfer coefficient,kL (bychanging Graetz number). It can be seen fromFig. 4 thatthere is no uniqueE–Ha master curve due to the saturationeffects in the physical absorption case.
Fig. 5 shows the effect of the liquid velocity and the pa-rameterCA,i(k1DA)
1/2 on the average absorption flux inthe fast reaction regime for different simulation conditions.It can be seen from the figure that the average absorptionflux is independent of the liquid velocity and proportionalto the parameterCA,i(k1DA)
1/2. Thus measurements of theexperimental absorption flux in this regime, and comparingthe measured absorption flux with the flux predicted by tra-ditional mass transfer models using Eqs. (8) and (20) forhigher values of Graetz numbers or with the flux predictedusing exact numerical simulations, allows the estimation ofCA,i(k1DA)
1/2 group.In the case of the slow reaction regime,(Ha <0.3), there
is no enhancement due to chemical reaction. In this regimethe absorption flux depends on the mass transfer coefficientand hence on the liquid velocity.Fig. 6 shows the effect ofliquid velocity on the average absorption flux in slow reac-
1.0E-03
1.0E-02
1.0E-01
1.0E-04 1.0E-03 1.0E-02 1.0E-01 1.0E+00 1.0E+01
VL (m s-1)
J (m
ol m
-2 s
-1)
k1 = 1000, D=1E-9,m=1 k1 = 10000, D=1E-9,m=1
k1 = 1000, D=2E-9,m=1 k1 = 10000, D=2E-9,m=1
k1 = 1000, D=4E-9,m=0.5 k1 = 10000, D=4E-9,m=0.5
CA,i(k1DA)1/2
Fig. 5. Effect of liquid velocity on the average absorption flux for the gasabsorption in a fast reaction regime in a liquid flowing through a hollowfiber model contactor. Simulation conditions:L=0.1 m;d=600×10−6 m;CAG = 10 mol m−3.
1.0E-07
1.0E-06
1.0E-05
1.0E-04
1.0E-03
1.0E-04 1.0E-03 1.0E-02 1.0E-01 1.0E+00 1.0E+01
VL (m s-1)
J (m
ol m
-2 s
-1)
D=4E-9, m=0.5,k1=0.001
D=4E-9, m=0.5, k1=0.01
D=4E-9, m=0.5,k1=0
Fig. 6. Effect of liquid velocity on the average absorption flux for the gasabsorption in a slow reaction regime in a liquid flowing through a hollowfiber model contactor. Simulation conditions:L=0.1 m;d=600×10−6 m;CAG = 10 mol m−3.
tion regime. It can be seen from the figure than at higher val-ues of liquid velocities, which corresponds to lowHa num-ber, the chemical absorption flux coincides with the physicalabsorption flux. In this regime, the absorption flux is againproportional to the parameter(D2/3CA,i). Thus by measur-ing the absorption flux as a function of liquid velocity, theparameter(D2/3CA,i) can be estimated.
4.3. Second-order irreversible reaction
In the case of a second-order irreversible reaction, therate of reaction is proportional to the concentration of thedissolved gas ‘A’ as well as the liquid phase reactant ‘B ’.The rate of second-order irreversible reaction is given byEq. (22). The average absorption flux and numerical en-hancement factor can be calculated by solving Eq. (9) usingEq. (22):
RA = −k1,1CACB. (22)
In the case of mass transfer in a liquid flowing througha hollow fiber accompanied by a second-order (1,1)
V.Y. Dindore et al. / Chemical Engineering Science 60 (2005) 467–479 473
irreversible reaction, the saturation of species ‘A’ as well asthe depletion of species ‘B’ in the liquid bulk is important.Under the limiting conditions of high Graetz numbers, thepenetration depth of reacting species and hence the reactionzone is confined near the gas–liquid interface. Consequently,liquid far from the interface (at the axis of the fiber) isessentially undisturbed so that the depletion of species ‘B’as well as the saturation of the liquid with the solute can beneglected. This situation is analogous to the situation wherea liquid bulk is assumed to be present at infinite distance, asin traditional mass transfer models. At high Graetz numbersthe concentration of liquid phase reactantB at the axis offiber is the same as the concentration ofB at the inlet of thefiber. This situation is also referred as the pseudo-first-orderreaction regime. For this case,Kumar (2002)modified thedefinitions of the dimensionless Hatta number and asymp-totic enhancement factor based on the conditions at inlet ofthe fiber(z=0) and showed that, using these definitions it ispossible to predict effect of chemical reaction on absorptionflux using the approximate asymptotic solutions.
Thus when the Graetz number is relatively high and con-ditions for the fast reaction regime are satisfied(2<Ha �E∞), the enhancement factor in the case of hollow fibermodel contactor is equal to the modified Hatta numberand the average absorption flux can be calculated usingEq. (8) with zero average bulk concentration and the en-hancement factor given by Eq. (23). Similar to the irre-versible first-order reaction system, in this case also theaverage absorption flux is independent ofkL (and henceindependent of the liquid velocity) and proportional tothe parameterCA,i(k1,1DACB0)
1/2. Thus from the mea-surement of experimental absorption flux, the parameterCA,i(k1,1DA)
1/2 can be estimated. However, when the de-pletion of the liquid phase reactant ‘B ’ is small but notnegligible, the rigorous numerical model is required to fitthe data:
Modified Hatta number: Ha =√k1,1DACB,0
kL. (23)
At low Graetz numbers the penetration depth and hencethe reaction zone may extend up to the axis of the fiber.Therefore the absorption regime can continuously changefrom the liquid entrance to the liquid exit. At the liquid inlet,there is no depletion of the speciesB at the gas–liquid inter-face and the absorption rate is influenced by the chemical re-action rate (kinetics), while the liquid velocity has no effecton the local absorption rate (Fast regime). Further, along thelength of the fiber, depletion of the species ‘B’ occurs at theinterface. In the case of complete depletion of species ‘B’ atthe interface, the absorption rate is limited by the radial dif-fusion of the reacting species to the reaction plane and theflux is strongly influenced by the mass transfer coefficient(Instantaneous regime). At sufficiently low Graetz numbersand whenCB0DB/CA,iDA � Ha, the absorption regimeover the entire fiber can be assumed as instantaneous reac-tion regime. In this case, the enhancement factor is given
by modified asymptotic infinite enhancement factor and theaverage absorption flux can be calculated using Eq. (8) withzero average bulk concentration and the enhancement factorgiven by Eq. (24).
Modified infinite enhancement factor:E∞ =
(1 + CB,0DB
�BCA,iDA
) (DA
DB
)n. (24)
The value of ‘n’ depends on the type of mass transfermodel chosen. In the present case where a boundary layerflow is present in the mass transfer zone, hence the value of‘n’ is equal to 1/3. In the instantaneous regime the averageabsorption flux is determined byCAi, CB0,DA,DB, �B andkL. It may, therefore, be possible to infer the values of oneof these quantities from the measure absorption flux if thevalues of other quantities are known or can be estimated.
For the general case the approximate enhancement fac-tor, based on DeCoursey’s solution (using the definition ofmodified Hatta number and modified infinite enhancementfactor), is given by
Eapp= −Ha2
2(E∞ − 1)
+√[
Ha4
4(E∞ − 1)2+ E∞Ha2
(E∞ − 1)+ 1
]. (25)
In the extreme case of very low Graetz number, the species‘B ’ is completely consumed by the reaction over a certainportion of the fiber and then species ‘A’ starts physically ab-sorbing into the liquid phase containing the reaction producttill it is saturated with the species ‘A’. In such cases, theenhancement due to the chemical reaction is entirely deter-mined by the stoichiometric coefficients and the concentra-tions of species ‘A’ and ‘B ’.
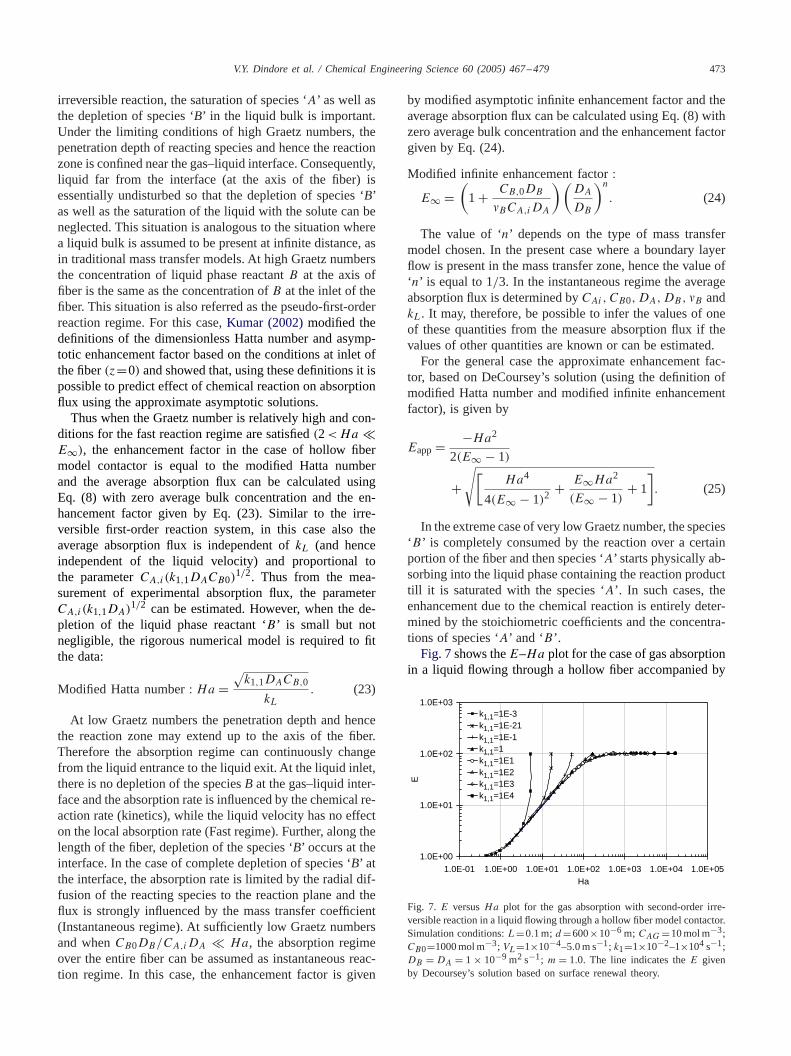
Fig. 7shows theE–Ha plot for the case of gas absorptionin a liquid flowing through a hollow fiber accompanied by
1.0E+00
1.0E+01
1.0E+02
1.0E+03
1.0E-01 1.0E+00 1.0E+01 1.0E+02 1.0E+03 1.0E+04 1.0E+05Ha
E
k1,1=1E-3k1,1=1E-21k1,1=1E-1k1,1=1k1,1=1E1k1,1=1E2k1,1=1E3k1,1=1E4
Fig. 7. E versusHa plot for the gas absorption with second-order irre-versible reaction in a liquid flowing through a hollow fiber model contactor.Simulation conditions:L=0.1 m; d=600×10−6 m; CAG=10 mol m−3;CB0=1000 mol m−3; VL=1×10⁻⁴–5.0 m s−1; k1=1×10⁻²–1×10⁴ s−1;DB =DA = 1 × 10⁻⁹ m2 s−1; m = 1.0. The line indicates theE givenby Decoursey’s solution based on surface renewal theory.
474 V.Y. Dindore et al. / Chemical Engineering Science 60 (2005) 467–479
a second-order reaction (with�B = 1). By comparingFigs. 7 and 4, it can be seen that the limit (here: 100) isreached in case of second-order reaction for allk1,1 values,whereas in case of the first-order reaction no such limit ispresent.
5. Experimental
Experiments were carried out to explore the applicabil-ity of the hollow fiber membrane device as a model con-tactor for the measurements of physical and chemical pa-rameters. The absorption of carbon dioxide into water waschosen as a model system to measure the physical param-eters for a non-reactive system and the absorption of car-bon dioxide into aqueous NaOH solutions was chosen as amodel system for the measurement of physical and chem-ical parameter for a reactive system. To measure the com-bined mass transfer coefficient of the membrane and thegas phase, used in the model development, separate ex-periments of NH3 absorption into 2 M sulfuric acid werecarried out.
5.1. Selection of process conditions for physical absorption
As discussed in Section 4.1, the simplified method canbe used to measure physical parameters with hollow fibermodel contactor at relatively high values of Graetz numbers.Hence experiments were carried out at very high Graetznumber(Gz>1000) so that the mass transfer zone was con-fined to the gas–liquid interface and Eq. (18) can be usedto predict the average absorption flux. The Graetz number(VLd
2/DL) can be increased by increasing the fiber diam-eter and/or the liquid velocity through the fiber and by de-creasing the fiber length. The higher values of the fiber di-ameter and the velocity were limited by the critical Reynoldsnumber (2100) for laminar flow. The lower values of thefiber length were limited by the least count of the measure-ment technique used in the experiments. In view of theselimitations, the velocity through the fiber was increased tillthe Reynolds number remains well below the critical limit.To increase the accuracy of the measurements, instead of asingle hollow fiber, a module of five identical short hollowfibers was used. To minimize the gas side mass transfer lim-itations pure carbon dioxide was used at the shell side ofthe module. As the hollow fiber model contactor has severaladvantages over the laminar jet contactor with similar oper-ation, it was tried to achieve the exposure time similar to thatare possible with the laminar jet contactor for the possiblecomparison.
5.2. Selection of process conditions for absorption in fastreaction regime
The absorption of CO2 in NaOH is followed by a second-order (1,1) irreversible reaction of CO2 with OH− ions.
At relatively high pH(>10) values the reaction is given by
CO2 + 2OH− → CO2−3 + H2O. (26)
As discussed in Section 4.2, kinetic parameters can bemeasured when the reaction occurs in the fast reactionregime over the entire length of the fiber with negligibledepletion of OH− ions. Hence to minimize the depletionof OH− ions and to carry the reaction in fast absorptionregime the following conditions were chosen so that thenecessary condition for fast reaction regime 2<Ha<E∞is satisfied:
1. A low CO2 partial pressure was used so as to obtainlower value ofCA,i .
2. Short exposure time. For this, short fibers with high ve-locity of the liquid through the fiber were used.
3. Relatively high concentration of OH− ions was used asan additional effectCA,i also decreases.
The conditions chosen for the measurement of the kineticsare given inTable 2.
5.3. Selection of process conditions for absorption ininstantaneous reaction regime
To measure the diffusivity ratio of OH− ions and carbondioxide in aqueous NaOH solutions, experiments were car-ried out in the instantaneous reaction regime. To satisfy thenecessary condition(Ha >E8) for the instantaneous reac-tion regime, experiments were carried out using high partialpressures of CO2 and long exposure times. Long exposuretimes were achieved using the low liquid velocities and thelong fibers. The experimental conditions chosen for the in-stantaneous absorption regime are given inTable 2.
5.4. Experimental procedure
Figs. 8a and8b show schematically the membrane con-tactor used for the absorption experiments. Microporouspolypropylene hollow fibers (Accurel PP: Type Q3/2; aver-age pore diameter: 0.2�m; inside fiber diameter 600�m)were used in this study. A module made up of five hollowfibers was used as a model contactor. The five hollow fiberswere glued to a liquid distributor with the help of siliconglue. The length of each fiber exposed to the gas was con-trolled by applying glue on the surface of the membrane. Inthis way, it was ensured that all five fibers had equal lengths.The glued part of the fiber provides sufficient distance forthe laminar liquid flow profile inside the fiber to be fullydeveloped before it contacts the gas. In all the experimentsthe Reynolds number was maintained well below the criticalvalue for turbulent flow (2100), generallyRe<1000.
Fig. 8c shows schematically the experimental setup usedfor the absorption experiments. A semi-batch mode ofgas–liquid contacting operation was used during the exper-iments. The liquid flow through the fiber was continuous.
V.Y. Dindore et al. / Chemical Engineering Science 60 (2005) 467–479 475
Table 2Experimental conditions
Absorption Fiber Velocity(m s−1) Graetz CNaOH (mol m−3) CCO2,G (mol m−3) Temperature (K)regime length (m) number
Physical 0.015 0.1–1 1260–12,200 — 48 298Fast 0.015–0.017 0.8–1 4000–10,100 250–1500 7–8 298–307Instantaneous 0.017 0.08 800–900 250–1000 52 302
Fig. 8. Hollow fiber membrane model contactor experimental set-up.
The solvent was fed from a high-pressure pump via a flowcontroller. The solvent used in the experiments was de-gassed before the usage by applying vacuum in a separateapparatus. Before passing to the hollow fiber module, thesolvent was passed through the heat exchanger to maintainthe desired temperature. The gas used in the experimentswas presaturated with water vapour to ensure that masstransfer was not impeded by the evaporation effects. Thecarbon dioxide partial pressure outside the hollow fiberin the contactor was maintained constant by feeding purecarbon dioxide from a gas supply vessel, through a pres-sure regulator. During all the experiments the liquid sidepressure was kept sufficiently higher than the shell side gaspressure to avoid the bubbling of gas. From the drop in thepressure of carbon dioxide in the gas supply vessel, theabsorption rate and hence the average carbon dioxide fluxacross the membrane was calculated.
6. Results and discussion
6.1. Measurement of the lumped gas and membrane masstransfer coefficient
The mass transfer coefficient of the membrane phaseand the gas phase are combined to give a lumped parame-ter termed as external mass transfer coefficientkext in thedevelopment of the numerical model. This lumped masstransfer resistance can contribute substantially to the over-all mass transfer process when inert are present in the gasphase and/or the enhancement due to the chemical reactionis considerably high. Hence detailed information on the ex-ternal mass transfer coefficient is important for the accuracyof the data fitting. The membrane mass transfer coefficientcan be estimated if the structural properties such as tortuos-ity (�) and porosity(�) of the membrane are known. These
476 V.Y. Dindore et al. / Chemical Engineering Science 60 (2005) 467–479
membrane morphological properties are generally deter-mined experimentally. It should be noted that liquids havinglow surface tension might fill the membrane pores resultinginto very low membrane mass transfer coefficient. Hence itis necessary to use more hydrophobic membrane to avoidthe wetting of membranes pores in such situations. Theestimation of the gas side mass transfer coefficient is ratherdifficult due to the complex geometry of the contactor andlack of the information on the correlation to predict the gasside mass transfer coefficient for such systems. Hence itwas decided to measure the lumped parameter experimen-tally. The absorption of NH3 into 2 M sulfuric acid satisfiesall criteria for the measurement of gas side mass transfercoefficient (Danckwerts, 1970), hence this system is usedto measure the lumped mass transfer coefficient.
In these experiments, first the shell side of the contactorwas filled with N2 to about 110 kPa. A small quantity of NH3(8–25 kPa) was added to the shell side. The partial pressureof NH3 was kept sufficiently small so that evaporation ofthe water due to the heat of reaction does not result intocondensation of water in the module. The average absorptionflux was calculated from the mass balance. The lumped masstransfer coefficient was calculated from the experimentalabsorption flux as given below:
kext = Jexpt
CG,NH3
. (27)
The thus determined value ofkext was 1.01×10⁻² m s−1.This estimated value is used for the simulations in the nextsections to fit the kinetic and physical parameters.
6.2. Physical absorption experiments
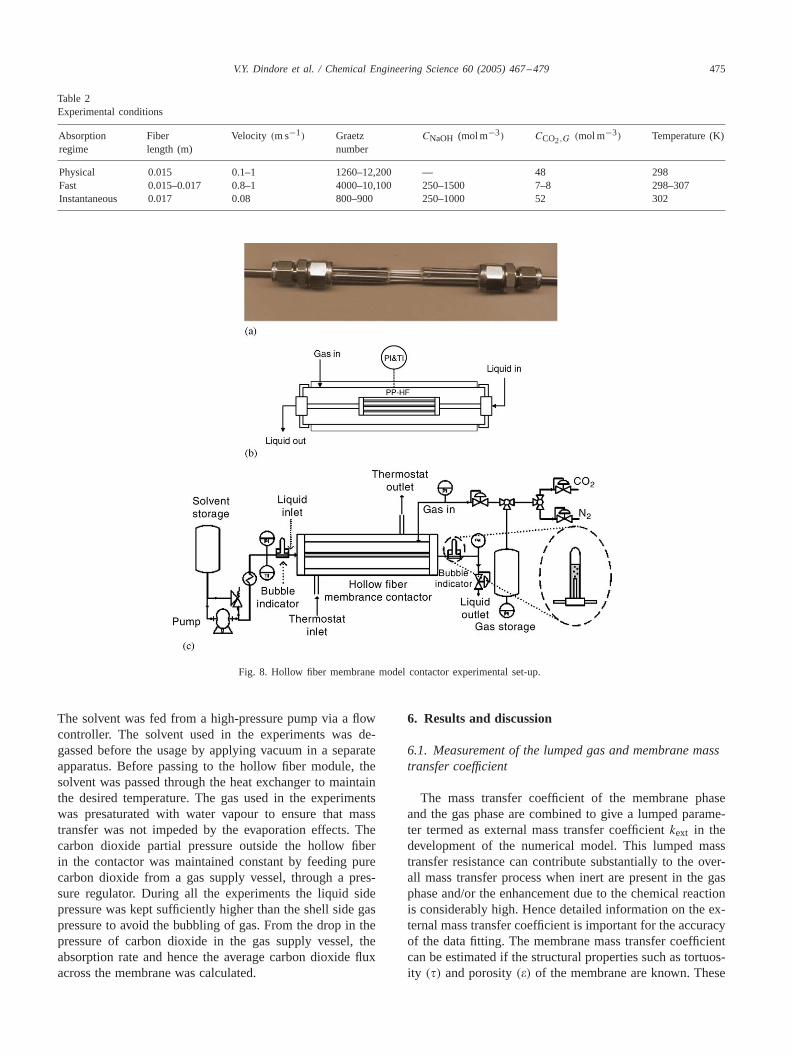
Initial experiments were carried out to optimize the systemfor high liquid velocity through the fiber and for the shortfiber lengths.Fig. 9 shows the plot ofkL versus exposuretime. From this figure it can be seen that exposure timesin the order of 0.01 s were successfully achieved. ThekLvalues obtained experimentally are in excellent agreementwith those predicted by Leveque’s equation with an averagedeviation of not more than 2%. This result also confirmsthat the flow within hollow fiber is in the laminar region forthese operating conditions.
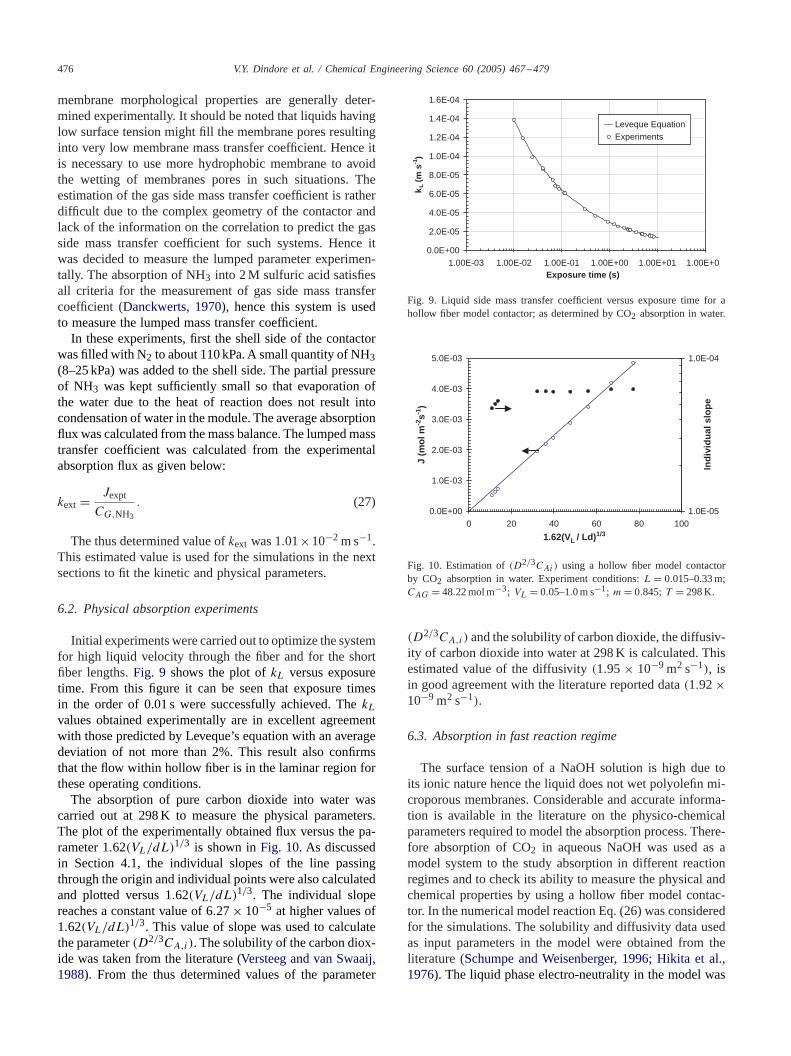
The absorption of pure carbon dioxide into water wascarried out at 298 K to measure the physical parameters.The plot of the experimentally obtained flux versus the pa-rameter 1.62(VL/dL)1/3 is shown inFig. 10. As discussedin Section 4.1, the individual slopes of the line passingthrough the origin and individual points were also calculatedand plotted versus 1.62(VL/dL)1/3. The individual slopereaches a constant value of 6.27× 10⁻⁵ at higher values of1.62(VL/dL)1/3. This value of slope was used to calculatethe parameter(D2/3CA,i). The solubility of the carbon diox-ide was taken from the literature (Versteeg and van Swaaij,1988). From the thus determined values of the parameter
0.0E+00
2.0E-05
4.0E-05
6.0E-05
8.0E-05
1.0E-04
1.2E-04
1.4E-04
1.6E-04
1.00E-03 1.00E-02 1.00E-01 1.00E+00 1.00E+01 1.00E+0 Exposure time (s)
kL
(ms-1
)
Leveque EquationExperiments
Fig. 9. Liquid side mass transfer coefficient versus exposure time for ahollow fiber model contactor; as determined by CO2 absorption in water.
0.0E+00
1.0E-03
2.0E-03
3.0E-03
4.0E-03
5.0E-03
0 20 40 60 80 100
1.62(VL / Ld)1/3
J (m
ol m
-2s-1
)
1.0E-05
1.0E-04
Ind
ivid
ual
slo
pe
Fig. 10. Estimation of(D2/3CAi) using a hollow fiber model contactorby CO2 absorption in water. Experiment conditions:L = 0.015–0.33 m;CAG = 48.22 mol m−3; VL = 0.05–1.0 m s−1; m= 0.845; T = 298 K.
(D2/3CA,i) and the solubility of carbon dioxide, the diffusiv-ity of carbon dioxide into water at 298 K is calculated. Thisestimated value of the diffusivity(1.95× 10⁻⁹ m2 s−1), isin good agreement with the literature reported data(1.92×10⁻⁹ m2 s−1).
6.3. Absorption in fast reaction regime
The surface tension of a NaOH solution is high due toits ionic nature hence the liquid does not wet polyolefin mi-croporous membranes. Considerable and accurate informa-tion is available in the literature on the physico-chemicalparameters required to model the absorption process. There-fore absorption of CO2 in aqueous NaOH was used as amodel system to the study absorption in different reactionregimes and to check its ability to measure the physical andchemical properties by using a hollow fiber model contac-tor. In the numerical model reaction Eq. (26) was consideredfor the simulations. The solubility and diffusivity data usedas input parameters in the model were obtained from theliterature (Schumpe and Weisenberger, 1996; Hikita et al.,1976). The liquid phase electro-neutrality in the model was

V.Y. Dindore et al. / Chemical Engineering Science 60 (2005) 467–479 477
0.0E+00
4.0E-03
8.0E-03
1.2E-02
1.6E-02
0.20 0.30 0.40 0.50 0.60 0.70 0.80 0.90 1.00
VL (m s-1)
J (m
ol m
-2s-1
)
Fig. 11. Effect of liquid velocity on the average absorption flux of CO2in 0.5 M NaOH in a hollow fiber model contactor at 303 K.
2.0
2.2
2.4
2.6
2.8
3.0
3.2
3.4
3.15 3.20 3.25 3.30 3.35 3.40
1000 T -1 (K-1)
ln (
k OH)
(m3 m
ol-1
s-1)
Fig. 12. Arrhenius plot for the second-order reaction rate constantkOH− .
maintained by using mean ion diffusion coefficients for theionic species in the liquid phase.
To ensure that the absorption takes place in the fast re-action regime the experimental conditions were chosen asdiscussed in the experimental section.Fig. 11shows the ef-fect of liquid velocity through the fiber on the average ab-sorption flux. The absorption in the fast reaction regime isconfirmed by the fact that flux was found to be independentof the liquid velocity through the fiber. Two different sets ofexperiments were carried out to study the effect of tempera-ture and to study the effect of ionic strength on the second-order reaction rate constant. To obtain the higher accuracyand to take into account the effect of the lumped externalmass transfer coefficient, the numerical model developed inSection 3 was used for the regression of the second-orderrate constant.
To estimate the second-order reaction constant of Eq. (26)at various temperature, absorption of CO2 into 0.5 M NaOHsolution was used.Fig. 12shows the Arrhenius plot for theestimated second-order reaction rate constant for the absorp-tion of CO2 into 0.5 M NaOH solution. From the Arrheniusplot activation energy ‘Eact’ of the reaction was calculated.The estimated value of the activation energy, 49.3 kJ mol−1,is in good agreement with data reported in the literature,
y = 0.2053x + 1.1335R2 = 0.9977
1.0
1.1
1.2
1.3
1.4
1.5
0 0.2 0.4 0.6 0.8 1 1.2 1.4 1.6
I (kmol ion m-3)
log
(kO
H)
(m3 m
ol-1
s-1
)
Fig. 13. Effect of ionic strength on the second-order reaction rate constantkOH− at 307 K.
5
10
15
20
25
30
5 10 15 20 25 30kOH literature (m3 mol -1 s-1)
kO
H f
itte
d (
m3 m
ol-1
s-1
)
Fig. 14. Parity plot for second-order reaction rate constantkOH− .
i.e. 44.8 kJ mol−1 for the ionic strength of 0.537 kmol m−3
(Pohorecki and Moniuk, 1988).To analyse the effect of ionic strength on the second-order
reaction constant of Eq. (26) CO2 absorption experimentswere carried out in NaOH solutions with varying concentra-tions. Fig. 13 shows the effect of ionic strength on the es-timated second-order reaction rate constant at 307 K. It canbe seen that in line with the data reported in the literature,the second-order reaction rate constant increases with theionic strength of the solution.Fig. 14shows the parity plotfor the estimated second-order reaction rate constant and theliterature data (Pohorecki and Moniuk, 1988). It can be seenfrom the figure that there is good agreement between the ex-perimentally estimated second-order reaction rate constantusing hollow fiber model contactor and the data reported inthe literature.
6.4. Absorption in instantaneous reaction regime
The absorption in the instantaneous regime is governedby the diffusion process of the gaseous solute and the liq-uid phase reactant. As discussed in Section 4.3, the absorp-tion flux in the instantaneous regime was calculated usingEqs. (8) with zero average bulk concentration and using the
478 V.Y. Dindore et al. / Chemical Engineering Science 60 (2005) 467–479
y = 1.3168x + 0.0019R2 = 0.9945
5.0E-03
1.0E-02
1.5E-02
2.0E-02
2.5E-02
3.0E-02
3.5E-02
4.0E-02
0.0E+00 5.0E-03 1.0E-02 1.5E-02 2.0E-02 2.5E-02 3.0E-02
kLC νB0 B-1 (mol m-2 s-1)
J (m
ol m
2 s-1
)
Fig. 15. Average absorption flux versuskLCB0/�B for absorption of CO2in NaOH in instantaneous regime.
enhancement factor given by Eq. (24). The flux equation canbe simplified as given below:
J = kL
(DA
DB
)1/3
CA,i + kLCB0
�B
(DB
DA
)2/3
. (28)
The plot of experimentally observed flux versus the pa-rameterkLCB0/�B can be used to estimate the diffusivityratio of the liquid phase reactant to the gaseous solute intothe liquid phase. To measure the diffusivity ratio, experi-ments were carried out in the instantaneous regime at 302 K.To ensure that the absorption take place in the instantaneousreaction regime(Ha � E∞) the experimental conditionswere chosen as discussed in the experimental section. TheparameterkLCB0/�B was varied by changing the concen-tration of aqueous NaOH solution (i.e.CB0).
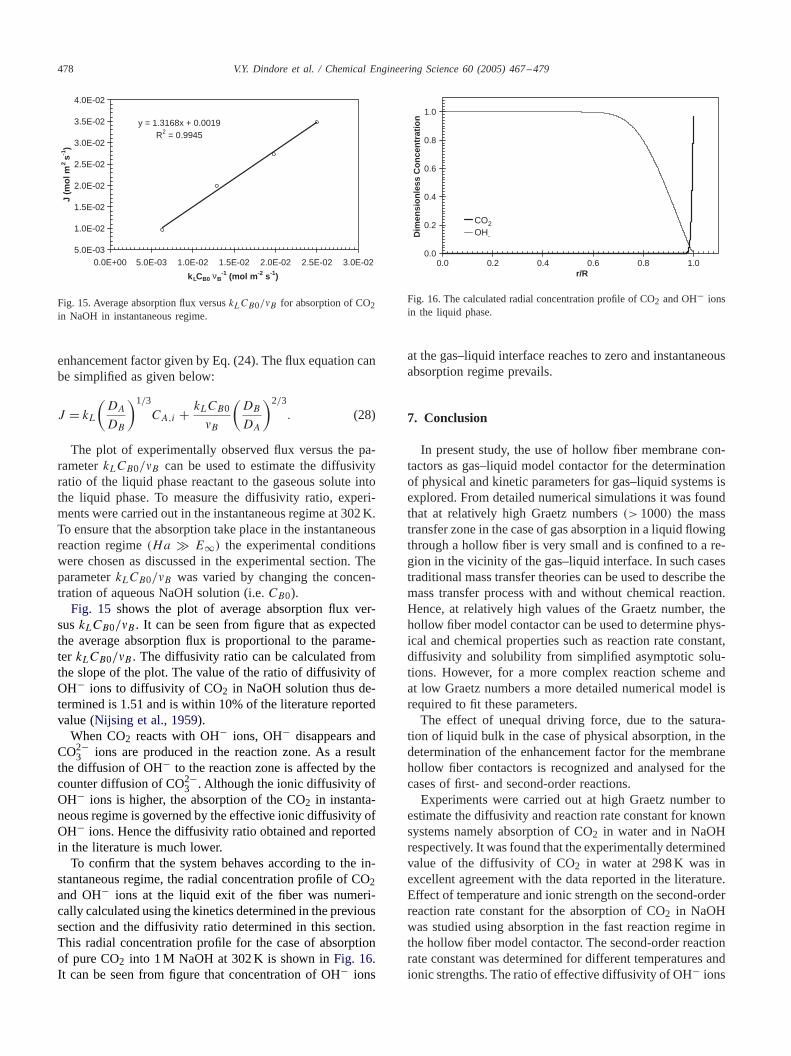
Fig. 15 shows the plot of average absorption flux ver-suskLCB0/�B . It can be seen from figure that as expectedthe average absorption flux is proportional to the parame-ter kLCB0/�B . The diffusivity ratio can be calculated fromthe slope of the plot. The value of the ratio of diffusivity ofOH− ions to diffusivity of CO2 in NaOH solution thus de-termined is 1.51 and is within 10% of the literature reportedvalue (Nijsing et al., 1959).
When CO2 reacts with OH− ions, OH− disappears andCO2−
3 ions are produced in the reaction zone. As a resultthe diffusion of OH− to the reaction zone is affected by thecounter diffusion of CO2−
3 . Although the ionic diffusivity ofOH− ions is higher, the absorption of the CO2 in instanta-neous regime is governed by the effective ionic diffusivity ofOH− ions. Hence the diffusivity ratio obtained and reportedin the literature is much lower.
To confirm that the system behaves according to the in-stantaneous regime, the radial concentration profile of CO2and OH− ions at the liquid exit of the fiber was numeri-cally calculated using the kinetics determined in the previoussection and the diffusivity ratio determined in this section.This radial concentration profile for the case of absorptionof pure CO2 into 1 M NaOH at 302 K is shown inFig. 16.It can be seen from figure that concentration of OH− ions
0.0
0.2
0.4
0.6
0.8
1.0
0.0 0.2 0.4 0.6 0.8 1.0r/R
Dim
ensi
on
less
Co
nce
ntr
atio
n
CO2OH-
Fig. 16. The calculated radial concentration profile of CO2 and OH− ionsin the liquid phase.
at the gas–liquid interface reaches to zero and instantaneousabsorption regime prevails.
7. Conclusion
In present study, the use of hollow fiber membrane con-tactors as gas–liquid model contactor for the determinationof physical and kinetic parameters for gas–liquid systems isexplored. From detailed numerical simulations it was foundthat at relatively high Graetz numbers(>1000) the masstransfer zone in the case of gas absorption in a liquid flowingthrough a hollow fiber is very small and is confined to a re-gion in the vicinity of the gas–liquid interface. In such casestraditional mass transfer theories can be used to describe themass transfer process with and without chemical reaction.Hence, at relatively high values of the Graetz number, thehollow fiber model contactor can be used to determine phys-ical and chemical properties such as reaction rate constant,diffusivity and solubility from simplified asymptotic solu-tions. However, for a more complex reaction scheme andat low Graetz numbers a more detailed numerical model isrequired to fit these parameters.
The effect of unequal driving force, due to the satura-tion of liquid bulk in the case of physical absorption, in thedetermination of the enhancement factor for the membranehollow fiber contactors is recognized and analysed for thecases of first- and second-order reactions.
Experiments were carried out at high Graetz number toestimate the diffusivity and reaction rate constant for knownsystems namely absorption of CO2 in water and in NaOHrespectively. It was found that the experimentally determinedvalue of the diffusivity of CO2 in water at 298 K was inexcellent agreement with the data reported in the literature.Effect of temperature and ionic strength on the second-orderreaction rate constant for the absorption of CO2 in NaOHwas studied using absorption in the fast reaction regime inthe hollow fiber model contactor. The second-order reactionrate constant was determined for different temperatures andionic strengths. The ratio of effective diffusivity of OH− ions
V.Y. Dindore et al. / Chemical Engineering Science 60 (2005) 467–479 479
and diffusivity of CO2 in liquid phase was determined usingabsorption in the instantaneous reaction regime in the hollowfiber model contactor. The estimated values of the second-order reaction rate constants and the effective diffusivityratio were in good agreement with the data reported in theliterature.
From the experimental validation it can be concludedthat a hollow fiber membrane contactor can successfully beused as a model contactor for the determination of variousgas–liquid physico-chemical properties. Moreover, since themembrane contactor facilitates indirect contact between thetwo phases, the application of hollow fiber model contac-tor can possibly be extended to liquid–liquid systems and/orheterogeneously catalyzed gas–liquid or liquid–liquid reac-tion systems.
Notation
C concentration, mol m−3
D diffusivity, m2 s−1
d diameter, mE enhancement factor, dimensionless
Gz Graetz number,vd2
Dz, dimensionless
Ha Hatta number, dimensionlessJ flux, mol m−2 s−1
k1 first-order forward reaction rate constant, s−1
k1,1 second-order forward reaction rate constant,mol−1 m3 s−1
k mass transfer coefficient, m s−1
L length, mm distribution coefficient, dimensionlessr radius, mRe Reynolds number,dv�� , dimensionless
Sh Sherwood number,kldD
, dimensionlessV velocity, m s−1
x distance, mz length, m
Greek letters
� porosity, dimensionless� tortuosity, dimensionless� stoichiometric coefficient, dimensionless
Subscripts
G gasi interface; component ‘i’
L liquidM membranez local value0 inletvalue∞ infinite value
Acknowledgements
This research is part of the research program performedwithin the Centre for Separation Technology (CST), whichis a co-operation between the Netherlands Organization forApplied Scientific Research (TNO) and the University ofTwente. We acknowledge Alexey Volkov for hishelp in ex-perimental work. We would also like to thank Benno Knakenand Wim Leppink for the construction of the experimentalset-up.
References
Danckwerts, P.V., 1970. Gas Liquid Reactions, McGraw Hill, New York.Hikita, H., Asai, S., Takatsuka, T., 1976. Absorption of carbon dioxide
into aqueous sodium hydroxide and sodium carbonate and bicarbonatesolutions. Chemical Engineering Journal 11, 131–141.
Kreulen, H., Smolders, C.A., Versteeg, G.F., van Swaaij, W.P.M., 1993.Microporous hollow-fiber membrane modules as gas–liquid contactors:1. Physical mass transfer processes—a specific application: masstransfer in highly viscous liquids. Journal of Membrane Science 78(3), 197–216.
Kumar, P.S., 2002. Development and design of membrane gas absorptionprocesses. Ph.D. Thesis, University of Twente, The Netherlands.
Leveque, J., 1928. Les lois de la transmission de chaleur par convection.Annls. Mines, Paris (Series 12), 201.
Nijsing, R.A.T.O., Hendriksz, R.H., Kramers, H., 1959. Absorption ofCO2 in jets and falling films of electrolyte solutions, with and withoutchemical reaction. Chemical Engineering Science 10, 88–104.
Pohorecki, R., Moniuk, W., 1988. Kinetics of the reaction between carbondioxide and hydroxyl ion in aqueous electrolyte solutions. ChemicalEngineering Science 43, 1677–1684.
Schumpe, A., Weisenberger, S., 1996. Estimation of gas solubility in saltsolutions at temperatures from 273 K to 363 K. A.I.Ch.E. Journal 42(1), 298–300.
Stefan, I., 1878. Sitzunsberichte der Akademie der Wissenschaften in Wein77 (II), 371.
Versteeg, G.F., van Swaaij, W.P.M., 1988. Solubility and diffusivity ofacid gases(CO2, N2O) in aqueous alkanolamine solutions. Journal ofChemical and Engineering Data 33, 29–34.
Versteeg, G.F., Kuipers, J.A.M., van Beckum, F.P.M., van Swaaij, W.P.M.,1989. Mass transfer with complex reversible chemical reactions. I.Single reversible chemical reaction. Chemical Engineering Science 44,2295–2310.