Embed Size (px)
Citation preview
University of Groningen
A nanoLC-MS-based platform for peptide analysisRieux, Laurent
IMPORTANT NOTE: You are advised to consult the publisher's version (publisher's PDF) if you wish to cite fromit. Please check the document version below.
Document VersionPublisher's PDF, also known as Version of record
Publication date:2006
Link to publication in University of Groningen/UMCG research database
Citation for published version (APA):Rieux, L. (2006). A nanoLC-MS-based platform for peptide analysis s.n.
CopyrightOther than for strictly personal use, it is not permitted to download or to forward/distribute the text or part of it without the consent of theauthor(s) and/or copyright holder(s), unless the work is under an open content license (like Creative Commons).
Take-down policyIf you believe that this document breaches copyright please contact us providing details, and we will remove access to the work immediatelyand investigate your claim.
Downloaded from the University of Groningen/UMCG research database (Pure): http://www.rug.nl/research/portal. For technical reasons thenumber of authors shown on this cover page is limited to 10 maximum.
Download date: 25-05-2018
CHAPTER 5
RAM-based albumin depletion coupled on-line to
nanoLC-MS for the analysis of complex proteomics samples
5.1 Introduction
Liquid chromatography-mass spectrometry (LC-MS) is an important analysis
technique in proteomics. In order to increase the concentration sensitivity of LC-
MS for low-molecular-weight peptides, it is often necessary to enrich them prior
to analysis and to remove high-abundance proteins like albumin. Notably, body
fluids like serum [1] or cerebrospinal fluid (CSF) [2] often contain considerable
amounts of albumin, making the analysis of constituents at nM concentrations
or below difficult. Removal of albumin and other high-abundance proteins is of-
ten achieved by immunoaffinity chromatography based on a panel of immobilised
antibodies [1–3]. However, highly abundant proteins can bind lower-abundance
proteins or peptides, which leads to the loss of the less-abundant species upon re-
moval of the high-abundance species. This is especially true when non-denaturing
conditions have to be used as in the case of immunoaffinity chromatography [4].
Consequently, improved methodology based on efficient sample pretreatment is
often necessary to study the low-abundance peptides in complex biological sam-
ples containing albumin.
Restricted access material (RAM) are porous silica materials used in chromatogra-
115
116 Chapter 5. On-line albumin depletion
phy for the separation of low-molecular-weight analytes from matrix components
like albumin by a combination of size exclusion and conventional adsorptive chro-
matography. Though the applicability of RAM for the analysis of peptides has
been demonstrated [5], RAM chromatography is seldom used in proteomics [6].
It has been applied to the analysis of cyanobacterial peptides after off-line sample
preparation [7] and for the quantitation of neuropeptide Y in porcine plasma.
In the latter case, the RAM column was coupled to reversed-phase LC-MS in a
forward-flush system, enabling a limit of detection (LOD) of 5 µM [8]. Unfortu-
nately, no data about the efficiency of albumin removal were provided [5, 8]. A
more complex set-up for the analysis of highly complex biofluids was described
by Wagner et al. [9]. This multidimensional system made use of RAM, coupled
on-line with ion-exchange and reversed-phase chromatography. All the columns
were connected in a back-flush fashion. Using this system, 92% of albumin was
depleted from the sample matrix.
In this study, a novel set-up for multidimensional nanoLC-MS featuring three
columns coupled on-line was developed and characterised. In particular, we were
concerned with the analysis of Substance P (SP) in albumin-rich matrices. The
columns were coupled using a single gradient pump and switching valve to min-
imise extracolumn dead volumes. Though the flow direction was controlled by a
switching valve, the analytes never flowed through valves except during injection.
For the first time, a RAM cartridge was coupled to nanoLC-MS in a forward-flush
mode and used for the analysis of microdialysis perfusates as model matrix and
SP as model peptide. BSA, which was added to reduce non-specific peptide ad-
sorption to the microdialysis membrane and connecting silica capillaries, could be
removed efficiently with the RAM cartridge while SP was quantitatively retained.
The set-up described here can be used reproducibly with fast gradients (RSD of
retention time ≈ 3% over a week), without requiring an extensive time period
to stabilise the flow or the pressure. Separation efficiency was high (peak width
at half-height of 10s) and samples up to 100 µL could be injected. Perfusates
containing up to 4.0 µM BSA were analysed without any off-line sample pretreat-
ment. The total cycle time, including sample pre-treatment, separation, washing
and equilibration, was about 40 min. Such rapid, reproducible and robust sepa-
rations by nanoLC-MS are expected to be of interest for the comparative analysis
of complex biofluids.
116
5.2. Materials and methods 117
5.2 Materials and methods
5.2.1 Materials
Formic acid (FA) (98-100% pure), formamide, sodium chloride, potassium chlo-
ride (all >99.5% pure) and magnesium chloride hexahydrate (99-102% pure) were
purchased from Merck KGaA (Darmstadt, Germany), and acetonitrile (ACN)
(HPLC Supra-Gradient grade) from Biosolve B.V. (Valkenswaard, The Nether-
lands). Ethyl acetate (99.9% pure) and 1/16” stainless steel blank nuts were
obtained from VWR International B.V. (Amsterdam, The Netherlands) and elec-
trodag PF-407A (carbon ink) from Acheson Industries Europe Ltd. (Scheemda,
The Netherlands). Substance P acetate salt (SP) (>98% pure), bovine serum
albumin (BSA) (>96% electrophoretically pure) and calcium chloride dihydrate
(>99% pure) were obtained from Sigma-Aldrich (Zwijndrecht, The Netherlands),
D(+)-glucose anhydrous from J.T. Baker Chemicals B.V. (Deventer, The Nether-
lands) and dimethyl sulfoxide (DMSO) (≥ 99.5% pure) from Fluka (Zwijndrecht,
The Netherlands). Fused-silica capillaries (50-200 µm ID, 360 µm OD) were pur-
chased from Composite Metal Service (Ilkley, UK) and microtight PEEK sleeve
(0.0155” ID, 0.025” OD) and microT PEEK assembly (0.25” bore) from Up-
church Scientific (Oak Harbor, WA, USA). PEEK cartridges and their stainless
steel holder were obtained from SPARK Holland (Emmen, The Netherlands).
Restricted-access chromatographic media of varying selectivity, C18, C8 and GFF-
II (glycine-phenylalanine-phenylalanine-based material) (C18-RAM, C8-RAM &
GFF), were a gift from Regis Technologies (Morton Grove, IL, USA) and the
potassium silicate solution (Kasil 1) a gift from PQ Europe (Winschoten, The
Netherlands).
5.2.2 Preparation of frits, columns and cartridges
Column frits were prepared based on a method described by Meiring et al. [10],
which involves polymerisation of potassium silicate in the solution at the end
of the capillary. Briefly, 50 µL of formamide were pipetted into a 1.5-mL Ep-
pendorf vial and 150 µL of Kasil 1 were added. Promptly after, the mixture
was briefly vortexed, and 10-to-15-cm long silica capillaries were immersed in the
polymerising mixture at a right angle with the surface of the liquid to a depth of
approximately 5 mm. In this way, the silicate solution was passively introduced
to the ends of the capillaries by capillary forces. Typically, 10 frits were prepared
at the same time. Polymerisation was completed by heating the capillaries at
100°C in an oven for 4h. The resulting frits were cut to a length of approximately
117
118 Chapter 5. On-line albumin depletion
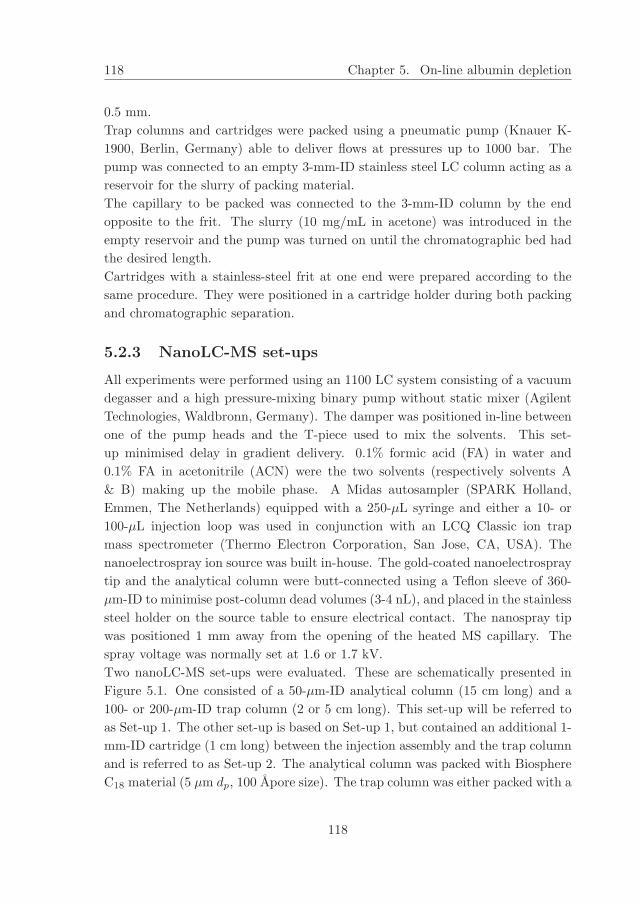
0.5 mm.
Trap columns and cartridges were packed using a pneumatic pump (Knauer K-
1900, Berlin, Germany) able to deliver flows at pressures up to 1000 bar. The
pump was connected to an empty 3-mm-ID stainless steel LC column acting as a
reservoir for the slurry of packing material.
The capillary to be packed was connected to the 3-mm-ID column by the end
opposite to the frit. The slurry (10 mg/mL in acetone) was introduced in the
empty reservoir and the pump was turned on until the chromatographic bed had
the desired length.
Cartridges with a stainless-steel frit at one end were prepared according to the
same procedure. They were positioned in a cartridge holder during both packing
and chromatographic separation.
5.2.3 NanoLC-MS set-ups
All experiments were performed using an 1100 LC system consisting of a vacuum
degasser and a high pressure-mixing binary pump without static mixer (Agilent
Technologies, Waldbronn, Germany). The damper was positioned in-line between
one of the pump heads and the T-piece used to mix the solvents. This set-
up minimised delay in gradient delivery. 0.1% formic acid (FA) in water and
0.1% FA in acetonitrile (ACN) were the two solvents (respectively solvents A
& B) making up the mobile phase. A Midas autosampler (SPARK Holland,
Emmen, The Netherlands) equipped with a 250-µL syringe and either a 10- or
100-µL injection loop was used in conjunction with an LCQ Classic ion trap
mass spectrometer (Thermo Electron Corporation, San Jose, CA, USA). The
nanoelectrospray ion source was built in-house. The gold-coated nanoelectrospray
tip and the analytical column were butt-connected using a Teflon sleeve of 360-
µm-ID to minimise post-column dead volumes (3-4 nL), and placed in the stainless
steel holder on the source table to ensure electrical contact. The nanospray tip
was positioned 1 mm away from the opening of the heated MS capillary. The
spray voltage was normally set at 1.6 or 1.7 kV.
Two nanoLC-MS set-ups were evaluated. These are schematically presented in
Figure 5.1. One consisted of a 50-µm-ID analytical column (15 cm long) and a
100- or 200-µm-ID trap column (2 or 5 cm long). This set-up will be referred to
as Set-up 1. The other set-up is based on Set-up 1, but contained an additional 1-
mm-ID cartridge (1 cm long) between the injection assembly and the trap column
and is referred to as Set-up 2. The analytical column was packed with Biosphere
C18 material (5 µm dp, 100 Apore size). The trap column was either packed with a
118
5.2. Materials and methods 119
regular RP stationary phase (Biosphere C18, 5 µm dp, 100 Apore size), or a RAM
phase (Regis C8, C18 or GFF-II; 5 µm dp, 100 Apore size). The cartridge was
only used with Regis C8 RAM packing material. Columns packed with Biosphere
C18 were purchased from Nanoseparations (Nieuwkoop, The Netherlands). In
both set-ups, the 6-port switching valve of the MS was used to control the flow
direction.
HPLC
Pump
Sample
Syringe
Trap
Column
Wastes
Analytical
Column
Split Line
Blank Nuts
Mass
Spectrometer
A
HPLC
Pump
Sample
Syringe
Trap
Column
Wastes
Analytical
Column
Split Line
Blank Nuts
Mass
Spectrometer
RAM
Cartridge
P 1: Split Flow
P 2: Unsplit Flow
B
HPLC
Pump
Sample
Syringe
Trap
Column
Wastes
Analytical
Column
Split Line
Blank Nuts
Mass
Spectrometer
A
HPLC
Pump
Sample
Syringe
Trap
Column
Wastes
Analytical
Column
Split Line
Blank Nuts
Mass
Spectrometer
A
HPLC
Pump
Sample
Syringe
Trap
Column
Wastes
Analytical
Column
Split Line
Blank Nuts
Mass
Spectrometer
RAM
Cartridge
P 1: Split Flow
P 2: Unsplit Flow
B
HPLC
Pump
Sample
Syringe
Trap
Column
Wastes
Analytical
Column
Split Line
Blank Nuts
Mass
Spectrometer
RAM
Cartridge
P 1: Split Flow
P 2: Unsplit Flow
B
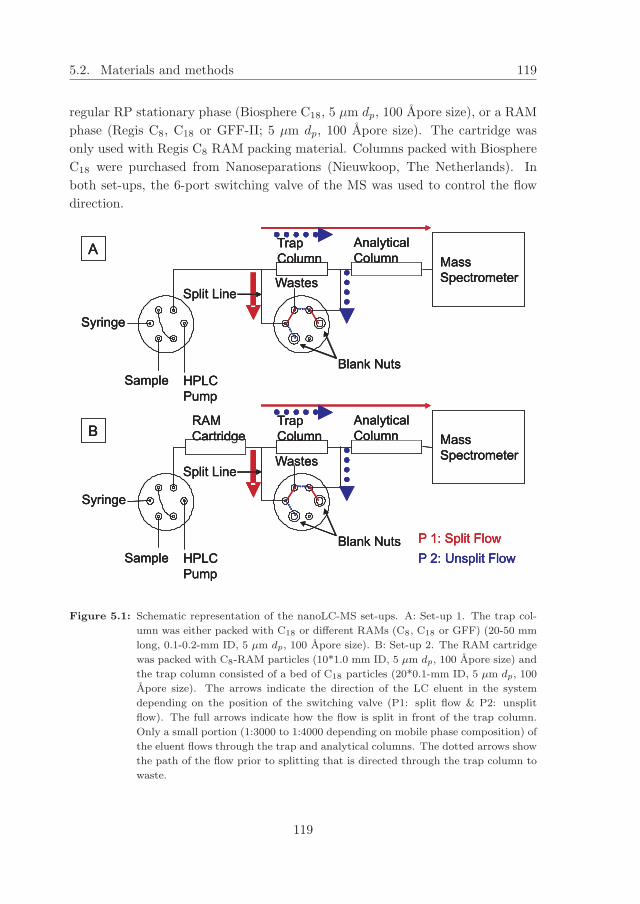
Figure 5.1: Schematic representation of the nanoLC-MS set-ups. A: Set-up 1. The trap col-
umn was either packed with C18 or different RAMs (C8, C18 or GFF) (20-50 mm
long, 0.1-0.2-mm ID, 5 µm dp, 100 Apore size). B: Set-up 2. The RAM cartridge
was packed with C8-RAM particles (10*1.0 mm ID, 5 µm dp, 100 Apore size) and
the trap column consisted of a bed of C18 particles (20*0.1-mm ID, 5 µm dp, 100
Apore size). The arrows indicate the direction of the LC eluent in the system
depending on the position of the switching valve (P1: split flow & P2: unsplit
flow). The full arrows indicate how the flow is split in front of the trap column.
Only a small portion (1:3000 to 1:4000 depending on mobile phase composition) of
the eluent flows through the trap and analytical columns. The dotted arrows show
the path of the flow prior to splitting that is directed through the trap column to
waste.
119
120 Chapter 5. On-line albumin depletion
5.2.4 NanoLC Procedures
Set-up 1 has been extensively described by Meiring et al. [10]. Briefly, the sample
plug was concentrated on either a C18 (20 * 0.1-mm-ID) or a RAM (50 * 0.2-
mm-ID) trap column. The flow (10 to 50 µL/min, 1 to 10% ACN) was directed
through the trap column by switching the valve so as to connect the split line (300
* 0.05 mm ID) to a blank nut. Elution of the analytes from the trap column onto
the analytical column was performed by switching the valve so as to connect the
split line to the waste line. The flowrate was concomitantly raised to 400 µL/min,
which was split down to 100-150 nL/min, and the gradient was started. The gra-
dient ran up to 65% ACN at 3%/min. Subsequently, the solvent composition was
returned to the starting composition and the system was equilibrated for 10 min.
Set-up 2 is based on Set-up 1 and Figure 5.1 illustrates its operation. An ad-
ditional RAM C8 cartridge, in a cartridge holder, was positioned between the
injection assembly and the split line. Programming of both the gradient pump
and the switching valve is described in Table 5.1. Briefly, the principle of the
set-up is the following. During the first 10 minutes, the flow was split between
the RAM cartridge and the nanoLC part of the system discarding the BSA that
is not retained on the RAM to waste. The transfer of SP from the RAM cartridge
to the trap column of the nanoLC was performed by directing the flow through
the trap column without splitting it. After loading of the trap column, the valve
was switched back to its original position, thereby splitting the flow again. At the
same time, the flow was raised and the gradient started, simultaneously washing
the RAM cartridge of the remaining BSA to waste and eluting SP off the nanoLC.
In the following discussion, the term ”trap” refers to the type of column used in
Set-up 1 (100- or 200-µm ID). The term ”cartridge” applies to the column (1-mm
ID) at the front-end of Set-up 2.
5.2.5 Sample preparation
The perfusate was composed of 140 mM NaCl, 3 mM KCl, 1.25 mM CaCl2, 1
mM MgCl2, 3 mM glucose and either 0.025 or 0.0025% BSA (w/v) (≈ 4.0 or 0.4
µM).
The perfusate was used, pure or as a mixture with 0.1% FA in DMSO in the
following ratios, perfusate: DMSO (19:1, 3:1 and 1:1), to dilute standards [11].
SP standards were also prepared in 0.1% FA in water:DMSO at the same ratios.
Concentrations ranged from 0.5 up to 50 nM. The volumes injected were either
10 or 100 µL depending on the experiment.
120
5.3. Results and discussion 121
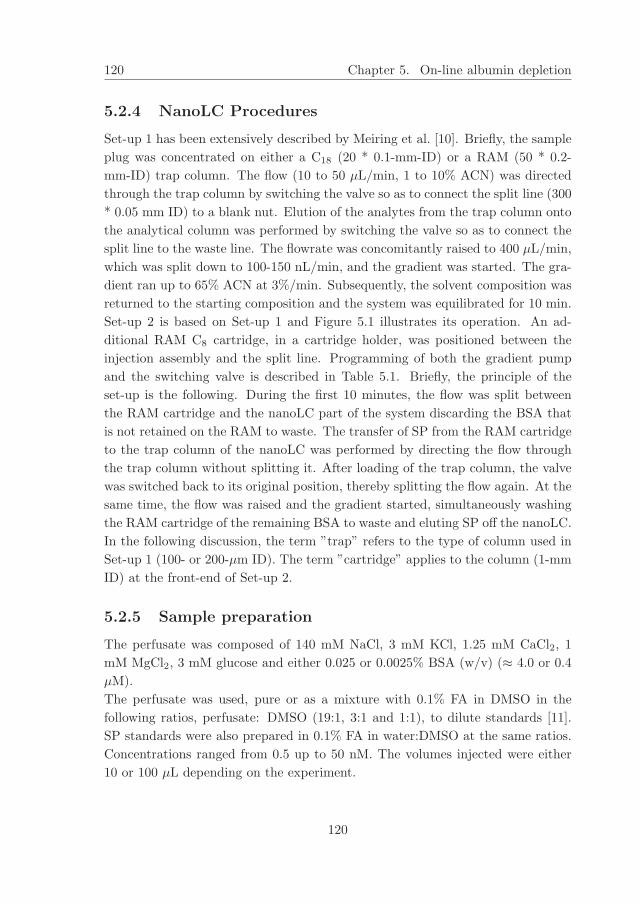
Valve LC pump
T (min) Position T (min) % B Flow (µL/min)
0 0 1 50
P1 5 1 50
10 5.01 10 50
10.01 15 10 50
P2
15 15.01 10 400
15.01 32.2 65 400
P1 32.21 1 400
42.2 42.2 1 400
Table 5.1: Programming of both the gradient pump and the switching valve in Set-up 2. The
terms split flow and unsplit flow are related to the position of the switching valve
(P1 & P2) and its action on the flow (see Figure 5.1). During loading of the sample
and elution of the nanoLC, the flow is split (P1) in front of the trap column with
a large fraction going to waste and a small one flowing through the trap and the
analytical columns. The split ratio is 1:3000 to 1:4000, depending on the mobile
phase composition. Conversely, the flow is unsplit (P2) when the switching valve
directs the flow through the trap column to waste (during transfer of the analytes
from the RAM cartridge to the trap column) (cf. Figure 5.1)
.
5.3 Results and discussion
5.3.1 NanoLC-MS: Set-up 1
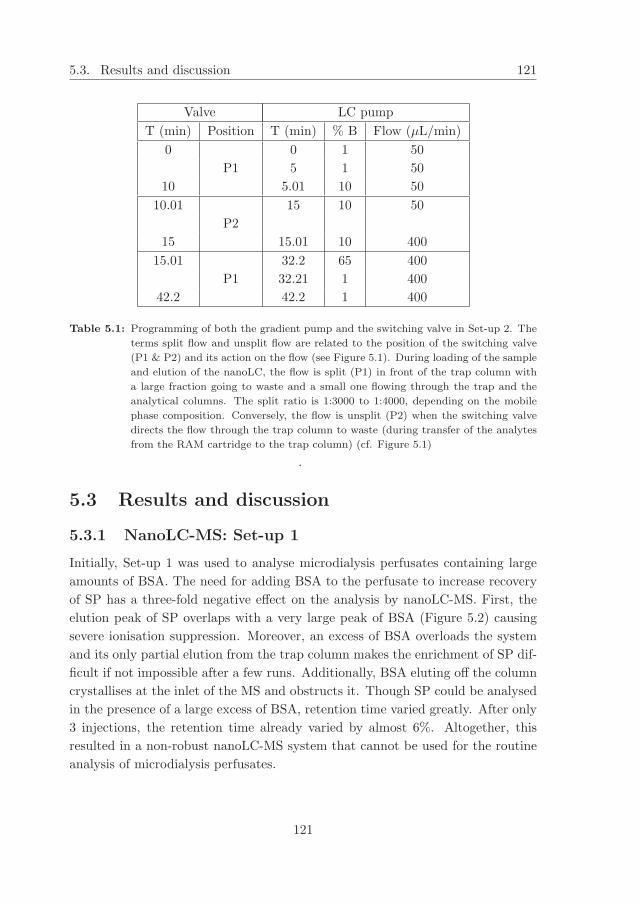
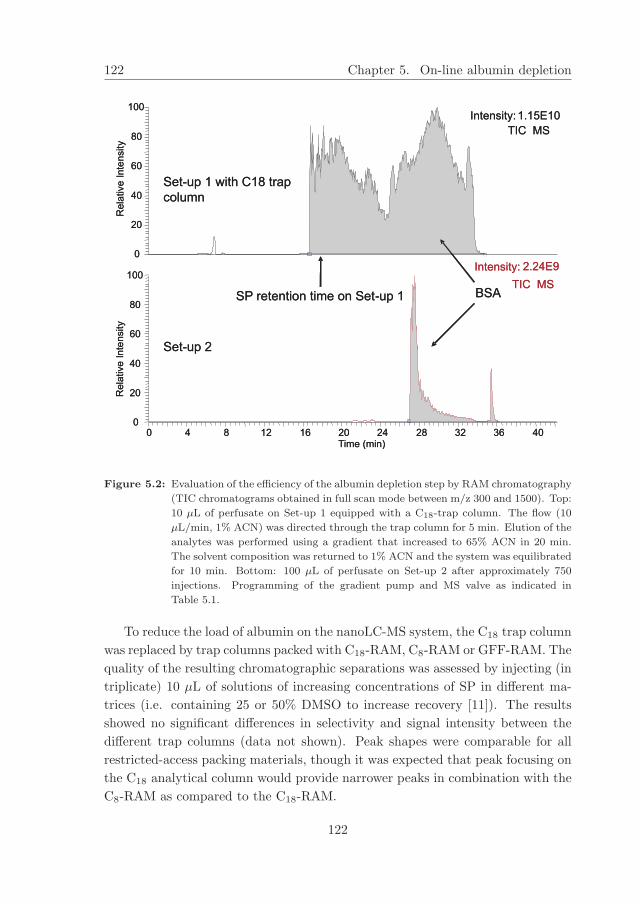
Initially, Set-up 1 was used to analyse microdialysis perfusates containing large
amounts of BSA. The need for adding BSA to the perfusate to increase recovery
of SP has a three-fold negative effect on the analysis by nanoLC-MS. First, the
elution peak of SP overlaps with a very large peak of BSA (Figure 5.2) causing
severe ionisation suppression. Moreover, an excess of BSA overloads the system
and its only partial elution from the trap column makes the enrichment of SP dif-
ficult if not impossible after a few runs. Additionally, BSA eluting off the column
crystallises at the inlet of the MS and obstructs it. Though SP could be analysed
in the presence of a large excess of BSA, retention time varied greatly. After only
3 injections, the retention time already varied by almost 6%. Altogether, this
resulted in a non-robust nanoLC-MS system that cannot be used for the routine
analysis of microdialysis perfusates.
121
122 Chapter 5. On-line albumin depletion
0 4 8 12 16 20 24 28 32 36 40Time (min)
0
20
40
60
80
100
0
20
40
60
80
100
Rela
tive
Inte
nsity
Intensity:1.15E10
TIC MS
Intensity: 2.24E9
TIC MS
Set-up 1 with C18 trap
column
Set-up 2
BSASP retention time on Set-up 1
Rela
tive
Inte
nsity
0 4 8 12 16 20 24 28 32 36 40Time (min)
0
20
40
60
80
100
0
20
40
60
80
100
Rela
tive
Inte
nsity
Intensity:1.15E10
TIC MS
Intensity: 2.24E9
TIC MS
Set-up 1 with C18 trap
column
Set-up 2
BSASP retention time on Set-up 1
Rela
tive
Inte
nsity
Figure 5.2: Evaluation of the efficiency of the albumin depletion step by RAM chromatography
(TIC chromatograms obtained in full scan mode between m/z 300 and 1500). Top:
10 µL of perfusate on Set-up 1 equipped with a C18-trap column. The flow (10
µL/min, 1% ACN) was directed through the trap column for 5 min. Elution of the
analytes was performed using a gradient that increased to 65% ACN in 20 min.
The solvent composition was returned to 1% ACN and the system was equilibrated
for 10 min. Bottom: 100 µL of perfusate on Set-up 2 after approximately 750
injections. Programming of the gradient pump and MS valve as indicated in
Table 5.1.
To reduce the load of albumin on the nanoLC-MS system, the C18 trap column
was replaced by trap columns packed with C18-RAM, C8-RAM or GFF-RAM. The
quality of the resulting chromatographic separations was assessed by injecting (in
triplicate) 10 µL of solutions of increasing concentrations of SP in different ma-
trices (i.e. containing 25 or 50% DMSO to increase recovery [11]). The results
showed no significant differences in selectivity and signal intensity between the
different trap columns (data not shown). Peak shapes were comparable for all
restricted-access packing materials, though it was expected that peak focusing on
the C18 analytical column would provide narrower peaks in combination with the
C8-RAM as compared to the C18-RAM.
122
5.3. Results and discussion 123
BSA
SP
30%
30%
10%
10%
0 4 8 12 16 20 24 28 32Time (min)
0
40
80
0
40
80
0
40
80
P 1: Split Flow P 2: Unsplit Flow P 1: Split Flow
10 min 15 min
Inte
nsity
0
40
80
BSA
SP
30%
30%
10%
10%
0 4 8 12 16 20 24 28 32Time (min)
0
40
80
0
40
80
0
40
80
P 1: Split Flow P 2: Unsplit Flow P 1: Split Flow
10 min 15 min
Inte
nsity
0
40
80
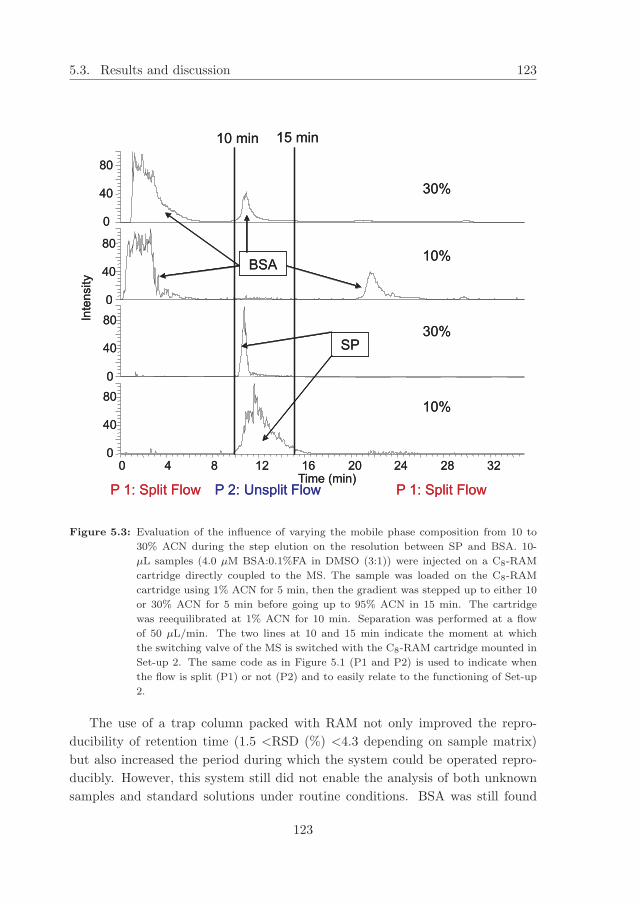
Figure 5.3: Evaluation of the influence of varying the mobile phase composition from 10 to
30% ACN during the step elution on the resolution between SP and BSA. 10-
µL samples (4.0 µM BSA:0.1%FA in DMSO (3:1)) were injected on a C8-RAM
cartridge directly coupled to the MS. The sample was loaded on the C8-RAM
cartridge using 1% ACN for 5 min, then the gradient was stepped up to either 10
or 30% ACN for 5 min before going up to 95% ACN in 15 min. The cartridge
was reequilibrated at 1% ACN for 10 min. Separation was performed at a flow
of 50 µL/min. The two lines at 10 and 15 min indicate the moment at which
the switching valve of the MS is switched with the C8-RAM cartridge mounted in
Set-up 2. The same code as in Figure 5.1 (P1 and P2) is used to indicate when
the flow is split (P1) or not (P2) and to easily relate to the functioning of Set-up
2.
The use of a trap column packed with RAM not only improved the repro-
ducibility of retention time (1.5 <RSD (%) <4.3 depending on sample matrix)
but also increased the period during which the system could be operated repro-
ducibly. However, this system still did not enable the analysis of both unknown
samples and standard solutions under routine conditions. BSA was still found
123
124 Chapter 5. On-line albumin depletion
to crystallise at the MS opening, so the system had to be cleaned on a daily
basis. The presence of BSA crystals on the MS endplate indicated that a signif-
icant portion of the injected BSA was not eliminated by the RAM column. To
better characterise BSA retention in the system, the C8-RAM trap column was
coupled directly to the ion trap using a 10-µm-ID gold coated nanospray emit-
ter mounted on the nanospray interface and 10-µL injections of SP in perfusate
were performed. Interestingly, BSA eluted in two fractions, the first one in the
flowthrough and the second after the elution of SP (Figure 5.3). Preliminary ex-
periments showed that linear flowrate and mobile phase composition were factors
of major importance for efficient removal of BSA and retention of SP. As much as
80% of BSA remained on the RAM trap at higher flowrates (10-20 µL/min) dur-
ing sample loading (data not shown). Using a C8-RAM trap column (20*0.1-mm
ID) and a flow of 2.5µL/min, improved BSA depletion was observed; 75% BSA
could be discarded in the flowthrough. Lower flowrates were expected to result
in even more efficient depletion of BSA. However, such low flowrates are highly
impractical with the system used. Firstly, such low flows are very unstable if de-
livered without flow splitting. Moreover, sample volumes as large as 100 µL were
expected to be brought onto the trap column, which would result in extremely
long loading times. As an alternative, 0.2-mm-ID trap columns were considered
but, when coupled to a 50-µm ID analytical column, this resulted in broad chro-
matographic peaks. Therefore, a change in set-up was necessary, incorporating
an on-line albumin depletion step using a larger ID C8-RAM cartridge coupled to
the original reversed-phase nanoLC system.
5.3.2 Set-up 2: RAM cartridge coupled to nanoLC-MS
In order to remove BSA prior to nanoLC-MS in a more efficient manner, Set-
up 2 was used (Figure 5.1). In this set-up, a RAM cartridge (10 * 1.0-mm-ID)
was positioned in-between the injection valve and the trap column. During the
first 10 minutes, the flow was split between the RAM cartridge and the nanoLC
part of the system, discarding the BSA that was not retained on the RAM to
waste. The transfer of SP from the RAM cartridge to the trap column of the
nanoLC was performed by directing the flow through the trap column without
splitting. After loading of the trap column, the valve was switched back to its
original position, thereby splitting the flow again. At the same time, the flow
was raised and the gradient started, simultaneously washing the RAM cartridge
of the remaining BSA to waste and eluting SP off the nanoLC. In this set-up a
RAM cartridge was coupled to nanoLC-MS in a forward-flush mode, an approach
124
5.3. Results and discussion 125
that has, to our knowledge, not been described before. This set-up has the ad-
vantage that no additional switching valve or pump are required, whereas most
nanoLC designs making use of a trapping column do require a second ”loading”
pump [12, 13]. Commonly, in the elution step, the sample is back-flushed off the
RAM cartridge and flows through the switching valve before reaching the ana-
lytical column. Back-flush set-ups minimise the contact time between analyte
and trap column. However, positioning the switching valve on the sample path
increases non-specific interactions between analytes and metal parts of the valve.
The set-up described here can be used reproducibly with very fast gradients and
without requiring an extensive period to stabilise both the flow and the pres-
sure [13]. Moreover, the use of fewer parts is likely to reduce down-times of the
instrumental set-up, though this remains to be seen in further long-term studies.
Additionally, large sample volumes (10 to 100 µL) could be injected at high
flowrates (50 µL/min) on Set-up 2. Haskins described a sensitive nanoLC-MS
system for the analysis of neuropeptides in microdialysates in the absence of BSA
in which no trap column was used. 5 min were necessary to inject 1.8 µL of sam-
ple on a 25-µm-ID column [14]. On-line coupling of trap and analytical columns
enabled faster loading (<2 min) of larger sample volumes (10 µL) while separa-
tion was performed at nL/min flowrates [12]. The design of the nanoLC set-up
described here allows for even larger sample volumes (up to 100 µL) to be loaded
in a short time. Moreover, analytes can be efficiently separated from the BSA-
containing sample matrix during loading before being further separated on the
nanoLC-MS part of the system.
This set-up has great potential for on-line sample preparation coupled to nanoLC-
MS. Its selectivity can be tailored to suit the needs of a particular application by
varying the selectivity of the cartridge and/or of the trap column. To demonstrate
the feasibility for on-line albumin depletion coupled to nanoLC-MS, a C8-RAM
cartridge was characterised and coupled on-line with a C18 nanoLC system.
5.3.3 Characterisation of RAM material
Using Set-up 2, it is of great importance to avoid that SP elutes in the flowthrough
containing the majority of BSA and to maximise resolution between SP and the
remainder of BSA that is retained on the RAM cartridge. To this end, loading
and elution conditions and the %DMSO in the sample were optimised. A car-
tridge (10*1 mm) packed with C8 RAM was coupled directly to the ion trap mass
spectrometer using a commercially available interface.
125
126 Chapter 5. On-line albumin depletion
5.3.3.1 Sample loading conditions
The impact of the mobile phase composition (1 to 15%ACN) during loading of the
sample was investigated. In addition, the influence of the flowrate during loading
of the RAM cartridge was investigated (50 to 250 µL/min). The influence of the
ACN percentage was investigated at a flow of 250 µL/min, while for the investiga-
tion of flowrate an ACN percentage of 1% during loading of the sample was used.
Prior to injection, the RAM cartridge was equilibrated for 2 min (at 250 µL/min)
at the mobile phase composition used for sample loading. After sample loading,
the gradient was started at this percentage. The ACN percentage increased to
95%, the change in volume fraction of acetonitrile per gradient volume was held
constant, i.e., the volume of the column effluent from the start to the end of the
gradient was constant. Every experiment was performed with perfusates contain-
ing 0.1%FA in DMSO at the following ratios (19:1, 3:1 and 1:1).
Two BSA fractions were observed, one in the flowthrough and the other result-
ing from retention of a part of BSA on the RAM column. Retention of BSA on
the RAM may have resulted from either one or a combination of three distinct
phenomena. First, BSA may interact with the polyethylene glycol chains present
on the outer surface of the RAM silica particles in a hydrophilic interaction chro-
matography (HILIC) retention mode. However, HILIC using the C8-RAM car-
tridge was only observed for SP at very high percentages of ACN (>60 %ACN.
data not shown). HILIC can therefore be ruled out at the mobile phase compo-
sition (1 %ACN) used during loading of the sample on the trap column. Second,
BSA may bind to the remaining silanol groups at the surface of the RAM as
suggested by Wagner et al. who used cation-exchange RAM particles [9]. Most
likely, however, is that some of the BSA passes through the polyethylene glycol
network and enters the pores, where it interacts with the C8 groups.
SP eluted between the two BSA fractions. 30 to 60% BSA were retained on the
C8-RAM cartridge depending on the mobile phase composition and the %DMSO
in the sample. Increasing the %ACN in the mobile phase during loading from 1 to
15% resulted in an increase of 5 to 10% of BSA (at fixed %DMSO in the sample)
in the flowthrough. It indicated that, indeed, BSA apparently interacts with the
octyl groups inside the pores of the silica particles. As expected, retention of
SP was also negatively influenced by an increased %ACN in the loading buffer.
Loading at 1% ACN offered the best compromise. SP was strongly retained on
the RAM phase and well separated from the second BSA fraction.
Increasing the flowrate only resulted in minor changes. Resolution between SP
and the second BSA fraction and the %BSA in the flowthrough were barely in-
126
5.3. Results and discussion 127
fluenced. However, the time window to switch the valve and direct BSA to waste
and SP to the nanoLC logically decreased with increasing flowrate.
Increasing the %DMSO in the sample increased the intensity of the MS signal for
SP indicating that DMSO probably prevents interactions between SP and BSA.
It also resulted in a greater proportion of BSA in the flowthrough on the RAM.
However, the SP peaks showed a better reproducibility in terms of peak shape
and peak width when the samples contained only a limited amount of DMSO.
Therefore, the flowrate was set at 50 µL/min and 25% DMSO in the sample and
1% ACN in the loading buffer were selected as the best compromise in terms of
signal intensity, reproducibility (MS signal and retention time) and depletion of
BSA.
5.3.3.2 Percentage ACN during elution of the RAM cartridge
To attain efficient elution of SP from the RAM cartridge while avoiding co-elution
with the fraction of BSA also retained on the RAM cartridge, the %ACN dur-
ing the elution step was investigated. The sample (containing 25% DMSO) was
loaded on the RAM cartridge at 1%ACN. After 5 min, SP was eluted applying
a step gradient up to 10 or 30%ACN for 5 min. The gradient was then linearly
increased up to 95% ACN at a flow of 50 µL/min. The RAM cartridge was equi-
librated at 1 %ACN for 10 min prior to the next injection.
Increasing the %ACN during step elution barely influenced the retention time
of SP as 10% ACN was already sufficient for SP to start eluting. However, the
retention of the retained BSA fraction was strongly influenced by the higher per-
centage of ACN during elution (Figure 5.3).
Step elution of SP using 10% ACN ensured baseline resolution between SP and
the BSA fraction retained on the cartridge whereas step elution using 30% ACN
resulted in co-elution of SP and BSA. The principle of Set-up 2 ensures complete
albumin depletion while SP was retained on the cartridge and chromatographi-
cally well-resolved from the second BSA fraction. Therefore elution of SP was
performed by step elution using 10% ACN.
5.3.3.3 Recovery
%ACN and flowrate during loading and %DMSO in the sample were expected
to affect SP recovery. However, with respect to flowrate, no decrease in recovery
was observed over the range of flowrates investigated. Breakthrough of SP was
observed when more than 5%ACN were used during loading of the sample on the
RAM cartridge or when the sample contained more than 25% DMSO.
127
128 Chapter 5. On-line albumin depletion
Additionally, the recovery of SP was expected to be influenced by the presence of
BSA and the time for which the RAM column was washed. The recovery of SP
in the presence (or absence) of BSA and with varying loading/washing times (1
or 10 min) of the RAM cartridge was investigated by injecting 100 µL of sample.
Loading was performed using 1% ACN during either 1 or 10 min. Subsequently,
the gradient went up to 95% ACN in 6 min at a flowrate of 250 µL/min. Finally,
the cartridge was subsequently re-equilibrated for 2 min at the loading buffer com-
position (1% ACN). The sample solvent was either perfusate (4.0µM BSA):0.1%
FA in DMSO (3:1) or 0.1% FA in water:DMSO (3:1). Samples containing 14.8,
148 & 1480 nM SP were sequentially injected onto the system. The resulting
calibration curves showed different sensitivities that can be directly related to the
respective recovery. The four different experiments showed decreasing recovery
in the following order: samples without BSA and 1 min wash >samples with
BSA and 1 min wash >samples without BSA and 10 min wash >samples with
BSA and 10 min wash. The washing time of the RAM cartridge clearly led to
great losses of SP. Recovery decreased by as much as 50% when the washing time
was increased from 1 to 10 min. Part of the SP was probably washed away by
the large excess of mobile phase used to wash the RAM cartridge. Sensitivity
was a few percent lower in the presence than in the absence of BSA, indicating
that only a small percentage of SP remained bound to BSA and was discarded
to waste together with the eliminated BSA. Though only repeated gel filtration
could dissociate the complex formed between SP and the high-molecular weight
plasma components [15], it was possible with our set-up to efficiently enrich SP
and discard BSA using a short RAM cartridge and a relatively high flowrate.
5.3.4 Set-up 2 under optimised conditions
The optimised chromatographic conditions for coupling the RAM cartridge with
nanoLC-MS in Set-up 2 (Figure 5.1, Table 5.1) were the following.
100 µL of perfusate (containing 0.4 or 4.0µM BSA and 25% acidified DMSO)
was loaded on the RAM cartridge using 1 %ACN at 50µL/min. A 50µL/min
flowrate during elution made it possible to couple the RAM cartridge directly to
the reversed-phase trap column without operating pressures exceeding 160 bar. A
step gradient to 10% ACN allowed the transfer of SP from the RAM cartridge to
the C18 trap column. No breakthrough of SP on the C18 trap column (20 * 0.1-mm
ID) was observed even up to an ACN concentration of 30 %ACN in the elution
step (data not shown). The RAM cartridge was washed during elution of SP over
the nanoLC system using a linear gradient up to 65% ACN. The programming of
128
5.3. Results and discussion 129
the gradient pump and switching valve is described in Table 5.1.
Separations were very efficient with peak widths of 10s at half height. Such peak
widths are consistent with other high-efficiency nanoLC systems [12, 14]. These
set-ups, however, did not integrate an on-line sample pretreatment step. The total
analysis time including sample pretreatment, separation of the analytes, washing
and equilibration of the system, was about 40 min.
As a control of the efficiency of BSA removal by RAM sample pretreatment using
Set-up 2, 100 µL of perfusate (containing 4.0µM BSA) were injected on Set-up 2
and the eluent of the nanoLC was monitored by full-scan mass spectrometry. The
area of the BSA peak was compared to the area of the BSA peak resulting from the
injection of 10 µL of perfusate on Set-up 1 equipped with a C18-trap column. The
peak area due to remaining BSA on Set-up 2 was estimated to be approximately
2-3% of that resulting from a ten-time smaller direct injection on the C18-nanoLC
system (Set-up 1). Therefore, only about 0.2-0.3% of the injected BSA on Set-up
2 reached the MS (Figure 5.2). With the system described by Wagner et al., as
much as 8% of the original albumin content remained on the system after the
RAM step [9]. Although antibody-based depletion approaches were specifically
designed to selectively remove albumin and other high-abundance proteins [3],
depletion did not reach the level achieved by our system. In the same study, other
depletion (antibody- or dye-based) columns apparently achieved better results
than our system but were not tested with a system as sensitive as a nanoLC-MS.
Moreover, anti-HSA columns require exchanging solvents before LC-MS analysis.
An advantage of RAM materials over antibody-based columns is that non-specific
binding of SP to BSA was reduced by adding 25% acidified DMSO (0.1% FA) to
the sample, which is not possible for antibody-based systems.
Based on the optimised conditions, Set-up 2 was operated for more than a week
(≈ 250 injections) without the need for washing either the nanoLC or the MS
endplate. Retention times were much more reproducible (RSD ≈ 3% over a
week) than for Set-up 1 (RSD ≈ 6% over 3 runs) even though samples with two
different matrices (0.4 or 4.0µM BSA) were injected. After approximately 750
injections of perfusate (0.4 or 4.0µM BSA:0.1%FA in DMSO (3:1)) on Set-up 2,
100 µL of perfusate were injected and the elution of BSA followed by full scan
mass spectrometry. The peak area of BSA was comparable to the area observed
after only a few injections. We therefore conclude that the system still operated
reproducibly after 750 injections.
129
130 Chapter 5. On-line albumin depletion
5.4 Conclusion
In this study, a novel set-up for multidimensional nanoLC-MS featuring three
columns coupled on-line was developed and characterised. For the first time, a
RAM cartridge was coupled on-line to nanoLC-MS in the forward-flush mode.
No additional switching valve or pump are required to couple the three different
columns. The set-up described here can be used reproducibly with very fast gradi-
ents without requiring an extensive period to stabilise either flow or pressure [13].
Moreover, its simplicity makes it very robust and cheap. After optimisation,
all SP in the perfusate was brought on the nanoLC part and virtually all BSA
(99.7-99.8%) was discarded. While analysing the sample by nanoLC-MS, the
RAM cartridge was washed using the eluent of the nanoLC. The RAM cartridge
and the nanoLC were re-equilibrated using the same mobile phase. Separations
were very efficient with peak widths (at half height) of 10s. The total analy-
sis time including sample pretreatment, separation of the analytes, washing and
re-equilibration of the system, was about 40 min. Moreover, the separation was
highly reproducible (RSD on retention time ≈ 3% over a week) and robust (750
injections without any change of RAM cartridge or nanoLC columns) compared
to a trap-nanoLC system such as Set-up 1. It was used almost continuously for
a couple of months before the different columns and the RAM cartridge were
exchanged as a precautionary measure. The set-up is particularly suitable for
peptides and other low-molecular weight analytes in matrices containing large
amounts of high-molecular weight proteins like BSA. Importantly, it can be used
for the analysis of relatively large volumes (10-100 µL) for nanoLC-MS.
Our rapid, reproducible and robust RAM-nanoLC-MS set-up is expected to be
of great interest for comparative analysis of large sets of samples. Further devel-
opments of this modular system involve the use of stationary phases of different
selectivity and the coupling to a more sensitive triple quadrupole or linear ion
trap mass spectrometer. We consider that this system holds promise in the field
of biomarker discovery, where limited sample is available (e.g. CSF from animal
studies) and concentrations of interesting molecules is rather low.
130
References
[1] N. I. Govorukhina, A. Keizer-Gunnink, A. G. J. van der Zee, S. de Jong,
H. W. A. de Bruijn, R. Bischoff; Journal of Chromatography A 1009, 171
(2003)
[2] C. Li, K. H. Lee; Analytical Biochemistry 333, 381 (2004)
[3] K. Bjrhall, T. Miliotis, P. Davidsson; Proteomics 5, 307 (2005)
[4] Y. Li, J. W. Cooper, C. S. Lee; Journal of Chromatography A 979, 241 (2002)
[5] T. C. Pinkerton, K. A. Koeplinger; Journal of Chromatography A 458, 129
(1988)
[6] S. Souverain, S. Rudaz, J. L. Veuthey; journal of chromatography B 801,
141 (2004)
[7] J. A. O. Meriluoto, K. Isaksson, H. Soini, E. Nygard, J. E. Eriksson; Chro-
matographia 30, 301 (1990)
[8] K. Racaityte, E. S. M. Lutz, K. K. Unger, D. Lubda, K. S. Boos; Journal of
Chromatography A 890, 135 (2000)
[9] K. Wagner, T. Miliotis, G. Marko-Varga, R. Bischoff, K. K. Unger; Analytical
Chemistry 74, 809 (2002)
[10] H. D. Meiring, E. van der Heeft, G. J. ten Hove, A. P. J. M. de Jong; Journal
of Separation Sciences 25, 557 (2002)
131
132 References
[11] P. van Midwoud, L. Rieux, R. Bischoff, E. Verpoorte, H. A. G. Niederlander;
Journal of Proteome Research In preparation (2006)
[12] Y. Shen, N. Tolic, C. Masselon, L. Pasa-Tolic, D. G. Camp, K. K. Hixson,
R. Zhao, G. A. Anderson, R. D. Smith; Analytical Chemistry 76, 144 (2004)
[13] L. Rieux, D. Lubda, H. A. G. Niederlander, E. Verpoorte, R. Bischoff; Jour-
nal of Chromatography A 1120, 165 (2006)
[14] W. E. Haskins, Z. Wang, C. J. Watson, R. R. Rostand, S. R. Witowski, D. H.
Powell, R. T. Kennedy; Analytical Chemistry 73, 5005 (2001)
[15] N. Corbally, D. Powell, K. F. Tipton; Biochemical Pharmacology 39, 1161
(1990)
132