Embed Size (px)
Citation preview

University of Groningen
A Bistable Gene Switch for Antibiotic BiosynthesisMehra, Sarika; Charaniya, Salim; Takano, Eriko; Hu, Wei-Shou
Published in:PLoS ONE
DOI:10.1371/journal.pone.0002724
IMPORTANT NOTE: You are advised to consult the publisher's version (publisher's PDF) if you wish to cite fromit. Please check the document version below.
Document VersionPublisher's PDF, also known as Version of record
Publication date:2008
Link to publication in University of Groningen/UMCG research database
Citation for published version (APA):Mehra, S., Charaniya, S., Takano, E., & Hu, W-S. (2008). A Bistable Gene Switch for AntibioticBiosynthesis: The Butyrolactone Regulon in Streptomyces coelicolor. PLoS ONE, 3(7), [2724]. DOI:10.1371/journal.pone.0002724
CopyrightOther than for strictly personal use, it is not permitted to download or to forward/distribute the text or part of it without the consent of theauthor(s) and/or copyright holder(s), unless the work is under an open content license (like Creative Commons).
Take-down policyIf you believe that this document breaches copyright please contact us providing details, and we will remove access to the work immediatelyand investigate your claim.
Downloaded from the University of Groningen/UMCG research database (Pure): http://www.rug.nl/research/portal. For technical reasons thenumber of authors shown on this cover page is limited to 10 maximum.
Download date: 19-06-2018
A Bistable Gene Switch for Antibiotic Biosynthesis: TheButyrolactone Regulon in Streptomyces coelicolorSarika Mehra1, Salim Charaniya2, Eriko Takano3, Wei-Shou Hu2*
1 Department of Chemical Engineering, Indian Institute of Technology Bombay, Powai, Mumbai, India, 2 Department of Chemical Engineering and Materials Science,
University of Minnesota, Minneapolis, Minnesota, United States of America, 3 Department of Microbiology, University of Groningen, Groningen, The Netherlands
Abstract
Many microorganisms, including bacteria of the class Streptomycetes, produce various secondary metabolites includingantibiotics to gain a competitive advantage in their natural habitat. The production of these compounds is highlycoordinated in a population to expedite accumulation to an effective concentration. Furthermore, as antibiotics are oftentoxic even to their producers, a coordinated production allows microbes to first arm themselves with a defense mechanismto resist their own antibiotics before production commences. One possible mechanism of coordination among individuals isthrough the production of signaling molecules. The c-butyrolactone system in Streptomyces coelicolor is a model of such asignaling system for secondary metabolite production. The accumulation of these signaling molecules triggers antibioticproduction in the population. A pair of repressor-amplifier proteins encoded by scbA and scbR mediates the production andaction of one particular c-butyrolactone, SCB1. Based on the proposed interactions of scbA and scbR, a mathematical modelwas constructed and used to explore the ability of this system to act as a robust genetic switch. Stability analysis shows thatthe butyrolactone system exhibits bistability and, in response to a threshold SCB1 concentration, can switch from an OFFstate to an ON state corresponding to the activation of genes in the cryptic type I polyketide synthase gene cluster, whichare responsible for production of the hypothetical polyketide. The switching time is inversely related to the inducerconcentration above the threshold, such that short pulses of low inducer concentration cannot switch on the system,suggesting its possible role in noise filtering. In contrast, secondary metabolite production can be triggered rapidly in apopulation of cells producing the butyrolactone signal due to the presence of an amplification loop in the system. S.coelicolor was perturbed experimentally by varying concentrations of SCB1, and the model simulations match theexperimental data well. Deciphering the complexity of this butyrolactone switch will provide valuable insights into howrobust and efficient systems can be designed using ‘‘simple’’ two-protein networks.
Citation: Mehra S, Charaniya S, Takano E, Hu W-S (2008) A Bistable Gene Switch for Antibiotic Biosynthesis: The Butyrolactone Regulon in Streptomycescoelicolor. PLoS ONE 3(7): e2724. doi:10.1371/journal.pone.0002724
Editor: Mark Isalan, Center for Genomic Regulation, Spain
Received May 2, 2008; Accepted June 5, 2008; Published July 16, 2008
Copyright: � 2008 Mehra et al. This is an open-access article distributed under the terms of the Creative Commons Attribution License, which permitsunrestricted use, distribution, and reproduction in any medium, provided the original author and source are credited.
Funding: This work was supported in part by a grant from the National Institutes of Health (GM55850). SM was supported by a dissertation fellowship fromGraduate School at University of Minnesota. SM also thanks the Industrial Research and Consultancy Center at Indian Institute of Technology, Bombay, whichsupported part of the research.
Competing Interests: The authors have declared that no competing interests exist.
* E-mail: [email protected]
Introduction
Many microorganisms make antibiotics that confer a compet-
itive advantage for their survival. Streptomycetes (genus Streptomy-
ces) in particular produce nearly 70% of antibiotics in clinical use
[1]. These are soil microorganisms, which in their natural habitat
grow in small colonies in an environment where the physical and
chemical conditions fluctuate constantly. The arsenal of antibiotics
helps them compete with other organisms in the soil environment
under stresses due to various adverse conditions. However,
accumulation of antibiotics to an effective concentration takes
time–a process that can be expedited if the entire population acts
in a synchronized manner. As antibiotics are often toxic even to
their producers, microbes first express a defense mechanism to
resist their own antibiotics before turning these weapons against
others. Coordination within members of a population is critical
because uncoordinated antibiotic production by some members
could be fatal for others of the same species in the population
which fail to equip themselves with a defense mechanism.
In a natural environment the transition from a favorable state to
an adverse state may not be as defined as under controlled
conditions in the laboratory. The environmental cues or signals
which indicate impending adverse conditions are likely to be
riddled with noise. Differentiating between these cues and noises is
vital for a coordinate response and thereby the survival of the
population. One possible mechanism of noise filtering is through a
mechanism of ‘‘voting’’ by members in the population. If a large
number of surrounding neighbors are positively responding to the
cue and begin to change their physiological state, then the cue is
more likely to be true. Conversely, if the number is small, then it is
highly probable that the cue is false; under such circumstance
those which have responded should return to the original state and
the responsive action taken by them will subside. One mechanism
of voting is by sensing and producing of signaling molecules. A
rapid accumulation of signaling molecules is an indication that a
large number of neighbors are producing the signaling molecule in
response to the environmental cue; this is likely to indicate the
right moment to produce antibiotics.
PLoS ONE | www.plosone.org 1 July 2008 | Volume 3 | Issue 7 | e2724

c-butyrolactone are a class of signaling molecules (for review,
see [2]) that were first ever identified from a microbe. Other classes
of signaling molecules have now been identified in many bacteria
including the homoserine lactones, which regulate many physio-
logical aspects like biofilm formation and have been shown to be
important in virulence in Pseudomonas aeruginosa (reviewed in [3]).
The existence of these multiple signaling molecules that are
widespread throughout the bacterial kingdom suggests the
importance of systems using such mechanism. In Streptomyces griseus
a c-butyrolactone that was first identified called the A-factor,
controls both antibiotic production and sporulation [4]. Since the
discovery of A-factor, c-butyrolactones have been identified in
many Streptomyces species [2]. Streptomyces coelicolor, the most widely
studied model organism of the Streptomyces genus, produces at least
three different c-butyrolactones. Among them, SCB1 is the best
characterized c-butyrolactone [5]. The addition of SCB1 to an
agar culture elicited localized antibiotic production in S. coelicolor.
Similar effects of c-butyrolactones on antibiotics production have
been observed in virginiamycin production in Streptomyces virginiae
[6], showdomycin and minimycin production in Streptomcyes
lavendulae FRI-5 [7,8], and in clavulanic acid production in
Streptomyces clavuligerus [9]. However, unlike A-factor in S. griseus,
most of these c-butyrolactones are involved only in the regulation
of antibiotic production and related aspects of secondary
metabolism and are not essential for morphological development.
A gene pair, scbA and scbR, is involved in the regulation of the
synthesis of c-butyrolactone, SCB1, in S. coelicolor. A transient
surge of the transcript of the two genes forebodes the rapid
increase of SCB1 and the synthesis of the antibiotics they regulate.
Homologues of ScbA and ScbR have been found in Streptomyces
virginiae, [6] Streptomyces fradiae, [10,11] Streptomyces lavendulae [12],
Streptomyces pristinaespiralis [13], Streptomyces clavuligerus [9], Streptomy-
ces lividans [14] and Kitasatospora setae, a non-streptomyces species of
actinomycetes [15], though the role of these homologues differs or
is not known in some species. This two-gene c-butyrolactone
signaling system entails a cytoplasmic receptor protein (ScbR) and
an amplifier protein (ScbA). The receptor protein ScbR has a c-
butyrolactone-binding domain at the C-terminal and a character-
istic DNA binding helix-turn-helix motif at its N-terminal [16,17].
ScbR directly binds to the promoter region of the gene encoding
the pathway-specific regulator (CpkO) of cryptic type I polyketide
synthase gene cluster (cpk) and represses its expression [18].
Binding of SCB1 to ScbR abolishes the repression of cpkO and
allows the expression of genes in cpk cluster. These results suggest
that sufficient levels of free ScbR are present during early
exponential phase to suppress expression of genes in cpk cluster.
Also, recent studies have strongly suggested that the amplifier
protein ScbA, a homologue of AfsA, a key enzyme in the
biosynthesis of A-factor [19], is likely to play an enzymatic role in
SCB1 synthesis in addition to a possible regulatory role [20].
Based on genetic and biochemical studies of mutants, Takano
and coworkers [21] have shown that ScbR autorepresses its own
transcription and that of scbA; binding of SCB1 to ScbR relieves
the repression of scbR and subsequent activation of scbA expression
enhances SCB1 synthesis. Integrating Takano’s original proposed
mechanism with recent findings of ScbR repression of CpkO and a
probable direct role of ScbA in SCB1 synthesis, a scenario of the
regulation of scbA/scbR system can be put together (depicted in
Figure 1). The molecular mechanism of scbA activation has not
been elucidated yet. In our model the original hypothesis of the
formation of an ScbA-ScbR complex and the activation of scbA
expression is adopted [20]. scbA and scbR, located at neighboring
positions (SCO6266 and SCO6265, respectively) on the S. coelicolor
chromosome, are divergently transcribed. ScbR, synthesized at
basal levels during early exponential phase, autorepresses its
expression by binding to its own promoter region (site OR), and
also represses scbA by binding at site OA. During exponential
growth phase, ScbR, which exists mostly in the DNA bound form
(no binding of SCB1 or ScbA), suppresses itself and also secondary
metabolite biosynthesis by repressing a positive regulator such as
CpkO. As the cells progress to transition stage of growth, an
increase in SCB1 concentration ensues a corresponding increase in
the level of the putative enzyme, ScbA. Upon exceeding a
threshold concentration, SCB1 binds to ScbR to form an SCB1-
ScbR complex. This binding of SCB1 to ScbR results in the loss of
DNA-binding activity of ScbR and a derepression of scbA and scbR.
The interaction of ScbA and ScbR to form an ScbA-ScbR
complex is hypothesized to activate transcription of scbA. This in
turn enhances SCB1 production [19,20], which reduces the
concentration of free ScbR. Consequently, the reduction in free
ScbR abolishes the repression of genes in the cpk cluster.
The proposed mechanism of scbA/scbR regulation is largely
consistent with observations reported. However, although a
qualitative description can be presented for the time sequence of
events of antibiotic synthesis regulation, it is not clear that there
exists a realistic combination of parameter values (concentration
range of components and binding constants), which enables the
hypothesized behavior of the system. Furthermore, as discussed
earlier, biologically one expects a good signaling system for
antibiotics biosynthesis to have a sharp response to the cue or
signaling molecule (in this case SCB1) and to be affected by growth
rate. To evaluate the possibility that such a model can indeed
provide a robust control of antibiotic synthesis we constructed a
mathematical model of the system. The parameter space relevant
to physiological conditions and beyond was surveyed to determine
the variety of dynamics that are possible with this system.
Figure 1. Schematic diagram of the ScbA/ScbR system. The twoDNA strands are shown in black. Gene scbA is present on the positivestrand (shown in red) whereas scbR is present on the opposite strand(shown in black). Protein ScbR (R) can bind to operator site OR to represstranscription from scbR gene. ScbR bound to OA represses transcriptionfrom scbA gene, whereas a protein-protein complex, ScbA-ScbR (AR)activates transcription from scbA gene. Blunt arrow indicates repressionand pointed arrow denotes activation. The two mRNAs, scbR and scbAare shown as r and a, respectively. Intracellular SCB1 (shown as C) isformed from glycerol derivates and b-keto acid by enzymatic action ofScbA (A). SCB1 can form a complex with ScbR protein (CR), and alsodiffuse out of the cell (Ce).doi:10.1371/journal.pone.0002724.g001
Antibiotic Gene Switch
PLoS ONE | www.plosone.org 2 July 2008 | Volume 3 | Issue 7 | e2724

Materials and Methods
Model and simulationsThe complete set of equations for the model is listed in Table 1.
The binding of repressor protein to the operator sites is at the root
of transcriptional regulation, as shown in Equations 1–3. ScbR (R)
protein, the auto-repressor, prevents its own transcription by
binding to the OR operator site and forming the OR-R complex as
depicted by Equation 1. In addition to binding to the operator site
OR, ScbR protein also forms complexes with ScbA (A) protein and
intracellular SCB1 (Ci) (Equations 4 and 5). Assuming the binding
reaction of OR is rapid and is essentially in equilibrium, the fraction
of unbound operator sitesOR½ �
OR,T½ � can be derived from Equation 7,
where KOR is the equilibrium dissociation constant k{OR
kOR. Applying
similar assumption of equilibrium, the ratiosOA½ � OA0{AR½ �OA,T½ � OA0 ,T½ � and
OA½ � OA0½ �OA,T½ � OA0 ,T½ � are derived as shown in Equations 8 and 9.
The transcript of scbR (r) as shown in Equation 10 is the balance
of transcription rate, degradation and dilution due to volume
expansion caused by growth. Degradation of scbR mRNA is
assumed to follow first order kinetics with rate constant kdr.
Transcription rate of scbR is considered proportional to the ratio of
unoccupied regulatory site to the total regulatory sites,OR½ �
OR,T½ �. The
balance of scbA (a) transcript (Equation 11) is similar to r except
that the repressor (R) and the activator ScbA-ScbR (AR) complex
bind to two separated operators, OA and OA9, respectively
(Equations 2 and 3). ScbA transcription rate is maximal when the
repressor site, OA, is unoccupied and the activator site, OA9, is
occupied by the AR complex. The first term of Equation 11 depicts
the transcription rate as being proportional to the fraction of
unoccupied OA sites and AR bound OA9 sites. In addition, there is a
basal rate of transcription when both the sites are unoccupied. The
balance of ScbR and ScbA proteins is described similarly
(Equations 12 and 13). The synthesis of ScbR protein is modeled
as proportional to the r concentration. Binding and unbinding of
ScbA and ScbR to each other and ScbR to SCB1 also contributes
to their balance. However, binding of ScbR to the operator site is
neglected since the concentration of operator sites is low. Note that
ScbR protein probably exists as a homo-dimer. However, since the
functional state of ScbR is always a dimer, the homo-dimer and
monomer states do not need to be considered separately. The
balance of SCB1-ScbR (CR) and ScbA-ScbR (AR) complexes is
given in Equations 14 and 15, respectively.
The production of the butyrolactone, SCB1, from a glycerol
derivative and b-keto acid derivative precursors (S) is assumed to
be proportional to the concentration of ScbA (first term in the rate
Equation 16). For the balance of SCB1 (Ci) (Equation 16) we
assume that its transport rate into or out of the cell is proportional
to the concentration difference across the cell membrane, as
denoted by the kse(Ci2Ce) term. Degradation of Ci is taken to be a
first order process. Equation 17 describes extracellular SCB1 (Ce).
The accumulation rate of extracellular SCB1 is affected by cell
density. Here r denotes the volume fraction of a single cell, and N0
is the initial number of cells.
Growth and transcriptional analysisS. coelicolor M145 (SCP12, SCP22) was used in this study and
was maintained as spore suspension prepared from agar plate
using R5 medium [22]. Liquid culture was initiated by inoculating
,107/ml of spores, pregerminated for 8 hr in 2xYT medium, into
50 ml flasks containing 10 ml of modified R5 medium [23].
Stainless steel coils were added to reduce pellet formation and
promote dispersed growth. Cultures were maintained at 30uC and
300 rpm in an orbital shaker and cell growth was measured
periodically by optical density (OD) at 450 nm. For RNA
extraction one-fifth volume of ice-cold stopping solution (5%
phenol in ethanol) was added to cell sample to prevent RNA
degradation [24]. Cell were harvested by centrifugation at 4uCand stored at 280uC until further use.
Total RNA extraction was performed as described in a previous
study [25]. Trace amount of genomic DNA (gDNA) in the RNA
samples was digested using Turbo DNA-freeTM kit (Ambion,
Austion, TX, USA). Reverse transcription was performed using
2 mg of total RNA, 1 mg of random hexamer primer (Amersham
Biosciences, Piscataway, NJ) and Superscript IIITM (Invitrogen,
Carlsbad, CA) according to manufacturer’s protocol. RNA was
digested by incubation with RNase H (Invitrogen) at 37uC for
20 min. cDNA was stored at 220uC until further use. Real-time
quantitative PCR was performed on Mx3000P instrument
(Stratagene, La Jolla, CA) using FullVelocityTM SYBRH Green
kit QPCR kit (Stratagene). Triplicate reactions were performed
and appropriate negative controls were included to confirm the
absence of residual gDNA in RNA samples, and primer-dimer
formation. The SYBR Green fluorescence was normalized by
ROX fluorescence and a threshold of 0.2 was applied on the
log(fluorescence) vs. cycle number plot to obtain Ct values. The Ct
value of SCO5820 (hrdB), the major vegetative sigma factor in S.
coelicolor was used for normalization. The 22DDCt method [26] was
used to compute relative changes in gene expression. The 0 min
sample withdrawn just before SCB1 addition was used as the
control sample.
Genome-wide temporal transcriptome data for M145 wild-type
in a batch liquid culture of modified R5 medium was obtained
from a public repository, Gene Expression Omnibus [27] (GEO
accession number: GSE8107) [28].
Steady state and dynamic analysis of mathematicalmodel
To obtain numerical solutions the differential equations were
solved using the stiff differential equations solvers ode23s in
MatlabH. The fixed points for the equations were computed in
Mathematica. Eigenvalues of the Jacobian were used to charac-
terize system stability at a given fixed point. The complete set of
kinetic parameters involved in the above model is listed in Table 2.
The range of values for each parameter, listed in Table 2, was
obtained from the literature [24,29,30,31,32,33,34,35] The
parameter range was explored to determine the capability of such
a system to show the desired system dynamics
Results
ScbA/ScbR system as a bistable switchThe bistability of scbA/scbR system was evaluated in this
investigation. The fixed points of the butyrolactone system in
terms of the concentration of ScbR protein ([R]) for different
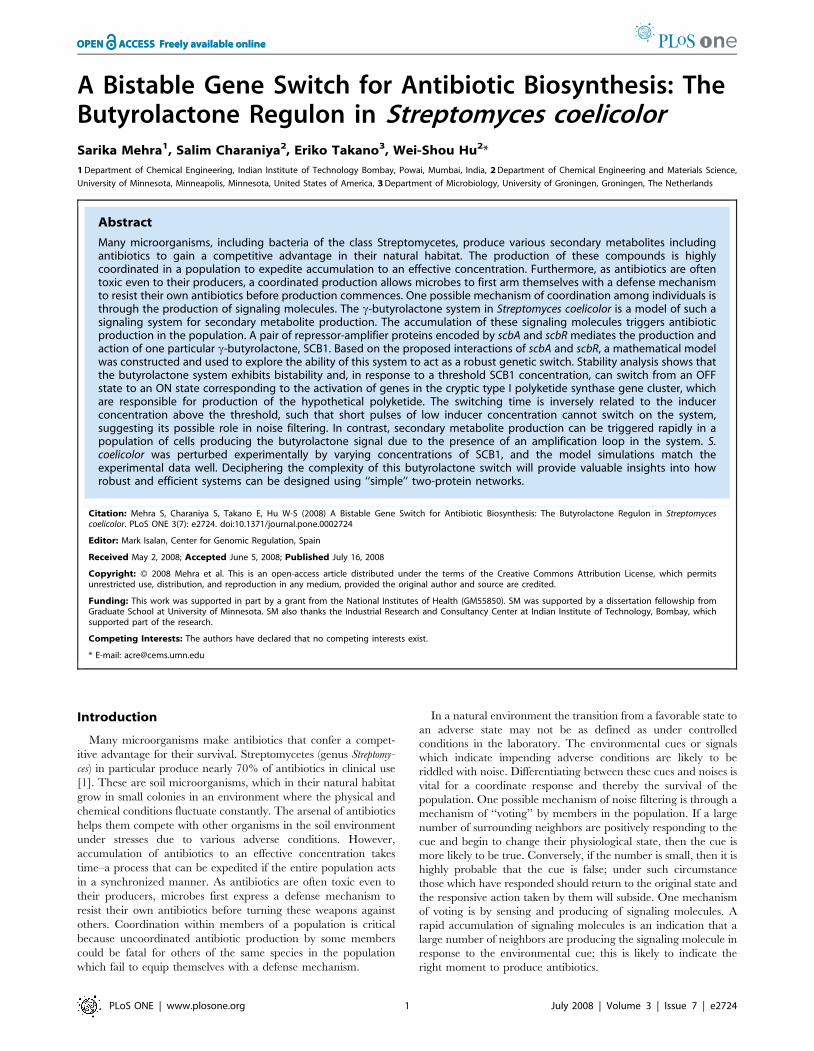
extracellular SCB1 concentrations (Ce) are shown in Figure 2.
Since ScbR protein is the direct effector of downstream activation
of the cpk gene cluster, the effect of Ce on ScbR is presented. To
determine these fixed points, Ce was kept at a constant level. The
stability of each fixed point is denoted by red (stable fixed point)
and blue (unstable steady point), respectively. The values of the
parameters used in this case along with their source are listed in
Table 2. At low concentrations of SCB1 (Ce,21 nM), only steady
states with a high [R] exist. As Ce increases beyond 21 nM three
fixed points of the system emerge until it reaches 76 nM. In two of
the regions the steady state is stable (denoted by red in Figure 2)
while in the other (blue) region the steady state is unstable. The
stable steady states with low free ScbR concentration ([R])
Antibiotic Gene Switch
PLoS ONE | www.plosone.org 3 July 2008 | Volume 3 | Issue 7 | e2724

Table 1. Equations for ScbA/ScbR Model.
Rate EquationsORzR '
kOR
k{OR
OR{R ð1Þ
OA0zAR 'kOAR
k{OAR
OA0{AR ð2Þ
OAzR 'kOA
k{OA
OA{R ð3Þ
AzR 'kbAR
k{bAR
AR ð4Þ
CizR 'kbCR
k{bCR
CR ð5Þ
SzA DCAkCprod
CizA ð6Þ
Equilibrium Relations OR½ �OR,T½ �~
KOR
KORz R½ � ð7Þ
OA½OA,T½ �
OA0{AR½ �OA0 ,T½ � ~
KOA1 AR½ �KOAz R½ �ð Þ KOA0z AR½ �ð Þ ð8Þ
OA½ �OA,T½ �
OA0½ �OA0 ,T½ �~
KOA1KOA0
KOAz R½ �ð Þ KOA0z AR½ �ð Þ ð9Þ
Mass Balance Equations d r½ �dt
~kmR:OR½ �
OR,T½ �{ kdrzmð Þ: r½ � ð10Þ
d a½ �dt
~kmA,max
OA½ �OA,T½ �
OA0{AR½ �OA0 ,T½ � zkmA,basal
OA½OA,T½ �
OA0½ �OA0 ,T½ �{ kdazmð Þ: a½ � ð11Þ
d R½ �dt
~kpR: r½ �{kbCR: C½ �: R½ �zk{bCR: CR½ �{kbAR: A½ �: R½ �zk{bAR: AR½ �{ kdRzmð Þ: R½ � ð12Þ
d A½ �dt
~kpA: a½ �{kbAR: A½ �: R½ �zk{bAR: AR½ �{ kdAzmð Þ: A½ � ð13Þ
d CR½ �dt
~kbCR: C½ �: R½ �{ k{bCRzkdCRzmð Þ: CR½ � ð14Þ
d AR½ �dt
~kbAR: A½ �: R½ �{ k{bARzkdARzmð Þ: AR½ � ð15Þ
d Ci½ �dt
~kC : A½ �{ kbCR: Ci½ �: R½ �{k{bCR: CR½ �ð Þ{kse: Ci½ �{ Ce½ �ð Þ{ kdCzmð Þ: Ci½ � ð16Þ
d Ce½ �dt
~kse:Nt Ci½ �{ Ce½ �ð Þ{ kdCð Þ: Ce½ � where Nt~N0emtr
1{N0emtrð17Þ
doi:10.1371/journal.pone.0002724.t001
Antibiotic Gene Switch
PLoS ONE | www.plosone.org 4 July 2008 | Volume 3 | Issue 7 | e2724

correspond to the ON state for expression of genes in cpk cluster,
while the states with high [R] represent an OFF state for
expression of cpk cluster genes. Cells can exist in either ON or
OFF steady states in this range of Ce concentration. At Ce.76 nM,
the high [R] steady state vanishes and only the ON state exists.
This distinction of ON and OFF states by ScbR concentration is in
accordance with the mechanism proposed by Takano et al. [18]. It
is important to note that free ScbR protein exists at primarily two
distinct states. It is either greater than 190 nM (OFF) or lower than
110 nM (ON). No intermediate values are admissible for [R], and
thus its behavior can be approximated as a two-state discrete
switch. The steady state profiles of all other species as a function of
SCB1 (Ce) concentration are shown in Figure S1.
Dynamics of Bistable SwitchThe steady state behavior of the system is notable for its classical
S-shaped curve with a region marked by the coexistence of two
stable steady states. Although the steady state is marked by a
specific level of free ScbR in Figure 2, each steady state is actually
characterized by a set of variables (concentration of ScbA protein
([A]), transcript of scbA (a) and scbR (r)). Cells are initially in an OFF
steady state with respect to cpk gene expression. When subjected to
a step increase to a different level of Ce, cells will exhibit different
transient behavior to reach a new steady state. If the concentration
of SCB1 is below the threshold concentration of 76 nM, cells will
remain in a steady state that is OFF. The ON state, in contrast, is
reached only if the Ce concentration is increased beyond the
bistable region (Ce.76 nM).
The dynamics of such a state-switch upon a step increase in Ce are
illustrated in Figure 3a. The system is initially at the high [R] steady
state corresponding to Ce = 0. A step change of Ce concentration to
50 nM (below switching threshold in the bistable region), 90 nM
(slightly higher than switching threshold) and 3000 nM (&switching
threshold), respectively was initiated at 10 hours as indicated in
Figure 3a. With a step increase in Ce to 50 nM (Figure 3a), [R]
decreases from its original steady state value briefly, but stays high in
the region of OFF state before it settles to a new, and OFF steady
state. At a step input just above the threshold value (90 nM), [R]
level decreases to the region of ON state gradually. For a step input
of 3000 nM, much greater than the threshold concentration,
switching happens much faster. The time span it takes to switch to
the ON state decreases as Ce increases.
In contrast, for cells which are initially at a ON steady state, a
step decrease of concentration causes the state to switch to OFF
Table 2. Parameter values and their range for which bistability is observed.
Parameter DescriptionRangetested
Estimated valuefor bistability Range of bistability Remarks/Reference Units
Min.evaluated
Max.evaluated
Equilibrium constants
KOR Binding of ScbR to OR 1025–10 8.82 5.80 9.50 [33,34] nM
KOA Binding of ScbR to OA 1025–10 7.44 7.30 8.30 nM
KOA9 Binding of ScbA-ScbR to OA9 1025–10 4.35 3.86 4.39 nM
Other rate constants
kmR scbR mRNA transcription 1024–10 1.861021 1.361021 2.061021 [29] s21
kmA scbA mRNA transcription 1024–10 4.561021 4.461021 5.061021 s21
kdr scbR mRNA degradation 6.661024–1.261022
1.761023 1.561023 2.561023 [24] s21
kda scbA mRNA degradation 6.661024–1.261022
1.861023 1.661023 1.961022 s21
kpR ScbR protein translation 1024–10 3.661021 2.561021 3.961021 [32,33] s21
kpA ScbA protein translation 1024–10 6.661022 6.461022 7.361022 s21
kdR ScbR protein degradation 1027–1021 4.061023 2.261023 6.761023 Half-life of secondsto hours [33]
s21
kdA ScbA protein degradation 1027–1021 1.861023 1.361023 1.861023 s21
m growth rate 0–1024 6.761025 0.0 1.061024 [35] s21
kC SCB1 synthesis 0–1.7 7.461021 6.761021 1.7 [30] s21
kdC SCB1 degradation 0–261024 6.761025 0.0 8.561023 Max. half life 1 hr. s21
kbCR Binding of ScbR and SCB1 to formSCB1-ScbR complex
1027–1021 8.361022 7.761022 1.761021 [34] nM21 s21
k2bCR Unbinding of SCB1-ScbR complex 0–103 1.76102 2.46101 1.86102 s21
kbAR Binding of ScbA and ScbR to formScbA-ScbR complex
1027–1021 8.361022 8.361022 1.261021 [34] nM21 s21
k2bAR Unbinding of ScbA-ScbR complex 0–103 6.36102 4.66102 6.36102 s21
kse SCB1 secretion 0–4.061021 8.361022 2.061022 9.761022 [31] s21
kdCR SCB1-ScbR degradation 1027–1021 6.261022 6.161022 1.761021 [33] s21
kdAR ScbA-ScbR degradation 1027–1021 6.261022 5.161022 6.961022 [33] s21
doi:10.1371/journal.pone.0002724.t002
Antibiotic Gene Switch
PLoS ONE | www.plosone.org 5 July 2008 | Volume 3 | Issue 7 | e2724
only if Ce decreases to below the low threshold value of 21 nM (at
the minimum bound of bistable region). This is illustrated by the
simulation results shown in Figure 3b. Cells initially at an ON
steady state, at different external SCB1 concentrations are
subjected to a step decrease to Ce = 0. They all evolve to the
OFF steady state. It is noted that the time period it takes to switch
OFF the system (reaching ScbR concentration of 272 nM, the
steady state level of [R] at Ce = 0) by removal of Ce is not drastically
different for different initial Ce concentrations.
Two characteristics of the bistable system are worth noting. First
of all, a sharp shift from the OFF state to the ON state is seen as Ce
increases from a low value to reach the threshold concentration of
76 nM. Secondly, hysteresis is evident. The Ce threshold for
switching OFF differs from that of switching ON. Cells initially in
the ON (low [R]) state stay ON even when Ce is decreased below
76 nM until it is reduced to below 21 nM. Accompanying the
hysteresis is a range of free ScbR concentrations separating the
two regions corresponding to OFF and ON states (shown in blue
in Figure 2). In this range of [R] the system is unstable, thus neither
ON nor OFF. Such an S-shaped curve shown in Figure 2 is in
contrast to a monotonic curve for which such a region separating
ON and OFF states would have been an intermediate state.
The results shown in Figure 3a illustrate that the time period for
switching ON is affected by the magnitude of step change in Ce.
We hypothesize that SCB1 serves as a signal for synchronization
by a voting mechanism. A strong and persistent signal indicates a
‘‘majority’’ response by surrounding population and marks a
positive signal and is interpreted as a switch indicator even at a
shorter duration. Conversely a weaker signal will be treated as true
only if it persists over a longer duration. To corroborate this idea,
the duration of exposure to high Ce was varied before it was
reduced to 50 nM, a concentration that is below the ON-threshold
but is in the bistable region. After Ce was decreased to 50 nM the
system may return to OFF state or proceed to the ON state. For
each such input profile, the minimum duration of the pulse that is
required to switch the system to ON state is determined. Figure 3c
shows a plot of this duration with respect to the step input
concentration of SCB1. The minimum duration of signal molecule
exposure needed for the system to switch decreases sharply from
48 hours at 90 nM to 7 hours at 300 nM and less than 2 hours at
3000 nM.
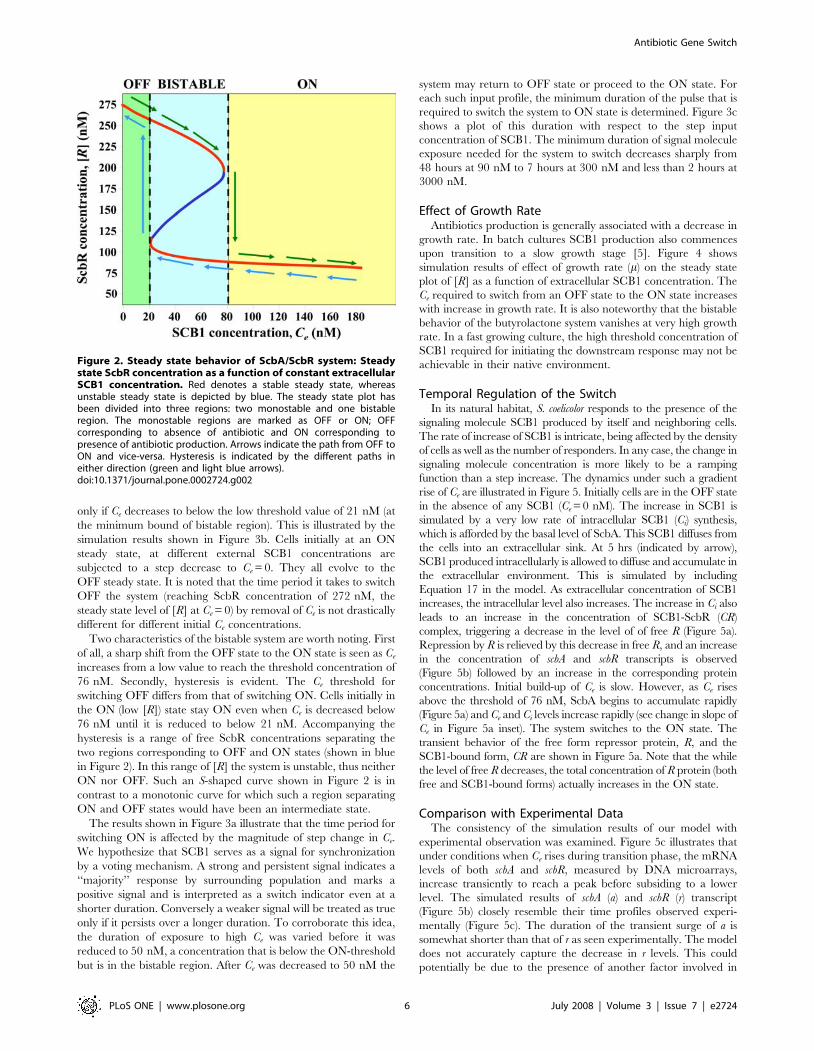
Effect of Growth RateAntibiotics production is generally associated with a decrease in
growth rate. In batch cultures SCB1 production also commences
upon transition to a slow growth stage [5]. Figure 4 shows
simulation results of effect of growth rate (m) on the steady state
plot of [R] as a function of extracellular SCB1 concentration. The
Ce required to switch from an OFF state to the ON state increases
with increase in growth rate. It is also noteworthy that the bistable
behavior of the butyrolactone system vanishes at very high growth
rate. In a fast growing culture, the high threshold concentration of
SCB1 required for initiating the downstream response may not be
achievable in their native environment.
Temporal Regulation of the SwitchIn its natural habitat, S. coelicolor responds to the presence of the
signaling molecule SCB1 produced by itself and neighboring cells.
The rate of increase of SCB1 is intricate, being affected by the density
of cells as well as the number of responders. In any case, the change in
signaling molecule concentration is more likely to be a ramping
function than a step increase. The dynamics under such a gradient
rise of Ce are illustrated in Figure 5. Initially cells are in the OFF state
in the absence of any SCB1 (Ce = 0 nM). The increase in SCB1 is
simulated by a very low rate of intracellular SCB1 (Ci) synthesis,
which is afforded by the basal level of ScbA. This SCB1 diffuses from
the cells into an extracellular sink. At 5 hrs (indicated by arrow),
SCB1 produced intracellularly is allowed to diffuse and accumulate in
the extracellular environment. This is simulated by including
Equation 17 in the model. As extracellular concentration of SCB1
increases, the intracellular level also increases. The increase in Ci also
leads to an increase in the concentration of SCB1-ScbR (CR)
complex, triggering a decrease in the level of of free R (Figure 5a).
Repression by R is relieved by this decrease in free R, and an increase
in the concentration of scbA and scbR transcripts is observed
(Figure 5b) followed by an increase in the corresponding protein
concentrations. Initial build-up of Ce is slow. However, as Ce rises
above the threshold of 76 nM, ScbA begins to accumulate rapidly
(Figure 5a) and Ce and Ci levels increase rapidly (see change in slope of
Ce in Figure 5a inset). The system switches to the ON state. The
transient behavior of the free form repressor protein, R, and the
SCB1-bound form, CR are shown in Figure 5a. Note that the while
the level of free R decreases, the total concentration of R protein (both
free and SCB1-bound forms) actually increases in the ON state.
Comparison with Experimental DataThe consistency of the simulation results of our model with
experimental observation was examined. Figure 5c illustrates that
under conditions when Ce rises during transition phase, the mRNA
levels of both scbA and scbR, measured by DNA microarrays,
increase transiently to reach a peak before subsiding to a lower
level. The simulated results of scbA (a) and scbR (r) transcript
(Figure 5b) closely resemble their time profiles observed experi-
mentally (Figure 5c). The duration of the transient surge of a is
somewhat shorter than that of r as seen experimentally. The model
does not accurately capture the decrease in r levels. This could
potentially be due to the presence of another factor involved in
Figure 2. Steady state behavior of ScbA/ScbR system: Steadystate ScbR concentration as a function of constant extracellularSCB1 concentration. Red denotes a stable steady state, whereasunstable steady state is depicted by blue. The steady state plot hasbeen divided into three regions: two monostable and one bistableregion. The monostable regions are marked as OFF or ON; OFFcorresponding to absence of antibiotic and ON corresponding topresence of antibiotic production. Arrows indicate the path from OFF toON and vice-versa. Hysteresis is indicated by the different paths ineither direction (green and light blue arrows).doi:10.1371/journal.pone.0002724.g002
Antibiotic Gene Switch
PLoS ONE | www.plosone.org 6 July 2008 | Volume 3 | Issue 7 | e2724

degrading the transcript in stationary phase. The experimental
profiles of r in a scbR deletion mutant (M752) [21] support such a
hypothesis.
To further validate the model, a step increase in SCB1
concentration in an early stage culture prior to scbA expression,
was carried out and the results were compared to model
prediction. To five exponentially growing (OD450,0.8) cultures
of wild-type (M145), SCB1 was added at concentrations of 0, 5,
25, 50, and 300 nM, respectively. Thereafter samples were taken
at 0, 30 and 120 min and probed for transcript levels of scbA, scbR,
and gene cpkI (SCO6282). cpkI is located in the cpk cluster whose
expression is directly controlled by the pathway-specific activator,
CpkO [18]. Thus, cpkI transcript serves as an indicator of the
downstream effect of the switch.
cpkI transcript levels observed at two different time points after
addition of SCB1 at different concentrations are shown in
Figure 6a. At high SCB1 concentrations (Ce = 50 and 300 nM),
cpkI transcript level was two to four orders of magnitude higher
than that observed low SCB1 concentrations (Ce = 0 and 5 nM).
Transcripts of both scbR and scbA show a similar increasing trend
with increasing SCB1 concentration (Figure 6b and c), although
the difference between high and low SCB1 concentrations is not as
pronounced as the gene cpkI that they regulate. It is also interesting
to note that SCB1 addition has a more pronounced effect on scbR
transcript compared to scbA transcript, particularly at low SCB1
concentrations (,100 nM). The simulation results predicting
similar trends for both scbR and scbA are shown in insets in
Figure 6b and c, respectively.
Figure 4. Effect of growth rate on steady states of ScbA/ScbRsystem. The specific growth rate is varied from 0 to 0.006 min21 insteps of 0.001. For each growth rate, the steady state concentrations aredetermined for increasing extracellular SCB1 concentrations (Ce). Stablesteady states are denoted in red and unstable in blue.doi:10.1371/journal.pone.0002724.g004
Figure 3. Dynamics of switch between OFF and ON states. (A)Switch from OFF to ON state. Dynamics of ScbR protein in response to astep input of extracellular SCB1 concentration of 50 nM (dashed line),90 nM (dotted line), 300 nM (dashed dotted line), and 3000 nM (solidline). The step input is applied at 10 hrs as marked by arrow. The systemis initially at steady state corresponding to absence of SCB1 in theextracellular medium (Ce = 0 nM). (B) Switch from ON to OFF state. Thesystem is at ON state corresponding to extracellular SCB1 concentrationof 50 nM, 90 nM, 300 nM and 3000 nM. At 10 hrs Ce is reduced to zeroand the dynamics towards OFF steady state are observed. (C) Minimum
duration of step change in SCB1 concentration to switch ON thesystem. The profile of the step input is shown in the inset. Initially cellsare at steady state corresponding to Ce = 0. After exposing to SCB1 atdifferent concentrations for a fixed time, SCB1 concentration is reducedto 50 nM. The minimum duration of the pulse that allows the cells toattain the ON state even when step input is decreased to 50 nM isshown.doi:10.1371/journal.pone.0002724.g003
Antibiotic Gene Switch
PLoS ONE | www.plosone.org 7 July 2008 | Volume 3 | Issue 7 | e2724

Figure 5. Dynamics of system in response to extracellularaccumulation of SCB1. Arrow indicates the time when accumulationof SCB1 was allowed. The dynamics of Ce was modeled as Equation 17in Table 1. (A) Concentration profiles of ScbR (R) (black), ScbA (A) (red),SCB1-ScbR complex (CR) (green), intracellular and extracellular SCB1 (Ci,Ce) (blue). (B) mRNA profiles of scbA (a) (red) and scbR (r) (black).r = 0.001 was used for this simulation. (C) Transcript profiles of scbA (a)(red square) and scbR (r) (black triangle) as measured from microarrayexperiments. The growth curve is also shown (black circle).doi:10.1371/journal.pone.0002724.g005
Figure 6. Perturbation of system by exogenous addition ofSCB1 at different concentrations. Comparison of experimentalresults with simulations. SCB1 was added at 0, 5, 25, 50 and 300 nM toexponentially growing liquid cultures of M145 at OD450,0.8. Thetranscript levels of (A) cpkI, (B) scbR and (C) scbA were measured at30 min (triangles) and 120 min (squares) after addition of SCB1, usingreal-time quantitative PCR. The threshold cycle (Ct) values at 30 and120 min were normalized with that Ct values at 0 min (SCB1 = 0 nM).Simulation results at various time points in response to SCB1 step inputof 0, 20, 100, 200 and 1200 nM, are shown in inset of panel (A) ScbRprotein, (B) scbR transcript and (C) scbA transcript.doi:10.1371/journal.pone.0002724.g006
Antibiotic Gene Switch
PLoS ONE | www.plosone.org 8 July 2008 | Volume 3 | Issue 7 | e2724

Discussion
Several important physiological processes operate in discrete
states [36,37,38]. Notable examples include sporulation vs.
vegetative growth for bacteria, differentiation vs. self-renewal state
of stem cells, and lysogeny vs. lytic state for bacteriophage lambda.
At any given time, a cell can only exist in either of the two states.
This is in contrast to the vast majority of physiological processes
where, in addition to a ‘‘high’’ activity state and a ‘‘low’’ activity
state, a continuum of intermediate states exists between the two
extremes [39]. In contrast to this graded response, the transition
from one state to the other in the discrete system is discontinuous
like a switch, going from one to the other without a true
intermediate state.
The discrete states arise as a consequence of the genetic and
biochemical network responding to environmental and develop-
mental signals. The binary states can often be represented in terms
of the concentration of a regulatory effector, in response to stimuli.
Once the level of the effector reaches a certain threshold level, the
subsequent reactions switch the cellular process from one
phenotype to the other.
The physiological states of secondary metabolite synthesis,
including antibiotics production, and vegetative rapid growth are
traditionally thought of as disjunct states; secondary metabolite
production is suppressed in rapidly growing cells until growth ceases
or at least drastically slows down. On agar plates, secondary
metabolism often coincides with sporulation for bacteria such as S.
coelicolor. The transition from vegetative growth (OFF state) to
secondary metabolite production (ON state) is likely to behave like a
switch, as is sporulation. Due to the toxic nature of some secondary
metabolites, such as antibiotics, it is essential that the ON state be
synchronized among individuals in the community. c-butyrolac-
tones potentially act as quorum sensing type of molecules in
Streptomyces spp. to regulate the onset of secondary metabolite
synthesis. We have examined the regulation of c-butyrolactone
SCB1 and the expression of genes in cryptic type I polyketide cluster
in S. coelicolor by the gene pair scbA and scbR. In response to an
increase in concentration of signaling molecule, SCB1, the free
repressor protein (R) transits from a high concentration that
represents OFF state to a low concentration that corresponds to
ON state.
A switch-like response to signaling molecule concentration can
be achieved either by ultrasensitivity or bistability in the
relationship between regulatory repressor protein and the
signaling molecule. In the former case, the two states are separated
by a threshold value of the signaling molecule; on one side of the
threshold the system is in the OFF state, on the other it is in the
ON state. In the latter case the ON and OFF states reside in two
distinct regions of high and low concentration of the regulatory
protein (R), respectively. Between the two monostable states exists
a bistable region in which the system can be in either the ON state
or the OFF state depending on the initial condition. In the first
scenario, the case of ultrasensitivity, a tiny difference in (Rcrit, Ccrit)
separates the two states; upon crossing the critical point the
systems switches from one state to another. Such a system will
require every component involved to be highly fine-tuned with
little leeway for fluctuations. In contrast, a bistable system exhibits
hysteresis; the path of switching ON from an OFF state is different
from that of switching OFF from an ON state. With a bistable
system, both the effector (R) and signaling molecule (C)
concentrations for ON and OFF states are well separated, giving
rise to the switch behavior where the ON and OFF states are
separated by a region of bistability. The simulation results
demonstrate that the switch to an ON state from OFF requires
an exposure to concentrations beyond the bistable region.
Furthermore, as the growth rate increases the concentration of
signaling molecule required to switch ON increases (Figure 4). At
very high growth rate the bistable behavior disappears (data not
shown). The simulated dynamic behavior of scbA and scbR in a
liquid culture resembles that of experimental observation.
Consistent with the voting hypothesis, i.e. a strong and fast rise in
signaling molecule concentration is indicative of a positive signal as
opposed to noise, the minimum duration of exposure to signaling
molecule decreases with increasing concentration (Figure 3c). The
bistable plot of [R] vs. Ce shown in Figure 2 illustrates that, for a
system initially at an OFF state, as SCB1 concentration increases it
will cross over to an ON state at Ce = 76 nM. The experimental
results shown in Figure 6 are qualitatively consistently with model
predictions. Since the organism triggers secondary metabolite
synthesis at high cell concentrations as cells enter a late transition
stage, the exogenous SCB1 addition experiment was carried out in
early stage of the culture. The addition of SCB1 to exponentially
growing cultures induced transcription of a gene encoding a
putative reductase enzyme in the cpk cluster. The induction was
indeed concentration-dependent and no other exogenous factors
were needed. Although there is no experimental evidence on
quantitative expression levels of the repressor protein R during the
culture period, a 2D-gel-based proteomics study identified R protein
from cultures harvested in the transition stage [40] (http://
dbkgroup.org/s_coeli/referencegel/index.php). The growth rate
of S. coelicolor at the time of SCB1 addition was substantially higher
than that used for simulation in Figure 2. That may have
contributed to the difference in numerical values between
experimental observation and simulation results. The bistability
shown in Figure 2 also implies that for a system originally in an ON
state, reducing Ce should increase the concentration of free ScbR
protein gradually until Ce reaches below 21 nM. At this point, the
switch should turn OFF accompanied by a sharp increase in R.
However, the reversibility of a bistable system is not assured, as once
the system is turned ON, additional biological processes may
become active to prevent the reversal via the original route.
Recognizing the importance of bistability in providing a robust
switch system, we searched the parameter space within the
constraints of literature values of parameters and identified a range
in which bistability of R in terms of Ce is realizable. The value of
each parameter was varied individually over a range while keeping
all the other parameters constant at the nominal value listed in
Table 2. For each new parameter value, the steady state response to
varying levels of external inducer concentration, Ce was determined.
Table 2 summarizes the range of values for each parameter within
which bistability is observed. Detailed plots for each parameter are
shown in Figure S2. The system exhibits a region of bistability
within at least 40% variation in the value for all but five of the
parameters. All five of the most sensitive parameters are involved in
modulating the concentration of ScbA protein: transcription and
translation, mRNA and protein degradation, and binding of A to R
to form the AR complex. The bistability behavior appears to be
dependent on a delicate balance of these reactions to maintain the
level of ScbA protein in a range. Excess of ScbA protein can lead to
hyperproduction of SCB1 causing the cells to always exist in the ON
state. This is reflected by a decrease in the switching threshold from
OFF to ON state as kmA or kpA are increased. Similarly, as KOA
increases, the increasing repression of scbA transcript by R keeps the
cells at the OFF state.
Although the system may be sensitive to individual parameter
variations, it is robust in the sense that bistability can be exhibited
over a wide range of parameter values. Individual parameters can
be varied over a much wider range when two parameters are
Antibiotic Gene Switch
PLoS ONE | www.plosone.org 9 July 2008 | Volume 3 | Issue 7 | e2724

varied in combination. For example when parameters kmR and kdr
are varied individually less than 30% variation is allowed.
However, when varied in combination such that the ratio of the
two parameters is unchanged, five-fold variation in each
parameter still yields similar results (See Figure S3 for various
such combinations of parameters).
Bistability as a possible mechanism of realizing the switch
behavior in biological systems has been discussed previously for
lambda phage lysis-lysogeny [41], the sinI-sinR and sigmaF
networks in Bacillus subtilis [32,42], the lac operon in E. coli [43,44]
and for the sonic hedgehog (Shh) network that controls a number
of critical cellular developmental decisions between distinct fates in
vertebrates [45]. In these studies, as well as in the current study, a
classical reaction engineering approach was taken to demonstrate
that the equations describing the system indeed give rise to a
behavior where two regions of monostable steady states are
separated by a segment of multiple steady states, as originally
depicted for continuous stirred tank reactors by Aris and
Amundson five decades ago [46,47]. It should be noted that the
term bistability is also used in a different context in describing the
experimental observation of different developmental patterns
coexisting in a population [38,48], such as the subpopulation of
B. subtilis existing in competence state in a stationary culture [49].
These phenomena of coexisting stable subpopulations may have
much in common with the bistable behavior illustrated mathe-
matically and reported in this and other studies; however, whether
all of them exhibit multiple steady states is yet to be examined.
There has been discussion on the general architecture of a
genetic network that would give rise to a switch-like behavior [50]).
A two-gene repressor system [51,52], where each of the two genes
negatively regulates the synthesis of the other; co-operativity,
where binding of one molecule improves the binding of second
molecule [51]; and positive feedback [53] have all been shown to
potentially enable bistability. The scbA/scbR system in S. coelicolor
has both positive feedback and negative feedback loops. The OFF
steady state is characterized by high levels of free ScbR protein
and basal levels of ScbA protein. In the ON steady state, ScbA is
present at greater levels, leading to self-activation and subsequent
increase in SCB1 production. (The binding of SCB1 and ScbA to
ScbR further suppresses its repressor activity.) The dominant
interactions in each of the steady states are shown in Figure S4.
Although the working model of scbA/scbR system hypothesized
the formation of ScbA-ScbR complex that activates SCB1 synthesis,
no experimental evidence for an interaction between ScbA and
ScbR proteins has been reported. Also, recent studies strongly
suggest an enzymatic role of ScbA in SCB1 synthesis. We
formulated a simplified model, where ScbA protein does not form
a complex with ScbR, but instead activates its own transcription by
binding to its operator region (Text S1). The existence of three fixed
points was demonstrated analytically for this simplified system.
Further, the fixed points of the system for this model were
determined for a set of parameter values and their stability was
examined. The plot of [R] as a function of Ce (Figure S5) bears many
similarities with the bistable plot of the working model (Figure 2).
The system exhibits hysteretic bistability–free ScbR protein exists
primarily in two different steady state zones corresponding to ON
and OFF state of expression of cpk cluster genes. Thus, the
formation of ScbA-ScbR complex is not a strict requirement for
bistable behavior of this system. However, it is important to note
that a direct or indirect positive feedback of ScbA is essential for the
switch-like behavior. Interestingly, evidence for the role of ScbA in
self-activation has been reported previously [21].
c-butyrolactones are widespread in Streptomyces species and are
shown to be important in the regulation of antibiotic production.
The gene network comprising two-genes and the c-butyrolactone
signaling molecule as the central element of the onset of antibiotic
biosynthesis also appears to be common among those species
investigated. Some features of this genetic network are conserved
such as the loss of DNA-binding activity of repressor protein upon
forming a complex with the signaling molecule. However, the
dynamic behavior of this two-gene system varies widely in different
Streptomyces species. The transient rise and fall of scbA and scbR
transcript levels seen in S. coelicolor is not observed in all Streptomyces
species. In S. virginaie the expression of barA and barB (the
homologues of scbA and scbR, respectively) rises monotonically,
coinciding with a sharp increase in butyrolactone concentration
[6,54] and turning ON the production of the antibiotic
virginiamycin. It is conceivable that the barA/barB network also
exhibits bistable behavior and acts as a switch, although this has
not been shown. At least it is clear that the basic two-gene
framework of scbA and scbR, with one autorepressor and one
amplifier acting via production of the signaling molecule, is rather
versatile and capable of producing different dynamic behaviors.
Using the model we developed and expanding the parameter
value from that reported in this study, it can be shown that the
system is indeed capable of generating many different kinds of
dynamics in addition to bistability, including graded, pulsed or
oscillatory responses to extracellular butyrolactone, which may all
result from responses of the bacteria to multiple environmental
situations. The present model could form a basis for deciphering
the ubiquitous butyrolactone system in other Streptomyces species. In
addition, similar models can be envisaged for several signaling
molecule-based systems found in many bacteria, which have been
shown to play an increasingly important regulatory role in
protecting the organism against a harsh environment, or for
pathogenicity, or for inter- and intra-species communication.
Supporting Information
Figure S1 Steady state concentration of species in the ScbA/
ScbR network for constant extracellular SCB1. The stable and
unstable steady states are represented by red and blue,
respectively. The steady state concentrations of (A) scbR mRNA
(r), (B) scbA mRNA (a), (C) ScbA protein, A, (D) SCB1-ScbR
complex, (CR), (E) ScbA-ScbR complex (AR); (F) intracellular
SCB1 (Ci) are plotted.
Found at: doi:10.1371/journal.pone.0002724.s001 (0.22 MB
PDF)
Figure S2 Effect of parameter perturbation on steady state
response of butyrolactone system to constant extracellular SCB1.
Each plot shows the results of simulation in which only one parameter
is varied, keeping the rest constant at the nominal values listed in
Table 2. The values of the parameter being varied are shown next to
the respective steady state plot. The dashed line in each plot
corresponds to the nominal parameter values. The parameter being
varied is (A) KOR, (B) KOA, (C) KOA9, (D) kmR (E) kmA (F) kdr (G) kda
(H) kpR (I) kpA (J) kdR (K) kdA (L) kC (M) kdC (N) kbAR (O) k2bAR (P)
kbCR (Q) k2bCR (R) kdCR (S) kdAR (T) kse
Found at: doi:10.1371/journal.pone.0002724.s002 (0.15 MB
PDF)
Figure S3 Effect of two parameter perturbation. For each
simulation, two parameters are varied such that their ratio is
constant. Dotted line corresponds to the nominal parameter values
in Table 2. The two parameter combinations are (A) kmR/kdr,
ratio of transcriptional rate constant to degradation rate constant
of scbR mRNA. (B) kmA/kda, ratio of transcriptional rate constant
to degradation rate constant of scbA mRNA, (C) kpR/kdR, ratio of
Antibiotic Gene Switch
PLoS ONE | www.plosone.org 10 July 2008 | Volume 3 | Issue 7 | e2724

translational rate constant to degradation rate constant of ScbR
protein, (D) KOA/kmA, ratio of equilibrium binding constant of
ScbR to OA operator to transcriptional rate constant of scbA
mRNA and (E) kbCR/kdCR, ratio of rate constant for dissociation
of CR complex to degradation rate constant of CR complex.
Found at: doi:10.1371/journal.pone.0002724.s003 (0.53 MB
PDF)
Figure S4 Physical description of the two steady states. (A) OFF
state corresponding to high [R] or low [A]; (B) ON state
corresponding to the low [R]. The solid line represents the
dominant reactions in each steady state. Dashed lines show
otherwise.
Found at: doi:10.1371/journal.pone.0002724.s004 (0.02 MB
PDF)
Figure S5 Steady state behavior of simplified ScbA/ScbR system.
The steady state concentration of ScbR protein, [R], is plotted as a
function of extracellular SCB1 concentration, Ce. (A) Steady state
plot when basal transcription rate of scbA is neglected. (B) Steady
state plot when scbA is transcribed at a basal rate. Stable steady
states are denoted in red, while unstable steady states are marked
in blue. Open circles denote the steady state corresponding to
[A] = 0, whereas filled circles denote the steady states correspond-
ing to [A]?0. The transition point beyond which the fixed state
corresponding to [A] = 0 becomes unstable is marked by an arrow.
At this point, one of the fixed roots corresponding to also
disappears.
Found at: doi:10.1371/journal.pone.0002724.s005 (0.04 MB
PDF)
Text S1 Analytical steady state analysis for a simplified ScbA/
ScbR system
Found at: doi:10.1371/journal.pone.0002724.s006 (0.14 MB
DOC)
Acknowledgments
We thank Professor Ramkrishna Doraiswami and Dr. Rainer Breitling for
comments and useful discussions. SCB1 was a generous gift from Professor
Takuya Nihira at Osaka University, Japan.
Author Contributions
Conceived and designed the experiments: SM. Performed the experiments:
SM SC. Analyzed the data: SM. Wrote the paper: SM. Supervised the
study WSH. Participated in discussions and manuscript writing: WSH.
Developed the model: SM. Carried out the simulations and drafted the
manuscript: SM. Carried out the experiments and participated in
manuscript writing: SC. Participated in critical discussions: ET. Provided
valuable suggestions for the study: ET.
References
1. Challis GL, Hopwood DA (2003) Synergy and contingency as driving forces for
the evolution of multiple secondary metabolite production by Streptomyces
species. Proc Natl Acad Sci U S A 100 Suppl 2: 14555–14561.
2. Takano E (2006) gamma-Butyrolactones: Streptomyces signalling molecules
regulating antibiotic production and differentiation. Curr Opin Microbiol 9:
287–294.
3. Hughes DT, Sperandio V (2008) Inter-kingdom signalling: communication
between bacteria and their hosts. Nat Rev Microbiol 6: 111–120.
4. Horinouchi S (2002) A microbial hormone, A-factor, as a master switch for
morphological differentiation and secondary metabolism in Streptomyces
griseus. Front Biosci 7: d2045–2057.
5. Takano E, Nihira T, Hara Y, Jones JJ, Gershater CJ, et al. (2000) Purification
and structural determination of SCB1, a gamma-butyrolactone that elicits
antibiotic production in Streptomyces coelicolor A3(2). J Biol Chem 275:
11010–11016.
6. Kinoshita H, Ipposhi H, Okamoto S, Nakano H, Nihira T, et al. (1997)
Butyrolactone autoregulator receptor protein (BarA) as a transcriptional
regulator in Streptomyces virginiae. J Bacteriol 179: 6986–6993.
7. Kitani S, Yamada Y, Nihira T (2001) Gene replacement analysis of the
butyrolactone autoregulator receptor (FarA) reveals that FarA acts as a Novel
regulator in secondary metabolism of Streptomyces lavendulae FRI-5. J Bacteriol
183: 4357–4363.
8. Ruengjitchatchawalya M, Nihira T, Yamada Y (1995) Purification and
characterization of the IM-2-binding protein from Streptomyces sp. strain
FRI-5. J Bacteriol 177: 551–557.
9. Kim HS, Lee YJ, Lee CK, Choi SU, Yeo SH, et al. (2004) Cloning and
characterization of a gene encoding the gamma-butyrolactone autoregulator
receptor from Streptomyces clavuligerus. Arch Microbiol 182: 44–50.
10. Bate N, Butler AR, Gandecha AR, Cundliffe E (1999) Multiple regulatory genes
in the tylosin biosynthetic cluster of Streptomyces fradiae. Chem Biol 6:
617–624.
11. Bignell DR, Bate N, Cundliffe E (2007) Regulation of tylosin production: role of
a TylP-interactive ligand. Mol Microbiol 63: 838–847.
12. Kitani S, Kinoshita H, Nihira T, Yamada Y (1999) In vitro analysis of the
butyrolactone autoregulator receptor protein (FarA) of Streptomyces lavendulae
FRI-5 reveals that FarA acts as a DNA-binding transcriptional regulator that
controls its own synthesis. J Bacteriol 181: 5081–5084.
13. Folcher M, Gaillard H, Nguyen LT, Nguyen KT, Lacroix P, et al. (2001)
Pleiotropic functions of a Streptomyces pristinaespiralis autoregulator receptor
in development, antibiotic biosynthesis, and expression of a superoxide
dismutase. J Biol Chem 276: 44297–44306.
14. Butler MJ, Takano E, Bruheim P, Jovetic S, Marinelli F, et al. (2003) Deletion of
scbA enhances antibiotic production in Streptomyces lividans. Appl Microbiol
Biotechnol 61: 512–516.
15. Choi SU, Lee CK, Hwang YI, Kinoshita H, Nihira T (2004) Cloning and
functional analysis by gene disruption of a gene encoding a gamma-
butyrolactone autoregulator receptor from Kitasatospora setae. J Bacteriol
186: 3423–3430.
16. Onaka H, Sugiyama M, Horinouchi S (1997) A mutation at proline-115 in the
A-factor receptor protein of Streptomyces griseus abolishes DNA-binding ability
but not ligand-binding ability. J Bacteriol 179: 2748–2752.
17. Natsume R, Ohnishi Y, Senda T, Horinouchi S (2004) Crystal structure of a
gamma-butyrolactone autoregulator receptor protein in Streptomyces coelicolor
A3(2). J Mol Biol 336: 409–419.
18. Takano E, Kinoshita H, Mersinias V, Bucca G, Hotchkiss G, et al. (2005) A
bacterial hormone (the SCB1) directly controls the expression of a pathway-
specific regulatory gene in the cryptic type I polyketide biosynthetic gene cluster
of Streptomyces coelicolor. Mol Microbiol 56: 465–479.
19. Kato JY, Funa N, Watanabe H, Ohnishi Y, Horinouchi S (2007) Biosynthesis of
gamma-butyrolactone autoregulators that switch on secondary metabolism and
morphological development in Streptomyces. Proc Natl Acad Sci U S A 104:
2378–2383.
20. Hsiao NH, Soding J, Linke D, Lange C, Hertweck C, et al. (2007) ScbA from
Streptomyces coelicolor A3(2) has homology to fatty acid synthases and is able to
synthesize gamma-butyrolactones. Microbiology 153: 1394–1404.
21. Takano E, Chakraburtty R, Nihira T, Yamada Y, Bibb MJ (2001) A complex
role for the gamma-butyrolactone SCB1 in regulating antibiotic production in
Streptomyces coelicolor A3(2). Mol Microbiol 41: 1015–1028.
22. Kierser T, Bibb MJ, Buttner MJ, Chater KF, Hopwood DA (2000) Practical
Streptomyces Genetics: John Innes Foundation. 613 p.
23. Huang J, Lih CJ, Pan KH, Cohen SN (2001) Global analysis of growth phase
responsive gene expression and regulation of antibiotic biosynthetic pathways in
Streptomyces coelicolor using DNA microarrays. Genes Dev 15: 3183–3192.
24. Bernstein JA, Khodursky AB, Lin PH, Lin-Chao S, Cohen SN (2002) Global
analysis of mRNA decay and abundance in Escherichia coli at single-gene
resolution using two-color fluorescent DNA microarrays. Proc Natl Acad
Sci U S A 99: 9697–9702.
25. Mehra S, Lian W, Jayapal KP, Charaniya SP, Sherman DH, et al. (2006) A
framework to analyze multiple time series data: a case study with Streptomyces
coelicolor. J Ind Microbiol Biotechnol 33: 159–172.
26. Livak KJ, Schmittgen TD (2001) Analysis of Relative Gene Expression Data
Using Real-Time Quantitative PCR and the 2- ??CT Method. Methods 25:
402–408.
27. Edgar R, Domrachev M, Lash AE (2002) Gene Expression Omnibus: NCBI
gene expression and hybridization array data repository. Nucleic Acids Res 30:
207–210.
28. Charaniya S, Mehra S, Lian W, Jayapal KP, Karypis G, et al. (2007)
Transcriptome dynamics-based operon prediction and verification in Strepto-
myces coelicolor. Nucleic Acids Res 35: 7222–7236.
29. Vo NV, Hsu LM, Kane CM, Chamberlin MJ (2003) In vitro studies of transcript
initiation by Escherichia coli RNA polymerase. 3. Influences of individual DNA
elements within the promoter recognition region on abortive initiation and
promoter escape. Biochemistry 42: 3798–3811.
30. Parsek MR, Val DL, Hanzelka BL, Cronan JE Jr, Greenberg EP (1999) Acyl
homoserine-lactone quorum-sensing signal generation. Proc Natl Acad Sci U S A
96: 4360–4365.
Antibiotic Gene Switch
PLoS ONE | www.plosone.org 11 July 2008 | Volume 3 | Issue 7 | e2724
31. Goryachev AB, Toh DJ, Wee KB, Lee T, Zhang HB, et al. (2005) Transition to
quorum sensing in an agrobacterium population: a stochastic model. PLoS
Comput Biol 1: e37.
32. Voigt CA, Wolf DM, Arkin AP (2005) The Bacillus subtilis sin operon: an
evolvable network motif. Genetics 169: 1187–1202.
33. Wong P, Gladney S, Keasling JD (1997) Mathematical model of the lac operon:
inducer exclusion, catabolite repression, and diauxic growth on glucose and
lactose. Biotechnol Prog 13: 132–143.
34. Santillan M, Mackey MC (2001) Dynamic regulation of the tryptophan operon:
a modeling study and comparison with experimental data. Proc Natl Acad
Sci U S A 98: 1364–1369.
35. Cox RA (2004) Quantitative relationships for specific growth rates and
macromolecular compositions of Mycobacterium tuberculosis, Streptomyces
coelicolor A3(2) and Escherichia coli B/r: an integrative theoretical approach.
Microbiology 150: 1413–1426.
36. Laurent M, Kellershohn N (1999) Multistability: a major means of differenti-
ation and evolution in biological systems. Trends Biochem Sci 24: 418–422.
37. Smits WK, Kuipers OP, Veening JW (2006) Phenotypic variation in bacteria:
the role of feedback regulation. Nat Rev Microbiol 4: 259–271.
38. Graumann PL (2006) Different genetic programmes within identical bacteria
under identical conditions: the phenomenon of bistability greatly modifies our
view on bacterial populations. Mol Microbiol 61: 560–563.
39. Kringstein AM, Rossi FM, Hofmann A, Blau HM (1998) Graded transcriptional
response to different concentrations of a single transactivator. Proc Natl Acad
Sci U S A 95: 13670–13675.
40. Hesketh AR, Chandra G, Shaw AD, Rowland JJ, Kell DB, et al. (2002) Primary
and secondary metabolism, and post-translational protein modifications, as
portrayed by proteomic analysis of Streptomyces coelicolor. Mol Microbiol 46:
917–932.
41. Tian T, Burrage K (2004) Bistability and switching in the lysis/lysogeny genetic
regulatory network of bacteriophage lambda. J Theor Biol 227: 229–237.
42. Igoshin OA, Price CW, Savageau MA (2006) Signalling network with a bistable
hysteretic switch controls developmental activation of the sigma transcriptionfactor in Bacillus subtilis. Mol Microbiol 61: 165–184.
43. Santillan M, Mackey MC (2004) Influence of catabolite repression and inducer
exclusion on the bistable behavior of the lac operon. Biophys J 86: 1282–1292.44. Ozbudak EM, Thattai M, Lim HN, Shraiman BI, Van Oudenaarden A (2004)
Multistability in the lactose utilization network of Escherichia coli. Nature 427:737–740.
45. Lai K, Robertson MJ, Schaffer DV (2004) The sonic hedgehog signaling system
as a bistable genetic switch. Biophys J 86: 2748–2757.46. Aris R, Amundson NR (1958) An analysis of chemical reactor stability and
control-I. The possibility of local control, with perfect or imperfect ontrolmechanisms. Chemical Engineering Science 7: 121–131.
47. Aris R, Amundson NR (1958) An analysis of chemical reactor stability andcontrol-II. The evolution of proportional control. Chemical Engineering Science
7: 132–147.
48. Dubnau D, Losick R (2006) Bistability in bacteria. Mol Microbiol 61: 564–572.49. Maamar H, Dubnau D (2005) Bistability in the Bacillus subtilis K-state
(competence) system requires a positive feedback loop. Mol Microbiol 56:615–624.
50. Ferrell JE Jr (2002) Self-perpetuating states in signal transduction: positive
feedback, double-negative feedback and bistability. Curr Opin Cell Biol 14:140–148.
51. Cherry JL, Adler FR (2000) How to make a biological switch. J Theor Biol 203:117–133.
52. Gardner TS, Cantor CR, Collins JJ (2000) Construction of a genetic toggleswitch in Escherichia coli. Nature 403: 339–342.
53. Kobayashi T, Chen L, Aihara K (2003) Modeling genetic switches with positive
feedback loops. J Theor Biol 221: 379–399.54. Matsuno K, Yamada Y, Lee CK, Nihira T (2004) Identification by gene deletion
analysis of barB as a negative regulator controlling an early process ofvirginiamycin biosynthesis in Streptomyces virginiae. Arch Microbiol 181:
52–59.
Antibiotic Gene Switch
PLoS ONE | www.plosone.org 12 July 2008 | Volume 3 | Issue 7 | e2724


![A Developmental Switch of Gene Expression in the Barley ...oa.upm.es/46343/1/INVE_MEM_2016_255898.pdf · A Developmental Switch of Gene Expression in the Barley ... DDL[SA]DID[HQ]LLDFAS](https://img.pdfslide.us/doc/110x75/5ad10abb7f8b9ae2138e67ab/a-developmental-switch-of-gene-expression-in-the-barley-oaupmes463431invemem2016.jpg)


![Bistable [2]Rotaxane Based Molecular Electronics ...thesis.library.caltech.edu/2030/10/Choi_Jang_Wook_2007.pdf · Bistable [2]Rotaxane Based Molecular Electronics: Fundamentals and](https://img.pdfslide.us/doc/110x75/5ec39875f0c68315cb72de5b/bistable-2rotaxane-based-molecular-electronics-bistable-2rotaxane-based.jpg)