Embed Size (px)
Citation preview

UNIVERSITY OF GHANA
STUDENTS` PERCEPTION OF SERVICE QUALITY IN HIGHER
EDUCATIONAL INSTITUTIONS IN GHANA AND ITS EFFECTS ON
THEIR LOYALTY
BY
BUKARI ZAKARI
(10508491)
THIS THESIS IS SUBMITTED TO THE DEPARTMENT
OF MARKETING AND ENTERPRENEURSHIP, UNIVERSITY OF
GHANA, LEGON IN PARTIAL FULFILLMENT OF REQUIREMENT
FOR THE AWARD OF MPHIL IN MARKETING DEGREE
JUNE, 2016
University of Ghana http://ugspace.ug.edu.gh
i
DECLARATION
I do hereby declare that this work is the result of my own research and has not been presented
by anyone for any academic award in this or any other university. All references used in my
work have been fully acknowledged.
I bear sole responsibility for any penalty that will be associated with this work
…………………………………… ……………………………….
BUKARI ZAKARI DATE
(STUDENT)
University of Ghana http://ugspace.ug.edu.gh

ii
CERTIFICATION
I hereby certify that this thesis was supervised in accordance with procedures laid down by the
university.
…………………………………………………….. .…………………………………………………
PROF. ROBERT EBO HINSON DATE
(SUPERVISOR)
……………….…………………… …………………….………………
DR MAHAMA BRAIMAH DATE
(CO-SUPERVISOR)
University of Ghana http://ugspace.ug.edu.gh

iii
DEDICATION
This thesis is dedicated to my Family: Abubakar Siddique my dad, Mariama Seidu my mom,
and my brothers and sisters.
University of Ghana http://ugspace.ug.edu.gh

iv
ACKNOWLEDGEMENT
The completion of this thesis would have been almost impossible without the contribution of
others. Their contribution to the completion of this work cannot be overemphasized. First, I
would like to thank Allah for his guidance and protection. My deepest gratitude goes to my
Supervisor and role model, Prof. Robert Ebo Hinson, for his immerse support throughout my
study. I am also grateful to Dr. Braimah Mahamah for his contribution towards the completion
of this thesis. I would like to acknowledge the support of Prof. Bedman Narteh (Head of my
Department); Dr Amoafo Samson; Dr Raphael Odoom; Mr Tutut-Boahene Bernard, Mr Kailan
Ibn-Hamid, Dr Thomas Anim Dorson; Mr Twum Kojo, Mr John Paul and Mrs Elizerberth
Opong for their readiness and willingness at all times to provide directions when called on. I
appreciate the effort of Mr Abudu Bukari of Ghana Portland Cement; Mr Kelley George; Mrs
Fidelis Quansah, Mrs Iyisha Ishao, Ms Maroufatu Yahuzah and Dr Charity Afua Boateng for
their dependable support and encouragement during the period.
University of Ghana http://ugspace.ug.edu.gh

v
TABLE OF CONTENTS
DECLARATION ........................................................................................................................ i
CERTIFICATION ..................................................................................................................... ii
DEDICATION ..........................................................................................................................iii
ACKNOWLEDGEMENT ........................................................................................................ iv
TABLE OF CONTENTS ........................................................................................................... v
LIST OF TABLES ................................................................................................................... xii
LIST OF FIGURES ................................................................................................................xiii
LIST OF ABBREVIATIONS ................................................................................................. xiv
ABSTRACT ............................................................................................................................ xvi
CHAPTER ONE ........................................................................................................................ 1
INTRODUCTION ..................................................................................................................... 1
1.1 Background of the Study .................................................................................................. 1
1.2 Research Gaps .................................................................................................................. 8
1.3 Research Problem ........................................................................................................... 11
1.4 Research Objectives ....................................................................................................... 13
1.4.1 General Objective ........................................................................................................ 13
1.4.2 Specific Objectives:..................................................................................................... 13
1.5 Research Questions: ....................................................................................................... 14
1.6 Significance of the Study ............................................................................................... 14
1.7 Scope/Delimitation of the Study .................................................................................... 15
1.8 Organization of the Study .............................................................................................. 15
CHAPTER TWO ..................................................................................................................... 16
LITERATURE REVIEW ........................................................................................................ 16
2.1 Theoritical Literature...................................................................................................... 16
University of Ghana http://ugspace.ug.edu.gh

vi
2.2 Concept of Service ......................................................................................................... 16
2.2.1 Characteristics of Services .......................................................................................... 17
2.2.1.1 Intangibility .............................................................................................................. 17
2.2.1.2 Inseparability ............................................................................................................ 18
2.2.1.3 Heterogeneity ........................................................................................................... 18
2.2.1.4 Perishability .............................................................................................................. 19
2.2.1.5 Ownership ................................................................................................................ 19
2.3 Service Marketing Mix................................................................................................... 20
2.3.1 Product/Service ........................................................................................................... 20
2.3.2 Price ............................................................................................................................. 20
2.3.3 Promotion .................................................................................................................... 21
2.3.4 Place ............................................................................................................................ 21
2.3.5 People .......................................................................................................................... 22
2.3.6 Process ......................................................................................................................... 22
2.3.7 Physical evidence ........................................................................................................ 22
2.4 The Concept of Quality .................................................................................................. 23
2.4.1 Quality Defined ........................................................................................................... 23
2.5 Service Quality ............................................................................................................... 24
2.5.1 Contemporary Views on Service Quality.................................................................... 27
2.5.2 Models of Service Quality........................................................................................... 28
2.5.3 Gronroos Model .......................................................................................................... 28
2.5.3.1 Servqual .................................................................................................................... 30
2.5.3.2 Gummerson`s 4 Q model ......................................................................................... 31
2.6 Dimensions of Service Quality ...................................................................................... 32
2.6.1 Reliability .................................................................................................................... 32
2.6.2 Responsiveness............................................................................................................ 33
2.5.3 Assurance .................................................................................................................... 33
University of Ghana http://ugspace.ug.edu.gh

vii
2.5.4 Empathy ...................................................................................................................... 34
2.5.5 Tangibles ..................................................................................................................... 35
2.6 SERVPERF .................................................................................................................... 35
2.7 HEdPERF Model............................................................................................................ 36
2.8 Significance of Service Quality...................................................................................... 37
2.9 Concept of Customer ...................................................................................................... 38
2.10 Students as Customers of Higher Education ................................................................ 38
2.11 Customer Perception .................................................................................................... 40
2.12 Students Perception ...................................................................................................... 40
2.13 Students` Expectations and Perceptions ....................................................................... 42
2.14 Students` Expectation and Experience ......................................................................... 43
2.15 Service Quality in Higher Education ........................................................................... 45
2.16 Assessing Service Quality in Higher Education .......................................................... 47
2.17 Students` Satisfaction ................................................................................................... 47
2.18 Determinants and Influences of Customer Satisfaction ............................................... 49
2.18.1 Product and Service Features .................................................................................... 49
2.18.2 Customer Emotion..................................................................................................... 50
2.18.3 Attribution for Service Success or Failure ................................................................ 50
2.18.4 Perception of Equity and Fairness ........................................................................... 50
2.18.5 Other consumers, Family Members and Co-workers ................................................ 50
2.19 Students Loyalty ........................................................................................................... 51
2.19.1 Antecedents of Students loyalty ................................................................................ 52
2.19.2 Institutional Reputation/ Image ................................................................................. 52
2.19.2.1 Importance of Institutional Reputation/ Image ...................................................... 55
2.19.3 Trust .......................................................................................................................... 56
2.20 Post grdaduate Students` Satisfaction and Retention ................................................... 57
2.20.1 Internal Environment................................................................................................. 58
University of Ghana http://ugspace.ug.edu.gh

viii
2.21 Undergraduates Students Satisfaction and Retention. ................................................. 58
2.22 Empirical Evidence ...................................................................................................... 60
2.23 Conceptual Framework ................................................................................................ 64
2.24 Components of the Conceptual Framework ................................................................. 68
2.24.1 Service Quality Dimensions (SERVQUAL) ............................................................. 68
2.24.2 Relationship Between the Variables in the Model: ................................................... 68
2.24.2.1 Service Quality and Students Satisfaction ............................................................. 68
2.24.2.2 Service Quality and Students Loyalty .................................................................... 69
2.24.2.3 Students Satisfaction and Students Loyalty ........................................................... 69
2.24.2.4 Institutional Image and Students Loyalty............................................................. 69
2.24.2.5 Students Satisfaction and Students’ Loyalty .......................................................... 69
2.24.3 Students Loyalty ........................................................................................................ 70
2.24.4 Level of Education Satisfaction and Retention ......................................................... 70
CHAPTER THREE ................................................................................................................. 71
CONTEXT OF THE STUDY .................................................................................................. 71
3.1 Overview of Ghana ........................................................................................................ 71
3.2 Education in Ghana ........................................................................................................ 71
3.3 Administration ................................................................................................................ 73
3.4 Progress and Developments in University Education .................................................... 74
3.5 Historical Overview of Higher Education ...................................................................... 74
3.6 Access to Quality Education in Ghana ........................................................................... 76
3.7 Private Universities ........................................................................................................ 76
3.8 Quality Assurance in Ghana`s Higher Education .......................................................... 77
3.9 Studies in the Ghanaian Education Sector ..................................................................... 77
University of Ghana http://ugspace.ug.edu.gh
ix
CHAPTER FOUR .................................................................................................................... 79
RESEARCH METHODOLOGY............................................................................................. 79
4.1 Introduction .................................................................................................................... 79
4.2 Research Approach ........................................................................................................ 79
4.3 Research Design ............................................................................................................. 80
4.4 Research Strategy ........................................................................................................... 81
4.5 Sampling Plan ................................................................................................................ 82
4.6 Population and Sampling ............................................................................................... 82
4.6.1 Target Population ........................................................................................................ 83
4.7 Sample Size .................................................................................................................... 83
4.8 Sampling Technique ....................................................................................................... 84
4.9 Data Collection and Instrumentation.............................................................................. 85
4.9.1 Primary data collection ............................................................................................... 85
4.10 Contact Method ............................................................................................................ 86
4.11 Survey Method ............................................................................................................. 86
4.12 Data Source .................................................................................................................. 87
4.13 Primary Source ............................................................................................................. 87
4.14 Instrumentation............................................................................................................. 87
4.15 Confirmatory Factor Analysis ...................................................................................... 89
4.16 Reliability and Validity Analysis. ................................................................................ 91
4.16.1 Validity ...................................................................................................................... 91
4.16.2 Reliability .................................................................................................................. 92
4.17 Normality Checking ..................................................................................................... 92
4.18 Multicollinearity ........................................................................................................... 93
4.19 Analysis ........................................................................................................................ 93
4.20 Descriptive Statistical Analysis .................................................................................... 94
4.21 Inferential Statistical Analysis ..................................................................................... 95
University of Ghana http://ugspace.ug.edu.gh

x
4.22 Regression Analysis ..................................................................................................... 95
CHAPTER FIVE ..................................................................................................................... 96
ANALYSIS AND DISCUSSIONS ......................................................................................... 96
5.1 Introduction .................................................................................................................... 96
5.2 Profile of Respondents ................................................................................................... 97
5.3 Descriptive Statistics ...................................................................................................... 98
5.4 Confirmatory Factor Analysis (CFA) .......................................................................... 101
5.5 Discriminant Validity ................................................................................................... 103
5.6 Hypothesis Testing Using Structural Equation Modelling (SEM)............................... 105
5.7 Discussion of Findings ................................................................................................. 110
5.8 Service Quality and Students Loyalty Devoid of Institutional Reputation .................. 110
5.9 Service Quality and Students Satisfaction Deviod of Institutional Reputation ........... 111
5.10 Students` Satisfaction and Students` Loyalty Devoid of Institutional Reputation..... 112
5.11 Service Quality and Students Satisfaction When Controlled for Institutional
Reputation .......................................................................................................................... 113
5.12 Service Quality and Students Loyalty When Controlled for Institutional Reputation
............................................................................................................................................ 113
5.13 Service Quality, Students Satisfaction, Loyalty and Institutional Reputation ........... 114
5.14 Variation in Students Satisfaction of Service Quality among Degree Level ............. 115
5.15 Variation in Students` Loyalty among Degree Level................................................. 115
CHAPTER SIX ...................................................................................................................... 116
SUMMARY OF RESULTS, CONCLUSIONS AND RECOMMENDATIONS ................. 116
6.1 Summmary of Findings ................................................................................................ 116
6.1.1 Service Quality and Students’ Loyalty...................................................................... 116
6.1.2 Service Quality and Students’ Satisfaction ............................................................... 116
6.1.3 Students’ Satisfaction and Students’ Loyalty............................................................ 116
University of Ghana http://ugspace.ug.edu.gh

xi
6.1.4 The Interaction Effects of Service Quality Dimensions’ Students’ Satisfaction and
Students’ Loyalty Devoid of Institutional Reputation ....................................................... 117
6.1.5 The interaction effects of service quality dimensions,’ students’ satisfaction and
students’ loyalty when controlled for institutional reputatiion .......................................... 117
6.1.6 Variation between the level of education Post graduates and Undergraduates
satisfaction and loyalty ....................................................................................................... 117
6.2 Conclusions .................................................................................................................. 118
6.3 Implication of Findings ................................................................................................ 118
6.4 Limitations of the Study and Future Research Directions ........................................... 120
REFERENCES ...................................................................................................................... 122
APPENDIX ............................................................................................................................ 146
University of Ghana http://ugspace.ug.edu.gh

xii
LIST OF TABLES
Table 2.1 Definitions of Quality .............................................................................................. 23
Table 2.2 Definitions of Service Quality ................................................................................. 25
Table 2.3 Definitions of Service Quality continued ................................................................ 26
Table 2.4 Definitions of Perception ......................................................................................... 40
Table 2.5 Definitions of Quality in Higher Education ............................................................. 45
Table 5.1 Dermographics Profile ............................................................................................. 97
Table 5.2 – t test (descriptive statistics) ................................................................................... 99
Table 5.3 - t test (descriptive statistics) continued ................................................................. 100
Table 5.4 Confirmatory Factor Analysis Results ................................................................... 102
Table 5.5 Confirmatory Factor Analysis Results continued .................................................. 103
Table 5.6 Descriptives, Correlations and AVEs .................................................................... 104
Table 5.7 Fit Indices of Models ............................................................................................. 105
Table 5.8 Structural Model Assessment Results.................................................................... 107
Table 5.9 Structural Model Assessment Results continued ................................................... 108
Table 5.10 Test of variations among undergraduates and postgraduates’ satisfaction. ......... 109
Table 5.11 Test of variations among Undergraduates and Postgraduates Loyalty. ............... 110
University of Ghana http://ugspace.ug.edu.gh
xiii
LIST OF FIGURES
Figure I Conceptual Framework .............................................................................................. 67
University of Ghana http://ugspace.ug.edu.gh

xiv
LIST OF ABBREVIATIONS
UNCTAD - United Nation Commission on Trade and Development
GDP - Gross Dosmestic product
UNESCO - United Nation Education Sciengtific and Sultural Organization
NAB - National AccredetationBoard
UK - United Kingdom
MDG - Millineum Development Goal
HEI - Higher Educational Institution
EMBA - Executive Masters of Business Administration
UG - University of Ghana
UGBS - University of Ghana Business School
HEdPERF - Higher Education Performance
SERVPERF - Customer Perception of Service performance
SERVQUAL - MultippleItemScale Measuring Consumer perception of Service
(Customer Expectation of Service Performance)
GES - Ghana Education Service
NCTE - National Council for Tertiary Education
PNDC - Provissional National Neffence Council
KNUST - Kwame Nkrumah University of Science and Technology
UCC - University of Cape Coast
CITO - Chief Information Technology Officer
MBA - Masters in Business Adminstration
MSC - Masters of Mcience
MPHIL - Masters of Philosophy
PHD - Doctor of Philosophy
SPSS - Statistical Product for Services Solution
CFA - Confirmatory Factor Analysis
University of Ghana http://ugspace.ug.edu.gh

xv
GFI - Goodness of Fit Index
CFI - Comparative Fit Index
RMSEA - Root Mean Square-Error of Approximation
AGFI - Average Goodness of Fit Index
VIF - Variance Inflation Factor
University of Ghana http://ugspace.ug.edu.gh

xvi
ABSTRACT
The proliferation of higher educational institutions has given students a wider variety of options
as to where to persue their studies. In this era of competition, measuring service quality in
higher education has become a vital tool to determine the level of students` perception of
service quality in order to achieve their loyalty. This study focuses on Ghanaian students’
perception of service quality in higher educational institutions and its effects on their loyalty.
The SERVQUAL model was adopted as a conceptual framework for this study. The study
sought to examine the interaction and non-interaction effects of service quality dimensions,
institutional reputation and level of education on students’ satisfaction and loyalty. The
quantitative approach was adopted, using a questionnaire to collect data from 379 students
attending the University of Ghana Business School. Regression analysis and the structural
equations model (SEM) were used to analysed the data. The findings revealed, that there is a
variation in the key service quality dimension that were peculiar to the undergraduate and post
graduate students. Tangibles, assurance, institutional reputation and responsiveness were found
to be peculiar to undergraduates; whereas, institutional reputation, tangibles and empathy were
found to be crucial to postgraduate students. Finally, findings from the study revealed that
institutional reputation plays a vital role in predicting students` satisfaction and loyalty. The
study therefore, recommended that managers of higher educational institutions should
concentrate on institutional reputation as a strategic tool in achieving students’satisfaction and
loyalty. Again, it is recommended that managers of higher educational institutions identify the
specific quality dimensions that are peculiar to students at different levels, and design a
different service quality strategy for these groups, in their quest to achieve students` satisfaction
and loyalty.
University of Ghana http://ugspace.ug.edu.gh

1
CHAPTER ONE
INTRODUCTION
1.1 Background of the Study
The service industry has grown to become a dominant area in the global economy (United
Nation Conference on Trade and Development (UNCTAD), 2014). The services sector
contributed to the global Gross Domestic Products (GDP) by 71.21% in 2011 (UNCTAD,
2014). The sector contributed to Ghana`s GDP by 48.4 and 49.5% in 2012 and 2013
respectively (Ghana Statistical Service Report, 2014). A review of literature suggests a wide-
spread need for service quality considerations to boost customer value, attract, retain and
foster relationship with customers to achieve competitive advantage (Hasan, Ilias, Rahman,
& Razak, 2009).
Consequently, the concept seems to have attracted research attention within the last two
decades to enhance understanding in theory and practice (Brochado, 2009). The concept has
now become a fundamental concern of well established organizations strategic plans (Chopra,
Chawla, & Sharma, 2014). Management of higher education in developing countries are
now embarking on service quality as a key to success (Abukari & Corner, 2010). Past
and current scholars have conducted studies in various sectors of the service industry
including; banking (Hinson, Mensah, & Mahmoud, 2006) healthcare (Akortsu & Abor, 2011)
and education (Hinson & Otieku, 2005; Fosu & Owusu, 2015; Abukari & Corner, 2010) to
understand the suitability and applicability of the service quality concept in these relevant
service sectors.
Service quality has been defined differently by various scholars. In the view of Lewis and
Booms (1993) “service quality is a measure of how well a service level delivered matches
University of Ghana http://ugspace.ug.edu.gh

2
customers’ expectations”. Parasuraman, Zeithaml, and Berry (1994) define service quality
as “ a trade-off between customer expectation and their perception of actual service
performance”. Others however, argue that service quality is a direct result of perception of
performance and service quality is generally the perceived quality by customers
(Parasuraman, 2000). Gronroos (1984) posits that service quality is the outcome of customer
evaluation of his or her service experience from the service encounter compared with what
they were expecting. Taking the above definitions into consideration, service quality in
education could be defined as students’ evaluation of how services delivered by an
educational institution meets the expectation of the students. Hence, quality is defined by
the students and not the institution. These definitions suggest that customer perception is
central to service research.
Customer expectation is the belief about the service delivery that serves as a benchmark
or standard against which the overall performance of an organization could be evaluated;
perception on the other hand, is the subjective assessments of actual service experience
through interaction with the service provider (Zeithaml, Bolton, Deighton, Keiningham,
Lemon, & Petersen, 2006). Lindsay and Norman (1977) define “perception as the process
by which organisms interpret and organize sensation to produce a meaningful experience of
the world”. All the definitions describe perception as the process or phenomenon by which a
person perceives any object and interprets it. However, in recent times understanding
students’ perception has become imperative to management of higher educational institutions,
as students view service quality as a sample of their educational experience, depending on
the trade-off between their prior expectation and experience after passing through the
educational cycle (Oliver, 1981).
University of Ghana http://ugspace.ug.edu.gh

3
Scholars in service marketing literature have acknowledged the importance of perception
(Arambewela & Hall, 2009; Cronin & Taylor, 1992; Parasuraman, Zeithaml, & Berry, 1988).
The issue of service quality and perception remains at the forefront of many research agenda
as a result of the significant role it plays in gathering, organizing, analyzing and interpreting
information acquired from the environment to make a coherent picture of the world (Lindsay
& Norman , 1977). The concept has been widely researched in area such as the banking
industry, hospitality industry, health sector as well as education (Lindsay & Norman, 1977).
In recent times, the service quality research is gaining attention in higher education
institutions. This is as a result of globalization, liberalization, restructuring and educational
reforms which has made the higher education institutions independent, coupled with drastic
changes with a reduced public funding (Regassa, Tolemariam, Ferede, Hunde, & Lemma,
2013). This has paved way for competition in the sector, allowing individual entrepreneurs
to enter the market (Regassa et al., 2013). A wider variety of options has therefore been
open to the students and other stakeholders when making choices concerning higher
education.
Forecasting into the future, the demand and enrolment for higher education globally and
nationally is going to increase more than double (Gibney, 2013). The number rose between
2000 and 2010, worldwide from 19 to 29 percent according to (Haddad, 2003). Students`
enrolment globally is expected to reach 262 million by 2025 compared with 178 million in
2010 (Gibney, 2013). In Sub- Saharan Africa, gross enrolment is expected to move from
20 to 25 (Haddad, 2003). The number of internationally mobile students is expected to
almost double to 8 million by 2025 (Gibney, 2013). The high quality of education in some
countries than others, higher ambitions of parents, students and more sophisticated
requirements of the marketplace which has forced developing countries to contest with more
University of Ghana http://ugspace.ug.edu.gh

4
advanced countries in a viable knowledge-based globally, can be a contributory factor to this
rapid growth (Materu, 2007). The tertiary education environment has now become a global
village, students are more informed and have up to date information within the global
academic environment (Materu, 2007). This has put more pressure on management to
implement quality measures to meet and exceed students’ desire as well as to meet global
academic standards.
The 21st century has experienced a basic education deficit of approximately 50 million
children out of school and about 850 million illiterate youths and adults (Haddad, 2003).
In an attempt to curb the situation there will be an increase in the demand for higher
education (Haddad, 2003). In this situation quality i s likely to be sacrificed at the expense of
the number. Hence, any academic institution that will be proactive enough to define quality
from stakeholders` (students, employers, parents, government etc) perspectives will be in the
best position to attract the majority of the applicants, as quality plays a vital role in students’
choice, employers’ choice to employ and parents’ decision to select.
Sub Saharan African, a Sub region of about 740 million people, can boast of about 200 public
universities with an escalating number of private Universities (Materu, 2007). All these
institutions a re competing for the percentage of the age cohort to enroll i n their institution
and the only way to be the preferred choice of the majority is to deliver quality service and
quality can only be defined by the students, by understanding their perception of service
quality.
In Ghana the story is not different, the growth of the sector has been a phenomenon, since
independence. The statistics from the National Accreditation Board (NAB) reveals that, as at
University of Ghana http://ugspace.ug.edu.gh

5
2007, there were 17 private universities in the country, the number rose to 76 by 2015 National
Accreditation Board (NAB), (2015). In the case of the public sector the number rose from 5
Universities to 11 Universities within the same period. The proliferation of these universities
has given students more tertiary education options. Understanding students’ perception will be
the best way management can deliver quality service to gain competitive advantage in this
turbulence environment (Regessa et al., 2013).
The growth of quality management has emerged as a key management issues over the past
few decades across all industries in the world, with the services sector being no exception.
Management of higher education institutions are now beginning to realize the significant
role of customer centered philosophy (Shaney, 2012). For instance, UNESCO emphasized
quality education as a fundamental human right, which should be the primary focus of every
education institution. In line with this, the external examiner system was established in UK
and other Commonwealth countries and the American Accreditation and Government
Ministerial control was established in Europe and other parts of the world (Abukari & Corner,
2010). Between 1968 and 2006, 17 regulatory bodies were established in Sub Saharan Africa
to regulate the quality issues of higher education institutions (Materu, 2007). In Ghana, the
National Accreditation Board, Quality Assurance systems and National Council for Tertiary
Education were establish in 1993 to ensure that quality education is delivered to students
(Abukari & Corner, 2010). Empirical evidence in our tertiary education system is students’
evaluation of faculty at the end of each semester. These regulatory bodies over the years have
put in place systematic measures to ensure that quality service is delivered to students, yet
we cannot be convinced that, without empirical and scientific research, all quality issues
within our higher educational experience can completely be handled (Fosu & Owusu, 2015).
University of Ghana http://ugspace.ug.edu.gh
6
Materu (2007) conducted a research on quality issues in higher educations in Sub-Saharan
Africa, including six detailed country case studies; Ghana, Cameroon, Mauritius, Nigeria,
South Africa and Tanzania between November, 2005 and December, 2006 and called for
more insight into quality management issues in higher education institutions to help improve
upon the quality of the sector in the Sub-region. As quality education is a power fu l tool
that will help facilitate the achievement of t he Millennium Development Goals (MDGs) and
to help shape the national and international policies to facilitate the potential of the country’s
productivity growth (Materu, 2007).
Quality implementation in the higher education sector is believed to be able to help change
students’ perceptions and improve the retention of skilled human capital (Materu, 2007).
As the majority of emigrants are attracted by quality and standing of tertiary education, it is
interesting to note that, only a few return home to apply the knowledge acquired (Materu,
2007). For instance, between 1990 and the year 2000 the tertiary education emigrants from
Sub- Saharan African rose from 23 to 31.4 percent (Docquier & Marfouk, 2005 as cited in
Materu, 2007). Quality education will again help to improve the attractiveness of local base
institutions’ and help to increase the number of qualified students studying in these institutions.
Yet, higher educational institutions in the sub-region still face challenges of implementing
appropriate practical measures to ensure that the programmes offered are of sufficient quality
and relevant to the stakeholders (Abukari & Corner,2010). Hence, institutions that will strive
to deliver service that will meet students, parents, employers’ requirements will be in good
standing to attract the majority of these students.
Higher education is very critical to the national development and has a tremendous impact on
a nation`s success, as a result of the role it plays in producing competent and skilled
University of Ghana http://ugspace.ug.edu.gh

7
professionals to facilitate socio-economic development (Materu, 2007; Abukari & Corner,
2010; Fosu & Owusu, 2015; Regassa et al., 2013). On this basis, management of higher
education institutions, policy makers and practitioners are putting measures in place to
improve quality of higher education in the sub-region (Materu, 2007). Service quality can
help improve the standards of higher education in the sub- region.
Previous studies on service quantity i n higher education h a s encompassed areas such as
service quality on the EMBA programme (Hinson & Otieku,2005), student satisfaction
(Hasan et al., 2009), quality in higher education (Adullah, 2005), quality for the higher
educational system (Sahney, 2012), management and educational institutions (Chopra,
Chawla, & Sharma, 2014), excellence in business education (Sohail & Shaikh, 2004) and
perception of service quality, (Fosu & Owusu, 2015). Findings from these studies reveal
that service quality can help managers of higher educational institutions to re-engineer their
services to meet students’ desires and needs. To this end, the management of higher education
institutions are confronted with the following questions; what are the perceptions of the
students towards quality of service delivered by their institution? Can their perception of
service quality influence their loyalty decisions?
Sub Saharan African countries have been urged to study students’ perception of service quality
in higher education institutions as a strategic tool for competitive advantage (Materu, 2007;
Chopra, Chawla & Sharma, 2013). Among the quality management issues in Ghana`s higher
educational system is students` perception of service quality of our educational experience,
(Fosu & Owusu, 2015). Students’ perception (expectation and experience) as define earlier
on could be negative or positive based on information acquired from the academic
environment which will leads to positive or negative behavioral intention.
University of Ghana http://ugspace.ug.edu.gh
8
For the case of University of Ghana Business School (UGBS) in 2005 the EMBA students
infered that, they pay $8000 for four semesters programme, and for that matter expected more
programmes and good facilities hence, will not recommend UBGS EMBA to friends and
relatives, but rather will recommend that of Ghana Institute of Management and Public
Administration and that of Leicester distance learning programme, (Hinson & Otieku, 2005).
This is an indication that students pay more attention to quality of service and the nature of
programmes offered by their institutions. This has a deamener on their loyalty decisions.
Currently it costs $10,000 to enroll in EMBA programme, Mphil used to be free, now it cost
not less than GHC 10,000, about GHC 20,000 for regular MBA, not less GHC2,000 for under
graduate studies. Hence, getting an insight about students’ perception of service quality is
essential to the management of University of Ghana (UG), so as to facilitate managerial
decisions regarding the level of quality required to influence students’ perception positively
to keep University of Ghana at a competitive advantage. For this reason, the idea of going
beyond the institutional expectation to actual performance is becoming a key priority in the
management agenda (Hinson & Otieku, 2005). Against this background, the study examines
students’ perception of service quality in higher educational institutions in Ghana. Findings
from the study will help management of Ghanaian universities, policy makers and regulatory
bodies to identify which aspect of our educational experience needs to be given more attention
when it comes to quality issues in higher education.
1.2 Research Gaps
Previous studies on service quantity in higher education has encompassed areas such as service
quality on the EMBA programme (Hinson & Otieku, 2005), student satisfaction (Hasan et al.,
University of Ghana http://ugspace.ug.edu.gh

9
2009 Ali & Abdirisaq, 2014), service quality in higher education ( Abdullah, 2005), designing
quality for the higher educational system (Sahney, 2012), management and education
institutions (Chopra, Chawla, & Sharma, 2014), teaching and students outcome (Samuelsson
& Lindbleand, 2015), “ Quality, Value and Customer Satisfaction on Behavioral
intentions”(Cronin & Talor, 1992), perception of the quality of teaching and learning (Abdul-
Hamid, 2004 Rasli, Shekarchizadeh & Iqbal, 2012),excellence in business education (Sohail
& Sheikh, 2004), student perception,(Fosu & Owusu, 2015) and quality service in a developing
economy context (Abukari & Corner, 2010). Empirical evidence from these studies have
shown that intstitutional reputation has not been, given much attention as to how it can interact
with service quality to achieve student’s satisfaction and loyalty. Despite the growing body of
research in these areas, it is still not clear how institutional reputation interacts with variables
such as, loyalty and satisfaction (Beerli Palacio, Menses& Perez ,2002), hence the need to
examine the two constructs to see how they will behave to predict behavioral intentions.
Not withstanding the number of research in the arear of service quality on personal and
academics factors affecting students’ satisfaction and retention, the issue of non-academics’
aspects of university services and its influence on satisfaction and retention behavior is yet to
be given attention (Sickler, 2013).
These studies emphasize a call for more studies exploring students’ perception of service
quality in higher education institutions and its effects on their loyalty decisions (Chopra,
Chawla & Chawla, 2014; Fosu & Owusu, 2015; Abukari & Corner, 2010). Hassan et al., (2009)
note that service quality dimension can influence students’ satisfaction, however the various
factors that contribute most to students’ satisfaction has not been clearly highlighted. The
authors therefore recommend that, since students’ perception of service quality play a vital role
University of Ghana http://ugspace.ug.edu.gh
10
in their satisfaction and loyalty decisions, future research should investigate service quality and
students’ perception in higher education institutions. These studies point out that, service
quality issues in public higher education institutions in developing economy like Ghana has
not been well researched (Abukari & Corner, 2010). Hence, more research is required through
a comprehensive approach to study the effects of service quality on students’ perception in
higher education institutions of learning in a developing economy context (Abukari & Corner,
2010).
In a study of service quality in higher education institutions in Ghana, Abukari and Corner
(2010) attempted to respond to this call. The study presented evidence on the relationship
between service quality dimensions and students satisfaction, how service quality contributes
to students’ satisfaction and its overall effects on students’ perception of service quality. The
study further presented empirical evidence on critical factors in service quality dimension that
contribute most to students’ satisfaction. However, the study failed to acknowledge how
perception of service quality can influence students’loyalty decisions as well as how
institutional reputation and satisfaction can influence the relationship.
Service quality dimension has been identified by these studies to influence students’ perception
of service quality (Hinson & Otieku, 2005; Hill, 1995; Anderson, 1995; Cuthbert, 1996; Kwan
& Ng, 1999; Sohail & Shaikh, 2004; Sahney Banwet & Karunes, 2004; Ali & Abdirisaq,
2014; Abukari & Corner, 2010; Fosu & Owusu, 2015). The majority of these studies tended
to concentrate only on service quality dimension developed by (Parasuraman, Zeithaml, &
Berry, 1985; Cronin & Taylor, 1992) in developed economy. The concentration has, however
been on how the five service quality dimensions by Parasuraman et al., (1985) affects either
students’ satisfaction or perception of service quality in educational institution; ( Ali &
University of Ghana http://ugspace.ug.edu.gh
11
Abdirisaq , 2014; Fosu & Owusu , 2015 & Sahney,2012). The interaction effects of service
quality, institutional reputation, satisfaction and loyalty has not been given a considerable
attention. Very little however, has been done on service quality issues in higher educational
institutions in developing economies on students’ behavioral prediction studies and more
importantly with respect to the integrating service quality dimensions with university image to
identify the various factors that influences the students’ perception of service quality and its
effects on their loyalty
“Service quality has attracted considerable attention within the tertiary education sector, but
despite this little work has been concentrated on identifying its determinants from the stand
point of the students being primary customers” (Abdullah, 2005, p.87). Again previous
research has been too myopic with an over emphasis on the quality of academics and very little
attention paid to the non-academic aspects of the educational experience (Abdullah, 2005).
Furthermore, how students level of education can interact with service quality dimensions to
influence their satisfaction and loyalty has not been given much attention to date.
1.3 Research Problem
The study therefore, sougth to fill the above gap by examining the interaction and non-
interaction effects of service quality dimensions and institutional reputation on studentions
satisfaction and their loyalty. The study also examined how the students level of education can
influence their satisfaction and loyalty. Perception and satisfaction of service quality has been
identified in the marketing literature to influence behavioral loyalty decisions (Eggert & Ulaga,
2002; Dodds, Monroe, & Grewal, 1991; Parasuraman & Grewal, 2000; Ravald & Grönroos,
1996; Liljander & Strandvik, 1995; Gross 1997; Zeithaml, 2000). Most of these empirical
studies tended to focus on developed economy with more concentration on academics’ aspects,
University of Ghana http://ugspace.ug.edu.gh
12
with very little attention paid to the non-academics’aspects of the educational experience
(Abdullah, 2005).
In Ghana, the establishment of the quality assurance systems, the National Accreditation Board
and National Council for Tertiary Education in 1993 has brought more reforms into the
educational sector. The students are therefore exposed to more tertiary education options than
ever before (Fosu & Owusu, 2015), hence the need to deliver quality service to students
(Abukari & Corner, 2010). Again, from satisfaction to intention to retention behavior needs to
be carfully examined (Kara & De Shield 2004). There is an assertion that quality in service
marketing is based on the notion that quality has to be judged on the assessment or user
perspective (Gronroos, 1984; Parasuraman et al., 1985, as cited in Fosu & Owusu, 2015).
However, empirical evidence has shown that the, research conducted in marketing literature on
services in the field of higher education from the user perspective is significantly weak
(Abdulah, 2005; Cronin & Taylor, 1992). Despite numerous studies having been carried out in
the field over the years, there still exist a significant disparity concerning the best way to define
and measure service quality (Fosu & Owusu, 2015). To add to the above is that no single model
of service quality is accepted, past experience with the service therefore will go a long way to
influence expectations (Fosu & Owusu, 2015). Furthermore, consumers’ expectations are
influenced by marketing mix activities; ideology and word of mouth communication, hence
past experience will influence their expectations (Gronroos, 1984).
Again, students` perception could be positive or negative depending on their expectation and
experience, and the consequence of perception either negative or positive will be very critical
to an institutional success. Hence, measuring the kind of perception that the students form about
the university will go a long way to influencing managerial decisions regarding the level of
quality they need to deliver to meet students` desires and needs. This will help them achieve
University of Ghana http://ugspace.ug.edu.gh

13
students’ satisfaction and loyalty. In doing this, they need to be concern about how their
students feel about their service experience, but rather not only show concern about the value
of the society and the abilities of their graduates (Lawson, 1992, as cited in Abdullah, 2006).
It is therefore very important to determine how the variables within SERVQUAL model,
institutional reputation and students’ satisfaction can influence students’ perception and its
loyalty decisions. This study specifically examines the interaction and non-interaction effects
of service quality and institutional reputation on the loyalty of the students of University of
Ghana as well as how their level of education can influence their satisfaction and loyalty
decisions.
1.4 Research Objectives
1.4.1 General Objective
The main objective of this study was to investigate the relationship between students’
perception of service quality in higher education institutions in Ghana and their loyalty, taken
into consideration the role of institutional reputation and students’ level of education.
1.4.2 Specific Objectives:
Specifically, the objectives of this study were to:
Determine the relationship between students’ perception of service quality and their
loyalty,
To find out the effects of students’ satisfaction of the various dimensions of service
quality on their loyalty,
To assess the relationship that level of education establishes between students’
perception of service quality, their satisfaction and loyalty and
University of Ghana http://ugspace.ug.edu.gh
14
To examine the interaction and non- interaction effects of servivice quality and
institutional reputation on students’ satisfaction and loyalty.
1.5 Research Questions:
What is the relationship between students’ perception of service quality and their
loyalty?
What are the effects of students’ satisfaction of the various dimensions’ of service
quality on their loyalty?
What kind of relationship does the level of education establish between students’
perception of service quality and their satisfaction?
What are the interaction and non-interaction effects of service quality and
institutionalreputation on students’ satisfaction and loyalty?
1.6 Significance of the Study
The findings of this study will:
Create awareness for all concerned bodies about the current quality status of education
institutions in Ghana,
Help the University administrators in compiling information that can be used in
planning, implementation and monitoring of the programmes that are geared towards
maintaining quality of education,
Contribute towards enhancing and ensuring quality in higher education through policy
measures emanating from the recommendation of the study and
Serve as a springboard for further investigation of the issues under discussion.
University of Ghana http://ugspace.ug.edu.gh

15
1.7 Scope/Delimitation of the Study
This study is confined to assessing the quality of education in the University of Ghana Business
School. It explores service quality from students’ perspectives, based on how the istitutional
reputation and level of education will influence their perception of service quality dimensions
in predicting their satisfaction and loyalty. Therefore, conceptually this study investigates the
quality of education in the University of Ghana Business School, by emphasizing students`
concern on quality dimensions in the teaching and learning process. Finally, the study
examineds the students` loyalty decision from the students’ point of view.
1.8 Organization of the Study
The study is divided into six basic chapters.
Chapter one explains in detail the background of the study, problem statement, objective of the
study, research questions, significance of the study and scope and organization of the study.
Chapter two provides a brief review of the theoretical and empirical literature and conceptual
framework. Chapter Three focused on the context of the study. Chapter Four outlines the data
sources and research approach, research instrument, sampling plan, contact method and data
analysis technique. This chapter gives an account of the methodology. It provides the rationale
for choosing a specific method or technique and a details of the data collection and presentation
for the research. Chapter Five presents the results and the discussion of the findings. Chapter
six present a summary of the findings, conclusions reached, recommendations made and
limitations of the study.
University of Ghana http://ugspace.ug.edu.gh

16
CHAPTER TWO
LITERATURE REVIEW
2.1 Theoritical Literature
2.2 Concept of Service
Studies into services as a distinct research discipline did not emerge until the late 1970s
(Zeithaml & Bitner, 2002). The last 40 years have seen a significant upsurge in services having
dominated economic activities globally, and this has led to the growth of several economies
(Abdullah 2006). Many definitions have been given by scholars as to what constitute a service.
Zeithaml, Bitner, and Gremler (1996) define service “as a deeds, processes and performances
provided or co-produced by one entity or person for another entity or person”. Kotler and Keller
(2006) define “service as any act or performance that one party can offer to another that is
essentially intangible and does not result in the ownership of anything”. According to Lovelock
and Wirtz (2007) services is “something that can be bought and sold but cannot be dropped on
the foot”. Lovelock and Wirtz (2007) defined service as “economic activities offered by one
party to another, most commonly employing time-based performances to bring about desired
results in recipients themselves or in objects or other assets for which purchasers have
responsibility”.
The above definitions capture centrally the intangible nature of services demonstrating the most
fundamental differences between goods and services. It is important to also note that as well as
the differences, there exist similarities between goods and service hence it is appropriate to
distinguish further to broaden the definition of service (Beaumont, 2007).
University of Ghana http://ugspace.ug.edu.gh

17
Some scholars however contend that “service” and “services” mean different thing to different
people (Solomon, Surpremant, Czepiel, & Gutman, 1985). Whilst “service” involves the whole
organization`s performance in delivering the to the customer, “services” referred to something
that can be offered to the customer. Needless to say, “services” definitions are result oriented
or directed at the value created since it is something of value delivered to a performance to
meet customers’ desire (Nimako, Azumah, Donkor & Vernica, 2011). In a typical educational
institution, “services” may include specific services such as: access to lectures, access to
library, extracurricular activities etc.
2.2.1 Characteristics of Services
Services are distinguished from goods as they possess unique characteristics and thus are
treated differently from physical goods. There appears to be a general consensus between
scholars that the following characteristics; intangibility, inseparability, heterogeneity,
perishability and ownership differentiate services from goods (Parasuraman, Zeithaml, &
Berry, 1988; Fisk, Brown, & Bitner, 1993; Zeithaml, Bitner & Gremler, 1996; Palmer, 2001).
2.2.1.1 Intangibility
“Services are activities performed by the provider, unlike physical goods they cannot be seen,
tasted or felt, heard or smelt before they are consumed” (Berry, 1980). Services cannot be
stored or inventoried (Berry, 1980). “They cannot be patented and readily displayed or
communicated as compared to goods” (Berry, 1980). Berry (1980) argues that even though
the performance of most services is supported by tangibles, the essence of what is purchased is
the performance. Thus, services are experienced when performed. Examples are making or
receiving telephone calls, having a haircut and attending lecturers. In order to increase the
tangibility of services marketers must emphasize the important aspectss, instead of just
University of Ghana http://ugspace.ug.edu.gh

18
describing the features. Marketers must also develop strong visual symbols and images for their
firms (Hinson, 2012). For example, MBA students after being taught by lecturers at a Business
Schools may not fully understand the benefits received from the service itself. The only
tangible components that the students see about the service are the lecture facilities on campus.
2.2.1.2 Inseparability
Inseparability “referred to simultaneous delivery and consumption of services” (Kotler, 2006).
Thomas (1978) contends that the degree of this participation is a function of the extent to which
the service is people based or equipment based. The implication here is that people based
services tend to be less standardized than equipment based services or goods producing services
(Hinson,2012). Company employees must know that they (physically) and their actions
(attitudes) go into the perceived service quality of the customer. Management and employees
must be trained to behave appropriately. In the case of higher education this characteristic may
come in a form involving students enrolling in a programme, lecture sessions commencing and
information being transferred from lecturers to students at the same time.
2.2.1.3 Heterogeneity
Heterogeneity reflects a potential for high variations or inconsistency in service delivery
(Zeithaml, Bitner & Gremler 1996). According to Zeithaml et al., (1996), “service marketers
find it difficult to control the quality of the service performances because it is dependent on
fallible employees as one of its main inputs”. Ensuring consistency in service quality therefore
poses a great challenge to service marketers due to the heterogeneous nature of service. In
managing this, automation of routine services should be employed to ensure quality, as
standardization is maintained (Arpin, 2007). In the education context, no two lecturers can
University of Ghana http://ugspace.ug.edu.gh

19
deliver their modules in the same manner and besides no two students will experience the
lecturer of the service delivery in the same way.
2.2.1.4 Perishability
Kotler, (2006) defines perishability as the inability of a service to be inventoried or stored.
Services are “time dependent” and “time important”and this tends to make them highly
perishable. The issue of perishability is primarily the concern of the service provider. Service
consumers usually become aware of the perishability of services where there is insufficient
supply of a particular service or when they have to wait to consume a particular service. The
inability of a service provider to build and maintain stock means that fluctuations in demand
cannot be accommodated in the same way as goods, this poses many quality management
problems (Zeithaml, et al., 1996). An example in an education institution is once courses are
delivered to students the service is completes and they cannot return the courses` taught to them
if they wish to withdraw from the programme.
2.2.1.5 Ownership
The last characteristic of service that distinguishes it from goods is ownership. Customers only
receive the right to a service when they have paid for it. Many scholars argue that payment for
services, does not result to physical transfer of ownership to customers, but only give the
purchaser the right to access it, (Roberts, 2005). Customers are not certain, as to whether the
right service has been delivered to them as a result of lack of ownership, they perceived it as
risk and the result cannot be assured (Roberts, 2005). The inability to own a service also has
its associated consequences on the distribution of services (Roberts, 2005). In a university, for
instance, students pay to only get access to lectures, library, hostel accommodation etc.
however they do not get a physical transfer of those services to themselves.
University of Ghana http://ugspace.ug.edu.gh

20
2.3 Service Marketing Mix
The marketing mix “refers to specific organizational factors a firm can control to deliver value
to internal and external customers on a repeated basis” (Hinson, 2012). The traditional
marketing mix model was primarily directed as seemed useful for physical goods. The extended
marketing mix “is a marketing toolbox that expands the number of controllable variables from
four in the original marketing mix model to seven” (Hinson, 2012).
2.3.1 Product/Service
According to Hinson (2012), a product “is the core benefit that consumers derive from the
consumption of a particular service or product”. It is the responsibility of marketers to ensure
that the quality of the service delivered meets customers’ requirements, including the;
technical, functional and emotional aspects of the service. Other scholars categorized “product”
into three basic levels; namely the core product, actual product and augmented product (Kotler
& Keller 2006). The core product, which is the first level, represents what the consumer
actually pay for in terms of benefits. The second level being the actual product comprises of
the brand name, features, packaging, parts, and styling whilst the final level, the augmented
component consists of the additional services and benefits that is emannated from the first two
levels of the product (Kotler & Keller 2006).
2.3.2 Price
Price can be defined “as the amount of money that consumers are willing to pay for a product
or service” (Bearden, Hardesty, & Rose, 2001). “Prices are determined by several factors
including market share, competition, material cost, product identity and customers’ perceived
value of the product” (Bearden et al., 2001). Zeithaml (1998) defines price from a customer’s
University of Ghana http://ugspace.ug.edu.gh

21
cognitive conception as something that must be sacrificed to obtain certain kinds of products.
Armstrong, Kotler, and He (2000) defined price as “the amount of money charged for a product
or service, or the sum of the values that the customer exchanges for the benefit of having or
using the product or service”
2.3.3 Promotion
Promotion is a communication procedure that linked a business to its various publics (Kotler
& Keller, 2006). Promotion in a service-oriented corporation that includes marketing
communications tools that can be employed by a service firm to influence the image and
perceptions of their corporate and sub brands in the minds of consumers for the benefit of the
firm (Hinson, 2012). Promotional tactics that can be employed to project quality of a service
include through-the-line advertising, sponsorships, personal selling, and positive word of
mouth communication.
2.3.4 Place
“Place refers to having the right product, in the right location, at the right time to be purchased
by consumers” (Hinson, 2012). The place element in the service marketing mix refers to how
available the service is to the service customer (Hinson, 2012). Place in a service-oriented
company includes the extent of accessibility of the service (Hinson,2012). Service must be
made accessible to the service customer at the right place and at the right time without
inhibitions to the consumer.
University of Ghana http://ugspace.ug.edu.gh

22
2.3.5 People
Due to the simultaneity of production and consumption in services, employees occupy the key
position in influencing customer’s perception of service quality. Hence, all individual actors
who play a role in influencing the consumption of a service form an integral part of the extended
marketing mix (Hinson, 2012). This element includes the dressing of employees, personal
appearance and their attitudes, which influence the customer’s perception of the service.
2.3.6 Process
Process refers to procedures, mechanisms, and the flow of activities by which services are
acquired or consumed (Zeithaml et al.,1996). Process decisions are an essential part of the
marketing strategy and radically affect how a service is delivered to customers. The process
must be perceived by the customer as being relevant and value-laden (Hinson, 2012). The
customer judges the service by the operational flow of the service and actual delivery steps
experienced (Hinson, 2012). Some services may, however, be so complex and hence require
the customer to follow complicated steps in order to obtain satisfaction.
2.3.7 Physical evidence
This represents “the environment in which the service is delivered” (Hinson, 2006). It is any
tangible good that facilitate the performance and communication of the service. The ability and
environment in which the service is delivered, both in terms of the tangible goods that helps to
communicate and perform the service, and the intangible experience of existing customers and
the ability of the business to relay that customer satisfaction to potential customers are entailed
in physical evidence (Hinson, 2006). Customers are more concerned about some tangibles
clues to the likely quality of a service by examining the touchable evidence. For example,
prospective students of a university may look at the facilities and infrastructure on campus.
University of Ghana http://ugspace.ug.edu.gh

23
2.4 The Concept of Quality
Over the years, the issue of quality has been applied to products and performances. The term
quality however, has attracted considerable debate among academics and business practitioners
when applying concept to service delivery as a result of the escalating growth of the service
industry. Zeithaml and Bittner (2000) posit that it is difficult to defined the term quality. These
authors further stress the fact that there is no universally accepted definition of quality. Scholars
in the field have defined the term differently from different perspectives.
2.4.1 Quality Defined
Table 2.1 Definitions of Quality
AUTHOR(S)
AND YEAR
DEFINITIONS MAJOR THEMES
Crosby
(1974)
“Quality is conformance to requirements”. Meeting requirement
Deming,
(1968)
Defines quality as “the degree to which
performance meet expectations”.
Meeting expectation
Feigenbaum,
(1983)
Quality “means best for a certain customer
conditions that is the actual use and the selling
price of a product or service”.
Fit for Purpose
Gilmore,
(1974)
Quality is “the degree to which a specific
product satisfies the wants of a specific
consumer”.
Customer satisfaction
Deming,
(1968)
Quality “consists of the capacity to satisfy a
want”.
Customer satisfaction
Sahney et al.,
(2004)
Quality “is a property of products or services or
processes producing these product or services”.
Focus on the process
Juram1989
cited in
Sahney et al.,
(2004)
Defines quality “as meeting or exceeding
customer expectations”
Customer expectation
Lovelock and
Wirtz, 2007
“Quality is how a customer defines it and must
be defined from customers’ perspectives”
Customer focus
University of Ghana http://ugspace.ug.edu.gh

24
SOURCE: Author`s own tabulation based on the literature review
From the table above it is evident that, people view quality from different perspectives. Yet
everyone understands what is mean by quality. “In a manufacturing product, the consumer as
the user recognizes the quality of fit, finish, appearance, function and performance” (Deming
1968). The quality of service may be related based on the level of satisfaction by the customer
receiving the service. The final decision in this evaluation lies with the consumer. The
objective here is to ensure that the consumer is satisfied to pay for the product or the service
provider. Scholars in the relevant field of knowledge (Deming, 1968; Tuchman, 1980; Leffler,
1982; Gilmore, 1974s; Crosby, 1974; Broh, 1982) view quality differently. This provides the
means to assess quality using a relative measure. Resister (1995) gave a broader view of the
quality definition by defining quality as an attitude about how to conduct a business irrespective
of the type of business. According to this author, the attitude consists of two things, the first
part emphasizes on meeting customer expectations, needs and wants, whereas, the second part
emphasizes doing it in an efficient way. This, therefore, implies that inefficient process does
not lead to excellence. Hence quality goes beyond just the product or service provided to how
it is provided. This makes employee and management training an essential tool for ensuring
effective internal communication to achieve a successful quality concept in an organization.
For the purpose of this study, quality will be viewed from Gronroos, (2001) perspective, that
is quality is perception, therefore managing quality is all about managing perception
(expectation and experience).
2.5 Service Quality
According to Hirvenon, (2007), the growth of the service industry in the global economy has
resulted in a growing interest in service quality. The concentration of the concept used to be on
tangible goods. Scholars (Hirvenon, 2007; Dale, 2003; Douglas, Mc Celland, & Davis, 2008)
University of Ghana http://ugspace.ug.edu.gh

25
have argued that it is difficult to define and measure service quality compared to tangible goods.
The service quality concept has received considerable debate in the marketing research
literature. However, as a result of the challenges in defining and measuring it, the concept has
still not been given a definite definition (Winsiewski, 2001). Various definitions have emerged
over the years, with different interpretations of what the term service quality actually means.
The table below presents a brief overview of definitions of service quality.
Table 2.2 Definitions of Service Quality
AUTHOR(S)
AND YEAR
DEFINITIONS MAJOR THEMES
Gronroos
(1982)
Defines service “quality as customer perceived
quality which is defined as the confirmation or
disconfirmation of the customer’s expectation of the
service compared with the customer’s perception of
the service actually delivered”.
The difference
between customer
expectation and
actual service
performance.
(Asubonteng,
McCleary &
Swan, 1996).
Also defined it as “the extent to which a service
meets customers’ needs or expectations”.
Meeting
expectation.
Parasuraman,
Zeithaml and
Berry (1988)
Defines service quality as “a form of attitude related,
but not equivalent to satisfaction, that results from a
comparison of expectations with perceptions of
performance”.
The difference
between expectation
and performance.
Lewis and
Smith (1989)
Suggests that “perceived service quality is a
consumer judgment which is derived after comparing
expectations of service with their perceptions of
actual service performance”. Customers therefore
evaluate services as they interact with the service
provider in a service encounter.
The difference
between expectation
and performance.
Parasuraman,
Zeithaml and
Defines service quality “as a consumer attitude
reflecting the perceived overall superiority and
Consumers
perceptions
SOURCE: Author`s own tabulation based on the literature review
26
University of Ghana http://ugspace.ug.edu.gh
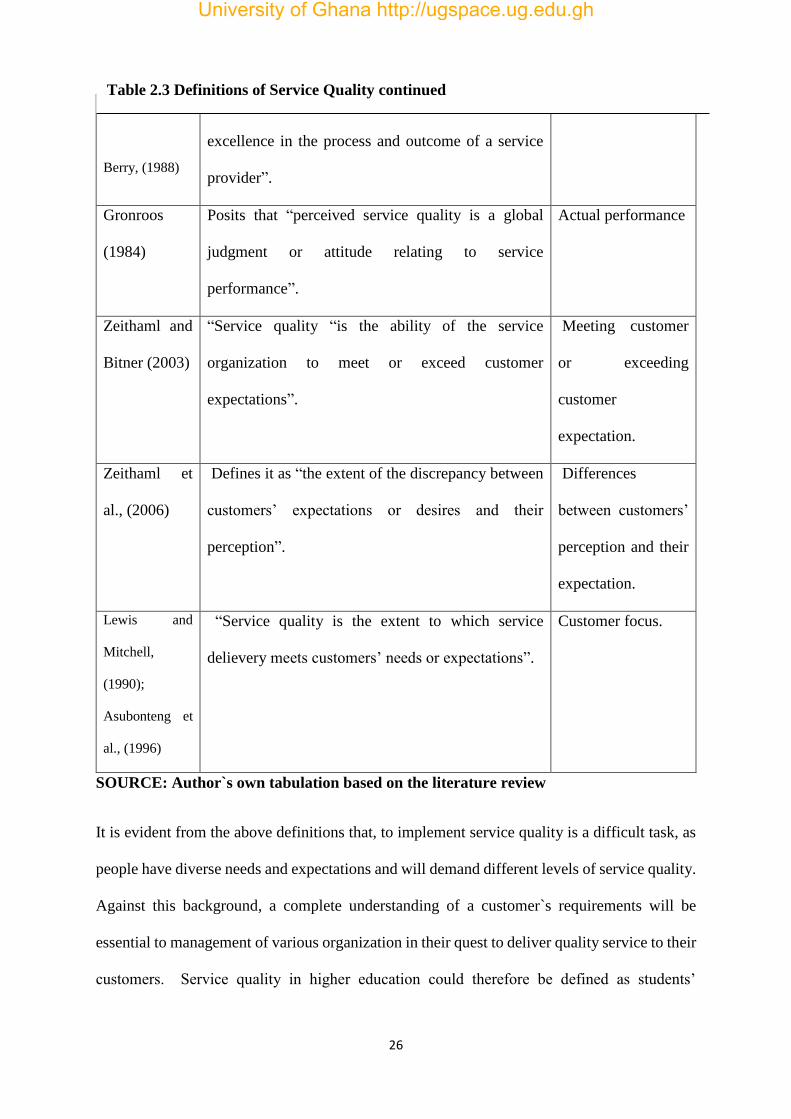
26
Berry, (1988)
excellence in the process and outcome of a service
provider”.
Gronroos
(1984)
Posits that “perceived service quality is a global
judgment or attitude relating to service
performance”.
Actual performance
Zeithaml and
Bitner (2003)
“Service quality “is the ability of the service
organization to meet or exceed customer
expectations”.
Meeting customer
or exceeding
customer
expectation.
Zeithaml et
al., (2006)
Defines it as “the extent of the discrepancy between
customers’ expectations or desires and their
perception”.
Differences
between customers’
perception and their
expectation.
Lewis and
Mitchell,
(1990);
Asubonteng et
al., (1996)
“Service quality is the extent to which service
delievery meets customers’ needs or expectations”.
Customer focus.
SOURCE: Author`s own tabulation based on the literature review
It is evident from the above definitions that, to implement service quality is a difficult task, as
people have diverse needs and expectations and will demand different levels of service quality.
Against this background, a complete understanding of a customer`s requirements will be
essential to management of various organization in their quest to deliver quality service to their
customers. Service quality in higher education could therefore be defined as students’
Table 2.3 Definitions of Service Quality continued
University of Ghana http://ugspace.ug.edu.gh

27
measurement or evaluation of how service delivered by an educational institution matches with
the expectations of the students (Fosu & Owusu, 2015). It also infers that the quality of service
delivered is defined by the students and not the institutions. Hence, educational institutions
must first understand students’ expectations as the basis for developing and delivering quality
service (Fosu & Owusu, 2015).
2.5.1 Contemporary Views on Service Quality
It is evident from the review of marketing literature that the concept of service quality has
received considerable attention from both academics and practioners over the last three
decades. Marketing researchers (Gronroos, 1982; Parasuraman et al., 1985; Gummesson, 1993;
Cronin & Taylor, 1992; Abdullah, 2005) have relentlessly conducted studies in the various
areas of service quality to enhance the understanding of the field both in theory and in practice.
Their studies have not only contributed to the development and the expansion of service quality
as an important area for research, but have actually contributed immensely in attracting a
considerable interest among academics, practitioners and service quality researchers as well as
laying the foundation in which research may be carried out in the field.
Different opinions have emerged concerning the growing interest in service quality by
marketing researchers and practitioners alike. Some are of the view that, interest has been
aroused because of its contribution to bottom line performance (Ewing & Caruana, 1999.
Others are also of the view that it contributes to market share, customer satisfaction and loyalty,
(Zeithaml et al., 2006, Parasuraman et al., 1994). In another case it is argued that, although the
concept is not regarded as an important business requirement, it is a competitive weapon that
is crucial to corporate profitability and survival (Voss, 2004; Maddern , Maull , Smart , &
Barker, 2007; Newman, Cowling, & Leigh, 1998). In this regard, various institutions seeking
University of Ghana http://ugspace.ug.edu.gh

28
to achieve competitive advantage in the industry in which they operate need to embark on
service quality delivery as a strategic tool to achieve customer satisfaction, delight and loyalty.
Kotler and Keller, (2006) posit that customer satisfaction is an antecedent to loyalty through
delivery of high value product and services that meets the needs and wants of customers. To
successfully achieve customer loyalty and retention it is worthy to note that, management of
various institutions needs to understand and satisfy customer needs and requirement, so as to
gain a competitive advantage in the industry in which they operate (Day, 1994). That is, the
primary assumptions underlying the marketing concept (Day, 1994).
2.5.2 Models of Service Quality
2.5.3 Gronroos Model
Gronroos (1984) proposed a functional and technical quality model of service quality. The
model is made up of three different dimensions: functional quality, technical quality and image
quality. The model embraces image quality with the functional quality as portrayed by
(Parasuraman et al., 1988), which is more realistic of today’s turbulence global marketplace
than models that only depict functional quality, (Nimako, Azumah, Donkor, & Veronica,
2010). Nimako et al., (2010) posit that, customer evaluations of perceived performance of
service against his/her perceived service quality leads to a measure of service quality.
Technical quality is the clarified quality of what consumer actually obtains as the outcome of
his/her interaction with the service provider and is crucial to them and to their evaluation of the
quality of service (Nimako et al., 2010; Stromgren, 2007). The outcome quality forms an
integral part of the quality experiences and can be measured objectively by customers as it
provides technical solutions to customer’s problem (Nimako et al., 2010). Stromgren, (2007)
posits that customers may find it difficult to evaluate technical aspects. However, they may
University of Ghana http://ugspace.ug.edu.gh
29
rely on other measures of quality attributes that are associated with the functional aspects of
the service. The functional aspect is concerned with services delivered (Stromgren, 2007). The
functional aspect is an interrelated process and denotes how the customer receives and
experiences the service delivered (Nimako et al., 2010). Whereas customers can measure
technical quality, functional aspects cannot be measured objectively; customers’ perception of
functional quality is subjective (Stromgren, 2007). Functional quality is a function of how
technical outcome is received.
Gronroos (2000) emphasized the importance of corporate image in his perceived service
quality model, which is similar to the idea proposed by Lithinen and Lithinen (1982). In view
of this the image concept was introduced as an important attribute in the original perceived
quality model to ensure the dynamics aspects of the service perception process (Kang & James,
2004).
A well-managed and favorable image is an asset to any firm, as it influences customers’
perceptions of a firm’s communication efforts as well as operations in many respects (Kang &
James, 2004; Zeithaml et al., 2006; Stromgren, 2007). Any service firm that builds a positive
and favorable image in the minds of customers, will surely enjoy customer loyalty and “petty,
petty” mistakes will be forgiven when service failure occurs (Zeithaml et al., 2006;
Fitzsimmons & Fitzsimmons, 2006; Zeithaml & Bitner, 2000; Kang & James, 2004). It is
however, very essential to note that service firms that often commit mistakes are likely to
communicate negative impressions in the minds of customers and its image will be damaged.
Service failure is inevitable and service customers are likely to experience it even in the firms
with “world class” systems and employ state of the art technologies in service delivery
(Zeithaml & Bitner, 2003; Hinson, 2006). If service failure occurs repeatedly over time and the
University of Ghana http://ugspace.ug.edu.gh

30
provider fails to address the mistakes, the provider’s image will be affected negatively and the
impact of the mistake will be severe in the customer’s mind (Kang & James, 2004). Once a
positive image is formed customers can neglect minor mistakes (Kang & James, 2004;
Strongren, 2007). On the other hand, if service failures occur frequently customers form
negative image and the impact on perceived service quality will be remarkably greater than
anticipated (Hirvonen, 2007). The perceived image can be described as a sample in terms of
how customers perceive service quality (Kang & James, 2004; Hirvonen, 2007; Strongren,
2007). The model is noted for its usefulness in service quality evaluations involving
consequences and procedures, yet critic have argued that, the role of consumers has not been
taken into consideration in the process (Nimako et al., 2010).
2.5.3.1 SERVQUL
The SERVQUAL scale was developed by Parasuraman, Zeithaml and Berry (1988). The model
performs an analysis of an organization’s service quality performance against customer service
quality requirement (Parasuraman et al.,1988). According to these authors, the respondents
complete a series of scales which measures their expectations of a particular company base on
a specific service characteristic. Customers are required to record their perceptions of that
company’s performance on those same dimensions. In a situation where perceived
performance ratings fall below expectations, quality is poor (Parasuraman et al.,1988). They
posit that, the gap from the analysis may be used as a standard for service quality enhancement.
This model therefore provides detailed information about customer perceptions of service i.e.
the customer’s benchmark performance levels as perceived by customers, customer comments
and suggestions as well as impressions from employees with respect to customer expectations.
University of Ghana http://ugspace.ug.edu.gh

31
The SERVQUAL scale assumes service quality as containing five dimensions which can be
measured through 22 items under five heading, namely tangibles, reliability, responsiveness,
assurance and empathy (Parasuramanan et al., 1985;1988;1991). Relating these dimensions to
higher education, they include appearance of the institution’s physical facilities, equipment,
personnel, and communication material (Tangibles), the capacity of the university to
accomplish the promised service dependably and accurately (Reliability), the readiness of the
university to help the students and deliver quick service (Responsiveness), the knowledge and
politeness of teachers and their capacity to carry trust and confidence (Assurance) and caring,
individualized attention the university delivers to its students (Empathy) Parasuraman et al.
(1985; 1988; 1991).
The five SERVQUAL dimensions identified by Parasuraman et al. (1985, 1988, & 1991) have
been generally used in evaluating higher education service quality; According to Cuthbert
(1996), notwithstanding the criticisms several authors have made, the SERVQUAL scale still
seems to be the most useful model for the evavluation of service quality in higher education.
Cuthbert, (1996) further contentd that, expectations should be taken into consideration when
measuring service quality in higher education. Hill (1995) studied how expectations and
perceptions of service quality can be stable over time in the higher education context. His
empirical study concluded students` perception of service quality experienced was less stable
over time compare to expectation.
2.5.3.2 Gummerson`s 4 Q model
In 1993 Gummerson developed the 4 Q model based on the earlier models. The main brain
behind the model was that a service has both tangibles and intangible dimensions. The main
University of Ghana http://ugspace.ug.edu.gh

32
purpose of the model is to help develop and manage quality, irrespective of the type of offering,
whether pure service or tangible goods. The 4 Q model emphasizes customer expectation and
their experience as well as how these two constructs affects corporate image. The model further
explains how customer perception can affect corporate image as well as how customer
perception contributes to brand reputation.
2.6 Dimensions of Service Quality
Customers judge service quality by certain criteria. According to Kotler, Asplund, Rein, and
Heider (1999) and Parasuraman et al. (1988) these criteria determine customers’ perceptions
of service quality. The determinants as proposed by Parasuraman et al (1988) include access,
credibility, knowledge, reliability, security, competence, courtesy, responsiveness, time,
timeliness, empathy, communication, and tangibles. Five key quality dimensions were later
identified by Parasuraman et al. (1988). The SERVQUAL is an intensive assessment that
replicates the customer’s perception of a particular service, quality dimension namely
Reliability, responsiveness, assurance, Empathy, and Tangibles (Parasuraman et
al.,1985,1988).
2.6.1 Reliability
Parasuraman et al., (1988) defined reliability as the ability to perform service dependably and
accurately. The ability of a firm to deliver promises is the most vital factor to providing quality
services. Organizations who fulfill their promises on service delivery, provision, resolutions
and pricing are often seen as customer oriented and are preferred organizations to do business
with, in the eyes of customers (Robert, 2005). Thus, customers want to be loyal to firms that
fulfill their promises, more importantly, their promises about the service delivery as well as
core service as salient charracteristics. Therefore, organizations should note that, customers’
University of Ghana http://ugspace.ug.edu.gh

33
expectations of reliability are a very important predictor of their perception (Zeithaml & Bitner,
2003 as cited in Robert, 2005). In higher education, when a service is delivered to students at
the time it was promise to be delivered, may be consided reliable by the students (Arpin, 2007).
University staff dealing with student’s problems promptly, ensuring error free records by the
administrative staff, performing the services correctly to students the first time; among others
are some of the determinants of the reliability of an institution.
2.6.2 Responsiveness
Zeithaml and Bitner, (2003) defined “responsiveness as the willingness to help customers and
provide prompt service”. Customers evalutate a firm’s responsiveness by taking into
consideration the length of time it takes to address their request, questions, complaints and
problems (Zeithaml & Bitner, 2003). Responding quickly to a request or complaints leads to a
higher rating on this dimension. For a successful service experience regarding this dimension,
organizations’ need to view service delivery from the customer’s perspectives and not the
organizations. Organizations should set standards for responsiveness according to the
customers’ requirements because their notion of what constitutes speed and promptness might
differ from the custmers. Zeithaml and Bitner (2003) contend that, designing service
employee’s jobs, having a clear job description and training form a strong foundation for
responsiveness. Zeithaml and Bitner., (2003) argue that customer`s standards for prompt
services may be different from organizational standards. In the context of higher education, a
university student’s standards for prompt service are more likely to be different from
management standards.
2.5.3 Assurance
University of Ghana http://ugspace.ug.edu.gh

34
This refers to the ability of a service firm to inspire trust and confidence in the firm through
knowledge, politeness, trust and worthiness of the employees (Zeithaml & Bitner 2002). This
dimension refers to the firm’s employees. Are employees skilled workers who are able to gain
the trust and confidence of the customers? Ensuring that employees possess the right attitude
toward quality is of the utmost importance to service organizations particularly. According to
Walker, (1995) employees’ degree of friendliness, credibility, trustworthiness and competence
will be reflected in customers’ perception of service quality. Organizations can enforce the
assurance dimension in the minds of customers by providing strong evidence of the service to
the customers particularly at the early stages of the relationship (Walker, 1995). In the context
of higher education, the provider would be interested in building trust and loyalty between its
employees and students. In the early stages of the student-institution relationship, the student
may need tangible evidence to access the assurance dimension (Walker, 1995). According to
Zeithaml and Bitner (2002), visible evidence of degree, honours, special certifications and
other awards would give a new customer (student) confidence in a service provider. In the
context of this study, an example could be the link between a lecturers and students in a
university.
2.5.4 Empathy
The empathy dimension “refers to how the company cares and gives individualized attention
to their customers, to make the customers feel extra value and special” (Ziethaml & Bitner,
2002). An organization’s ability to obtain information about their customers’ personal issues,
needs and desires goes a long way in helping to create customized and personalized services
for customers. This invariably makes the organization more competitive. In the context of
higher education, this dimension includes giving personal attention to students and
understanding their specific needs (Arpin, 2007).
University of Ghana http://ugspace.ug.edu.gh
35
2.5.5 Tangibles
Parasuraman et al (1988) defined the tangible dimension as the appearance of a service firm’s
facilities, employees, equipments and communication materials. ‘Tangibles’ is about creating
first hand impressions. Tangibles have the capacity of attracting existing customers to approach
the service provider’s customer service centers, and more importantly, eliciting positive
perceptions of the service provider in the minds of the potential customer (Nimako et al., 2010).
Teaching can be regarded as highly intangible, because services represent performance or
actions rather than objects (Fosu & Owusu, 2015), Services, including education, are difficult
for students to comprehend (Fosu & Owusu, 2015). Thus, implying that managers of
educational institutions can manage physical evidence by providing tangible clues to service
quality; for instance, by reducing service complexity where possible and encouraging word-of-
mouth recommendations from others. Bitner (1992) explains the position of the more physical
constituent of delivery systems in education context; which is known as ‘services cape’.
2.6 SERVPERF
Although the SERVQUAL model has been used extensively over the years, it has received
various criticisms. Cronin and Taylor (1992) were among the researchers who criticized the
SERVQUAL scale of measurement. In questioning the conceptual base of the model, they
contend that the scale is confusing with customer satisfaction. Furthermore, they posited that
the Expectation component of SERVQUAL be rejected and rather the Performance element
alone be used. Cronin and Taylor (1992) further suggest that measuring perceptions alone
might provide a better indicator of service quality than measuring the differences between
expectations and perceptions. On the operational perspective.) Buttle (1996) finds difficulty in
University of Ghana http://ugspace.ug.edu.gh

36
conceptualizing expectations, the limited number of items in each dimension, the problems
related to the double administration of the instrument which fuels customer confusion and
boredom as the key challenges associated with SERVQUAL. A study by Carman (1990)
empirically tested SERVQUAL in four different areas and observed that the dimensions were
not general enough to cater for the needs of all industries. This led to the proposal of the
SERVPERF model. Cronin and Taylor (1992) empirically supported their argument through a
study across four industries including, banks, pest control, dry cleaning and fast food
2.7 HEdPERF Model
Both the SERVQUAL and SERVPERF models have been criticized on their operational
effectiveness to serve industry specific service quality e.g Carman (1990), Cronin and Taylor
(1992) and Abdullah (2005) suggested that industry-specific service quality measures may be
more appropriate. Abdullah (2006) contends that generic measurements (SERVQUAL and
SERVPERF) of service quality may not be totally suitable for assessing perceived quality
education making it more needed for scholars to create a specific scale for higher education. It
has also been identified that little has been done in the development of service quality models
specifically for higher education (Fosu & Owusu 2015).
In view of these challenges, Abdullah (2005) proposed a service quality model specifically for
higher education. This model, known as HEdPERF (Higher Education Performance-only), is a
new and improved comprehensive performance based measuring scale that attempts to capture
the authentic determinants of service quality within higher education. The model, which
comprised of as set of 41 items (Abdullah, 2006) did not only consider academic components,
but also aspects the student considers in their overall assessment of service quality in higher
education.
University of Ghana http://ugspace.ug.edu.gh

37
Five dimensions of the service quality concept were identified; they are non-academic aspects,
academic aspects, reputation, and access and programme aspects. Non-academic aspects
consist of items that are essential to enable students to fulfill their study obligations, and relates
to duties carried out by non-academic staff. It captures how administrative staff communicates
to students; how students are treated and the knowledge possessed about the institution by
administrative staff. Academic aspects relate to the responsibilities of academics. It includes
positive attitudes, good Communication skills, adequate consultation, regular response to
students`problems and subcontracting ability of teaching staffs, which recount to the
responsibilities of academics. Reputation aspect of HEdPERF has to do with the professional
image the institution projects to the outside world and the employment of graduates from the
institution. Abdullah (2005) explains access as including issues such as approachability, ease
of contact, availability and convenience. Programme issues relate to the ability of the
institution/university to offer a wide range and reputable academic programmes/specializations
with flexible structures and health services (Abdullah, 2005).
2.8 Significance of Service Quality
Many scholars have reported the significance of good service quality in the marketing efforts
of organisations. According to Zeithaml and Bitner (2003), service quality can help companies
attract more and better customers to the business. The business can gain a positive reputation,
which invariably leads to higher market share and the ability to charge better prices than the
competition when quality of service is good Zeithaml and Bitner (2003). Aggressive service
quality greatly aids offensive marketing efforts which involve market capture, market share,
and reputation and price premiums (Hirvonen, 2007) Vibrant organizations have implemented
quality systems to ensure that they delight their customers (Hirvonen,2007). Industries which
University of Ghana http://ugspace.ug.edu.gh

38
have seen successful implementation of quality systems have derived the following benefits;
reduction in complaints from customers, both internal and external, reduction in the cost of the
product, reduction in production time, increased systems efficiency, boost morale of workers
and improve customer satisfaction (Hirvonen, 2007)
2.9 Concept of Customer
A customer is the recipient of a good, service, product, or idea, obtained from a seller, vendor,
or supplier for a monetary or other valuable consideration (Resister, 1995). A customer may
or not also be a consumer, but the two notions are distinct, even though the terms are commonly
confused. A customer purchase goods; a consumer uses them; (Anderson, Jain & Chintagunta
1993). The term ‘customer’ is commonly referred to end-users of a product. Shank, Walker
and Hayes, (1995) suggests that “customer” is a generic term referring to anybody who receives
a service or a product from some other person or group of people”. Customers can be
categorized into internal and external, where internal customers refer to the staff or employees
and external customers refer to other stakeholders of an organization. Within the external
customer group include; clients, suppliers, consumers, and constituents.
2.10 Students as Customers of Higher Education
Different authors have identified that higher educational institutions have a great number of
customer groups. These customers come with different requirements, complementary or
contradictory among themselves (Juran 1988). Joseph and Joseph (1997) divided customers in
higher education into six different actors who are linked to the educational value chain. These
include; current students, potential students, employees, employers, government and industry.
The authors further classified customers into internal and external; internal customers are those
who work to satisfy the needs of the external customers (Juran, 1988). Customer classification
University of Ghana http://ugspace.ug.edu.gh

39
into internal or external is based on their location and the frequency of interaction the institution
has with them. Students can therefore be classified as internal or external. This also depends
on the role developed by them during their course (Juran, 1988).
Yeo (2008) finds that those who regard students as primary customers of higher education
associate them with being involved in the input and output of the learning process. On the other
hand, those who see students as potential employees and primary customers hold that it is vital
to consider the economic reality of the situation where course modules should be tailored to
the needs of the employers. Jaraiedi and Ritz (1994) agree with the latter view arguing that
students have no conception of what they need to learn and that education is preparing them
with the aim of achieving long term benefits. With this long term perspective, the authors
further argue that potential employers are primary customers while students are regarded as
secondary customers.
Joseph and Joseph (1997), however, suggest that, since students are primary beneficiaries of
education they should be treated as primary customers. Students now do not consider
themselves as active learners and participants in the attainment of their education, but also as
customers of the educational “goods” the institutions deliver as well as the services evaluators
of what these institutions offer.
University of Ghana http://ugspace.ug.edu.gh

40
2.11 Customer Perception
Table 2.4 Definitions of Perception
AUTHOR(S) DEFINITIONS MAJOR THEMES
Strydom,
Jooste and Cant
(2000)
Define customer perceptions as “the process of
receiving, organizing and assessing meaning to
information or stimuli detected by the customer’s
five senses”.
Making meaning
about the world
around us based on
our experience.
Kotler and Fox
(1995)
Defines “perception as the process by which an
individual selects, organizes and interprets
information inputs to create a meaningful picture
of the world”.
Making sense out of
the world us based on
base our experience.
Nadri,
Kandampully
and Hussein,
(2009)
Services marketers often view quality in terms of
perceived service quality.
Quality is judged by
the perceived service
quality
Rust and Oliver
as cited in
Beaumont,
(2007).
Posit that, perceptions can also be explained as
“the end result of a number of observations by the
customer due to the subjective nature of service
quality”.
Perception is based
on expectation and
experience
SOURCE: Author`s own tabulation based on the literature review
2.12 Students Perception
Students’ perception is a major concept in this study. According to Zeithaml, Bitner and
Gremler, (1996), perceived service quality is the outcomes from the comparison of customer
service expectations of real performance. In the context of higher education, perceived service
University of Ghana http://ugspace.ug.edu.gh

41
quality is the overall appraisal of the institution’s services (Fosu & Owusu, 2015). Perceived
service quality could be the student’s evaluation of a number of service encounters with office
staff, tutors, lecturers, the head of department etc. (Oilfield & Baron 2000). When students
appraise course lecturer highly we would hope it is because the lecturer has shaped effective
learning Centra & Gaubatz, 2005). This belief is actiually the foundation for many rationality
studies that have been conducted with student assessments of courses and instructors (Centra
& Gaubatz, 2005). According to Oilfield and Baron (2000), students evaluate services of
higher education using three main criteria. These, according to the authors, has been labeled as
requisite encounters which essentially enable students to fulfill their study obligations;
acceptable encounters which refers to what students acknowledge as being desirable but not
essential during their programme and functional, which Oilfield and Baron (2000) define as an
encounter of a practical or utilitarian nature.
Several authors find the relationship between students’ perceptions and their ratings of service
quality. For instance, Dickinson (2015) in his study found that students` perceptions of learning
in a course is connected more closely with student evaluations of teaching than did differences
in pre- and post-test scores. Ryan and Harrison (1995) and Cashin and Downey (1992, 1999)
found that students’ perceptions of learning were highly associated with their overall ratings of
education effectiveness (Centra & Gaubatz, 2005).
Cuthbert (1996) holds that, in the context of higher education, experiences of students are
varied and continuous, over months and years and this highlights the relevance of the context
when measuring perceived service quality.
University of Ghana http://ugspace.ug.edu.gh

42
2.13 Students` Expectations and Perceptions of Service Quality its relationship on their
Satisfaction and Loyalty
Studies have found that students` expectations are a valuable source of information for
managers of higher education (Hill, 1995). Higher education managers may respond
appropriately to the idealistic expectations of students, especially new graduates, if they are
able to know their expectations (Scherter & Scherter, 2004). These institutions can thus respond
to student’s expectations at a more realistic level as they would be able to, at least inform
students of what is realistic to expect from lecturers (Hill, 1995). Hill, (1995) posit that the
knowledge of student’s expectations may help lecturers design their teaching methods and
programmes. Perceived quality of services provided by higher education depends on students`
expectations and values (Telford & Mason, 2005). Several studies have indicated a positive
impact of expectations and values on variables such as student participation, role clarity and
motivation to participate in the service encounter (Claycomb, Lengnick-Hall, & Inks, 2001).
According to the literature review, perceived service quality is an antecedent to student
satisfaction (Marzo-Navarro, Pedraja-Iglesias, & Rivera-Torres, 2005). Positive perceptions of
service quality can lead to student satisfaction (Marzo-Navarro et al., 2005) and satisfied
students may then engage in behaviors by engaging in positive word-of-mouth communication
and return to the university to take other courses (Wier-Jenssen, Stensaker, & Grogaard 2002;
Mavondo & Zaman., 2004). It is therefore hypothesized that;
H1; There is a significant positive relationship between perception of service quality and
students` loyalty.
H2; There is a significant positive relationship between perception of service quality and
students` satisfaction.
University of Ghana http://ugspace.ug.edu.gh

43
2.14 Students` Expectation and Experience
According to Gronroos (1982), perception of quality of service being perceived by a customer
is the comparism between their expectation and real life experience. Quality management is
synonymous to managing perception and two things form customer perception that is
expectation and experience (Gronroos, 1991). In a situation where customer expectation is
greater than experience, perceived quality is low, which leads to customer dissatisfaction. On
the other hand, when experienced is greater than customer expectation, perceived quality is
high which may eventually lead to customer satisfaction (Gronroos, 1991).
Zeithaml and Bitner (2003) argue that customer expectations are belief about the service
delivery which serves as a benchmark against which the organizational performance will be
evaluated. The authors further posit that customer expectation of good and or/ services vary
among different industries as well as individuals. For example, in a university environment,
the expectation of an undergraduate students may be different from the expectation of a PhD
student. A service provided by a university may not meet a PhD student’s expectation and will
be considered poor service, however, an undergraduate student may consider the same service
as high quality. With this understanding, it is essential for managers to ensure that there is
conformity between student’s expectation and their experience. Parasuraman et al., (1988),
identified various types of customer expectation as:
Desired service; This is the level of service that the customer will be willing to receive. For
the case of a university, the desired service level of a student may be a student expecting a
lecturer to give him or her personal attention during consultation as well as in class.
University of Ghana http://ugspace.ug.edu.gh
44
Adequate service: This is defined as the level of service the customer is willing to accept. In
a university environment a student may accept further explanation from the lecture after the
lecture ours, due to time constraint, class size and other factors that may prevent students from
understanding what was thought in class.
Service performance that fall below an adequate service level may lead to customer
dissatisfaction and frustration, on the other hand service performance that exceeds the adequate
service level may lead to customer satisfaction and delight (Arpin 2007). Customers may react
negatively or positively depending on the level of their expectations that is their zone of
tolerance (Lovelock & Wirtz, 2007).
In the context of higher education, a university student may be expecting their mid semester
results within a week or their end of semester results three weeks after school has resumed,
which is within their zone of tolerance, the case where the results are released after this time
period will result in frustrations and dissatisfaction.
Predicted service: This is the level of service a customer expects to receive, which influences
their experience (Lovelock & Wirtz, 2007). The adequate level may be higher or lower
depending on the predicted service level. For the example in a university a student may expect
fifteen (15) minutes delayed, while other students are receiving assistance from the lecturer
after a class. In this case the service received is likely not to fall below the adequate service
level.
University of Ghana http://ugspace.ug.edu.gh

45
2.15 Service Quality in Higher Education
Table 2.5 Definitions of Quality in Higher Education
AUTHOR(S) DEFINITIONS MAJOR THEMES
Sahney et al.,
(2004)
“Quality in higher education follows the
definitions of quality in general”.
Peters and
Waterman,
(1982),
“Defined service quality in the context of
education as excellence in education”.
Excellence
Feigenbaum,
(1983);
“Defined quality in education as value addition
in education”.
Value
(Gilmore, (1974)
and Crosby,
(1979)
Defined it as “conformance of education output
to planned goals, specifications and
requirements”.
Meeting
requirement.
Crosby, (1979) Defined it as “defect avoidance in the education
process”.
Quality assurance
(Parasuraman et
al., (1985).
Define quality in education as “meeting or
exceeding customer expectations of education”.
Meeting and
exceeding students’
expectation.
SOURCE: Author`s own tabulation based on the literature review
Literature pertaining to service quality in the higher education sector is significantly low
(Beaumont, 2007). Traditionally, many researchers have focused their efforts on commercial
services (Sultan & Wong, 2010). Institutions of higher education are increasingly realizing that
they are part of the service industry and are putting more emphasis on student’s satisfaction as
they face increasing competition. (DeShieds, Kara, & Kainak, 2005).
University of Ghana http://ugspace.ug.edu.gh

46
De hield et al., (2005) also argue that it is imperative for higher education institutions to apply
market-orientated principles and strategies that are used by profit making organizations.
Hemsly-Brown and Oplatka (2006) found that these principles are being applied to higher
education in the bid to achieve competitive advantage.
Hill (1995) contends that, as higher education is considered a service, then it should exhibit all
the classical features of a service. This makes its measurement in the industry a complex issue.
Many scholars have attempted to discuss the framework towards the research into services
marketing from an educational perspective (Kara & DeShield, 2004)). Service quality literature
suggests the importance for managers of higher educational institutions to monitor the quality
of services they render in order to commit themselves to continuous improvement (Kara &
DeShield, 2004). Measuring service quality from an educational perspective has received
considerable debate. Many researchers have posited on the best way to define service quality
in higher education institutions (Shank et al., 1995). It is, however, profound to note that higher
educational institutions have become a conducive environment for researchers to understand
the role and importance of service quality in that industry (Shank et al., 1995). This may be
due to the competitive nature of the education industry and its associated challenges.
The measurement of service quality has however turned out to be a controversial issue because
of the difficulty in defining quality (Shank et al., 1995). Parasuraman et al 1998 suggested that
service quality concepts result from the comparison of performance perception with
expectation. Other scholars disagree and argue that it is derived from perceptions of
performance only (Cronin & Taylor 1992) claiming that including expectations in the
measurement is irrelevant coupled with the misleading information it provides for the model
intended to evaluate perceived service quality.
University of Ghana http://ugspace.ug.edu.gh

47
2.16 Assessing Service Quality in Higher Education
Service quality has since emerged as a strategic tool for managers of higher education to
achieve competitive advantage in the face of rising competition. Hence measuring service
quality in higher education has become an important exercise to determine students’ level of
satisfaction and possibility of continued enrolment (Fosu & Owusu, 2015). As a result, both
academics and practitioners alike are interested in accurately determining service quality in
order to better appreciate its indispensable antecedents and significance, and ultimately,
develop methods for refining quality to accomplish competitive advantage and build customer
loyalty (Abdullah, 2006).
However due to the elusive nature of service quality constructs, it has made it extremely
difficult to define and measure (Abdullah, 2006). The past two to three decades has seen some
scholars attempting to define the evaluation standard of service quality independent of any
particular service context, for instance, SERVQUAL (Parasuraman et al., 1988) and
SERVPERF (Cronin & Taylor 1992). The SERVQUAL frame measures service quality by
comparing perception of performance with expectation whereas SERFPERF assumes only the
perception of performance. The expectation of performance scale on the other hand compares
the gap between perceived performance and the ideal amount of a feature rather than the
customer’s expectations Parasuraman et al., 1985). Diverse studies using these scales find
difficulties resulting from the conceptual or theoretical component as much as from the
empirical component (Abdullah, 2006).
2.17 Students` Satisfaction
Customer satisfaction has often been used interchangeably with service quality (Palmer, 2011).
This has led to difficulties when attempting to distinguish between the theoretical concepts
University of Ghana http://ugspace.ug.edu.gh

48
(Beaumont, 2007). Munteanu, Ceobanu and Bobalaca and Anton, (2010) posit that like service
quality, customer satisfaction is an abstract and ambiguous concept and, as such, many scholars
have attempted to reach a consensus on the definition of the concepts (Giese & Cote, 2001).
Satisfaction according to Oliver (1999) is the perception of pleasurable fulfillment of a service.
Althiyaman (1997) provides a contrasting view and explains satisfaction as the result of the
evaluation of a specific transaction or consumption experience.
Kunanusorn and Puttawong (2015) define satisfaction as an overall customer attitude towards
a service provider, or an emotional reaction to the differences between what customers
anticipate and what they receive herein regarding the fulfillment of some needs, goals or desire.
The authors found that it is important for higher education institutions to satisfy their customers
(students) in order to ensure their retention. For instance, it is likely that a dissatisfied student
will reduce the number of courses or drop out of a university completely. Student satisfaction
or dissatisfaction hence lead to student retention or attrition (Kara & DeShield, 2004).
According to a study done by Banwet and Datta (2003), satisfied students are found to be loyal
and satisfied students were likely to attend another lecture delivered by the same lecturer or opt
for another course taught by him/her. Using a survey of 168 students, the study revealed that
students pay more attention to the result of the lecture (skills and knowledge received,
capability of class notes and reading materials etc) than any other dimension. This goes to
support a similar study by Schneider and Bowen (1995).
Studies have found that a positive perceptions of service quality has a significant influence on
student satisfaction (Alves & Raposo, 2010). Satisfied students would therefore attract more
students through word of mouth communication. According to Hanaysha, Abdullah and
Worokka, (2011), students can be moved or stimulated by both academic performance and
University of Ghana http://ugspace.ug.edu.gh
49
administrative efficiency of their institution. The authors posit that higher education institution
are like other service providers whose success and growth is dependent on the students’
perception and thus, one of the easiest yet powerful marketing strategy is through positive word
of mouth. Perrault and Thomas (2011) argue that customer perception is essential to an
organization, since services are intangible and will, to a large extent, depends on positive
perception. Perception therefore plays a vital role in determining customer satisfaction of a
service delivered to them. In the context of higher education, a university student may develop
bad perception of service quality in a situation where the services delivered falls below
expectation, thereby leading to dissatisfaction which may result in a decrease in the student’s
loyalty. Thomas (2011) further, postulates that student satisfaction is a vital antecedence and
as such is a major driver of student loyalty. It is therefore hypothesized that;
H3; There is a significant positive relationship between student’s satisfaction and student’s
loyalty.
2.18 Determinants and Influences of Customer Satisfaction
Zeithaml and Bitner (2003) identify the basic determinants of customer satisfaction as;
“product or service features and perception of service quality”. Arpin (2007) also posit that,
customers` emotional responses and their attributions are very important determinants of
satisfaction.
2.18.1 Product and Service Features
Customer satisfaction of a product or service is, to a large extent influenced by their assessment
of that product or service`s features (Zeithaml & Bitner 2003). In higher education institutions
a student`s evaluation of campus facilities, helpfulness and courtesy of lecturers, administrative
staff as well as the variety of courses the institutions offer may influences their satisfaction.
University of Ghana http://ugspace.ug.edu.gh

50
2.18.2 Customer Emotion
Customer perception of satisfaction of product or service can also be influence by their
emotion, which may be influenced by the product or service experience (Zeithaml, 2003). A
lecturer can deliver a module in a particular manner to a class which may influence their overall
satisfaction with the module.
2.18.3 Attribution for Service Success or Failure
Zeithaml and Bitner (2003) opine that there are perceived causes of an event, which can
influence perception of satisfaction. Arpin (2007) realize that, customers tend to look out for
the causes of a situation when they are taken by surprise by an outcome, they try to find out the
reason for causes which eventually influences their satisfaction. For instance, if students realize
that, the cause of a problem is not the fault of a lecturer or administrative staff and is unlikely
to occur in future, they are unlikely to be dissatisfied (Arpin 2007). A typical example is when
they realize that the delay in releasing an exam result is due to a system failure.
2.18.4 Perception of Equity and Fairness
According to Zeithaml and Bitner (2003), perception of equity and fairness is another major
determinant of customer satisfaction. The issue of fairness is crucial to customer perception of
service quality. For example, university students may be dissatisfied with a course provision,
if they are not getting good value for their money.
2.18.5 Other consumers, Family Members and Co-workers
Consumer satisfaction is influenced by other people (Arpin, 2007). In a University community
student’s perception of satisfaction can be influenced by several factors including their
experiences, behavior as well as the view of other students (Arpin, 2007)
University of Ghana http://ugspace.ug.edu.gh

51
2.19 Students Loyalty
Student loyalty is one of the major goals of educational institutions (Thomas, 2011). It has been
defined as the loyalty of students after their time at an educational institution (Althiyaman,
1997; Helgesen & Nesset, 2007; Mohamad, 2009; Thomas, 2011). Oliver (1999) defines
customer loyalty as “a deeply held commitment to rebuy or patronize a preferred
product/service consistently in the future, thereby causing repetitive same-brand or same-brand
set purchasing, despite situational influences and marketing efforts having the potential to
cause switching behavior. According to Thomas (2011), student loyalty has botha short term
and a long term impact on educational institution; student loyalty is therefore the combination
of the student’s willingness to provide positive word of mouth about the institution and make
recommendations concerning the educational institution to family, friends, employers and
organizations whenever there is an opportunity (Kunansorn & Puttawong, 2015). Students are
therefore good advocates of educational institutions as their behavior after school goes a long
way to affect the growth and reputation of the institution.
According to the iterature review (Oliver, 1997; Reichheld & Sasser, 1990; Dick & Bassu,
1994) customer loyalty is manifested in various forms including a commitment to rebuy or
patronize a preferred product or service. Scholars including Hennig-Thurau, Langer and
Hansen (2001); Marzo-Navarro et al (2005) found that student loyalty contains an attitudinal
component and behavioral component. They further posit that, the attitudinal component of
customer loyalty is further developed by partitioning it into cognitive and affective dimensions.
The behavioral component of loyalty has been viewed as relying on a customer’s actual conduct
regardless of the attitudes or preferences that underlie that conduct (Hennig-Thurau et al.,
2005). Other scholars (Kahn, Kalwani, & Morrison, 1986; Bearden et al., 2001) supports the
University of Ghana http://ugspace.ug.edu.gh

52
notion that repeat purchase can capture the loyalty of a consumer towards the brand of interest.
By these explanations, a customer becomes ‘loyal’ to an organization if they buy from it and
then continue to buy from it. Loyalty thus is concerned with repurchase activity regardless of
any internally held attitudes or preferences. In this context, educational institutions can enhance
student loyalty if they focus on tactics that will effectively increase the amount of repurchase
behavior for example: service quality, improving brand preference, student’s satisfaction etc.
(Hennig-Thurau et al., 2005)
However, the existence of situational factors (e.g. stock-out and non-availability), intrinsic
factors (e.g individual fortitude) or social cultural factors (e.g. social bonding) `that can
distinguish between repeat purchase and brand loyalty has led to more studies to understand
and operationalize brand loyalty beyond behavioral measures (Dick & Basu, 1994).
The attitudinal perspective of loyalty has been referred to as “a state of mind”. (Hennig-Thurau
et al., 2005). This implies that customers can be seen as ‘loyal’ to an organization if they have
a ‘positive preferential attitude’ towards it. This definition places more emphasis on
‘willingness’ than actual behavior and as such increasing customer loyalty is equivalent to
increasing the brand preference of the customer (Hennig-Thurau et al., 2005)
2.19.1 Antecedents of Students loyalty
Kunansorn and Puttawong, (2015) identify service quality, Institutional reputation/ image, trust
and commitment as main antecedents to customer loyalty.
2.19.2 Institutional Reputation/ Image
University of Ghana http://ugspace.ug.edu.gh

53
Image is defined as the overall impression that a customer holds about an object (Kunanusorn
& Puttawong, 2015). Kotler and Armstrong (2010) define corporate image as the overall
impression in the mind of the public about a firm. In the view of Kim and Lee (2010), it is the
perception of an organization that customers hold in their memories. Kotler and Fox (1995)
studied that image bases on “incomplete information” and it differs between various
organizations. Some authors have examined the relationship between image and perceptions of
customers (Gronroos, 2011; Kunanusorn & Puttawong, 2015). According to Gronroos (2001),
image has an impact on how customers perceived communications and operations of a firm in
many aspects. Organizations can be viewed as having a positive image if it is the customers’
perception that they could obtain benefits or interest from that particular organization.
Corporate image serves as a mirror through which the overall organization`s operation is
perceived and is a sample of the organization in the eye of the public. Kim and Lee (2010)
further posit that signaling theory has provided a framework for explaining the relationship
between corporate image and customer loyalty. According to these authors, customers use cues
such as capabilities and social responsibilities to evaluate the quality and value of the
intangibles. Kotler and Armstrong (2010) realizes that corporate image has a very strong
influence on customer loyalty. Kunanusorn and Puttawong (2015) argue that corporate image
has an association with physical and behavioral attributes of a firm such as business name,
architecture, variety of products/services and the impression of quality communicated by the
people interacting with the firm`s clients. They further argue that there is a positive relationship
between corporate image and customer loyalty in the telecommunication, education and
retailing sectors.
University of Ghana http://ugspace.ug.edu.gh

54
The image expectation that customers and users have about a firm with respect to the nature
and quality of their services goes a long way to influence customer loyalty and behavioral
intention (Agyei & Kilika, 2014). Corporate image thus affects customer evaluation of service
quality, satisfaction and loyalty. Brown and Dacin (1997) posit that corporate image is deriving
from customer satisfaction of perception and firm capabilities. The capabilities refer to the
company`s expertise in delivering products/services offerings such as innovation and high
service quality.
The academic reputation of an institution, quality of lectures, tutors and provision of facilities
as well as market orientation are all major contributors of student satisfaction (Mavondo &
Zaman, 2000). The authors also found that satisfied students provide positive word of mouth
about the institution to prospective students. Scholars have agreed that in pursuit of excellence
in higher education it is vital to emphasise the recognized programme in the context of
accreditation and reputable or industrial specialization Hanaysha et al., (2011). The
prospective students in their decision making process consider factors such as academic
reputation, service, employment prospect and teaching as the most important factors in their
choice (Hanaysha et al., 2011). Hanaysha et al., (2011) found in a study conducted in U.S that
students highly consider academic reputation and programme and thus influence their
perception of service quality. The selection of higher education differs from consumer
products, bccause it becomes even more complex when relating it to quality, cost and career
implications.
However, it has also been argued that applying a dynamic brand function to higher education
has the same effect as it does in other commercial contexts (Zhao, 2012). A good image helps
a firm in a competitive market to compete favorably as it differentiates it from competitors
University of Ghana http://ugspace.ug.edu.gh

55
(Mohamad, 2009). Image has often been found to be a variable with the greatest direct
influence on customer satisfaction and customer loyalty (Alves & Raposo, 2007). University
image has been found to have a direct and positive influence on positive behavioral intention
(students’ loyalty) (Helgesen & Nesset, 2007; Brown & Mazzarol, 2009). Mohamad (2009)
found that the effect of student satisfaction plays a significant role in establishing a relationship
between university image and student loyalty. It is therefore hypothesized that:
H1f; There is a significant positive relationship between institutional reputation and student’s
loyalty.
H1g; Students` satisfaction can play a role between institutional reputation and students
loyalty.
2.19.2.1 Importance of Institutional Reputation/ Image
Gummesson (1993) emphasized the importance of corporate image in the service quality
experience in his 4Q model, which is similar to the idea proposed by Lehtinen and Lehtinen
(1982) and Gronroos (1982; 1984). According to these authors, customers bring their past
experiences and overall perceptions of a service firm to each encounter, as they often have
frequent contact with the same service firm (Gronroos, 2001; Zeithaml & Bitner, 2003;
Zeithaml et al., 2006; Kang & James, 2004). In the light of this the image component was
introduced as an important element in the Gummerson 4Q model to reinforce customer
perceived quality, expectations and experiences.
Hirvonen (2007) identified four main roles that image plays in influencing customer
perceptions about service quality. He first identified positive word-of-mouth communication
from satisfied customers. Contrary negative image can lead to unfavorable word-of-mouth
communication. Secondly, he identified image as a filter through which technical and
University of Ghana http://ugspace.ug.edu.gh

56
functional quality can be seen. This function influences customer perception of a firm`s
performance. Hirvonen (2007) posit that, if a service provider has a positive image in the minds
of customers, minor mistakes will be overlooked. On the other hand, if the provider’s image
is negative the impact of any mistake will often be severe in the mind of customers. Hence, a
positive image becomes a shelter and minor mistakes and problems are overlooked whereas a
bad image leads to customer dissatisfaction with a service encounter (Hirvonen, 2007; Kang &
James, 2004).
Image has internal implications on employees’ performance, which also affects external
customers. If employees are not sure of the overall corporate image it may affect their attitude
and performance levels, which may eventually influence the relationship that exists between
them and customers which may further have an influence on their perceptions of service quality
(Gronroos, 2000; Hirvonen, 2007). He finally realizes that, image is a function of customer
expectations. If expectation is below perceived service quality a positive image will be formed
in the minds of customers. On the other hand, if customers’ perceived quality is below
expectation, the opposite effects will result (Hirvonen 2007; Kang & James, 2004).
2.19.3 Trust
Trust is considered as one of the most relevant antecedents of stable and collaborative
relationships (Akbar & Parvez, 2009). Moorman Deshpande and Zaltman, (1993) defined trust
as the willingness to depend on an exchange partner in whom confident is instilled. Trust is
necessary for institutions to build and maintain long term relationships (Singh & Sirdeshmukh,
2000). It is explained in the higher education context to mean that, if a student is loyal to his/her
institution, he/she will also trust the institution. Trust in this context is developed through the
University of Ghana http://ugspace.ug.edu.gh

57
experience students have with the institution. Student trust therefore can be inferred as their
confidence in the institution’s integrity and reliability, and this is dependent on the personal
experiences of the students with the faculty members (Henning-Tharau et al., (2001) and Saad-
Andaleeb (1994) argued that the lack of trust in institutions may seriously affect long term
relationships. Studies have also found that commitment in a highly dependent association, such
as higher education, can be large extenuated in the absence of trust (Saad-Andaleeb, 1994).
2.20 Post grdaduate Students` Satisfaction and Retention
Lo, (2010) contends that, students` satisfaction can be subjective, based on how well a learning
environment helped to achieve their academic objectives. Letcher and Neves, (2010) posit that,
satisfaction has the potential of building post graduates’ students’ self-confidence, which, will
eventually help in developing their skills and acquisition of knowledge. Trotter and Roberts
(2006) and Fearn, (2008), however, argue that, it can help decreased student attrition and
improve their experience. It is however, argued that, students’ satisfaction in general to a large
extent depends on the level of quality they received (Arambewela & Hall, 2013; Li, 2005).
Therefore, postgraduates’ students’satisfaction can be conceptualized through different salient
dimensions. These dimensions, according to Memon, Salleh, Baharom and Harun, (2014),
includes; internal and external university environment, and supervisors’ feedback. More
recently, Ibrahim, Rahman and Yasin (2014), found that, a campus environment that is
conducive to learning was the most significant predictor of student satisfaction. According to
these authors, student satisfaction is an essential tool for current students’ retention, and can
leads to offensive marketing. External and internal learning environments and supervisors’
feedback was, however, identified as the salient antecedents to achieving a higher level of
satisfaction and retention among postgraduate students (Memon et al., 2014). For the purpose
of this study, only internal environmental factors will be considered.
University of Ghana http://ugspace.ug.edu.gh

58
2.20.1 Internal Environment
Arambewela, Hall, and Zuhair, (2006) identified the following internal environmental factors
that can influence postgraduates’ perception of quality of education and satisfaction as;
reputation of the institution, student facilities and post-study marketability of a degree. They
strongly argue that, these factors influence the students’ level of satisfaction. Zepke and Leach,
(2007), contend that postgraduate students are highly conscious of their study outcomes, future
careers employment prospect and research supervision. Others are also of the view that student
satisfaction has a strong relationship with the quality of higher education perceived by the
student, and that this perception will be influenced by many factors concerning the educational
service, including expectation of service and image of the institution (Zhao ,2012). Again, Li
(2005), Opine that an institution’s image and learning quality significantly influence the
satisfaction of students at postgraduate business school in the US and the UK. Kuo and Ye
(2009) supported the notion that internal environmental factors, such as service quality and an
institution’s image, were the most salience factors that influenced the level of postgraduates’
students’ satisfaction and retention. Memon et al., (2014) found that, these factors not only
influences students` satisfaction and retention, but also enhanced their academic performance.
They further posit that, quality education is not the only factor that influences postgraduate
students’ satisfaction and retention, institutional reputation can lead to higher levels of
satisfaction and reputation.
2.21 Undergraduates Students Satisfaction and Retention.
According to Sickler (2013), students enter college with the ultimate desire of obtaining a
degree, however, students change, both physically and emotionally, during this period.
According to the author, some of the changes could lead to college success and other changes
University of Ghana http://ugspace.ug.edu.gh

59
can lead to college withdrawal. Pascarella and Terenzini (2005) identified two groups of
theories and models underpinning student changes in college. They include; developmental
theories which focuses on intraindividual change and describes the salient characteristics of
student development as a function for ages, stages, and movement along a given dimension.
Pascarella and Terenzini (2005) also suggested four categories of developmental theories that
influences changes in college students, psychosocial development, cognitive-structural
theories, typological models and person-environment interaction theories.
Pascarella and Terenzini (2005) again, identified the college impact model as a theory that
influences students’ changes in college. This models concentrates on the interaindividual
drivers of student change and cannot be recognize as a developmental factor. College impact
models assumes that personal change is influenced by the characteristics of the institution the
student attends or the experiences they have while enrolled (Sickler,2013). Sickler (2013)
posit that the variables may be student-related, such as gender or academic achievement,
structural and organizational, such as institution size and admissions selectivity, or
environmental, such as the academic, social, or political environment on campus.
Sickler (2013) asserts that student satisfaction and loyalty are a function of three sets of
elements: inputs, such as demographic characteristics, family backgrounds, and academic and
social experiences; environment, such as the total college experience, including people,
programmes, policies, experiences; and outcomes, such students’ knowledge, skills, values,
attitudes and behaviors after college.
Tinto (1975) believes that students enter college with a lot of personal, family, and academic
skills, predilections and intentions. As the student interacts with the various structures and
members within the institution, these intentions and outlooks are continually adjusted. Tinto
University of Ghana http://ugspace.ug.edu.gh

60
(1975) opine that, rewarding and incentives associated with formal and informal systems within
the institution lead to greater student integration and increased persistence. Whereas, negative
interactions and experiences hinder the integration progression, leading to reduced institutional
commitment and possible defection. More so, Bean (1980) introduced the Model of Student
Withdrawal. This model proposes that students hold certain inherit characteristics that affect
their perceptions and interactions with the institution. These perceptions and interactions, in
turn, influences the students` level of satisfaction with the institution`s services and the level
of satisfaction then directly affects the students` level of commitment to the institution. Bean
(1980) further argued that, the extent of institutional commitment is a major determinants of
retention. It is therefore, hypothesised that;
H4: Students` level of education can play a moderating role between service quality, students
satisfaction and loyalty.
2.22 Empirical Evidence
Mosavi and Ghaedi (2011) investigated the effects of various dimensions of perceived quality
(social, emotional and conditional) on commitment and further explored the effects of
commitment on customer advocacy behaviors’ including information sharing, marketing
research support, word-of-mouth recommendations and increasing purchase intentions. Using
students of Shiraz University in Iran the study found a significant positive relationship between
customers’ perceived value and commitment. The study further found that most impacts of
commitment are word-of-mouth, repurchase intentions, information sharing and marketing
research support.
Kwan and Ng (1999) examined the effects of students’ perceived quality on students’
satisfaction. The study measured students’ perception of service quality using 22 statements
University of Ghana http://ugspace.ug.edu.gh

61
that were divided into seven dimensions. The study revealed that, perceived service quality has
a positive significant effect on students’ satisfaction.
Ali and Abdrisaq (2014) In examining the relationships between service quality dimensions
and student’s satisfaction, found that there is a positive significant relationship between service
quality dimensions and student’s satisfaction. The study further examined the critical factors
in service quality dimensions that mostly contribute to students’ satisfaction. Using 120
graduate students from three universities in Mogadishu, the findings revealed that reliability
has the strongest relationship followed by empathy, with tangibility recording the weakest
relationship. It is therefore Hypothesized that;
H1ao: There is no significant relationship between tangible dimension and student satisfaction
H1c: There is a significant positive relationship between the reliability dimension and students`
satisfaction.
H1e: There is a significant positive relationship between the empathy dimension and students’
satisfaction.
Hassan, Ilias, Rahman and Razak (2009) in their study examine the relationship between the
overall service quality dimensions and student satisfaction using a modified SERVQUAL
questionnaire comprising 35 items. Two hundred undergraduate students from two private
universities in Malaysia were sampled for the study. The study found that empathy elements
established the strongest relationships with students` satisfaction followed by assurance factors.
The findings further established that, these two dimensions were very important in explaining
student’s satisfaction and that any effort to improve assurance and empathy dimensions will
help students give better evaluation to their satisfaction. It therefore hypothesized that;
University of Ghana http://ugspace.ug.edu.gh

62
H1b: There is no statistically significant positive relationship between the assurance dimension
and students’ satisfaction and loyalty
Lee, (2013) examined the moderators influencing service quality, customer satisfaction and
loyalty in mobile phone services. The result of the hierarchical multiple regression analysis
reveals that, service quality positively affects customer loyalty. It was found that service quality
positively influences customer satisfaction, which further influences customer loyalty.
Abas, Ghaleb and El-refae, (2012), in their study of the relationship between service quality,
satisfaction and behavioral intention, found a significant positive relationship between service
quality, satisfaction behavioral intention. Using a sample size of 1200 students, the study
reveals tangibles (ß=.310, P=.00) and empathy (β=.380, P=.00) shows the strongest
relationship between customer satisfaction and behavioral intention, followed by reliability
(β=.22, P=00) and responsiveness (β=.10, P=.00). However, the assurance dimension was not
found to play a significant role in predicting satisfaction and behavioral intention. It is therefore
hypothysized that;
H1aa; There is a significant positive relationship between the tangible dimensions and
students’ satisfaction and loyalty
H1d: There is a significant positive relationship between the responsiveness dimension and
students’ satisfaction and loyalty.
Sickler (2013) studied the salient undergraduate students’ perceptions of service quality that
predict students’ retention. Using a total of 483 freshmen and continuing students of a large
institution in the United States, the study found that the overall student satisfaction is a
significant predictor of student retention. The study further reports that students placed greater
University of Ghana http://ugspace.ug.edu.gh

63
emphasis on the institution’s concern for them than the institution itsel; this provides the ability
to predict student satisfaction. This finding is supported by a study conducted by Kerlin (2000),
which found that students place less emphasis on tangible aspects of service quality including
appearance of the institution’s facilities and greater emphasis in the aspects that can affect their
personal needs.
Carter (2009) examined the relationship between service quality perceptions and students’
intentions to recommend the university to a friend or colleague. Using the constructs of class
availability, professor`s knowledge, job advancement, facilities, and tuition. The study
established that, service quality significantly influences both student satisfaction and intention
to recommend, therefore, service quality was found to have a significant impact on student`
overall satisfaction and retention. Aldridge and Rowley (1998) argue that, quality is different
from satisfaction and that quality is a general attitude, whereas satisfaction is linked to specific
transactions” Others however, argue that the concept of perceived quality of university services
leads to overall satisfaction with the university (Cronin & Taylor, 1992; Parasuraman et al.,
1985, 1988).
Agyei and Kilika, (2014) examined the relationship between the corporate image and customer
loyalty in the telecommunications market in Kenya. The study found a significant positive
relationship between corporate image and customer loyalty. The findings further revealed that
service quality and brand image are significant predictors of customer loyalty. The result of the
analysis reveals an R2 = 0.25 in the relationship. It was found that service quality predicts
customer loyalty at (β=.400, P<.001) indicating that service quality is a good predictor of
customer loyalty. Corporate image predicts customer loyalty at (β=.323, P<.001) indicating
that it is a good predictor.
University of Ghana http://ugspace.ug.edu.gh

64
2.23 Conceptual Framework
This conceptual framework is on perception of service quality, institutional reputation, level of
education and satisfaction used in studying student’s loyalty. A review of available literature
has shown a positive relationship between students’ perceptions of service quality and students’
loyalty (Hinson & Otieku, 2005; Fosu & Owusu, 2015) as well as their satisfaction and loyalty
(Seok Lee, 2013; Parasuraman & Grewal, 2000). Again a review of available literature has
shown that there is a limited research on the collective effects of students’ perception of service
quality, institutional satisfaction, and their loyalty (Chopra, Chawla & Sharma, 2014). Against
this background, the framework below depicts the conceptual framework for this study. It is
a pictorial representation of the relationship between perception of service quality and
students’ satisfaction on their loyalty. The framework proposes that, customer satisfaction is
directly related to service quality dimensions (tangibility, reliability, assurance, empathy and
responsiveness) and institutional image and students’ loyalty. The framework further proposes
that the level of education also moderates the relationship between service quality dimensions
and institutional image on students’ satisfaction.
University of Ghana http://ugspace.ug.edu.gh

67
Figure 2.1 Conceptual Framework
H1, H1a-H1f
H4
H4
Source: Adapted from Karatepe (2011)
H2
SERVICE QUALITY
DIMENSIONS
TANGIBLES
ASSURANCE
EMPATHY
RELIABILITY
RESPONSIVENES
INSTITUTIONAL
REPUTATION
STUDENTS’
SATISFACTION
STUDENT
LOYALTY
Level of
education
H3
University of Ghana http://ugspace.ug.edu.gh

68
2.24 Components of the Conceptual Framework
This section gives a vivid description of the elements within the conceptual framework. The
diagram above gives a pictorial representation of the variables in the model and their
interactions as well as their relationships. Perception of service quality has a direct relationship
with students’ loyalty. Students’ satisfaction of the various dimensions of service quality can
influence the perception their loyalty. The level of education can moderate the relationship
between students’ perception of service quality, their satisfaction and loyalty.\
2.24.1 Service Quality Dimensions (SERVQUAL)
The service quality concept has been extensively acknowledged in the literature review;
however, the relationship between perception of service quality and students’ loyalty is
discussed in relation to the conceptual framework of the study. Parasuraman et al., (1988)
model of service quality (SERVQUAL), students’ satisfaction and loyalty is guiding the
conceptualization of this thesis. Service marketing literature has identified five major
determinants of service quality (Tangibility, Reliability, Empathy Responsiveness and
Assurance). These dimensions have been discussed indepth in the literature review.
2.24.2 Relationship between the Variables in the Model:
2.24.2.1 Service Quality and Students Satisfaction
This concept has been thoroughly discussed in the literature review. Scholars such as, Alves
and Raposo, (2010) and Fosu and Owusu, (2015) argued for positive relationship between
quality dimensions and students’ satisfaction.
University of Ghana http://ugspace.ug.edu.gh
69
2.24.2.2 Service Quality and Students Loyalty
Marketing scholars and practitioners; Seok-Lee (2013) and Parasuraman and Grewal (2000),
posit that service quality has a direct relationship with behavioral intention (loyalty decisions),
2.24.2.3 Students Satisfaction and Students Loyalty
Eggert and Ulagga (2002) posit that there is a strong relationship between satisfaction and
behavioral intention (loyalty dimensions) such as repurchase intention, alternative
considerations and recommendations.
2.24.2.4 Institutional Image and Students Loyalty
Kim and Lee (2010) posit that corporate image, brand awareness, service price and service
quality are major antecedent for achieving customer loyalty in a mobile telecommunications
industry. Hence, corporate image plays a key role in establishing and sustaining customer
loyalty. Corporate image relates positively with customer loyalty in education,
telecommunications and retailing sectors (Kim & Lee, 2010). The image and expectation that
consumers hold with respect to the nature and quality of their services influences their loyalty
(Rowly & Dawes, 1999). Corporate image influences consumers’ behavioral intention. Kim
Lee (2010) further posit that corporate image has a significant influence on evaluation of
service, satisfaction and loyalty.
2.24.2.5 Students Satisfaction and Students’ Loyalty
Scholars have argued that customer loyalty is a composite of a number of qualities driven by
the objectives of achieving customer satisfaction which, will intend enable the customer to
show commitment to an organization`s offering. This commitment leads to a customer making
a continual investment in an ongoing relationship with an organization. Viewing customer
University of Ghana http://ugspace.ug.edu.gh
70
loyalty from this perspective is a product of a combination of attitude and behaviors. The
attitude includes repurchase intention, recommendation to others as well as commitment to the
firm that is resistance to switch to competitors. Scholars Boahene and Agyapong (2011)
identified service quality and customer satisfaction as an antecedent to customer loyalty
2.24.3 Students Loyalty
The study examined the students’ loyalty from the perception of service quality and satisfaction
on three variables, namely; students’ recommendation (Sickler, 2013); alternative
consideration (Eggert & Ulaga, 2002); continued enrolment (Dodds et al., 1991; Parasuraman
& Grewal, 2000) and word of mouth communication (Ravald & Gronroos 1996; Liljander &
Strandvik, 1995; Gross, 1997; & Dolds et al., 1991).
2.24.4 Level of Education Satisfaction and Retention
Studies have shown that students` level of education can influence their satisfaction and loyalty
and can therefore moderate the relationship between their perception of service quality and
these two constructs (Sickler, 2013; Memon et al., 2014)
University of Ghana http://ugspace.ug.edu.gh

71
CHAPTER THREE
CONTEXT OF THE STUDY
3.1 Overview of Ghana
Ghana is geographically located at the Western part of Africa with a total land size of about
238,583 square kilometers (Brayed, 2009). In 2010, Ghana`s population stood at about 25
million with an annual growth rate of about 2.7% per annum (Baryeh, 2009). Formally
colonized by the British, Ghana gained its independence from its colonial masters on the 6th
of March 1957 (Baryeh, 2009). The country is subdivided into ten regions with Accra in the
Greater Accra region as the capital. The political system in the country is a multiparty
democracy Baryeh, (2009).
3.2 Education in Ghana
Ghana over the years has adopted a series of reforms in education. Education evolution in
Ghana involved all levels including primary education, secondary and Tertiary education
(Asabere-Ameyaw, 2016). The foremost step towards establishing a strong foundation in
Ghana’s education can be dated back in 1951 by first president Dr. Nkrumah, under a policy
called Accelerated Development Plan (Asabere-Ameyaw, 2016). This policy is noted for some
remarkable progress in the educational sector including rapidly increasing the enrolment in
primary schools’ introduction of emergency teachers training, appointment of pupil teachers
and provision of facilities to middle, secondary and technical schools (Asabere-Ameyaw,
2016).
Higher education systems in Ghana were reformed and expanded extensively (Utuka, 2010).
In 1987, the government formed a university rationalization committee (URC) to work towards
reforming the management, academic structure and the funding of tertiary institutions in Ghana
University of Ghana http://ugspace.ug.edu.gh

72
(Utuka 2010). Proposals brought forth by the committee reflected in a government white paper
in 1991, which sought to significantly expand tertiary education as a whole to meet the demand
of school leavers and the needs of employers, and to ensure that those previously denied
education could have access (Utuka, 2010).
In spite of interventions made in Ghana’s education systems over the years, there seems to be
a plethora of challenges leaving a toll on the quality of teaching and learning (Ministry of
education, 2003). Demand for higher education is high and as a result the state funded
universities have to refuse many applications from a good number of qualified students (Utuka,
2010).
The educational reforms started in the mid-1980s, and higher education in Ghana has
experienced a varied and significant transformation (Utuka, 2010). For instance, there have
been increases in the number of undergraduates and a significant expansion in post graduate
education (Utuka, 2010). www.dictionary.com definse higher education as education beyond
high school specifically that provided by colleges and graduate professional schools. British
dictionary also defines higher education as education and training in college. It is a qualification
that covers the degree level and takes not less than three years to complete( www.wg.
Aegee.or/ewg/higher education.gh). It offers a wide range of qualification ranging from
diploma to doctorate degrees. Taking the above definitions into consideration, the Higher
education sector in Ghana consists of colleges of educations, polytechnics and universities. It
can be inferred that, over the last decades, the number of higher education institutions have
expanded rapidly, particularly private university colleges, in the face of rising student
enrolments. Currently Ghana has six public universities, five public professional universities,
ten public polytechnics, and thirty-eight colleges of education across the country (National
University of Ghana http://ugspace.ug.edu.gh

73
Accreditation Board, 2015). In the private sector, there are over 76 private university colleges
with the majority affiliated to government universities in Ghana and four private colleges of
education (National Accreditation Board, 2015).
Public universities have had a near monopoly in providing tertiary education in Africa (Utuka,
2010). Immediately after independence, public universities had a state monopoly like other
African countries (Ghana Education Service Report,2001). With full funding from the state,
the main objective of these public universities was to train the manpower needed for the rapid
transformation of the country (Utuka, 2010). Initially, the government depended significantly
on foreign capital and foreign personnel to meet the lack of qualified and trained manpower
(Ghana Education Report, 2001). This necessitated government to focus on expanding the
capacity of higher education by developing systems and infrastructure to train the needed
manpower for Ghana (Utuka, 2010).
Due to increasing demand for higher education in the country, government had the challenge
of financing education in this sector and hence adopted a legal regime that allows for the active
participation of private universities (Utuka, 2010). This led to a rapid growth of private
provision of tertiary education over the last decade.
3.3 Administration
The Ministry of Education (MoE) has a general obligation for education sector policy, planning
and monitoring (Ghana Education Service Report, 2001). The primary objectives of the
ministry is to ensure that “quality education is delivered to all Ghanaians at all levels to enable
them to obtain skills that will support them to improve their potential, to be fruitful, to facilitate
University of Ghana http://ugspace.ug.edu.gh

74
poverty reduction and to promote socio-economic growth and national development” (Ghana
Education Service Report, 2001).
Education delivery and implementation is devolved to institutions, districts and regions
through various agencies of the Ministry of Education. Among these, the Ghana Education
Service (GES) is the agency that implements the basic and senior secondary education
components, including tchnical and vocational institutes (Ghana Education Service Report,
2001) Ghana Education Service is therefore responsible for schools (Ghana Education Service
Report, 2001). The other agencies take care of the rest of the education sector. The National
Council for Tertiary Education (NCTE) and the Non-Formal Education Division (NFED) have
important sub-sectorial areas of responsibility like quality like issues and many others
regarding education delivery (Ministry of education, 2003).
3.4 Progress and Developments in University Education
During the period of independence, Ghana had only two (public) tertiary institutions
(universities) (Baryeh, 2009). The last decade has witnessed phenomenal growth (Baryeh,
2009). Currently, Ghana has 11 public universities, about 76 private university colleges, 10
public polytechnics and 38 college of educations (NAB, 2015). This growth can be interpreted
to mean continued high demand for tertiary education.
3.5 Historical Overview of Higher Education
Ghana`s higher education development can be traced back to 11th August 1948 when the
University College of the Gold Coast (now University of Ghana) was established by the British
colonial government in a special relationship with the University of London, to offer a limited
programme of study (Baryeh,2009). In 1961, the university college was granted a full fledged
University of Ghana http://ugspace.ug.edu.gh

75
university status with the powers to award its own degrees (Baryeh,2009). According to this
author, between 1972 and 1973, the total student’s enrollment was estimated at 2530 with 450
academic staff. To solve the problem of rapid population growth as well as increasing demand
for higher education it became very important for the nation to establish new universities. In
line with this, the Kumasi College of Technology was raised to a university standing and was
renamed Kwame Nkrumah University of Science and Technology by an Act of Parliament on
August 22, 1961 (Daniel, 1996 cited in Baryeh, 2009). An international commission, in line
with the country’s development objectives, urged for the establishment of a third university
(Baryeh,2009). The University College of Cape Coast was established in December 1962 and
was raised to a full university status in October 1971 by an Act of Parliament, the University
of Cape Coast Act 1971, and subsequently the University of Cape Coast Law 1992 (PNDC
LAW 278) (University of Cape Coast Calender, 1995-2005). The main purpose was to deliver
graduate teachers for the increasing number of secondary schools and teacher training colleges.
In 1992, the University of Education, Winneba was added to train teachers for the nation`s
secondary schools and was affiliated to the University of Cape Coast (Baryeh, 2009). The
University has three campuses located in two of the country`s ten regions (Baryeh, 2009). The
University of Development Studies was established by Provisional National Defense Council
(PNDC) Law 279 in May, 1992, (Agbodeka, 1998 cited in Bayeh, 2009). The University has
four campuses spread over four regions of the country namely, Brong Ahafo, Northern, Upper
East and Upper West Regions (Baryeh, 2009).
Currently, the statistics from the national accreditation board reveals that the country has 38
colleges of education, 10 polytechnics and 10 public universities. In addition to this, the
National Accreditation Board has accredited 76 private universities and university institutions
that offer various programmes (NAB, 2015).
University of Ghana http://ugspace.ug.edu.gh

76
3.6 Access to Quality Education in Ghana
Chiyan Chao (1998) cited in Britwum, Jonah and Tay (2001) defines access as “the ability to
progress through the education cycle without delay or dropouts”. The Government of Ghana
over the years has its desire to provide tertiary education to all Ghanaians as specify in the
Article 25 of the 1992 Constitution of Ghana (Britwum et al., 2001). In response to the Jontien
Declaration of Education for All and the implementation of education reforms in 1987 and
1991; the, University of Ghana (UG). University of Cape Coast (UCC) and Kwame Nkrumah
University of Science and Technology (KNUST) were able to change their level of enrolment
significantly from 4,569, 1,491, and 3,506 in 1987 to 4, 017, 2000 and 3,980 respectively in
1991 (Britwum et al., 2001). The tertiary education reforms in 1991 further aggravated
Government`s commitment to increased access to tertiary education and in response; UG, UCC
and KNUST further increase their level of enrolment from 4,017,2000 and 3,980 in 1991 to
9,095, 7,722 and 8,573 respectively in 1999 ((Britwum et al., 2001). Currently, statistics from
the Chief Information Technology Officer (CHITO) of University of Ghana`s office the
indicate that, the University has not less than 40000 students.
3.7 Private Universities
The expansion of private higher education institutions is apparent in most parts of the world
(Baryeeh,2009). Although the expansion of the sector can be attributed to a number of reasons.
Altbach, (1998) argues that the main reasons are related to massification and financing. An
increased in demand for access to higher education and the change of thinking about the
financing of higher education has led to the growth of the sector (Baryeh, 2009). The change
in concept from the traditional idea that higher education is a public good that has to be
provided by society to private good, has also been the major derivatives for the growth of
private higher education (Baryeh, 2009). In line with the general rational plus the national
University of Ghana http://ugspace.ug.edu.gh

77
political and ideological changes, the country has seen a tremendous growth in private higher
education institutions since the year 2000 (Baryeh, 2009). Currently there are 76 accredited
private higher education institutions dotted across the length and breadth of the country (NAB,
2015).
3.8 Quality Assurance in Ghana`s Higher Education
The education sector reforms in 1987 stress quality of education at all levels (Britwum et al.,
2001). However, it was realized that, twelve years after the reforms, the quality of education is
still below expectation (Britwum et al., 2001). Several studies have been carried out by
researchers and organizations on tertiary education and have concluded that, in the face of
increased resource input to the sector, the reforms still fail to raise the level of quality required
for the sector (Britwum et al., 2001). Whilst researchers have agreed that, at the tertiary level,
there is a falling standard in academic performance of students, yet enough systematic studies
have not been conducted to examine the level of quality of education in Ghana (Britwum et al.,
2001).
3.9 Studies in the Ghanaian Education Sector
Several studies have been carried out in the higher education sector, including; quality and
experience (Hinson & Otieku, 2005; Tutu-Boahene & Akwensivie, 2014) and quality and
perception (Fosu and Owusu, 2015). The study provided a brief summary of these studies as
shown below.
Tutu-Boahene and Akwensivie (2014) studied the services experience perspectives in
Ghanaian private universities. Specifically, the study examined the relationships that exists
between student experiences and service quality indicators using Grummesson’s 4Q model of
delivering quality. The empirical data gathered from 700 students of three universities in Accra
University of Ghana http://ugspace.ug.edu.gh

78
found that there is a positive but insignificant relationship between student experiences and
service quality indicators. It also revealed that service quality indicators such as output quality,
process quality, interactive quality and outcome quality impact on service experience of
students.
Fosu and Owusu (2015) studied Ghanaian students’ perception of service quality in higher
education. Adopting the HEdPERF model as a conceptual framework with a sample of 372
students from Tamale Polytechnic, the study found that excellent and quality programmes run
by the institution, highly educated instructors, timely delivery of promises by staff, reputation
of the programmes offered by the institution and access to materials at the institution’s library
were salient criteria that influenced the students’ perception of service quality. The study
posited that higher education institutions can affect students’ perceptions by introducing
programme that are highly marketable with various areas of specialization, recruiting high
caliber of lectures and delivering promises on time.
Abukari and Corner`s, (2010) study on how to deliver higher education to meet local needs in
a developing economy context used the experience of the students from university of
development studies. The study concluded that, the basis for any quality should be grounded
on the principle of mutual benefit to all stakeholders.
Hinson and Otieku (2005) examined service quality from Ghana`s first executive programme
from students’ perspectives. The study reveals that the students were more concern about the
facilities and conducive classroom setting.
University of Ghana http://ugspace.ug.edu.gh
79
CHAPTER FOUR
RESEARCH METHODOLOGY
4.1 Introduction
This chapter discusses how the study was undertaken, outlines procedures that were used in
achieving the stated objectives and provides justification for each step taken. It entails the
research design of the study, the population of the study, and the sample size that was used. It
includes the sampling techniques that were employed in the study, detailsof the research
instruments used the source of data for the study and how this data was analysed.
4.2 Research Approach
In the view of Hair, Wolfinbarger, Ortinau and Bush (2008) research approach is a broad
category of research design. According to Hair, Wolfinbarger, Ortinau and Bush (2008)
determining the most appropriate research approach is to a large extent a function of the
research objectives as well as the level of information requirement. Hair et al., (2008) and
Creswell, (2009) identified three (3) main research approaches: namely Qualitative;
Quantitative; and Mix methods. In addition, Creswell (2009) argued that the researcher
decision on which approach to adopt for a specific study, is influenced by the researcher’s
personal philosophy; nature of research problem; researchers personal experience and the target
audience for the study.
Creswell (2009) define qualitative research as a means for exploring and understanding the
meaning individuals or groups ascribe to a social or human problem. Alternatively, the
quantitative research approach is a means for testing objective theories by examining the
relationship among variables (Creswell, 2009). Furthermore, the mixed methods approach is
an approach to inquiry that combines both qualitative and quantitative approaches. This
University of Ghana http://ugspace.ug.edu.gh

80
encompasses the use of both quantitative and qualitative approaches concurrently so that the
overall strength of a study is stronger than using one approach (Creswell & Clark, 2007).
The researcher adopted a quantitative research approach for this study because it uses
standardized procedures and replication of findings is assumed (Neuman, 2007). The study was
based on the determinants of service quality perceptions of students in higher educational
institutions. The study was carried out on the basis of five (5) service quality dimensions
developed by Parasuraman et al., (1988) with some modifications to suit the current study.
Again, in order to test the hypotheses of the study, quantitative data was required. Similar
studies (Fosu & Owusu, 2015; Joseph & Joseph, 1997; Oldfield & Baron, 2000; Joseph &
Joseph,1999; Telford & Masson, 2005; Eggert & Ulaga,2002; Agarwal, Eramilli & Dev, 2003;
Hinson, Mensah & Mahmoud, 2006) have used the quantitative research approach and thereby
supports the use of the approach in this study.
4.3 Research Design
Scholars in the relevant field of knowledge have defined research design from different
perspectives. However, Cooper and Schindler, (2008) realizes that no single definition is
absolute. In the view of Creswell (2009), research design is the plan and procedures for
research that span the decisions from broad assumptions to detailed methods of data collection
and analysis in achieving objectives and answering the research questions. Again, Cooper and
Schindler (2008) define a research design as the blueprint for achieving study objectives and
answering research questions. Research scholars (Hair et al., 2008; Zikmund & Babin, 2010)
have identified three main research designs exploratory; descriptive; and causal. An
exploratory research according to (Hair et al., 2008) generates insights and deepens the
University of Ghana http://ugspace.ug.edu.gh

81
understanding of a phenomenon / research problem, descriptive research, on the other hand,
describes the existing characteristics of a given target audience. In addition, a causal research
design, collects data that enables decision makers to determine cause and affect relationships
between two or more variables (Hair et al., 2008). This study used the exploratory research
design in order to understand and seek deeper insight into students’ perception of service
quality in higher educational institutions of learning and their loyalty decisions as well as the
role that their level of education and institutional reputation play in this relationship. (Robson,
2000; Hair et al., 2008). Furthermore, exploratory research was used to clarify any equivocal
situations and discover new insight that may be prospective for opportunities (Zikmund &
Babin, 2010).
The study was conducted based on the cross sectional survey to measure the responses of the
students of the University of Ghana. A Cross-sectional study examines a particular
phenomenon at a specific period of time (Saunders, Lewis & Thornhill, 2007). The cross
sectional method was deemed appropriate because the data was collected once at a particular
time period and analysed. This technique is relatively cheaper to use and ensures for easy data
collection involving students from diverse backgrounds; gender, experiences and age. This
was done to enable the researcher to complete the study within a given stipulated period.
4.4 Research Strategy
Creswell (2009) identified survey and experimental research as the two main research
strategies. Zikmund and Babin (2010) further argued that the most appropriate method of
collecting primary data is the survey strategy. According to these authors, the survey is a
research technique in which a sample is interviewed in a particular manner or the behavior of
respondents is observed and described in a given situation. The survey research was used by
University of Ghana http://ugspace.ug.edu.gh
82
the researcher instead of the experimental research as a results of its numeric description of
trends, attitudes, or opinions of a population by studying a sample using a questionnaire to
gathering primary data (Creswell, 2009).
Furthermore, a survey because respondents (the students) are the actual consumers of the
services of University of Ghana and not assumed as in experiment. Again, the survey method
provides; quick, inexpensive, efficient, and accurate means of assessing information regarding
a given population. To add to the above, this allows the use of statistical tools in analyzing the
sample survey results very easily (Zikmund & Babin, 2010). Research of service quality in
higher education has used this method to achieve their desired objectives (Fosu & Owusu 2015,
Abukari & Corner, 2010, Brochado, 2009).
Under the survey research strategy, the cross-sectional study was employed. According to
Kuada and Hinson (2012), a cross-sectional design involves the collection of information from
a given sample of population at one point in time. Kumar (1996) further posit that this design
is suitable for studies that aim to analyze a phenomenon, situation, problem, attitude or issue
by considering a cross-section of the population at one point in time. This method is thus less
expensive and less time consuming compare to the longitudinal design. It is interesting to know
that some service quality in higher education researchers have employed the cross-sectional
design (Hinson & Otieku, 2005; Fosu & Owusu, 2015; Abukari & Corner, 2010)
4.5 Sampling Plan
The sampling plan consists of three components, namely; target population, sampling size and
sampling procedure (Malhotra & Dash, 2011).
4.6 Population and Sampling
University of Ghana http://ugspace.ug.edu.gh

83
4.6.1 Target Population
Population is defined as encompassing “the total collection of all members, cases or elements
about which the researcher wishes to draw conclusions (Huysamen, 1994). Malhotra and Dash,
(2011) also define the population of a study as the aggregate of all elements, sharing some
common set of characteristics that comprise the target audience for the purpose of the research
interest. Malhotra and Birk, (2006) defined target population as the group to which the results
of the study are intended to apply. In other words, the target population is the group to which
the results of the study are generalized.
In this study, the target population comprises of the students of the University of Ghana
Business school. This target population is crucial to the strategic decisions of the University
when it comes to service quality issues, hence the need for their participation in the study.
Scholars have advocated for the inclusion of students as they are the best target group when
the researcher is interested in perception of service quality of higher educational institutions
(Fosu & Owus,2015; Abukari & Corner,2010).
Considering the broad nature of the education industry of Ghana, the intricacies involved in
service quality coupled with time constraints, the researcher could only look at the relationship
between service quality dimensions, level of education, institutional reputation, satisfaction
and loyalty decisions from University Ghana students’ perspective.
4.7 Sample Size
This is the fraction of the target population that is being considered for the study (Malhotra &
Dash, 2011). According to a sample size table developed by Kriechje and Morgan, (1970), and
Bartlett, Kotrlik and Hinggins (2001), a population between 6000 to 8000 can have a minimum
University of Ghana http://ugspace.ug.edu.gh

84
sample size of 367. Currently, the statistics from the Chief Information Technology Office
(CITO) of University of Ghana reveals that there are 7436 students at the Business School.
Using Yamane`s (1967) formula, a sample size of three hundred and seventy-nine (379)
respondents (the students) was drawn from the target population (students of University of
Ghana Business School) for the purpose of the study. This sample size is line with the result of
the sample size calculator proposed by Krejcie and Morgan (1970) and the one proposed by
Bartlett, Kotrlik and Hinggins (2001). Finally, similar studies have used sample sizes above
200 (Abukari & Corner, 2010; Fosu & Owusu, 2015). The sample size was drawn owing to
the fact that the population of students of University of Ghana Business School is too large for
the study. The sample size for the study was drawn based on the Taro Yamane`s formula of
sample size in order to obtain reliable data at (95% level of confidence and 5% error level)
(Yamane, 1967). The formula is given by n=N / [1+N (e)2 ]
Where n represents sample size
“ N represents research population
“ e represents a sample error (5%)
Yamane`s formula was adopted because similar researchers including Fosu and Owusu, (2015),
Fosu and Poku (2014) and Al-Fatal (2010), have use this formula in their study of higher
education and it has proved worthwhile.
4.8 Sampling Technique
According to Webb, (2000), there are two main types of sampling techniques. These are the
probability sampling and non-probability sampling. With probability sampling, all elements
are given equal chances of being selected, whereas with the non-probability sampling, the
chances of selection depend on the discretion of the researcher. They are sampled to achieve
the demands of research the objectives (Webb, 2000).
University of Ghana http://ugspace.ug.edu.gh

85
This study used a probability sampling technique under this technique a stratified sampling was
used to divide the students of University of Ghana Business School into seven into strata as
follows: undergraduates, regular MBA, weekend MBA, MSc/MA MPHIL, EMBA and PHD.
This was done to ensure that there is fair participation among all the degree levels in the
business school. A convenient sampling method was then used to select the target respondents
after the stratification. Webb (2000), posit that, sample members under this sampling technique
should meet certain criteria, which are appropriate to the successful completion of their
investigation. The criteria were based on respondents’ exposure to service quality issues at the
University of Ghana. Again, a probability sampling techniques such as simple random
sampling techniques was used because all the students at the University of Ghana Business
School have reasonable knowledge about the issues under investigation and are required to
participate in the study. Also, only students at the business school were considered, these group
of students have more knowledge and experience about the variables under consideration. A
simple random sampling technique again helped the researcher to select the most accessible
respondents to provide accurate information for the study. Again, a probability sampling
specifically simple random sampling method was used because of the large nature of the total
population, hence, the chance of a respondent (student) being selected for the study was
dependent on the random selection.
4.9 Data Collection and Instrumentation
4.9.1 Primary data collection
Data collection is the process of gathering information. Data was gathered by observation and
interviews. Survey requires direct participation of research participants’ involvement that
involve filling out a questionnaire (Zikmund & Babin, 2010).
University of Ghana http://ugspace.ug.edu.gh

86
The study utilized structured the questionnaires as the primary data collection instrument.
Results from this procedure were used in the analysis stage. Self-administration of the
questionnaires was done by the researcher. After explaining the purpose of the survey and
obtaining consent, the respondents were asked to fill out the questionnaires. Respondents were
also engaged in face to face interaction to facilitate clarification of issues and obtain feedback.
The study employed the used of questionnaires since many previous studies on service quality
in higher education have relied on questionnaires to collect data (Hinson & Otieku, 2005;
Fosu & Owusu, 2015).
4.10 Contact Method
Questionnaires were administered personally to the students of University of Ghana Business
School. This choice of method helped the researcher to have very high level (percentage)
redeeming rate and helped to explain questions that respondents found difficult to understand
and also enable the researcher to observe the respondents (the students). The questionnaires
were administered at a range of about ten to fifteen minutes per respondent over a period of
three weeks. This was to adjust the time period of the entire study. Only close-ended questions
were administered; This was done to help facilitate the coding.
4.11 Survey Method
Both self-completion method and the interviewer administered method was employed by the
researcher. This survey method was chosen to facilitate successful administration of the
questionnaire by allowing those who could successfully complete it without the researcher`s
assistance to do so and provided help for those who faced difficulties in the process.
University of Ghana http://ugspace.ug.edu.gh

87
4.12 Data Source
The sources of data needed to address research problems can either be primary or secondary
(Hair et al., 2008). According to these scholars, the sources of data depend on two basics issues
that are: 1. whether the data already exist, and 2. the extent to which the researcher knows the
purpose for which the data was gathered. These sources of data collection are discussed below;
Secondary data is data that has already been collected for some purpose other than the one
under consideration (Webb, 2000). Wilson (2000) defines secondary data as information that
has been previously gathered for some purpose other than the current research project.
Secondary sources of data include the internet websites like Google scholar, Emerald, and
Science direct and University libraries like the University of Ghana library. At these sources,
existing data and information on students’ perception of service quality were sourced. These
were collected to guide the researcher in primary data collection, analysis and discussion of the
findings of the study (Webb, 2000).
4.13 Primary Source
Primary data are collected directly from first hand sources to address the current research
problem (Webb, 2000). Primary data for testing the hypothesis were collected via self-
administered questionnaires from the Students of University of Ghana Business School. The
study used primary data because of the high level of consumer behavior involvement in the
study.
4.14 Instrumentation
Structured questionnaires were employed to collect data which was subjected to quantitative
analysis with the aid of SPSS version 22 to achieve the objective of the study. A structural
equation model Amos was used to analysed the effect of service quality dimensions on
University of Ghana http://ugspace.ug.edu.gh
88
students` perception of service quality and how it influences their loyalty. It was also used to
analyze how the level of education, institutional reputation, students’ satisfaction and service
quality dimensions interact and its effects on loyalty decisions from students’ perspectives. As
stated by Saunders et al. (2007), the validity and the reliability of the data you collect, as well
as the response rate you achieve, depends, to a large extent, on the design and the structure of
your questionnaire. In this study, the questionnaire design was approached in one way that is
by adopting questions used in other questionnaires.
The questionnaires consist of five sections using a summated rating method, which required
respondents to circle the number that accurately represents their perception of each statement.
The first part of the questionnaire covered the respondents’ personal information. The second
section addressed questions relating to students’ perceptions of service quality as well as how
institutional reputation can influence their perception of service quality dimensions,
satisfaction and loyalty. The third section evaluated students’ satisfaction. The SERVQUAL
model developed by Parasuraman, et al., (1988) was adopted as the instrument for service
quality measurement. Only performance perceptions of the students were measured which
implies that the study adopted a modified SERQUAL model by (Parasuraman et al.,1988). A
five-point Likert scale, which measures the extent to which respondents agree or disagree with
statements, was used. The Likert scale is an appropriate format for measuring the respondent's
agreement to a series of beliefs or statements about a given object (Webb, 2000). The 5-point
rating scale was used to measure the respondents’ perceptions with regards to the constructs
under investigation. The descriptors ranged from 1(strongly disagree) to 5(strongly agree).
The Section A contained seven questions pertaining to the student`s personal profile, while
Sections B required the respondents to evaluate the service components of the University of
University of Ghana http://ugspace.ug.edu.gh

89
Ghana, in which only perceptions data was collected and analysed. Specifically, section B
consisted of 40 perception-items, questionnaire adopted from (Fosu and Owusu, 2015 &
Hassan et al.,2009). All the items in sections B were presented as statements on the
questionnaire, using the same rating scale throughout the entire study.
In addition to the main scale addressing individual items, respondents were asked in Section C
to provide their overall level of satisfaction, based on the level of servicev quality received,
questionnaire adopted from (Hassan et al., 2009). Finally, the respondents were asked in
section D to indicate the extent to which they will be loyal to the university base on their
perception of service quality, questionnaire adopted from (Rojas-Mendez, Vasquez- Parraga,
Kara & Cerda – Urrutia,2009). The drafted questionnaire was eventually subjected to a pilot
testing with a total of 50 students, and they were asking to comment on any perceived
ambiguities, omissions or errors concerning the draft questionnaire. Respondents were asked
to indicate the extent to which each item reflects the University`s service quality on a 5-point
likert scale from 1=strongly disagree to 5= strongly agree. The reliability test (Cranach`s alpha)
was used to determine the internal consistency and the reliability of the instruments. The
students’ loyalty was measured by six items on a 5-point Likert scale, questionnaire adopted
from Rojas-Mendez et al., (2009) modify to suit the current study. The first item measured the
students’ recommendations as a result of the service quality delivery. The second and the fifth
items measured the students continued enrolment decision as a result of the quality of the
service delivered. The third item measured students` decision to look for an alternative
institution. The fourth item measured the word of mouth communication and students’
recommendations base on the level of service quality experienced.
4.15 Confirmatory Factor Analysis
University of Ghana http://ugspace.ug.edu.gh

90
According to Hair, Black, Babin, Anderson, and Tatham, (2006) factor analysis is a technique
particularly suitable for analyzing the patterns of complex, multidimensional relationships
encountered by researchers, and it is also used to determine whether the information can be
condensed or summarized in a smaller set of factors or components. These components are, by
definition, highly inter-correlated, and assumed to represent dimensions within the data. Factor
analysis can reduce data by identifying representative variables from a much larger set of
variables or create an entirely new set of variables. Scholars have concluded that, to run factor
analysis, the preferable sample size should be 100 or more. The critical assumptions underlying
factor analysis are more conceptual than statistical. According to Hair et al., (2006) it is the
obligation of the researcher to ensure that the experiential patterns are conceptually valid and
appropriate to study with factor analysis, as the technique has no means of defining suitability
other than correlations among variables.
Hair et al. (2006), identifies the following rules of thumb for conducting factor analysis:
1. A strong conceptual background needs to support the assumption that a structure does exist
before the factor analysis.
2. A statistically significant Bartlett’s test of spericity (sig.<0.05) indicates that sufficient
correlations exist among variables.
3. MSA (KMO) values should exceed 0.50 for both the overall test and each individual
variable; variables with values less than 0.50 should be omitted from the factor analysis one at
a time, with the smallest one being omitted each time. According to Hair et al., (2006), a
principal component analysis model is the most appropriate type of factor analysis when a
researcher is considering data condensation. A confirmatory factor analysis was employed for
the purpose of achieving simpler and theoretically more meaningful factor (CFA) solutions.
CFA helped to improves the interpretation by reducing some of the ambiguities that were
University of Ghana http://ugspace.ug.edu.gh

91
accompanied initially. This method was employed because all the variables were adopted from
the literature.
4.16 Reliability and Validity Analysis.
4.16.1 Validity
Validity refers to whether the statistical instrument measured what it intended to measure i.e.
accuracy measurement (Saunders et al., 2007). Validity of statistical instruments can be done
both internally and externally. The following forms of internal and external validity were used
in the study.
Face Validity: This involves assessing whether a logical relationship exists between the
variables and the proposed measure (Hair et al., 2006; Saunders, Lewis & Thornhill, 2007). In
this study a questionnaire-based survey was used to measure students’ perception of service
quality in higher educational institutions and their loyalty as well the role the level of education
and institutional reputation played in this relationship as it was found logical.
Content Validity: Content validity refers to whether a measurement instrument has acceptable
and representative coverage of the concepts in the variables being measured (Saunders et al.,
2007). To achieve content validity, the questionnaire for this study was given to research
experts in marketing for review.
Criterion Validity: This refers to ensuring validity by showing a correlation between the
measurement instrument and some standard that is thought to accurately measure the variable
being measured (Saunders et al., 2007). In this study, the questionnaire adopted was compared
with other validated SERVQUAL instruments that have been developed and used in several
studies.
University of Ghana http://ugspace.ug.edu.gh

92
Construct Validity: This involves measuring an instrument to a general theoretical framework
in order to determine whether the device confirms a series of hypothesis derived in an existing
theory (Saunders et al., 2007). This was ensured by deriving the determinants of students’
perception and service quality from the already established Parasuraman et al., (1988) model.
External Validity: According to Saunders et al., (2007), the external validity refers to the extent
to which the results of a study could be generalised. In this study, external validity was ensured
by generalising the findings and results to customers (Students) in Ghana (using the students
of the University of Ghana).
4.16.2 Reliability
Reliability is an examination of the degree of consistency between multiple measurements of
a variable (Hair et al., 2006). To ensure that the questionnaire is able to elicit the required
information for the study, a sample of the questionnaire was pre-tested. Cronbach’s alpha was
used to determine the reliability of the measurement instrument. The measure ranges from 0 to
1. A value of 1 indicates perfect reliability, and the value 0.70 is considered to be the lower
level of acceptability (Hair, Anderson, Tatham & William, 1998). Nunnally (1978) also posit
that, Cronbach’s alpha of each instrument should be greater than the recommended levels of
0.70 to ensure the satisfactory internal consistency of the measured items under each
correspondent construct. Theerefore, a Cranach’s alpha of at least 0.70 was ensured, this
being the widely accepted limit for a high reliability test.
4.17 Normality Checking
Before any multivariate analysis is performed, it is very crucial to confirm the assumption of
data normality (Hair et al., 2006). According to them, whether the data are normally distributed
University of Ghana http://ugspace.ug.edu.gh
93
can be indicated by measures of distributions, such as skewness and kurtosis. In this study,
skewness and kurtosis was used to assess the normality.
4.18 Multicollinearity
When two or more independent variables are highly correlated, this is known as
multicollinearity (Hair et al., 2006). In another case multicollinearity takes place when one
single independent variable is highly correlated with a set of other independent variables. Hair
et al. (2006), identified the two most common measures for assessing multicollinearity as;
tolerance and the variance inflation factor. Tolerance refers to a direct measure of
multicollinearity, that is, the amount of variability of the selected independent variable not
explained by the other independent variables. Variance inflation factor refers to a measure of
multicollinearity as an inverse of the tolerance value. According to Hair et al. (2006) tolerance
values of up to 0.10 and a VIF of up to 10 are the acceptable levels.
4.19 Analysis
Zikmund and Babin, (2010) define data analysis as the application of reasoning to understand
the data that have been gathered. The authors further posit that data analysis may involve
determining consistent patterns and summarizing the relevant details revealed in an
investigation. Primary data collected were entered into the Statistical Product for Services
Solution (SPSS) version 22 and with the aid of regression analysis and the structural equation
model Amos, the relationship between service quality and students’ perception was examined
and the hypotheses statistically tested. The appropriate analytical technique for data analysis
was determined by the characteristics of the research design and nature of data gathered.
According to Zikmund and Babin, (2010) statistical analysis varies from univariate, bivariate
University of Ghana http://ugspace.ug.edu.gh
94
to multivariate analysis. This section addresses how the raw data were processed. It comprised
of entering, checking and coding data; reliability analysis, multicollinearity and validity.
Entering, Checking and Transforming the Data
Data processing generally begins by editing and coding the data. According to Zikmund and
Babin (2010), editing involves cross examining the questionnaire for omissions, legibility, and
consistency in classification. The editing process helped to correct problems such as
interviewer errors that is an answer that was recorded in a wrong portion of the questionnaire
and incomplete questionnaires before the data were transferred to the SPSS Amos software for
analysis. The process of interpreting, categorizing, recording, and transferring the data to the
software programmes is refereds to as coding. The coding process facilitate the computer or
hand tabulation. The data were edited for non-answered questions. Questionnaires that the
respondents did not complete were withdrawn from the data set. The data were then coded and
entered into SPSS vession 22 Amos Software. The frequencies command in SPSS was to
detect any coding error. Data was re-coded and transformated into different variables.
4.20 Descriptive Statistical Analysis
Pallant, (2011) posit that, prior to doing many of the statistical analyses (e.g. t-test, ANOVA,
correlation), in studies involving human participants, it is important to subject the data to
descriptive analysis before any further data validation and analysis. Descriptive statistics such
as measures of central tendency, which includes the mean, standard deviation, range of scores,
skewness and kurtosis were used. They helped to indicate the extent to which the respondents
disagreed or agreed with the statements in the questionnaire and indicate how each statement
performed from the respondents’ point of view. Descriptive statistics allow the researchers to
present the data acquired in a structured, accurate and summarized manner (Huysamen, 1994).
University of Ghana http://ugspace.ug.edu.gh

95
4.21 Inferential Statistical Analysis
According to Sekaran (2003), “inferential statistics allow researchers to infer from the data, the
relationship between two variables; differences in a variable amongst different subgroups; and
how several independent variables might explain the variance in a dependent variable.”
4.22 Regression Analysis
A regression is a statistical process used to estimate the strength of a relationship between one
or more dependent variables and one or more independent variables (Saunders et al., 2007).
Regression analysis could be simply involving one dependent variable and one independent
variable, or multiple involving one dependent variable and two or more independent variables
(Saunders et al., 2007). The regression analysis was used in order to detect and predict the
relationship between students’ perception and servicen quality dimensions. Unlike the Pearson
correlation analysis, regression analysis enabled us to infer relationships between more than
two variables simultaneously.
University of Ghana http://ugspace.ug.edu.gh

96
CHAPTER FIVE
ANALYSIS AND DISCUSSIONS
5.1 Introduction
The analysis and discussion is presented in six sections. Firstly, the demographic
characteristics of the respondents are examined. Secondly, the results of the descriptive
statistics are examined. Thirdly, the result of the confirmatory factor analysis (CFA) are
discussed. The fourth section provides an analysis of the hierarchical multiple regression
results. The fifth sections presents two structural path models, one involving service quality
dimensions, students’ satisfaction and their loyalty devoid of institutional reputation, and one
that controls for the institutional reputation. The sixth section presented the moderating effects
of the level of education on students’ satisfaction and loyalty. The final part of the chapter
discusses the findings of this study.
University of Ghana http://ugspace.ug.edu.gh

97
Table 5.1 Dermographics Profile
Frequency Percentage
Gender of Respondents Male 212 61.6
Female 132 38.4
Age of Respondents Below 20 years 91 26.5
20-30 years 199 57.8
30 and above 54 15.7
Income Level of
Respondents
Below 1000 199 57.8
1001-2000 47 13.7
2001-3000 34 9.9
3001-4000 23 6.7
4001-above 41 11.9
Educational Background Diploma 37 10.8
Undergraduate 197 57.3
Masters
(MBA/EMBA/MPHIL)
99 28.8
PhD 11 3.2
Occupational Background Business/Self-Employed 77 22.4
Public Servant 45 13.1
Private Sector 43 12.5
Not working/Unemployed 177 51.5
Others 2 0.6
Residential Status Resident 109 31.7
Non-resident 235 68.3
N=344 Source; field survey 2016
5.2 Profile of Respondents
Three hundred and forty-four (344) valid questionnaires were used for the analysis out of 379
administered questionnaires, this accounted for 90.765%. The data on gender revealed, 212
males (61.6%) and 132 females (38.4%). The age distribution of the respondents showed,
students less than 20 years old represented 91 (26.5%), those who were between 20 and 30
University of Ghana http://ugspace.ug.edu.gh

98
years old accounted for 179 (57.8%) and respondents above 30 years of age were 54 (15.7%).
The analysis on educational background of the respondents revealed that, 11 (3.2%) were PHD
candidates, Master’s degree students accounted for 99 (28.8%) of the respondents,
undergraduates (first degree) students represented 197 (57.3%) and Diploma students recorded
37 (10.8). The analysis on the respondents’ income level (monthly) revealed that, 199(57.8)
earn less than GHC 1000 per month, those who earn between GHC 1001 and 2000 per month
accounted for 47(13.7%), 34 (9.9%) earn between GHC 2001 and 3000, between GHC 3001
and 4000 income group accounted for 23 (6.7%) and the rest 41(11.9%) earn more than GHC
4000 cedis per month. With respect to the respondents’ residential status, those who were
residents on campus accounted for 109 (31.09) where as those who were not residents on
campus were 235 (68.3%). The statistics on the respondents’ occupational background
established that, 77 (22.4%) were either doing their own business or self-employed, 45(13.1%)
were public servant, 43(12.5%) works in the private sector, 177 (51.5) were either not working
or they were unemployed, the rest, 2 (0.6%) did not indicate their occupational background.
5.3 Descriptive Statistics
In studies involving human participants, prior to doing many of the statistical analyses (e.g. t-
test, ANOVA, correlation), it is important to subject the data to descriptive analysis before any
further data validation and analysis (Pallant, 2011). These descriptive statistics include
measures of central tendency such as the mean, standard deviation, range of scores, skewness
and kurtosis. The table below displays the descriptive statistics of the variables used in the
survey instrument. They indicate the extent to which the respondents disagreed or agreed with
the statements in the questionnaire and indicate how each statement performed from the
respondents’ point of view. From the table the highest mean was 4.0174 (Professional image
of university) while the lowest was 2.0669 (Registration is timely and error free). The 53
University of Ghana http://ugspace.ug.edu.gh

99
variables displayed in Table 5.2 below represent the components of the constructs depicted in
the conceptual framework for the study.
Table 5.2 – t test (descriptive statistics)
Variables CODE Mean s.d
Physical facility TAN1 3.3256 1.18977
Classroom lighting TAN2 3.6890 1.13224
Appearance of building, grounds etc. TAN3 3.4331 1.07240
Overall cleanliness TAN4 3.3750 1.11526
Comfortable classrooms and study rooms TAN5 3.2471 1.12226
Conducive decor and atmosphere TAN6 3.3372 1.06205
Appearance of academic & non-academic staff TAN7 3.4942 1.03014
Adequate parking space TAN8 3.3023 1.15119
Adequate computers in lab TAN9 2.8314 1.13803
Up-to-date computers TAN10 3.0581 1.08372
Access to internet facilities TAN11 2.8953 1.16838
Up-to-date software in computers TAN12 3.142 1.0131
Available and accessible course materials TAN13 3.1047 1.06115
Good and attractive course materials TAN14 3.1628 .99691
Friendly and courteous lecturers ASS1 3.5262 1.06599
Friendly and courteous admin staff ASS2 3.2994 1.05000
Research efficient/productive lecturers ASS3 3.6221 1.01141
Highly accredited lecturers ASS4 3.6860 1.06370
Innovative lecturers and agents of change ASS5 3.3866 1.05474
Adequately knowledgeable university staff of rules and procedures ASS6 3.4099 .99445
Source; field survey 2016
University of Ghana http://ugspace.ug.edu.gh

100
Table 5.3 - t test (descriptive statistics) continued
Variables CODE Mean s.d
Adequate university security ASS7 3.3372 1.09715
Timely and error-free registration REL1 3.0349 1.14487
Accurately kept records REL2 3.2703 1.01857
General reliability of lecturers REL3 3.2587 1.03295
Sincere and problem solving admin staff REL4 2.9971 1.08930
Provision of services on time and as promised REL5 3.0843 1.03658
Sincere and problem solving lecturers REL6 3.3227 1.00318
Excellent quality programmes on offer REL7 3.6250 .98179
Always available personnel to assist RES1 3.0349 1.11390
Capable lecturers to attend to problems when they arise RES2 3.4564 .97093
Seldom information seeking with 'run-around' scenario RES3 3.1453 .99669
Channels for students’ complaints available RES4 2.9767 1.12721
Efficient and prompt query address RES5 2.9593 1.07642
Admin staff with students' interest at heart EMP1 2.948 1.1694
Convenient computer access EMP2 3.0959 1.10107
Convenient study room access EMP3 3.1221 1.09979
Willingness of staff to give attention to students EMP4 3.0959 1.08237
Empathetic and supportive lecturers to students’ needs EMP5 3.1919 1.04608
Fair and unbiased treatment of students EMP6 3.1395 1.11614
Professional image of university REP1 4.0174 1.11169
Reputable academic programmes REP2 3.9709 1.04101
Easily employable graduates of the university REP3 3.3314 1.10686
Satisfaction with decision to attend university SAT1 3.6890 1.16273
Choice of university being wise SAT2 3.8256 1.10859
Happiness in decision to enrol in university SAT3 3.7907 1.14149
Right decision made on university enrolment SAT4 3.8110 1.12579
Happy to have enrolled in university SAT5 3.7558 1.16745
Recommend Legon to friends and relatives SLOYAL1 3.7384 1.18353
Reconsider university in further education SLOYAL2 3.5610 1.19122
Non-consideration of alternative university when in need of
academic services
SLOYAL3 3.2297 1.19871
Communicate positively about university to friends and relatives SLOYAL4 3.6715 1.04962
Non-negative communication about services provided by
university
SLOYAL5 3.3459 1.18523
Re-choose the university in case of next choice SLOYAL6 3.4767 1.22154
Source; field survey 2016
University of Ghana http://ugspace.ug.edu.gh

101
5.4 Confirmatory Factor Analysis (CFA)
Since the survey scale measures were adopted from literature, a confirmatory factor analysis
(CFA) was conducted on the variables. The variables were checked for their loadings and
reliabilities. The reliability and validity of the measures represent the constructs being
examined and evaluate the psychometric properties of scaled measures (Fornell & Larcker,
1981). On the basis of this, six variables (SLOYAL5, REL1, TAN9, TAN10, TAN11 and
TAN1) were dropped during the CFA because their loadings were less than the threshold value
of 0.5. The composite reliabilities gave an indication of the internal consistency, which means
that the measures consistently represent the same latent construct. The composite construct
reliability of each construct ranged from 0.776 (responsiveness) to 0.959 (satisfaction), which
meets the acceptable criteria (Fornell & Larcker, 1981; Hair et al., 2006). Table5.4 and Table
5.5 presents the standardized loadings and the t-value of each variable indicator. All indicators
had significant standardized loadings of ρ ≤ 0.001, and t-values of the individual indicators
ranged from 5.018 to 27.634 (Fornell & Larker, 1981). All the eight constructs were tested for
their goodness of fit and authentication of scales of the measurement of the constructs by the
CFA. The model fit indices in the measurement model exhibited a good fit on the data (Χ2 =
3275.669, df = 1648, GFI = .907, CFI = .938, RMSEA = .054, PCLOSE = 0.069). These indices
meet the acceptable criteria for the overall model fit of the sample group suggested by Kline
(2005).
University of Ghana http://ugspace.ug.edu.gh

102
Table 5.4 Confirmatory Factor Analysis Results
Constructs
(Cronbach’s
Alphas)
Items Standardized
Loading t-value P
Composite
reliability
Tangibles (α =
0.862) TAN14 0.543 Fixed 0.856
TAN12 0.566 8.626 ***
TAN8 0.583 8.489 ***
TAN7 0.56 8.153 ***
TAN6 0.628 9.245 ***
TAN5 0.634 9.237 ***
TAN4 0.664 9.198 ***
TAN3 0.667 9.322 ***
TAN2 0.634 8.837 ***
TAN1 0.614 8.962 ***
Assurance (α =
0.845) ASS7 0.63 Fixed 0.843
ASS6 0.684 10.327 ***
ASS5 0.714 10.835 *** ASS4 0.639 10.272 ***
ASS3 0.656 10.424 ***
ASS2 0.66 10.015 ***
ASS1 0.628 9.664 ***
Reliability (α = 801) REL7 0.598 Fixed 0.809
REL6 0.701 9.687 ***
REL5 0.649 9.258 ***
REL4 0.676 9.284 ***
REL3 0.655 9.297 ***
REL2 0.58 8.738 ***
Responsiveness (α =
0.783) RES1 0.721 Fixed 0.776
RES2 0.666 11.074 ***
RES3 0.566 9.826 ***
RES4 0.643 11.741 ***
RES5 0.596 11.338 ***
Χ2 = 3275.669, df = 1648, GFI = .907, CFI = .938, RMSEA = .054
Source; field survey 2016
University of Ghana http://ugspace.ug.edu.gh

103
Table 5.5 Confirmatory Factor Analysis Results continued
Constructs
(Cronbach’s
Alphas)
Items Standardized
Loading t-value P
Composite
reliability
Empathy (α =
0.864) EMP1 0.668 Fixed 0.858
EMP2 0.686 11.604 ***
EMP3 0.67 11.368 ***
EMP4 0.775 12.533 ***
EMP5 0.752 12.289 ***
EMP6 0.693 11.684 ***
Reputation (α =
0.801) REP1 0.881 Fixed 0.826
REP2 0.896 19.775 ***
REP3 0.54 10.478 ***
Satisfaction (α =
0.959) SAT1 0.893 Fixed 0.959
SAT2 0.945 27.634 ***
SAT3 0.922 27.418 ***
SAT4 0.88 25.565 ***
SAT5 0.9 25.359 ***
Loyalty (α =
0.890) SLOYAL1 0.851 Fixed 0.892
SLOYAL2 0.821 18.345 ***
SLOYAL3 0.665 13.572 ***
SLOYAL4 0.771 16.691 ***
SLOYAL6 0.827 18.554 ***
Χ2 = 3275.669, df = 1648, GFI = .907, CFI = .938, RMSEA = .054
Source; field survey 2016
5.5 Discriminant Validity
Discriminant validity compares the variance-extracted estimates of the dimensions with the
square of the parameter estimate between the measurements. Table5. 4 shows the means,
standard deviations, whereas Table 5.6 correlation values among the seven constructs. The
University of Ghana http://ugspace.ug.edu.gh

104
means ranged from 3.10 (Empathy) to 3.77 shared by (reputation) and (satisfaction), and the
standard deviations from 0.73 to 1.06. The correlations among the constructs ranged from 0.234
to 0.762. The lowest correlation was that between loyalty and tangibles (r = 0.234), and the
highest was that between value for empathy and responsiveness (r = 0.762). The results
demonstrated the strength and direction of relationships among the factors. This was carried
out to cater for multicollinearity and to confirm that the factors are distinct from each other and
not measuring the same attributes. The average variance-extracted (diagonals) estimates
measure the amount of variance captured by a construct in relation to the variance due to
random measurement error. The variance extracted scores of the constructs ranged from 0.506
(Tangibles) to 0.825 (satisfaction), which suggests adequate convergent validity (Bagozzi &
Yi, 1988; Fornell and Larcker, 1981).
Table 5.6 Descriptives, Correlations and AVEs
Constructs Mean s.d 1 2 3 4 5 6 7 8
Tangibles 3.35 0.73 (.506)
Assurance 3.47 0.75 .641** (.535)
Reliability 3.26 0.73 .568** .712** (.515)
Responsiveness 3.11 0.77 .523** .550** .654** (.510)
Empathy 3.10 0.85 .508** .524** .633** .762** (.542)
Reputation 3.77 0.92 .530** .569** .449** .345** .296** (.624)
Satisfaction 3.77 1.06 .546** .584** .475** .402** .382** .623** (.825)
Value 3.35 1.02 .399** .430** .384** .363** .389** .408** .391** (.649)
Loyalty 3.54 0.98 .234** .348** .300** .368** .337** .351** .507** .496** (.624)
Source; Fied Survey, 2016
University of Ghana http://ugspace.ug.edu.gh

105
5.6 Hypothesis Testing Using Structural Equation Modelling (SEM)
To help understand and evaluate the various hypotheses made earlier in this study, the study
employed a structural equation modeling (SEM) approach. SEM is essentially considered a
preferred modeling method (Bagozzi & Yi, 2012) because researchers can use it to control for
measurement error, provide information on the degree of fit of the tested model, and test
multiple relationships (Bagozzi & Yi, 2012). Two structural paths were estimated to test the
hypotheses between the constructs. The first structural model dealt with the framework without
institutional reputation while the second structural model controlled for institutional reputation.
The AMOS output provided some measures which allow assessment of the absolute and
incremental fit of the proposed model.
Table 5.7 Fit Indices of Models
Fit index Recommended
value
Model 1 Model 2
Chi-square/df ≤ 3 (71.713/27) = 2.65 (74.178/31) = 2.39
GFI ≥ 0.90 .964 .966
AGFI ≥ 0.80 .912 .914
CFI ≥ 0.90 .969 .974
RMSEA ≤ 0.08 .069 .064
Source; field survey; 2016
In Model 1 of the study model results, a chi-square of 71.713 (df = 27, p < .01) indicating a
normed chi-square fit value of 2.65. The root-mean-square-error of approximation (RMSEA)
value is 0.069; goodness-of-fit index (GFI) is 0.964 with an AGFI of 0.912. Regarding the
incremental fit measures, the comparative fit index (CFI) value was 0.969. In the second model
results, a chi-square of 74.178 (df = 31, p < .01) indicating a normed chi-square fit value of
University of Ghana http://ugspace.ug.edu.gh

106
2.39. The root-mean-square-error of approximation (RMSEA) value is 0.064; goodness-of-fit
index (GFI) is 0.966 with an AGFI of 0.914. For the incremental fit measures, the comparative
fit index (CFI) value was 0.974. These results from the structural model assessment statistics
above reveal that the models appear to have established an acceptable fits and therefore
accomplished a satisfactory level of validity.
In Model 1, only the controls were estimated. However, in Model 2, the hypothesized
relationships were included. In Model 1, it was found that regarding the relationship between
service quality dimensions and student’s satisfaction, only Assurance (β=0.274, t-value= 4.764,
p<.001) and Tangibles (β=0.360, t-value= 5.478, p<.001) had a positive and statistically
significant relationship. Hypothesis H1 was partially supported, Hypothesis H1a and H1b were
fully supported where as H1c, Hd and H1d were not. In the relationships between service
quality dimensions and loyalty, Tangibles (β=0.169, t-value= 2.691, p<.05) and
Responsiveness (β=0.192, t-value= 2.602, p<.05) haves positive and statistically significant
relationships. Hypothesis H1 was partially supported, Hypothesis H1a and H1d were fully
supported where as H1b, H1c and H1e were not. There was also a strong positive and statistical
relationship between students’ satisfaction and loyalty (β=0.467, t-value= 8.179, p<.001) in the
first model devoid of institutional reputation. Hypothesis H4 was also suported in this regard.
In Model 2, it was found that regarding the relationship between service quality dimensions
and student’s satisfaction, Institutional reputation (β=0.389, t-value= 7.948, p<.001),
Assurance (β=0.213, t-value= 3.373, p<.001) and Tangibles (β=0.160, t-value= 2.918, p<.05)
had a positive and statistically significant relationship. Hypothesis H2 was partially supported,
Hypothesis H1a and H1b were fully supported, where as H1c, H1d and H1e were not. In the
association between service quality dimensions and loyalty, Tangibles (β=0.183, t-value=
University of Ghana http://ugspace.ug.edu.gh

107
2.875, p<.05) and Responsiveness (β=0.190, t-value= 2.584, p<.05) has a positive and
statistically significant relationships. Hypothesis H1 was partially supported, Hypothesis H1a
and H1d were fully supported, where as H1b, H1c and H1e were not. There was also a strong
positive and statistical relationship between students’ satisfaction and loyalty (β=0.431, t-
value= 6.967, p<.001) in the second model in which institutional reputation was controlled for.
Thus hypotheses H4 and H1 were supported in this study. Table 5.6 displays the results of the
hypotheses tests using structural equation modelling.
Table 5.8 Structural Model Assessment Results
Model 1 Model 2
Controls β (t-
value) P β (t-value) P
Gender .041
(.921) 0.357 .040 (.909) 0.363
Age .007
(.132) 0.895 .008 (.160) 0.873
Income -.094 (-
1.867) 0.062
-.094 (-
1.877) 0.061
Education -.030 (-
.585) 0.558
-.036 (-
.700) 0.484
Hypothesized Paths
Satisfaction <--- Tangibles .274
(4.764) 0.000
.160
(2.918) 0.004
Satisfaction <--- Assurance .360
(5.478) 0.000
.213
(3.373) 0.000
Satisfaction <--- Reliability .039
(.566) 0.572 .012 (.190) 0.849
Satisfaction <--- Responsiveness .031
(.445) 0.656 .021 (.328) 0.743
Satisfaction <--- Empathy .007
(.096) 0.923 .051 (.812) 0.417
Loyalty <--- Empathy .110
(1.531) 0.126
.120
(1.671) 0.095
Source; field survey 2016
University of Ghana http://ugspace.ug.edu.gh

108
Table 5.9 Structural Model Assessment Results continued
Model 1 Model 2
Controls β (t-value) P β (t-value) P
Loyalty <--- Satisfaction .467 (8.179) 0.000 .431 (6.967) 0.000
Loyalty <--- Responsiveness .192 (2.602) 0.009 .190 (2.584) 0.01
Loyalty <--- Reliability -.046 (-.636) 0.525 -.051 (-.706) 0.48
Loyalty <--- Assurance .056 (.771) 0.441 .035 (.478) 0.632
Loyalty <--- Tangibles .169 (2.691) 0.007 .183 (2.875) 0.004
Satisfaction <--- Reputation .389 (7.948) 0.000
Loyalty <--- Reputation .087 (1.427) 0.153
Loyalty <--- Reliability -.046 (-.636) 0.525 -.051 (-.706) 0.48
Loyalty <--- Assurance .056 (.771) 0.441 .035 (.478) 0.632
Loyalty <--- Tangibles .169 (2.691) 0.007 .183 (2.875) 0.004
Satisfaction <--- Reputation .389 (7.948) 0.000
Loyalty <--- Reputation .087 (1.427) 0.153
Source; field survey 2016
The Moderating Effect of Educational Level
The moderation analysis was conducted through a sub-group analysis. Two groups of
undergraduates and postgraduates were constructed for this purpose. Drawing from the
suggestions from Arpin, (2007), Sickler, (2013) and Memon et al., (2014) the research further
examined the variations in service quality dimensions and students’ levels of satisfaction and
loyalty among undergraduate and postgraduate students. Table5.7 shows the results for
variations in level of satisfaction while Table5.8 displays the levels of loyalty. From the
sampled respondents, there were a total of 234 undergraduate students and 110 postgraduate
students. Table5.7 displays the results of the variations between the two student categories.
University of Ghana http://ugspace.ug.edu.gh

109
Among the undergraduates, institutional reputation, assurance and tangibles were found to be
positively and statistically influencers of student’s satisfaction. On the other hand, tangibles
and reputation were the only positive and statistically significant influencers of students’
satisfaction among postgraduate students.
Table 5.10 Test of variations among undergraduates and postgraduates’ satisfaction.
Undergraduates Postgraduates
Independent variables Β t-value Β t-value
Tangibles .127 2.038** .443 4.011***
Assurance .310 4.159*** -.051 -.443
Reliability -.058 -.772 .061 .565
Responsiveness -.054 -.724 .090 .726
Empathy .042 .610 .071 .552
Reputation .478 8.309*** .267 3.118**
R2 .553 .479
Adjusted R2 .541 .448
F-stats 46.717*** 15.755***
Dependent variable: Student satisfaction *** p<0.01, ** p<0.05, * p<0.1
Source; field survey 2016
Table 5.8 below displays the results of the variation in loyalty among these categories of
students. The responsiveness dimension and institutional reputation were found to be
statistically positive and significant influencers of undergraduates’ students’loyalty. Whereas,
empathy and institutional reputation were found to be statistically positive and significant
influencers of postgraduates’ students’ loyalty. The ongoing results present some interesting
findings for discussions.
University of Ghana http://ugspace.ug.edu.gh
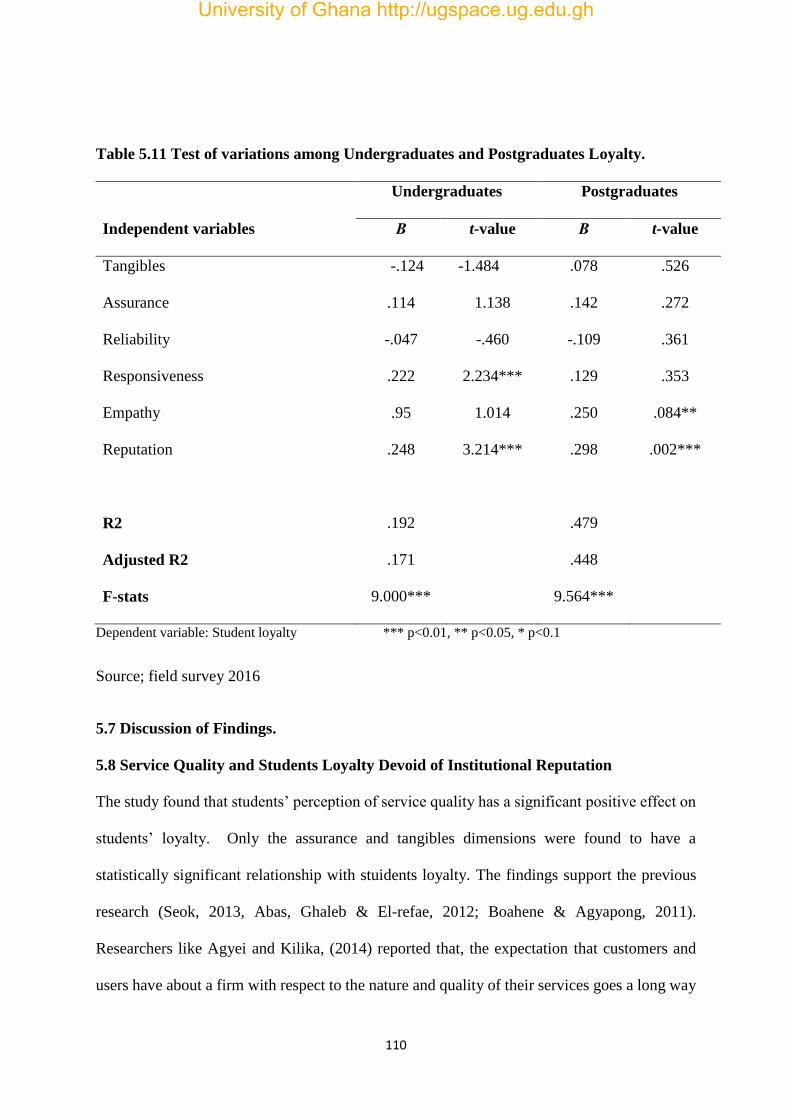
110
Table 5.11 Test of variations among Undergraduates and Postgraduates Loyalty.
Undergraduates Postgraduates
Independent variables Β t-value Β t-value
Tangibles -.124 -1.484 .078 .526
Assurance .114 1.138 .142 .272
Reliability -.047 -.460 -.109 .361
Responsiveness .222 2.234*** .129 .353
Empathy .95 1.014 .250 .084**
Reputation .248 3.214*** .298 .002***
R2 .192 .479
Adjusted R2 .171 .448
F-stats 9.000*** 9.564***
Dependent variable: Student loyalty *** p<0.01, ** p<0.05, * p<0.1
Source; field survey 2016
5.7 Discussion of Findings.
5.8 Service Quality and Students Loyalty Devoid of Institutional Reputation
The study found that students’ perception of service quality has a significant positive effect on
students’ loyalty. Only the assurance and tangibles dimensions were found to have a
statistically significant relationship with stuidents loyalty. The findings support the previous
research (Seok, 2013, Abas, Ghaleb & El-refae, 2012; Boahene & Agyapong, 2011).
Researchers like Agyei and Kilika, (2014) reported that, the expectation that customers and
users have about a firm with respect to the nature and quality of their services goes a long way
University of Ghana http://ugspace.ug.edu.gh

111
to influences their behavioral intention. Seok (2013) reported a significant positive effects of
service quality on customer loyalty. It is therefore worthy to note that, the findings from the
study is in line with established findings by other researchers in different sectors.
Furthermore, previous studies on service quality and students’loyalty (Zethaml et al., 2006;
Parasuraman et al.,1994), found a positive relationship between service quality, market share,
customer satisfaction and loyalty. Similarly, (Voss,2004; Maddern et al,. 2007, Newman &
Cowling,1998) found that, service quality is a competitive weapon, crucial to corporate
profitability and survival.
However, the findings contradict Abas Ghaleb and El- refree (2012) who reported no
significant relationship between the assurance dimension and students’ behavioral intention
and the one which revealed a relationship with empathy dimension. It was also in line with
their other findings which reported a significant positive relationship between tangibles
dimensions and students’ behavioral intention. The findings of Agyei and Kilika, (2014) also
establish that, service quality is a good predictor of customer loyalty.
Moreso, the current findings are inconsistent with Kerlin (2000) who revealed that students
place less emphasis on tangibles aspects of service quality including the appearance of the
institutions facilities and greater emphasis in the aspects that can affects their personal needs.
5.9 Service Quality and Students Satisfaction Deviod of Institutional Reputation
The findings from the study reveals a significant positive relationship between service quality
dimension and students’ satisfaction. Tangibles and responsiveness dimension were found to
have a positive and statistically significant relationship with students’ satisfaction. The current
University of Ghana http://ugspace.ug.edu.gh
112
findings is in consistent with (Alves & Raposo, 2010) who reported that perceived service
quality is an antecedent to students’ satisfaction. Marzo-Navarro et al., (2005) also found a
significant positive relationship between service quality and students’ satisfaction. Kwan and
Ng, (2011) also reported positive relationship between service quality and students’
satisfaction. The recent study supports Hassan, et al., (2009) who found a strong relationship
between the assurance dimension and students’ satisfaction and also contradicts their other
findings which reported a strong relationship between the empathy dimension and students’
satisfaction.
The current findings contradict Ali and Raza (2014) who reported weakest relationship
between the tangibles dimensions and students’ satisfaction, but rather found a significant
positive relationship was between reliability and empathy dimensions and students’
satisfaction.
5.10 Students` Satisfaction and Students` Loyalty Devoid of Institutional Reputation
The findings from the study found a significant positive relationship between students’
satisfaction and loyalty. The results of the study confirm the findings of Sickler (2013) who
found that the overall student satisfaction is a significant predictor of student retention. The
findings also in line with Kotler and Keller, (2006) who believe that customer satisfaction is
an antecedent to loyalty through delivery of high value products and services that meets the
needs and wants of customers. The study result also correlates the findings of Day, (1994) who
noted that, to successfully achieve customer loyalty and retention, it is worthy to note that,
management of various institutions needs to understand and satisfy customer needs and
requirement so as to gain competitive advantage in the industry in which they operate.
University of Ghana http://ugspace.ug.edu.gh

113
The findings of Abas, Ghaleb and El-refae, (2012) found a strong significant positive
relationship between customer satisfaction and behavioral intention, which is consistence with
the current findings. Kunanusorn and Puttawong (2015), found that it is important for higher
education institutions to satisfy their customers (students) in order to ensure their retention.
They further found that, it is likely for a dissatisfied student to reduce the number of courses or
drop out of a university completely. The current findings are said to support this finding.
Similarly, the findings of DeShield, (2004) concluded that, student satisfaction or
dissatisfaction leads to student retention or attrition. This is also synonymous to the present
findings. The findings of Wier-Jenssen et al., (2002), Mavondo et al., (2000), Schertzer and
Schertzer, (2004) found that, satisfied students may then engage in positive word-of-mouth
communication and return to the university to take other courses. The recent study supports the
above findings.
5.11 Service Quality and Students Satisfaction When Controlled for Institutional
Reputation
The study found a statistically significant positive relationship between service quality
dimensions, students’ satisfaction and institutional reputation. The relationship was established
by the tangibles and the assurance dimensions. The findings again, is in line with that of Alves
and Raposo, (2007) whose findings reveal that image is a variable with the greatest direct
influence on customer satisfaction and loyalty.
5.12 Service Quality and Students Loyalty When Controlled for Institutional Reputation
The study findings reveal that, there exist a statistically significant strong positive relationship
between service quality, institutional reputation and students’ loyalty. The relationship was
identified among Tangibles and Responsiveness dimensions. The current findings reaffirm
University of Ghana http://ugspace.ug.edu.gh
114
those of Kotler and Armstrong (2010) who found that corporate image has a very strong
influence on customer loyalty. Nukpezah and Nyumuyo (2009) also found that, corporate
image has an association with physical and behavioral attributes of a firm. Their study
identified a positive relationship between corporate image and customer loyalty in the
telecommunications, education and retailing sectors. The present findings support their
findings.
The result of the study is also in agreement with the findings of Agyei & Kilika, (2014) who
concluded that, the image expectation that customers and users have about a firm with respect
to the nature and quality of their services goes a long way to influence customer behavioral
intention. We can therefore infer that corporate image impacts on customer evaluation of
service quality, satisfaction and loyalty.
The results of the study by Helgesen and Nesset, (2007) and Brown and Mazzarol, (2009) is
also consistence with the findings of the present study which reveals that, university image has
been found to have a direct and positive influence on positive behavioral intention (students’
loyalty).
5.13 Service Quality, Students Satisfaction, Loyalty and Institutional Reputation
The findings from the study reveal that there exists a statistically strong positive relationship
between the service quality dimension, students’ satisfaction and loyaty as shown in the
structural Model 2. The findings support that of Mohamad (2009) who found that, the effect
of student satisfaction plays a significant role in establishing relationship between university
image and student loyalty.
University of Ghana http://ugspace.ug.edu.gh

115
5.14 Variation in Students Satisfaction of Service Quality among Degree Level
The findings from the study reveal a significant variation in students’ satisfaction among the
degree level. Institutional reputation, assurance and tangible dimensions were found to be
statistically significant influencers of students’ satisfaction among undergraduates. In another
case, only institutional reputation and tangible dimensions were found to be statistically
influencers of postgraduates’students’satisfaction. These findings go a long way to support the
findings of Arpin, (2007) who establish that, the zone of tolerance influences students’
perception of service quality, which in inturn influences their level of satisfaction, and that the
zone of tolerance could differ among students at diferrent levels. Lo (2010) contend that,
students’ satisfaction can be subjective, based on how well a learning environment helps to
achieve their academic objectives. This is also supported by the current study.
5.15 Variation in Students` Loyalty among Degree Level
The study again revealed a significant variation in loyalty among postgraduates and
undergraduates. Responsiveness and institutional reputation were found to influence
undergraduates’ loyalty. Emparthy and reputation were found to influence postgraduates’
loyalty. Kuo and Ye (2009) found that, service quality and institution image were the most
salient factors that influences post graduates’ students’ satisfaction and retention. The present
study confirms the above findings. Sickler (2013) found that, academic experience and level
of knowledge can infliuences students’ satisfaction and retention. The study re-affirmed the
stated findings.
University of Ghana http://ugspace.ug.edu.gh

116
CHAPTER SIX
SUMMARY OF RESULTS, CONCLUSIONS AND RECOMMENDATIONS
6.1 Summmary of Findings
This chapter brings to bear the end of the thesis. It provides the summary, conlusions, and
recommendations of the study based on the findings. The chapter is sub-divided under the
heardings mention above. The summary covers six areas: Service quality and students’ loyalty,
Service quality and students’ satisfaction, students’ satisfaction and students’ loyalty, variation
among degree level, the interaction effects of service quality dimensions’ students’ satisfaction
and students’ loyalty devoid of institutional reputation and the interaction effects of service
quality dimensions, satisfaction and loyalty, when controlled for institutional reputation.
6.1.1 Service Quality and Students’ Loyalty
The findings support Hypothesis 1 that service quality directly leads to students’ loyalty.
Hence, educational institutions that will deliever quality service to students, will be in a position
to gain their loyalty more than those that donot emphasize service quality.
6.1.2 Service Quality and Students’ Satisfaction
The findings support Hypothesis 2 that service quality directly influences students’ satisfaction.
The findings therefore imply that, when educational institution concentrate on delievering
quality service to students they will be able to satisfy them better than the competetion.
6.1.3 Students’ Satisfaction and Students’ Loyalty
The findings support the the Hypothesis 3 that students` satisfaction positively and significantly
influences their loyalty. The findings therefore suggest that, if higher educational institutions
want to achieve students’ loyalty, they must first satisfy them.
University of Ghana http://ugspace.ug.edu.gh

117
6.1.4 The Interaction Effects of Service Quality Dimensions’ Students’ Satisfaction and
Students’ Loyalty Devoid of Institutional Reputation
The findings partially support Hypothesis H1f that institutional reputation directly influences
students’ perception of service quality, their satisfaction and loyalty. Hypothesis H1f was
partally rejected since only two out of the five quality dimensions were found to be significant
and positive inflencers of students` satisfaction. Hypotheses 2 and 3 were partially supported
and partially rejected, since only 3 out of the 5 service quality dimensions were found to
statistically and positively influences satistisfaction and loyalty in this model.
6.1.5 The interaction effects of service quality dimensions,’ students’ satisfaction and
students’ loyalty when controlled for institutional reputatiion
The findings partially rejected Hypothesis H1f and partially supported it, since only 2 out of
the five service quality dimensions were found to be statistiacally positive and significant
influencers of students’ satisfaction and loyalty per the out come of the structural equation
model. Hypothesis 2 and 3 were also partially supported and partially supported, per the
outcome of the structural equation model 2.
6.1.6 Variation between the level of education Post graduates and Undergraduates
satisfaction and loyalty
Hypothesis H4 was surported since, the study revealed a significant variation in factors that
affects undergraduates and postgraduates perception.
University of Ghana http://ugspace.ug.edu.gh

118
6.2 Conclusions
The paper sought to examine students’ perception of service quality in higher educational
institutions in Ghana and its effects on students’ loyalty using the experience of students from
the University of Ghana Susiness School. Educational institutions that emphasize service
quality as a strategic tool and competive weapon will end up satisfying students, which will
lead to gaining their loyalty. The results of the study revealed that, some service quality
dimensions were pecuiliar to students and as such became an antecedent to satisfaction and
loyalty. Key among the service quality dimensions revealed by the students as a predictor of
their satisfaction and loyalty include tangibles, assurance and responsiveness dimensions.
Institutional reputation was found to influence students’ satisfaction and loyalty. It is therefore,
regarded as the best competitive strategy for satisfaction and loyalty. The findings confirmed
previous findings on service quality dimensions in the literature. However, there were other
findings discovered which were not evident in the extant literature. Therefore, the interpretation
of findings must be done with caution.
6.3 Implication of Findings
In order for educational institutions to achieve students’ satisfaction and loyalty, their managers
must focuse on identifying specific quality dimensions that are peculiar to students by knowing
the kind of perception that they form about their services delivery to them. This can be
achieved through periodic evaluation and review of the institutional service quality from the
students’ perspective. Managers of higher educational institutions must continue to engage
with students to identify their service quality requirements and expectations based on their
experience. They need to appreciate the outcome, if there is the need to make adjustments in
the institutional requirement as a result of changes in students’requirement and expectations.
After identifying these expectations and requirements, there is the need for management to
University of Ghana http://ugspace.ug.edu.gh

119
disseminate this information across the board, from the last security man to the vice-chancelor,
as every body`s role is equally important in delivering superior service quality in the institution.
Identifying and understanding students’ expectation and requirement is necessary but not
sufficient for managerial decision making, knowing their level of satisfaction and loyalty as
result of their expectation and experience are equally important. As identified earlier on in the
literature service quality, students’ satisfaction and loyalty, when implemented increases
market share and bottom line performance.
Knowing and identifying service quality alone doesnot lead to students’ loyalty. Managers of
higher educational institutions must view students as customers and as partners of their
institution. Hence, there is the need to create coordinated responses witin the istitution about
the service quality focus of the institution across all departments and all teahinng and non-
teaching staffs, as they all play a key role in dealing with students.
When an educational institution embarks on service quality and customer (students) focus as a
strategic tool and a key to success, students’ satisfaction and loyalty will certainly be achieved
better than those that donot recognized the role of service quality in their success criteria. It is
therefore, essential for managers of higher educational institutions to implement service quality
and be students focused oriented, before considering satisfaction and loyalty issues. When
service quality is successfully implemented the students will be satisfied and will certaingly be
loyal to the university. Service quality dimensions such as tangibles; assurance, responsiveness
and institutional reputation seem to establish a relationship between an institution and their
students’ satisfaction and loyalty. Hence, managers may consider theses dimensions in their
quest to deliever superior service quality that will lead to students’ satisfaction and loyalty.
University of Ghana http://ugspace.ug.edu.gh
120
The managers of higher educational institutions should not concentrate only on the quality
issues within their academic experience, but should also be concerned about the employment
ability of their graduates, quality of programmes offered and also build a strong professional
image for their institution, as institutional reputation was found to be a good predictor of
students’ satisfaction and loyalty.
6.4 Limitations of the Study and Future Research Directions
There were some in herent limitations, due to the study`s objectives. The present study helped
us to understand the interaction effects of service quality dimensions and institutional
reputation on students’ satisfaction and loyalty as well the overall effects of service quality
dimensions, students’ satisfaction and loyalty without institutional reputation. The study
collected data from only the students from University of Ghana Business School. This poses a
limitation on the researcher’s ability to generalized the findings. With this development,
caution is essential in generalizing the findings, although substantial evidence of relative
efficiency and effectiveness was found in the study.
Given that the current study is limited to only University of Ghana Business School. There is
the need to validate this assertion by further research. Future studies on service quality, students
satisfaction and loyalty should be carried out in other higher educational institutions in different
parts of the country. It will also be worthwhile, if future research compares different
institutions, more importantly private and public higher educational instituttions in the country.
Future research again aspiring to work in this area should consider the various possible market
postioning strategies on the basis of service quality of the institutions of higher learning.
Finally, the questionnaire was administered to only the students at the University of Ghana
Business School and not other colleges and schools. Future studies may consider the responses
University of Ghana http://ugspace.ug.edu.gh

121
of students in other colleges and schools within University of Ghana`s perception of service
quality as well how it will influence their satisfaction and loyalty with or without institutional
reputation.
University of Ghana http://ugspace.ug.edu.gh

122
REFERENCES
Abbas , B., Ghaleb , A., & EL-refae, A. (2012). Relationship between service quality
satisfaction and behavioral intentions of Malaysian Spa Center. International Journal
of Business and Social Science, 3(1),198-205
Abdul-Hamid, J. (2004). Students' perception of the quality of teaching and learning in
Business Studies Programs. Pertanika Journal of Social Sciences & Humanities, 12(1
), 71-86.
Abdullah, F. (2005). HEdPERF versus SERVPERF: The quest for ideal measuring
instrument of service quality in higher education sector. Quality Assurance in
Education, 13(4), 305-328.
Abdullah, F. (2006). Measuring service quality in higher education: Three instruments
compared. International Journal of Research & Method in Education, 29(1), 71-89.
Abukari, A., & Corner, T. (2010). Delivering higher education to meet local needs in a
developing context: The quality dilemmas. Quality Assurance in Education, 18(3),
191-208.
Agarwal , S., Erramilli, M. K., & Dev , C. S. (2003). Market Orientation and Performance in
Service firms: role of innovation. Journal of Services Marketing, 17(1), 62-82.
doi:10.1108/08876040310461282.
Agyei, P. M., & Kilika, J. M. (2014). Relationship between Corporate Image and Customer
Loyalty in the Mobile Telecommunication Market in Kenya. Management, 2(5), 299-
308.
Akbar, M. M., & Parvez, N. (2009). Impact of service quality, trust, and customer satisfaction
on customers loyalty. ABAC Journal, 29(1).
University of Ghana http://ugspace.ug.edu.gh

123
Akortsu, A. M., & Abor, A. P. (2011). Financing public healthcare institutions in Ghana.
Journal of health organization and management, 25(2), 128-141.
Aldridge, S., & Rowley, J. (1998). Measuring customer satisfaction in higher education.
Quality Assurance in Education, 6(4), 197-204.
Al-Fattal, A. (2010). Understanding students’ choice of university and marketing strategies in
Syria Private Higher Education. Retrieved January 9, 2016, from
http://ethesis.whiterose.ac.uk/1115
Ali , S. A., & Abdirisaq , I. M. (2014). Service Quality Provided by Higher Education
Institutions in Somalia and Its Impact on Student Satisfaction. European Journal of
Business and Management.
Ali, M., & Raza, S. A. (2014). Measurement of Service Quality Perception and Customer
Satisfaction in Islamic Banks of Pakistan: Evidence from Modified SERVQUAL
ModelIQRA University. Retrieved from http://mpra.ub.uni-muenchen.de/64039
Altbach, P. (1998). Competitive higher education knowledge: the university and development.
London: Albex.
Alves, H., & Raposo, M. (2007). Conceptual model of student satisfaction in higher
education. Total Quality Management, 18(5), 571-588.
Alves, H., & Raposo, M. (2010). The Influence of University Image on Students’ Behavior.
International Journal of Educational Management, 24(1), 73-85.
Anderson, E. A. (1995). Measuring service quality at a university health clinic. International
Journal of Health Care Quality Assurance, 8(2), 32-37.
University of Ghana http://ugspace.ug.edu.gh

124
Anderson, J. C., Jain , C., & Chintagunta, P. K. (1993). Customer value assessment in
business markets. Journal of Business to Business Marketing, 1(1), 3-29.
Arambewela, R., & Hall , J. (2013). The international effects of the internal and external
university environment, and the influence of personal values, on satisfaction among
international postgraduate students. Studies in Higher Education, 38(7), 98-972.
Arambewela, R., & Hall, J. (2009). An empirical model of international student satisfaction.
Asia Pacific Journal of Marketing and Logistics, 21(4), 555-569.
Arambewela, R., Hall, J., & Zuhair, S. (2006). Postgraduate International Students from Asia:
Factors Influencing Satisfaction http://dx.doi.org/10.1300/J050v15n02_05. Journal of
Marketing for Higher Education, 15 (2), 105-127.
Armstrong, G., Kotler, P., & He, Z. (2000). Marketing: an introduction. New Jersey: Prentice
Hall .
Arpin, J. (2007). Students' Perceptions of Service Quality at the Durban University of
Technology. Unpublish thesis
Asabre-Ameyaw, C. (2016). Evolution of the educational system in Ghana, Center for
educational Policy. Retrieved from University of Education Winneba Web site:
uew.edu.gh/sites/default
Asubonteng, P., McCleary, K. J., & Swan, J. E. (1996). SERVQUAL revisited: critical
review of service quality. Journal of Services Marketing, 10(6), 62-81.
Athiyaman, A. (1997). Linking student satisfaction and service quality perception: the case of
university education. European Journal of Marketing, 31(7), 528-540.
University of Ghana http://ugspace.ug.edu.gh

125
Bagozzi, R. P., & Yi , Y. (2012). Specification, evaluation, and interpretation of structural
equation models. Journal of the Academy of Marketing Science, 40(1), 8-34.
Banwet, D. K., & Datta, B. (2003). A study of the office of perceived lecturer quality on post-
lectur intentions. Work Study, 24, 253-268.
Bartlett, J. E., Kotrlik, J. W., & Higgins, C. C. (2001). Organizational Research: Determining
Appropriate Sample Size in Research. Published in Information Technology,
Learning and Performance Journal, 19(1).
Baryeh , B. O. (2009). Higher Education Quality in Ghana: How NAB Coping with the
Balance Between Improvement and Accountability. Master’s Thesis,Unpublished.
Bean, J. P. (1980). Dropouts and turnover: The synthesis and test of a causal model of student
attrition. Research in Higher Education, 12(2), 155-187.
Bearden, W. O., Hardesty, D. M., & Rose, R. L. (2001). Consumer self‐confidence:
refinements in conceptualization and measurement. Journal of Consumer Research,
28(1), 121-134.
Beaumont, C. (2007). Strategic marketing and management tools used to increase employee
efficiency.
Beerli Palacio, A., Díaz Meneses, G., & Pérez Pérez, P. J. (2002). The configuration of the
university image and its relationship with the satisfaction of students. Journal of
Educational Administration, 40(5), 486-505.
Berry, L. L. (1980). Services marketing is different. Business, 30(3), 24-29.
Bitner, M. J. (1992). Servicescapes: The impact of physical surroundings on customers and
employees. The Journal of Marketing, 57-71.
University of Ghana http://ugspace.ug.edu.gh

126
Boohene, R., & Agyapong, G. K. (2011). Analysis of the antecedents of customer loyalty of
telecommunication industry in Ghana: The case of vodafone (Ghana). International
Business Research, 4(1), 229-240.
Brayed, C. (2009). Some New thoughts on Conceptualizing Perceived Service Quality: a
Hierarchical approach. Journal of Marketing, 65, 34-49.
Britwum, A. O., Jonah, K., & Tay, F. D. (2001). Structural adjustment participatory review
initiative (SAPRI). Ghana country report. Tripartite National Steering Committee.
Brochado, A. (2009). Comparing alternative instruments to measure service quality in higher
education. Quality Assurance in Education, 17(2), 174-190.
Broh, R. A. (1982). Managing quality for higher profits. New York: McGraw.
Brown , T. J., Churchill, G. A., & Peter, J. P. (1993). Improving the measurement of servic
quality. Journal of Retailing, 68(1), 39-127.
Brown, R. M., & Mazzarol, T. W. (2009). The importance of institutional image to student
satisfaction and loyalty within higher education. Higher Education, 58(1), 81-95.
Brown, T. J., & Dacin, P. A. (1997). The company and the product: Corporate associations
and consumer product responses . The Journal of Marketing, 68-84.
Buttle, F. (1996). SERVQUAL: R
eview, critique, research agenda. European Journal of Marketing, 30(1), 8-32.
Carman, J. M. (1990). Consumer perceptions of service quality: an assessment of the
SERVQUAL dimensions. Journal of Retailing, 65, 33-55.
University of Ghana http://ugspace.ug.edu.gh
127
Carter, R. E. (2009). The impact of perceived service quality on MBA student satisfaction
and recommendations: Do expectations matter? Services Marketing Quarterly, 30(3),
234-248.
Cashin, W. E., & Downey, R. G. (1992). Using global student rating items for summative
evaluation. Journal of Educational Psychology, 84(4), 563-572.
Cashin, W. E., & Downey, R. G. (1999). Using global student rating items for summative
evaluation: Convergence with a second criterion. Paper presented at the annual
meeting of the American Educational Research Association, Montreal, Quebec,
Canada.
Centra, J. A., & Gaubatz, N. B. (2005). Student Perceptions of Learning and Instructional
Effectiveness in College Courses: A Validity Study of SIR II. Princeton, NJ:
Educational Testing Service.
Chopra, R., Chawla, M., & Sharma, T. (2014). Service Quality in Higher Education: A
comparative Study of Management and Education Institutions . Journal of
Management and Education Institutions, 971-1023.
Claycomb, C., Lengnick-Hall, C. A., & Inks, L. W. (2001). The Customer as a Productive
Resource: a pilot study and strategic implications. Journal of Business Strategies,
18(1), 47-69.
Cooper, D. R., & Schindler, P. S. (2008). International Edition: Business Research Methods.
Creswell, J. W. (2009). Editorial: Mapping the field of mixed methods research. Journal of
Mixed Methods Research, 3(2), 95-108.
Creswell, J. W., & Clark, V. L. (2007). Designing and conducting mixed methods research.
University of Ghana http://ugspace.ug.edu.gh

128
Cronin , J. J., & Taylor, S. A. (1992). Measuring service quality: a reexamination and
extension . Journal of Marketing, 55-68.
Crosby, M. (1974). U.S. Patent No. 3,845,391. Washington, DC: Patent and Trademark
Office.
Crosby, P. B. (1979). Quality is free: The art of making quality certain. New York: New
American Library.
Cuthbert, P. F. (1996). Managing service quality in HE: is SERVQUAL the answer? Part 1.
Managing Service Quality: An International Journal, 6(2), 11-16.
Dale, B. G. (2003). Managing Quality (4th ed.). Oxford: Blackwell Publishing.
Day, G. S. (1994). The capabilities of market-driven organizations. Journal of Marketing, 37-
52.
Deming, R. H. (1968). Characteristics of an effective management control system in an
industrial organization. Harvard University.
DeShieds, O. W., Kara, A., & Kaynak, E. (2005). Determinants of Business Students
Satisfaction and Retention in Higher Education: Applying Herzberg's Two-factor
theory. International Journal of Education Management, 19(2), 128-139.
Dick, A. S., & Basu, K. (1994). Customer loyalty: toward an integrated conceptual
framework. Journal of the Academy of Marketing Science, 22(2), 99-113.
Dinkinson, B. J. (2015). Customer loyalty: A multi-attribute approach. Research in Business
and Economics Journal , 1-17.
University of Ghana http://ugspace.ug.edu.gh

129
Douglas, J., Mc Celland, R., & Davies, J. (2008). The Development of a conceptual model of
student satisfaction with their experience in higher education. Quality Assurance in
Education, 16(1), 19-35.
Eggert, A., & Ulaga, W. (2002). Customer perceived value: a substitute for satisfaction in
business markets? Journal of Business and Industrial Marketing, 17(2/3), 107-118.
Ewing, T., & Caruana, A. (1999). An internal marketing approach to public sector
management: The marketing and human resource interface. International Journal of
Public Sector Management, 12(1), 17-29.
Fearn, H. (2008). Living the dream. Times Higher Education, 11(17), 862.
Feigenbaum, A. V. (1983). Total Quality Control. New York, NY: McGraw-Hill.
Fisk, R. P., Brown, S. W., & Bitner, M. J. (1993). Tracking the evolution of the services
marketing literature. Journal of Retailing, 69(1), 61-103.
Fitzsimmons, J. A., & Fitzsimmons, M. J. (2006). Service management: Operations, strategy,
and information technology. Irwin/McGraw-Hill.
Fornell, C., & Larcker, D. F. (1981). Evaluating structural equation models with
unobservable variables and measurement error. Journal of Marketing Research, 18,
39-50.
Fosu, F. F., & Owusu , B. K. (2015). Understanding Ghanaian Students' Perception of
Service Quality in Higher Education. European Journal of Business and
Management, 7(9).
University of Ghana http://ugspace.ug.edu.gh
130
Fosu, F. F., & Poku, K. (2014). Exploring the Factors That Influence Students’ Choice of
Higher Education in Ghana. European Journal of Business and Management, 6(28),
209-220.
Ghana Education Service. (2001). The impact of SAP on Access to and quality of tertiary
education. Accra: Assembly Press.
Ghana Statistical Service. (2014). Gross Domestic Product. Accra: Head Office Economic
Statistics Directorate. Retrieved from www. statsghana.gov.gh
Gibney, E. (2013). Adifferent world. The Time higher Education.
Giese, J. L., & Cote, J. A. (2001). Defining customer satisfaction. Academy of Marketing
Science Review, 1, 1–34.
Gilmore, H. L. (1974). Product conformance cost. Quality Progress, 7(5), 16-19.
Grönroos, C. (1982). An applied service marketing theory. European journal of marketing,
16(7), 30-41.
Grönroos, C. (1984). A service quality model and its marketing implications. European
Journal of Marketing, 18(4), 36-44.
Grönroos, C. (1991). Scandinavian management and the Nordic School of Services-
contributions to service management and quality. International Journal of Service
Industry Management, 2(3), 17-26.
Grönroos, C. (2000). Creating a relationship dialogue: communication, interaction and value.
The Marketing Review, 1(1), 5-14.
Grönroos, C. (2001). The perceived service quality concept-a mistake? Managing Service
Quality: An International Journal, 11(3), 150-152.
University of Ghana http://ugspace.ug.edu.gh

131
Grönroos, C. (2004). The relationship marketing process: communication, interaction,
dialogue, value. Journal of business & industrial marketing, 19(2), 99-113.
Gronroos, C. (2011). Value co-creation in service logic: A critical analysis. Marketing
Theory, 11(3), 279-301.
Gross, I. (1997). Evolution in Customer Value: the gross perspective in customer value:
moving forward-Back to Basics. ISBM Report No 13.
Gummesson, E. (1993). Quality management in service organizations: an interpretation of
the service quality phenomenon and a synthesis of international research. ISQA.
Haddad , D. W. (2003). Tertiary Education Today: Global Trends, Global Agendas, Global
Constraints Knowledge Enterprise, Inc. (USA). International Consultation for
Theological Educators . London: High Wycombe.
Hair, J. F., Wolfinbarger, M. F., Ortinau, D. J., & Bush, R. P. (2008). Essentials of marketing
research. McGraw-Hill/Higher Education.
Hair, J. F., Anderson, R. E., Tatham, R. L., & William, C. (1998). Multivariate data analysis,
5, . "Black.1998", 87-135.
Hair, J. F., Black, W. C., Babin, B. J., Anderson, R. E., & Tatham, R. L. (2006). Multivariate
data analysis (Vol. 6). Upper Saddle River, NJ: Pearson Prentice Hall.
Hanaysha, J. R., Abdullah, H. H., & Warokka, A. (2011). Service Quality And Students at
Higher Learning Institutions: The Competing Dimensions of Malaysian Universities
Competitiveness. Journal of Southeast Asian Research, 1-10.
University of Ghana http://ugspace.ug.edu.gh

132
Hasan, H. F., Ilias, A., Rahman, R. A., & Razak, M. Z. (2009). Service quality and student
satisfaction: A case study at private higher education institutions. International
Business Research, 1(3), 163.
Helgesen, O., & Nesset, E. (2007). What accounts for students' loyalty? Some field study
evidence. International Journal of Educational Management, 21(2), 126-143.
Hemsley-Brown, J., & Oplatka, I. (2006). Universities in a competitive global marketplace: A
systematic review of the literature on higher education marketing. International
Journal of Public Sector Management, 19(4), 316-338.
Hennig-Thurau, T., Langer, M. F., & Hansen, U. (2001). Modeling and Managing Student
Loyalty An Approach Based on the Concept of Relationship Quality. Journal of
service research, 3(4 ), 331-344.
Hill, F. M. (1995). Managing service quality in higher education: the role of the student as
primary consumer. Quality assurance in Education, 3(3), 10-21.
Hinson, R. (2006). Marketing of Services: A Managerial Perspective. Accra: Sedco Press.
Hinson, R. E. (2012). Service Marketing Excellence: With a twist of Corporate Social
Responsibility. Accra: Sedco Publishing Limited.
Hinson, R., & Otieku, J. (2005). Service quality on ghana's first executive MBA programme:
some exploratory insights. IFE PsychologIA, 13(2), 114-137.
Hinson, R., Mensah, R., & Mahmoud, M. A. (2006). Determinants of Ghanaian bank service
quality in a universal banking dispensation. Banks and Bank Systems, 1(2), 69-81.
Hirvonen, T. (2007). Studying in an international degree programme from expectation to
reality.
University of Ghana http://ugspace.ug.edu.gh

133
Huysamen, G. K. (1994). Methodology for the social and behavioural sciences. Southern
Book Publishers.
Ibrahim, M. Z., Rahman, M. N., & Yasin, R. M. (2014). Determining Factors of Students’
Satisfaction with Malaysian Skills Training Institutes . International Education
Studies, 7(6), 9-24. Retrieved from http://dx.doi.org/10.5539/ies.v7n6p9
Ilias, A., Hasan, H. F., Rahman, R. A., & Yasoa, M. R. (2008). Student Satisfaction and
Service Quality: Any Differences in Demographic Factors? International Business
Research, 1(4), 131-143.
Jaraiedi, M., & Ritz, D. (1994). Total quality management applied to engineering education.
Quality Assurance in Education, 2(1), 32-40.
Joseph, M., & Joseph, B. (1997). Service Quality in Education: a student perspective. Quality
Assurance in Education, 5(1), 15-21.
Juran, J. M. (1988). Juran on Planning for Quality. Juran Institute Inc.
Kahn, B. E., Kalwani, M. U., & Morrison, D. G. (1986). Measuring variety-seeking and
reinforcement behaviors using panel data . Journal of Marketing Research, 89-100.
Kang, G. D., & James, J. (2004). Service quality dimensions: an examination of Grönroos's
service quality model. Managing Service Quality: An International Journal, 14(4),
266-277.
Kara, A., & DeShields, O. W. (2004). Business student satisfaction, intention and retention in
higher education: An empirical investigation. Marketing Educator Quarterly, 3(1), 1-
25.
University of Ghana http://ugspace.ug.edu.gh

134
Karatepe, O. M. (2011). Service Quality, Customer Satisfaction and Loyalty: The Moderating
Role of Gender. Journal of Business Economics and Management , 284.
Kerlin, C. (2000). Measuring student satisfaction with the service processes of selected
student educational support services at Everett Community College.
Kim, Y. E., & Lee, J. W. (2010). Relationship between corporate image and customer loyalty
in mobile communications service markets. African Journal of Business Management,
4(18), 4035.
Kotler, P., & Armstrong, G. (2010). Principles of Marketing. Pearson education.
Kotler, P., & Fox, K. (1995). Strategic Marketing for Educational Institutions (2 ed.). New
Jersey: Prentice Hall.
Kotler, P., & Keller, K. L. (2006). Administração de marketing.
Kotler, P., Asplund, C., Rein, I., & Heider, D. (1999). Marketing places Europe: Attracting
investments, industries, residents and visitors to European cities, communities,
regions and nations. Financial Times Prentice-Hall: Harlow.
Krejcie, R. V., & Morgan, D. W. (1970). Table for determining sample size from a given
population. Educational and Psychological Measurement, 30, 607-610.
Kuada, J., & Hinson, R. E. (2012). Corporate social responsibility (CSR) practices of foreign
and local companies in Ghana. Thunderbird International Business Review, 521-536.
Kumar, N. (1996). The power of trust in manufacturer-retailer relationships. Harvard
Business Review, 74(6), 92.
Kunanusorn, A., & Puttawong, D. (2015). The mediating effect of satisfaction on student
loyalty to higher education institution. European Scientific Journal, 25-52.
University of Ghana http://ugspace.ug.edu.gh

135
Kuo, Y. K., & Ye, K. D. (2009). The causal relationship between service quality, corporate
image and adults’ learning satisfaction and loyalty: A study of professional training
programmes in a Taiwanese vocational institute. Total Quality Management, 20(7),
749-762. Retrieved from http://dx.doi.org/10.1080/14783360903037085
Kwan, P. Y., & Ng, P. W. (1999). Quality indicators in higher education: Comparing Hong
Kong and China’s students. Managerial Auditing Journal, 14, 20-27.
Lawson, S. B. (1992). Why restructure? An international survey of the roots of reform.
Journal of Education Policy, 7, 54-139.
Lee, H. S. (2013). Major moderators influencing the relationships of service quality,
customer satisfaction and customer loyalty. Asian Social Science, 9(2), 1.
Leffler, K. B. (1982). Ambiguous changes in product quality. The American Economic
Review, 72(5), 956-967.
Lehtinen, U., & Lehtinen, J. R. (1982). Service quality: a study of quality dimensions. Service
Management Institute.
Lehtinen, U., & Lehtinen, J. R. (1991). Two approaches to service quality dimensions.
Service Industries Journal, 11(3), 287-303.
Letcher, D. W., & Neves, J. S. (2010). Determinant of undergraduate business student
satisfaction . Research in Higher Education Journal, 1-26.
Lewis, B. R., & Mitchell, V. W. (1990). Defining and measuring the quality of customer
service. Marketing Intelligence & Planning, 8(6), 11-17.
Lewis, B. R., & Smith, A. M. (1989). Customer Care in the Service Sector: The Customer' s
Perspective. Manchester: FSRC, Manchester School of Management.
University of Ghana http://ugspace.ug.edu.gh

136
Lewis, R. C., & Booms, B. (1983). The marketing aspects of service quality . American
Marketing Association, 99-104.
Li, W. M. (2005). A comparative study between UK and USA: The student satisfaction in
higher education and its influential factors . Journal of Marketing Management, 21,
859-878. Retrieved from http://dx.doi.org/10.1362/026725705774538471
Liljander, V., & Strandvik, T. (1995). The nature of customer relationships in services.
Advances in Services Marketing and Management, 4(141), 67.
Lindsay, P. H., & Norman , D. A. (1977). Human information processing: An introduction to
psychology.
Lo, C. C. (2010). How student satisfaction factors affect perceived learning. Journal of the
Scholarship of Teaching and Learning, 10(1), 47-54.
Lovelock, C. H., & Wirtz, J. (2007). Services Marketing (5 ed.). New Jersey: Prentice-Hall.
Maddern , H., Maull , R., Smart , A., & Barker, P. (2007). Customer satisfaction and service
quality in UK financial services. International Journal of Operations and Production
Management, 27(9), 999-1019.
Malhotra, N. K., & Dash, S. (2011). Marketing Research An Applied Orientation. Delhi:
Pearson Prentice Hall.
Malhotra, N., & Birks , F. D. (2006). Marketing Research: An appled Approach. London:
Prentice-Hall.
Marzo-Navarro, M., Pedraja-Iglesias, M., & Rivera-Torres, P. (2005). A new management
element for universities: satisfaction with the offered courses. International Journal of
Educational Management, 19(6), 505-526.
University of Ghana http://ugspace.ug.edu.gh

137
Materu, P. N. (2007). Higher education quality assurance in Sub-Saharan Africa: status,
challenges, opportunities and promising practices (No. 124). World Bank
Publications.
Mavondo, F., & Zaman, M. (2000). Student satisfaction with a tertiary institution and
recommending it to prospective students. Retrieved January 22, 2016, from http. In
anzmac. org/conference/2000/CDsite/papers/m/Mavondo1.PDF.
Memon, M. A., Salleh, R., Baharom , M. N., & Harun , H. (2014). Factors Influencing the
Satisfaction of International Postgraduate Students in the Malaysian Context—A
Literature Review and A Proposed Model. International Education Studies, 7(11), 76-
80.
Mohamad, M. (2009). Building corporate image and securing student loyalty in Malaysian
higher learning industry. The Journal of International Management Studies, 4(30), 1.
Monroe, K. B. (1990). Pricing: Making Profitable Decisions ( 2nd ed.). New York, NY:
McGraw-Hill Book Company.
Moorman, C., Deshpande, R., & Zaltman, G. (1993). Factors affecting trust in market
research relationships . Journal of Marketing, 81-101.
Mosavi, M., & Ghaedi, J. (2011). A survey on the relationship between perceived value and
customer advocacy behaviour. International Conference on Innovation Management
and Science. 14. Singapore: IACST Press.
Munteanu, C., Ceobanu, C., Bobâlca, C., & Anton, O. (2010). An analysis of customer
satisfaction in a higher education context. International Journal of Public Sector
Management, 23(2), 124-140.
University of Ghana http://ugspace.ug.edu.gh

138
Nadiri, H., Kandampully, J., & Hussain, K. (2009). Students' perceptions of service quality in
higher education. Total Quality Management & Business Excellence, 20(5), 523-535.
Nationa Accreditation Board. (2015, April 15). Registered private and public higher
education institutions in Ghana as at 31st December 2015. Retrieved from National
Accreditation Board Web site: http://www.nationalaccreditationboard.com
Neuman, M. G. (2007). Immune dysfunction in inflammatory bowel disease. Translational
Research, 149(4), 173-186.
Newman, K., Cowling, A., & Leigh, S. (1998). Case Study: Services quality, business
process re-enginering, and human resources; a case in point. International Journal of
Bank Marketing, 16(6), 42-225.
Nimako, S. G., Azumah, F. K., Donkor, F., & Veronica, A. B. (2010). Overall customer
satisfaction in Ghana’s mobile telecommunication networks: Implications for
management and policy. ATDF JOURNAL, 6(3/4).
Nukpezah, D., & Nyumuyo, C. (2009). What Drives Customer Loyalty and Profitability?
Analysis of Perspectives from Retail Customers in Ghana's Banking Industry.
Nunnally, J. C. (1978). Psychometric Theory. New York, NY: McGraw-Hill.
Oldfield, B. M., & Baron, S. (2000). Student perceptions of service quality in a UK
University Business and Management Faculty. Quality Assurance in Education, 8(2),
85-95.
Oliver , R. L. (1999). Whence consumer loyalty? The Journal of Marketing, 63, 33-44.
Oliver, C. (1997). Sustainable competitive advantage: Combining institutional and resource-
based views. Strategic Management Journal, 18(9), 697-713.
University of Ghana http://ugspace.ug.edu.gh

139
Oliver, R. L. (1981). Measurement and evaluation of satisfaction processes in retail settings.
Journal of Retailing.
Pallant, J. (2011). SPSS Survival Manual: A step by step guide to data analysis using SPSS.
Australia.
Palmer, R. W. (2001). Guidelines for financing & catchment managment agencies in South
Africa. WRC Report No 1044/1/01.
Parasuraman, A. (2000). Technology Readiness Index (TRI) a multiple-item scale to measure
readiness to embrace new technologies. Journal of Service Research, 2(4), 307-320.
Parasuraman, A., Berry, L. L., & Zeithaml, V. A. (1991). Refinement and reassessment of the
SERVQUAL scale. Journal of Retailing, 67(4), 420.
Parasuraman, A., & Grewal , D. (2000). The impact of technology on the quality-value-
loyalty chain: a research agenda. Journal of the Academy of Marketing Science, 28
(1), 168-174.
Parasuraman, A., Zeithaml, V. A., & Berry, L. L. (1985). A conceptual model of service
quality and its implications for future research . Journal of Marketing, 41-50.
Parasuraman, A., Zeithaml, V. A., & Berry, L. L. (1988). SERVQUAL: a multi-item scale for
measuring consumer perceptions of the service quality. Journal of Retailing, 64(1),
12-40.
Parasuraman, A., Zeithaml, V. A., & Berry, L. L. (1994). Reassessment of expectations as a
comparison standard in measuring service quality: implications for further research.
the Journal of Marketing, 111-124.
University of Ghana http://ugspace.ug.edu.gh
140
Pascarella, E. T., & Terenzini, P. T. (2005). How college affects students. San Francisco, CA:
Jossey-Bass.
Peters , T., Waterman , J., & Robert, H. (1982). In search of excellence-lessons from
American best run companies. London: Harper collins publishers.
Rasli, A., Shekarchizadeh, A., & Iqbal, M. J. (2012). Perception of service quality in higher
education: Perspective of Iranian students in Malaysian universities. International
Journal of Academic Research in Management (IJARM), 1(1).
Ravald, A., & Grönroos, C. (1996). The value concept and relationship marketing. European
Journal of Marketing, 30(2), 19-30.
Regassa, T., Tolemariam, T., Ferede, B., Hunde, A. B., & Lemma, A. (2013). Quality of
education: the case of Jimma University. Education, 3(5), 267-278.
Reichheld, F. P., & Sasser, W. E. (1990). Zero defeciions: Quoliiy comes to services.
Harvard Business Review, 68(5), 105-111.
Resister , J. R. (1995). Buyer behavior form marketing managers perspectives: the
measurement of service quality. Journal of Retailing, 68(1), 39-127.
Roberts, G. H. (2005). Auchan's entry into Russia: prospects and research implications.
International Journal of Retail & Distribution Management, 33(1), 49-68.
Robson, C. (2000). Real worl Resarch Methods: The Research for Social Scientists and
Practitioner-Research (2nd ed.). New York: Willey Publishing Company.
Rojas-Mendez, J., Vasquez-Parraga, A. Z., Kara, & Cerda- Urrutia, A. ( 2009). Determinants
of Student Loyalty in Higher Education: A Tested Relationship Approach in Latin
America. Lating America Business Review, 21-39
University of Ghana http://ugspace.ug.edu.gh

141
Rowley, J., & Dawes , J. (1999). Customer loyalty-a recent concept for libraries? Library
Management, 20(6), 345-351.
Ryan, J., & Harrison, P. (1995). The relationship between individual instructional
characteristics and the overall assessment of teaching effectiveness across different
instructional contexts. Research in Higher Education, 36(5), 577-594.
Saad-Andaleeb, S. (1994). Hospital advertising: the influence of perceptual and demographic
factors on consumer dispositions. Journal of Services Marketing. Journal of Service
marketing, 8(1), 48-59.
Sahney, S. (2012). Designing quality for the higher educational system: A case of selected
engineering and management Institutions in India. Asian Journal on Quality, 13(2),
116-137.
Sahney, S., Banwet, D. K., & Karunes, S. (2004). Conceptualizing Total Quality
Management in Higher Education. The TQM Magazine, 16(2), 145-159.
Saunders, M., Lewis, P., & Thornhill, A. (2007). Research methods for business students.
London: Pearson Education.
Schertzer, C. B., & Schertzer, S. M. (2004). Student satisfaction and retention: A conceptual
model. Journal of Marketing for Higher Education, 14(1), 79-91.
Sekaran, U. (2003). Research Methods for Business A Skill Building Approach. Singapore:
John Wiley & Sons, Inc.
Seok-Lee, L. (2013). Major Moderators Influencing the relationships of service quality,
customer satisfaction and customer loyalty. Asian Social Science, 9(2).
University of Ghana http://ugspace.ug.edu.gh

142
Shank, M. D., Walker, M., & Hayes, T. (1995). Understanding professional service
expectations: Do you know what our students expect in a quality education? Journal
of Professional Service Marketing, 31(1), 71-89.
Sickler, S. L. (2013). Undergraduate Student Perceptions of Service Quality as a Predictor of
Student Retention in the First Two Years. Doctoral dissertation. Bowling Green State
University.
Sickler, S. L. (2013). Undergraduate Student Perceptions of Service Quality as a Predictor of
Student Retention in the First Two Years (Doctoral dissertation, Bowling Green State
University).
Singh, J., & Sirdeshmukh, D. (2000). Agency and Trust Mechanisms in Consumer
Satisfaction and Loyalty Judgments. Journal of Academy of Marketing Science, 28,
150-167.
Sohail, M. S., & Shaikh, N. M. (2004). Quest for excellence in business education: a study of
student impressions of service quality. The International Journal of Educational
Management, 18(1), 58-65.
Solomon, M. R., Surpremant, C., Czepiel, J. A., & Gutman, E. G. (1985). A role of theory
perspective on dyadic interactions: the service encounter. Journal of Marketing, 49,
99-111.
Stromgren, O. (2007). Analyzing service quality in a tertiary institution. Journal of
Educational Administration, 34(140), 72-82.
Strydom, J. W., Jooste, C. J., & Cant, M. C. (2000). Marketing Management (4th ed.). Cape
Town: Juta.
University of Ghana http://ugspace.ug.edu.gh

143
Sultan, P., & Wong, H. (2010). Performance-based service quality model: An empirical study
on Japanese universities. Quality Assurance in Education, 18(2), 126-143.
Telford, R., & Masson, R. (2005). The congruence of quality values in higher education.
Quality Assurance in Education, 13(2), 107-119.
Thomas, E. J. (1978). Research and service in singlecase experimentation: conflicts and
choices. In Social Work Research and Abstracts, 14(4), 20-31.
Thomas, S. (2011). What drives student loyalty in university: An empirical model for India.
International Business Research, 4 (2), 183-192.
Tinto, V. (1975). Dropout from higher education: A theoretical synthesis of recent research.
Review of Educational Research, 45, 89-125.
Trotter, E., & Roberts, C. A. (2006). Enhancing the early student experience. Higher
Education Research and Development, 25(4), 371-386.
Tuchman, B. W. (1980). The decline of quality. New York Times Magazine, 2(104), 38-41.
Tutu-Boahene , B., & Akwensivie , A. M. (2014). Service experience perspectives in
Ghanaian private universities. British Journal of Marketing Studies, 2( 3), 1-13.
UNCTAD, R. (2014). United Nations Conference on Trade and Development. Review of
Maritime Transport.
Utuka, G. (2010). The emergence of Private Higher education and the issue of quality
assurance. Retrieved from www.devnetoorg.nz
Voss, C. (2004). Are You Being Served? Brand Strategy, 30-31.
University of Ghana http://ugspace.ug.edu.gh

144
Walker, J. L. (1995). Service encounter satisfaction: conceptualized. Journal of Services
Marketing, 9(1), 5-14.
Webb, J. R. (2000). Understanding and Designing Marketing Research. London :
International Thompson Business Press.
Wiers-Jenssen, J., Stensaker, B., & Grogaard, J. (2002). Student satisfaction: towards an
empirical deconstruction of the concept. Quality in Higher Education, 8(2), 183–195.
Wilson, D. T. (2000). Deep relationships: The case of the vanishing salesperson.
Pennsylvania: The pennsylvania State University.
Winsiewski, M. (2001). Using SERVQUAL to access customer satisfaction with public
sector services. Managing Service Quality, 2(6), 380-388.
Yamane, T. (1967). Statistics: an introductory analysis. New York: Harper and Row.
Yeo, R. K. (2008). Brewing service quality in higher education: Characteristics of ingredients
that make up the recipe. Quality Assurance in Education, 16(3), 266-286.
Zeithaml, V. A. (1998). Customer Perception of Price, Quality and Value: A Means-end
Model and Synthesis of Evidence. Journal of Marketing, 52(3), 2-22.
Zeithaml, V. A. (2000). Service quality, profitability, and the economic worth of customers:
what we know and what we need to learn. Journal of the Academy of Marketing
Science, 28(1), 67-85.
Zeithaml, V. A., & Bitner , M. S. (2011). Serving marketing: integrating consumer focus
across the firm. New York: Mc Graw.
University of Ghana http://ugspace.ug.edu.gh

145
Zeithaml, V. A., & Bitner, M. J. (2000). Services marketing, integrating customer focus
across the firm (4th ed.). New York: Mc Graw-Hill.
Zeithaml, V. A., & Bitner, M. J. (2003). Services Marketing: Integrating Customer Focus
Across the Firm (4th ed.). New York: McGraw-Hill.
Zeithaml, V. A., Bitner, M. J., & Gremler, D. D. (1996). Services Marketing . New York:
McGraw Hill.
Zeithaml, V. A., Bolton, R. N., Deighton, J., Keiningham, T. L., Lemon, K. N., & Petersen, J.
A. (2006). Forward-Looking Focus Can Firms Have Adaptive Foresight? Journal of
Service Research, 9(2), 168-183.
Zeithaml, V., & Bitner, M. (2002). Services Marketing (3rd ed.). New York: McGraw Hill.
Zepke, N., & Leach, L. (2007). Improving student outcomes in higher education: New
Zealand teachers’ view on teaching students from diverse backgrounds . Teaching in
Higher Education, 12(5), 6. Retrieved from
http://dx.doi.org/10.1080/13562510701596190
Zhao, X. (2012). A Review on Service Quality and Student Satisfaction of Higher Education.
Soft Computing in Information Communication Technology, 115-122. Retrieved from
http://dx.doi.org/10.1007/978-3-642-29148-7_17
Zikmund, G. W., & Babin, B. J. (2010). Essentials of Marketing Research. Mason,OH: South
WesternCengage Learning.
University of Ghana http://ugspace.ug.edu.gh

146
APPENDIX
Dear respondent,
The researcher is an MPhil candidate with the department of Marketing and Entrepreneurship
at the University of Ghana Business School, researching on the topic “Students` perception
of service quality in higher educational Institutions in Ghana”. The researcher will be most
grateful if you could give your views by answering these questions below. The information
obtain will be used for purely academic purpose, specifically in partial fulfilment for the award
of MPhil degree in marketing and will be treated with utmost confidentiality
Thank you.
Personal data
1. Please indicate your gender a) Male [ ] b) Female [ ]
2. Age of the respondents (in years) a) Below 20 years [ ] b 20-30years [ ] c) 30 and above [
]
3. Income level of the respondent (monthly) a) below 1000 [ ] b) 1001-2000 [ ] c) 2001-3000
[ ] d) 3001-4000[ ] e) 40001- and above [ ]
University of Ghana http://ugspace.ug.edu.gh

147
4. What programme are you enrolled in a) Diploma [ ] b) Undergraduate [ ] c) Masters (MBA/
EMBA/ MPHIL [ ] d) PHD [ ]
5. Occupational status of the respondents a) Business/ self- employed [ ] b) Public servant [ ]
c) Private Sector [ ] d) Notworking/Unemployed [ ]
e) Others…………………………………………
6. Please indicate whether you are a resident or non-resident
a) Resident [ ] b) Non-resident [ ]
SECTION B: SERVICE QUALITY (SERVQUAL)
Please tick or circle appropriately, how each of the following statements represents your
opinion. Where 1= strongly disagree, 2= Disagree, 3= Neutral, 4= Agree and 5= Strongly
Agree.
University of Ghana http://ugspace.ug.edu.gh

148
TANGIBLES 1 2 3 4 5
1 The physical facilities and lay out of classrooms are visually appealing (i.e.
building and surroundings)
2 Lighting in classrooms are adequate enough for studies
3 Appearance of building and grounds are quite appealing
4 Overall cleanliness is encouraging
5 The classrooms and study rooms are comfortable for students
6 Decoration and atmosphere is conducive for study
7 Appearance of academic and non-academics staffs are presentable
8 Adequate parking space is available
9 Adequate computers available in the lab for students
10 The computers are to Up-to-date
11 There is always access to the Internet facilities
12 The software use in computers are up to date
13 Course materials are available and accessible at the library
14 Materials associated with course delivery (such as handbooks, notices, notice
boards, signs) look good and attractive
ASSURANCE
1 The lecturers have high academic credentials
2 The lecturers are innovative and agents of change
3 The lecturers are research efficient/productive
University of Ghana http://ugspace.ug.edu.gh

149
4 Adequate security measures are put in place at the university.
5 The University’s staffs have adequate knowledge on rules and procedures
6 The administrative staffs are friendly and courteous.
7 The lecturers are friendly and courteous
RELIABILITY
1 Registration is timely and error-free
2 This university keeps its records accurately
3 The general reliability of lecturers ie. keeps time/don’t cancel classes
4 The administrative staff show sincere interest in solving student’s problem
5 This university provides its services at a time it promises to do so.
6 The Lecturers sincere interest in solving student’s problem
7 The University runs excellent quality programs
RESPONSIVENESS
University of Ghana http://ugspace.ug.edu.gh

150
1 Personnel are always availability to assist you
2 Lecturers show their capacity to solve problems when they arise
3 I seldom get the “run-around” when seeking information on this
University
4 Channels for expressing student complaints are readily available
5 Queries are dealt with efficiently and promptly
EMPATHY
1 The administrative staffs have students’ best interest at heart
2 Access to computer facilities is convenient to students
3 Access to study rooms is convenient to students
4 Staff are willing to give students individual attention
5 The lecturers are sympathetic and supportive to the needs of
students.
6 The University staff are fair and unbiased in their treatment of
individual’s students.
REPUTATION
1 The University has a professional image
2 The academic program run by the University is reputable.
3 The University `s graduates are easily employable
SECTION C STUDENTS` SATISFACTION
1 I am satisfied with my decision to attend this University
Please tick or circle appropriately, how each of the following statements represents your opinion.
Where 1= Strongly disagree, 2= Disagree, 3= Neutral, 4= Agree and 5= Strongly Agree.
University of Ghana http://ugspace.ug.edu.gh

151
2 My choice to enroll in this University is a wise one
3 I am happy on my decision to enroll in this University
4 I did the right decision when I decided to enroll in this
University
5 I am happy that I enrolled in this University
SECTION D STUDENTS LOYALTY
1 I will recommend University of Ghana to friends and relatives
2 I will consider University of Ghana, if I have the opportunity to
further my education
3 I will not look for alternative institution, if I need academics services
4 I will communicate positively about the university to friends and
relatives
5 I will not communicate negatively about the services provides by the
university.
6 If I have a choice to do it all over again, I still will enroll in this
University
University of Ghana http://ugspace.ug.edu.gh


![[1]Customers Perception of the Organizational Efficiency of the Ghana Immigration Service](https://img.pdfslide.us/doc/110x75/577d25531a28ab4e1e9e8763/1customers-perception-of-the-organizational-efficiency-of-the-ghana-immigration.jpg)