Embed Size (px)
Citation preview

University of Dundee
Measuring the violence prevention climate
Hallett, Nutmeg; Huber, Jorg W.; Sixsmith, Judith; Dickens, Geoffrey L.
Published in:International Journal of Nursing Studies
DOI:10.1016/j.ijnurstu.2018.09.002
Publication date:2018
Licence:CC BY-NC-ND
Document VersionPeer reviewed version
Link to publication in Discovery Research Portal
Citation for published version (APA):Hallett, N., Huber, J. W., Sixsmith, J., & Dickens, G. L. (2018). Measuring the violence prevention climate:Development and evaluation of the VPC-14. International Journal of Nursing Studies, 88, 97-103.https://doi.org/10.1016/j.ijnurstu.2018.09.002
General rightsCopyright and moral rights for the publications made accessible in Discovery Research Portal are retained by the authors and/or othercopyright owners and it is a condition of accessing publications that users recognise and abide by the legal requirements associated withthese rights.
• Users may download and print one copy of any publication from Discovery Research Portal for the purpose of private study or research. • You may not further distribute the material or use it for any profit-making activity or commercial gain. • You may freely distribute the URL identifying the publication in the public portal.
Take down policyIf you believe that this document breaches copyright please contact us providing details, and we will remove access to the work immediatelyand investigate your claim.
Download date: 22. Dec. 2021

Measuring the violence prevention climate:
Development and evaluation of the VPC-14
Authors: Nutmeg Halletta,b,1, Jörg Huberc, Judith Sixsmithb,2, Geoffrey L. Dickensa,b,3
Affiliations:
aSt Andrew’s Healthcare, Cliftonville Road, Northampton, NN1 5DG, UK
bUniversity of Northampton, Park Campus, Boughton Green Road, Northampton, NN2 7AL, UK
cUniversity of Brighton, Falmer, BN1 9PH, UK
Corresponding author: Nutmeg Hallett, School of Nursing, College of Medical and Dental
Sciences, Edgbaston, Birmingham, B15 2TT. Telephone: +44 (0)121 4146826. Email: {
HYPERLINK "mailto:[email protected]" } Twitter: @dr_nutmeg
Present addresses:
1University of Birmingham, Edgbaston, Birmingham, B15 2TT, UK
2University of Dundee, Dundee, DD1 4HN
3Western Sydney University, Penrith, NSW 2751, Australia
© 2018. This manuscript version is made available under the CC-BY-NC-ND 4.0 license http://creativecommons.org/licenses/by-nc-nd/4.0/
Measuring the violence prevention climate: Development and evaluation of the VPC-14
1. BACKGROUND
1.1. Introduction
Violence and aggression are common in inpatient mental health settings (Iozzino et al., 2015) and
cause problems for staff, patients and organisations (Bowers et al., 2011). Surveys suggest that 30%
to 54% of health care staff have experienced violence in the past year (Campbell et al., 2011, Hatch-
Maillette et al., 2007), and most staff working in mental health services expect to be assaulted at some
time in their career (Bilgin and Buzlu, 2006). The practices that staff sometimes use to prevent violence
by restricting patient autonomy (e.g. restraint, seclusion and forced medication) cause physical and
psychological harm to staff and patients (Bonner et al., 2002, Fish and Hatton, 2017, Renwick et al.,
2016) and can even result in patient death (Duxbury et al., 2011). In the UK, violence towards NHS
staff is estimated to cost at least £69 million a year (National Institute for Health and Care Excellence,
2015a), and in mental health settings the estimated annual cost of verbal abuse and physical assaults
is £20.5 million per year (Flood et al., 2008, National Institute for Health and Care Excellence,
2015b).The prevention of violence and aggression is therefore a vital part of the role of healthcare
staff in these settings.
From a public health perspective, primary violence prevention refers to actions taken before violence
has occurred, aimed at stopping its occurrence; secondary prevention comprises the actions taken to
prevent imminent violence; while tertiary prevention encompasses the interventions that take place
whilst violence is occurring and in its aftermath to minimise harm (Paterson et al., 2004). As such,
primary prevention is encapsulated in activities and behaviours that are somewhat distal antecedents.
There is a clear parallel, therefore, between primary violence prevention and the notion of the 'ward
climate' that has been proposed as an important contextual determinant of outcomes.

The World Health Organisation (1953 p.17) stated that ‘the single most important factor in the efficacy
of treatment given in a mental hospital appears ... to be an intangible element which can only be
described as its atmosphere’. Subsequently, the notion of social climate, the shared perceptions that
people have about a particular environment (Bennett, 2010), to describe similar phenomena across
social contexts including healthcare, education, and the wider workplace has become commonplace.
In healthcare, the Ward Atmosphere Scale (WAS; Moos, 1974) has been the most widely used
instrument but it lacks robust psychometric properties (Røssberg and Friis, 2003). As a result of the
perceived shortcomings of the WAS,Schalast et al. (2008) developed the Essen Climate Evaluation
Scale (EssenCES) to measure the ward atmosphere specifically in a forensic mental health setting.
1.2. Study rationale
The concept of a distinct ‘violence prevention climate’ is not entirely novel; Spector et al. (2007), who
examined safety in a range of workplace settings including hospitals, describe it from an organisational
perspective as employees' perceptions of the policies, procedures and training related to violence
prevention rather than as an aspect of the social environment. Our review (Hallett et al., 2014)
identified only one scale that measured perceptions of the violence prevention climate within mental
health inpatient settings, the E13 (Björkdahl et al., 2013). However, the E13 has various shortcomings
in the development and testing of the scale, specifically that there was no expert review of the items
nor pilot testing prior to use, and no validity or reliability testing is described. The E13 was developed
to evaluate a specific training model within one setting, and therefore may have limited
generalizability away from that setting.
1.3. Study aims
The aim was to develop a reliable and valid scale to measure perceptions of the violence prevention
climate among staff and patients in mental health inpatient settings, based on four key
principles(Morello et al., 2013, Schalast et al., 2008, Streiner and Norman, 2008): i) it should be based
on available evidence on the topic e.g., violence prevention in mental health settings; ii) scale items

should refer to observable and relevant phenomena, for this scale that constitute primary and/or
secondary violence prevention behaviours; iii) it should provide robust and valid quantitative data that
can be used to make comparisons across wards and over time; and iv) it should be quick and easy to
complete by both staff and patients.
2. METHODS
2.1. Design
The study was conducted in three phases: i) scale development, ii) pilot testing, and iii) psychometric
evaluation. The first phase included qualitative semi-structured interviews and focus groups, while
subsequent phases utilised a cross-sectional survey design. The current study adhered to the methods
of assessing reliability and validity described in the COSMIN checklist (Mokkink et al., 2010) which was
designed for the evaluation of health-related patient-reported outcomes measures but are also
relevant to outcomes measures more generally.
2.2. Participants and setting
Each phase of the study was conducted at one or more of three hospitals in England run by an
independent sector not-for-profit provider of secure mental health care. Eligible participants were
patients and staff residing in/working on wards in the adult male and female mental health care
pathways (phases 1-3). The inclusion criteria for patient participants were age (≥18 years), willing and
able to give informed consent to participate in the study, currently admitted to inpatient mental
health services, and English language speakers. Patients’ clinical teams advised on whether each
individual had capacity to consent to the study, and this was monitored by the researcher during the
consenting process and data collection. For the focus groups in phase 1, patients were recruited via
the patient experience team. Staff members of the organisation’s prevention and management of
violence and aggression (PMVA) team, as well as ward-based staff, were eligible for the interviews in
phase 1; they were purposively sampled to capture the view of staff who were experienced in violence

prevention. In phases 2 and 3 eligible staff were those permanently employed in the clinical setting,
having worked on the ward for a minimum two week period, or those employed to work in the clinical
setting on a non-regular basis and having a self-expressed knowledge of the ward setting.
2.3. Ethical considerations
Ethical approval for all aspects of the study including instrument development and piloting was
obtained from Nottinghamshire NHS NRES Research Ethics Committee, (REC reference 13/EM/0221),
and the University of Northampton REC. All potential participants were provided with full information
about the study. At all stages, patient participants were required to provide written informed consent.
For study elements requiring only staff questionnaire completion, consent was assumed from
completion and return of measures.
2.4. Validating instruments
Two instruments previously used in research in mental health inpatient settings were used as part of
the scale validation process.
2.4.1.1. EssenCES (Schalast et al., 2008)
The EssenCES is a 15-item scale comprising three factors: therapeutic hold (perceptions of how
supportive the environment is to patients’ therapeutic needs), experienced safety (perceived levels of
threat from violence and aggression), and patient cohesion (the perceived presence of peer support
between patients). The EssenCes has well established psychometric properties; the factor structure
has been replicated in various settings, each factor demonstrates good internal consistency, and
construct validity has been demonstrated in tests of convergent and discriminant validity (Howells et
al., 2009, Milsom et al., 2014, Tonkin et al., 2012).The 15 scale items are framed by two additional,
unscored items (an ice breaker and a concluding item) measured on a unipolar, five-point Likert scale.
The EssenCES was designed to measure the ward climate in forensic mental health settings, but has
been used in prisons and learning disability settings (Day et al., 2012, Willets et al., 2014). Violence
prevention measures are included in the therapeutic hold and patient cohesion factors. Internal

consistency of each factor is good, as measured by Cronbach’s alpha (range 0.73 to 0.87; Schalast et
al., 2008).
2.4.1.2. Attitudes to Containment Measures Questionnaire (ACMQ; Bowers et al., 2004)
The ACMQ assesses the views on the acceptability of 11 containment methods for disturbed behaviour
(Bowers et al., 2004). The ACMQ lists each of the containment methods with a brief description and a
picture, and asks respondents to rate the acceptability of the method using a five-point Likert scale
(strongly agree to strongly disagree). Principal components analysis of the scale identified that each
method is a separate component (Dack et al., 2012).
2.5. Data collection
For phase 1, two patient focus groups were planned, one with patients from a female ward and one
with patients from a male ward. Patient consent was obtained at the start of each group. They were
not recorded at the request of patients; one researcher (NH) facilitated the groups and detailed notes
were taken by another (GD). Staff interviews were recorded, and conducted and transcribed by a
single researcher (NH). Data collection for phases two and three took place from February to October
2014. For the pilot study (phase 2), three wards in one hospital site were purposively chosen to access
staff and patients in a variety of settings, a medium secure female ward (the only female ward at this
site), and a medium secure and a low secure male ward. For the main study (phase 3) all eligible staff
and patients in mental health care pathways were invited to participate. For phases two and three a
single researcher (NH) collected all data. Staff were provided with a study questionnaire and a brief
verbal explanation of the purpose of the study. Consent was taken to be implied from return of the
completed questionnaire. The study was introduced to patients at the weekly ward meetings, and
patients identified by the clinical team as having capacity to consent to the study were invited to
participate. A consent form was completed with patient participants, then they were given the option
to complete the questionnaire with the researcher, or self-complete it. Most patients (n=77, 81%)
chose the former.Participants in the pilot study were also invited to complete the EssenCES and the

ACMQ for convergent and discriminant validity testing, and to repeat the scale 7-14 days after the first
completion to assess test-retest reliability. With regards to sample size for phase three, 300
participants is sufficient for tool development requiring exploratory factor analysis (Comrey and Lee,
1992); further, Worthington and Whittaker (2006) suggest that a sample size be set prior to data
collection. Assuming a 40-item scale, a sample size of 300 falls in the mid -range suggested by Gorsuch
(1983), of between 5 to 10 participants per item. Therefore the aim was to recruit a minimum of 300
participants for stage three.
2.6. Data analysis
A combination of classical test theory and item response theory (Rasch modelling) was used to assess
the psychometric properties of the scale. Statistical analyses were performed using SPSS version 18.0
and Winsteps 3.81.0.
2.6.1. Classical test theory
Item test-retest reliability was calculated using weighted kappa with removal of items of less than
moderate strength (<0.40) based on guidelines provided by Landis & Koch (Landis and Koch, 1977).
Descriptive statistics for socio-demographic, employment and clinical characteristics of the
participants were produced. Normality of the data were assessed using the Shapiro-Wilk test to
ascertain whether to use parametric or non-parametric tests. An exploratory factor analysis (Principal
Components Analysis; PCA) was conducted as part of the item reduction process and to evaluate the
construct validity of the scale. Internal consistency of the subscales was assessed using Cronbach’s
alpha coefficients and calculating item-item correlations. Convergent and discriminant validity was
measured against the EssenCES and the ACMQ respectively; data were collected from pilot study
participants (phase 2) and analysis undertaken once factors of the scale had been identified
(subsequent to phase 3).
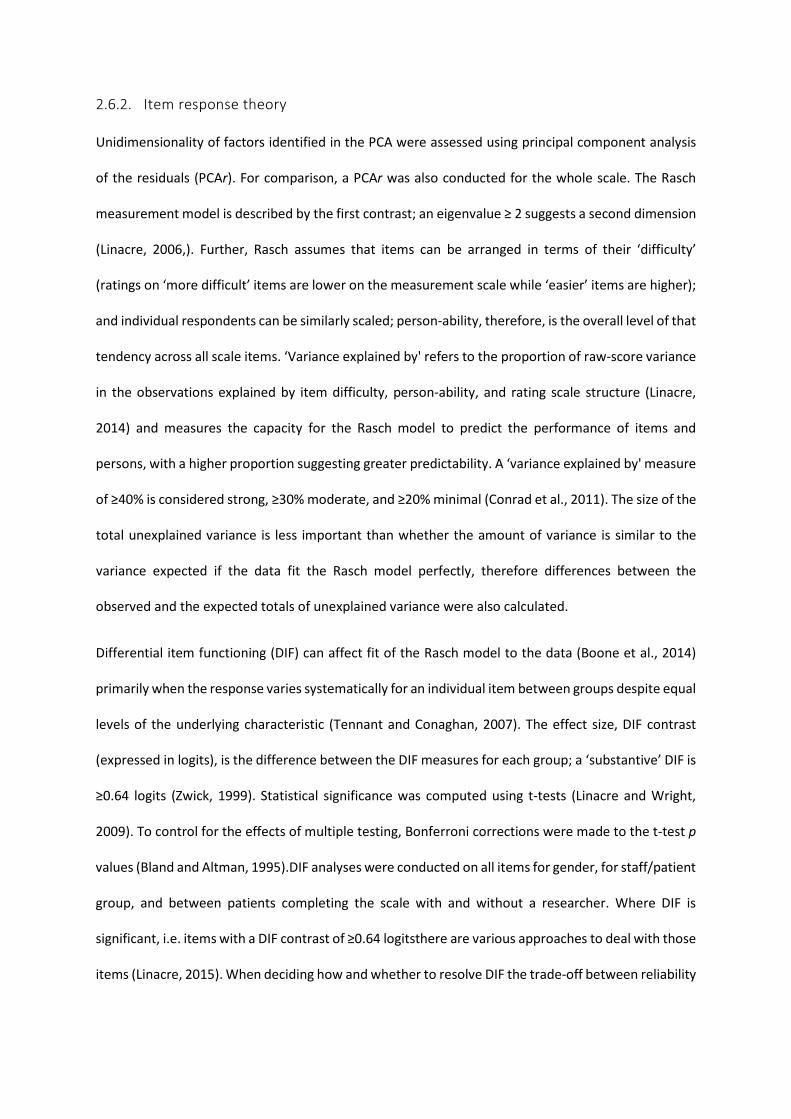
2.6.2. Item response theory
Unidimensionality of factors identified in the PCA were assessed using principal component analysis
of the residuals (PCAr). For comparison, a PCAr was also conducted for the whole scale. The Rasch
measurement model is described by the first contrast; an eigenvalue ≥ 2 suggests a second dimension
(Linacre, 2006,). Further, Rasch assumes that items can be arranged in terms of their ‘difficulty’
(ratings on ‘more difficult’ items are lower on the measurement scale while ‘easier’ items are higher);
and individual respondents can be similarly scaled; person-ability, therefore, is the overall level of that
tendency across all scale items. ‘Variance explained by' refers to the proportion of raw-score variance
in the observations explained by item difficulty, person-ability, and rating scale structure (Linacre,
2014) and measures the capacity for the Rasch model to predict the performance of items and
persons, with a higher proportion suggesting greater predictability. A ‘variance explained by' measure
of ≥40% is considered strong, ≥30% moderate, and ≥20% minimal (Conrad et al., 2011). The size of the
total unexplained variance is less important than whether the amount of variance is similar to the
variance expected if the data fit the Rasch model perfectly, therefore differences between the
observed and the expected totals of unexplained variance were also calculated.
Differential item functioning (DIF) can affect fit of the Rasch model to the data (Boone et al., 2014)
primarily when the response varies systematically for an individual item between groups despite equal
levels of the underlying characteristic (Tennant and Conaghan, 2007). The effect size, DIF contrast
(expressed in logits), is the difference between the DIF measures for each group; a ‘substantive’ DIF is
≥0.64 logits (Zwick, 1999). Statistical significance was computed using t-tests (Linacre and Wright,
2009). To control for the effects of multiple testing, Bonferroni corrections were made to the t-test p
values (Bland and Altman, 1995).DIF analyses were conducted on all items for gender, for staff/patient
group, and between patients completing the scale with and without a researcher. Where DIF is
significant, i.e. items with a DIF contrast of ≥0.64 logitsthere are various approaches to deal with those
items (Linacre, 2015). When deciding how and whether to resolve DIF the trade-off between reliability
and content validity of the measurement scale needs to be considered (Hagquist and Andrich, 2017),
therefore decisions were made on an item-by-item basis.
Rasch analysis uses point-measure correlations to investigate whether all scale items measure the
same construct. A fundamental concept in Rasch is that higher person measures lead to higher ratings
on items and vice versa (Linacre, 2012). The accuracy of this concept is reported by point-measure
correlations. All correlations should be noticeably positive (>.50).
To measure the item fit to the Rasch model, two statistics are commonly used, the unweighted mean
square, and the weighted mean square. An ideal mean square (MNSQ) would be 1.0, where the
observed variance is the same as the expected variance and mean square values should be close to
1.0. Values greater than this (underfit) indicate a lack of fit between the items and the model, and
values below 1.0 (overfit) indicate that the data predict the model too well, suggesting item
redundancy. Validity is more greatly affected by underfit than overfit. The reasonable range of mean
square statistic scores for a rating scale is 0.6–1.4 (Wright et al., 1994); items with a MNSQ >2.0 are
likely to distort or degrade the scale causing the measurement to be inaccurate, and items with a
MNSQ of 1.4 – 2.0 or <.5 are potentially unproductive for the measurement but not degrading
(Linacre, 2012).
3. RESULTS
3.1. Scale Development (phase 1)
Item development was both theory-driven, based on our systematic review of the literature on mental
health staff and patients’ views about primary and secondary prevention measures (Hallett et al.,
2014), and based on local relevant expertise. Two patient focus groups (total n=6) and four individual
staff interviews were conducted (NH/GD). Patients were current residents on one male (n=4) and one
female (n=2) medium secure ward, while staff were two members of the Prevention and Management
of Violence and Aggression (PMVA) training team, the ward manager of a medium secure female ward,

and a qualified, experienced staff nurse working on a medium secure male ward. The data were
analysed using thematic analysis, guidedby the a priori themes identified in the literature review
(Braun and Clarke, 2006). Over 100 initial items were generated; these were reduced to 54 following
review by two of the authors. Expert review, by the site research manager and two PhD students at
St. Andrew’s, and two health-related professors at the University of Northampton,, resulted in
removal of 10 items and addition of 10 new items, creating a 54-item scale for pilot testing.
3.2. Pilot testing (phase 2)
The pilot scale was completed by 58 staff and 25 patients (overall response rate = 77%). Participants
were invited to completed the scale on a second occasion 7-14 days later for test-retest reliability
purposes (staff n=36, patients n=5). Application of criteria for item acceptability resulted in retention
of 50 items. Linear weighted Kappa was calculated for the 50 remaining statements; 10 statements
had fair test-retest reliability (K .21-.40), 37 moderate (K .41-.60) and 3 substantial (K > .61). The 10
statements that showed fair agreement were removed. The final scale with ambiguous, redundant,
and non-reliable items removed comprised 40 items. Cronbach’s alpha was .87.
3.3. Psychometric evaluation (phase 3)
In total, 511 people (352 staff, 144 patients) were invited to participate and 421 completed scales
were returned (326 staff, 95 patients), giving an overall response rate of 82% (staff 93%, patients 66%).
Staff and patient characteristics are shown in Table 1.

Table { SEQ Table \* ARABIC }. Staff and patient participant characteristics
Staff n (%) Patients n (%) GENDER GENDER Male 116 (35.6) Male 67 (70.5) Female 170 (52.1) Female 28 (29.5) AGE AGE 18-24 34 (10.4) 18-24 18 (18.9) 25-34 73 (22.4) 25-34 26 (27.4) 35-44 78 (23.9) 35-44 8 (8.4) 45-54 66 (20.2) 45-54 16 (16.8) 55+ 34 (10.4) 55+ 15 (15.8) ROLE DIAGNOSIS Health care assistant 123 (37.7) Schizophrenia type 29 (30.5) Qualified nurse 50 (15.3) Personality disorder 20 (21.1) Deputy ward manager 11 (3.4) Personality disorder /
Schizophrenia type 9 (9.5)
Ward manager 4 (1.2) Other (occupational therapist, assistant psychologist)
14 (4.3) Other (inc. developmental, behavioural and mixed) 25 (26.5)
ETHNICITY White 67 (70.5)
EXPERIENCE Black 6 (6.3) <5 years 100 (30.7) Asian 5 (5.3) 5-9 years 32 (9.8) Other 2 (2.1) ≥10 years 105 (32.2) TYPE OF WARD TYPE OF WARD Locked 40 (12.3) Locked 19 (20.0) Low secure 164 (50.3) Low secure 38 (40.0) Medium secure 109 (33.4) Medium secure 38 (40.0)
3.3.1. Principal Components Analysis
The Kaiser-Meyer-Olkin Measure of Sampling Adequacy (.916) suggested that the data were
appropriate for PCA. Examination of the scree plot suggested a one-factor solution, whilst findings
from the literature review suggested three factors, therefore multiple analyses were run, extracting
one, two and three factors. To identify which solution had best fit, two quantitative criteria were
used: i) no crossloading items defined as items that loaded .32 or higher on more than one factor, and
ii) no factors with fewer than three items (Costello and Osborne, 2005). For the one-factor solution,
orthogonal (varimax) rotation was used as the factor correlation was less than .32, Factor correlations
for the two- and three-factor solutions exceeded .32, so oblique (direct oblimin) rotation was used in
these cases. For each factor solution, items with a factor loading <.50 were removed before PCA was
re-run.

Only the 1- and 2- factor solutions comprised more than three items per factor. The one-factor
solution comprised items relating to staff actions and none relating to the actions that patients might
take to prevent violence. On inspection, the two-factor solution comprised a staff actions and a patient
actions factor. The one-factor solution explained 54.1% of the total variance, slightly higher than the
total variance explained by the two-factor solution (53.3%) and so the one-factor solution was
marginally statistically stronger than the two-factor solution. However, the loss of all items relating to
patient actions in the one-factor solution means that it is conceptually weaker. For this reason, the
two-factor scale was chosen for further analysis: staff actions (11 items) and patient actions (5 items).
Factor loadings, communalities, and the variance explained by the factors are shown in { HYPERLINK
\l "Ref498085142" }.

Table 2. Factor loadings with variance
Item Loading Communalities
Factor 1. Staff actions (40.2% variance)
The staff here are experienced in preventing aggression .83 .68
Staff here know how to talk to patients .81 .67
Staff on this ward show the patients respect .80 .65
Negotiation with aggressive patients is used effectively by staff
.75 .53
The staff have a positive attitude towards patients .75 .62
Staff know when to intervene when a patient is becoming aggressive
.74 .52
Staff on the ward are good at talking down aggressive patients
.73 .50
Staff are good at listening to patients .72 .54
Staff here have a good knowledge of the patients .71 .53
There is usually a member of staff around for patients to talk to
.65 .47
Staff are sometimes rude to patients .60 .40
Factor 2. Patient actions (13.1% variance) Patients bully other patients .72 .52
Patients are nice to each other .71 .57
Patients on this ward show the staff respect .69 .50
Patients on the ward are good at controlling their inner feelings .66 .43
Patients sometimes annoy other patients on purpose .66 .42
3.3.2. Rasch analysis
PCAr of the 16-item scale resulting from principal components analysis revealed that the eigenvalue
of the first contrast for the VPC scale total was 3.6, which verifies scale multidimensionality. The
eigenvalue of the first contrast for the staff actions and patient actions factors were below 2.0 (both
1.7), suggesting these factors are unidimensional.
The raw variance explained by measures for the factors was 43.3% (staff actions) and 48.8% (patient
actions) and were therefore both considered strong measurement dimensions (Conrad et al., 2011).

Comparison of male and female participants revealed no significant item invariance for any items,
with all contrasts falling below the 0.64 logit criterion. Comparison of patient and staff participants
revealed significant DIF on a single item in the staff actions factor: ‘Staff are rude to patients’ (DIF
contrast .72 p<.0001). Because this was the only negatively worded staff actions factor item
remaining, asking an important question relating to staff behaviour, the first option for dealing with
DIF was chosen, to ignore it as inherent in the measurement system and retain the item.
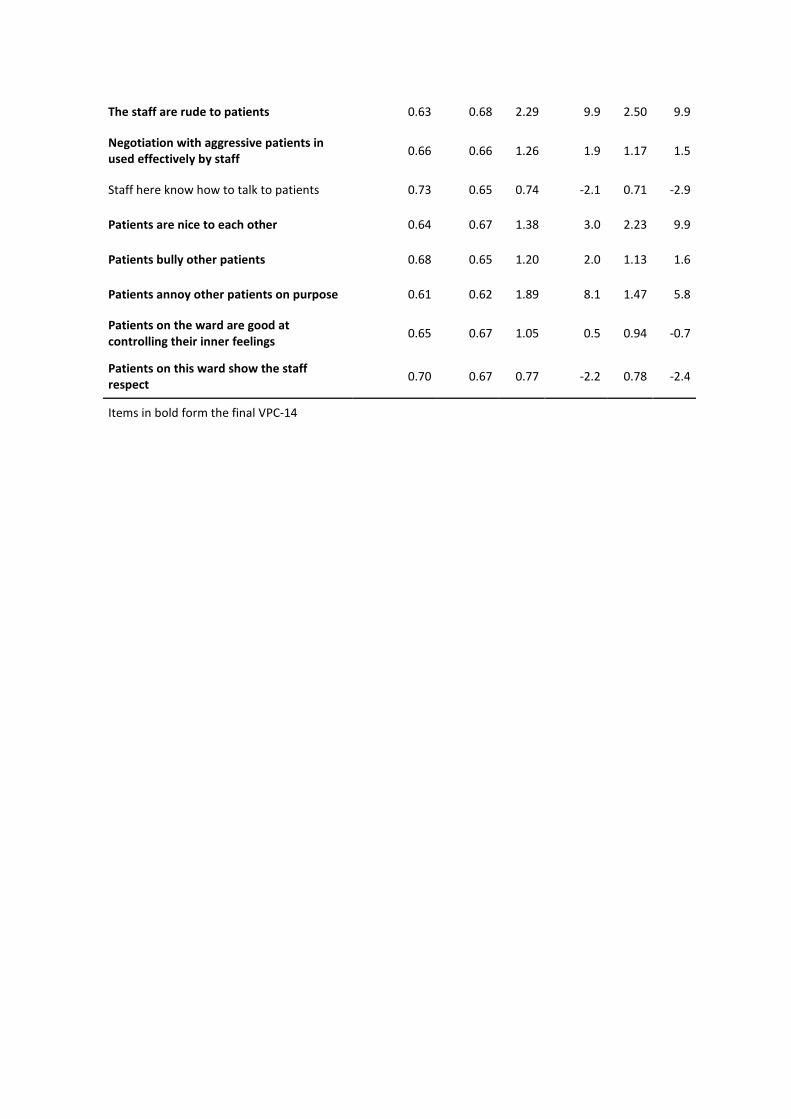
The point-measure correlations for all items were ≥.61, suggesting high construct validity ({ HYPERLINK
\l "Ref498085041" }). The infit and outfit MNSQs of all but two items fell within the acceptable range
(0.6-1.4) ({ HYPERLINK \l "Ref4980850411" }). One item from the patient actions factor had an infit
MNSQ of 1.89; given that this fit statistic is unlikely to degrade the scale (i.e., none >2.0) it was
retained. The staff actions item ‘The staff are rude to patients’ had an infit MNSQ above 2.0 (2.29);
the conceptual importance of the item outweighs the marginal statistical gains made by item removal
and so the item was retained.
Table 3. Item measure and fit for the VPC scale
Item Pt Measure Corr. Expected
Infit MNSQ
Infit ZSTD
Outfit MNSQ
Outfit ZSTD
Staff are good at listening to patients 0.65 0.65 0.98 -0.1 0.99 0.0
There is usually a member of staff around for patients to talk to 0.65 0.66 1.0 0.0 1.01 0.2
Staff on the ward are good at talking down aggressive patients 0.60 0.66 1.32 2.3 1.37 2.9
The staff have a positive attitude towards patients 0.65 0.66 0.99 -0.1 0.92 -0.7
Staff here have a good knowledge of the patients 0.69 0.65 0.65 -2.9 0.67 -3.3
Staff on this ward show the patients respect 0.65 0.64 0.91 -0.7 0.85 -1.5
Staff know when to intervene when a patient is becoming aggressive 0.66 0.64 0.60 -3.5 0.72 -2.8
The staff here are experienced in preventing aggression 0.70 0.65 .98 -0.1 1.02 0.3
The staff are rude to patients 0.63 0.68 2.29 9.9 2.50 9.9
Negotiation with aggressive patients in used effectively by staff 0.66 0.66 1.26 1.9 1.17 1.5
Staff here know how to talk to patients 0.73 0.65 0.74 -2.1 0.71 -2.9
Patients are nice to each other 0.64 0.67 1.38 3.0 2.23 9.9
Patients bully other patients 0.68 0.65 1.20 2.0 1.13 1.6
Patients annoy other patients on purpose 0.61 0.62 1.89 8.1 1.47 5.8
Patients on the ward are good at controlling their inner feelings 0.65 0.67 1.05 0.5 0.94 -0.7
Patients on this ward show the staff respect 0.70 0.67 0.77 -2.2 0.78 -2.4
Items in bold form the final VPC-14
3.3.3. Internal consistency of factors
Cronbach’s alpha for the staff actions factor was .92 suggesting redundant items. Item-item
correlations were examined and three items were highly correlated (>.65) therefore two were
removed. The retained item ‘Staff on this ward show the patients respect’ was retained as it reflects
a patient actions factor item and thus retention improved balance. After removal of these items alpha
was .89. Alpha for the patient actions factor was .76 suggesting good internal consistency for each
factor, with no redundant items.
3.3.4. Convergent and discriminant validity
As the data were not normally distributed, the non-parametric Spearman’s rank-order test was
employed. As predicted, moderate significant correlations were observed between the VPC-14 staff
actions factor and the EssenCES therapeutic hold factor, rs(65)=.414, p.=001, and between the VPC-
14 patient actions factor and the EssenCES patient cohesion factor, rs(62)=.316, p.012. Moderate
significant correlations were also observed between the VPC-14 patient actions factor, and the
therapeutic hold and experienced safety factors of the EssenCES. Spearman’s rank-order correlations
between sum factor scores of the VPC scale and the ACMQ ranged from .087 to .223, all weak
correlations, and none were significant, thus suggesting good discriminant validity.
4. DISCUSSION
The final 14-item version of the scale, the VPC-14, is quick and easy to complete for both staff and
patients and was developed using a strong theoretical evidence base. Statistical analysis suggests that
it is valid and reliable. All final items were clear and understandable for staff and patients and
demonstrated moderate test-retest reliability (K .40-.60). PCA indicated a two-factor solution
comprising staff actions (F1) and patient actions (F2), with all items having a factor loading >.60 and
communalities ≥.40, and no cross-loading items. Rasch analysis confirmed the unidimensionality of
each factor and suggested good construct validity. Both factors showed good internal consistency, and
convergent/discriminant validity was demonstrated.

Despite the initial item pool containing many items relating to organisational and environmental
factors, none of these items were retained by the principal components analysis. The antecedents to
violence and aggression are more commonly cited as patient or staff factors than organisational or
environmental factors (Bowers et al., 2011). It may be that organisational and environmental factors
are of greater interest to researchers than participants; these factors frequently appear in quantitative
studies of violence prevention, but are rarely found in qualitative studies (Hallett et al., 2014).
4.1. Strengths and limitations
The strengths of the VPC-14 include its strong theoretical base and developed with expert review and
a substantial pilot study with staff and patients. For the psychometric testing, there was a large sample
size with excellent response rates. There was a difference in participation rate between staff and
patients, 93% and 66% respectively. However this is a particularly high response rate for staff and a
good response rate from patients (Aiken et al., 2012) and so the discrepancy is not cause for
concern. Item reduction and psychometric testing used a combination of classical test theory and item
response theory, thus strengthening statistical confidence in the measure. The use of factor analysis
alone can produce varying results between studies, but in combination with Rasch analysis provides
greater stability (Kelly et al., 2007). However, test-retest reliability and convergent/discriminant
validity were only assessed with a subsample of the participants. Reliability and validity were assessed
in accordance with the COSMIN checklist (Mokkink et al., 2010), but responsiveness and
interpretability were not. However, responsiveness is about change over time and would require a
longitudinal study to assess. Interpretability explores the distribution of scores among groups, and
therefore was beyond the scope of this study.
The scale was developed within a single charitable trust, with most participants based in secure
settings, therefore it is unclear whether the statistical results would be replicated in other settings.
Including data from a pilot study for further testing with a larger dataset has been used and justified

for scale development (Duxbury, 2003). However some researchers argue that responses to items are
dependent on their context within a scale (Schwarz, 1999, Stanton et al., 2002).
4.2. Implications for practice
Violence prevention and the reduction of coercive measures (e.g. restraint and seclusion) are receiving
much attention currently at organisational and ward level. Wards and trusts in many countries are
adopting Safewards, a programme of ten ward-level interventions designed to increase safety, and
reduce conflict and containment (Safewards, 2017). Similarly the Six Core Strategies, organisational
level interventions to reduce the use of seclusion and restraint, has had widespread adoption in the
USA and other countries (Goulet et al., 2017). As the VPC-14 is a measure of staff’s and patients’
perceptions of the violence prevention climate, it is a useful tool to assess the efficacy of violence or
restraint reduction programmes. Even when interventions havenot been introduced, it may be able
to provide a meaningful measure of the violence prevention climate over time. It is quick and easy to
administer, and can be given to staff and patients, meaning that it can be used to compare the views
of these groups.
4.3. Further research
The VPC-14 needs to be evaluated in other mental health settings including general acute to
determine the transferability of the psychometric properties. This would also allow confirmatory
factor analysis to be undertaken to confirm the factor structure identified by the PCA and Rasch
modelling. Finally, this study has not explored differences in the perceptions of the violence
prevention climate between and within staff and patient groups.
5. CONCLUSION
The VPC-14, based on the knowledge of the authors and considering its psychometric properties, is
currently the most robust measure of the inpatient violence prevention climate available. It is quick
and easy to administer and can be used with staff and patients, meaning that it has the potential to

be introduced as standard practice in a ward setting. It can be used to assess the violence prevention
climate over time, as well as to assess the efficacy of new policies and procedures, at least from the
perspectives of staff and patients. Using the VPC-14 allows staff and patients to identify elements of
the violence prevention climate that they perceive are good or poor, so that the organisation can
explore what is working, and also areas that may need improvement. It is hypothesised that
improvements to the violence prevention climate would lead to improved staff and patient outcomes,
as well as a reduction in conflict and containment events, and so any measure that can help identify
where improvements can be made, as well as the efficacy of those improvements once implemented,
can only be of benefit to individual staff and patients, and the organisation as a whole.
6. REFERENCES
Aiken, L.H., Sermeus, W., Van den Heede, K., Sloane, D.M., Busse, R., McKee, M., Bruyneel, L., Rafferty, A.M., Griffiths, P., Moreno-Casbas, M.T., Tishelman, C., Scott, A., Brzostek, T., Kinnunen, J., Schwendimann, R., Heinen, M., Zikos, D., Sjetne, I.S., Smith, H.L., Kutney-Lee, A., 2012. Patient safety, satisfaction, and quality of hospital care: cross sectional surveys of nurses and patients in 12 countries in Europe and the United States. BMJ 344, e1717
{ HYPERLINK "http://www.kcl.ac.uk/iop/depts/hspr/research/ciemh/mhn/projects/litreview/LitRevAgg.pdf"} [Accessed 4 May 2012].
Braun, V., Clarke, V., 2006. Using thematic analysis in psychology. Qualitative Research in Psychology 3 (2), 77-101.
Campbell, J.C., Messing, J.T., Kub, J., Agnew, J., Fitzgerald, S., Fowler, B., Sheridan, D., Lindauer, C., Deaton, J., Bolyard, R., 2011. Workplace violence: prevalence and risk factors in the safe at work study. Journal of Occupational and Environmental Medicine 53 (1), 82-89.
Cano, S.J., Hobart, J.C., 2011. The problem with health measurement. Patient Preference and Adherence 5, 279-290.
Cano, S.J., Mayhew, A., Glanzman, A.M., Krosschell, K.J., Swoboda, K.J., Main, M., Steffensen, B.F., Bérard, C., Girardot, F., Payan, C.A., 2014. Rasch analysis of clinical outcome measures in spinal muscular atrophy. Muscle and Nerve 49 (3), 422-430.
Cappelleri, J.C., Lundy, J.J., Hays, R.D., 2014. Overview of classical test theory and item response theory for the quantitative assessment of items in developing patient-reported outcomes measures. Clinical Therapeutics 36 (5), 648-662.
Comey, A.L. and Lee, H.B., 1992. A first course in factor analysis. Lawrence Erlbaum, Hillside, NJ. Conrad, K., Conrad, K., Riley, B., Funk, R., 2011. Validation of the Substance Problem Scale (SPS) to the
Rasch Measurement Model, GAIN Methods Report. Chestnut Health Systems, Chicago. Costello, A., Osborne, J., 2005. Best practices in exploratory factor analysis: four recommendations for
getting the most from your analysis. Practical Assessment, Research and Evaluation 10 (7), 173-178.
Dack, C., Ross, J., Bowers, L., 2012. The relationship between attitudes towards different containment measures and their usage in a national sample of psychiatric inpatients. Journal of Psychiatric and Mental Health Nursing 19 (7), 577-586.

Dancey, C.P., Reidy, J., 2007. Statistics without maths for psychology. Pearson Education, Harlow. Day, A., Casey, S., Vess, J., Huisy, G., 2012. Assessing the therapeutic climate of prisons. Criminal Justice
and Behavior 39 (2), 156-168. Duxbury, J., 2003. Testing a new tool: the Management of Aggression and Violence Attitude Scale
(MAVAS). Nurse Researcher 10 (4), 39-53. Duxbury, J., Aiken, F., Dale, C., 2011. Deaths in custody: the role of restraint. Journal of Learning
Disabilities and Offending Behaviour 2 (4), 178-189. Fish, R., Hatton, C., 2017. Gendered experiences of physical restraint on locked wards for women.
Disability and Society 32 (6), 790-809. Flood, C., Bowers, L., Parkin, D., 2008. Estimating the costs of conflict and containment on adult acute
inpatient psychiatric wards. Nursing Economics 26 (5), 325-330, 324. Gliem, J.A., Gliem, R.R., 2003. Calculating, interpreting, and reporting Cronbach’s alpha reliability
coefficient for Likert-type scales. In: Midwest Research-to-Practice Conference in Adult, Continuing, and Community Education. Columbus, OH.
Gorsuch, R., 1983. Factor analysis. Lawrence Erlbaum Associates, Hillsdale, NJ. Goulet, M.-H., Larue, C., Dumais, A., 2017. Evaluation of seclusion and restraint reduction programs in
mental health: a systematic review. Aggression and Violent Behavior. Güler, N., Uyanık, G.K., Teker, G.T., 2014. Comparison of classical test theory and item response theory
in terms of item parameters. European Journal of Research on Education 2 (1), 1-6. Hagquist, C., Andrich, D., 2017. Recent advances in analysis of differential item functioning in health
research using the Rasch model. Health and Quality of Life Outcomes 15 (1), 181. Hallett, N., Huber, J., Dickens, G., 2014. Violence prevention in inpatient psychiatric settings:
systematic review of studies about the perceptions of care staff and patients Aggression and Violent Behavior 19 (5), 502-514.
Hatch-Maillette, M.A., Scalora, M.J., Bader, S.M., Bornstein, B.H., 2007. A gender-based incidence study of workplace violence in psychiatric and forensic settings. Violence and Victims 22 (4), 449-462.
Howells, K., Tonkin, M., Milburn, C., Lewis, J., Draycot, S., Cordwell, J., Price, M., Davies, S., Schalast, N., 2009. The EssenCES measure of social climate: a preliminary validation and normative data in UK high secure hospital settings. Criminal Behaviour and Mental Health 19 (5), 308-320.
Iozzino, L., Ferrari, C., Large, M., Nielssen, O., de Girolamo, G., 2015. Prevalence and risk factors of violence by psychiatric acute inpatients: a systematic review and meta-analysis. PloS One 10 (6), e0128536.
Jabrayilov, R., Emons, W.H., Sijtsma, K., 2016. Comparison of classical test theory and item response theory in individual change assessment. Applied Psychological Measurement 40 (8), 559-572.
Kelly, P., Kallen, M., Suarez-Almazor, M., 2007. A combined-method psychometric analysis recommended modification of the multidimensional health locus of control scales. Journal of Clinical Epidemiology 60 (5), 440-447.
Landis, J.R., Koch, G.G., 1977. The measurement of observer agreement for categorical data. Biometrics 33, 159-174.
Lin, C.-J., 2008. Comparisons between classical test theory and item response theory in automated assembly of parallel test forms. The Journal of Technology, Learning and Assessment 6 (8).
Linacre, J.M., 2002. What do infit and outfit, mean-square and standardized mean. Rasch Measurement Transactions 16 (2), 878.
Linacre, J.M., 2006. Data variance explained by Rasch measures. Rasch Measurement Transactions 20 (1), 1045.
Linacre, J.M., 2012. Winsteps Rasch tutorial 2 [Online]. Available: { HYPERLINK "http://www.winsteps.com/a/winsteps-tutorial-2.pdf" } [Accessed 5 January 2015].
Linacre, J.M., 2014. Table 23.0 Variance components for items [Online]. Available: { HYPERLINK "http://www.winsteps.com/winman/table23_0.htm" } [Accessed 31 October 2014].

Linacre, J.M., 2015. DIF - DPF - bias - interactions concepts [Online]. winsteps.com, Available: { HYPERLINK "http://www.winsteps.com/winman/difconcepts.htm" } [Accessed 14 January 2015].
Linacre, J.M., Wright, B.D., 2009. A user's guide to WINSTEPS. winsteps.com, Chicago. Livingston, J.D., Nijdam-Jones, A., Brink, J., 2012. A tale of two cultures: Examining patient-centered
care in a forensic mental health hospital. Journal of Forensic Psychiatry and Psychology 23 (3), 345-360.
McDowell, I., 2006. Measuring health: a guide to rating scales and questionnaires. Oxford University Press, Oxford.
Milsom, S.A., Freestone, M., Duller, R., Bouman, M., Taylor, C., 2014. Factor structure of the Essen Climate Evaluation Schema measure of social climate in a UK medium-security setting. Criminal Behaviour and Mental Health 24 (2), 86-99.
Mokkink, L.B., Terwee, C.B., Patrick, D.L., Alonso, J., Stratford, P.W., Knol, D.L., Bouter, L.M., de Vet, H.C.W., 2010. The COSMIN checklist for assessing the methodological quality of studies on measurement properties of health status measurement instruments: an international Delphi study. Quality of Life Research 19 (4), 539-549.
Moos, R., 1974. Evaluating treatment environments: a social ecological approach. Wiley, New York. Morello, R.T., Lowthian, J.A., Barker, A.L., McGinnes, R., Dunt, D., Brand, C., 2013. Strategies for
improving patient safety culture in hospitals: A systematic review. BMJ Quality and Safety 22 (1), 11-18.
Müller, M., 2013. Nursing competence: psychometric evaluation using Rasch modelling. Journal of Advanced Nursing 69 (6), 1410-1417.
National Institute for Health and Care Excellence, 2015a. Safeguarding NHS staff from violent and aggressive patients [Online]. Available: { HYPERLINK "https://www.nice.org.uk/news/article/safeguarding-nhs-staff-from-violent-and-aggressive-patients" } [Accessed 10 November 2017].
National Institute for Health and Care Excellence, 2015b. Costing statement: Violence and aggression. National Institute for Health and Care Excellence, Manchester.
Paterson, B., Leadbetter, D., Miller, G., 2004. Workplace violence in health and social care as an international problem: a public health perspctive on the 'Total Organisational Response' [Online]. Available: { HYPERLINK "http://www.nm.stir.ac.uk/documents/ld-integrated-response.pdf" } [Accessed 12 November 2012].
Renwick, L., Lavelle, M., Brennan, G., Stewart, D., James, K., Richardson, M., Williams, H., Price, O., Bowers, L., 2016. Physical injury and workplace assault in UK mental health trusts: An analysis of formal reports. International Journal of Mental Health Nursing 25 (4), 355-366.
Røssberg, J.I., Friis, S., 2003. A suggested revision of the Ward Atmosphere Scale. ActaPsychiatricaScandinavica 108 (5), 374-380.
Safewards, 2017. Safewards [Online]. Available: { HYPERLINK "http://www.safewards.net/" } [Accessed 8 May 2017].
Schalast, N., Redies, M., Collins, M., Stacey, J., Howells, K., 2008. EssenCES, a short questionnaire for assessing the social climate of forensic psychiatric wards. Criminal Behaviour and Mental Health 18 (1), 49-58.
Schwarz, N., 1999. Self-reports: how the questions shape the answers. American Psychologist 54 (2), 93-105.
Spector, P.E., Coulter, M.L., Stockwell, H.G., Matz, M.W., 2007. Perceived violence climate: a new construct and its relationship to workplace physical violence and verbal aggression, and their potential consequences. Work and Stress 21 (2), 117-130.
Stanton, J.M., Sinar, E.F., Balzer, W.K., Smith, P.C., 2002. Issues and strategies for reducing the length of self-report scales. Personnel Psychology 55 (1), 167-194.
Stewart, D.W., 1981. The application and misapplication of factor analysis in marketing research. Journal of Marketing Research 18 (February), 51-62.
Streiner, D.L., Norman, G.R., 2008. Health measurement scales. Oxford University Press, Oxford.

Tennant, A., Conaghan, P.G., 2007. The Rasch measurement model in rheumatology: what is it and why use it? When should it be applied, and what should one look for in a Rasch paper? Arthritis Care and Research 57 (8), 1358-1362.
Tonkin, M., Howells, K., Ferguson, E., Clark, A., Newberry, M., Schalast, N., 2012. Lost in translation? Psychometric properties and construct validity of the English Essen Climate Evaluation Schema (EssenCES) social climate questionnaire. Psychological Assessment 24 (3), 573.
Willets, L., Mooney, P., Blagden, N., 2014. Social climate in learning disability services. Journal of Intellectual Disabilities and Offending Behaviour 5 (1), 24-37.
Williams, B., Brown, T., Onsman, A., 2012. Exploratory factor analysis: a five-step guide for novices. Australasian Journal of Paramedicine 8 (3), 1-13.
World Health Organization, 1953. The community mental hospital: third report of the expert committee on mental health. World Health Organization, Geneva.
Worthington, R.L., Whittaker, T.A., 2006. Scale development research. The Counseling Psychologist 34 (6), 806-838.
Wright, B.D., Linacre, J.M., Gustafson, J., Martin-Lof, P., 1994. Reasonable mean-square fit values. Rasch Measurement Transactions 8 (3), 370.
Zwick, R.T., D.T. Lewis, C., 1999. An empirical Bayes approach to Mantel-Haenszel DIF analysis. Journal of Educational Measurement 36 (1), 1-28.