Embed Size (px)
Citation preview

University of Dundee
Fidelity of Computational Modelling of Offshore Jacket Platforms
Vilnay, Margi; Sivickij, Valdemaras; Watters, Frazer; Doerich-Stavridis, Cornelia; Chernin,LeonPublished in:Proceedings of the Institution of Civil Engineers: Engineering and Computational Mechanics
DOI:10.1680/jencm.19.00004
Publication date:2019
Document VersionPeer reviewed version
Link to publication in Discovery Research Portal
Citation for published version (APA):Vilnay, M., Sivickij, V., Watters, F., Doerich-Stavridis, C., & Chernin, L. (2019). Fidelity of ComputationalModelling of Offshore Jacket Platforms. Proceedings of the Institution of Civil Engineers: Engineering andComputational Mechanics, 172(2), 79-93. https://doi.org/10.1680/jencm.19.00004
General rightsCopyright and moral rights for the publications made accessible in Discovery Research Portal are retained by the authors and/or othercopyright owners and it is a condition of accessing publications that users recognise and abide by the legal requirements associated withthese rights.
• Users may download and print one copy of any publication from Discovery Research Portal for the purpose of private study or research. • You may not further distribute the material or use it for any profit-making activity or commercial gain. • You may freely distribute the URL identifying the publication in the public portal.
Take down policyIf you believe that this document breaches copyright please contact us providing details, and we will remove access to the work immediatelyand investigate your claim.
Download date: 08. Feb. 2022

1
FidelityofComputationalModellingofOffshoreJacketPlatforms
Margi Vilnay1#, Valdemaras Sivickij2, Frazer Watters3, Cornelia Doerich-Stavridis1, Leon Chernin4
1 School of Science, Engineering and Technology, Abertay University, UK 2 Bridges Department, WSP 3 UK Verification Centre, DNV GL
4 School of Science and Engineering, University of Dundee, Dundee, UK # Corresponding author: email: [email protected], tel. +44(0)1382 308768
Abstract
The development of oil and gas exploitation offshore has a history of about half a century. Many
platforms have been built since to facilitate the production of hydrocarbons oil and gas, of which fixed
offshore jacket type structures are the most commonly adopted rigs for shallow water depths. The
present paper focuses on the modelling of a 4-legged X-braced jacket type platform, representative of
a typical fixed platform in the North Sea using nonlinear finite element analysis. Normally, offshore
platforms are conservatively designed using linear-elastic models to determine the effects of applied
actions. The nonlinear effects of joint flexibility, piled foundations and geometrical imperfections on the
platform behaviour are investigated in this paper. Joint flexibility is studied by modelling the jacket using
beam elements and introducing rigid or flexible joints. A hybrid model, with the critically loaded leg and
connected joints built using shell elements, is applied for the investigation of localised effects on
increasing joint flexibility. The soil-pile interaction is modelled implicitly using sets of decoupled springs
distributed along the piles. The geometrical imperfections are introduced in the compression legs of the
jacket. The imperfect leg shapes are generated based on the failure modes of the platform. The platform
is loaded by operational and environmental loads. The environmental loads are gradually increased
until platform failure occurs. Eight load cases are considered, where the environmental loads are
applied in 4 end-on and 4 broadside directions. The findings of the paper indicate that incorporation of
joint flexibility and piled foundation result in the reduction of platform yielding and ultimate strength. The
piled foundation affects platform stiffness severely. The imperfections increase platform deformability
in the elastic rage and lead to dramatic reduction of jacket base shear capacity.

2
1. Introduction
Steel platforms are extensively used in exploration of offshore oil and gas, the first of which were erected
in the Gulf of Mexico in 1947 (Clauss et al., 1992). Of these platforms, fixed offshore jacket type
structures are the most commonly adopted rigs for shallow water depths (Skallerud and Amdahl, 2002).
They are exposed to harsh offshore conditions during storms and hurricanes and, therefore, are
designed to resist high environmental loads generated from wave, current, wind, snow and ice. The
cyclic nature of the environmental loads causes fatigue-related strength reduction (Ersdal, 2005).
Another important factor in the structural design of the platforms is the length of the service life. The
majority of the North Sea platforms have, for instance, reached the end of their designed service life
and as such are currently operating out-with their life expectancy (The UK Oil and Gas Industry
Association, 2017). The structural performance of platforms has been affected by the aggressive marine
environment through material deterioration (e.g., steel corrosion) leading to the reduction of platform
durability (Stacey et al., 2008). Many platforms have additionally undergone significant structural
changes, such as topside extensions to accommodate new, more efficient oil extraction equipment or
additional living quarters. Therefore, reliable analysis procedures, based on the application of advanced
computational methods and the development of highly detailed models, are required to keep platforms
operating at a safe and efficient level.
Over the last decades, analysis and assessment methods of offshore platforms have developed
significantly (Chandrasekaran, 2015; Hellan, 1995; Skallerud and Amdahl, 2002). However, several
catastrophic events such as the collapse of the Alexander Kielland platform in 1980 (Lancaster, 2000)
and the Piper Alpha disaster in 1993 (Paté-Cornell, 1993) have placed an increased focus on the
evaluation of the ultimate strength of the platform. The ultimate strength and actual design life can only
be accurately assessed by considering non-linear effects of joint flexibility, piled foundations and
geometrical imperfections on the platform behaviour.
1.1. Joint flexibility
The design of offshore tubular space frames widely used in offshore jacket platforms usually consists
of several tubular legs (chords) with a large number of tubular bracing members (Ueda and Rashed,
1990). Tubular joints constitute one of the main challenges in the design, construction and maintenance

3
of these jackets (Background to a new static strength guidance for tubular joints in steel offshore
structures., 1990). The design of tubular joints is generally based upon the strength and detailing
requirements, in which two principal considerations have to be addressed – fatigue behaviour and static
strength. In practice, the measure of the structural capacity of an overall jacket structure is normally
taken when the first yielding at the highest stressed point in a structural component occurs. However,
for unstiffened tubular joints, first yielding has never been used as a criterion for ultimate capacity.
Rather, this is determined on the basis of a maximum allowable displacement or limit load (Skallerud
and Amdahl, 2002). In compression, the capacity of a tubular joint can be described by an ultimate limit
load. However, when a tubular joint is loaded in tension, the matter is further complicated. Although a
limit load may be applied to a joint, it occurs at such high levels of deformation that the joint suffers
severe ductile crack growth (Skallerud and Amdahl, 2002), indicating that tensile capacity must be
reduced if failure is to be considered at the first sign of cracking. The implementation of this theory in
modelling practice resulted in neglecting joint flexibility. It is usual practice within the offshore industry
(e.g. ISO 19900) to assume rigid joints and the length of a member equal to the distance between
centres of joints connected by it (i.e., centre-to-centre approach). However, these assumptions
contradict the real conditions, since joints undergo deformation particularly when members in the jacket
are pushed beyond the elastic response. Recent experiments have shown that the amount of force
required to achieve a complete failure of tubular joints is significantly greater that those loads that cause
initial yielding in members of the jacket platform (Bouwkamp et al., 1980). In an attempt to consider
some joint deformation in the design, joint capacity equations have been developed (Dier and Lalani,
1998). These equations consider the development of various failure mechanisms, depending on the
type and magnitude of applied load, and can be used for evaluation of the limit values. When the effect
of joint flexibility needs to be accounted for directly, the joints are modelled either with shell elements,
which account for the deformation within the joint explicitly, or springs, which consider elastic behaviour
of the joint based on parametric equations (Dier et al., 2002). Additionally, special type elements were
developed for this purpose (Holmås, 1987; Holmås et al., 1987).
Several researches have investigated the effect of joint flexibility on the overall behaviour of a jacket
platform (Bouwkamp et al., 1980; Dier et al., 2002; Hellan, 1995; Holmås, 1987; Holmås et al., 1987;
Mendoza Espinosa, 2017; Mirtaheri, 2009; Priyanka, 2009). These studies reported that introducing
joint flexibility led to significant changes in the structural response. However, the effect of joint flexibility

4
on platform strength was not clear. For example, Hellan (Hellan, 1995) investigated the impact of joint
flexibility on the ultimate strength of four jacket models representative of typical North Sea platforms.
The models employed different strategies in considering joint flexibility. Structural members were
modelled using either the centre-to-centre approach with rigid joints or the face-to-face approach with
rigid or flexible joints. Here, the face-to-face approach assumed length of a brace member equal to
distance between faces of legs, while legs were modelled as continuous. This configuration
corresponds to the actual length of brace members, since braces are welded to the faces of the legs
resulting in shorter member lengths. The study indicated that the centre-to-centre approach is
sufficiently conservative and joint flexibility can be disregarded. Mirtaheri et al. (Mirtaheri, 2009)
performed a non-linear static push-over analysis on platforms with individual T- and Y-joints modelled
as rigid or flexible. To estimate the effect of joint flexibility on the strength and stiffness of the platform,
the load-deformation (P-δ) behaviour was studied analytically by examining the response of deck
displacement to the base shear. The authors reported that the platform was considerably stiffer when
joints were modelled as rigid. Consequently, stiffness and ultimate capacity of the jacket platform
modelled without joint flexibility can be overestimated leading to a non-conservative design of the
structure. According to ISO 19902(BS EN ISO 19902:2007: Fixed steel offshore structures), flexibility
of the joint does not significantly affect the axial forces in a simple framework, but inclusion of the joint
flexibility modifies member end- and mid-span bending moments and can reduce the overall stiffness
of the framework, thus increase the main periods of vibration by 3-6%.
1.2. Piled foundation
Fixed jacket structures are generally piled to the sea floor. Piles are installed primarily to resist the axial
bearing actions due to gravity of the structure, overturning moment and global base shear force
generated from environmental actions (Skallerud and Amdahl, 2002). The foundation failure
mechanisms include lateral soil failure, induced by lateral forces in piles and axial soil failure, which
includes pull-out in tension and punch-through in compression. In the case of lateral soil failure, a portal
frame mechanism develops in the piles below the mud-line. This results in formation of plastic hinges
in the piles at the mud-line and development of maximum bending moment just below the mud-line
(Norske Veritas, 1999). In the case of axial soil failure, whole platform rotates as a ‘rigid body’ about a
horizontal axis in the foundation.

5
In practice, the soil-structure interaction is accounted for by modelling the pile embedded in the soil (an
explicit approach), or by attaching to the pile a series of uncoupled springs representing the soil (an
implicit approach) (Skallerud and Amdahl, 2002). In the latter option, the springs should accurately
capture the non-linear mechanical properties of the soil. Several research works investigated the effect
of soil-structure interaction on offshore platforms, e.g. (Azadi, 1998; Gilbert et al., 2010; Mostafa and El
Naggar, 2004). Azadi (Azadi, 1998) investigated the influence of soil-structure interaction of an actual
eight-legged jacket in the North Sea by means of a static push-over analysis. It was reported that soil-
structure interaction increased platform displacements but had insignificant effect on the ultimate
strength. This implies that the piled foundation was stronger than the jacket.
1.3. Geometrical imperfections
Platform strength can also be affected by the imperfections introduced at the fabrication stage. The
imperfections can significantly reduce the buckling strength of compression elements, because it is
generally dependent on the amount of deformation within the element (Skallerud and Amdahl, 2002). If
the imperfections are not considered, the simulated buckling capacity of the members in the jacket is
unrealistically high. Two main type of imperfections in structural elements include (i) residual stresses
and (ii) geometric deviations. Residual stresses arise from both manufacturing of the profile and
fabrication of the structure. This includes stresses induced during the welding process which generates
lateral distortions and misalignment of structural elements. Fabrication-induced residual stresses are
usually redistributed in adjacent elements of the jacket. Geometric imperfections consist of cross-
sectional variations (i.e., plate thickness, tube diameter, shape distortions) and axial out-of-straightness.
Such imperfections are primarily caused by the manufacturing and fabrication processes of the profile.
Experimental observations on K-braced plane frames indicated that significant compressive residual
stresses in the range of 30% of the yield stress had a substantial effect on the occurrence of first
member buckling, but resulting effect of fabrication-induced residual stresses on the ultimate strength
of the system was relatively small (Bolt, 1995; Bolt et al., 1996). Therefore, the fabrication-induced
residual stresses can be neglected in the analysis, while element geometric imperfections should be
accounted for (Skallerud and Amdahl, 2002). Some codes (e.g., ECCS, Eurocode 3) provide design
equations for element buckling where the out-of-straightness captures the effect of both geometric
deviations and residual stresses.

6
For a thin-walled tubular beam made of mild steel, an equivalent imperfection is given by (Skallerud
and Amdahl, 2002)
0.0015 1.
(1)
where 𝑤 is the out-of-straightness amplitude (equivalent imperfection), 𝑙 is element length, and �̅� is
reduced slenderness ratio for column buckling. Eq. (1) implies that equivalent imperfection can be
considered by introducing a mid-span deflection of 0.15% of the element length. Furthermore,
sufficiently accurate results can be obtained by using a constant amount of out-of-straightness over the
whole range of slenderness.
When the out-of-straightness imperfection distorts the element shape in the direction opposite to the
critical buckling mode, the buckling strength increases. Therefore, the imperfections can be either
favourable or unfavourable. In the analysis of offshore platforms, a conservative approach, which
assumes the most unfavourable imperfection, is required for ultimate strength assessment (Skallerud
and Amdahl, 2002). Hellan (Hellan, 1995) suggested that the most conservative case corresponds to
imperfections assigned in the direction of the global base shear.
This paper examines the extent, by which the computational prediction of the ultimate strength of jacket
platform is affected by joint flexibility, piled foundation and geometrical imperfections. For this purpose,
a fixed offshore jacket type platform, typical of the North Sea, is considered. The structure is modelled
using the nonlinear finite element analysis (NLFEA) software suite – Abaqus (Abaqus Documentation,
version 6.12, 2012). The loads applied at the platform include functional loads, buoyancy and typical
environmental loads including wind and wave. The joints are modelled using the centre-to-centre
approach with flexible joints, the face-to-face approach with rigid joints and a hybrid shell-to-beam
approach. The piled foundation is modelled with soil-structure interaction using the implicit approach
and compared to the fully fixed boundary conditions. The imperfections are introduced in the jacket
compression legs to study the effect of the reduced leg buckling strength on the jacket behaviour.

7
2. NLFEA model
2.1. Model geometry and material
The structure analysed in this paper is a typical basic jacket type offshore structure shown in Figure 1.
The installation consists of a 4-legged X-braced steel jacket substructure with 5 horizontal frames
supporting a topside model and standing in a water depth of 125 m. The jacket frame consists of 4
bays, which are named as the bottom, middle-bottom, middle-top and top bays. The bottom and middle-
bottom bays are 35.2 m high, while the middle-top and top bays are 30.2 m high. The model axes X, Y
and Z represented the East, North and Vertical directions. This orientation is used for description of the
directions of environmental loads. Additionally, the jacket legs are named in accordance with the
orientation, North-West (NW), North-East (NE), South-West (SW) and South-East (SE) leg, as shown
in Figure 1.
Figure 1. NLFEA model of jacket platform: (a) isometric view; view from (b) X and (c) Y directions.
The topside was primarily constructed using I-beams with heavier bottom flange and steel plates,
whereas the jacket using steel tubular members, typical of the platform type. Therefore, the topside was
modelled using beam and shell elements in all platform models analysed in this study. The density of
steel was assumed equal to 7850 kg/m3, Young’s modulus to 210 GPa and Poisson’s ratio to 0.3.
NE SE
NW
SW

8
Plasticity of the steel material was accounted for using the von Mises criterion with isotropic hardening,
with yield stress set to 355 MPa.
2.2. Modelling of loads
Offshore jacket type structures are generally subjected to operational and environmental loads.
Operational loads typically include the dead ( or functional) load generated from the self-weight of
the jacket and equipment, live loads from utilisation of the topside (equipment, living modules) and also
buoyancy loads. Buoyancy is calculated in accordance to accepted practice (Douglas, 2011) based on
the weight of the fluid displaced by the structure, meaning that larger members create more fluid
displacement. The environmental loads are comprised of the wind and wave loads. Modern offshore
fixed installations are commonly designed to resist the 1-year operating load and 100-year
environmental storm load. The latter is attributable to the combined wave and wind loads that occurs
during the storm which is characterised by a return period of 100 years (Nelson et al., 2003). The wave
load consists of the transverse fluid drag and inertia, which are calculated based on the Morison
equation (ISO 19902 (BS EN ISO 19902:2007: Fixed steel offshore structures, n.d.)). As a result, the
wave load on each jacket member depends on its diameter, location in the frame and orientation relative
to the wave direction. Partial factors of safety are applied to the loads in compliance with ISO 19902.
The gravity and buoyancy loads were applied to the platform model gradually, over several increments.
The environmental loads corresponded to the North Sea conditions. The wind load was applied to
exposed surfaces of the platform above the sea level, while the wave load was applied to submerged
jacket members. This effectively generated a push-over effect on the structure, where high overturning
moments and shear forces were generated at the base of the rig. To evaluate how the jacket structure
behaved under the environmental loads applied in different directions and find out which direction was
the most critical, eight analysis cases were carried out: North, North-East, East, South-East, South,
South-West, West, North-West (see Figure 2). The name of each analysis case indicates the direction
of the environmental loads. It is important to note that the North, South, East or West direction are called
the end-on directions, while the North-East, South-West, North-West or South-East directions are called
broadside directions.

9
Figure 2. Directions of environmental loads.
The submerged part of the jacket is always colonised by marine growth (or biofouling), which consists
of a variety of species depending on the location, depth and configuration of the structure. The marine
growth has several effects on the loads applied to the structure. It increases structural dimensions,
displaced volume, structural weight, hydrodynamic added mass, drag forces and flow instability around
the jacket (Jusoh and Wolfram, 1996). In this study, the marine growth was assumed to develop only
above 94 m from the seabed. At 100 m above the seabed the marine growth reached 50 mm and at
125 m above the seabed to 100 mm. These values are typical of ageing North Sea offshore structures.
A linear increase in the marine growth was assumed between the heights specified.
2.3. Modelling of joints
The joints in the jacket were modelled using three different methods. The first method was based on
the face-to-face approach for modelling brace members, see Figure 3a. The points, where the braces
were connected to legs, were dictated by true cross-sections of the legs (see Figure 3b). Therefore, the
joints were offset and did not influence each other directly. The connections between the braces and
the legs were introduced into the model using rigid elements, which were tied together at the connection
with the leg. Hence, any local deformation was prevented, and joint flexibility was disregarded. All
members of the jacket were modelled using beam elements.
S (-y)
N (+y)
W (-x) E (+x)
SE
NW
SE
NW

10
(a) (b) (c)
Figure 3. Face-to-face approach for modelling braces: (a) beam element representation, (b) true cross-section representation. (c) Centre-to-centre approach for modelling braces.
In the second method, the centre-to-centre approach was applied for modelling brace members. All
braces in one joint were connected to the leg at the same node located at the centre of the joint, as
demonstrated in Figure 3c. This made the braces longer by leg radii on both ends and thus more flexible,
simulating the effect of joint flexibility implicitly. All members of the jacket were also modelled using
beam elements.
The third method employed a hybrid approach which was based on detailed modelling of one jacket leg
using shell elements, as shown in Figure 4. The rest of the jacked was modelled using beam elements
and the face-to-face approach. As a result, the effect of joint flexibility was explicitly considered in the
joints of the shell leg. In the model, the beam elements were connected to the shell elements by tying
the degrees of freedom of the end nodes. It should be noted that this approach was applied here due
to the reduced computational cost of the NLFEA analysis compared to modelling whole jacket using
shell elements. In order to decide which loading direction is the most critical and which leg to model
with shell elements, 8 analyses of the platform loaded in the directions stated in Section 2.2 were run.
These analyses determined that the South-West loading direction is the most critical and therefore the
North-East leg is to be modelled with shell elements because of the high stresses that develop in the
leg.

11
Figure 4. Hybrid shell-to-beam model. The North-East leg is modelled using shell elements, while the rest of the jacked using beam elements.
2.4. Modelling of piled foundation
To investigate the effect of piled foundation on the behaviour of the jacket rig, two models were analysed
and compared. In one model, a piled foundation was explicitly incorporated (e.g., see Figure 5). The
jacket was attached to the seabed by 4 piles driven 75 m deep into the soil and extended above the
mud-line into the main legs of the platform. The soil was implicitly modelled using springs distributed
along the steel piles. Separate soil layers were represented by springs with corresponding equivalent
stiffness. This study considered a case where piles are driven into soil consisting of three sand layers
between 0 m and -5.5 m below the mud-line and two clay layers between -5.5 m and -70 m below the
mud-line. The pile tip was positioned in the additional sand layer that started at -70 m and extended to
the depth of -100 m. The soil layers were characterised using the relationships for the end bearing
resistance vs. displacement at the pile tip, for the shear transfer (skin friction) vs. pile displacement and
for the lateral soil resistance vs. displacement, as per ISO 19902. These constitutive relationships were

12
used for modelling the behaviour of springs. The piles were modelled using beam elements with circular
cross-sections. The behaviour of the platform with piled foundation was compared to the platform fixed
to the seabed.
2.5. Modelling of imperfections
The influence of imperfections on the jacket behaviour was examined using the model with piled
foundations. The geometrical imperfections were introduced directly into the model by changing the
shape of the legs only, as buckling of a leg is considered more critical than buckling of a brace. It is a
common practice within the offshore industry to assume the equivalent imperfection (𝑤 ) at the mid-
span as equal to 0.15% of the element length (𝑙). Therefore, a simplified version of Eq. (1), given below,
was used for evaluation of the imperfections
𝑤 0.0015𝑙 (2)
For the two bottom bays with a leg length of 35,234.7 mm and the two top bays with a leg length of
30,201.2 mm, Eq. (2) yields the imperfection values of 52.85 mm and 45.3 mm, respectively. These
geometrical imperfections were introduced into the models in two stages. At the first stage, the shape
of the leg with imperfections was obtained by application of equivalent forces to the leg at the middle of
each bay. The leg was also restrained by simple horizontal supports at each joint to prevent the
influence of jacket deformation on the ‘imperfect’ leg shape. Each equivalent force was increased in
value until a desirable imperfection developed. The ‘imperfect’ shape was recorded, and the forces and
supports were removed. At the second stage, the operational and environmental loads were applied on
the ‘imperfect’ jacket platform, and the effect of imperfection examined.
Several trial analyses showed that imperfections can either decrease or increase the ultimate strength
of the platform. To considering the worst-case scenario, the direction of each force and thus the
imperfection was selected based on the failure modes of the model without imperfections. As a result,
the imperfections increased the deformation of the jacket under the operational and environmental loads
and caused maximum damage to the load carrying capacity of the platform.
The imperfections were introduced into both compression legs in the end-on load cases and into the
compression leg in the broadside load cases. Figure 5 depicts two models with imperfection introduced
into (a) both North legs and (b) the North-East leg. The model in Figure 5a is designated for the end-on

13
South loading, while in Figure 5b for the broadside South-West loading. As can be seen, the
imperfection is introduced in each leg in every bay of the frame in opposite direction, which creates a
shape similar to a buckling mode of the leg.
(a) (b)
Figure 5. Models with geometrical imperfection in (a) both North legs and (b) North-East leg. In the legend, ‘U’ stands for displacement. The deformation scale factor of 50 was applied to the models.
2.6. Analysis procedure
It is common practice to determine the ultimate capacity of the jacket rig using static push-over analysis.
This type of analysis accounts for the non-linear response in an incremental-iterative way. For a realistic
representation of offshore platform behaviour, the analysis was conducted in several steps. The
arrangement of steps is significant, since it controls the sequential chain of events during the analysis.
The steps included the consecutive application of the gravity, buoyancy and service loads, followed by
the application of the environmental loads which were gradually increased by the load proportionality
factor (LPF) until structure reached its ultimate resistance load (ultimate strength) and failed. The

14
ultimate resistance (Rult) of the structure at the state of collapse can be represented by the following
relationship (Lloyd and Clawson, 1983):
𝑅 𝜆 𝐸 (3)
where 𝜆 is the LPF at collapse and 𝐸 is the unfactored (characteristic) global environmental actions.
An elastic response was observed in the platform subjected to the operational and initial environmental
loads. However, the increasing environmental loads pushed-over the structure beyond the elastic
response. The non-linear behaviour of the platform was analysed using the modified Riks method
(Abaqus Documentation, version 6.12, 2012), which allowed to determine the ultimate load carrying
capacity and the mode of failure.
3. Analyses results and discussion
3.1. Behaviour of platform
Two sets of computational simulations were carried out for the rigid and flexible joint models subjected
to 8 load cases (4 end-on and 4 broadside load cases). In the first set, the models were analysed without
and with piles, while in the second set with piles. The results of the computational simulations containing
the load carrying capacity (i.e., LPF at the first yielding and maximum LPF) and the stiffness
(represented by the LPF divided by the maximum deformation, δ, in the jacket) of the platform are
presented in Tables 1 and 2 for the rigid and flexible joint models, respectively. The data in the tables
below is analysed and discussed in the following sections.
Table 1. Sustained loads (in terms of LPF) and stiffness of the rigid joint model without and with piles under different load cases.
Load case LPF at 1st yielding Maximum LPF Stiffness (LPF/δ)
No piles Piles No piles Piles No piles Piles
North 3.81 3.51 4.85 4.48 12.71 6.16
North-East 5.58 5.05 6.44 5.99 15.91 7.67
East 5.30 4.68 6.85 6.04 21.94 11.25
South-East 5.53 5.01 6.35 5.82 15.95 7.51
South 3.89 3.49 4.66 4.28 12.39 5.84
South-West 5.48 4.92 6.40 5.80 15.55 7.38
West 5.06 4.52 6.66 5.98 21.55 10.80 North-West 5.60 5.10 6.58 6.00 16.14 7.55

15
Table 2. Sustained loads (in terms of LPF) and stiffness of the flexible joint model without and with piles under different load cases.
Load case 1st yield LPF Maximum LPF Stiffness (LPF/δ)
No piles Piles No piles Piles No piles Piles
North 3.45 3.43 4.06 4.24 11.12 6.00
North-East 4.92 4.86 5.76 5.74 13.49 7.26
East 4.62 4.55 6.04 5.87 18.65 10.73
South-East 4.90 4.82 5.59 5.56 13.34 7.10
South 3.45 3.40 4.08 4.07 10.31 5.70
South-West 4.90 4.82 5.65 5.57 15.55 6.98
West 4.56 4.50 5.85 5.74 17.93 10.34 North-West 5.14 5.08 5.79 5.79 13.55 7.28
The results of non-linear static push-over analyses of the platform indicated that, in general, the collapse
of the jacket structure was governed by the failure (buckling) of bracing elements in the space frame.
This conclusion is supported by the findings in (Skallerud and Amdahl, 2002). The behaviour of the jacket
subjected to static loads was typical of a space truss. As the structure reached its ultimate load, the
behaviour was dominated by axial forces in the braces. The initial response of the jacket was linear until
buckling of the first brace took place. This caused a significant instantaneous drop in the global load
carrying capacity. The drop was so dramatic that dynamic spring-back occurred, which was followed by
load redistribution between adjacent members and recovery of platform carrying capacity and stiffness.
On further increase of the loads, more braces buckled and similar spring-back occurred again. This
process continued until structure eventually reached its ultimate strength followed by complete failure.
The failure mode of the jacket depended on the direction of the applied environmental loads. When the
platform was subjected to an end-on loading, it underwent buckling failure of the horizontal and diagonal
braces within its supporting frame. Figure 6 illustrates the failure modes of braces in the jacket subjected
to the end-on West loading.

16
Figure 6. Mode of failure of flexible joint model with piled foundation subjected to end-on West loading. In the legend, ‘S’ stands for stress. The deformation scale factor of 50 was applied to the
models.
When the environmental loading was applied from a broadside direction, three front legs carried tension
forces, while only the back leg carried compression forces. Therefore, it was initially expected that that
buckling of the entire compression leg would occur before any other failure modes. However, the large
wall thickness of bottom section of jacket legs resulted in high axial stiffness of the compression leg,
while braces had smaller sections and buckled first. Figure 7 presents the failure modes for the
broadside South-West loading, where the highest deformations occurred in the compression leg and in
the compression braces of the middle-top bay.

17
Figure 7. Mode of failure of flexible joint model with piled foundation subjected to broadside South-West loading. In the legend, ‘S’ stands for stress. The deformation scale factor of 50 was applied to
the models.
The comparison of the load cases indicates that in the end-on load case (Figure 6), compression braces
failed by buckling in all three bottom bays, while in the broadside load case (Figure 7), the compression
braces buckled only in the middle-top bay of the frame. In both load cases, buckling failure occurred
first in the middle-top bay, where the stiff lower leg section connected to a less stiff upper leg section.
3.2. Effect of joint flexibility
The effect of joint flexibility introduced using the face-to-face approach was initially considered by
comparing the data in Tables 1 and 2. The results of the comparison are presented in Table 3 separately
for the models without and with piled foundation as percentile differences between the rigid and flexible
joint models in the first yield and maximum sustained loads and stiffness. For the model without piles,
the incorporation of flexible joints into the platform model led to the 10.69% reduction in the first yielding
load, the 12.37% reduction in the platform strength and the 13.6% reduction in the platform stiffness,
on average. As a result, the platform strength and stiffness were more sensitive to the effect of joint
flexibility, especially for loads in certain directions. The models with piled foundations were much less

18
sensitive to the flexibility of joints. The effect of joint flexibility was reduced by nearly 5 times, on average,
for the first yielding load and by 3 times for the strength and stiffness.
Table 3. Effect of joint flexibility of sustained load and stiffness of the platform under different load cases.
Load case
Difference between rigid and flexible joint models (%)
Models without piles Models with piles 1st yield
LPF Maximum
LPFStiffnes
s1st yield
LPFMaximum
LPF Stiffnes
sNorth 9.45 16.28 12.55 2.28 5.31 2.66North-East 11.83 10.49 15.23 3.76 4.28 5.44East 12.83 11.89 14.98 2.78 2.84 4.64South-East 11.39 12.01 16.38 3.79 4.40 5.35South 11.31 12.45 16.80 2.58 4.90 2.41South-West 10.58 11.71 0.00 2.03 3.96 5.49West 9.88 12.20 16.78 0.44 3.97 4.27North-West 8.21 11.98 16.03 0.39 3.52 3.61
Average = 10.69 12.37 13.60 2.26 4.15 4.23
For the three types of joints considered (i.e., rigid, flexible and hybrid), analyses were conducted using
fixed boundary conditions. The three platforms were loaded by the environmental loads in the most
critical South-West direction. Figure 8 shows the platforms at the moment of failure. The locations of
material yielding are highlighted in red. Note that Figure 8a and Figure 8b are rendered, showing jacket
member cross-sections to scale. The comparison of in the models with rigid and flexible joints showed
that yielding occurred in similar locations, however smaller yielding zones developed in the rigid joint
model (see Figure 8a and Figure 8b). Additional braces also yielded in the middle-top and top bays of
the jacket in the flexible joint model. This happened due to the braces in the rigid joint model being
shorter and therefore stiffer and able to transfer higher loads without yielding. In the hybrid model, the
second joint of the North-East shell leg from the seabed did not yield, while the yielding zone in the first
joint was much smaller than in the other two models (see Figure 8c). The comparison between the rigid
joint and hybrid models demonstrated that the brace connected to the North-East compression leg in
the middle-top bay of the hybrid model did not yield, but some other braces in the middle-top and top
bays yielded to a greater extent. In all models, the North-West and South-West legs yielded at the
supports, where the yielding zones were the largest in the hybrid model. The South-East leg yielded
only in the hybrid model. This behaviour indicates that the redistribution of loads from the North-East
shell leg to the other beam legs occurred in the hybrid jacket due to higher shell leg flexibility. The

19
comparison between the flexible joint and hybrid models suggests that these methods result in a
different response of the jacket to the applied loads.
(a) (b) (c)
Figure 8. Yielding in the jacket structure with (a) rigid, (b) flexible and (c) hybrid joints, subjected to broadside South-West loading.
Figure 9 shows the LPF vs. maximum global deformation in the jacket for the three considered models
(without piled foundation) loaded in the broadside South-West direction. The global deformation
represents the cumulative displacement of the whole jacket composed from the displacements of
individual components. The highest structural capacity was demonstrated by the rigid joint model. Both
the rigid and flexible joint models exhibited ductile behaviour, while the hybrid model behaved in a brittle
manner. All the models behaved in a similar way until the point of first yield. The flexible joint model
yielded at a LPF of 4.48 and the maximum jacket deformation of 0.29 m, while the rigid joint and hybrid
models yielded at a slightly higher LPF of 5.27 and a deformation of 0.35 m. The stiffness of all three
models was similar. As the load increased further, the analysed models responded in a non-linear
manner due to the formation of plastic hinges and buckling of braces, which resulted in the gradual
reduction of stiffness and load redistribution. The flexible joint model lost its stiffness faster than the
other two. The hybrid model failed by buckling of entire shell leg at a LPF of 5.68 and a maximum jacket
deformation of 0.42 m, after which a period of unloading occurred. The rigid joint model was able to
carry the maximum load of LPF equal to 6.40 with a corresponding deformation of 1.18 m. Further,
small reduction of the LPF occurred with the increase in the deformation but without a distinct limit point
as in the hybrid model case. The flexible joint model behaved similarly to the rigid joint model but
NE NW
SW NENW
SWNE
NW
SW

20
showed lower carrying capacity with the LPF reaching 5.65 at the deformation of 1.24 m. Therefore, the
incorporation of the flexible joints led to the 11.7% reduction in the structural strength of the platform.
Figure 9. LPF vs. maximum global deformation in the rigid joint, flexible joint and hybrid models subjected to broadside South-West loading
It is important to note that both the flexible joint and hybrid models demonstrated similar maximum load
carrying capacity. The hybrid model underwent much less deformation before failure than that the other
models. This brittle behaviour was the result of the jacket structural configuration. The compression leg
and connected joints were modelled using shell elements, which allowed capturing the accumulative
effects of localised yielding and localised shell buckling in both the leg and braces. As a result, the joints
were flexible and the compression leg was less restrained against global buckling. The analysis of the
curves in Figure 9 suggests that the rigid joint model could overestimate the strength of the jacket, while
both the rigid and flexible joint models could significantly overestimate the deformability of the jacket.
The latter conclusion is supported by the findings in (Mirtaheri, 2009).
The effect of joint flexibility on the shear force at the jacket base was also investigated. The base shear
force (𝑆𝐹) was calculated at the first yielding of the jacket for each load case using the following
expression:
𝑆𝐹 ∑𝑆𝐹 ∑𝑆𝐹 (3)

21
where ∑𝑆𝐹 is the sum of shear forces at the piled foundation in the X (or Y) direction. Since only the
base shear force generated by the environmental loading was of the interest, the values of the base
shear generated by the operational (dead, live and buoyancy) loads were disregarded. Table 4 presents
the maximum base shear forces for the rigid and flexible joint models with piled foundations subjected
to eight loading cases. As can be observed, the broadside loading cases resulted in higher base shear
force (by up to 22%) than the end-on loading cases in both types of models. Also, the base shear force
was higher (by up to 5%) in the rigid joint model than in the flexible joint model. The maximum base
shear force in the hybrid model loaded in the broadside South-West direction was 172.6 MN, which is
smaller than the maximum base shear force in the rigid joint by 17.6%.
Table 4. Maximum base shear force for rigid and flexible joint models with piled foundations.
Loading case
Base Shear Force (MN) Difference (%)
Rigid joint model Flexible joint model
North 175.34 167.23 4.6
North-East 210.96 202.46 4.0
East 189.53 184.70 2.5
South-East 208.11 199.60 4.1
South 173.87 165.69 4.7
South-West 209.49 201.43 3.8
West 190.73 184.08 3.5
North-West 211.81 204.08 3.6
3.3. Effect of piled foundation
The effect of piled foundation is initially considered by comparing the data in Tables 1 and 2. The results
of the comparison are presented in Table 5 separately for the rigid and flexible joint models as percentile
differences in the first yield and maximum sustained loads and stiffness. It is evident that the
incorporation of piled foundation into the rigid joint model resulted in the 9.82% reduction of the first
yielding load, the 9.8% reduction of the strength and the 51.67% reduction of the stiffness of the
platform, on average. As a result, the stiffness of the platform was most significantly affected by the
base movement and rotation introduced by the piles, especially in certain loading directions. The first
yielding load and strength of the flexible joint model were much less sensitive to the presence of the
piled foundation; however, the reduction of stiffness was still significant.
22
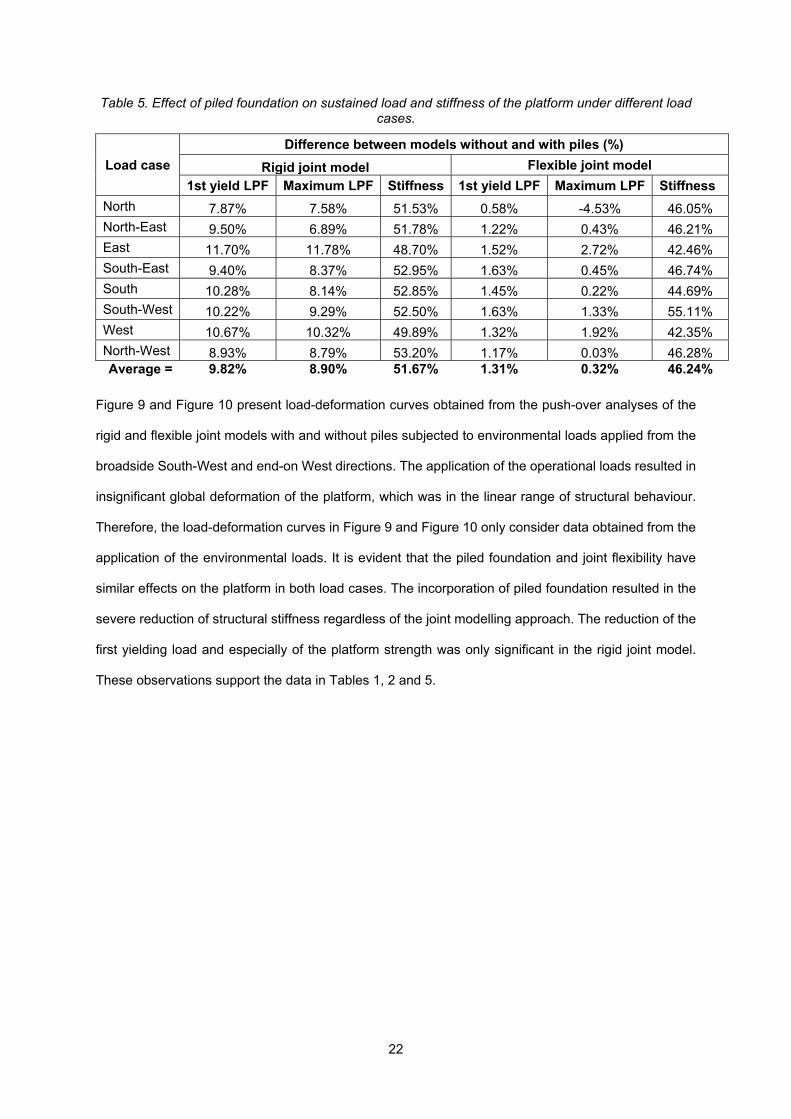
Table 5. Effect of piled foundation on sustained load and stiffness of the platform under different load cases.
Load case
Difference between models without and with piles (%)
Rigid joint model Flexible joint model
1st yield LPF Maximum LPF Stiffness 1st yield LPF Maximum LPF Stiffness
North 7.87% 7.58% 51.53% 0.58% -4.53% 46.05%North-East 9.50% 6.89% 51.78% 1.22% 0.43% 46.21%East 11.70% 11.78% 48.70% 1.52% 2.72% 42.46%South-East 9.40% 8.37% 52.95% 1.63% 0.45% 46.74%South 10.28% 8.14% 52.85% 1.45% 0.22% 44.69%South-West 10.22% 9.29% 52.50% 1.63% 1.33% 55.11%West 10.67% 10.32% 49.89% 1.32% 1.92% 42.35%North-West 8.93% 8.79% 53.20% 1.17% 0.03% 46.28%Average = 9.82% 8.90% 51.67% 1.31% 0.32% 46.24%
Figure 9 and Figure 10 present load-deformation curves obtained from the push-over analyses of the
rigid and flexible joint models with and without piles subjected to environmental loads applied from the
broadside South-West and end-on West directions. The application of the operational loads resulted in
insignificant global deformation of the platform, which was in the linear range of structural behaviour.
Therefore, the load-deformation curves in Figure 9 and Figure 10 only consider data obtained from the
application of the environmental loads. It is evident that the piled foundation and joint flexibility have
similar effects on the platform in both load cases. The incorporation of piled foundation resulted in the
severe reduction of structural stiffness regardless of the joint modelling approach. The reduction of the
first yielding load and especially of the platform strength was only significant in the rigid joint model.
These observations support the data in Tables 1, 2 and 5.

23
Figure 10. LPF vs. maximum global deformation in the rigid and flexible joint models with and without piled foundation subjected to end-on West loading
3.4. Effect of geometrical imperfections
The effect of geometrical imperfections was investigated by comparing models with imperfections
against models without imperfections (i.e., perfect model). The effect of joint flexibility was also
considered. Figure 11 demonstrates the deformed shapes of two platforms subjected to (a) end-on
South and (b) broadside South-West loadings with imperfections in compression legs, as shown in
Figure 5. The state captured in Figure 11 corresponds to the first converged increment after the
application of the environmental load. As can be observed in both cases, the geometrical imperfections
had the highest impact on the compression leg in the bottom bay, because this leg segment was long
(relative to the middle-top and top bay segments) and subjected to higher shear and compression forces
than the segments above. Bending of each compression leg caused rotation of joints, especially the
bottom one, and bending of connected braces and the supporting pile.
Figure 12 and Figure 13 present the load-deformation for the two models shown in Figure 5 and Figure
11. The models had piled foundations and rigid or flexible joints. As can be seen in the figures, the
imperfection introduced initial deformation in the jacket elements shifting the beginning of the load-
deformation curve. This phenomenon occurred because the imperfections contributed to the net
deformation of the jacket. The initial deformation in the platform with imperfections in both North legs

24
subjected to the end-on South loading (Figure 12) was 2.25 (= 0.173m / 0.077m) times larger than in
the platform with imperfection in the North-East leg subjected to the broadside South-West loading
(Figure 13). The initial deformation in all models with imperfections was recovered through smaller
deformation rate under loading, and the load-deformation curves joined with those of the models without
imperfections after the first yielding occurred and before the ultimate load was reached. The presence
of imperfections in compression legs did not affect the initial stiffness, the first yield load or the platform
strength. The platforms behaved in similar way regardless of the direction of loading and joint flexibility.
The imperfection-induced shift of the load-deformation curve was larger in the platforms subjected to
the end-on loading.
(a) (b)
Figure 11. Response of (a) platform with imperfections in both North legs subjected to end-on South loading and (b) platform with imperfection in North-East leg subjected to broadside South-West
loading. Both figures present the first converged increment after the application of environmental load. In the legend, ‘U’ stands for displacement. The deformation scale factor of 50 was applied to the
models.

25
Figure 12. LPF vs. maximum global deformation in the rigid and flexible joint models with piled foundation and without/with imperfections in both North legs subjected to end-on South loading.
Figure 13. LPF vs. maximum global deformation (maximum displacement in the jacket) in the rigid and flexible joint models with piled foundation and without/with imperfection in North-East leg
subjected to broadside South-West loading.
Table 6 presents the maximum base shear forces for the rigid and flexible joint models with piled
foundations and imperfections subjected to eight loading cases. The base shear forces were calculated
using Eq. (3). The maximum base shear forces in the broadside loading cases are much larger (up to
0
0.5
1
1.5
2
2.5
3
3.5
4
4.5
5
0 0.5 1 1.5 2 2.5
LPF
Global deformation (m)
Perfect; rigid joints
Perfect; flexible joints
Imperfections; rigid joints
Imperfections; flexible joints
0
1
2
3
4
5
6
7
0 0.5 1 1.5 2 2.5
LPF
Global deformation (m)
Perfect; rigid joints
Perfect; flexible joints
Imperfections; rigid joints
Imperfections; flexible joints

26
3.4 times in the rigid joint model and 3.8 times in the flexible joint model) than those in the end-on
loading cases. The joint flexibility reduced the shear forces in the broadside loading cases by up to
25.8%, while in the end-on loading cases by up to 7.2%. The comparison with the data in Table 4
indicates that the incorporation of imperfections into the platform legs increased the sensitivity of the
model to joint flexibility, especially in the case of end-on loading. Moreover, the imperfections reduced
the maximum base shear force in all loading cases, this is especially evident in the platforms subjected
to the end-on loading.
Table 6. Maximum base shear force for rigid and flexible joint models with piled foundations and imperfections.
Loading case
Base Shear Force (MN) Difference (%)
Rigid joint model Flexible joint model
North 46.62 39.53 15.2% North-East 155.68 144.50 7.2% East 56.08 41.61 25.8% South-East 154.65 145.00 6.2% South 46.70 39.65 15.1% South-West 155.72 146.25 6.1% West 58.63 44.22 24.6% North-West 157.18 148.28 5.7%
The models with imperfections failed in similar modes but at lower load levels than the models without
imperfections. This led to reduction of the maximum base shear force in the jacket, which are visually
summarised in the radar-type chart given in Figure 14. The data shown in this figure is taken from Table
4 and Table 6. The average reduction in the maximum base shear force in the rigid joint model subjected
to the end-on loading was equal to 71.6%, while in the broadside loading case only to 25.8%. In the
flexible joint model, the reduction of the maximum base shear force was slightly larger, rising to 76.5%
and 27.7%, respectively. It was identified in the computational simulations that the imperfections had
the highest impact on the bottom section of the critical compression leg. Therefore, the reduction of the
base shear force was larger in the end-on loading cases because of the development of compression
forces in two legs. The detrimental effect of imperfections was connected to the initial deformation of
piles (see Figure 5), which amplified the pile deformation induced by the environmental loading at a

27
later loading stage. Since flexible joints allowed for higher initial deformation of piles, the imperfections
had larger effect on the flexible joint model.
Figure 14. Maximum base shear force in the rigid and flexible joint models without/with imperfections subjected to end-on and broadside loading. The units in the chart are MN.
4. Conclusions
The paper analysed the effects of joint flexibility, piled foundations and geometrical imperfections on
the structural behaviour of a typical 4-legged X-braced jacket type offshore platform subjected to vertical
operational (gravity, buoyancy and service) and horizontal environmental (wind and wave) loads using
nonlinear finite element method. The environmental loads corresponded to the North Sea conditions
and were applied in 8 directions (4 end-on and 4 broadside). The obtained failure modes of the jacket
0
25
50
75
100
125
150
175
200
225N
NE
E
SE
SE
SW
W
NW
Perfect; rigid joints
Perfect; flexible joints
Imperfections; rigid joints
Imperfections; flexible joints
28
depended on the direction of the applied environmental loads and were governed by the failure
(buckling) of braces in the bay where the jacket legs had smaller cross-sections.
The incorporation of joint flexibility into the model affected the yielding and ultimate strength and
stiffness of the platform. Material yielding occurred in similar locations in the flexible and rigid joint
models, where the yielding zones were mostly larger in the former model. Modelling of the jacket
members using shell elements, as opposed to beam elements, enabled capturing localised yielding and
buckling of legs and braces, which made joints more flexible and led to reduced structural strength and
global deformability potential. Further to this, smaller shear forces developed at the base of the platform
with flexible joints. As a result, disregarding joint flexibility in modelling of offshore jacket platforms can
result in overestimation of platform strength, deformability and shear capacity.
The piled foundation had a severe degenerative effect on the stiffness of the platform because of the
base movement and rotation introduced by the piles. The extent of this effect depended on the direction
of loading. The platform yielding and ultimate strength were also affected but to a smaller degree. The
strength reduction was only significant in the rigid joint model.
The geometrical imperfections were introduced in the compression legs of the jacket. Each imperfect
leg was most severely affected in the most loaded segment in the bottom bay leading to the increased
rotation of the joints and bending of the leg, braces and the pile. The imperfections increased the initial
deformation of the jacket in the elastic range, while the effect on the strength and stiffness was
insignificant. The jacket with imperfections in compression legs suffered significant reduction in shear
capacity, especially when the environmental load was applied in the end-on directions. The
imperfections had slightly larger effect on the model with flexible joints because of higher deformability
of the structure.
In conclusion, the findings presented in this paper suggest that joint flexibility, piled foundations and
geometrical imperfections should be accounted for both in the design of new and when assessing
existing offshore jacket platforms, since disregarding these factors may lead to overly optimistic
predictions.

29
5. References
Abaqus Documentation, version 6.12, 2012. Hibbit, Karlsson and Sorensen, RI, USA.
Azadi, M.R.E., 1998. Analysis of static and dynamic pile-soil-jacket behaviour.
Bolt, H.M., 1995. Results from Large Scale Ultimate Strength Tests of K-Braced Jacket Frame
Structures. Annu. OFFSHORE Technol. Conf. 2, 797.
Bolt, H.M., Billington, C.J., Ward, J.K., Great Britain, Health and Safety Executive, Billington Osborne-
Moss Engineering Limited, 1996. A review of the ultimate strength of tubular framed structures. HSE
Books.
Bouwkamp, J., Hollings, J., Maison, B., Row, D., Offshore Technology Conference, 1980. Effects of
Joint Flexibility on the Response of Offshore Towers.
BS EN ISO 19902:2007: Fixed steel offshore structures.
Chandrasekaran, S., 2015. Dynamic Analysis and Design of Offshore Structures, Ocean Engineering
& Oceanography. Springer India.
Clauss, G., Lehmann, E., Östergaard, C., 1992. Offshore Structures: Volume I: Conceptual Design and
Hydromechanics. Springer-Verlag, London.
Dier, A.F., Hellan, O., ASME 2002 21st International Conference on Offshore Mechanics and Arctic
Engineering, 2002. A Non-Linear Tubular Joint Response Model for Pushover Analysis 627–634.
Dier, A.F., Lalani, M., 1998. New code formulations for tubular joint static strength. Tubul. Struct. -Int.
Symp.- 8, 107–116.
Douglas, J.F., 2011. Fluid mechanics. Prentice Hall, Harlow, England; New York.
Jusoh, I., Wolfram, 1996. Effects of marine growth and hydrodynamic loading on offshore structures.
Faculty of Mechanical Engineering, UTM.
Ersdal, G., 2005. Assessment of existing offshore structures for life extension. University of Stavanger.

30
Mendoza Espinosa, J., 2017. Evaluation of the Fatigue Resistance of Offshore Jacket Joints by
Numerical Approaches.
Gilbert, R.B., Chen, J.Y., Materek, B., Puskar, F., Verret, S., Carpenter, J., Young, A.G., Murff, J.D.,
2010. Analysis of Potential Conservatism in Foundation Design for Offshore Platform Assessment, in:
Offshore Technology Conference. Presented at the Offshore Technology Conference, Offshore
Technology Conference, Houston, Texas, USA. https://doi.org/10.4043/20861-MS
Hellan, Ø., 1995. Non-linear Pushover and cyclic analysis in ultimate limit state design and
reassessment of tubular steel offshore structures. Dept. Marine structures, Trondheim University.
Holmås, T., 1987. Implementation of tubular joint flexibility in global frame analysis (No. 87.1). The
Norwegian Institute of Technology.
Holmås, T., Remseth, S.N., Hals, T.E., Selskapet for industriell og teknisk forskning ved Norges
tekniske høgskole, 1987. Approximate flexibility modelling of tubular joints in marine structures. U.S.
Dept. of Commerce, National Technical Information Service, Springfield, VA.
Lancaster, J.F., 2000. Engineering catastrophes: causes and effects of major accidents. CRC Press ;
Abington Press, Boca Raton, FL; Cambridge.
Lloyd, J.R., Clawson, W.C., 1983. Reserve and Residual Strength of Pile Founded Offshore Platforms,
in: International Symposium, The Role of Design, Inspection, and Redundancy in Marine Structural
Reliability. pp. 157–196.
Mirtaheri, 2009. Effect of Joint Flexibility on Overall Behavior of Jacket Type Offshore Platforms. Am. J
Eng. Appl. Sci. Am. J. Eng. Appl. Sci. 2, 25–30.
Ueda, Y., Rashed, S., 1990. Modern Method of Ultimate Strength Analysis of Offshore Structures.
Welding Research Institute, Osaka University.
Mostafa, Y.E., El Naggar, M.H., 2004. Response of fixed offshore platforms to wave and current loading
including soil–structure interaction. Soil Dyn. Earthq. Eng. 24, 357–368.
https://doi.org/10.1016/j.soildyn.2003.11.008

31
Nelson, A., Great Britain, Health and Safety Executive, EQE (Firm), 2003. Technical performance
measures for North Sea jacket structures.
Norske Veritas, 1999. Ultiguide: best practice guidelines for use of non-linear analysis methods in
documentation of ultimate limit states for jacket type offshore structures. Det Norske Veritas, Hovik.
Background to a new static strength guidance for tubular joints in steel offshore structures., 1990.
Offshore Energy Technology Board.
Paté-Cornell, M.E., 1993. Learning from the Piper Alpha Accident: A Postmortem Analysis of Technical
and Organizational Factors. RISA Risk Anal. 13, 215–232.
Priyanka, 2009. Effect of Joint Flexibility on Overall Behavior of Jacket Type Offshore Platforms. Am.
J. Eng. Appl. Sci. Am. J. Eng. Appl. Sci. 2, 25–30.
Skallerud, B., Amdahl, J., 2002. Nonlinear analysis of offshore structures. Research Studies Press,
Baldock, Hertfordshire, England; Philadelphia, PA.
Stacey, A., Birkinshaw, M., Sharp, J.V., 2008. Life extension issues for ageing offshore installations, in:
Proceedings of OMAE2008. Presented at the 27th International Conference on Offshore Mechanics
and Arctic Engineering, Portugal.
The UK Oil and Gas Industry Association, 2017. Decommissioning Insight 2017.