Embed Size (px)
Citation preview

University of Dundee
DOCTOR OF PHILOSOPHY
Functional & Molecular Analysis of Bod1in Mitotic Chromosome Segregation
Schleicher, Katharina
Award date:2014
Link to publication
General rightsCopyright and moral rights for the publications made accessible in the public portal are retained by the authors and/or other copyright ownersand it is a condition of accessing publications that users recognise and abide by the legal requirements associated with these rights.
• Users may download and print one copy of any publication from the public portal for the purpose of private study or research. • You may not further distribute the material or use it for any profit-making activity or commercial gain • You may freely distribute the URL identifying the publication in the public portal
Take down policyIf you believe that this document breaches copyright please contact us providing details, and we will remove access to the work immediatelyand investigate your claim.
Download date: 07. Dec. 2021

University of Dundee
United Kingdom
College of Life Sciences
Functional&MolecularAnalysisofBod1inMitoticChromosomeSegregation
A Thesis Presented by
Katharina Schleicher
In Application for the Degree of
Doctor of Philosophy
September 2014
PhD Supervisor Prof. Jason R Swedlow FRSE Internal Examiner Prof. Tomoyuki U Tanaka FRSE External Examiner Prof. Susanne M A Lens

Abstract
i
Abstract
Preservation of genetic integrity during mitotic chromosome segregation requires the
attachment of sister chromatids to microtubules emanating from opposite poles of the mitotic
spindle. Successful mitosis and cell cycle progression critically depend on the achievement of
this attachment state, otherwise called amphitelic attachment or biorientation. Cells therefore
operate an error‐correcting system at the kinetochore, which is the main microtubule
attachment site on chromosomes. This system selectively removes incorrect attachments
while leaving amphitelic attachments unaltered. Error correction of microtubule attachments
heavily depends on integration of kinase‐phosphatase signalling. The data presented in this
thesis suggest that one mechanism of fine‐tuning this phospho‐regulation at the kinetochore is
the regulation of protein phosphatase 2A (PP2A) by the small kinetochore protein
Biorientation defective 1 (Bod1).
Bod1 is structurally related to Arpp‐19 and Ensa, two proteins that inhibit PP2A‐B55 to
facilitate mitotic entry. In contrast to Arpp‐19 and Ensa, Bod1 specifically interacts with PP2A‐
B56 isoforms as demonstrated using co‐immunoprecipitation in mitotic HeLa cells as well as in
vitro pull down with recombinant proteins. Moreover, Bod1 can inhibit PP2A activity in vitro
and the PP2A interaction domain in Bod1 is essential for its function in maintaining
biorientation. This establishes Bod1 as a new member of a class of small PP2A regulators,
comprising at least Bod1, Arpp‐19 and Ensa.
Mass spectrometry analysis of mitotic Bod1‐GFP immunoprecipitates revealed that Bod1 also
interacts with Hec1, an outer kinetochore protein that directly mediates kinetochore‐
microtubule attachment as part of the heterotetrameric Ndc80 complex. The interaction was
confirmed through co‐IP and in vitro pull down with purified Bod1 and Ndc80Bonsai, a
recombinant form of the Ndc80 complex. Bod1 localisation strictly depends on Hec1 and site‐
specific analysis of the N‐terminus of Hec1 revealed that Bod1 depletion reduces Hec1

Abstract
ii
phosphorylation, potentially increasing its microtubule binding affinity. This provides a
functional link between Bod1 kinetochore localisation, PP2A‐B56 activity and microtubule
attachment.
The data presented here support the growing evidence that PP2A plays a major role in error
correction, chromosome alignment and the successful completion of mitosis. Furthermore,
they reveal Bod1 as a regulator of PP2A function at the kinetochore.

Acknowledgements
iii
Acknowledgements
I would like to express my most sincere gratitude to Prof. Jason Swedlow for his support and
guidance throughout my PhD experience in his lab. Jason has been truly inspirational on my
way to becoming a scientist and I am thankful for the countless opportunities that I was given
to improve my own work and learn about the work of others.
I thank all members of the Swedlow lab for their help and friendship‐ especially Dr Iain Porter,
who let me in on the secrets of Bod and generously and continually shared his knowledge,
experience, and advice.
The findings presented in this thesis would not have been possible without the support of
Cancer Research UK and the people that value basic research.
I want to acknowledge the assistance from many colleagues at the College of Life Sciences in
Dundee: I would like to mention the invaluable advice I was given by my thesis committee,
Prof. Julian Blow, Prof. Dario Alessi, and Dr Jens Januschke; as well as the excellent technical
support by Dr Sara ten Have and Kelly Hodge in the GRE Proteomics Support Group, Dr
Rosemary Clarke from the Flow Cytometry Facility, and the staff at the Light Microscopy
Facility.
Last but not least I would like to thank my friends and family, above all my parents who have
been loving and encouraging all my life, whether I was close to home or far away.

Thesis declaration
iv
Thesisdeclaration
I hereby declare that the following thesis is based on the results of investigations conducted by
me, and that this thesis is of my own composition. Work other than my own is clearly indicated
in the text by reference to the relevant researchers or their publications. This thesis has not, in
whole or part, been previously accepted for a higher degree.
…………………………………………………………………
Katharina Schleicher
I certify that the work of which this thesis is a record was performed by Katharina Schleicher.
The conditions of the relevant Ordinance and Regulations have been fulfilled.
………………………………………………………………..
Prof. Jason R Swedlow

Table of Contents
v
TableofContents
Abstract ........................................................................................................................................... i
Acknowledgements ....................................................................................................................... iii
Thesis declaration ......................................................................................................................... iv
Table of Contents ........................................................................................................................... v
List of Figures ................................................................................................................................ 1
Chapter I .................................................................................................................................... 1
Chapter II ................................................................................................................................... 1
Chapter III .................................................................................................................................. 1
Chapter IV ................................................................................................................................. 2
Chapter V .................................................................................................................................. 2
Chapter VI ................................................................................................................................. 2
List of Tables ................................................................................................................................. 3
Abbreviations ................................................................................................................................ 4
Chapter I: Introduction ............................................................................................................... 12
The Cell Cycle .......................................................................................................................... 12
Mitosis ..................................................................................................................................... 12
The Mitotic Checkpoint ........................................................................................................... 15
The Kinetochore ...................................................................................................................... 15
The Kinetochore‐Microtubule Interface ................................................................................. 18
Stability of kinetochore‐microtubule interactions .............................................................. 18
Dynamics of kinetochore‐microtubule interactions ........................................................... 19
Microtubule attachment error correction .............................................................................. 22
Mechanisms of mitotic checkpoint silencing .......................................................................... 25
Phosphatases that antagonise Aurora B activity .................................................................... 26
Catalytic activity of protein phosphatase 2A (PP2A) .............................................................. 27
PP2A activity is regulated through subunit composition of the holoenzyme .................... 28
PP2A holocomplexes in mitosis .......................................................................................... 35
Bod1 is similar in sequence to the PP2A inhibitors Arpp‐19 and Ensa ................................... 38
Bod1 is a novel kinetochore protein required for biorientation ............................................ 41
Research Objectives of this Study ........................................................................................... 47
Chapter II: Materials and Methods ............................................................................................. 48
Molecular Biology ................................................................................................................... 48
Mutagenesis polymerase chain reaction (PCR) .................................................................. 48

Table of Contents
vi
Molecular cloning ............................................................................................................... 48
Transformation ................................................................................................................... 49
Agarose gel electrophoresis ................................................................................................ 49
Biochemistry ........................................................................................................................... 49
Bradford Protein Assay ....................................................................................................... 49
Immunoblotting .................................................................................................................. 50
GFP‐Trap Immunoprecipitation .......................................................................................... 50
B56α/δ antibody‐mediated Immunoprecipitation ............................................................. 51
Malachite Green Phosphatase Assay .................................................................................. 51
CDK1 Kinase assay ............................................................................................................... 52
PP2A protein expression and purification .......................................................................... 52
Bod1 expression and purification ....................................................................................... 53
Ndc80 Bonsai Expression and Purification .......................................................................... 53
PP2A single subunit binding assay ...................................................................................... 54
Recombinant PP2A holocomplex assembly ........................................................................ 54
Semi‐recombinant PP2A holocomplex assembly and PP2A‐Bod1 Pull Downs ................... 54
Ndc80‐Bod1 Pull Down Experiments .................................................................................. 55
Generation of Bod1 phospo‐peptide antibodies ................................................................ 56
Mass spectrometry ............................................................................................................. 59
Tissue Culture .......................................................................................................................... 62
Cell lines and cell culture .................................................................................................... 62
siRNA Rescue experiments ................................................................................................. 62
Imaging .................................................................................................................................... 63
Paraformaldehyde preparation .......................................................................................... 63
Immunofluorescence staining............................................................................................. 63
Deconvolution microscopy ................................................................................................. 63
Flow Cytometry ....................................................................................................................... 64
Data Analysis ........................................................................................................................... 64
Image Quantification .......................................................................................................... 64
Determination of minimum kinetochore size ..................................................................... 67
Measurement of centromere‐outer kinetochore distance ................................................ 67
Statistics .............................................................................................................................. 67
Bioinformatics and Software .............................................................................................. 67
Chemicals and reagents .......................................................................................................... 68
Buffers and solutions .............................................................................................................. 68

Table of Contents
vii
Antibodies ............................................................................................................................... 71
Chapter III ............................................................................................................................ 71
Chapter IV ........................................................................................................................... 71
Chapter V ............................................................................................................................ 72
Primers .................................................................................................................................... 73
Sequencing primers ............................................................................................................ 73
Cloning primers ................................................................................................................... 73
Mutagenesis primers .......................................................................................................... 74
siRNAs ..................................................................................................................................... 74
Chapter III: Bod1 binds to PP2A‐B56 and inhibits PP2A activity ................................................. 75
Results ..................................................................................................................................... 75
Bod1 interacts with a PP2A‐B56 holocomplex and inhibits its activity .............................. 75
Bod1 interaction with PP2A depends on a phospho‐motif that is conserved between
Bod1, Arpp‐19, and Ensa ..................................................................................................... 78
In vitro binding of Bod1 to the PP2A holocomplex is dependent on T95 phosphomimetic
mutation ............................................................................................................................. 85
Discussion................................................................................................................................ 96
Chapter IV: Bod1 phosphorylation at T95 specifically occurs in mitotic cells and is sensitive to
microtubule attachments ......................................................................................................... 101
Results ................................................................................................................................... 101
Purification of the Bod1 antibodies .................................................................................. 101
The T95 phospho‐antibodies have high specificity for the phosphorylated Bod1 peptide
.......................................................................................................................................... 102
The 573 antibody recognises GFP‐tagged Bod1 as well as endogenous Bod1 in
immunoblots ..................................................................................................................... 102
Sheep pan‐ and phospho‐specific Bod1 antibodies recognises Bod1 in
immunofluorescence ........................................................................................................ 105
Bod1 is phosphorylated at mitotic onset and gets dephosphorylated at the kinetochore in
metaphase ........................................................................................................................ 110
Inhibition of Cdk1 using the Inhibitor RO‐3306 substantially reduces Bod1
phosphorylation ................................................................................................................ 115
Phospho‐Bod1 is enriched on unattached kinetochores .................................................. 116
Discussion.............................................................................................................................. 122
Chapter V: Bod1 binds to Hec1 and regulates its phosphorylation at the kinetochore ........... 125
Results ................................................................................................................................... 125
PP2A‐B56 is not necessary to recruit Bod1 to the kinetochore ........................................ 125

Table of Contents
viii
Mass spectrometry experiment reveals numerous kinetochore proteins in complex with
Bod1 .................................................................................................................................. 128
Bod1 directly interacts with the Ndc80 complex .............................................................. 131
Bod1 preferably binds to the microtubule‐binding Hec1‐Nuf2 dimer ............................. 141
Bod1‐depletion reduces Hec1 phosphorylation on Ser55 at the kinetochore ................. 141
Hec1 is required for proper Bod1 localisation .................................................................. 147
Bod1 domain analysis of Ndc80 binding ........................................................................... 152
Discussion.............................................................................................................................. 158
Chapter VI: Discussion and Future Directions .......................................................................... 164
Bod1 can fine‐tune kinetochore phosphorylation by regulating PP2A‐B56 ......................... 164
Bod1 regulates multiple phospho‐epitopes at the kinetochore ........................................... 165
Bod1’s regulatory activity is an early mitotic event .............................................................. 167
Bod1 depletion compromises error correction mechanisms ............................................... 168
Bod1‐depleted cells can establish end‐on attachments ................................................... 170
Bod1‐depleted cells are unable to correct syntelic attachments ..................................... 171
Conclusion ............................................................................................................................. 174
References ................................................................................................................................ 177

List of Figures
1
ListofFigures
ChapterIFigure 1. 1 The Cell Cycle ............................................................................................................ 14
Figure 1. 2 The Kinetochore ........................................................................................................ 17
Figure 1. 3 Attachment states of chromosomes in prometaphase ............................................ 21
Figure 1. 4 Spatial separation model of biorientation ................................................................ 24
Figure 1. 5 Structure of a PP2A‐B56 Holoenzyme ....................................................................... 30
Figure 1. 6 Structural variations of PP2A containing different B subunits ................................. 32
Figure 1. 7 Regulation of PP2A‐B55 during mitotic entry ........................................................... 36
Figure 1. 8 Bod1 has similar biochemical properties to Arpp19 and Ensa ................................. 39
Figure 1. 9 Bod1 is a novel kinetochore protein that is required for chromosome biorientation
.................................................................................................................................................... 42
Figure 1. 10 Bod1 depletion can be partially rescued by expression of siRNA resistant Bod1‐GFP
.................................................................................................................................................... 44
Figure 1. 11 Bod1 depletion causes loss of phosphoepitopes at the kinetochore ..................... 46
ChapterIIFigure 2. 1 Surface accessibility plot for the selected Bod1 T95 peptide ................................... 56
Figure 2. 2 Mass Spectromerty experiment to find Bod1 interaction partners at the kinetochore
.................................................................................................................................................... 60
Figure 2. 3 Determination of parameters for quantitative image analysis................................. 65
ChapterIIIFigure 3. 1 Bod1 interacts with PP2A‐B56 in mitotic HeLa cells ................................................. 76
Figure 3. 2 Bod1 inhibits PP2A activity ....................................................................................... 79
Figure 3. 3 T95 and D98 are critical for Bod1 Function in biorientation and its interaction with
PP2A‐B56 ..................................................................................................................................... 82
Figure 3. 4 The STHLD domain in Bod1 can be phosphorylated by Cdk1 in VITRO .................... 83
Figure 3. 5 Bod1 does not interact specifically with purified single PP2A subunits in vitro ....... 86
Figure 3. 6 A stoichiometric mix of purified PP2A subunits and Bod1‐GST does not form a
complex in vitro ........................................................................................................................... 88
Figure 3. 7 Bod1(T95E) binds to a semi‐recombinant PP2A Holocomplex in Vitro .................... 92
Figure 3. 8 Bod1(T95E) reduced Activity of in vitro assembled PP2A ......................................... 94
Figure 3. 9 Regulation of PP2A‐B56 at the kinetochore ............................................................. 97

List of Figures
2
ChapterIVFigure 4. 1 Bod1 peptides and overexpressed Bod1 are detected by all T95 antibodies in
Immunoblots ............................................................................................................................. 103
Figure 4. 2 Endogenous Bod1 in HeLa cell lysates is detected by some of the sheep Bod1
antibodies in immunoblots ....................................................................................................... 106
Figure 4. 3 Endogenous Bod1 protein is detected by some of the sheep Bod1 antibodies in
immunofluorescence microscopy ............................................................................................. 108
Figure 4. 4 Depletion of Bod1 ablates the signal of two Antibodies at the kinetochores ........ 111
Figure 4. 5 Cell cycle profile of T95 Phosphorylation ................................................................ 113
Figure 4. 6 Inhibition of CDK1 depletes Bod1 from kinetochores ............................................ 118
Figure 4. 7 Preliminary Data indicates that T95 phosphorylation is highest at unattached
kinetochores ............................................................................................................................. 120
ChapterVFigure 5. 1 PP2A‐B56 is not necessary to recruit Bod1 to the kinetochore .............................. 126
Figure 5. 2 Kinetochore proteins in the Bod1 interaction network .......................................... 129
Figure 5. 3 Bod1interacts directly with the Ndc80 complex ..................................................... 138
Figure 5. 4 Bod1 preferentially binds the Nuf2/Hec1 heterodimer .......................................... 142
Figure 5. 5 Bod1 depletion causes Hypophosphorylation of Hec1 at the kinetochore ............ 145
Figure 5. 6 Hec1 is necessary for Bod1 recruitment to the kinetochore .................................. 148
Figure 5. 7 Fragments and mutations for a domain analysis of Bod1 ...................................... 154
Figure 5. 8 Preliminary results for in vitro binding studies of Bod1 C‐ and N‐terminal fragments
with Ndc80Bonsai ......................................................................................................................... 156
Figure 5. 9 Line profile of a pair of sister Kinetochores ............................................................ 160
Figure 5. 10 Crystal structure of Ndc80Bonsai ............................................................................. 161
ChapterVIFigure 6. 1 Different causes for chromosome alignment defects in vertebrate cells............... 169

List of Tables
3
ListofTables
Table 1. 1 Human PP2A Subunits and their orthologues ............................................................ 34
Table 2. 1 Immunisation schedule for antibody generation in sheep ........................................ 57
Table 5. 1 PP2A subunits found in Bod1‐GFP IPs ...................................................................... 128
Table 5. 2 Kinetochore Proteins found enriched in Bod1‐GFP IPs by mass spectrometry ....... 132

Abbreviations
4
Abbreviations
(‐) end Slow growing end of a microtubule, exposing the α‐tubulin monomer
(+) end Fast growing end of a microtubule, exposing the β‐tubulin monomer
A A Alanine
A.U. Arbitrary units
AbDil Antibody dilution
ACA Anti‐centromere antigen
Ana Anaphase
APC/C Anaphase promoting complex/cyclosome
Arpp‐19 cAMP‐regulated phosphoprotein of 19kD
ATM Ataxia telangiectasia mutated, serine/threonine protein kinase
ATP Adenosine triphosphate
AuB Aurora B kinase
B Bis‐Tris Bis(2‐hydroxyethyl)‐amino‐tris(hydroxymethyl)‐methane
BL21 Escherichia coli strain BL21‐DE3
BO Bod1 only
Bod1 Biorientation defective 1
BSA Bovine serum albumin
Bub1 Budding uninhibited by benzimidazoles 1
Bub3 Budding uninhibited by benzimidazoles 3
BubR1 Budding uninhibited by benzimidazole‐related 1
C C. elegans Caenorhabditis elegans
CASC5 (Knl1) Cancer susceptibility candidate gene 5
CBB Coomassie Brilliant Blue
CCAN Constitutive centromere associated network
CCD Charge coupled device
cdc14 Cell‐division cycle protein 14

Abbreviations
5
Cdc20 Cell‐division cycle protein 20
cdc25 Cell‐division cycle protein 25
cdc55 Cell‐division cycle protein 55
Cdk Cyclin‐dependent kinase
Cdk1 Cyclin‐dependent kinase 1
CENPA‐W Centromere protein A‐W
CH domain Calponin homology domain
chTOG Colonic and hepatic tumor overexpressed gene
CIP2A Cancerous Inhibitor of PP2A
CK Cytokinesis
CLASP Cytoplasmic linker associated protein
CLIP‐170 Cytoplasmic linker protein of 170kD
COMPASS Complex of proteins associated with Set1p
CPC Chromosomal passenger complex
CRTL Control
CSK Cytoskeleton
D D Aspartate
Dam1 DUO1 and MPS1‐interacting protein 1
DAPI 4',6‐Diamidino‐2‐phenylindole
∆CMV Attenuated cytomegalovirus promoter
DH5α Escherichia coli strain DH5α
DMP Dimethyl pimelimidate
DMSO Dimethyl sulfoxide
DNA Deoxyribonucleic acid
dNTP Deoxyribonucleotide triphosphate
Drosophila Drosphila melanogaster
Dsn1 Dosage suppressor of NNF1 1
DTT Dithiothreitol

Abbreviations
6
E E Glutamate
E. coli Escherichia coli
EA Ethanolamine
EB1 End‐binding protein 1
ECL Enhanced chemiluminescent HRP substrate
EDTA Ethylenediaminetetraacetic acid
Eg5 Kinesin‐related motor protein Eg5
EGTA Ethylene glycol tetraacetic acid
EMEM Eagle's minimal essential medium
Ensa α‐Endosulfine
Exp Experiment
F FBS Fetal bovine serum
FDR False discovery rate
FL Full length
Flp Flippase
FRET Förster resonance energy transfer
FRT Flp recombination target
Fzy Fizzy
G G1 phase Gap1 phase
G2 phase Gap2 phase
GFP Green fluorescent protein
GRK G protein‐coupled receptor kinase
GRR Glycine rich region
GST Glutathione S‐transferase
Gwl Greatwall kinase
H H3 Histone‐variant H3
HEAT Huntington‐elongation‐A subunit‐TOR
Hec1 Highly Expressed in Cancer 1

Abbreviations
7
HeLa ‘Henrietta Lacks’ human cervical adenocarcinoma cells
HEPES 4‐(2‐Hydroxyethyl)‐1‐piperazineethanesulfonic acid
HPLC High‐performance liquid chromatography
HRP Horseradish peroxidase
I I Isoleucine
I2PP2A Inhibitor 2 of protein phosphatase 2A
IAA‐NHS Iodoacetic acid N‐hydroxysuccinimide
IF Immunofluorescence
IgG Immunoglobulin G
INCENP Inner centromere protein
Int Intensity
Inter Interphase
IP Immunoprecipitation
IPTG Isopropyl β‐D‐1‐thiogalactopyranoside
K K Lysine
KCh Kinetochore
Kid Kinesin‐like DNA‐binding protein
KLH Keyhole limpet hemocyanin
KMN network KNL1, Mis12, and Ndc80 containing protein network
Knl1 Kinetochore‐null protein 1
L L Leucine
LB Luria‐Bertani liquid medium
M M Metaphase
M phase Mitosis
Mad1 Mitotic arrest deficient protein 1
Mad2 Mitotic arrest deficient protein 2
MBP Maltose‐Binding Protein
MCAK Mitotic centromere‐associated kinesin

Abbreviations
8
MCC Mitotic checkpoint complex
MG132 Cell‐permeable proteasome inhibitor
Mis12 Minichromosome instability protein 12
Mlf1 (PBIP) Myeloid leukemia factor 1
MOPS 3‐(N‐Morpholino) propanesulfonic acid
Mps1 Monopolar spindle 1
MS Mass spectrometry
Mtw1 Mis12 (Mis twelve) like protein 1
myt1 Membrane‐associated tyrosine‐ and threonine‐specific cdc2‐inhibitory
kinase
N N Asparagine
NA Not assessed
Ndc80 Nuclear division cycle protein 80
nf Not found
Nnf1 Necessary for nuclear function 1
Noc Nocodazole
NP40 Nonyl phenoxypolyethoxylethanol
NPC Nuclear pore complex
ns Not significant
Nsl1 Kinetochore‐associated protein NSL1 homolog
Nuf2 Nuclear filamentous protein 2
O OA Ocadaic acid
OD Optical density
P pa Pre‐assembly
PAGE Polyacrylamide gel electrophoresis
PBIP1 (CENPU) Polo‐box‐interacting protein 1
PBS Phosphate‐buffered saline
PCR Polymerase chain reaction

Abbreviations
9
PD Pull down
PDB Protein Data Bank
PEP Posterior error probability
PFA Paraformaldehyde
Pfu Pyrococcus furiosus
PIPES Piperazine‐N,N′‐bis(2‐ethanesulfonic acid)
PKC Protein kinase C
Plk1 Polo‐like kinase 1
PM Prometaphase
PP Phosphatase
PP1 Protein phosphatase 1
PP2A Protein phosphatase 2A
Pro Prophase
PRR Proline rich region
R R Arginine
RNA Ribonucleic acid
RO‐3306 Selective CDK1 inhibitor
Rod Rough deal protein
ROI Region of interest
RSK Ribosomal s6 kinase
RWD domain RING finger, WD repeat containing protein, DEAD‐like helicases
RZZ Rod‐Zw10‐Zwilch
S S phase Synthesis phase of the cell cycle
S, Ser Serine
S.O.C. Super Optimal broth with Catabolite Repression
SAC Spindle assembly checkpoint
SDS Sodiumdocecyl sulfate
SET I2PP2A

Abbreviations
10
siR siRNA resistant
siRNA Small interfering RNA
Ska Spindle and kinetochore‐associated protein
Spc24 Spindle pole component 24
Spc25 Spindle pole component 25
STLC S‐Trityl‐L‐cysteine
STRING Search Tool for the Retrieval of Interacting Genes/Proteins
SV40t Simian vacuolating virus 40 small t antigen
SVM Support vector machine
T T, Thr Threonine
TADB Tris assay dilution buffer
TAE Tris‐acetate‐EDTA buffer
Tax Taxol
TBS Tris‐buffered saline
TEA Triethanolamine
TEV Tobacco Etch Virus
TFA Trifluoroacetic acid
TOR Target of Rapamycin
Tpx2 Targeting protein for Xklp2
Tris Tris(hydroxymethyl)aminomethane
TTF Transiently transfected
U Ub Ubiquitinylation site
UV Ultraviolet
V V Valine
W WB Western blot
wee1 Wee1‐like protein kinase
WT Wild type
X Xenopus Xenopus laevis

Abbreviations
11
Z Z stack Stack of sequential images taken at different focus distances
ZW10 Zeste‐white 10
Zwilch Zwilch kinetochore protein

Chapter I: Introduction
12
ChapterI:Introduction
TheCellCycle
Dividing cells duplicate all their cellular components ‐ from lipid membranes and cytoplasmic
content to organelles and genetic information ‐ before they separate into two genetically
identical daughter cells at the end of mitosis. These processes are coordinated in a succession
of molecular events that form the cell cycle. Molecular checkpoints ensure that the synthesis
of organelles and DNA is completed without errors at the end of interphase, before the
separation of the cellular material is accomplished in mitosis. Cells preparing for division in
interphase and cells in mitosis can be easily distinguished at a cytological level based on
different morphologies of their cytoskeleton and chromatin (Figure 1. 1). The basic cell cycle
consists of a period of DNA replication in the synthesis (S) phase followed by mitosis (M).
However, in most cells the extent of interphase is not limited to S phase. Instead, S phase is
preceded and followed by gap phases (G1 and G2), allowing more time for protein synthesis,
organelle duplication and quality control before mitotic entry (Cross et al., 1989).
Mitosis
Different solutions to the problem of accurate genome segregation have emerged during the
course of evolution, including open (vertebrates), fully closed (budding yeast) or semi‐closed
(nematodes) mitosis (Drechsler and McAinsh, 2012). All of these solutions have in common
that the two DNA strands that form in S phase as products of semi‐conservative replication
condense into mitotic chromosomes. Compaction of the two genetically identical strands,
which are referred to as sister chromatids, is essential for their separation in later steps of
mitosis and enhances their individual mobility in the cytoplasm. Figure 1. 1 illustrates why this
is necessary: The arrangement of the sister chromatids changes multiple times over the course
of mitosis, reflected in different morphologies of mitotic DNA that serves as a visual marker of
the different mitotic stages.

Chapter I: Introduction
13
The stages of a typical vertebrate mitosis are described below and in Figure 1. 1:
Chromosomes begin to condense in prophase, and concomitantly the mitotic spindle
apparatus starts to form. The microtubule cytoskeleton rearranges to form the spindle fibres;
and centrosomes, organelles which later form the spindle poles, begin to separate to opposing
sides of the cell. The next stage, prometaphase, is marked by the breakdown of the nuclear
envelope in vertebrate cells. This event coined the term ‘open mitosis’, as all nuclear content,
including the chromosomes, is now exposed to the rest of the cytoplasm. This enables the
spindle microtubules to make contact with chromosomes. Load‐bearing microtubule
attachments are only formed in a region of the chromosome called the centromere. Initial
contacts between centromeres and microtubules involve the lateral surface of spindle
microtubules (Rieder and Alexander, 1990), but during the course of prometaphase these
lateral attachments are converted to an end‐on conformation (Dong et al., 2007; VandenBeldt
et al., 2006). In HeLa cells, the early lateral interactions help to rearrange prometaphase
chromosomes into a characteristic horseshoe shape, positioning the chromosomes to favour
amphitelic attachment (Magidson et al., 2011). This describes an attachment state in which the
centromeres are connected to microtubules emanating from opposite poles. The process of
achieving amphitelic attachment is referred to as biorientation. Metaphase is defined by the
alignment of all chromosomes on the central plane between the two spindle poles, called
equatorial plane or metaphase plate. During metaphase, chromosomes perform a series of low
amplitude oscillations while a control mechanism is operated to verify that two fundamental
prerequisites for successful chromosome segregation are fulfilled: the sister kinetochores are
attached to microtubules and this attachment conforms to a bioriented state (Musacchio and
Salmon, 2007). Only if this is achieved do the cells proceed into anaphase, where the
connection between the two sisters is severed and they start to move towards opposing poles.
Cell division is completed at cytokinesis, when the nuclear envelope re‐forms around each
bundle of separated DNA and the cytoplasm is divided into two by the cytokinetic furrow.

Chapter I: Introduction
14
FIGURE1.1THECELLCYCLE
The cell cycle consists of interphase (green) where proteins, organelles, and DNA are replicated to
eventually divide the cell into genetically identical daughters in mitosis (grey and red). Green arrows
indicate the direction of the cycle. In the middle of the cycle is a human interphase cell stained by
immunofluorescence for DNA (grey), the centromere (blue) and the interphase tubulin cytoskeleton
(green). The top panel represents morphologically distinct mitotic stages of the same cell type,
illustrating prominent changes in the DNA (grey), arrangement of centromeres (blue) and the mitotic
tubulin cytoskeleton (red).

Chapter I: Introduction
15
TheMitoticCheckpoint
Correct attachment of mitotic chromosomes to the spindle is vitally important for successful
mitosis as it is the basis for sister chromatids moving to opposing poles. Before they are
separated in anaphase, sister chromatids are held together at their centromeres by a ring‐
shaped protein complex called cohesin (Peters et al., 2008). Cohesin is the substrate of a
protease called separase. Before anaphase onset, this protease is inhibited by its
stoichiometric inhibitor securin. When the cell is ready to proceed from metaphase to
anaphase, securin is ubiquitinylated by an ubiquitin ligase called the anaphase promoting
complex/cyclosome (APC/C), targeting it for degradation by the proteasome. The requirement
to relieve separase inhibition in order to physically separate the sister chromatids in anaphase,
provides the basis for an intra‐mitotic checkpoint: mitotic progression would come to a natural
halt unless the APC/C is activated. The major effector of this spindle assembly checkpoint (SAC)
is the mitotic checkpoint complex (MCC). The MCC consists of the checkpoint proteins Mad2,
BubR1, and Bub3 forming a complex with Cdc20, which by itself acts as a cofactor for the
APC/C (Musacchio, 2011; Musacchio and Salmon, 2007). However, Cdc20 complexed with the
other MCC components helps to disrupt substrate binding of the APC/C (Chao et al., 2012). The
checkpoint proteins concentrate at the microtubule attachment site that is assembled on the
centromere of each sister chromatid, called the kinetochore.
TheKinetochore
The kinetochore is a complex multi‐protein assembly on centromeric heterochromatin
consisting of 197 proteins in human cells (Tipton et al., 2012). These include approximately 30
structural components and a plethora of associated regulatory components such as the
checkpoint proteins (Musacchio, 2011). Just as different mechanisms evolved for nuclear
division, kinetochore structures diverge among various biological phyla. In budding yeast, the
kinetochore comprises the attachment site for one single microtubule. Other organisms,
including vertebrates, bind multiple microtubules per kinetochore. This is accompanied by an

Chapter I: Introduction
16
expansion of the centromeric region on which the kinetochore is built (Santaguida and
Musacchio, 2009).
Ultrastructural studies of chemically fixed cells describe the unattached vertebrate
kinetochore as a trilaminar structure bordered by a fibrous corona (Figure 1. 2 A). The three
layers visible in thin section transmission electron microscopy are two electron dense zones,
referred to as inner and outer plate, divided by a more translucent central layer (Rieder, 2005).
Electron tomography reconstruction of these layers revealed that the outer plate actually
consists of a fibrous network that can envelope microtubules (Dong et al., 2007). This network
is the result of a hierarchical build‐up of structural kinetochore proteins during the course of
the cell cycle (Figure 1. 2 B, reviewed in : (Cheeseman and Desai, 2008)). Several structural
components of the inner kinetochore are constitutively associated with the centromere,
irrespective of cell cycle stage. These are the centromere‐specific histone variant CENPA, as
well as the centromeric satellite DNA‐binding protein CENPB and a protein network of 14
CENP‐proteins that tightly interacts with CENPA, called the constitutive centromere associated
network (CCAN). Recruitment of outer kinetochore components to the CCAN commences in
late G2. The early interactors include the Mis12 complex and Knl1. In prophase, the
microtubule binding protein complex Ndc80, regulatory proteins such as the chromosomal
passenger complex (CPC), polo‐like kinase (Plk1), and mitotic centromere‐associated kinesin
(MCAK); as well as some checkpoint proteins including Bub1, Bub3, and BubR1 bind to the
kinetochore platform. This completes the assembly of the structural components of the outer
plate and begins to accumulate the regulatory kinetochore‐associated proteins that build the
fibrous corona. Nuclear envelope breakdown allows for binding of the remaining checkpoint
proteins, Mad1, Mad2, and the RZZ (Rod‐ZW10‐Zwilch) complex; as well as other parts of the
corona such as dynein, CENPE and nuclear pore complex proteins (NPC).

Chapter I: Introduction
17
FIGURE1.2THEKINETOCHORE
(A) Thin section transmission electron micrograph of an unattached vertebrate kinetochore generated
by conventional chemical fixation procedures. The lack of mictrotubule attachment highlights the
extensive fibrous corona (1) and the trilaminar morphology of the kinetochore consisting of the outer
plate (2), the central kinetochore (2) and the inner plate (3) is clearly visible. (Adapted from: CL Rieder,
2005)
(B) Cartoon of an attached kinetochore illustrating some of the best characterised constituents of the
vertebrate kinetochore, and their localisation within corona, outer‐ and inner plate. Structural
components depicted here and described in the text include the CCAN complex, the Mis12 and Ndc80
complexes, and Knl1. Regulatory proteins are the chromosomal passenger complex (Aurora B, INCENP,
Borealin, Survivin); the mitotic kinases Plk1 and Mps1; the checkpoint proteins Cdc20, Bub1, Bub3,
BubR1, Mad1, Mad2, and the RZZ complex; and other regulatory factors including MCAK, dynein and the
Ska complex.

Chapter I: Introduction
18
TheKinetochore‐MicrotubuleInterface
There are several structural kinetochore proteins that directly contact the spindle
microtubules to mediate attachment. These attachment sites need to facilitate chromosome
movement in mitosis and therefore need to be highly adaptable in their properties: Once
correct attachments are formed in prometaphase, they have to persist until the end of
anaphase. This requires a certain degree of stability of the kinetochore‐microtubule
attachment sites. At the same time, attachments also have to be sufficiently dynamic to allow
for the resolution of incorrect microtubule attachments when they occur, as well as to track
the microtubule ends when the sister chromatids are separated in anaphase (Tanaka and
Desai, 2008).
Stabilityofkinetochore‐microtubuleinteractions
From yeast to mammals, an outer kinetochore complex called the KMN network was
demonstrated to constitute the primary microtubule attachment site in various experimental
systems. In this supracomplex, the protein Knl1 is associated with the tetrameric Mis12/Mtw1
(Mtw1/Mis12, Dsn1, Nsl1, Nnf1) and Ndc80 (Ndc80/Hec1, Nuf2, Spc24, Spc25) subcomplexes
to form the KMN network (the eponymous proteins are underlined in the text).
Mutation of Ndc80 and Mtw1 complex components in yeast or injection of Hec1‐binding
antibodies in mammalian cells renders the kinetochore significantly less capable to capture
microtubules and maintain attachment (DeLuca et al., 2006; Tanaka et al., 2005). Direct
interactions with microtubules have been shown for Knl1 and the Ndc80 complex, but not the
Mis12 complex, using reconstituted proteins in biochemical binding assays, cryo‐electron
microscopy, or protein crystallography (Alushin et al., 2010; Cheeseman et al., 2006; Ciferri et
al., 2008; Welburn et al., 2010). Recombinantly expressed C. elegans Ndc80 complexes can
bind along the entire lattice of stabilised microtubules as shown by electron microscopy
(Cheeseman et al., 2006). Interestingly, these experiments with recombinant Ndc80 complexes
revealed that their ability to bind microtubules was noticeably dependent on Ndc80

Chapter I: Introduction
19
concentration. A Scatchard plot of Ndc80 ligand binding to microtubules is not linear with a
negative slope as would be expected for a simple binding site. Instead, it shows an increasing
concave down shape, indicative of positive allosteric effects (Cheeseman et al., 2006; Umbreit
et al., 2012). Moreover, the full KMN network displays a higher microtubule association rate
than the Ndc80 complex by itself. Approximately 7‐20 Ndc80 complexes localise to the
microtubule attachment site in budding yeast (DeLuca and Musacchio, 2012). The number of
Ndc80 complexes per kinetochore thus exceeds the number of kinetochore microtubules in
this organism 7‐20‐fold. It was therefore proposed that the relatively weak microtubule
binding affinity of single Ndc80 complexes is amplified by cooperative binding of an array of
these low‐affinity binding sites within the kinetochore (Cheeseman et al., 2006; Tanaka and
Desai, 2008; Zaytsev et al., 2014).
Dynamicsofkinetochore‐microtubuleinteractions
Interactiondynamicsthatallowforerror‐correction
Reconstruction of cryo‐electron microscopy data collected from Ndc80 bound to microtubules,
identified microtubule binding sites in the Ndc80 globular region (Alushin et al., 2010). These
binding sites co‐incide with basic patches found in the Ndc80 crystal structure which are
important for microtubule binding in vitro (Ciferri et al., 2008). The complementary Ndc80
binding domain on microtubules is highly negatively charged (DeLuca and Musacchio, 2012).
This indicates that attachment probably involves electrostatic interactions between
kinetochore and microtubule. In agreement with this hypothesis, phosphorylation of the
Ndc80 complex can significantly alter its binding to microtubules (Welburn et al., 2010) and its
ability to sustain end‐on microtubule attachment in vivo (Guimaraes et al., 2008).
This is important, because incorrect attachments that do not conform to a bioriented state
may occur as by‐products of the initial microtubule capture process in prometaphase.
Reversible phosphorylation of microtubule attachment sites provides a mechanism to resolve
such attachment errors. According to the search‐and‐capture model of initial kinetochore‐

Chapter I: Introduction
20
microtubule interactions, the attachment of sister kinetochores to spindle microtubules in
early prometaphase occurs in a stochastic manner (Hayden et al., 1990; Kirschner and
Mitchison, 1986). This leaves room for generation of different attachment conformations
(Figure 1. 3). Due to steric reasons, intact chromosomes are mostly biased towards the
bioriented state (Indjeian and Murray, 2007; Loncarek et al., 2007; Magidson et al., 2011), but
merotelic and syntelic attachments do occur (Ault and Rieder, 1992). These attachments need
to be selectively destabilised before a cell progresses to anaphase. Otherwise, sister
chromatids could persist on the metaphase plate (merotelic attachment) or co‐segregate into
the same daughter cell (syntelic attachment). Both cases would lead to aneuploidy which can
have deleterious effects ranging from cell death to transformation (Gordon et al., 2012).
Modulating the interaction dynamics of kinetochores and microtubules by phosphorylation is
thought to be an important prerequisite for error‐correction mechanisms (Andrews et al.,
2004; Foley and Kapoor, 2013; Fuller et al., 2008; Funabiki and Wynne, 2013; Welburn et al.,
2010).
Dynamicsallowingmicrotubuletrackinginanaphase
In anaphase, kinetochore microtubules shorten by depolymerisation and a majority of this
depolymerisation takes place at the more dynamic (+) end which is associated with the
kinetochore (Mitchison and Salmon, 1992). Microtubules are polarised filaments of tubulin
dimers (Margolis and Wilson, 1978). In the mitotic spindle, their relatively stable (‐) end is
embedded in the spindle poles and their more dynamic (+) end is involved in end‐on
chromosome attachments at the kinetochores (Mitchison, 1989). The dynamic properties of
microtubule (+) ends can result in different structural conformations, including a straight
lattice in polymerising microtubules and a curving lattice at the frayed ends of depolymerising
microtubules (VandenBeldt et al., 2006). Despite such profound structural rearrangements
upon onset of depolymerisation, chromatids do not fall off the microtubule ends at anaphase.
On the contrary, they stay associated with and track the depolymerising microtubule plus ends

Chapter I: Introduction
21
FIGURE1.3ATTACHMENTSTATESOFCHROMOSOMESINPROMETAPHASE
Spindle microtubules can contact mitotic kinetochores in different conformations. The desired state of
attachment is biorientation, with the sister kinetochores attached to microtubules emanating from
opposite poles (top panel). Other attachments states can be found in prometaphase cells, but need to
be converted to biorientation before anaphase onset for sister separation (bottom panel). Monotelic
attached chromosomes have one kinetochore attached, the other unattached. Merotelic attachment is
the term for a configuration where both kinetochores are attached, but one of them is attached to
microtubules from both poles. Syntelic attachment describes a state where both kinetochores are
attached to microtubules from the same pole.
Chromosomes are shown in grey, spindle poles and kinetochore microtubules are light blue, attached
kinetochores are in dark blue, unattached kinetochores are red.

Chapter I: Introduction
22
(Gorbsky et al., 1988; Koshland et al., 1988). In budding yeast, the Dam1 complex allows
microtubule tracking in anaphase. Dam1 forms an oligomeric ring structure around the
microtubule (Miranda et al., 2005; Wang et al., 2007) that moves processively on
depolymerizing microtubule ends (Westermann et al., 2006). Association of the Dam1 complex
with kinetochores depends on Ndc80 (Maure et al., 2011). These properties are consistent
with a model in which the Dam1 ring complex associates with Ndc80 to couple microtubule
depolymerisation in anaphase to the movement of sister chromatids (Westermann et al.,
2007).
Most interestingly, Dam1 orthologues are absent in higher eukaryotes (Jeyaprakash et al.,
2012). In those species, kinetochores contact multiple microtubules and coupling to the
depolymerising microtubule bundles is achieved in an alternative manner. The Ska complex is
found in higher eukaryotes and can bind and track depolymerising microtubules similar to
Dam1 (Welburn et al., 2009). It is therefore widely assumed to be a functional homologue of
the Dam1 complex (DeLuca and Musacchio, 2012; Foley and Kapoor, 2013; Kops et al., 2010;
Santaguida and Musacchio, 2009; Tanaka, 2010). The Ska complex also requires Ndc80 for
association with the kinetochore (Gaitanos et al., 2009).
Microtubuleattachmenterrorcorrection
As important as establishing and maintaining microtubule attachments, is the propensity of
kinetochores to sense and selectively destabilise incorrect attachments. A central role in
attachment error correction mechanisms is attributed to the mitotic kinase Aurora B (Biggins
et al., 1999; Cimini et al., 2006; Hauf et al., 2003; Tanaka et al., 2002). Aurora B has been
shown to phosphorylate microtubule‐binding kinetochore proteins, including epitopes in the
KMN network and Dam1 (Cheeseman et al., 2002; Ciferri et al., 2008; DeLuca et al., 2006).
Phosphorylation of epitopes in the KMN network by Aurora B reduces their affinity for
microtubules in vitro (Welburn et al., 2010) and mutation of Aurora B sites in the Ndc80
complex and Dam1 leads to microtubule attachment defects in cells (Cheeseman et al., 2002;

Chapter I: Introduction
23
DeLuca et al., 2006; Guimaraes et al., 2008). Aurora B’s radius of action seems to be confined
to a discrete area around centromeric heterochromatin (Fuller et al., 2008) and position
effects on phosphorylation of a FRET‐sensor target (Liu et al., 2009) or its natural kinetochore
substrates (Welburn et al., 2010) can be observed. These properties set Aurora B up as an ideal
candidate for a tension sensor at the kinetochore. This is emphasised by the fact that Aurora B
inhibition leads to a high frequency of syntelic attachment errors (Lampson et al., 2004) and
re‐positioning of Aurora B within the kinetochore severely affects microtubule attachments
(Liu et al., 2009).
A popular model to explain why the Aurora B phosphorylation state of outer kinetochore
proteins could differ in amphitelically attached and syntelically or merotelically attached
kinetochore pairs is the spatial separation model of biorientation (Figure 1. 4). Aurora B is
tethered to centromeric heterochromatin as part of the chromosomal passenger complex
(CPC), which consists of Aurora B, INCENP, Borealin and Survivin (Vader et al., 2006). The
model predicts that the flexibility of this complex allows it to reach just far enough to
phosphorylate its substrates at the outer kinetochore‐ as long as kinetochores are close
together due to lack of proper biorientation. Once biorientation is established, the outer
kinetochore substrates are removed from Aurora B’s activity radius and proteins at the outer
kinetochore become fully dephosphorylated (Andrews et al., 2004; Fuller et al., 2008; Lampson
and Cheeseman, 2011; Liu et al., 2009; Welburn et al., 2010).

Chapter I: Introduction
24
FIGURE1.4SPATIALSEPARATIONMODELOFBIORIENTATION
Aurora B localises to the inner centromere from prophase to anaphase onset (Murata‐Hori et al., 2002).
Aurora B establishes a phosphorylation gradient (concentric rings) that reaches from the centromeric
chromatin (grey) to the outer kinetochore (dark blue) in unattached kinetochores. During early
prometaphase, Aurora B activity is antagonised by a phosphatase (PP) at the outer kinetochore, which
transiently removes some of the Aurora B phosphorylation sites to allow for initial binding of
microtubules (light blue) to both kinetochores. These initial interactions can conform to a bioriented
state (A) or could be syntelic (B) or monotelic.
(A) If these initial attachments have been formed in a bioriented manner, the depolymerising
microtubules on both sides will pull the outer kinetochores apart. Outer kinetochore proteins are thus
entirely removed from Aurora B’s radius of catalytic activity and only subject to phosphatase activity.
They cannot be re‐phosphorylated by Aurora B which strengthens the interaction with microtubules and
amphitelic attachments are selectively stabilised.
(B) If the initial attachments are syntelic (as shown here) or monotelic (not shown) the spindle force
experienced by both kinetochores is unidirectional and does not generate tension to separate the outer
kinetochores from Aurora B activity. This causes the outer kinetochore proteins to be re‐phosphorylated
and the initial attachments are destabilised. The kinetochores are reset to an unattached state and the
entire attachment process can be repeated to eventually generate amphitelic attachments.

Chapter I: Introduction
25
Mechanismsofmitoticcheckpointsilencing
Once biorientation is established and chromosomes are aligned on the equatorial plane,
spindle assembly checkpoint proteins are removed from the kinetochore. Retention of Mad1‐
Mad2 dimers at the kinetochore by artificially tethering them to the Mis12 complex is
sufficient to cause prolonged mitotic arrest (Maldonado and Kapoor, 2011), indicating that its
removal from the kinetochore is imperative for mitotic progression. In vertebrate cells, an
important pathway to remove checkpoint proteins is mediated by dynein, a minus‐end
directed motor protein, which transports its cargo away from the kinetochore towards the
spindle poles (Howell et al., 2001). Assuming that spindle‐localised Mad2 cannot maintain the
checkpoint, microtubule attachment is absolutely necessary for SAC silencing (Vanoosthuyse
and Hardwick, 2009).
There has been a long standing debate over whether attachment is sufficient to silence the
spindle assembly checkpoint. In support of this viewpoint, it has been shown that one single
unattached kinetochore can delay the progression of mitosis (Rieder et al., 1994), but laser
ablation of this kinetochore will cause cells to consistently exit mitosis with normal dynamics
(Rieder et al., 1995). However, the notion that microtubule attachment is the only signal that
feeds into checkpoint silencing poses a conceptual problem regarding the conservation of
genome integrity: if attachment of both kinetochores to microtubules is the only cue for a cell
to progress to anaphase, how can biorientation be sensed given the existence of syntelic and
merotelic attachments, both of which maintain attachments of both kinetochores? Conscious
of this disparity, SAC silencing was proposed to not only depend on microtubule attachment
but also on tension across the centromere as a read‐out of kinetochore microtubules attached
to opposite poles pulling apart the sister kinetochores (Nicklas et al., 2001). This does not
exclude the possibility that the ultimate signal to SAC silencing is attachment: relaxing tension
on grasshopper spermatocyte chromosomes aligned on the equatorial plane of meiosis I
metaphase reduces the amount of microtubules bound to kinetochores by about 50% (King

Chapter I: Introduction
26
and Nicklas, 2000). Thus, a tension‐sensing mechanism could act upstream of the spindle
assembly checkpoint to selectively destabilise incorrect attachments as described in the
previous section (Lampson and Cheeseman, 2011). This would result in the generation of
unattached kinetochores and the activation of the SAC.
PhosphatasesthatantagoniseAuroraBactivity
The spatial separation model of attachment error detection is incomplete unless the
phosphate groups transferred to outer kinetochore proteins by Aurora B are removed upon
biorientation. This is required to enhance microtubule binding affinity and stabilise end‐on
kinetochore‐microtubule attachments, thus allowing for mitotic progression (Lampson and
Cheeseman, 2011). Therefore, the activity of a phosphatase is indispensable at that stage.
Earlier, in prometaphase when initial kinetochore‐microtubules are first established, one
would also expect the requirement for phosphatase activity. Here, the phosphatase would
antagonise Aurora B to retain some microtubule binding activity in the outer kinetochore. A
kinase‐phosphatase antagonism at that stage would provide a certain dynamic range to
attachment stability that is needed to allow for initial attachments to form on one hand, but
also retain the propensity of these attachments to be destabilised relatively quickly should
they not conform to a bioriented state (Foley and Kapoor, 2013). Two phosphatases have been
described to oppose Aurora B activity at the centromere, protein phosphatase 1 (PP1) and
protein phosphatase 2A (PP2A) (Emanuele et al., 2008; Foley et al., 2011; Hsu et al., 2000;
Porter et al., 2013; Posch et al., 2010).
PP1 localisation to kinetochores is maximal in metaphase when bioriented attachment has
been achieved (DeLuca et al., 2011; Liu et al., 2010). In nocodazole‐treated cells that lack
kinetochore‐microtubule attachments, PP1 levels at the kinetochore are about half as high
(DeLuca et al., 2011).This spatio‐temporal pattern makes PP1 a good candidate for opposing
Aurora B to ultimately stabilise microtubule attachments upon biorientation. It is less likely to

Chapter I: Introduction
27
be involved in the regulation of initial microtubule attachment as it is not enriched at
unattached kinetochores.
The B56 family of PP2A subunits has been shown to localise to kinetochores from prophase,
peaking at prometaphase and dissipating again at metaphase (Foley et al., 2011). PP2A‐B56 is
enriched on chromosomes that have not congressed to the metaphase plate and on the
chromosomes of nocodazole‐treated cells (Foley et al., 2011). Depletion of B56 leads to an
increase of phosphorylation in the Aurora B target proteins Dsn1 and Knl1, accompanied by a
loss of stable microtubule attachments. Importantly, inhibition of Aurora B restores
microtubule binding in B56‐depleted cells (Foley et al., 2011). This behaviour is suggestive of a
role for PP2A‐B56 in early attachment control at the kinetochore (Foley and Kapoor, 2013).
Their temporal differences in kinetochore‐binding place PP2A and PP1 activities in two
functional niches at the mitotic kinetochore: PP2A antagonises Aurora B early in mitosis to
allow for microtubule attachment to happen, whereas PP1 removes Aurora B phosphorylation
sites after biorientation has been established and allows for mitotic progression (Funabiki and
Wynne, 2013). It now remains to be solved how , in prometaphase, the balance is kept
between enough Aurora B kinase activity and kinetochore phosphorylation to allow for error
correction on one hand; and enough PP2A phosphatase activity to protect initial attachments
on the other. A potential mechanism is the superposition of multiple layers of feedback control
over the primary kinase‐phosphatase system. Besides spatial confinement of the kinase and
phosphatase (Andrews et al., 2004; Liu et al., 2009), this could involve substrate selectivity
through accessory docking sites (Schulman et al., 1998), cooperativity with other kinases such
as Plk1 (Suijkerbuijk et al., 2012) or changing the catalytic activity of the enzymes.
Catalyticactivityofproteinphosphatase2A(PP2A)
Protein phosphorylation is a post‐translational protein modification that functions as
ubiquitous regulatory mechanism for protein interactions and signalling pathways. The critical

Chapter I: Introduction
28
phosphate group is transferred to serine, threonine or tyrosine residues of a given protein
through the catalytic activity of protein kinases, and it is removed by a protein phosphatase.
Interestingly, the activity of a plethora of over 400 cellular Ser/Thr kinases is counteracted by
less than 40 catalytic subunits of Ser/Thr phosphatases (Shi, 2009). Rather than attributing this
apparent imbalance of catalytic activity to high substrate promiscuity of the phosphatases, it is
now assumed that the key to diversity of phosphatases lies in their elaborate subunit
composition (Eto and Brautigan, 2012).
PP2Aactivityisregulatedthroughsubunitcompositionoftheholoenzyme
Protein phosphatase 2A (PP2A) is a Ser/Thr‐specific phosphatase of the phosphoprotein
phosphatase (PPP) family that consists of three subunits: The catalytic C‐subunit, a scaffolding
A‐subunit and a regulatory B‐subunit. The B‐subunit is thought to confer substrate specificity
to the heterotrimer. The A‐ and C‐subunits are very abundant and exist as a heterodimer
which is called the core enzyme (Shi, 2009). Structurally, the A‐subunit features 15 HEAT
(Huntington‐elongation‐A subunit‐TOR) repeats that form a concertina‐like structure as a
scaffold (Figure 1. 5). The intra‐repeat turns along the ridge of this structure comprise
hydrophobic surfaces that promote interactions with the other PP2A subunits (Ruediger et al.,
1994). The crystal structures of holoenzymes containing either a B/B55 or B’/B56 regulatory
subunit (Figure 1. 6 A and B) show that the C‐subunit and the regulatory subunit sit on the
intra‐repeat loop‐side of PP2A‐A (Cho and Xu, 2007; Xu et al., 2008). The PP2A holoenzyme is
formed after binding of any of the regulatory B‐subunits. There are four families of PP2A B‐
subunits (B/B55/R2, B’/B56/R5, B’’/PR72/R3, B’’’/striatin; Table 1. 1) with up to five isoforms
per family. Each single B‐subunit is expressed in a lower copy number than the core enzyme
(Ruediger et al., 1991), but since there are many different B‐subunits it is proposed that B‐
subunits are competing for a limiting pool of core dimers (Mumby, 2004).
PP2A regulatory subunits are structurally diverse (Figure 1. 6). The B/B55 subunits are WD40
repeat proteins that interact with the scaffolding subunit through a β‐propeller and make very

Chapter I: Introduction
29
few interactions with the catalytic subunit (Xu et al., 2008). The B’/B56 subunits on the other
hand contain HEAT‐like repeats, echoing the structure of the scaffolding subunit (Cho and Xu,
2007; Magnusdottir et al., 2009). The interacting surfaces of the B’‐subunits with the A‐subunit
lie on the convex sides of those HEAT‐like repeats leaving some of the intra‐repeat loops free
to make contacts with the catalytic subunit (Cho and Xu, 2007). The B’’’/striatin family of
proteins is even thought to form a coiled‐coil dimer that is capable of binding to two molecules
of PP2A‐A and thus recruiting two catalytic subunits (Chen et al., 2014). This model, however,
is yet to be confirmed by resolving the crystal structure of the striatin‐bound holocomplex.
Notably, the viral oncogene SV40t binds to the same residues on the A‐subunit that are
occupied by the B subunit (Cho et al., 2007), making it a competitive inhibitor of endogenous
holocomplex formation.
The PP2A crystal structures with both the B/B55‐ and B’/B56‐ subunit show that the C‐
terminus of PP2A‐C is tucked away between the A‐ and the B‐ subunit in the holoenzyme (Cho
and Xu, 2007; Xu et al., 2008). This provides a structural basis for why association of the B‐
subunits with the core dimer is, in part, regulated by post‐translational modification of the C‐
terminal tail of the catalytic subunit. These modifications include phosphorylation of T305 and
T307, as well as methylation of L309. Each of the regulatory subunits have a preferred
combination of modification of these three residues that increases their affinity for the core
dimer (Janssens et al., 2008).
The levels of PP2A protein are tightly regulated and it is difficult to overexpress the catalytic
subunit in cells (Baharians and Schonthal, 1998). Unregulated PP2A activity is most likely a
toxic insult for cells and to prevent unspecific activity of the C‐subunit, it is rapidly degraded if
the holoenzyme cannot form and there are no PP2A chaperones available to stabilise the
protein in an inactive conformation (Li et al., 2002; Sents et al., 2013; Silverstein et al., 2002).

Chapter I: Introduction
30
FIGURE1.5STRUCTUREOFAPP2A‐B56HOLOENZYME
(A) Front view of a PP2A holoenzyme (PDB: 2IAE) with the scaffolding subunit in yellow, catalytic subunit
in red and the B56 subunit in orange.
(B) Top view of the same holocomplex exposing the catalytic site (insert) of the phosphatase with a
molecule of the PP2A inhibitor microcystin bound (stick model, green). Two manganese ions as
cofactors are shown in turquoise.

Chapter I: Introduction
31

Chapter I: Introduction
32
FIGURE1.6STRUCTURALVARIATIONSOFPP2ACONTAININGDIFFERENTBSUBUNITS
(A) Top and front view of PP2A‐B55 (PDB: 3DW8, B55 in light blue, catalytic subunit in red, scaffolding
subunit in yellow).
(B) Top and front view of PP2A‐B56 (B56 in orange, catalytic subunit in red, scaffolding subunit in
yellow). (C) Hypothetical 2:2 dimer of PP2A and striatin (striatin in green, scaffolding subunit in lavender,
as shown in (Chen et al., 2014)).

Chapter I: Introduction
33

Chapter I: Introduction
34
TABLE1.1HUMANPP2ASUBUNITSANDTHEIRORTHOLOGUES
Human gene Common names Budding yeast orthologues Drosophila orthologues
Catalytic subunits (C) PPH21/PP2A‐1, PPH22/PP2A‐2
Microtubule star (mts)
PPP2CA PP2A‐Cα
PPP2CB PP2A‐Cβ
Scaffolding subunits (A) TPD3 PP2A‐29B/PR65
PPP2R1A PP2A‐Aα
PPP2R1B PP2A‐Aβ
Regulatory subunits (B)
B/B55 family CDC55 Twins (tws)
PPP2R2A Bα, B55α
PPP2R2B Bβ, B55β
PPP2R2C Bγ, B55γ
PPP2R2D Bδ, B55δ
B’’ family
PPP2R3A B’’α, PR72
PPP2R3B B’’β, PR70
PPP2R3C B’’γ, G5PR
B’/B56 family RTS1 Widerborst (wdb), Well‐rounded (wrd)
PPP2R5A B’α, B56α
PPP2R5B B’β, B56β
PPP2R5C B’γ, B56γ
PPP2R5D B’δ, B56δ
PPP2R5E B’ε, B56ε
B’’’/striatin family FAR8 Connector of kinase to AP‐1 (cka)
STRN Striatin, PR110
STRN3/SG2NA Striatin‐3, S/G2 antigen, PR93
STRN4 Striatin‐4, Zinedin
Chapter I: Introduction
35
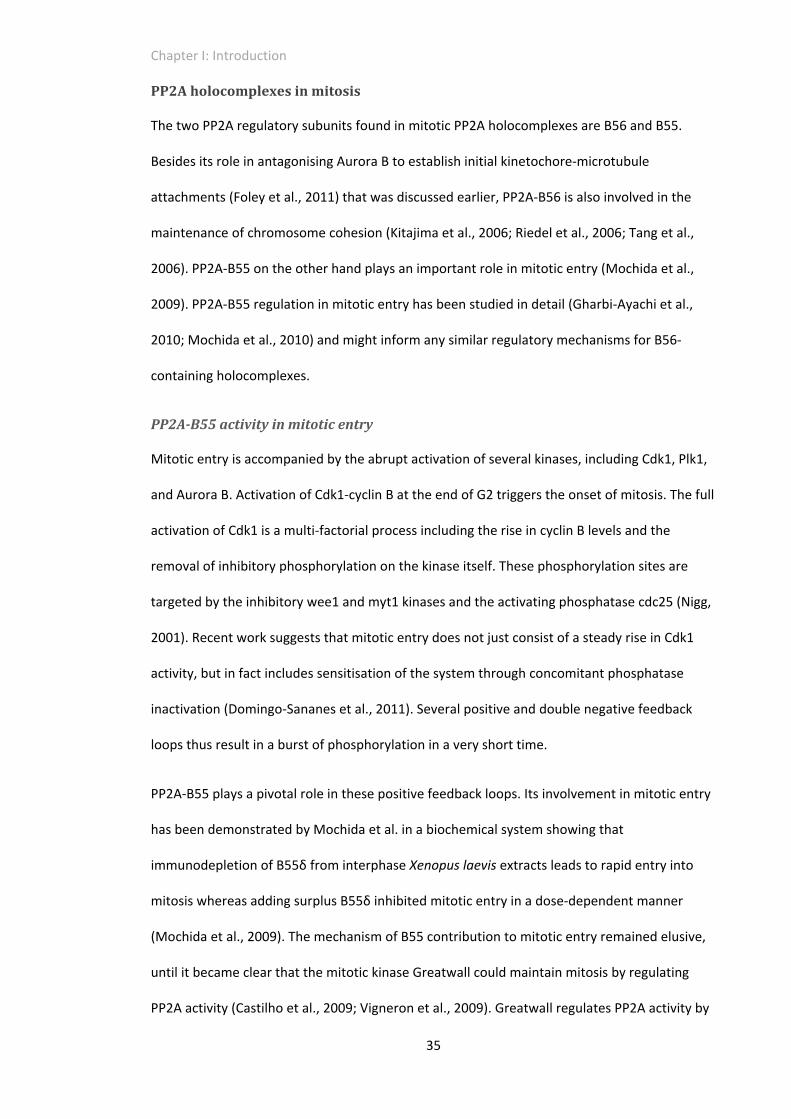
PP2Aholocomplexesinmitosis
The two PP2A regulatory subunits found in mitotic PP2A holocomplexes are B56 and B55.
Besides its role in antagonising Aurora B to establish initial kinetochore‐microtubule
attachments (Foley et al., 2011) that was discussed earlier, PP2A‐B56 is also involved in the
maintenance of chromosome cohesion (Kitajima et al., 2006; Riedel et al., 2006; Tang et al.,
2006). PP2A‐B55 on the other hand plays an important role in mitotic entry (Mochida et al.,
2009). PP2A‐B55 regulation in mitotic entry has been studied in detail (Gharbi‐Ayachi et al.,
2010; Mochida et al., 2010) and might inform any similar regulatory mechanisms for B56‐
containing holocomplexes.
PP2A‐B55activityinmitoticentry
Mitotic entry is accompanied by the abrupt activation of several kinases, including Cdk1, Plk1,
and Aurora B. Activation of Cdk1‐cyclin B at the end of G2 triggers the onset of mitosis. The full
activation of Cdk1 is a multi‐factorial process including the rise in cyclin B levels and the
removal of inhibitory phosphorylation on the kinase itself. These phosphorylation sites are
targeted by the inhibitory wee1 and myt1 kinases and the activating phosphatase cdc25 (Nigg,
2001). Recent work suggests that mitotic entry does not just consist of a steady rise in Cdk1
activity, but in fact includes sensitisation of the system through concomitant phosphatase
inactivation (Domingo‐Sananes et al., 2011). Several positive and double negative feedback
loops thus result in a burst of phosphorylation in a very short time.
PP2A‐B55 plays a pivotal role in these positive feedback loops. Its involvement in mitotic entry
has been demonstrated by Mochida et al. in a biochemical system showing that
immunodepletion of B55δ from interphase Xenopus laevis extracts leads to rapid entry into
mitosis whereas adding surplus B55δ inhibited mitotic entry in a dose‐dependent manner
(Mochida et al., 2009). The mechanism of B55 contribution to mitotic entry remained elusive,
until it became clear that the mitotic kinase Greatwall could maintain mitosis by regulating
PP2A activity (Castilho et al., 2009; Vigneron et al., 2009). Greatwall regulates PP2A activity by

Chapter I: Introduction
36
phosphorylating the small PP2A inhibitory protein Arpp‐19/α‐endosulfine (Ensa) and in doing
so enables it to bind PP2A‐B55 (Gharbi‐Ayachi et al., 2010; Mochida et al., 2010). In a Xenopus
system, a PP2A type phosphatase activity is required to keep cdc25 dephosphorylated and in a
low activity state, and Cdk1‐cyclinB activity in those extracts prevents dephosphorylation of
cdc25 (Clarke et al., 1993). Through a feedback loop (involving Greatwall, Arpp‐19/Ensa, and
PP2A‐B55), Cdk1 can thus activate its activator cdc25 (Figure 1. 7). It is assumed that PP2A also
inactivates the Cdk1 inhibitor, wee1, to form a bistable system (Domingo‐Sananes et al., 2011;
Mochida et al., 2010).
FIGURE1.7REGULATIONOFPP2A‐B55DURINGMITOTICENTRY
After activation by Cdk1, Greatwall (Gwl) kinase phosphorylates Arpp19 during mitotic entry which
allows it to interact with and inhibit PP2A‐B55. Inhibition of the phosphatase is thought to amplify the
phosphorylation cascade required for mitotic progression by indirectly stimulating Cdk1 activity through
inhibition of cdc25 phosphatase and activation of wee1 kinase. (P) indicates phosphorylation.
In mammalian and Drosophila cells, Greatwall is localised in the nucleus in interphase (Alvarez‐
Fernandez et al., 2013; Burgess et al., 2010; Wang et al., 2013). PP2A‐B55 on the other hand is
mainly found in the cytoplasm before nuclear envelope breakdown (Alvarez‐Fernandez et al.,
2013; Mayer‐Jaekel et al., 1994; Santos et al., 2012). Cdk1‐cyclinB is also retained in the
cytoplasm when it is inactive, posing the question how these components can come together
to form a regulatory network. New evidence points to a series of re‐localisation events that

Chapter I: Introduction
37
make this possible. Seemingly, activation of Cdk1 first takes place in the cytoplasm (Jackman et
al., 2003). Cdk1‐cyclinB then autoactivates its own translocation to the nucleus (Gavet and
Pines, 2010) and begins to phosphorylate its nuclear mitotic targets including Greatwall (Wang
et al., 2013). Greatwall phosphorylation by Cdk1 and Plk1 causes it to be excluded from the
nucleus before nuclear envelope breakdown (NEB) to inhibit cytosolic PP2A‐B55 (Wang et al.,
2013). Of note, Arpp‐19 and Ensa are proteins of <20kD, presumably allowing them to diffuse
freely between the nucleus and cytoplasm (Weis, 2003). The cytoplasmic and nuclear
localisation of Ensa was confirmed experimentally in Drosophila embryos (Rangone et al.,
2011).
Most recently it has been demonstrated that Arpp‐19 can also directly be phosphorylated by
Cdk1‐cyclin B (Okumura et al., 2014). This might provide a mechanism for regulation of mitotic
entry in nematodes such as C. elegans that lack obvious orthologues of the Greatwall kinase
(Kim et al., 2012).
The Greatwall‐endosulfine‐PP2A pathway is conserved in yeast. Strikingly, budding yeast
B/Cdc55‐PP2A promotes mitotic entry instead of inhibiting it (Juanes et al., 2013). This
demonstrates a flexibility in utilisation of conserved biochemical pathways that might be the
key to facilitate evolutionary divergent solutions for successful cell division and proliferation
such as open and closed mitosis in mammals and yeast (Guttinger et al., 2009).
PP2A‐B55activityinmitoticexit
Mitotic exit is driven through two major events: (1) the degradation of cyclin B by the
anaphase promoting complex/cyclosome (APC/C) resulting in inactivation of Cdk1; and (2) the
active dephosphorylation of Cdk1 substrates to return them to an interphase state (Sullivan
and Morgan, 2007). In budding yeast, the major phosphatase that reverses Cdk‐
phosphorylation is Cdc14 (Stegmeier and Amon, 2004). PP2A has an initiating role in this
process: downregulation of PP2A‐Cdc55 is thought to lead to release of Cdc14 from the

Chapter I: Introduction
38
nucleolus and thus enable Cdc14 interaction with its substrates (Queralt et al., 2006). Whereas
Cdc55 activity is enhanced in mitotic entry, it needs to be downregulated for mitotic exit.
Accordingly, one would expect the opposite to be true in vertebrate cells: since PP2A‐B55
inhibition is required for mitotic entry it can be reasoned that its activation will lead to mitotic
exit. Indeed, B55 holoenzyme activity is lower in mitosis than in interphase (Schmitz et al.,
2010). Furthermore, PP2A‐B55 is known to dephosphorylate proline‐directed serines or
threonines that are typical for Cdk activity (Mumby, 2004). However, depletion of PP2A‐B55
from mitotic Xenopus extracts does not have a noteworthy impact on the timing of mitotic exit
(Mochida et al., 2009). PP2A‐B55 seems to be more important in keeping Cdk1 substrates
dephosphorylated in interphase whereas PP1 was suggested to be the mitotic phosphatase
that dephosphorylates Cdk1‐cyclin B targets during Xenopus mitotic exit instead (Wu et al.,
2009).
Bod1issimilarinsequencetothePP2AinhibitorsArpp‐19andEnsa
The PP2A‐B55 inhibitors Arpp‐19 and Ensa are highly similar to the small kinetochore protein
Biorientation defective 1 (Bod1) (Porter et al., 2013). Regions of high similarity can be found
between residues 78‐120 of human Bod1 and between residues 143‐164 (Figure 1. 8 A). The
PP2A binding region in Arpp‐19 and Ensa includes serine S67 which is phosphorylated by
Greatwall kinase at mitotic entry (Gharbi‐Ayachi et al., 2010; Mochida et al., 2010), as well as
the preceding aspartate residue D66 (Gharbi‐Ayachi et al., 2010). This aspartate is conserved in
Bod1 (D98). The following serine is lacking, but there is a weak Cdk1 site just upstream of D98.
Disorder profiles of the three proteins show that all of them contain long unstructured regions
(Figure 1. 8 B). Arpp‐19 and Ensa are known to be heat‐stable (Mochida et al., 2010), indicative
of their lack of hydrophobic cores (Tompa, 2002). Bod1 is also a heat‐stable protein (S.
Mochida, personal communication). The only two structured areas in the three proteins
coincide with stretches of conservation between them. Taken together, these biochemical
similarities led to the hypothesis that Bod1 might be a PP2A regulating protein.

Chapter I: Introduction
39
FIGURE1.8BOD1HASSIMILARBIOCHEMICALPROPERTIESTOARPP19ANDENSA
(A) Sequence alignment of Bod1 (Accession: Q96IK1), Arpp19 (P56211) and Ensa (O43768‐3). Asterisks
mark conserved residues. Dots indicate residues with conserved biochemical properties. A conserved
aspartate (D98 in Bod1) which is part of the PP2A interaction motif in Arpp‐19 and Ensa is highlighted in
red. The Greatwall phosphorylation sites on Arpp19 and Ensa, as well as a potential phosphorylation site
in Bod1 are highlighted in green.
(B) Disorder profiles of Bod1, Arpp19 and Ensa were generated using the DISOPRED algorithm (Ward et
al., 2004a) and aligned according to the Clustal W alignment shown in (A). Probability score ranges from
0 (low disorder probability) to 9 (high disorder probability).

Chapter I: Introduction
40

Chapter I: Introduction
41
Bod1isanovelkinetochoreproteinrequiredforbiorientation
Bod1 was identified in a proteomic screen of Xenopus laevis in vitro assembled chromosomes
(Porter et al., 2007). Endogenous Bod1 was detected in the centromeric region of human
metaphase chromosomes by immunofluorescence using chromosome spreading to expose the
kinetochore (Figure 1. 9 A) and GFP‐tagged Bod1 localises to kinetochores, as well as
centrosomes, when exogenously expressed in HeLa cells (Figure 1. 9 B). Its role in mitosis was
confirmed in a RNA interference experiment in HeLa cells, in which depletion of the protein
lead to gross biorientation defects including chromosome alignment defects and a
disorganised mitotic spindle (Figure 1. 9 C). This phenotype can be partially rescued by re‐
introducing Bod1 to the cells in form of a siRNA resistant plasmid (Figure 1. 10).
Biorientation defects have been described for the depletion of a number of kinetochore and
centromere proteins (DeLuca et al., 2005; DeLuca et al., 2002; Foley et al., 2011; McEwen et
al., 2001; Salic et al., 2004). The reasons for the defects are dependent on the individual roles
those proteins assume in the establishment of a bioriented spindle. The alignment of
chromosomes on the metaphase plate, or chromosome congression, depends on the ability of
chromosomes to move along the spindle microtubules. Accordingly, depletion of motor
proteins that are involved in this process, for example CENPE, cause failure of some
chromosomes to align properly (McEwen et al., 2001). Time‐lapse microscopy of cells treated
with Bod1 siRNA on the other hand showed that they were able to align all their chromosomes
on the metaphase plate, yet failed to progress to anaphase and chromosomes became
unaligned in the course of this metaphase arrest. The majority of unaligned chromosomes in
Bod1‐depleted cells stained strongly for the mitotic checkpoint proteins Bub1, BubR1 and
Mad2, suggesting this arrest was checkpoint mediated (Porter et al., 2007).

Chapter I: Introduction
42
FIGURE1.9BOD1ISANOVELKINETOCHOREPROTEINTHATISREQUIREDFORCHROMOSOME
BIORIENTATION
(A) Chromosome spreads of mitotic HeLa cells were stained with antibodies targeting endogenous Bod1
(green) and the centromere (red). DNA was visualised by the fluorescent stain 4',6‐diamidino‐2‐
phenylindole (DAPI). (From (Porter et al., 2007))
(B) A metaphase HeLa cell stably expressing Bod1‐GFP (green in the left panel, white in the right panel)
and co‐stained for markers of the mitotic spindle (tubulin, red) and the centromere (ACA, blue). Red
arrows indicate accumulation of Bod1‐GFP at the centrosomes as well as kinetochores. Insert shows a
pair of kinetochores magnified from the field indicated by the small white box. Scale bars are 5µm.
(C) Hela cells treated with control or Bod1 siRNA were imaged in mitosis. Chromosomes are grey (DAPI),
centrosomes blue (ACA), the mitotic spindle red (tubulin). Scale bars are 5µm. Bod1‐depleted cell shows
characteristic phenotype with gross chromosome alignment defects and a disorganised mitotic spindle.

Chapter I: Introduction
43

Chapter I: Introduction
44
FIGURE1.10BOD1DEPLETIONCANBEPARTIALLYRESCUEDBYEXPRESSIONOFSIRNA
RESISTANTBOD1‐GFP
(A) Mitotic HeLa cells co‐expressing Bod1 siRNA and siRNA resistant Bod1‐GFP (Bod1siRGFP) or GFP are
shown. Red arrows indicate position of the centrosomes, inserts show pairs of kinetochores magnified
from the small white boxes. Scale Bar is 5µm.
(B) Quantification of the rescue for Bod1‐GFP and GFP. 100 cells were counted per condition.

Chapter I: Introduction
45

Chapter I: Introduction
46
Close observation of sister kinetochores of Bod1‐depleted cells by time‐lapse
immunofluorescence microscopy suggested, that kinetochores of misaligned chromosomes
were frequently syntelically attached (Porter et al., 2007). This was confirmed by artificially
increasing the prevalence of syntelic attachment by treatment with monastrol, a drug that
arrest cells in prometaphase with monopolar spindles (Kapoor et al., 2000). In this experiment,
control cells demonstrated high efficiency in resolving the increased number of syntelic
attachments and forming a normal metaphase plate. In contrast, Bod1‐depletion severely
compromised the formation of a metaphase plate after monastrol treatment (Porter et al.,
2007). To investigate a possible role for Bod1 in mitotic error correction, Aurora B kinase
integrity was examined. Neither Aurora B activity nor its localisation was affected by Bod1
depletion, but its kinetochore substrate MCAK was substantially hypophosphorylated at
mitotic kinetochores (Figure 1. 11, (Porter et al., 2007)). Even though the kinase‐driven
machinery that normally detects syntelic attachment errors was in place and active, the
phospho‐signal was not sustained to translate this information into removal of the erroneous
kinetochore‐microtubule connection.
FIGURE1.11BOD1DEPLETIONCAUSESLOSSOFPHOSPHOEPITOPESATTHEKINETOCHORE
Mitotic HeLa cells treated with control or Bod1 siRNA were stained for phosphorylated MCAK (red), DNA
(blue), and the centromere (green). Inserts show unattached kinetochores from small white boxes.
Dashed line indicates localisation of the metaphase plate. Scale bar is 5µm. (Porter et al., 2007).

Chapter I: Introduction
47
ResearchObjectivesofthisStudy
The co‐localisation of Bod1 with PP2A‐B56 at mitotic kinetochores, the hypophosphorylation
phenotype coupled with erroneous microtubule attachments in Bod1 siRNA depleted cells,
and the structural similarity of Bod1 to the small PP2A inhibitory proteins Arpp‐19 and Ensa
incite the hypothesis that Bod1 might regulate PP2A‐B56 at mitotic kinetochores to allow for
attachment error correction in early mitosis. Such an interaction would not only have
important implications for the aetiology of the biorientation defect observed in Bod1‐depleted
cells it would also provide direct evidence for an alternative phospho‐regulatory mechanism at
the kinetochore. Such a regulatory system would grant new insights into the regulation of
PP2A‐type phosphatases. This hypothesis was tested in this thesis by determining whether
Bod1 can interact with PP2A‐B56 at the kinetochore. Bod1’s impact on PP2A activity was
assessed in HeLa cells and in vitro. The interaction between PP2A and Bod1 was further
characterised with respect to interaction domains and potential regulatory mechanisms.
Due to its small size and naturally low cellular abundance, Bod1 has been poorly covered in
proteomic screens, and little is known about its interactome at the kinetochore. Dissecting
Bod1’s protein interaction network will be fundamental to interpret its functional role at the
kinetochore. This work therefore aimed to develop a method to reliably detect Bod1 in mass
spectrometry experiments and use this to determine a Bod1 interactome. Placing Bod1 within
a particular aspect of the kinetochore regulatory network will help further our understanding
of how mitotic chromosome segregation in vertebrates is regulated.

Chapter II: Materials and Methods
48
ChapterII:MaterialsandMethods
MolecularBiology
Mutagenesispolymerasechainreaction(PCR)
In a 50µl reaction, 10ng template DNA were supplemented with 400µM dNTPs, 250pg/µl
forward and reverse primers and 2.5U PfuUltra High‐Fidelity DNA Polymerase (Agilent) in
PfuUltra HF Reaction Buffer. The PCR cycling programme consisted of 30s initial denaturation
at 95°C, followed by 12 (point mutation) or 16 (single amino acid change) cycles of 30s
denaturation at 95°C, 1min annealing at 58°C and 1min/kb elongation at 68°C. The template
DNA was removed after the PCR by digesting methylated DNA with 10U DpnI resctriction
enzyme (New England BioLabs) for 1h at 37°C.
Molecularcloning
To subclone a protein coding insert into different plasmid vectors, the insert DNA was first
amplified in a polymerase chain reaction (PCR). 10ng of the parent vector were added to a PCR
mix containing 160µM dNTPs, 240nM forward and reverse cloning primers, and 0.5U Phusion
High‐Fidelity DNA polymerase (Thermo Scientific) in HF polymerase buffer in a total volume of
25µl. PCR fragments were amplified using a cycling programme of 2min at 98°C intitial
denaturation, followed by 35 cycles of 15s at 98°C, 15s at 65.5°C and 20s at 72°C, and a final
elongation step of 5min at 72°C.
The PCR products were then separated in a 0.8% agarose gel and bands of the appropriate size
were excised from the gel in UV light. DNA was extracted from the gel with QIAquick Gel
Extraction kits (Qiagen).
The newly synthesised DNA fragments as well as the target vector were then cut with two
different restriction endonucleases (all purchased from New England BioLabs) in a double
digest to generate two different sticky DNA overhangs for ligation. The exact conditions were

Chapter II: Materials and Methods
49
dependent on the restriction enzymes chosen. The products of this reaction were again
separated by agarose gel, excised and extracted from the gel.
Ligations of the insert DNA and the target vector were performed using T4 DNA ligase (New
England BioLabs) according to the manufacturer’s instructions at an insert:vector ratio of 1:4.
Ligation products were transformed into competent cells immediately.
Transformation
For plasmids generated in mutagenesis PCRs, 4µl DNA or water as a control were gently mixed
with 30µl DH5α E. coli competent cells. For ligation products generated in molecular cloning
procedures, 2µl DNA or water as a control were gently mixed with 30µl DH5α E. coli
competent cells. Cells were chilled on ice for 30min, heat shocked for 30s at 42°C and then
recovered for at least 2min on ice. S.O.C. medium without antibiotics (Invitrogen) was added
for 40min in a 37°C shaking incubator to allow time for the expression of antibiotic resistance
genes in favourable conditions. Cells were then plated on pre‐warmed agar‐plates containing
the appropriate selection antibiotic and colonies were allowed to grow at 37°C over night.
Agarosegelelectrophoresis
Agarose gels (0.8% w/v in TAE buffer) were stained with 3% v/v ethidium bromide and samples
containing 20% v/v Gel loading dye (New England BioLabs) were run at 110V for 40min. 1kb
DNA ladder (New England BioLabs) was used as a size marker.
Biochemistry
BradfordProteinAssay
Proteins concentrations were determined by using 1ml 1x Bradford Solution (Biorad). Proteins
were added to the solution, mixed thoroughly and absorption was measured after 10min at
595nm to detect the blue anionic dye that stabilises upon binding of the reagent to basic and
aromatic amino acids (Compton and Jones, 1985). A BSA standard curve spanning a range of 0‐
16µg/ml was generated in parallel to calculate protein concentrations from these reference

Chapter II: Materials and Methods
50
values. Protein solutions were diluted to fall into the linear absorption range of the assay if
applicable.
Immunoblotting
Protein samples in SDS electrophoresis loading buffer (Invitrogen) supplemented with 5% β‐
mercaptoethanol were loaded on 4‐12% Bis‐Tris NuPAGE gels (Life technologies) and run in
MOPS electrophoresis running buffer (0.2M MOPS (pH7.0), 20mM sodium acetate, 10mM
EDTA (pH8.0)) for 55min at 200V. The electrophoretically separated proteins were transferred
from the gel to nitrocellulose membranes (GE Healthcare) in NuPAGE Transfer Buffer (Life
technologies) for 120min at 30V. Transfer efficiency was tested with Ponceau S (Sigma) and
the membrane was blocked in 5% w/v milk powder in TBS‐T for 30min at room temperature.
Primary antibody diluted in 5% w/v milk powder in TBS‐T was applied for 1h at room
temperature. The membrane was then washed 4x3min with 20ml TBS‐T and incubated with
the secondary antibody for 30min at room temperature. After another four rounds of washes,
the secondary antibody was detected using either Clarity Western ECL Substrate (BioRad) and
X‐Ray films (Kodak) or the Odyssey Clx infrared detection system (LI‐COR).
GFP‐TrapImmunoprecipitation
Bod1‐GFP stably transfected cells were arrested in prometaphase with Eg5 inhibitors
(monastrol or STLC) for 18h and mitotic cells were isolated by gentle mitotic shake‐off. Cells
were washed with phosphate buffered saline (PBS) and lysed in lysis buffer (20mM Tris acetate
pH 7.5, 1mM EGTA, 1mM EDTA, 10mM Na‐β‐glycerophosphate, 5mM Na‐pyrophosphate,
1mM Na‐orthovanadate, 50mM NaF, 1µM microcystin, 0.27M sucrose, 0.01% Triton‐X‐100,
10µg/ml leupeptin, 10µg/ml pepstatin, 10µg/ml aprotinin) with four rounds of freeze
fracturing. After depleting unsoluble proteins by centrifugation (4°C, 10.000rpm, 5min),
immunoprecipitation was performed using GFP‐Binder (Chromotek).

Chapter II: Materials and Methods
51
B56α/δantibody‐mediatedImmunoprecipitation
Per immunoprecipitation, 20µl Protein G sepharose (GE Healthcre) were washed with
phosphate buffered saline (PBS) and resuspended in 1mg/ml BSA in PBS. Anti‐B56 IgG1 was
added to a final concentration of 0.02mg/ml and incubated for 1h at room temperature under
constant agitation. The antibody‐coated sepharose beads were then resuspended in 0.2M
triethanolamine (TEA) in PBS and Dimethyl pimelimidate (DMP) was added to a final
concentration of 12.5mg/ml. After 1h incubation at room temperature, the process was
repeated with fresh DMP. Excess DMP was quenched using 0.2M NaCl/ 0.2M ethanolamine
(EA) pH8.5 by first washing 2x5min with 1ml NaCl/EA and then resuspending in 1ml NaCl/EA
and shaking 1h at RT. For the IP, mitotic cells were washed with PBS and lysed in lysis buffer
(20mM Tris acetate pH 7.5, 1mM EGTA, 1mM EDTA, 10mM Na‐β‐glycerophosphate, 5mM Na‐
pyrophosphate, 1mM Na‐orthovanadate, 50mM NaF, 1µM microcystin, 0.27M sucrose, 0.1%
Triton‐X‐100, 10µg/ml leupeptin, 10µg/ml pepstatin, 10µg/ml aprotinin) with four rounds of
freeze fracturing. Unsoluble protein was depleted by centrifugation (4°C, 10.000rpm, 5min)
and lysates were precleared with Protein G beads for 1h at 4°C. Pre‐cleared lysates were
applied to anti‐B56‐conjugated sepharose beads and binding was allowed for 1h at 4°C at
constant agitation. Beads were washed three times with PBS and the remaining protein was
eluted by two rounds of boiling in SDS electrophoresis loading buffer.
MalachiteGreenPhosphataseAssay
Bod1‐GFP was immunoprecipitated without microcystin in the lysis buffer. Beads washed
twice in phosphatase reaction buffer (50mM HEPES, 1mM dithiothreitol (DTT), 1mM EDTA and
0.1% NP40), split into two equal fractions and resuspended in PPase reaction buffer with or
without 1% NP40 and 300nM NaCl. Phosphorylated PBIPtide (6mM) CDPPLHS[p]TAIYADEE was
added and incubated for 45min at 30°C. Phosphate release was measured using a Malachite
Green Phosphate Detection kit (R&D Systems) as per the manufacturer’s instructions. PP2A‐
specific phosphate release was measured as activity inhibited by 2nM okadaic acid.

Chapter II: Materials and Methods
52
CDK1Kinaseassay
(conducted by Iain Porter)
Cdk1/cyclin B (100 ng; Millipore) was mixed with TADB (6.7mM Tris–HCl pH 7.5, 13mM EGTA,
2mM DTT), IB (10mM Na2HPO4, pH 7.4, 100mM KCl, 1mM MgCl2) and magnesium/ATP cocktail
(27.5mM MgCl2, 0.183mM ATP, 4mM 3‐(N‐morpholino) propanesulfonic acid pH7.2, 9.17mM
β‐glycerolphosphate, 1.83mM EGTA, 0.37mM sodium orthovanadate, 0.37mM DTT) and
incubated for 30min at 30°C. [γ‐32P]ATP (10mCi) and 300ng GST‐Bod1 was added and
incubated for a further 30min at 30°C. Samples were separated on a 4–12% SDS–
polyacrylamide gel (Invitrogen), and the gel was dried and exposed to autoradiography.
PP2Aproteinexpressionandpurification
5ml LB medium containing the appropriate selection marker were inoculated with BL21 E. coli
competent cells that had been transformed with the PP2A expression plasmid of interest. After
18h in a 37°C incubator, these starter cultures were transferred into 2l conical flasks containing
500ml LB medium with the selection antibiotic. The cultures were grown in shaking incubators
at 37°C up to OD600 = 0.4. Uninduced protein samples were taken and the bacteria were
challenged with 100mM benzylalcohol for 30min at 37°C to induce chaperones and assist
protein folding. Recombinant protein production was then induced by the addition of 0.1mM
Isopropyl β‐D‐1‐thiogalactopyranoside (IPTG). For the production of GST‐PP2A‐A and GST‐
B56γ, cells were incubated at 18°C for 18h. For the production of GST‐PP2A‐Cα(D88N), cells
were incubated at 28°C for 18h. Optimal temperature and time for protein expression were
determined using the Taguchi method (Khoudoli et al., 2004). The following day, induced
samples were taken and bacteria were harvested by ultracentrifugation (5250xg, 4°C, 30min,
slow deceleration). Bacterial pellets were lysed by resuspending them in PBS containing a
protease inhibitor cocktail (Roche) and adding 1mg/ml lysozyme. Cells were incubated at 4°C
under constant agitation for 30min after which Triton X‐100 was added to a final concentration
of 1%. The suspension was sonicated for 30s on ice and left to incubate another 30min at 4°C.

Chapter II: Materials and Methods
53
The lysate was sonicated twice more and whole cell lysate samples were taken. Unsoluble
debris was pelleted by ultracentrifugation (26.000xg, 4°C, 1h).
For protein purification, 1ml glutathione beads were pre‐equilibrated with binding buffer
(50mM Tris‐HCl pH 7.5, 100mM NaCl, 3mM β‐Mercaptoethanol) and the soluble fraction of the
protein lysate was added after passing through a 0.2μm filter. Binding was allowed for 2h at
4°C under constant agitation. The recombinant protein bound to beads was washed with
protease buffer (50mM Tris‐HCl pH 7.5, 100mM NaCl, 1mM DTT). To elute the protein, 500μl
protease buffer containing 20mM glutathione was added and samples were incubated for
90min at 4°C under agitation. The supernatant was transferred into a Slide‐A‐Lyzer dialysis
cassette (Pierce) and dialysed into pull down buffer (20mM Tris‐HCl pH 7.5, 20mM NaCl, 10%
Glycerol, 1mM EGTA, 1mM DTT) over night. The concentration of dialysed protein was
determined using a Bradford colorimetric assay. 1µl PreScission protease (GE healthcare) was
used per 100µg protein to cleave the GST tag off constructs subcloned into pGEX‐6P1 vectors
(PP2A‐Cα(D88N), B56δ). 4µl TEV protease (Promega) was used for pGEX‐4T1 constructs (PP2A‐
A, B56y1Δ29). To remove GST after cleavage, glutathione beads were added for 1h at 4°C
under rotation. Concentrations of the purified proteins were determined using the Bradford
assay. If the concentration was lower than 0.2mg/ml, protein solutions were concentrated
using Vivaspin columns (GE Healthcare) at 4750rpm, 4°C. Proteins were aliquoted and stored
at ‐80°C.
Bod1expressionandpurification
Bod1 was purified under the same conditions as GST‐PP2A‐A.
Ndc80BonsaiExpressionandPurification
Ndc80 Bonsai was expressed and purified as described previously (Ciferri et al., 2008). In brief,
Bl21 cells harbouring the expression construct were grown in overnight cultures, expanded to
500ml LB medium supplemented with ampicillin and protein expression was induced with
01.mM IPTG at OD600=0.4. Protein expression was allowed to take place at 18°C over night.

Chapter II: Materials and Methods
54
Cells were pelleted at 4000rpm, 4°C for 30min and resuspended in Bonsai lysis buffer (25mM
Tris‐Cl pH7.6, 300mM NaCl, 1mM EDTA, 1mM DTT, 1 tablet/50ml Complete protease inhibitors
(Roche)). Cells were lysed by sonication and unsoluble protein was pelleted by
ultracentrifugation (40.000rpm, 4°C, 1h). The soluble fraction was filtered onto glutathione‐
conjucated beads and binding was allowed by rocking at 4°C for 1h. After washing with Bonsai
lysis buffer, the recombinant protein was eluted from the beads with 200mg/ml glutathione.
Purity of the protein was tested on a HiLoad Superdex 200 16/60 HPLC column with Superdex
lysis buffer (25mM Tris‐Cl pH7.6, 300mM NaCl, 1mM EDTA, 5% glycerol) at a flow rate of
1ml/min.
PP2Asinglesubunitbindingassay
200pmol of Bod1‐GST or GST were conjugated to glutathione‐sepharose and incubated with
individual PP2A components (PP2A‐A, PP2A‐C(D88N) and B56δ) in protein complex interaction
buffer (20mM Tris–HCl, 20mM NaCl, 10% glycerol, 1mM EGTA, 1mM DTT, Complete protease
inhibitors (Roche)), but no specific binding was observed.
RecombinantPP2Aholocomplexassembly
200pmol of Bod1‐GST or GST were conjugated to glutathione‐sepharose and 100pmol each of
purified PP2A‐A, PP2A‐C(D88N) and B56δ proteins were added for complex formation.
Alternatively, the purified PP2A subunits were incubated in interaction buffer (20mM Tris–HCl,
20mM NaCl, 10% glycerol, 1mM EGTA, 1mM DTT, Complete protease inhibitors (Roche))
containing 0.1mg/ml insulin at 4°C for 1h to pre‐assemble before adding this protein solution
to 200pmol of Bod1‐GST or GST conjugated to glutathione‐sepharose. No holocomplex
formation was observed by immunoblot.
Semi‐recombinantPP2AholocomplexassemblyandPP2A‐Bod1PullDowns
200pmol PP2A‐A‐GST were conjugated to glutathione sepharose and incubated with the
soluble fraction of mitotic HeLa cell lysates supplemented with 1mM DTT. The beads
containing the A/C dimers where then washed extensively with high salt and detergent wash

Chapter II: Materials and Methods
55
buffer (20mM Hepes pH7.6, 300mM NaCl, 1mM DTT, Complete protease inhibitors (Roche),
0.2% Triton‐X 100) and re‐equilibrated to interaction‐friendly conditions by washing with
interaction buffer (20mM Tris–HCl, 20mM NaCl, 10% glycerol, 1mM EGTA, 1mM DTT,
Complete protease inhibitors (Roche)). 300pmol purified PP2A‐B56δ was added and left to
interact for 1h at 4°C at constant agitation. The beads were then washed with wash buffer
containing different amounts of salt and detergent (same wash buffer as used above but
containing 150mM NaCl/0.1% Triton X‐100; or 150mM/0.2%; or 300mM/0.2%), but no binding
of B56δ to the semi‐recombinant core dimer was observed in any of the conditions.
Alternatively, glutathione sepharose beads were blocked with 0.1mg/ml insulin in interaction
buffer (20mM Tris–HCl, 20mM NaCl, 10% glycerol, 1mM EGTA, 1mM DTT, Complete protease
inhibitors (Roche)). 200pmol B56γ3∆29‐GST (Cho and Xu, 2007)or GST were added and
coupled to the sepharose beads for 1h. The protein‐coupled beads were then incubated with
mitotic HeLa cell lysates supplemented with 1mM DTT to co‐precipitate cellular PP2A‐C/A
heterodimers. The holocomplex was washed with interaction buffer supplemented with 0.1%
Triton‐X, and then incubated with 100pmol MBP, MBP‐Bod1 or MBP‐T95E‐Bod1. The protein
complexes were washed with interaction buffer containing 0.05% Triton‐X and analysed by
immunoblot.
Ndc80‐Bod1PullDownExperiments
150pmol Ndc80Bonsai, Hec1/Nuf2 dimer, or Spc24/25 dimer coupled to glutathione beads were
pre‐incubated with 0.01% insulin in interaction buffer (20mM Tris–HCl, 20mM NaCl, 10%
glycerol, 1mM EGTA, 1mM DTT, Complete protease inhibitors (Roche)) for 20min at 4°C. 1nmol
MBP or Bod1‐MBP was added to the beads and binding was allowed to take place for 1h at
4°C. After washing with interaction buffer, proteins were eluted with SDS loading buffer and all
eluate was loaded for immunoblot analysis. 25pmols MBP or Bod1‐MBP were loaded as input
controls.

Chapter II: Materials and Methods
56
Band intensity was determined using the ImageStudio software package. Total amount of
protein in the pull down was determined by using the input as a reference.
Binding experiments with the Bod1 fragment proteins were so far performed in duplicate. The
quantification was performed taking into account all bands, including break down products.
GenerationofBod1phospo‐peptideantibodies
Peptide antibodies were generated according to (Field et al., 1998).
Designofthephospho‐peptide
To maximize antigenicity of the peptide, the number of charged amino acids was picked such
that the overall charge of the peptide would not amount to a net charge of zero. A surface
probability plot (Figure 2. 1) of the chosen peptide indicated that T95 was likely to be surface
exposed. A cysteine residue was added at the N‐terminus to allow for thiol coupling to a
carrier protein for immunisation. The full antigenic phospho‐peptide was NH2‐
CRQKVDNFVS[pT]HLDKQ‐COOH. The full antigenic peptide for the alternative antibody, not
directed against T95, was NH2‐CRNGLRQ[pS]VVQS‐COOH. This antibody was raised to detect a
potential Aurora kinase site at serine 118 of Bod1.
FIGURE2.1SURFACEACCESSIBILITYPLOTFORTHESELECTEDBOD1T95PEPTIDE
Relative surface accessibility (RSA) was calculated using NetSurfP 1.1 (Petersen et al., 2009). Residues
were assigned to be either exposed or buried according to the cut‐off value of the algorithm.

Chapter II: Materials and Methods
57
Thiolcouplingofthephospho‐peptidetothecarrierproteinKLH
Because peptides are not large enough to elicit an immune response by themselves, they need
to be coupled to a larger carrier protein for antibody production (Harlow and Lane, 1988). The
carrier protein chosen here was keyhole limpet hemocyanin (KLH). For four injections, 100mg
KLH (Sigma) were dissolved in 2ml water and dialysed against 2l 0.1M Na phosphate buffer
pH7.8 over night. The following day, aggregates were removed by centrifugation and the
solution was warmed to room temperature. Iodoacetic acid N‐hydroxysuccinimide ester (IAA‐
NHS, Sigma) was added to 1/9th volume at 100mg/ml in DMSO. The following steps were
carried out at 4°C in minimal light conditions. The KLH solution was loaded onto a gel filtration
column containing Bio‐Gel P‐10 resin (Bio‐Rad) equilibrated with 0.1M Na phosphate pH7.8.
After filtration, KLH containing fractions were added to 10mg phospho‐peptide and incubated
over night at 4 °C. Finally, the conjugates were diluted to 5ml with 0.15M NaCl and frozen in
aliquots for injection.
Immunisationprotocol
Sheep were immunized with the immunogenic phosphopeptide and serum containing the
polyclonal antibody was collected in three batches, one test bleed and two bleeds potentially
containing the desired polyclonal antibodies (Table 2. 1). The third batch, obtained 91 days
after the initial immunisation and 7 days after the third antigen booster injection, was used for
antibody purification to maximise antibody titres by allowing enough time for the immune
response (Patil et al., 2002).
TABLE2.1IMMUNISATIONSCHEDULEFORANTIBODYGENERATIONINSHEEP
Procedure Pre‐immune bleed and
initial antigen injection
First antigen booster
injection
Test bleed Second antigen
booster injection
First blood collection Third antigen
booster injection
Second blood
collection
Week 0 4 5 8 9 12 13
Day 0 28 35 56 63 84 91

Chapter II: Materials and Methods
58
Affinitypurificationoftheantibodies
Each antibody was purified on a non‐phospho peptide column followed by a phospho‐peptide
column. The first column retained antibodies that were able to bind the unphosphorylated
peptide as well as the phosphorylated peptide, and the eluate was therefore termed
panspecific antibody. The second clolumn would only retain phospho‐specific antibodies, as all
antibodies binding both forms of the peptide would have been depleted from the serum with
the first column.
Per column, 5ml of Affigel‐10 (Biorad) were activated with 5% ethylene diamine in water to
replace the terminal N‐hydroxysuccinimide groups of the gel with amino groups. To convert
the amino group into iodoacetyl groups that can react with the terminal sulfhydryl groups of
the peptides, 7mg IAA‐NHS ester were added per ml of resin. After washing with 0.1M Na
phosphate buffer pH7.8, coupling of 5mg peptide to the fully activated resin was allowed to
take place over night. Then, residual iodoacetate groups were blocked with 0.2% β‐
mercaptoethanol and non‐covalently bound peptide was removed by consequtive washes with
0.1M NaHCO3, 1M Na2CO3, water, 0.2M glycine‐HCl pH2.0, 150mM NaCl, and TBS. The resin
was stored in 0.1% NaN3 in TBS.
Per antibody, 4ml serum were diluted 1:1 with TBS and passed through a 0.2µm filter. The
diluted serum was run over the column ten times. The column was then washed with TBS,
0.5M NaCl, 20mM Tris‐HCl pH7.4, 0.2% Triton‐X in TBS, and TBS. A low pH elution was
performed with 0.15M NaCl, 0.2M glycine‐HCl pH2.0 collecting 1ml fractions with each tube
containing 0.1ml 2MTris‐HCl pH8.5. After re‐equilibrating the pH of the column by washing
with TBS, a second, guadinuim hydrochloride elution was performed with 6M GuanidinHCl in
TBS. Samples of all fractions were spotted onto nitrocellulose membranes and protein content
was visualised with Ponceau S (Sigma). All fractions that contained antibody proteins were
pooled and dialysed into TBS over night. Antibodies were stored in 0.1% sodium azide in TBS at
4°C.

Chapter II: Materials and Methods
59
Massspectrometry
GFP‐Trap affinity purified samples from mitotic HeLa cells stably or transiently expressing
Bod1‐GFP were analysed by mass spectrometry. A stable GFP cell line and HeLa cells
transiently transfected with GFP under a ∆CMV promoter were used as controls. The whole
experiment was repeated twice giving a total of four biological replicates. The correlation
between these biological replicates was very high (Figure 2. 2 C), indicating that the datasets
could be compared with a high confidence.
Eight 15cm plates of stably transfected cells and two 15cm plates of transiently transfected
cells were arrested in mitosis using monastrol for 8h. Cells were harvested and resuspended in
lysis buffer containing 0.01% and 0.05% Triton X‐100 for stable and transient transfections
respectively. Cells were lysed using the freeze‐thaw method and immunoprecipitation was
allowed at 4°C for 90min on 25µl GFP‐Trap beads. The beads were washed with PBS, the
proteins were eluted with 2xSDS buffer and the full eluate was run on a 4‐12% SDS‐PAGE.
Bands were visualised using Coomassie Brilliant Blue (CBB) staining and lanes were cut into 4
gel pieces (Figure 2. 2 B). Gel pieces were subsequently de‐stained with ammonium
bicarbonate and acetonitrile as an organic solvent and dried completely in a vacuum
centrifuge. To unfold the proteins, 10mM DTT was used to reduce cystine disulphide bonds
and the resulting thiol groups were irreversibly alkylated to S‐carboxyamidomethylcysteine
with 55mM iodoacetamide. Excess iodoacetamide was removed and gel pieces were dried in a
vacuum centrifuge before enzymatic digestion of the proteins. In‐gel digestion was performed
with 20ng/µl trypsin in 50mM ammonium bicarbonate at 37°C o/n. Tryptic peptides were
extracted from the gel by repeated addition of 0.1%TFA/acetonitrile extraction solution and
sonication. The peptide samples were cleaned for mass spectrometry using a C18‐Ziptip
protocol (http://greproteomics.lifesci.dundee.ac.uk/).
HPLC‐MS/MS was performed at the College of Life Science mass spectrometry facility using a
C18 column and electron spray ionisation.

Chapter II: Materials and Methods
60
FIGURE2.2MASSSPECTROMERTYEXPERIMENTTOFINDBOD1INTERACTIONPARTNERSATTHE
KINETOCHORE
(A) Schematic drawing of the GFP‐Trap IP used for identifying novel Bod1 interaction partners using
subsequent mass spectrometry
(B) Coomassie gel of the immunoprecipitates of the first mass spectrometry experiment. Horizontal
lines indicate where the lanes were cut to generate four gel pieces per lane. The gel looked similar in the
second experiment (data not shown).
(C) Intensity correlation between the biological replicates. Intensity correlations between experiment 1
and 2 for stably and transiently transfected cells are shown, as well as correlation between stably and
transiently transfected cells in experiment 1. r is the Pearson correlation coefficient.
(D) Histograms for the intensity values obtained in the first mass spectrometry experiment shows
normal distribution of the data. Control and Bod1‐transfected cells for stable and transient transfections
are shown. Intensity statistics for the second experiment were similar (data not shown).
S1…stably Bod1‐GFP transfected cell lysates, experiment 1
T1…transiently Bod1‐GFP transfected cell lysates, experiment 1

Chapter II: Materials and Methods
61
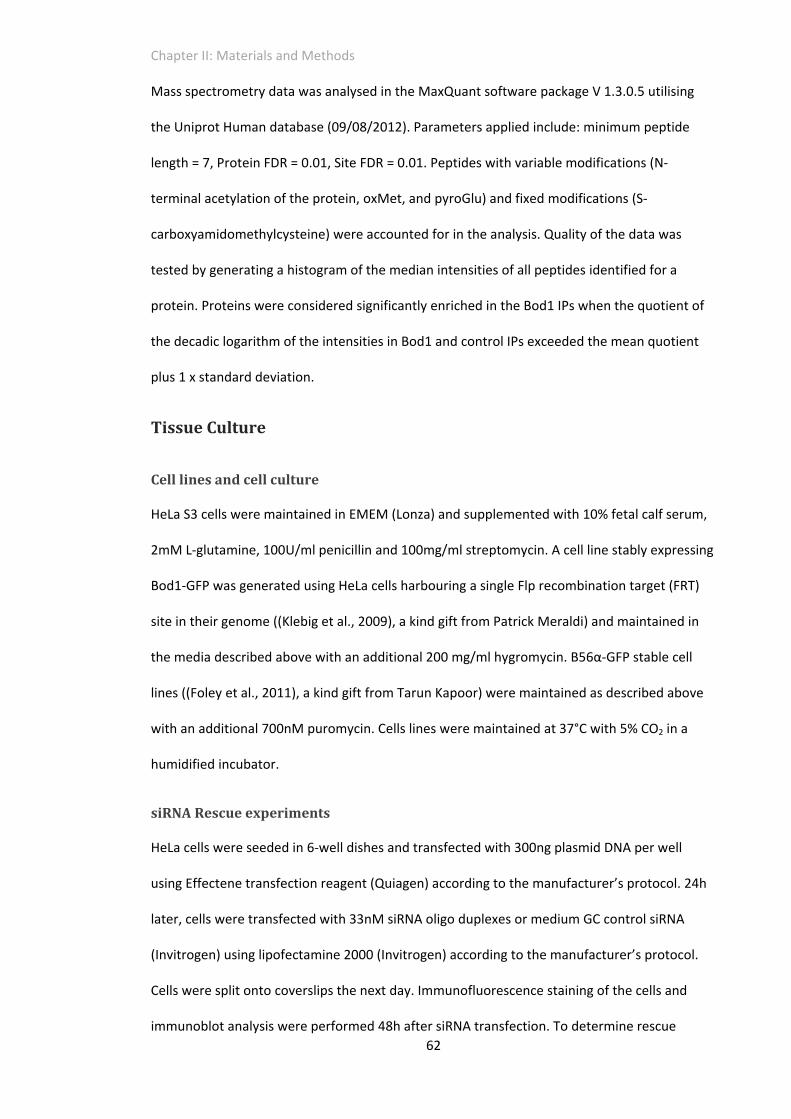
Chapter II: Materials and Methods
62
Mass spectrometry data was analysed in the MaxQuant software package V 1.3.0.5 utilising
the Uniprot Human database (09/08/2012). Parameters applied include: minimum peptide
length = 7, Protein FDR = 0.01, Site FDR = 0.01. Peptides with variable modifications (N‐
terminal acetylation of the protein, oxMet, and pyroGlu) and fixed modifications (S‐
carboxyamidomethylcysteine) were accounted for in the analysis. Quality of the data was
tested by generating a histogram of the median intensities of all peptides identified for a
protein. Proteins were considered significantly enriched in the Bod1 IPs when the quotient of
the decadic logarithm of the intensities in Bod1 and control IPs exceeded the mean quotient
plus 1 x standard deviation.
TissueCulture
Celllinesandcellculture
HeLa S3 cells were maintained in EMEM (Lonza) and supplemented with 10% fetal calf serum,
2mM L‐glutamine, 100U/ml penicillin and 100mg/ml streptomycin. A cell line stably expressing
Bod1‐GFP was generated using HeLa cells harbouring a single Flp recombination target (FRT)
site in their genome ((Klebig et al., 2009), a kind gift from Patrick Meraldi) and maintained in
the media described above with an additional 200 mg/ml hygromycin. B56α‐GFP stable cell
lines ((Foley et al., 2011), a kind gift from Tarun Kapoor) were maintained as described above
with an additional 700nM puromycin. Cells lines were maintained at 37°C with 5% CO2 in a
humidified incubator.
siRNARescueexperiments
HeLa cells were seeded in 6‐well dishes and transfected with 300ng plasmid DNA per well
using Effectene transfection reagent (Quiagen) according to the manufacturer’s protocol. 24h
later, cells were transfected with 33nM siRNA oligo duplexes or medium GC control siRNA
(Invitrogen) using lipofectamine 2000 (Invitrogen) according to the manufacturer’s protocol.
Cells were split onto coverslips the next day. Immunofluorescence staining of the cells and
immunoblot analysis were performed 48h after siRNA transfection. To determine rescue

Chapter II: Materials and Methods
63
efficiencies of the different plasmids, 100 mitotic cells per coverslip were imaged and assigned
to mitotic stages. Each rescue experiment was performed in triplicate for statistical analysis.
Imaging
Paraformaldehydepreparation
1.85g paraformaldehyde (PFA) were dissolved in 3.5ml water and 10µl 10N KOH, by placing the
mixture in a water bath in the fume hood for no more than 5min, swirling it arund until a clear
solution is obtained. The PFA solution was then filterd through a 0.2µm filter and 10µl HCl
were added to neutralise the pH. PBS was added to 45ml to yield a final concentration of 3.7%
PFA and the pH was tested with Duotest indicator paper (Machery‐Nagel).
Immunofluorescencestaining
Cells were seeded on coverslips (thickness 1.5) 24h before fixation. Cells were fixed in 37%
paraformaldehyde (PFA) in PBS for 7min at 37°C and re‐hydrated with TBS‐T before blocking
with 1% normal donkey serum in AbDil (0.25% v/v Tween‐20, 2% w/v BSA, 0.1% w/v NaN3 in
TBS). For phosphorylated kinetochore proteins, cells were pre‐permeabilised with ice‐cold
cytoskeleton (CSK) buffer (100mM NaCl, 300mM sucrose, 3mM MgCl2, 10mM PIPES (pH6.8))
containing 0.1% Triton X‐100 for 3min at 4°C before fixation with PFA at room temperature.
Primary antibodies were added diluted in AbDil for 1h. Cells were carefully washed with TBS‐T
and secondary antibodies (1:500 in AbDil, Jackson ImmunoResearch) were added for 30min.
Cells were washed again and 4',6‐Diamidino‐2‐phenylindole (DAPI, Sigma) was added at
1µg/ml in TBS for 10min to visualise chromatin. Cells were washed with TBS and mounted onto
microscope slides by inverting them into mounting medium (0.5 % p‐phenylenediamine (Free
Base; Sigma) in 20 mM Tris, pH 8.8, 90 % glycerol).
Deconvolutionmicroscopy
Three‐dimensional deconvolution image data sets were acquired on a DeltaVision imaging
system (Applied Precision) equipped with an Olympus 1‐UB836 microscope, CCD camera

Chapter II: Materials and Methods
64
(CoolSNAP_HQ/ICX285), and 100x/1.4 NA plan‐apochromat oil immersion objectives
(Olympus). Z stacks were collected 0.2µm apart and deconvolved using softWoRx (Applied
Precision).
FlowCytometry
Cells were trypsinised, washed with PBS and fixed in 1% w/v paraformaldehyde for 20min at
37°C. The fixed cells were resuspended in 70% ethanol and kept at ‐20°C until further
processing. For staining, samples were brought to room temperature and washed with 1% v/v
FBS in PBS. Cells were resuspended in 100µl of 10µg/ml Alexa Fluor 647‐conjugated phospho‐
Histone H3 (Ser10) antibody and incubated in the dark for 30min. Cells were rinsed in 1% v/v
FBS in PBS and 300ul PBS containing 10µg/ml DAPI were added to incubate for 20min before
flow cytometry analysis.
DataAnalysis
ImageQuantification
Quantification of kinetochore intensities was performed using OMERO.mtools. Kinetochores
were identified from deconvolved image stacks covering the whole cell by segmenting them
based on anti‐centromere antibody (ACA) staining using Otsu thresholding. The minimum
object size was set to 50 pixels and the perimeter of the automatically generated mask was
expanded by 4 pixels to include the outer kinetochore in the analysis. The fluorescence signal
within this mask was measured and background staining was quantified in a 2 pixel annulus
with a 1 pixel gap to the perimeter of each segmented mask. Fluorescence intensity at the
kinetochore was then calculated as the summed fluorescence intensity within the mask
subtracting the product of its size and the average background intensity in the 2 pixel annulus.
Only positive values were taken into consideration for the statistical analysis.

Chapter II: Materials and Methods
65
FIGURE2.3DETERMINATIONOFPARAMETERSFORQUANTITATIVEIMAGEANALYSIS
Minimum kinetochore size was determined by analysing the size distribution of anti‐centromere
antibody (ACA)‐based masks automatically created by the OMERO.mtools plugin. Size distribution was
analysed using line graphs (A) and histograms (B). Low size background noise (grey) was distinguished
from single (green) and paired (orange) kinetochores based on the shape of the graphs generated.
The distance between ACA‐staining and the outer kinetochore was determined by manually drawing
linear regions of interests (ROIs) in OMERO and determining their average length. (C) Single z‐section of
a metaphase HeLa cells stained for ACA (red), tubulin (blue) and pBod1 (green). Numbers indicate length
of the linear ROI in pixels and angle of the ROI. Black and white boxes demarcate the endpoints of the
ROI. Scale bars are 5µm in the upper panel and 1µm in the lower panel. (D) Bar graph of the average
distance between ACA and the outer edge of pBod1 staining in four different experiments.
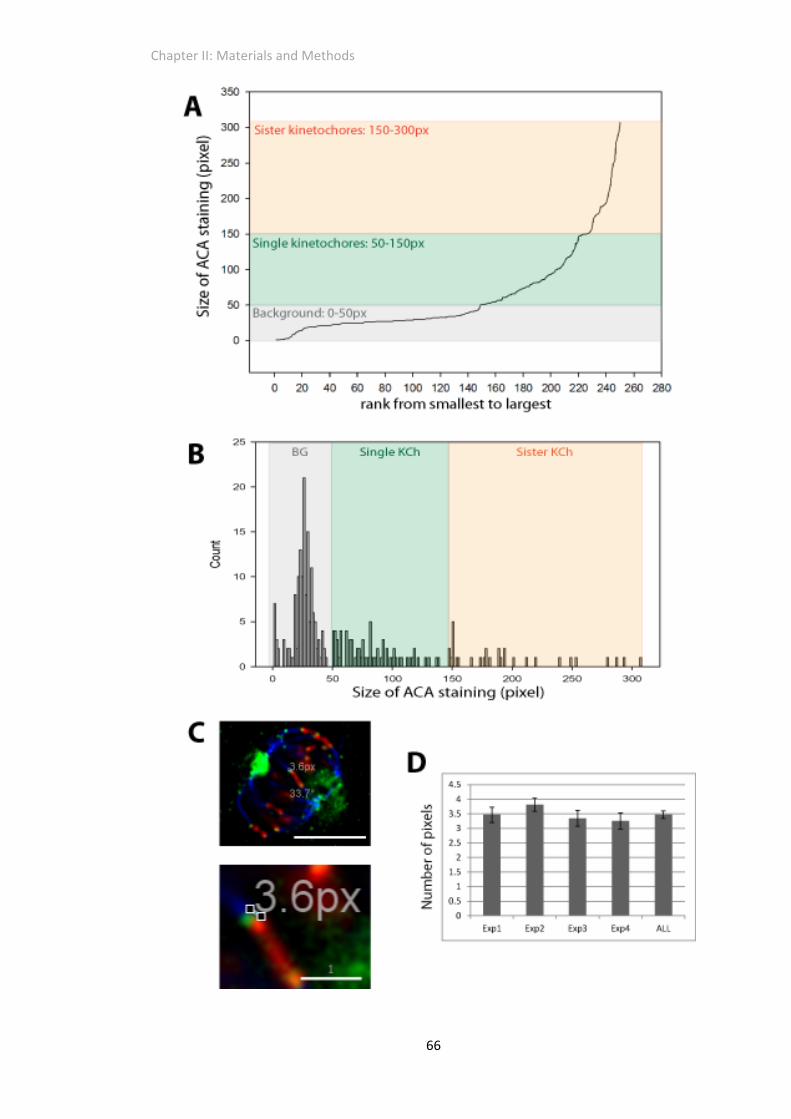
Chapter II: Materials and Methods
66

Chapter II: Materials and Methods
67
Determinationofminimumkinetochoresize
To set a minimum threshold for kinetochore size in image quantification, the size‐distribution
of ACA‐based masks in a set of images (n=28) were analysed in a line graph and histogram
(Figure 2. 3 A and B). Based on the shape of those curves, Gaussian noise was resolved for the
low end of the size spectrum and the minimum kinetochore size was set to 50 pixels.
Measurementofcentromere‐outerkinetochoredistance
To determine by what distance the ACA‐based masks generated by Otsu thresholding would
need to be expanded to include outer kinetochore staining, the distance between ACA and the
outmost point of the Bod1 kinetochore signal was measured using linear regions of interest
(ROIs) in OMERO in a multiple images within four image sets (n=12). The average distance
measured was 3‐4 pixels (Figure 2. 3 C and D).
Statistics
Statistical significance tests were performed using Sigma Plot 12.5 (Systat Software Inc.). Non‐
Gaussian distribution datasets were tested by Mann–Whitney U test, and Gaussian
distributions were tested by Student’s t test.
BioinformaticsandSoftware
Sequence Alignments were generated using Clustal W and Clustal X version 2.0 (Larkin et al.,
2007) through Jalview V2.8.1 (Waterhouse et al., 2009). Disorder profiles were predicted using
the DISOPRED algorithm (Ward et al., 2004b). Crystal structures were rendered using UCSF
Chimera V1.8 (Pettersen et al., 2004). Relative surface accessibility for peptides was calculated
by using NetSurfP V1.1 (Petersen et al., 2009). DNA sequence analysis and protein secondary
structure prediction was performed using CLC Main Workbench 6 (CLC bio). Kinases for the
T95 phosphorylation site were predicted by the KinasePhos 2.0 algorithm (Wong et al., 2007).
This algorithm assigns a SVM (support vector machine) score for each residue based on
experimentally validated phosphorylation sites from Phospho.ELM and Swiss‐Prot; as well as
taking into account protein‐specific analyses of amino acid coupling around the residue in

Chapter II: Materials and Methods
68
question and its solvent accessibility. Microscopy images were deconvolved using softWoRx
(Applied Precision). Images were rendered using OMERO software V5.0.1 (Allan et al., 2012).
Image quantification was performed using a MatLab‐based plugin toolset for OMERO,
OMERO.mtools. Mass spectrometry data was analysed in the MaxQuant software package
V1.3.0.5 (Cox and Mann, 2008). LI‐COR images were quantified using Image Studio software
V2.0 (LI‐COR). Statistical analysis was performed using Sigma Plot 12.5 (Systat Software Inc.).
Figures were compiled using Adobe Illustrator CS5.1 and OMERO.figure.
Chemicalsandreagents
Monastrol was used at 100nM over night. STLC was used at 5µM over night. RO‐3306 was used
at 10µM as indicated. MG 132 was used at 10µM for 1h. Taxol was used at 8nM over night.
Nocodazole was used at 100ng/ml for 2h. 4',6‐Diamidino‐2‐phenylindole (DAPI) was used at
1µg/ml for immunofluorescence staining or 10µg/ml for flow cytometry. Kanamycin was used
at 50µg/ml. Ampicillin was used at 50µg/ml. Hygromycin was used at 200 mg/ml. Puromycin
was used at 700nM. Isopropyl β‐D‐1‐thiogalactopyranoside (IPTG) was used at 0.1mM.
Dimethyl pimelimidate (DMP) was used at 12.5mg/ml. Dithiothreitol (DTT) was used at 1mM.
Buffersandsolutions
TAE buffer (50x stock)
2.5M Tris‐acetate, 50mM EDTA (pH 8.0)
LB (Luria‐Bertani) liquid medium
10g/l Tryptone, 10g/L NaCl, 5g/L Yeast extract
LB agar
20g/l Agar, 10g/l Tryptone, 10g/L NaCl, 5g/L Yeast extract

Chapter II: Materials and Methods
69
Cell lysis buffer
20mM Tris acetate pH 7.5, 1mM EGTA, 1mM EDTA, 10mM Na‐β‐glycerophosphate, 5mM Na‐
pyrophosphate, 1mM Na‐orthovanadate, 50mM NaF, 1µM microcystin*, 0.27M sucrose*,
0.01%‐0.1% Triton‐X‐100*, 10µg/ml leupeptin*, 10µg/ml pepstatin*, 10µg/ml aprotinin*
*items added fresh at the time of cell lysis
Phosphate‐buffered saline (PBS)
137mM NaCl, 2.7mM KCl, 10mM Na2HPO4, 1.8mM KH2PO4
Tris‐buffered saline (TBS)
150mM NaCl, 50mM Tris‐Cl (pH 7.5)
TBS‐T (Immunoblot)
150mM NaCl, 50mM Tris‐Cl (pH 7.5), 0.02% TritonX‐100
TBS‐T (Immunofluorescence staining)
150mM NaCl, 50mM Tris‐Cl (pH 7.5), 0.1% TritonX‐100
SDS electrophoresis loading buffer
2xLDS buffer (Life technologies), 5% β‐mercaptoethanol
MOPS electrophoresis running buffer
0.2M MOPS (pH7.0), 20mM sodium acetate, 10mM EDTA (pH8.0)
Phosphatase reaction buffer
50mM HEPES, 1mM dithiothreitol (DTT), 1mM EDTA and 0.1% NP40

Chapter II: Materials and Methods
70
Protease buffer
50mM Tris‐HCl pH 7.5, 100mM NaCl, 1mM DTT
Pull down buffer
20mM Tris‐HCl pH 7.5, 20mM NaCl, 10% glycerol, 1mM EGTA, 1mM DTT
Protein complex wash buffer
20mM Hepes pH7.6, 150‐300mM NaCl, 1mM DTT, Complete protease inhibitors (Roche), 0.1‐
0.2% Triton‐X 100
Protein complex interaction buffer
20mM Tris–HCl pH 7.5, 20mM NaCl, 10% glycerol, 1mM EGTA, 1mM DTT, Complete protease
inhibitors (Roche)
Bonsai lysis buffer
25mM Tris‐Cl pH7.6, 300mM NaCl, 1mM EDTA, 1mM DTT, 1 tablet/50ml Complete protease
inhibitors (Roche)
Superdex buffer
25mM Tris‐Cl pH7.6, 300mM NaCl, 1mM EDTA, 5% glycerol
100ml of 1M Sodium phosphate buffer pH7.8
89.6ml 1M Na2HPO4 + 10.4ml NaH2PO4
AbDil
0.25% v/v Tween‐20, 2% w/v BSA, 0.1% w/v NaN3 in TBS

Chapter II: Materials and Methods
71
Cytoskeleton (CSK) buffer
100mM NaCl, 300mM sucrose, 3mM MgCl2, 10mM PIPES (pH6.8)
Mounting medium
0.5 % p‐phenylenediamine (Free Base; Sigma) in 20 mM Tris, pH 8.8, 90 % glycerol
Antibodies
AntibodiesusedinChapterIII
Rabbit anti‐Bod1 (Porter et al., 2007) was used at 1:100 for WB. Mouse anti‐B56α (Abcam) was
used at 1:500 for WB and 0.02mg/ml for IP. Mouse anti‐B56δ (Abcam) was used at 1:500 for
WB and 0.02mg/ml for IP. Mouse anti‐PP2Ac (Millipore, 1D6) was used at 1:1,000 for WB. Goat
anti‐PP2A‐A (Santa Cruz) was used at 1:5,000 for WB. Mouse anti‐MBP (NEB) was used at
1:20,000 for WB. Mouse anti‐GFP (Roche) was used at 1:1,000 for WB. Mouse anti‐tubulin
(Sigma‐Aldrich, DM1A) was used at 1:1,000 for WB. Mouse anti‐B55 (Santa Cruz, D‐10) was
used at 1:500 for WB. Rabbit anti‐Bod1 (Abcam) was used at 1:500 for WB. Goat anti‐GST
(Abcam) was used at 1:5,000 for WB. IRDye 680LT Donkey Anti‐Mouse IgG (H+L) (LI‐COR) was
used at 1:20,000 for WB. Anti‐rabbit IgG, HRP‐linked (Cell Signalling) was used at 1:5,000 for
WB. Donkey Anti‐Goat IgG, HRP‐linked (Promega) was used at 1:20,000. Sheep anti‐mouse IgG,
HRP‐linked (GE Healthcare) was used at 1:10,000.
AntibodiesusedinChapterIV
Polyclonal sheep Bod1 antibodies were used at 2ug/ml for WB and 0.5µg/ml for IF. Rabbit anti‐
Bod1 (Abcam) was used at 1:500 for WB. Mouse anti‐Vinculin (Abcam, SPM227) was used at
1:10,000 for WB. Rat anti‐tubulin (AbD Serotec) was used at 1:500 in IF. Human anti‐
centromere autoantisera (ACA), (a kind gift from Sara Marshall, Ninewells Hospital, Dundee)
was used at 1:1,000 for IF. Rabbit anti‐phospho Histone H3 (Ser(10) (Millipore) was used at
1:500 for IF. Secondary anti‐sheep HRP (Sigma) was used at 1:20000. Secondary antibodies for
IF (Jackson ImmunoResearch) were used at 1:150.

Chapter II: Materials and Methods
72
AntibodiesusedinChapterV
Mouse anti‐B56α (BD Biosciences) was used at 1:100 for IF. Human ACA used at 1:1,000. Rat
anti‐tubulin (AbD Serotec) was used at 1:500 in IF. Mouse anti‐B56α (Abcam) was used at
1:500 for WB. Mouse anti‐B56δ (Abcam) was used at 1:500. Mouse anti‐Vinculin (Abcam,
SPM227) was used at 1:10,000 for WB. Mouse anti‐Hec1 (Abcam, 9G3) was used at 1:1000 for
WB and 1:500 for IF. Mouse anti‐Nuf2 (Abcam) was used at 1:1,000 for WB and 1:300 for IF.
Rabbit anti‐Spc24 (Abcam, EPR11548(B)) was used at 1:1000 for WB. Mouse anti‐MBP (NEB)
was used at 1:20,000 for WB. Goat anti‐GST (Abcam) was used at 1:5,000 for WB. Rabbit anti‐
Hec1 (phospho Ser 55) antibody (GeneTex) was used at 1:300 for IF. Rabbit anti‐Dsn1
(GeneTex) was used at 1:300 for IF. Rabbit anti‐CASC5 (Knl1, Abcam) was used at 1:1,000 in IF.
CENPU (Mlf1,Rockland) was used at 1:200 for IF. Polyclonal sheep Bod1 antibodies were used
at 0.5µg/ml for IF. Mouse anti‐GFP (Roche) was used at 1:1,000 for WB. Rabbit anti‐phospho
Histone H3 (Ser10), Alexa Fluor 647 conjugate (Cell Signalling) was used at 10µg/ml for flow
cytometry.

Chapter II: Materials and Methods
73
Primers
Sequencingprimers
Primer Name Sequence (5’ to 3’)
pCMV5 Fwd CGCAAATGGGCGGTAGGCGTG
pCMV5 Rev CCTCCACCCCATAATATTATAGAAGGACAC
pGEX Fwd CCAGCAAGTATATAGCATGG
pGEX Rev CCGGGAGCTGCATGTGTCAGAGG
pFastBac Fwd TATTCCGGATTATTCATACCGTC
pFastBac Rev GTATGGCTGATTATGATCCTC
Mal‐F GGTCGTCAGACTGTCGATGAAGCC
Mal‐R AATCTTATCTCATCCGCCAAAACAGCCAAG
Cloningprimers
Primer Name Sequence (5’ to 3’)
Bod1 EcoRI fwd TATGAATTCATGGCGGACGGCGG
Bod1 Stop NotI rev TATGCGGCCGCTTTAGGAAGTGTCCTGAG
dGRR‐Bod1 Start EcoRI fwd TATGAATTCATGCCCATCAACCCGGCC
dUb1‐Bod1 Start EcoRI fwd GAGGAATTCATGAACCAGTTGCGAAATGGTCTGAG
dPRR‐Bod1 AgeI rev TATACCGGTGCTGCTTTTTTCTGGGCC
dUb2‐Bod1 AgeI rev CCTACCGGTGCATCCACCACCTGAGAAATAATC
Bod1 AgeI rev TATACCGGTGCGGAAGTGTCCTGAGATGGAG
dPRR‐Bod1 Stop HindIII rev ACCAAGCTTCCGTTATGCTTTTTTCTGGGCC
dUb2‐Bod1 Stop HindIII rev AGCAAGCTTCGGTTAATCCACCACCTGAG
Bod1 Stop HindIII rev TAAAGCTTCGTACCGGTTTAGGAAGTGTCCTGAGATG
B56delta EcoRI fwd ACGCGAATTCATGCCCTATAAACTG
B56delta NotI rev TATAGCGGCCGCTTAGAGAGCCTCCTG

Chapter II: Materials and Methods
74
Mutagenesisprimers
Primer Name Sequence (5’ to 3’)
Bod1 S94A fwd AGAAAGTGGATAATTTTGTGGCAACACATCTGGACAAGCAG
Bod1 S94A rev CTGCTTGTCCAGATGTGTTGCCACAAAATTATCCACTTTCT
Bod1 S94E fwd GCAGAAAGTGGATAATTTTGTGGAAACACATCTGGACAAGCAGGAA
Bod1 S94E rev TTCCTGCTTGTCCAGATGTGTTTCCACAAAATTATCCACTTTCTGC
Bod1 T95A fwd GTGGATAATTTTGTGTCAGCACATCTGGACAAGCAGG
Bod1 T95A rev CCTGCTTGTCCAGATGTGCTGACACAAAATTATCCAC
Bod1 T95E fwd TGAGGCAGAAAGTGGATAATTTTGTGTCAGAACATCTGGACAAGCA
Bod1 T95E rev TGCTTGTCCAGATGTTCTGACACAAAATTATCCACTTTCTGCCTCA
Bod1 D98A fwd TGTGTCAACACATCTGGCCAAGCAGGAATGGAATC
Bod1 D98A rev GATTCCATTCCTGCTTGGCCAGATGTGTTGACACA
siRNAs
Protein siRNA sequence Sequence reference
Control Stealth™ RNAi siRNA Negative Control, Med GC (Invitrogen)
Bod1 5’‐GCCACAAAUAGAACGAGCAAUUCAU‐3’ (Porter et al., 2007)
Hec1 5’‐AAGTTCAAAAGCTGGATGATCTT‐3’ (Martin‐Lluesma et al., 2002)
PP2A‐B56 pool (Foley et al., 2011)
B56α(PPP2R5A) 5’‐GCUCAAAGAUGCCACUUCA‐3’
B56β(PPP2R5B) 5’‐CGCAUGAUCUCAGUGAAUA‐3’
B56γ(PPP2R5C) 5’‐GGAUUUGCCUUACCACUAA‐3’
B56δ(PPP2R5D) 5′‐UCCAUGGACUGAUCUAUAA‐3′
B56ε(PPP2R5E) 5’‐UUAAUGAACUGGUGGACUA‐3’

Chapter III: Bod1 binds to PP2A‐B56 and inhibits PP2A activity
75
ChapterIII:Bod1bindstoPP2A‐B56andinhibitsPP2Aactivity
Bod1 depletion in HeLa cells leads to a biorientation defect with increased syntelic attachment
errors. Based on the sequence similarity of Bod1 with recently described inhibitors of the
protein phosphatase 2A (PP2A), the experiments described in the following aim to determine,
whether the kinetochore protein Bod1 acts in an analogous manner to Arpp‐19 and Ensa to
regulate PP2A activity during the process of kinetochore‐microtubule attachment.
Results
Bod1interactswithaPP2A‐B56holocomplexandinhibitsitsactivity
To test whether Bod1 could interact with any PP2A holocomplexes, Bod1‐GFP was
immunoprecipitated from HeLa cells stably expressing Bod1‐GFP using GFP‐Trap beads. To
focus on Bod1’s role in mitosis, cells were arrested in prophase with the kinesin‐inhibitor
monastrol (Kapoor et al., 2000) before preparing the cell lysates. The immunoprecipitate
contained the catalytic and a B56 regulatory subunit of PP2A (Figure 3. 1 A). B55 could not be
detected in this experiment. To test the specificity of the interaction, the experiment was
repeated using B56δ‐specific antibodies conjugated to sepharose beads in a reciprocal
approach (Figure 3. 1 B). Bod1‐GFP could be detected with a Bod1‐specific antibody in the
B56δ‐ but not the IgG precipitation. Some background staining was observed in both samples
due to lack of crosslinking of the antibody to the beads. To test whether Bod1 interaction with
PP2A was limited to B56δ isoform containing complexes, a B56α‐specific antibody was used in
an analogous experiment (Figure 3. 1 D). This time, IgG background was avoided by cross‐
linking of the antibodies to protein G sepharose using DMP. Bod1‐GFP, but not GFP, interacted
specifically with the anti‐B56α‐beads. Lastly, B56α‐GFP was precipitated from a B56α‐GFP
containing HeLa cell line (a kind gift from E.A. Foley). Both the catalytic subunit of PP2A and
endogenous Bod1 were enriched in the B56α‐GFP precipitates over controls (Figure 3. 1 C).

Chapter III: Bod1 binds to PP2A‐B56 and inhibits PP2A activity
76
FIGURE3.1BOD1INTERACTSWITHPP2A‐B56INMITOTICHELACELLS
(A) Bod1‐GFP was immunoprecipitated with GFP‐Trap from stably transfected, monastrol arrested
HeLa cells. PP2A catalytic subunit, B56δ and B55 regulatory subunits were probed by immunoblot.
(B) B56α‐GFP was immunoprecipitated with GFP‐Trap from stably transfected, monastrol arrested
HeLa cells. Endogenous Bod1 and PP2A subunits were probed by immunoblot.
(C) B56δ was immunoprecipitated with B56δ‐specific antibodies bound to Protein G sepharose from
stably Bod1‐GFP transfected, monastrol arrested HeLa cells. Bod1‐GFP co‐precipitation was assesed
by immunoblot.
(D) B56α was immunoprecipitated with B56α‐specific antibodies crosslinked to Protein G sepharose
from stably Bod1‐GFP transfected, monastrol arrested HeLa cells. Bod1‐GFP co‐precipitation was
assessed by immunoblot. The arrowhead indicates B56α‐specific bands. The asterisk indicates
unspecific bands in the input and unbound fractions.

Chapter III: Bod1 binds to PP2A‐B56 and inhibits PP2A activity
77

Chapter III: Bod1 binds to PP2A‐B56 and inhibits PP2A activity
78
The Bod1‐PP2A complexes from the IPs described above were subsequently used for assessing
the impact of Bod1 binding on PP2A activity. Bod1‐GFP was immunoprecipitated from mitotic
HeLa cells as before. The precipitates were then incubated with synthetic phosphopeptides
resembling the phosphorylated polo binding domain of the kinetochore protein CENPU/PBIP1.
Importantly, this incubation step was carried out under conditions that would either allow or
disrupt binding of PP2A to immobilised Bod1. Dissociation of PP2A from Bod1 was achieved
through addition of high salt and detergent to the reaction buffer (Figure 3. 2 C). Phosphatase
activity was quantified using a colorimetric assay based on malachite green as a chromophore
(Figure 3. 2 B). The phosphate release in mild conditions permissive of Bod1 binding was
significantly reduced compared to when PP2A was released from the complex. Phosphatase
activity measured in this assay was inhibited by 2nM okadaic acid, a PP2A inhibitor. These
experiments demonstrate that Bod1 binds to PP2A‐B56 in mitotic HeLa cells and that it has the
propensity to reduce PP2A phosphatase activity to a kinetochore substrate.
Bod1interactionwithPP2Adependsonaphospho‐motifthatisconservedbetween
Bod1,Arpp‐19,andEnsa
Binding of Arpp‐19 and Ensa to PP2A‐B55 depends on the conserved FDSGDY‐motif (Gharbi‐
Ayachi et al., 2010; Mochida et al., 2010). To test whether the corresponding aspartate D98 in
Bod1 as well as the upstream S94 and T95 were similarly important to Bod1 function, inert
alanine and phosphomimetic glutamate residues were substituted as applicable. Initially, wild
type and mutant Bod1‐GFP constructs were tested for their ability to rescue the characteristic
biorientation defect in Bod1‐depleted HeLa cells (Figure 3. 3 A). Although the overexpression
of Bod1‐GFP alone in a wild type background has not been associated with adverse effects
(Porter et al., 2007), it was interesting to note that in these rescue experiments the
biorientation defect was only partially rescued by wild type Bod1‐GFP.

Chapter III: Bod1 binds to PP2A‐B56 and inhibits PP2A activity
79
FIGURE3.2BOD1INHIBITSPP2AACTIVITY
Bod1 immunoprecipitates were incubated with phospho‐PBIP1tide in the presence or absence of high
concentrations of salt and detergent. Phosphate release was assayed using a malachite green phosphate
detection kit, n=4.
(A) Schematic drawing of the PP2A phosphatase assay showing the GFP‐Trap IP and the
phosphopeptide used.
(B) Quantification of phosphatase activity as a function of the free phosphate detected in the malachite
green phosphatase assay (result courtesy of Iain Porter).
(C) Immunoblot showing the ability of PP2A to bind Bod1‐GFP in low and high salt conditions (result
courtesy of Iain Porter).

Chapter III: Bod1 binds to PP2A‐B56 and inhibits PP2A activity
80
Chapter III: Bod1 binds to PP2A‐B56 and inhibits PP2A activity
81
This might indicate that the function of Bod1 was partially inhibited by the large GFP tag or
else that overexpression of the construct in the absence of endogenous protein was not well
tolerated. Using the partial rescue of the wild type construct as a reference, only the
phosphomimetic T95E mutant was able to rescue the Bod1 siRNA‐induced biorientation
defect. The alanine mutants collectively showed similar fractions of biorientation defective
cells as GFP controls. Substitution of S94 to glutamate was not nearly as effective as T95E in
rescuing the phenotype.
To examine the effect of the above mutations on PP2A binding, the mutated Bod1‐GFP
constructs were transiently expressed in HeLa cells and their ability to bind PP2A was tested by
immunoprecipitation (Figure 3. 3 B). In this experiment, B56δ‐specific antibodies cross‐linked
to sepharose beads were used to precipitate PP2A‐B56 and the amount of co‐precipitating
Bod1‐GFP was determined by immunoblot. The alanine mutants of D98 and T95 showed
weaker binding than wild type Bod1‐GFP and only Bod1(T95E)‐GFP was pulled down with
PP2A‐B56δ as effectively as the wild type protein. T95 and D98 thus have important roles in
PP2A binding as well as Bod1 function in chromosome alignment.
The importance of these residues is emphasised by the fact that the STHLD motif is conserved
among species (Figure 3. 4 A). Conservation is especially high among vertebrates: all
vertebrates contain S94 and T95 (except the serine and the threonine is inverted in puffer
fish), and all vertebrate sequences bar fish contain D98. According to the kinase prediction
algorithm KinasePhos 2.0 (Wong et al., 2007) S94 and T95 could be phosphorylated by
different kinases (Figure 3. 4 B). In an in vitro kinase assay, purified Cdk1‐cyclinB could
phosphorylate recombinant wild type Bod1‐GST, but not the alanine mutants of S94 or T95
(Figure 3. 4 C). Three other mitotic kinases, Aurora A, Aurora B and Plk1, were also tested but
could not specifically phosphorylate this site (Iain Porter, unpublished results).

Chapter III: Bod1 binds to PP2A‐B56 and inhibits PP2A activity
82
FIGURE3.3T95ANDD98ARECRITICALFORBOD1FUNCTIONINBIORIENTATIONANDITS
INTERACTIONWITHPP2A‐B56
(A) HeLa cells were co‐transfected with the indicated siRNA and plasmids expressing GFP alone or
siRNA‐resistant GFP‐Bod1 variants. 48h after transfection with the siRNA, cells were fixed and processed
for immunofluorescence microscopy. Biorientation defects were scored using tubulin and DNA markers.
100 cells were counted per condition, n=3. (B) HeLa cells were transiently transfected with GFP, Bod1‐
GFP or Bod1‐GFP mutated at the indicated sites. B56δ was immunoprecipitated from monastrol
arrested cells as before and co‐precipitation of any GFP‐tagged constructs was assessed by immunoblot.

Chapter III: Bod1 binds to PP2A‐B56 and inhibits PP2A activity
83
FIGURE3.4THESTHLDDOMAININBOD1CANBEPHOSPHORYLATEDBYCDK1INVITRO
(A) Clustal W sequence alignment of Bod1 protein found in various species. Intensity of blue shading
indicates percent identity. Red box highlights the STHLD domain.
(B) Summary of kinase activity prediction towards the STHLD domain. Table shows results based on
KinasePhos 2.0 algorithm. SVM (support vector machine) score indicates probability of kinase activity
towards the residue. Input was full length Bod1.
(C) Recombinant WT, S94A or T95A GST‐Bod1 was produced in E. coli and incubated in buffer
containing γ‐32P ATP and recombinant Cdk1‐cyclin B. Incorporation of γ‐32P was analysed by
autoradiography, total protein was visualised by Coomassie staining (result courtesy of Iain Porter).
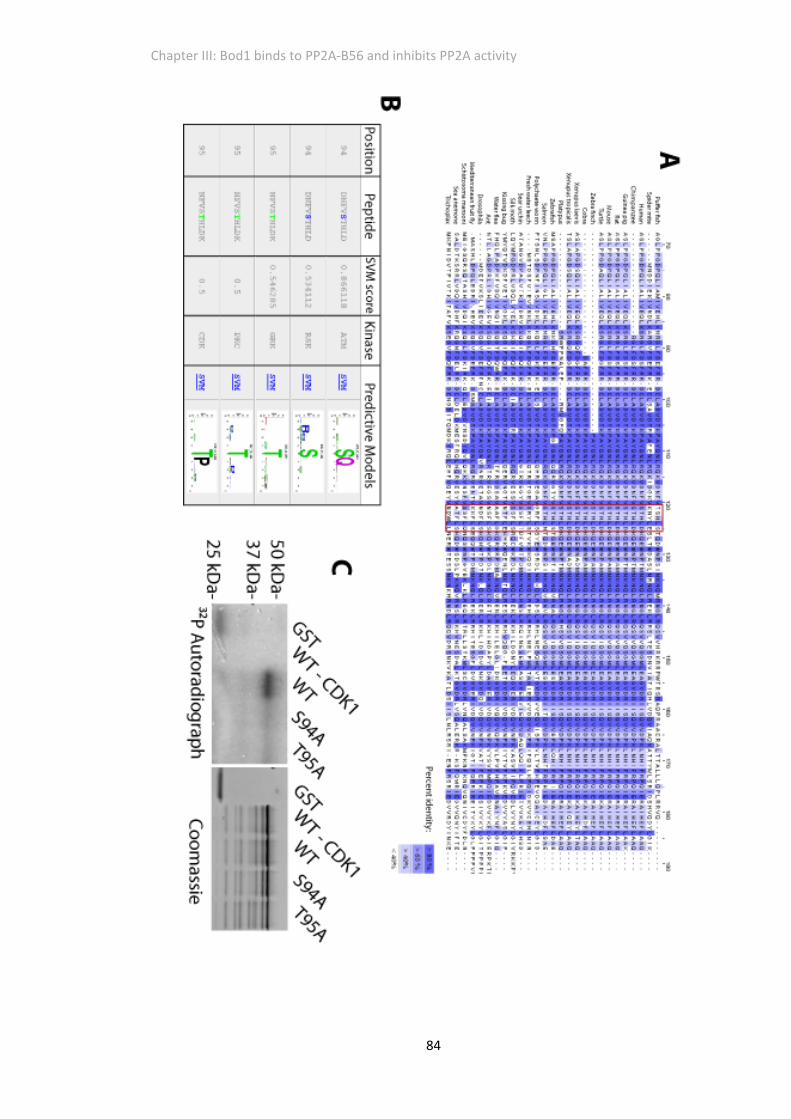
Chapter III: Bod1 binds to PP2A‐B56 and inhibits PP2A activity
84

Chapter III: Bod1 binds to PP2A‐B56 and inhibits PP2A activity
85
InvitrobindingofBod1tothePP2AholocomplexisdependentonT95
phosphomimeticmutation
In order to show that the interaction between PP2A‐B56 and Bod1 was direct and not
mediated by other factors co‐purified from HeLa cells, the PP2A‐Bod1 complex was
reconstituted in vitro.
First, it was investigated whether Bod1 could bind to any of the PP2A subunits alone. PP2A
subunits were expressed in BL21 cells and the GST tag was cleaved off. Bod1‐GST (Figure 3. 5
A) or GST as a control (Figure 3. 5 B) were immobilised on sepharose beads and incubated with
either of the purified PP2A subunits or BSA. Binding was assessed by immunoblot with subunit‐
specific antibodies. B56δ binding could not be observed in Bod1‐GST or GST samples. At the
same time, PP2A‐A and PP2A‐C could not be shown to be enriched in the Bod1‐GST samples
over GST‐sepharose background in the chosen conditions.
Considering that interaction of PP2A with its mitotic binding partner shugoshin involves
cooperative binding of the B‐ and C‐subunits, we hypothesised that Bod1 binding might
require holocomplex assembly. Initially, a full recombinant approach was taken by either
incubating Bod1 with all three purified subunits or allowing some incubation time for the PP2A
heterotrimer to assemble first and then adding recombinant Bod1‐GST (Figure 3. 6 A). GST
alone was used as a control (Figure 3. 6 B). As before, binding of PP2A‐B56δ could not be
observed in any of the samples, whereas PP2A‐C was not enriched in the Bod1‐GST samples.

Chapter III: Bod1 binds to PP2A‐B56 and inhibits PP2A activity
86
FIGURE3.5BOD1DOESNOTINTERACTSPECIFICALLYWITHPURIFIEDSINGLEPP2ASUBUNITSIN
VITRO
Bod1(T95E)‐GST or GST were immobilised on sepharose beads and incubated with untagged PP2A
subunits (A, C, and B56δ) or BSA as a control. Pull down of the PP2A subunits was assayed by
immunoblot. Total protein in each pull down was visualised with Ponceau S staining and the membrane
was then cut for analysis with antibodies against Bod1 (A) or GST (B), as well as the different PP2A
subunits.
(A) Ponceau staining and immunoblots of pull downs using Bod1(T95E)‐GST as bait.
(B) Ponceau staining and immunoblots of pull downs using GST as bait.
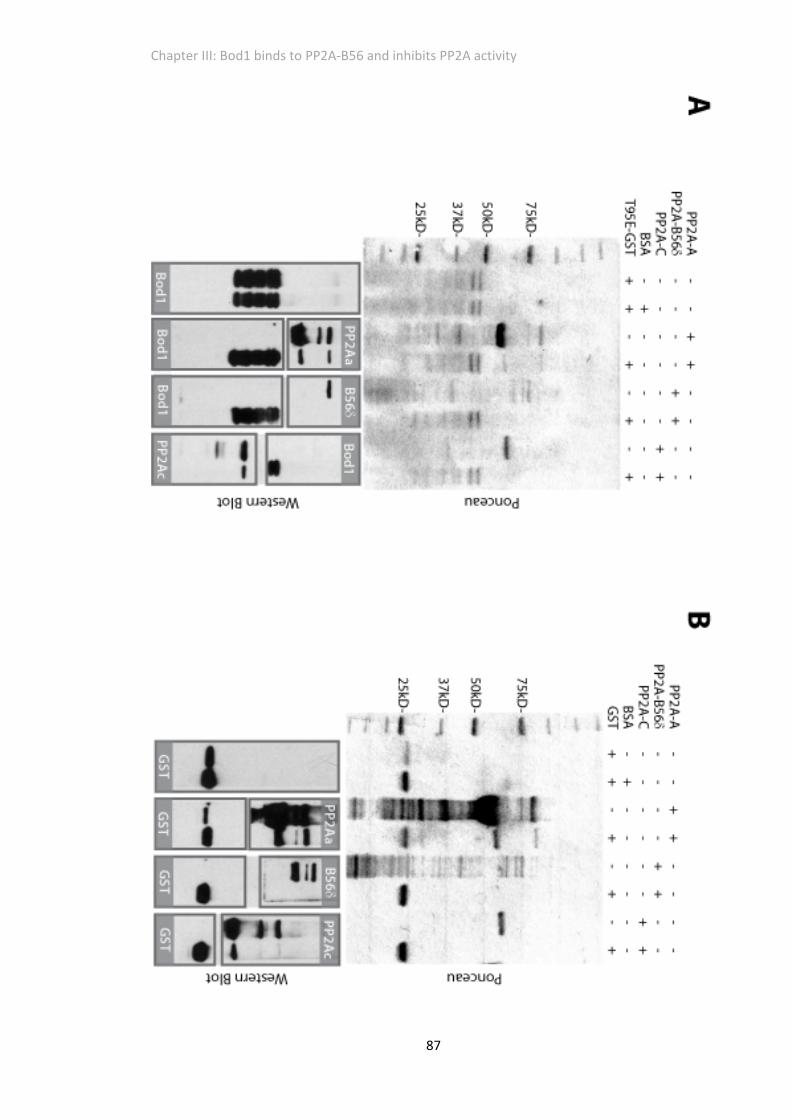
Chapter III: Bod1 binds to PP2A‐B56 and inhibits PP2A activity
87

Chapter III: Bod1 binds to PP2A‐B56 and inhibits PP2A activity
88
FIGURE3.6ASTOICHIOMETRICMIXOFPURIFIEDPP2ASUBUNITSANDBOD1‐GSTDOESNOT
FORMACOMPLEXINVITRO
(A) Bod1(T95E)‐GST coupled to sepharose beads was added to a stoichiometric mix of PP2A subunits,
either directly or after an incubation period allowing for pre‐assembly (pa) of the subunits. Binding was
assayed by immunoblotting.
(B) As a control, GST was added to a stoichiometric mix of PP2A subunits, either directly or after an
incubation period allowing for pre‐assembly (pa) of the subunits. Binding was assayed by
immunoblotting.

Chapter III: Bod1 binds to PP2A‐B56 and inhibits PP2A activity
89

Chapter III: Bod1 binds to PP2A‐B56 and inhibits PP2A activity
90
The fact that PP2A‐B56δ was not detected in any of the PP2A‐C containing pull downs
indicated that the PP2A holocomplex was not able to form by simply incubating the purified
PP2A subunits in solution. Since interactions with the C‐subunit and modifications of the C‐
terminal tail subunit have been shown to influence B56 subunit association with the
holocomplex (Janssens et al., 2008), I was concerned that the bacterially expressed protein did
not assume the correct conformation for holocomplex assembly with full length B56δ. In
search for conditions that were permissive to holocomplex formation, the scaffolding subunit
PP2A‐A was purified as a recombinant protein with a GST tag and immobilised on glutathione
beads. The native C‐subunit was added by incubating the A subunit with mitotic HeLa cell
extracts. This only led to A/C dimer formation, B56δ was not co‐purified. Holocomplex
formation was then attempted by adding purified B56δ (Figure 3. 7 A). With this experimental
approach, PP2A‐C was considerably enriched over GST‐containing beads. In fact, the C‐subunit
could not be detected at all in the GST control by immunoblot, indicating that the core dimer
was formed successfully. However, the purified B56δ subunit did not interact with the semi‐
recombinant core‐enzyme.
For the generation of the PP2A‐B56 crystal structure, a truncated form of B56γ had been used
(Cho and Xu, 2007) and previous biochemical experiments with PP2A were often based on
PP2A core enzyme purified from cellular extracts retaining its catalytic activity (Adams and
Wadzinski, 2007; Mochida et al., 2009). Taking these results into account, a different approach
was tested for the assembly of a full PP2A holocomplex in vitro: The B56γ‐GST vector from the
original publication was obtained as a generous gift from Wenquing Xu and the recombinant
protein was purified retaining the GST tag. The B56 subunit was then used to co‐precipitate
A/C core dimers from mitotic HeLa cells, successfully generating a semi‐recombinant
holocomplex (Figure 3. 7 B). The PP2A holocomplex was next incubated with MBP, Bod1‐MBP
or Bod1(T95E)‐MBP (Figure 3. 7 C). In agreement with the in vivo data (Figure 3. 3), the T95E
mutant had a much higher affinity for PP2A‐B56 in vitro than the wild type protein.

Chapter III: Bod1 binds to PP2A‐B56 and inhibits PP2A activity
91
Finally, the phosphatase activity of in vitro assembled PP2A was measured in the presence and
absence of Bod1. After assembly of the holocomplex, PP2A was incubated with MBP, Bod1‐
MBP or Bod1(T95E)‐MBP. Phosphopeptides were added to the full complexes and any
inorganic phosphate released from this step was measured in a malachite green phosphatase
assay (Figure 3. 8 A). Only addition of Bod1(T95E)‐MBP was able to reduce the phosphatase
activity to levels similar to the PP2A inhibitor okadaic acid. Addition of wild type recombinant
Bod1‐MBP showed little, addition of MBP showed no effect. Holocomplex formation was
tested after the experiment (Figure 3. 8 B).

Chapter III: Bod1 binds to PP2A‐B56 and inhibits PP2A activity
92
FIGURE3.7BOD1(T95E)BINDSTOASEMI‐RECOMBINANTPP2AHOLOCOMPLEXINVITRO
Different approaches for semi‐recombinant PP2A holocomplex formation (A, B) and binding of Bod1 to
the semi‐recombinant holocomplex (C).
(A) Binding of PP2A‐B56δ to semi‐recombinant core‐dimers assembled on purified PP2A‐A‐GST or GST
alone was assessed in different buffer conditions. Tx…TritonX‐100 detergent.
(B) PP2A‐B56γ‐GST or GST were immobilised on sepharose beads and association of PP2A‐A/C
complexes from HeLa cells in different buffer conditions was assessed by immunoblotting.
(C) MBP, MBP‐wtBod1 or MBP‐T95E‐Bod1 were incubated with in vitro reconstituted PP2A‐B56 and
analysed by immunoblotting for binding to the holocomplex.

Chapter III: Bod1 binds to PP2A‐B56 and inhibits PP2A activity
93

Chapter III: Bod1 binds to PP2A‐B56 and inhibits PP2A activity
94
FIGURE3.8BOD1(T95E)REDUCEDACTIVITYOFINVITROASSEMBLEDPP2A
(A) PP2A complexes were assembled as described previously, and PP2A activity in samples treated with
okadaic acid (OA), MBP, Bod1‐MBP, or Bod1(T95E)‐MBP was assessed based on nmol phosphate
released from phospho‐PBIPtides as determined in a malachite green phosphatase assay. MBP, Bod1‐
MBP and Bod1(T95E)‐MBP were also tested without the presence of PP2A in the phosphatase assay
(mock samples). Statistical test performed was Mann‐Whitney U‐test, n=3. Asterisks indicate significant
changes.
(B) Immunoblot of the samples used in (A) was performed to determine the amount of Bod1‐PP2A
complex in each sample. Ub1…unbound fraction of the first incubation step (glutathione sepharose
incubated with B56‐GST), ub2…unbound fraction of the second incubation step (HeLa cell lysates
incubated with B56‐coated beads).

Chapter III: Bod1 binds to PP2A‐B56 and inhibits PP2A activity
95
Chapter III: Bod1 binds to PP2A‐B56 and inhibits PP2A activity
96
Discussion
The data presented here demonstrate that Bod1 binds to PP2A‐B56 in HeLa cells and in vitro. A
threonine residue in the Bod1 sequence, T95, was identified that could promote PP2A binding.
This residue was also shown to be important for Bod1 function in mitotic cells. Experiments
with Bod1‐PP2A coprecipitates from mitotic HeLa cells as well as in vitro assembled Bod1‐PP2A
complexes further indicate that Bod1 can regulate PP2A‐B56 activity.
The in vitro interaction experiments with Bod1 and purified PP2A subunits strongly suggest
that Bod1 can only bind to the PP2A holocomplex. This may reflect the need for accessory
factors that are co‐purified with the A/C subunits in the semi‐recombinant approach taken.
Alternatively, it could be attributed to the requirement of structural changes in the PP2A
subunits after holocomplex formation or the requirement of binding interfaces on more than
one PP2A subunit. UV cross‐linking studies with Ensa and PP2A‐B55 suggest that Ensa binds
PP2A across the B‐ and C‐subunits close to the active site of the phosphatase (Mochida, 2013).
Very recently it has been revealed that Ensa inhibits PP2A by a mechanism dubbed ‘unfair
competition’ (Williams et al., 2014): phosphorylated Ensa is thought to bind to the active site
of PP2A with a very high affinity, but at the same time the rate of dephosphorylation is
considerably slower than that of Fzy(S50), a known PP2A‐B55 target in mitotic exit. These
findings provide an enzyme kinetic explanation for why Ensa can inhibit PP2A‐B55 at mitotic
entry and not at mitotic exit. Only at mitotic entry is the supply of phosphorylated Ensa high
enough to sustain PP2A inhibition. As PP2A gradually dephosphorylates this pool of phospho‐
Ensa, it inactivates its own inhibitor to peak in activity in late mitosis.
In our current model of Bod1‐mediated PP2A regulation at the kinetochore (Figure 3. 9), Bod1,
too, needs to be phosphorylated to bind to PP2A efficiently. This in turn leads to a reduction of
PP2A‐B56 activity towards kinetochore substrates, protecting essential phosphorylation sites
during early mitosis. MCAK serine 92 phosphorylation is one example of epitopes that are
affected by Bod1 depletion in mitotic HeLa cells (Porter et al., 2007). According to the

Chapter III: Bod1 binds to PP2A‐B56 and inhibits PP2A activity
97
phosphatase assays described here, CENPU/PBIP1 dephosphorylation by PP2A‐B56 is also
inhibited by Bod1 in vitro. This is consistent with the loss of Plk1 observed in Bod1‐depleted
HeLa cells (Porter et al., 2013) as the polo binding domain (PBD) of CENPU is involved in the
recruitment of Plk1 to the kinetochore (Kang et al., 2006). In this context it might be of
interest that during the development of the phosphatase assay one critical step was to change
the PP2A substrate from a generic phospho‐substrate (such as myelin basic protein) to a
kinetochore specific substrate (Iain Porter, personal communication). This potentially
highlights the kinetochore‐specific effects of Bod1 on PP2A‐B56.
FIGURE3.9REGULATIONOFPP2A‐B56ATTHEKINETOCHORE
Phosphorylated Bod1 interacts with and inhibits PP2A‐B56 activity at the kinetochore. This protects
important mitotic phospho‐epitopes and ensures correct localisation of phospho‐dependent
kinetochore proteins. Depletion of Bod1 causes hyperactivity of the phosphatase and loss of
kinetochore phosphorylation. (P) indicates phosphorylation.
According to this model, loss of Bod1 would result in an increase of PP2A‐B56 activity towards
other kinetochore substrates‐ including polo binding domains, preventing proper Plk1
kinetochore localisation. Concomitantly, co‐depletion of PP2A‐B56 with Bod1 should restore
Plk1 binding sites and Plk1 localisation to the kinetochore. This is precisely what can be
observed in HeLa cells treated with a B56‐specific pool of siRNAs (Foley et al., 2011) and Bod1
Chapter III: Bod1 binds to PP2A‐B56 and inhibits PP2A activity
98
siRNA simultaneously, validating the hypothesis that Bod1 regulates PP2A‐B56 activity at the
kinetochore (Porter et al., 2013). Hypophosphorylation of kinetochore proteins as a result of
Bod1 depletion would be expected to be especially detrimental at incorrectly attached
kinetochores that rely on phosphorylation to destabilise their microtubule attachment for
error‐correction. Hence, the loss of PP2A‐B56 inhibition could provide an explanation for why
Bod1‐depletion from HeLa cells causes a paucity of phosphorylation at unaligned kinetochores
that can ultimately lead to biorientation defects.
To complete this model it is now imperative to find the physiological kinase that mediates
phosphorylation of the STHLD motif. As detailed above, there is some evidence that Bod1 is a
substrate of Cdk1‐cyclin B (Figure 3. 4). However, the consensus sequence is weak as it lacks
the characteristic proline that follows the phosphorylatible Ser/Thr in almost all Cdk1
substrates identified to date (Errico et al., 2010). It is absolutely required to perform an in‐
depth kinase screen with a large panel of mitotic kinases to suitably address this question. In
the meantime, Cdk1‐cyclin B should not be disregarded purely based on the lack of consensus.
Cdk‐complexes are known to cooperatively bind their substrates both at the Cdk active site
and a hydrophobic groove on the cyclin surface (Takeda et al., 2001). The cyclin interacts with
an RxL motif on the Cdk1 substrate. This sequence is present in human Bod1 at R62.
Interaction of the two proteins might be further promoted by co‐localisation at the
kinetochore. Like Bod1, cyclin B1 is found at the kinetochore in early mitosis (Chen et al.,
2008). Close proximity and the stabilisation of the interaction through a second site might
drive phosphorylation of intrinsically ‘poor’ substrates (Funabiki and Wynne, 2013). In fact,
nuances of substrate specificity might facilitate sequential phosphorylation of the various Cdk1
substrates in early mitosis. A precedent for this is set in the case of Cdc14‐dependent
dephosphorylation of Cdk1 targets during mitotic exit (Bouchoux and Uhlmann, 2011). Cdc14
has many substrates during mitotic exit in yeast and the order of dephosphorylation of these
substrates is not random. Moreover, the early substrates of Cdc14 have a much higher

Chapter III: Bod1 binds to PP2A‐B56 and inhibits PP2A activity
99
turnover rate and substrate affinity than the later substrates and this is considered an integral
mechanism for ordered Cdk1 substrate dephosphorylation. It further needs to be considered
that kinase consensus motifs are not always found to be linear. For instance, α‐tubulin was
recently reported to be phosphorylated by protein kinase C βI (PKCβI) on a structurally formed
consensus motif (Duarte et al., 2014). Here, a threonine residue within purified α‐tubulin was
phosphorylated by PKCβI in an in vitro kinase assay and prominently detected in mass
spectrometry analysis. Subsequent analysis of this residue in the context of the folded protein
using crystal structures of the protein revealed that protein folding juxtaposed the threonine
to two lysine residues such that the folded domain mimicked the [R/K][R/K]X[S/T] PKC
consensus motif previously reported for the kinase (Songyang et al., 1994).
Another open question is the mechanism by which Bod1 regulates PP2A‐B56 activity. To solve
this, establishing the kinetic parameters of the dephosphorylation reaction with and without
Bod1 in experiments measuring phosphate release at different time points using different
concentrations of Bod1 might help to determine the efficiency of the inhibition (Nimmo and
Cohen, 1978). Those types of enzyme kinetic experiments would further indicate whether
Bod1 inhibits PP2A as a classical allosteric, non‐competitive or pseudosubstrate competitive
inhibitor. Likewise, Bod1 could represent an alternative substrate and regulate PP2A activity at
the kinetochore by competing for its active site rather than acting as an inhibitor in the
classical sense. This would affect the overall turnover number for other PP2A substrates at the
kinetochore by reducing the free enzyme concentration available. The latter case could partly
explain the fact that Bod1(T95E) is a better binding partner for PP2A, assuming that catalytic
activity and release of the phosphate group from wild type Bod1 disrupts the enzyme
substrate complex. The in vitro malachite green assay could be used to carry out the enzyme
kinetic experiments mentioned above, although its dynamic range would need to be optimised
for such an application. The PP2A activity measured averaged only 0.2mU, possibly leading to
high background in the assay and making it difficult to get consistent readings. Besides
Chapter III: Bod1 binds to PP2A‐B56 and inhibits PP2A activity
100
stabilising the holocomplex by using higher protein concentrations, the addition of higher
amounts of MnCl2 could be considered to provide ample cofactor for the catalytic subunit
(Nimmo and Cohen, 1978).
To conclude, these results demonstrate that the novel kinetochore protein Bod1 is a previously
unknown interaction partner of PP2A‐B56 (Porter et al., 2013). Although there are several
aspects of this protein‐protein interaction that still warrant further investigation, it has strong
implications regarding the catalytic activity of PP2A‐B56 at the kinetochore. The following two
chapters are dedicated to exploring the spatio‐temporal regulation of this interaction as well
as further examining its functional consequences for the kinetochore protein network.

Chapter IV: Bod1 phosphorylation at T95 specifically occurs in mitotic cells and is sensitive to microtubule attachments
101
ChapterIV:Bod1phosphorylationatT95specificallyoccursin
mitoticcellsandissensitivetomicrotubuleattachments
Bod1 interaction with PP2A‐B56 critically depends on a binding motif around an acidic
aspartate residue (D98 in human Bod1) that is conserved in the PP2A inhibitory proteins Arpp‐
19 and Ensa. The interaction further requires phosphorylation of the T95 residue, just
upstream of D98 as shown in the previous chapter.
The spatio‐temporal window of this phosphorylation, and with it the ability of PP2A‐B56 to
associate with Bod1, remains to be determined. It is unknown whether T95 phosphorylation
exists during the entire cell cycle or whether it is a mitosis‐specific event. It is similarly unclear
if this phosphorylation is constantly present during the course of mitosis. To further investigate
T95 phosphorylation, phospho‐specific antibodies against this site were generated using site‐
specific phospho‐peptides. Antibodies raised against peptides have a slightly lower probability
of success than antibodies against the full length protein (Field et al., 1998). The success rate
of antibodies raised against internal peptides was reported to amount to only 43%. The
purified antibodies were therefore extensively characterised before their application in cell
cycle and mitosis‐specific studies of Bod1 T95 phosphorylation.
Results
PurificationoftheBod1antibodies
Polyclonal antibodies were raised in sheep and a detailed description of the generation and
purification procedures can be found in the methods section. Briefly, sheep were immunized
with the immunogenic phosphopeptide and serum containing the polyclonal antibody was
collected. Sera obtained in the third bleed were run over two consecutive columns: First, a
non‐phosphorylated peptide column with a primary sequence corresponding to the
immunogenic phosphopeptide was used to bind all antibodies that would recognise the
unphosphorylated peptide. This includes antibodies specific for the unphosphorylated form as

Chapter IV: Bod1 phosphorylation at T95 specifically occurs in mitotic cells and is sensitive to microtubule attachments
102
well as antibodies that can bind both phosphorylation states of the peptide. This first fraction
was labelled ‘panspecific’. The second column contained the immunogenic phosphopeptide.
After the serum was depleted of all panspecific antibodies, this second column was now used
to purify the phospho‐specific antibodies only. Three different polyclonal antibodies were
raised in sheep: Antibodies obtained from sheep number 572 and 573 were raised against the
same phospho‐peptide which incorporated the T95 phosphorylation site, NH2‐
CRQKVDNFVS[pT]HLDKQ‐COOH. Sheep number 570 was immunised with a peptide from a
different site in Bod1.
TheT95phospho‐antibodieshavehighspecificityforthephosphorylatedBod1
peptide
After purification, the antibodies raised against the T95 phospho‐peptide were first tested for
phospho‐specificity using Bod1 peptides, CRQKVDNFVS[pT]HLDKQ and CRQKVDNFVSTHLDKQ.
Serial dilutions of phospho‐ and nonphospho‐peptides were adsorbed on nitrocellulose
membranes and probed with purified antibodies (Figure 4. 1 A). The panspecific antibodies
from both 572 and 573 sera had similar affinities for the non‐phospho and phosphorylated
peptides. The phospho‐specific antibodies, 572P and 573P, on the other hand showed a clear
preference for the phosphopeptide. In both cases the affinity was at least two orders of
magnitude higher for the phosphorylated peptide.
The573antibodyrecognisesGFP‐taggedBod1aswellasendogenousBod1in
immunoblots
To test the antibodies’ ability to recognise full length Bod1 protein in immunoblots, HeLa cells
were transfected with Bod1‐GFP or GFP in the presence and absence of Bod1 siRNA (Figure 4.
1 B). Asynchronous whole cell lysates were blotted with each antibody or a GFP‐specific
antibody as a control. All purified antibodies recognised Bod1‐GFP but not GFP, even though
the phospho‐specific antibody number 572 had an extremely poor affinity for Bod1‐GFP.
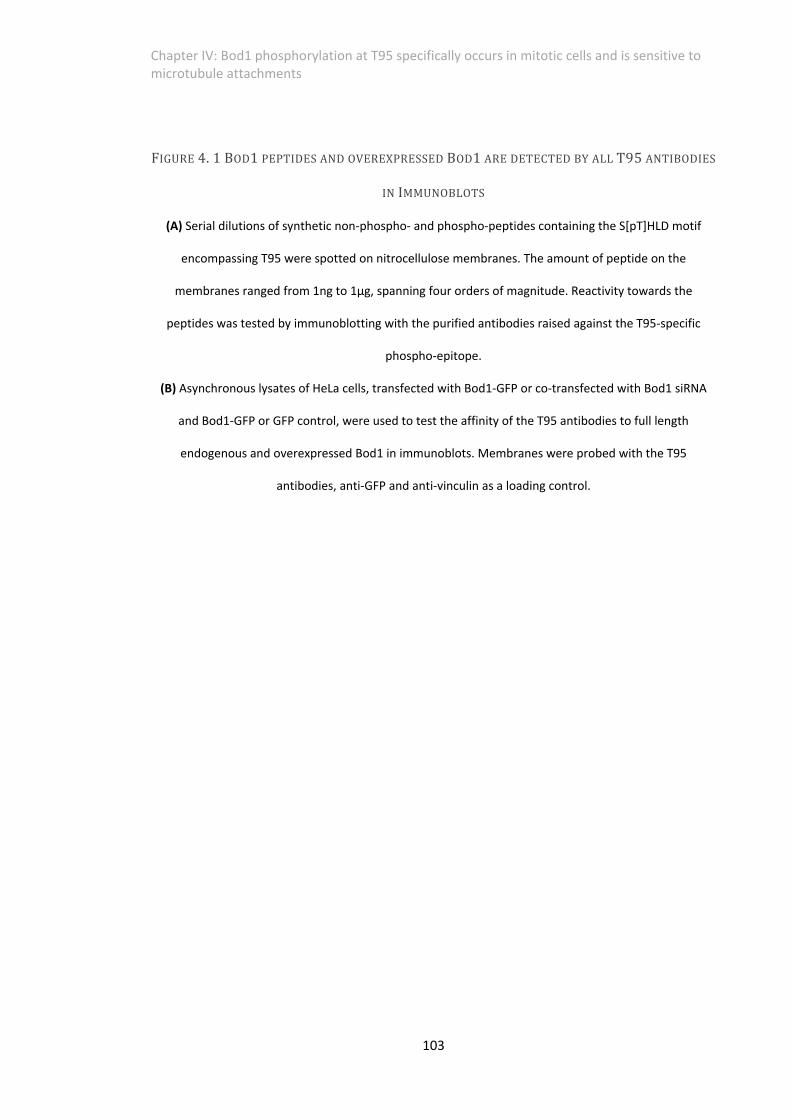
Chapter IV: Bod1 phosphorylation at T95 specifically occurs in mitotic cells and is sensitive to microtubule attachments
103
FIGURE4.1BOD1PEPTIDESANDOVEREXPRESSEDBOD1AREDETECTEDBYALLT95ANTIBODIES
INIMMUNOBLOTS
(A) Serial dilutions of synthetic non‐phospho‐ and phospho‐peptides containing the S[pT]HLD motif
encompassing T95 were spotted on nitrocellulose membranes. The amount of peptide on the
membranes ranged from 1ng to 1µg, spanning four orders of magnitude. Reactivity towards the
peptides was tested by immunoblotting with the purified antibodies raised against the T95‐specific
phospho‐epitope.
(B) Asynchronous lysates of HeLa cells, transfected with Bod1‐GFP or co‐transfected with Bod1 siRNA
and Bod1‐GFP or GFP control, were used to test the affinity of the T95 antibodies to full length
endogenous and overexpressed Bod1 in immunoblots. Membranes were probed with the T95
antibodies, anti‐GFP and anti‐vinculin as a loading control.

Chapter IV: Bod1 phosphorylation at T95 specifically occurs in mitotic cells and is sensitive to microtubule attachments
104

Chapter IV: Bod1 phosphorylation at T95 specifically occurs in mitotic cells and is sensitive to microtubule attachments
105
Endogenous Bod1 was not detected by any of the antibodies in these experiments. To explore
the possibility that the antibodies might detect endogenous Bod1 without the high Bod1‐GFP
overexpression background, HeLa cells were transfected with siRNA only and asynchronous
extracts were probed with the antibodies (Figure 4. 2). A commercial antibody raised against
Bod1 (Abcam, ab103510) was used as a control. Whole membrane blots showed that although
all antibodies recognised unspecific bands across the membrane, the 573 antibodies also
recognised a Bod1‐specific band (Figure 4. 2 A). The panspecific antibody 573 mainly
recognised a band at the expected molecular weight of approximately 22kD, comparable to
the commercial Bod1 antibody. The phospho‐specific antibody 573P recognised a band with a
slightly reduced electrophoretic mobility of approximately 25kD, which could be indicative of
the phospho‐specificity. In an attempt to increase the affinity for endogenous Bod1, the
experiment was repeated and membranes were cropped at approximately 30kD before
incubation with the primary antibodies (Figure 4. 2 B). Here, the panspecific 572 antibody
recognised unphosphorylated Bod1 similar to the control, panspecific 573 and panspecific 570.
Phospho‐specific 572P however failed to recognise any specific bands, unlike 573P.
Sheeppan‐andphospho‐specificBod1antibodiesrecognisesBod1in
immunofluorescence
All five antibodies were tested in immunofluorescence applications with different fixation
methods, including methanol and formaldehyde fixation as well as different approaches for
pre‐extraction of cytoplasmic proteins. The method giving the best kinetochore signal was
selected and characterisation of the antibodies with this fixation protocol is described here.
First, the antibodies were tested with and without blocking of the paratope with
phosphorylated and unphosphorylated antigenic peptides (Figure 4. 3). Without blocking, 572,
573P and 570 antibodies recognise epitopes at the kinetochore (Figure 4. 3 A). All three as well
as antibody number 572P additionally recognised epitopes at the centrosome. Both

Chapter IV: Bod1 phosphorylation at T95 specifically occurs in mitotic cells and is sensitive to microtubule attachments
106
FIGURE4.2ENDOGENOUSBOD1INHELACELLLYSATESISDETECTEDBYSOMEOFTHESHEEP
BOD1ANTIBODIESINIMMUNOBLOTS
(A) Asynchronous lysates from HeLa cells treated with control or Bod1 siRNA were separates by gel
electrophoresis. Immunoblotting was performed using the indicated antibodies. The boxed area was
used for the experiment described in (B). Asterisks mark Bod1‐specific bands.
(B) The experiment described in (A) was repeated, this time cutting the membrane at 30kD before
probing the lower part with the purified antibodies in order to minimise unspecific binding of the
antibody to the part of the membrane with higher molecular weight. Asterisks mark Bod1‐specific
bands.

Chapter IV: Bod1 phosphorylation at T95 specifically occurs in mitotic cells and is sensitive to microtubule attachments
107

Chapter IV: Bod1 phosphorylation at T95 specifically occurs in mitotic cells and is sensitive to microtubule attachments
108
FIGURE4.3ENDOGENOUSBOD1PROTEINISDETECTEDBYSOMEOFTHESHEEPBOD1
ANTIBODIESINIMMUNOFLUORESCENCEMICROSCOPY
(A) HeLa cells were co‐stained with the purified antibodies and a kinetochore marker (pHec1) and
mitotic cells were imaged. Two magnifications of metaphase cells are shown for all antibodies, showing
the whole cell in the top panel and middle panel as well as a magnification of the kinetochores on the
bottom panel. White circles indicate centrosomal staining. White arrows indicate kinetochore staining.
White boxes indicate the area shown in the bottom panel. Scale bars are 1µm.
(B) Staining was carried out as before but the antibody was pre‐incubated with synthetic non‐phospho
peptide to block all paratopes that react with it. Scale bar is 1µm.
(C) Staining was carried out as before but the antibody was pre‐incubated with synthetic phospho‐
peptide to block all paratopes that react with it. Scale bar is 1µm.

Chapter IV: Bod1 phosphorylation at T95 specifically occurs in mitotic cells and is sensitive to microtubule attachments
109
Chapter IV: Bod1 phosphorylation at T95 specifically occurs in mitotic cells and is sensitive to microtubule attachments
110
kinetochore and centrosomal signals were completely lost upon incubation with the
immunogenic phosphopeptide, but not the corresponding unphosphorylated peptide (Figure
4. 3 B). Retention of some of the staining in the non‐phospho peptide treated panspecific
antibodies indicates that those antibody fractions contain some antibodies that preferentially
recognise the phosphorylated protein.
To verify the observed staining was Bod1 specific, the experiment was repeated using cells
treated with control or Bod1 siRNA (Figure 4. 4). All antibodies were tested bar panspecific
573, since this antibody had not shown any localised staining in the previous experiment.
Knock‐down efficiency was assessed by immunoblot (Figure 4. 4 D). Only the phosphospecific
antibody number 573P and the panspecific antibody number 570 produced Bod1‐specific
kinetochore staining. This was evident from the immunofluorescence images, but best
illustrated by quantification of the Bod1 fluorescence intensity at the kinetochore (Figure 4. 4
B). Interestingly, much of the centrosomal staining was not depleted by Bod1 siRNA treatment
(Figure 4. 4 A), although blocked by the phosphopeptide.
The panspecific 570 antibody and the phosphospecific 573P antibody were chosen for further
analysis and are henceforth referred to as sheep Bod1 and sheep pBod1(T95) antibody.
Bod1isphosphorylatedatmitoticonsetandgetsdephosphorylatedatthe
kinetochoreinmetaphase
The sheep Bod1 antibodies provided the opportunity to observe the localisation of
endogenous Bod1 in whole cell immunofluorescence staining for the first time.
To get an overview of the temporal resolution of T95 phosphorylation throughout the cell
cycle, staining with the pBod1(T95) antibody was compared to the panspecific Bod1 antibody
staining (Figure 4. 5). Like Bod1‐GFP (Porter et al., 2007), Bod1(T95) was detected at the
kinetochores, centrosomes, and the midbody of mitotic cells. The fluorescence intensity at

Chapter IV: Bod1 phosphorylation at T95 specifically occurs in mitotic cells and is sensitive to microtubule attachments
111
FIGURE4.4DEPLETIONOFBOD1ABLATESTHESIGNALOFTWOANTIBODIESATTHE
KINETOCHORES
(A) ctrl siRNA‐treated cells stained with Bod1 antibodies. Scale Bars are 5µm.
(B) Bod1 siRNA‐treated cells stained with Bod1 antibodies. Scale bars are 5µm.
(C) Quantification of the kinetochore signals.
(D) Immunoblot of asynchronous cells to show Bod1 depletion efficiency in this experiment.
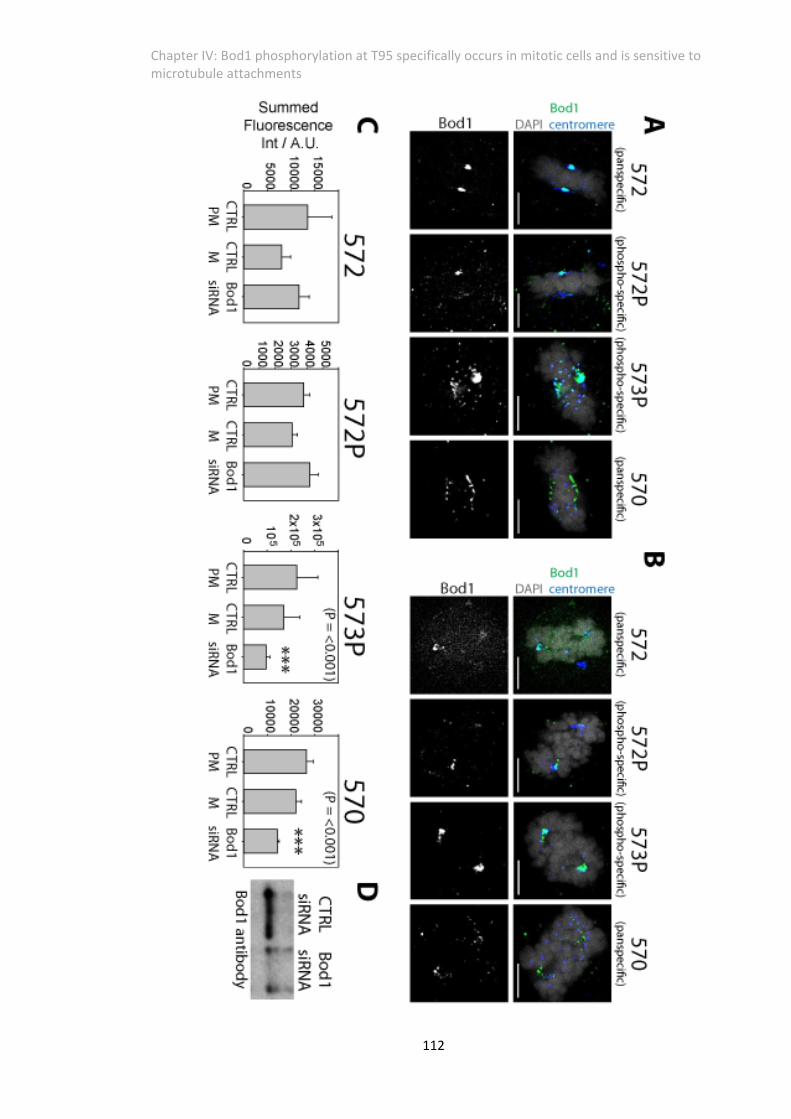
Chapter IV: Bod1 phosphorylation at T95 specifically occurs in mitotic cells and is sensitive to microtubule attachments
112

Chapter IV: Bod1 phosphorylation at T95 specifically occurs in mitotic cells and is sensitive to microtubule attachments
113
FIGURE4.5CELLCYCLEPROFILEOFT95PHOSPHORYLATION
(A) Immunofluorescence staining of fixed HeLa cells using the T95 phosphospecific Bod1 antibody. Cells
in different stages of the cell cycle are depicted. Scale bars are 5µm.
(B) Quantification of fluorescence intensity at the kinetochore. Data for the pan‐specific antibody and
phosphospecific antibody are shown. Ten cells per cell cycle stage and antibody were analysed.
(C) Quantification of fluorescence intensity in whole cells. Data for the pan‐specific antibody and
phosphospecific antibody are shown. Ten cells per cell cycle stage and antibody were analysed.

Chapter IV: Bod1 phosphorylation at T95 specifically occurs in mitotic cells and is sensitive to microtubule attachments
114

Chapter IV: Bod1 phosphorylation at T95 specifically occurs in mitotic cells and is sensitive to microtubule attachments
115
kinetochores increased rapidly in early mitosis and was lost in the later stages. During
interphase, no T95 phosphorylation was observed. Quantitative analysis specifically at
kinetochores revealed, that pBod1(T95) intensity was decreased in metaphase compared to
prometaphase (Figure 4. 5 B). In comparison, the panspecific Bod1 antibody showed that
accumulation of total protein continued into metaphase and only tailed off in anaphase,
suggesting that T95 phosphorylation is removed before Bod1 dissociates from the kinetochore
(Figure 4. 5 B). When the intensity profiles of pBod1(T95) and Bod1 across the whole cell were
examined, a sharp rise of phosphorylation in prophase was maintained until anaphase (Figure
4. 5 C). The latter data includes intensity values for the prominent centrosomal staining (Figure
4. 4 A and B) so the strong influence of the centrosomal staining needs to be considered.
InhibitionofCdk1usingtheInhibitorRO‐3306substantiallyreducesBod1
phosphorylation
The T95 site‐specific phosphoantibody was a powerful tool to investigate the sensitivity of T95
phosphorylation to cellular perturbations. Following up the in vitro Cdk1 kinase assay
described in the previous chapter, the Cdk1 inhibitor RO‐3306 was used to test whether T95
phosphorylation is dependent on Cdk1 in vivo. To particularly address the impact on acute
Cdk1 inhibition at prometaphase, when T95 phosphorylation peaks (Figure 4. 5), cells were
first arrested in early mitosis using the kinesin inhibitor STLC (Skoufias et al., 2006) over night.
They were then released into HeLa cell medium or medium containing 10µM RO‐3306. After
10min incubation, the cells were immediately fixed as before and stained for
immunofluorescence. Strikingly, even brief treatment with the inhibitor resulted in a profound
effect on T95 phosphorylation (Figure 4. 6). Kinetochore staining was reduced to 30%
compared to untreated cells, even though only cells had been selected that showed
prometaphase chromosome arrangement. However, panspecific Bod1 staining was also
reduced, albeit only about 50%. More importantly, the mitotic marker phospho‐histone H3
was lost from the cells. Phosphorylation of histone H3 at serine 10 (H3 S10) is a hallmark of

Chapter IV: Bod1 phosphorylation at T95 specifically occurs in mitotic cells and is sensitive to microtubule attachments
116
mitosis and is mediated chiefly by Aurora B (Hsu et al., 2000; Murnion et al., 2001; Prigent and
Dimitrov, 2003). The extent of H3 S10 loss was therefore surprising. A similar response of
Aurora B substrates to RO‐3306 treatment has previously been observed, for example using a
FRET sensor system (van der Waal et al., 2012). These observations might be explained by the
requirement of Cdk1 activity for proper centromere localisation of the CPC (Tsukahara et al.,
2010). Furthermore, the whole centromeric region seemed to be de‐stabilised as the
centromeric marker ACA showed decreased intensity. The DAPI stain was comparable in
control and RO‐3306 treated cells.
Phospho‐Bod1isenrichedonunattachedkinetochores
In a preliminary experiment, kinetochore intensity of the T95 phosphospecific antibody was
compared in HeLa cells treated with drugs causing mitotic arrest at different stages in mitosis
with different attachment states of the chromosomes (Figure 4. 7).
In this experiment, the Cdk1 inhibitor RO‐3306 was used to arrest cells in G2/M transition for
16h. Cells were subsequently released for 1h to obtain a synchronised metaphase population.
Here, the ACA centromere signal was not reduced in the RO‐3306 treated samples, but
pBod1(T95) kinetochore intensity was much lower than in control prometaphase cells.
Similarly, if HeLa cells were incubated in 10 μM MG132 for 1h to accumulate cells at
metaphase, similar to experiments in (Maldonado and Kapoor, 2011), T95 phosphorylation
was much reduced. Interestingly, if cells were arrested in mitosis by supplementing the
medium with 8nM taxol for 16h (Jordan et al., 1993), pBod1 levels were also significantly
reduced. Taxol treatment resulted in metaphase arrest or cells arresting with monopolar
spindles (Figure 4. 7 A) and in both cases pBod1 staining was low. Conversely, if cells were
arrested with the microtubule destabilising drug nocodazole (100ng/mL, 2h), pBod1 staining
was very high. With this treatment, staining between individual kinetochores was highly
variable, which is reflected in unusually high error bars. This was very unexpected because

Chapter IV: Bod1 phosphorylation at T95 specifically occurs in mitotic cells and is sensitive to microtubule attachments
117
treatment with nocodazole should result in depolymerisation of all microtubules. The expected
result would be a very uniform distribution of kinetochores, all of them in an unbound state.
This clearly indicates that the experiment needs to be considered a preliminary finding and
needs to be repeated in conditions that allow for the assessment of the degree of microtubule
depolymerisation, for example by using tubulin as a marker. Finally, cells were arrested in
prometaphase using STLC. Here, pBod1 staining was similar to prometaphase control cells.

Chapter IV: Bod1 phosphorylation at T95 specifically occurs in mitotic cells and is sensitive to microtubule attachments
118
FIGURE4.6INHIBITIONOFCDK1DEPLETESBOD1FROMKINETOCHORES
(A) HeLa cells were treated with the CDK1 inhibitor RO‐3306 for 10min and processed for
immunofluorescence. Cells were stained for the mitotic marker H3pSer10, Bod1 and phospho‐Bod1.
Scale bars are 5µm.
(B) Quantification of fluorescence at kinetochores. Ten cells per antibody were analysed. Statistical test
performed was Mann‐Whitney U‐test.

Chapter IV: Bod1 phosphorylation at T95 specifically occurs in mitotic cells and is sensitive to microtubule attachments
119

Chapter IV: Bod1 phosphorylation at T95 specifically occurs in mitotic cells and is sensitive to microtubule attachments
120
FIGURE4.7PRELIMINARYDATAINDICATESTHATT95PHOSPHORYLATIONISHIGHESTAT
UNATTACHEDKINETOCHORES
(A) HeLa cells after the indicated treatment were fixed and stained for pBod1 (green) and ACA (blue).
Maximum intensity projections of two representative cells are shown for each condition. Scale bars are
5µm.
(B) Summed fluorescence intensity of pBod1 at the kinetochore was determined for each condition.
Statistical test performed against CTRL PM was Mann‐Whitney U‐test. n=200 kinetochores.

Chapter IV: Bod1 phosphorylation at T95 specifically occurs in mitotic cells and is sensitive to microtubule attachments
121

Chapter IV: Bod1 phosphorylation at T95 specifically occurs in mitotic cells and is sensitive to microtubule attachments
122
Discussion
This chapter describes the successful generation of a phospho‐T95 specific Bod1 antibody that
works both in immunoblot and immunofluorescence experiments. The phospho‐T95 specific
antibody offers the unique opportunity to discriminate between total cellular Bod1 protein
and the pool of Bod1 that is modified to preferentially interact with PP2A as shown in the
previous chapter. The panspecific Bod1 antibody that was generated during the antibody
purification process also produced a Bod1‐specific signal in immunofluorescence staining. This
enabled detection of endogenous Bod1 in whole cell mounts for the first time and thus
allowed for generating a cell‐cycle profile of Bod1 localisation.
Surprisingly, and in contrast to what was observed for Bod1‐GFP, there is very little Bod1
detected in interphase. It remains to be determined if the deposition of Bod1‐GFP at the
centrosomes throughout the cell cycle is an effect of its strong overexpression or whether very
little Bod1 is sufficient to maintain its function at the centrosome in interphase. In this regard
it would be informative to study the regulation of Bod1 protein levels throughout the cell
cycle. A continuous turnover of the protein could explain a low local concentration at any fixed
time point.
The phospho‐specific antibody on the other hand provided an excellent opportunity to test the
hypothesis of whether Cdk1‐cyclin B is the in vivo kinase for Bod1 in mitosis. The Cdk1
inhibition experiment conducted showed that phospho‐T95 levels were much lower in
conditions where Cdk1 is inhibited. However, Bod1 phosphorylation was not completely lost
upon Cdk1 inhibition. Furthermore, even very brief incubation with the Cdk1 inhibitor lead to a
plethora of effects that are potentially interdependent, leading to a complex phenotype where
dissolution of cause and effect is difficult to achieve. For instance, loss of histone H3 serine10
(H3 S10) phosphorylation was severely affected by Cdk1 inhibition. Yet, the major kinase for
H3 S10 seems to be Aurora B kinase in Xenopus laevis extracts, Drosophila, C. elegans and

Chapter IV: Bod1 phosphorylation at T95 specifically occurs in mitotic cells and is sensitive to microtubule attachments
123
budding yeast (Adams et al., 2001; Giet and Glover, 2001; Hsu et al., 2000; MacCallum et al.,
2002; Murnion et al., 2001). Even though there is some evidence that Aurora B might not be
the only H3 kinase (Hauf et al., 2003; Prigent and Dimitrov, 2003), Cdk1 is not among the prime
candidates (De Souza et al., 2000). It is conceivable that Cdk1 inhibition interferes with the
localisation or activity of Aurora B at the centromere. Several priming phosphorylations in the
assembly of the chromosomal passenger complex (CPC, consisting of Aurora B, INCENP,
Survivin and Borealin) have been ascribed to Cdk1 (Goto et al., 2006; Tsukahara et al., 2010;
Zhou et al., 2014). Moreover, many histone phosphorylation marks, including H3 S10, but also
H3 T3 which facilitates Aurora B recruitment (Funabiki and Wynne, 2013), are removed by PP1
(Hsu et al., 2000; Murnion et al., 2001; Qian et al., 2011; Vagnarelli et al., 2011). Therefore,
inhibition of Cdk1 most likely initiates H3 S10 dephosphorylation by loss of the inhibitory T320
phosphorylation on PP1 (Dohadwala et al., 1994; Kwon et al., 1997). This brief digression
highlights that the in vivo Cdk1 inhibition experiment could still not definitively demonstrate
that Bod1‐phosphorylation is directly mediated by Cdk1‐cyclin B. It did, however, provide
direct evidence that maintenance of T95 phosphorylation is Cdk1‐dependent.
Beyond that, the phospho‐Bod1 antibody allowed the investigation of the dependence of T95
phosphorylation on different microtubule attachment states. The results of this preliminary
experiment were extremely suggestive of a strong positive correlation between T95
phosphorylation and unattached kinetochores. This mimics PP2A‐B56 dynamics under the
same conditions (Foley et al., 2011) and would be consistent with a model, in which Bod1 is
needed as an inhibitor of PP2A early in the microtubule attachment process. When stable
attachments are achieved in metaphase, the T95 residue that mediates Bod1‐PP2A interaction
is dephosphorylated, and this might alleviate restriction of PP2A activity. PP2A‐B56 levels at
the kinetochore are markedly reduced in metaphase as well (Foley et al., 2011), potentially
making the presence of its inhibitor obsolete. Alternatively, the mitigation of PP2A inhibition

Chapter IV: Bod1 phosphorylation at T95 specifically occurs in mitotic cells and is sensitive to microtubule attachments
124
by Bod1 could be explained by the fact that at this stage of mitosis, phosphatase activity is
needed and on the rise to facilitate mitotic progression (Barr et al., 2011).
In summary, I find that the appearance of a pool of Bod1 phosphorylated at T95 and ready to
interact with PP2A‐B56 coincides with the recruitment of the phosphatase to the kinetochore.
Considering that T95 Bod1 has the propensity to inhibit PP2A‐B56 in vitro, this makes Bod1 a
prime candidate for balancing PP2A‐B56 activity early in mitosis to allow for attachment error
correction by Aurora B.

Chapter V: Bod1 binds to Hec1 and regulates its phosphorylation at the kinetochore
125
ChapterV:Bod1bindstoHec1andregulatesitsphosphorylation
atthekinetochore
The results reported in the previous chapters demonstrated that Bod1 interacts with PP2A and
that this interaction requires Bod1 T95 phosphorylation. Furthermore, it was established that
this is an important part of Bod1’s biological function in HeLa cells. Endogenous Bod1
prominently localises to mitotic kinetochores as shown by the newly generated Bod1
antibodies. Bod1 can regulate PP2A activity, but their interaction at the kinetochore is
probably limited to early mitosis.
Presumably, Bod1 localisation to the kinetochore is a critical determinant for its function.
Following this rationale, Bod1 binding to the kinetochore was more closely examined. The
subsequent experiments aimed to delineate determinants for Bod1 binding, including proteins
that serve as recruitment factors for Bod1 at the kinetochore.
Results
siRNAdepletionofPP2A‐B56isnotsufficienttodisplaceBod1fromthekinetochore
Since both Bod1 and PP2A‐B56 localise to the outer kinetochore and their interaction there
had been established, I first asked whether the presence of PP2A‐B56 is necessary for Bod1
kinetochore recruitment. To test this, all B56 isoforms were depleted from HeLa cells using a
pool of isoform‐specific siRNAs as described previously (Foley et al., 2011; Porter et al., 2013).
This depletion resulted in a 50% reduction of B56α at the centromere (Figure 5. 1 A) as well as
B56α total protein levels (Figure 5. 1 B). Another isoform, B56δ, was depleted even more
efficiently and undetectable by immunoblot in the siRNA treated sample (Figure 5. 1 B). This
depletion resulted in a chromosome alignment defect (Figure 5. 1 A) as described previously
(Foley et al., 2011). Despite the highly significant reduction in the levels of all B56 isoforms
tested, kinetochore intensities of both the panspecific Bod1 antibody and the T95‐specific
pBod1 antibodies did not significantly change upon B56 depletion. Although the possibility

Chapter V: Bod1 binds to Hec1 and regulates its phosphorylation at the kinetochore
126
FIGURE5.1PP2A‐B56ISNOTNECESSARYTORECRUITBOD1TOTHEKINETOCHORE
(A) HeLa cells were treated with control siRNA or a pool of B56 siRNAs, fixed and processed for
immunofluorescence. Inserts show kinetochores magnified from the grey box. Scale Bars are 1µm.
Graphs show quantification of kinetochore fluorescence intensity. Statistical test performed was Mann‐
Whitney U‐test.
(B) Immunoblot shows knock‐down efficiency for two of the five targeted B56 isoforms, B56α and B56δ.

Chapter V: Bod1 binds to Hec1 and regulates its phosphorylation at the kinetochore
127
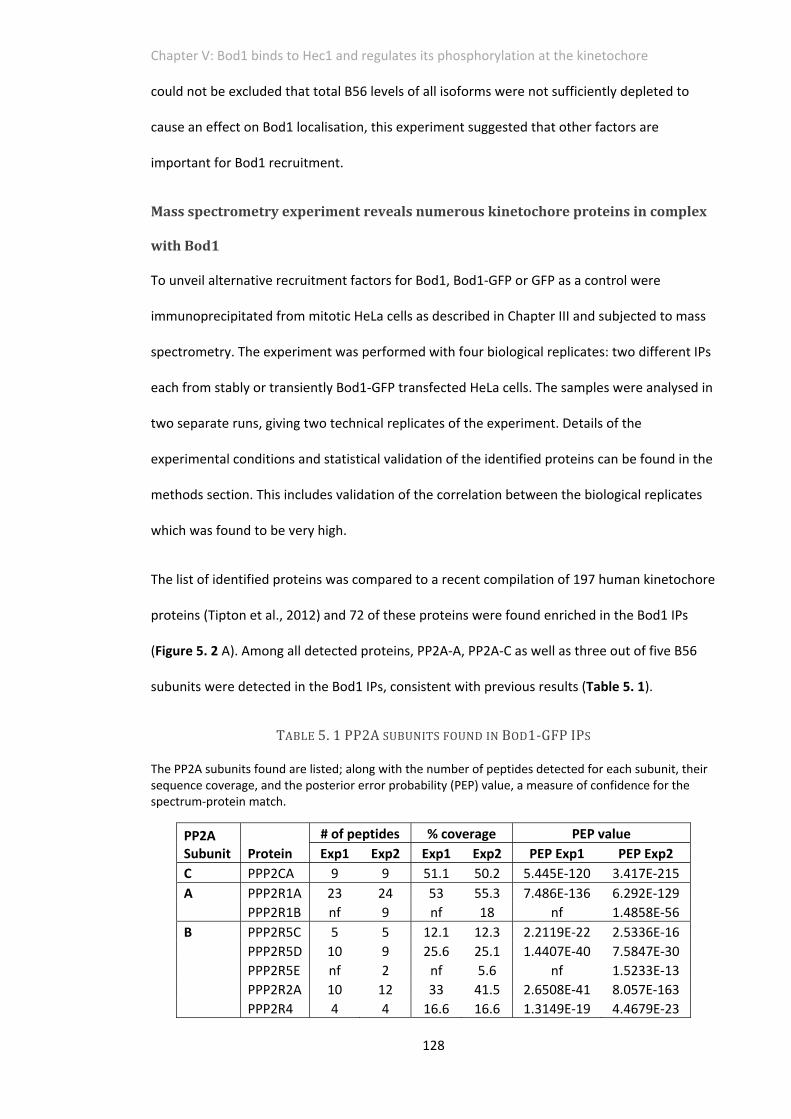
Chapter V: Bod1 binds to Hec1 and regulates its phosphorylation at the kinetochore
128
could not be excluded that total B56 levels of all isoforms were not sufficiently depleted to
cause an effect on Bod1 localisation, this experiment suggested that other factors are
important for Bod1 recruitment.
Massspectrometryexperimentrevealsnumerouskinetochoreproteinsincomplex
withBod1
To unveil alternative recruitment factors for Bod1, Bod1‐GFP or GFP as a control were
immunoprecipitated from mitotic HeLa cells as described in Chapter III and subjected to mass
spectrometry. The experiment was performed with four biological replicates: two different IPs
each from stably or transiently Bod1‐GFP transfected HeLa cells. The samples were analysed in
two separate runs, giving two technical replicates of the experiment. Details of the
experimental conditions and statistical validation of the identified proteins can be found in the
methods section. This includes validation of the correlation between the biological replicates
which was found to be very high.
The list of identified proteins was compared to a recent compilation of 197 human kinetochore
proteins (Tipton et al., 2012) and 72 of these proteins were found enriched in the Bod1 IPs
(Figure 5. 2 A). Among all detected proteins, PP2A‐A, PP2A‐C as well as three out of five B56
subunits were detected in the Bod1 IPs, consistent with previous results (Table 5. 1).
TABLE5.1PP2ASUBUNITSFOUNDINBOD1‐GFPIPS
The PP2A subunits found are listed; along with the number of peptides detected for each subunit, their sequence coverage, and the posterior error probability (PEP) value, a measure of confidence for the spectrum‐protein match.
PP2A Subunit Protein
# of peptides % coverage PEP value
Exp1 Exp2 Exp1 Exp2 PEP Exp1 PEP Exp2
C PPP2CA 9 9 51.1 50.2 5.445E‐120 3.417E‐215
A PPP2R1A 23 24 53 55.3 7.486E‐136 6.292E‐129
PPP2R1B nf 9 nf 18 nf 1.4858E‐56
B PPP2R5C 5 5 12.1 12.3 2.2119E‐22 2.5336E‐16
PPP2R5D 10 9 25.6 25.1 1.4407E‐40 7.5847E‐30
PPP2R5E nf 2 nf 5.6 nf 1.5233E‐13
PPP2R2A 10 12 33 41.5 2.6508E‐41 8.057E‐163
PPP2R4 4 4 16.6 16.6 1.3149E‐19 4.4679E‐23

Chapter V: Bod1 binds to Hec1 and regulates its phosphorylation at the kinetochore
129
FIGURE5.2KINETOCHOREPROTEINSINTHEBOD1INTERACTIONNETWORK
(A) Kinetochore proteins detected by mass spectrometry from Bod1‐GFP immunoprecipitated form
mitotic HeLa cells are represented as evidence‐based STRING protein interaction network.
(B) Mass spectrometry results represented as a cartoon of selected, well characterised kinetochore
proteins described in Figure 1. 2. Proteins that were enriched in the Bod1‐GFP IPs over controls in any
of the four biological replicates are highlighted in red.

Chapter V: Bod1 binds to Hec1 and regulates its phosphorylation at the kinetochore
130
Chapter V: Bod1 binds to Hec1 and regulates its phosphorylation at the kinetochore
131
Interestingly, a single PP2A‐B55 subunit (B55α) was also detected. This was not observed in
immunoblots (Figure 3. 1) but the low stringency approach chosen for the mass spectrometry
experiment might reveal weaker interaction partners of Bod1. When the identified proteins
were compared to a representative view of the localisation of the most thoroughly
characterised kinetochore proteins (Figure 5. 2 B), it was obvious, that almost all Bod1
interacting proteins localised to the outer kinetochore.
All kinetochore proteins found to specifically interact with Bod1 were ranked based on the
reproducibility of their interaction with Bod1 and the posterior error probability (PEP) values
associated with their identification in each experiment (Table 5. 2). The posterior error
probability is a value obtained during the MaxQuant analysis of mass spectra that estimates
the probability that the peptide‐spectrum match is incorrect (Cox and Mann, 2008). The
probability of a false hit is calculated taking into account the peptide identification score and
the length of the peptide. PEP values of <0.05 are considered reliable, but the lower the value,
the more certainty is associated with the protein match. The highest scoring kinetochore
protein besides Bod1 itself was Hec1, as it was significantly enriched in the Bod1 IPs of all four
experiments conducted and had very low PEP values. No other kinetochore protein was
detected in the Bod1 IPs with the same degree of reproducibility.
Bod1directlyinteractswiththeNdc80complex
Hec1 is a structural component of the kinetochore that can directly mediate kinetochore‐
microtubule interactions through its N‐terminal tail (Guimaraes et al., 2008; Miller et al.,
2008), the globular calponin homology (CH) domain (Alushin et al., 2010), as well as a loop
protruding from its long coiled‐coil region (Maure et al., 2011). It exists in a heterotetrameric
complex with Nuf2, Spc24, and Spc25, which is called the Ndc80 complex (Figure 5. 3 A). Coiled
coil regions mediate tetramerisation of the complex and all four proteins contain additional
globular domains on the distal end of the oligomerisation domain that mediate interactions
with other components of the

Chapter V: Bod1 binds to Hec1 and regulates its phosphorylation at the kinetochore
132
TABLE5.2KINETOCHOREPROTEINSFOUNDENRICHEDINBOD1‐GFPIPSBYMASSSPECTROMETRY
Kinetochore proteins were sorted on reproducibility of their interaction with Bod1‐GFP (number of experiments found and the posterior error probability (PEP) value. Different colours distinguish the highly reproducible interactions (dark blue, all four biological replicates) from less well reproducible interactions (white, detected in one of the four biological replicates). TTF…transiently transfected cells; FRT…stably transfected cells; BO…Bod1 only, proteins were found only in Bod1‐GFP IPs, not in the control IPs; nf…not found, protein was not detected in Bod1‐GFP IPs.
Protein
# of Exp
found
Intensity ratio BOD1/CTRL PEP value % coverage # of peptides
TTF1 TTF2 FRT1 FRT2 PEP Exp1 PEP Exp2 Exp1 Exp2 Exp1 Exp2
BOD1 4 BO 1.658793 BO BO 5.5E‐120 0 44.3 49.7 9 14
NDC80 4 BO BO BO BO 0.000508 8.59E‐06 1.9 3.3 1 2
SUPT16H 3 151.2845 nf 2.3258 1.1379 2.2E‐134 4.49E‐68 38.6 27.2 32 18
NCAPG 3 BO 1.11 2.4257 nf 1.5E‐50 2.86E‐59 15.2 12.4 12 10
RAE1 3 2.1589 nf BO 1.1654 9.29E‐05 1.45E‐25 7.9 33.2 2 8
XPO1 2 0.8927 nf 2.5343 nf 0 nf 51.1 nf 41 nf
CLASP2 2 BO 1.101859 nf nf 4.5E‐174 7.93E‐33 12.8 10.9 13 11
TOP2A 2 BO nf nf 1.1194 1.5E‐122 7.24E‐72 20.4 14.5 24 18
SMC3 2 BO 1.1008 nf nf 6.11E‐95 1.7E‐105 27.6 16 28 16
DCTN1 2 BO 1.211341 nf nf 1.97E‐82 3.28E‐47 21 18.2 17 16

Chapter V: Bod1 binds to Hec1 and regulates its phosphorylation at the kinetochore
133
NUP107 2 0.8764 nf 1.7275 nf 2.28E‐72 nf 13.7 nf 9 nf
SMC4 2 BO 1.1061 nf nf 1.39E‐57 1.04E‐66 18.6 15.9 16 15
NUP85 2 1.2198 nf 2.1566 nf 3.25E‐54 nf 20.1 nf 9 nf
PLK1 2 0.8393 nf nf 1.1212 1.27E‐52 1.49E‐37 19.7 17.1 7 6
SSRP1 2 0.7078 nf 5.8974 nf 5.83E‐52 nf 25.2 nf 13 nf
SMC1A 2 BO 1.1052 nf nf 7.05E‐49 1.86E‐24 13.1 9.5 14 9
DNMT1 2 BO 1.1736 nf nf 8.14E‐38 2.18E‐27 9.1 9.6 11 12
CCDC99 2 nf BO 3.643217 nf 8.15E‐36 2.26E‐15 28.4 8.1 12 4
ZW10 2 1.7239 nf 2.6122 nf 8.53E‐27 nf 16.4 nf 7 nf
KNTC1 2 BO 1.1223 nf nf 1.79E‐23 6.88E‐08 3.2 2 5 3
DIAPH3 2 BO 1.1454 nf nf 4.03E‐23 1.64E‐10 9.8 5.1 8 4
STAG2 2 BO 1.2036 nf nf 3.04E‐21 1.03E‐33 9 10.2 8 9
PPP1R12A 2 BO BO nf nf 4.16E‐17 5.48E‐15 5 5 4 4
BUB1 2 BO nf nf 1.123843 8.96E‐14 1.67E‐15 5.4 8.6 5 7
AHCTF1 2 BO nf nf 1.115806 1.29E‐11 2.18E‐35 2.7 nf 4 nf

Chapter V: Bod1 binds to Hec1 and regulates its phosphorylation at the kinetochore
134
CHD1 2 BO BO nf nf 1.23E‐09 1.08E‐09 2.3 3.1 2 5
DCTN2 2 nf nf 3.26745 BO 2.6E‐07 0.000203 7.9 3.4 3 1
BUB1B 2 BO 1.134961 nf nf 6.55E‐06 2.74E‐08 1.1 3.5 1 3
EP300 2 BO nf BO nf 0.001005 nf 0.7 nf 2 nf
MAD1L1 2 1.2599 nf BO nf 0.003225 nf 2.9 nf 2 nf
DVL2 2 0.913 nf 3.2216 nf 0.007684 nf 1.6 nf 1 nf
DYNC1H1 1 61.5682 nf nf nf 0 nf 43.1 nf 149 nf
TPR 1 60.3328 nf nf nf 2.6E‐230 nf 15.4 nf 26 nf
PPP2R1A 1 0.7708 nf nf nf 7.5E‐136 nf 53 nf 23 nf
PPP1CC 1 0.7823 nf nf nf 1E‐135 nf 40.7 nf 10 nf
RANBP2 1 BO nf nf nf 8.4E‐135 nf 13.3 nf 27 nf
NUP98 1 0.9465 nf nf nf 9.2E‐129 nf 12 nf 14 nf
MAPK1 1 1.8663 nf nf nf 1.1E‐120 nf 63.1 nf 16 nf
PARP1 1 6.8745 nf nf nf 7.1E‐120 nf 37.1 nf 22 nf
NUP160 1 BO nf nf nf 1.4E‐114 nf 26.5 nf 25 nf

Chapter V: Bod1 binds to Hec1 and regulates its phosphorylation at the kinetochore
135
SEC13 1 1.0469 nf nf nf 7.7E‐101 nf 26.6 nf 5 nf
DDB1 1 24.7223 nf nf nf 1.63E‐96 nf 29.1 nf 27 nf
TRIP13 1 1.0025 nf nf nf 2.12E‐89 nf 50.2 nf 16 nf
CLASP1 1 BO nf nf nf 7.78E‐79 nf 13.9 nf 15 nf
ANAPC1 1 BO nf nf nf 5.67E‐58 nf 14.8 nf 18 nf
NUP133 1 BO nf nf nf 1.12E‐57 nf 16.4 nf 12 nf
NCAPD2 1 BO nf nf nf 9.78E‐50 nf 19.5 nf 18 nf
SMC2 1 1.9598 nf nf nf 2.15E‐41 nf 19.7 nf 19 nf
PPP2R5D 1 nf nf 2.066 nf 1.44E‐40 nf 25.6 nf 10 nf
MAPRE1 1 nf nf BO nf 7.21E‐31 nf 17.5 nf 3 nf
DYNC1LI1 1 nf nf BO nf 1.8E‐23 nf 8.2 nf 3 nf
PPP2R5C 1 nf nf 5.1241 nf 2.21E‐22 nf 12.1 nf 5 nf
NCAPD3 1 BO nf nf nf 9.43E‐18 nf 3.9 nf 4 nf
SEH1L 1 2.3906 nf nf nf 1.48E‐14 nf 10.9 nf 4 nf
CDC27 1 0.878911 nf nf nf 1.91E‐14 nf 9.3 nf 4 nf

Chapter V: Bod1 binds to Hec1 and regulates its phosphorylation at the kinetochore
136
CDC16 1 1.700299 nf nf nf 3.18E‐09 nf 6.3 nf 2 nf
ZWINT 1 1.8552 nf nf nf 4.75E‐09 nf 13 nf 3 nf
NUP43 1 1.5758 nf nf nf 6.97E‐08 nf 16.1 nf 4 nf
CENPF 1 BO nf nf nf 7.55E‐07 nf 1.4 nf 4 nf
SIN3A 1 BO nf nf nf 2.95E‐06 nf 4 nf 3 nf
CASC5 1 BO nf nf nf 3.58E‐06 nf 1.5 nf 2 nf
ZWILCH 1 nf nf 4.0771 nf 1.08E‐05 nf 4.9 nf 2 nf
NUDCD3 1 nf BO nf nf 9.61E‐05 nf 8.6 nf 2 nf
SPAG5 1 BO nf nf nf 0.000233 nf 1.5 nf 1 nf
TP53BP1 1 BO nf nf nf 0.001328 nf 0.8 nf 1 nf
RACGAP1 1 nf BO nf nf nf 1.42E‐54 nf 2.5 nf 1
SPC24 1 nf nf nf BO nf 2.91E‐31 nf 21.8 nf 2
MAPK3 1 nf nf nf BO nf 4.03E‐21 nf 31.4 nf 8
PPP2R5E 1 nf nf nf BO nf 1.52E‐13 nf 5.6 nf 2
JUB 1 nf nf nf 1.1543 nf 5.43E‐07 nf 6.9 nf 2

Chapter V: Bod1 binds to Hec1 and regulates its phosphorylation at the kinetochore
137
AURKB 1 nf nf nf BO nf 2.27E‐05 nf 7.3 nf 2
SPC25 1 nf nf nf BO nf 0.00609 nf 9.8 nf 1

Chapter V: Bod1 binds to Hec1 and regulates its phosphorylation at the kinetochore
138
FIGURE5.3BOD1INTERACTSDIRECTLYWITHTHENDC80COMPLEX
(A) Schematic drawing of the Ndc80 complex, a heterotetramere consisting of the Hec1, Nuf2, Spc24,
and Spc25 subunits. Arrows indicate regions in the Hec1 protein that contribute to Ndc80‐microtubule
interactions.
(B) Co‐immunoprecipitation using Bod1‐GST or GST as a bait with mitotic HeLa cell extracts. Antibodies
against different Ndc80 components were used.
(C) Schematic drawing of the recombinant Ndc80Bonsai, a miniature form of the Ndc80 complex lacking
large parts of the coiled coil regions of the four proteins but retaining the interaction surfaces with
microtubules and the kinetochore. This construct was used for in vitro interaction studies between Bod1
and Ndc80.
(D) Coomassie gel illustrating the purification of Ndc80Bonsai from BL21 cells. Cell lysates before and after
the addition of IPTG to induce protein expression are shown, as well as the purified protein.
(E) Image of the immunoblot analysing the pull down of recombinant Ndc80Bonsai with Bod1‐MBP or MBP
control, taken with an Odyssey CLx infrared imaging system. Anti‐GST and anti‐MBP antibodies were
used.

Chapter V: Bod1 binds to Hec1 and regulates its phosphorylation at the kinetochore
139

Chapter V: Bod1 binds to Hec1 and regulates its phosphorylation at the kinetochore
140
kinetochore‐microtubule interface. The globular regions of the microtubule proximal end of
the complex, represented by Hec1 and Nuf2, fold into calponin homology domains. Spc24 and
Scp25 on the other side of the complex facing the centromere adopt a RWD domain
conformation (Petrovic et al., 2014).
To further confirm that Bod1 interacts with Hec1 I used a different experimental strategy and
immobilised Bod1‐GST as a bait to purify Hec1 from mitotic HeLa cell extracts (Figure 5. 3 B).
Bod1‐GST, but not GST alone, could co‐precipitate components of the Ndc80 complex. Hec1,
Nuf2 and Spc24 were probed. Together with the mass spectrometry results, this suggested
that Bod1 interacts with the Ndc80 complex in mitotic HeLa cells.
Subsequently, the interaction was replicated in vitro using recombinant Bod1‐MBP and
recombinant Ndc80Bonsai (a kind gift from Jennifer DeLuca). Ndc80Bonsai is a truncated form of
the Ndc80 complex in which large parts of the coiled‐coil regions of all proteins, including the
Ndc80 loop region, have been sacrificed to improve protein stability (Ciferri et al., 2008). The
globular regions as well as Hec1’s N‐terminal tail on the other hand are fully retained (Figure 5.
3 C), conserving the most important interaction domains with microtubules on one side (Ciferri
et al., 2008) and the centromere on the other (Malvezzi et al., 2013; Petrovic et al., 2014). The
complex is expressed from a dual‐expression vector containing a fusion of Hec1‐Spc25 as well
as GST‐Nuf2‐Spc24 and the two fusion proteins can be co‐expressed and co‐purified from BL21
cells (Figure 5. 3 D). For the interaction experiment, Ndc80Bonsai was immobilised on sepharose
beads using the GST‐Tag on Nuf2‐Spc24. The Ndc80 beads were then incubated with purified
Bod1‐MBP (Figure 5. 3 E). Bod1‐MBP, but not MBP alone was strongly enriched on the Ndc80‐
covered beads suggesting that Bod1 can directly interact with the Ndc80 complex.
For its interaction with PP2A‐B56 in vitro, the phosphomimetic T95E mutation is indispensable
for Bod1 binding, as described in Chapter III. In contrast, Ndc80Bonsai bound very consistently to
wild type Bod1‐MBP, indicating that phosphorylation of Bod1 at T95 is not necessary for its
interaction with Ndc80.

Chapter V: Bod1 binds to Hec1 and regulates its phosphorylation at the kinetochore
141
Bod1preferablybindstothemicrotubule‐bindingHec1‐Nuf2dimer
To narrow down Bod1 binding partners within the Ndc80 complex, the in vitro experiment was
repeated comparing the binding efficiency to the Bonsai complex with Bod1 binding to
recombinantly expressed dimers of Hec1/Nuf2, the microtubule‐facing dimer of the Ndc80
complex, or Spc24/Spc25, which constitutes the centromere‐facing part of the Ndc80 complex.
For this experiment, GST‐Nuf2 and Hec1 or GST‐Spc24 and Spc25 were co‐purified from BL21
cells in a similar manner to the Bonsai recombinant dimer. They were then immobilised on
sepharose beads and incubated with Bod1‐MBP for binding as before. The pull downs were
quantified using the Odyssey CLx infrared imaging system with antibodies against the MBP‐
and GST‐tags of the purified proteins (Figure 5. 4). Bod1 was found to bind very well to
Ndc80Bonsai and the Hec1/Nuf2 dimer (Figure 5. 4 A and B). Binding to the Spc24/Spc25 dimer
was also observed, but seemed to be less consistent under the same experimental conditions
(Figure 5. 4 C). These differences were illustrated by the results of image quantification. Both
Ndc80Bonsai and Hec1/Nuf2 pulled out Bod1‐MBP very efficiently, resulting in Bod1‐MBP
intensities significantly above the MBP background. However, although some binding was
observed in the Spc24/Spc25 experiments as well, the Bod1‐MBP signal did not exceeded the
intensity of MBP background staining (Figure 5. 4 D). These results suggest that Bod1
preferentially binds to the Hec1/Nuf2 dimer.
Bod1‐depletionreducesHec1phosphorylationonSer55atthekinetochore
Preferential binding of Bod1 to the microtubule binding region of Ndc80 was especially
compelling as microtubule binding affinity of the N‐terminal tail of Hec1 is highly dependent on
its phosphorylation status (Cheeseman et al., 2006; DeLuca et al., 2011; Guimaraes et al.,
2008): Hec1‐microtubule interactions are stabilised upon dephosphorylation of the N‐terminal
tail and both PP1 and PP2A are discussed as candidate phosphatases (Caldas and DeLuca,
2014; Funabiki and Wynne, 2013). Naturally, it was important to corroborate whether Bod1
might have any influence on Hec1 phosphorylation. To test this, a phosphospecific Hec1

Chapter V: Bod1 binds to Hec1 and regulates its phosphorylation at the kinetochore
142
FIGURE5.4BOD1PREFERENTIALLYBINDSTHENUF2/HEC1HETERODIMER
Recombinant Ndc80Bonsai (A), recombinant Nuf2/Hec1 dimers (B) or recombinant Spc24/Spc25 dimers
(C) were used to pull down Bod1‐MBP or MBP as a control and pull down efficiency was assessed by
immunoblotting using anti‐GST and anti‐MBP antibodies in a quantitative Odyssey CLx infrared imaging
system.
(D) Quantification of the bands from (A)‐(C). Statistical test used was Student’s t‐test (Bonsai: n = 9,
Nuf2/Hec1: n = 5, Spc24/25: n = 5).

Chapter V: Bod1 binds to Hec1 and regulates its phosphorylation at the kinetochore
143

Chapter V: Bod1 binds to Hec1 and regulates its phosphorylation at the kinetochore
144
antibody for the N‐terminal Ser55 residue was used to detect Hec1 phosphorylation in control
and Bod1‐depleted HeLa cells (Figure 5. 5). This site is reproducibly phosphorylated in mitotic
cells as determined by phosphoproteomics of the mitotic spindle and analysis by phospho‐
specific antibody (DeLuca et al., 2011; Nousiainen et al., 2006). Strikingly, Hec1
phosphorylation was strongly and significantly reduced upon Bod1 depletion (P<0.001). This
was evident from the immunofluorescence images alone (Figure 5. 5 A) and confirmed by
quantification of phospho‐Hec1(S55) fluorescence at the kinetochore (Figure 5. 5 B). The
difference in S55 phosphorylation between control prometaphase cells and metaphase cells
was not significant (P=0.228). This was unexpected, because phosphorylation of this residue
had been previously shown to substantially decrease in metaphase in different cell lines
(DeLuca et al., 2011). This raised concerns that the commercially sourced phospho‐antibody
(GTX70017, GeneTex) was not specific for the residue. However, according to the
manufacturer, the specificity of the antibody had been thoroughly confirmed by using mutant
expression in mammalian cells and siRNA knockdown experiments, and this behaviour of the
antibody has been reported previously in HeLa cells (Hafner et al., 2014). Furthermore, the
phospo‐antibody did not detect any kinetochore signal in Hec1‐depleted HeLa cells, confirming
Hec1‐specificity of the antibody (Figure 5. 5 C). Potential reasons for the differences in
observation will therefore be outlined in the discussion. Interestingly, Bod1‐depletion also led
to a slight reduction of total Hec1 immunofluorescence at the kinetochores (P<0.001). The loss
of intensity was not as marked as the loss of phospho‐Hec1: while the kinetochore intensity of
pHec1 was reduced by over 70% in Bod1‐depleted cells compared to metaphase control cells,
there was just a 20% change in Hec1. This mild loss of Hec1 should not affect its function at the
kinetochore, because stable kinetochore‐microtubule attachments are still formed in Bod1‐
depleted cells (Porter et al., 2007) and chromosome congression is unperturbed in human cells
with >30% of wild‐type Hec1 levels (Caldas and DeLuca, 2014).

Chapter V: Bod1 binds to Hec1 and regulates its phosphorylation at the kinetochore
145
FIGURE5.5BOD1DEPLETIONCAUSESHYPOPHOSPHORYLATIONOFHEC1ATTHEKINETOCHORE
(A) Cells were treated with Bod1 or control siRNA and processed for immunofluorescence using Hec1
(93G) or pHec1(S55) antibodies (green) as well as markers for the mitotic spindle (red) and centromere
(blue). Scale bars are 5µm. One single z‐section is shown.
(B) Quantification of fluorescence intensity at the kinetochore. Statistical test used was Mann‐Whitney
U‐test.
(C) Immunofluorescence images and quantification for pHec1(S55) fluorescence at the kinetochore in
control and Hec1‐depleted cells. Scale bars are 5µm, images are maximum intensity projections of the
full z‐stack imaged (8µm). Statistical test performed was Mann‐Whitney U‐test.

Chapter V: Bod1 binds to Hec1 and regulates its phosphorylation at the kinetochore
146

Chapter V: Bod1 binds to Hec1 and regulates its phosphorylation at the kinetochore
147
Hec1isrequiredforproperBod1localisation
In all experimental approaches taken, Bod1 readily interacted with the Ndc80 complex making
it an ideal candidate for a Bod1 kinetochore recruitment factor. To investigate whether Bod1
localisation to the kinetochore was dependent on Hec1, Hec1 was depleted from HeLa cells
and localisation of Bod1 was confirmed using the antibodies described in the previous chapter
(Figure 5. 6). Hec1 siRNA treatment resulted in a 72% reduction of Hec1 kinetochore staining
corresponding to a highly significant loss of fluorescence. Both Bod1 and pBod1 kinetochore
staining were significantly reduced upon Hec1 depletion, losing 74% (Bod1) and 62% (pBod1)
of the original intensity. Several other kinetochore proteins were probed as controls. Nuf2, the
direct binding partner of Hec1 in the Ndc80 complex (Ciferri et al., 2005; Hori et al., 2003), was
lost concomitantly with loss of Hec1, showing a 73% loss of intensity, similar to the loss of
Hec1 intensity. Interestingly, Dsn1, a component of the Mis12 complex that constitutes a
binding platform for the Ndc80 complex at the kinetochore (Malvezzi et al., 2013) was also
highly significantly reduced to about 16% of its original intensity. Knl1 on the other hand,
which together with Mis12 and Ndc80 forms the KMN network at the outer kinetochore
(Cheeseman et al., 2006), was only mildly affected by Hec1 depletion with a reduction of
fluorescence at the kinetochore of 28%. Like Knl1, the inner kinetochore protein CENPU was
still clearly visible at the kinetochore in Hec1 siRNA treated cells (Figure 5. 6 A), dropping only
by 24% in intensity. Importantly, quantification of B56α fluorescence intensity showed that
loss of Hec1 ‐ and with it an important site of kinetochore‐microtubule attachment ‐ lead to an
increase in PP2A‐B56 across the centromeric region to 116%. This is consistent with the results
that were obtained for nocodazole‐treated cells where kinetochore‐microtubule attachment is
absent (Foley et al., 2011).

Chapter V: Bod1 binds to Hec1 and regulates its phosphorylation at the kinetochore
148
FIGURE5.6HEC1ISNECESSARYFORBOD1RECRUITMENTTOTHEKINETOCHORE
HeLa cells were transfected with control siRNA (A) or Hec1 siRNA (B) and processed for
immunofluorescence. Mitotic cells are shown that were stained with antibodies against various
kinetochore proteins (green) as well as a spindle (red) and centromere marker (blue). Inserts show
kinetochore pairs magnified from the white boxes. Scale bars are 1µm, one single z‐section per image.
(C) Quantification of fluorescence intensity at the kinetochore. Statistical test used was Mann‐Whitney
U‐Test.
(D) Bar graph showing the percent change of fluorescence intensity at the kinetochore in Hec1‐depleted
cells as compared to control cells for all proteins tested.

Chapter V: Bod1 binds to Hec1 and regulates its phosphorylation at the kinetochore
149

Chapter V: Bod1 binds to Hec1 and regulates its phosphorylation at the kinetochore
150

Chapter V: Bod1 binds to Hec1 and regulates its phosphorylation at the kinetochore
151
Chapter V: Bod1 binds to Hec1 and regulates its phosphorylation at the kinetochore
152
Bod1domainanalysisofNdc80binding
To delineate possible Ndc80 binding motifs of Bod1, bioinformatics analysis of the full length
protein was carried out. As mentioned before, Bod1 is a largely unstructured protein, but
there are two domains of lower disorder probability (Figure 1. 8) that have a higher degree of
helix propensity (Figure 5. 7 A). These sections of the primary sequence overlap with the only
annotated domain feature of Bod1, the COMPASS homology domain. This domain is flanked by
the highly disordered N‐ and C‐termini. The N‐terminus bears a glycine‐rich region (GRR), the
C‐terminus a proline‐rich region (PRR). There are several sites of post translational
modifications that have been identified in proteomic screens, including a phosphorylation site
at S67 (Sara ten Have, personal communication) and two ubiquitinylation sites (Kim et al.,
2011; Wagner et al., 2011). T95 has been extensively studied as the phosphorylation site
mediating Bod1’s interaction with PP2A‐B56 and there is some experimental evidence for the
phosphorylation of S118 (Iain Porter, personal communication). Taking this information into
account, two N‐terminal and two C‐terminal fragments of Bod1 were cloned‐ a longer and a
shorter fragment each.
Proline‐rich regions (PRRs) have previously been suggested as protein‐interaction motifs that
mediate fast but reversible interactions (Williamson, 1994). To test, whether Bod1’s PRR might
act as a Velcro‐like tethering arm for binding to Ndc80, the longer fragments were constructed
to only miss the GRR and PRR in the N‐ and C‐terminus, respectively. Shorter fragments were
also generated that each terminated before one of the two reported ubiquitinylation sites
(Figure 5. 7 A).
GFP‐tagged forms of all four fragments were expressed in HeLa cells and tested for their
expression efficiency. Asynchronous HeLa cell extracts harvested 48h post transfection showed
that all fragments were expressed although the short N‐terminal truncation was barely
expressed as a full length protein, but most of it was degraded to GFP (Figure 5. 7 B). When
transfection efficiency was determined at the same time‐point post transfection using flow

Chapter V: Bod1 binds to Hec1 and regulates its phosphorylation at the kinetochore
153
cytometry, it was revealed that a surprisingly low number of cells were transfected with the
Bod1‐fragment lacking the N‐terminal GRR. All other fragments reached transfection
efficiencies similar to wild type Bod1‐GFP (Figure 5. 7 C).
When the siRNA resistant and GFP‐tagged forms of the Bod1 fragments were used in a siRNA
recue experiment, the N‐terminal fragments and the short C‐terminal fragment all had a very
poor capacity to rescue the biorientation defects. Only the long C‐terminal fragment rescued
biorientation defects comparable to wild type Bod1‐GFP. It has to be noted however, that due
to the low transfection efficiency there were only about half the number of mitotic cells
available for counting in the dGRR samples.
These fragments were also expressed recombinantly, tagged with MBP, for use in in vitro
binding experiments with Ndc80Bonsai. These initial replicates showed that all constructs had
the ability to bind to Ndc80Bonsai (Figure 5. 8 A and B, LiCor images). Quantification of the
immunoblots showed that binding was relatively poor compared to wild type Bod1‐MBP in all
cases, but statistical analysis can only be performed on this experiment after repeating it a
third time. Meanwhile, it was noteworthy that there was a clear cut‐off for the size of break‐
down products that were able to bind Ndc80Bonsai for all Bod1 fragments.

Chapter V: Bod1 binds to Hec1 and regulates its phosphorylation at the kinetochore
154
FIGURE5.7FRAGMENTSANDMUTATIONSFORADOMAINANALYSISOFBOD1
(A) Secondary structure prediction and domain structure of Bod1 and Bod1 fragments. Grey arrows
show increased helix propensity as predicted by CLC software on the basis of primary sequence. Grey
bar covers COMPASS homology domain. Orange phospho‐residue was detected in a mass spectrometry
experiment performed by Sara ten Have, red phospho‐residues were predicted based on consensus
sequence of Cdk1 (T95) and Aurora (S118) kinases. Blue ubiquitinylation sites were published from mass
spectrometry data mining on PhosphoSitePlus (www.phosphosite.org). GRR…glycine rich region,
PRR…proline rich region.
(B) Expression levels of the C‐ and N‐terminal fragments in a population of asynchronous, transiently
transfected HeLa cells.
(C) Transfection efficiency of the C‐ and N‐terminal fragments as seen by flow cytometry analysis (in
collaboration with R. Clarke).
(D) Ability of the N‐ and C‐terminal fragments to rescue the biorientation phenotype caused by Bod1
depletion. (n = 3 experiments).

Chapter V: Bod1 binds to Hec1 and regulates its phosphorylation at the kinetochore
155

Chapter V: Bod1 binds to Hec1 and regulates its phosphorylation at the kinetochore
156
FIGURE5.8PRELIMINARYRESULTSFORINVITROBINDINGSTUDIESOFBOD1C‐ANDN‐
TERMINALFRAGMENTSWITHNDC80BONSAI
(A) Li‐Cor image and quantification of the C‐terminal Bod1 fragments (dGRR and dUb1). n = 2
experiments.
(B) Li‐Cor image and quantification of the N‐terminal Bod1 fragments (dPRR and dUb2). n = 2
experiments.

Chapter V: Bod1 binds to Hec1 and regulates its phosphorylation at the kinetochore
157
Chapter V: Bod1 binds to Hec1 and regulates its phosphorylation at the kinetochore
158
Discussion
Bod1 was first described as a novel kinetochore protein (Porter et al., 2007), but information
about its binding determinants remained elusive. Here, it is revealed that recruitment of Bod1
to the kinetochore is mediated by direct interaction with the structural kinetochore
component Hec1 and functionally feeds forward by affecting Hec1 phosphorylation in its
microtubule binding region.
Immunofluorescence staining with the Bod1 peptide antibodies described in the previous
chapter showed Bod1 localisation at the outer kinetochore‐microtubule interface. In
agreement with this, the mass spectrometry experiments described here demonstrated that
kinetochore proteins detected in Bod1‐GFP immunoprecipitates from mitotic HeLa cells almost
exclusively present at the outer kinetochore (Figure 5. 2 B). The exception here is Aurora B
kinase which is tethered to the centromere via the CPC components survivin and borealin
binding to histones H3 and H2A, respectively (reviewed in (Funabiki and Wynne, 2013)).
Aurora B has a central role in error correction and is thought to target proteins at the outer
kinetochore as far as 100nm away (Wan et al., 2009). This is twenty times the diameter of an
Aurora B molecule (Elkins et al., 2012). Another pool of active Aurora B has recently been
described at the outer kinetochore in early mitosis (DeLuca et al., 2011). This might provide an
explanation for the interaction of Bod1 with Aurora B, but it also raises questions regarding the
pertinence of the spatial separation model of Aurora B phosphorylation: If the kinase is
present at the outer kinetochore, its outer kinetochore targets might not be removed entirely
from its vicinity upon biorientation. The active Aurora B pool is, however, strongly reduced at
metaphase, restricting its influence on kinetochore phosphorylation upon biorientation.
Therefore, the possibility that Bod1 in fact associates with Aurora B at the outer kinetochore
cannot be excluded.
The most reproducible interaction detected in the mass spectrometry experiment was the
interaction with Hec1. The strong interaction between Bod1 and Hec1 was surprising, as it had

Chapter V: Bod1 binds to Hec1 and regulates its phosphorylation at the kinetochore
159
not been detected in initial hydrodynamic experiments (Porter et al., 2007). These gel filtration
and glycerol gradient experiments had been performed in nocodazole‐arrested HeLa cells
which should have increased the probability of the interaction through lack of attachment
(Figure 4. 7). However, it is worth discussing that only two Bod1‐containing fractions were
detected in both experiments: the free cytoplasmic pool and a fraction co‐migrating with a
large complex of ~490kD. This was underrepresenting the number of suggested Bod1
complexes which include the kinetochore complex, a centrosomal complex (Porter et al., 2007)
and a chromatin‐associated complex (van Nuland et al., 2013). Under the conditions used for
the hydrodynamic analysis, the human kinetochores would have been expected to dissociate
into subcomplexes, including the ~197kD Ndc80 complex and the ~120kD Mis12 complex
(McClelland and McAinsh, 2009). Therefore it is unlikely that the ~490kD complex detected
represents the kinetochore ‐ the Bod1 kinetochore fraction might not have been isolated
under those particular experimental conditions at all. This conundrum will only be adequately
solved if the 490kD Bod1 complex can be isolated and subjected to mass spectrometry.
The mass spectrometry experiments of Bod1‐GFP IPs described in this chapter accurately
reflected the information implicit in the immunofluorescence experiments with both GFP‐
tagged Bod1 and Bod1 antibodies. GFP‐tagged Bod1 localises to the outer kinetochore (Porter
et al., 2007) and the Bod1 antibody signal recapitulates those results (Figure 5. 9). Accordingly,
most of the Bod1 interacting kinetochore proteins detected have been described as part of the
outer kinetochore (Figure 5. 2 B).

Chapter V: Bod1 binds to Hec1 and regulates its phosphorylation at the kinetochore
160
FIGURE5.9LINEPROFILEOFAPAIROFSISTERKINETOCHORES
Intensity profile of a pair of sister kinetochores (KCh1 and KCh2) stained for Hec1 (red) and Bod1
(green). The line along which measurement has been taken is indicated in the immunofluorescence
image on top. Scale bar in the top left corner is 1µm.
In the in vitro binding experiments, Bod1 preferentially associated with the Hec1/Nuf2‐side of
the Ndc80 complex, but some binding to Spc24/25 was also observed. This raises the question
whether Bod1 might interact with a common structural motif that is present in both halves of
the complex rather than a sequence motif. For example, even though large parts of the coiled
coil regions were deleted, there is still a substantial portion of coiled coil present in Ndc80Bonsai
(Figure 5. 10). To infer Bod1 binding propensity to coiled coil regions, binding to different
coiled‐coil proteins, such as tropomyosin, condensin and cohesin subunits (White and Erickson,
2009), or CENPE (Kim et al., 2008) could be tested in the Bod1 in vitro binding assay. Likewise,
Bod1 might recognise the calponin homology domain in Hec1. This structural motif is also
present in other proteins, for example the microtubule (+) end binding protein EB1 (Hayashi
and Ikura, 2003), which could be tested in the binding assay.

Chapter V: Bod1 binds to Hec1 and regulates its phosphorylation at the kinetochore
161
FIGURE5.10CRYSTALSTRUCTUREOFNDC80BONSAI
Crystal structure (PDB 2VE7) of Ncd80Bonsai showing the globular lateral regions and the medial coiled
coil region of the dimer. The crystal structure was solved in (Ciferri et al., 2008).
The most informative experiment, however, would be to express Hec1 and Nuf2 alone and test
them for Bod1 binding. Considering the negative results obtained for single PP2A subunits
binding to Bod1, one should be aware of the possibility that Bod1 binding might require the
native fold obtained in the Hec1‐Nuf2 dimer. However, if one or both of the proteins by
themselves retain the ability to bind to Bod1, the Bod1 binding domain could be isolated using
protein fragments as described in this chapter for Bod1. Alternatively, protein‐protein
interactions at the kinetochore on linear epitopes have successfully been identified using
peptide arrays that cover one protein from the complex of interest with partly overlapping 20‐
mer peptides derived from its primary sequence and then incubating these arrays with the
purified binding partner (Kruse et al., 2013).
Bod1 interaction with Hec1 seems to have functional implications for both proteins: Bod1
relies on Hec1 for kinetochore localisation, Hec1 in turn depends on Bod1 for its proper
phosphorylation at the N‐terminal S55. This is particularly significant as S55 conforms to the
suggested Aurora B consensus motif [R/K]x[T/S][I/L/V] (where x can be any amino
acid)(Cheeseman et al., 2002) and is phosphorylated by Aurora B in vitro (Ciferri et al., 2008;
DeLuca et al., 2006), which makes it an excellent candidate for playing a role in the tension‐
sensing machinery described earlier. It now needs to be demonstrated that loss of Hec1 Ser55
Chapter V: Bod1 binds to Hec1 and regulates its phosphorylation at the kinetochore
162
phosphorylation in Bod1‐depleted cells is a consequence of PP2A‐B56 hyperactivity. If co‐
depletion of PP2A‐B56 with Bod1 rescues the phosphorylation, there would be strong
evidence that the dephosphorylation event is PP2A‐dependent. It then remains to be
determined whether Hec1 dephosphorylation is catalysed directly by PP2A. This could be
tested by using a Hec1 peptide containing S55 in the Malachite green phosphatase assay. It
could then easily be determined whether this dephosphorylation event is inhibited by
Bod1(T95E).
Apart from S55, there are eight other phosphorylation sites in the Hec1 N‐terminus that
contribute to biorientation. Close monitoring of an unphosphorylatable 9A mutant of Hec1 in
metaphase cells revealed that the absence of all phospho‐residues at the N‐terminal tail
strongly reduced the oscillations of chromosomes on the metaphase plate and lead to
segregation defects (Zaytsev et al., 2014). The retention of one of those nine phosphorylation
sites was sufficient to rescue this phenotype and this was independent of the exact residue
within the N‐terminal tail. This shows that Hec1 phosphorylation is not completely lost in
metaphase, but instead there seems to be stochastic dephosphorylation of some residues
leading to a lower total number of phosphorylation sites in metaphase compared to prophase.
This mechanism might partly explain the unexpectedly high phosphorylation of S55 in
metaphase. This observation highlights the requirement for a more extensive characterisation
of the phosphorylation profile of the Hec1 N‐terminus in Bod1‐depleted cells in order to draw
conclusions regarding the microtubule binding properties of Hec1 upon Bod1 depletion.
Furthermore, a detailed characterisation of Hec1 as Bod1’s receptor at the kinetochore calls
for the identification of the interacting domains of both proteins. The Bod1 fragment binding
experiments described at the end of this chapter were designed to start to address this.
However, the conditions for these experiments probably need to be optimised as the
fragments seem generally less stable than wild type Bod1. Especially the C‐terminal fragments
are subject to extensive degradation in vivo: the long C‐terminal fragment dGRR displays very

Chapter V: Bod1 binds to Hec1 and regulates its phosphorylation at the kinetochore
163
low transfection efficiencies in HeLa cells and the short C‐terminal fragment dUb1 is largely
degraded to a protein with the electrophoretic mobility of GFP (Figure 5. 7 C and B). When
used in the in vitro studies, it was noticeable that all constructs displayed a minimum size cut‐
off for degradation products that were still able to interact with Ndc80Bonsai (Figure 5. 8). This
suggests that although the short fragments are generally unstable and show reduced Hec1
affinity, the critical binding site is probably not contained within the deleted regions. Hence,
these experiments should be continued including a Bod1 fragment containing the disordered
N‐ and C‐termini, but lacking parts of the middle region. T95 is missing from the short C‐
terminal fragment dUb2. This could mean that T95 is not crucial for the interaction with the
Ndc80 complex. Without the proper statistical analysis from a third repeat of the experiment,
this conclusion is, however, mere speculation. It nevertheless highlights the importance of
including a construct that is missing this site, for example the T95A Bod1 mutant.
It is further unclear whether Bod1 can bind to Hec1 and PP2A at the same time. The binding
region of Bod1 and PP2A is mapped around T95 on Bod1 (Porter et al., 2013). Its binding
surface with Hec1 on the other hand still needs to be found. Experiments with N‐terminally
truncated Bod1 show that Bod1 lacking T95 can still bind to Ndc80Bonsai, albeit not as well as
wild type Bod1. If this finding can be confirmed by narrowing down the region in Bod1 that
fully abolishes Ndc80 binding, an interaction of both PP2A and Hec1 with Bod1 is formally
conceivable. To test if both proteins can bind Bod1 at the same time, it might be possible to
measure Bod1‐PP2A binding in the presence of various concentrations of recombinant Ndc80.
If both proteins can bind at the same time, Ndc80 should not be unable to outcompete PP2A
for Bod1 binding.

Chapter VI: Discussion and Future Directions
164
ChapterVI:DiscussionandFutureDirections
Depletion of the kinetochore protein Bod1 causes a severe biorientation defect in 30% of cells
after 48h siRNA treatment (Porter et al., 2007). Bod1‐depleted cells have trouble recovering
from monopolar spindles (Porter et al., 2007), similar to what is observed in cells lacking
Aurora B activity (Lampson et al., 2004), and the balance of phosphorylation at their
kinetochores is considerably disturbed (Porter et al., 2007; Porter et al., 2013).
Bod1canfine‐tunekinetochorephosphorylationbyregulatingPP2A‐
B56
The data presented in this thesis demonstrated that Bod1 could, in HeLa cells (Figure 3. 1) and
in vitro (Figure 3. 7), interact with PP2A‐B56, a phosphatase that antagonises protein
phosphorylation at the outer kinetochore (Foley et al., 2011). This provides an explanation for
the phospho‐imbalance at the kinetochore upon Bod1 depletion as the interaction of the two
kinetochore proteins Bod1 and PP2A was essential in the prevention of chromosome
misalignment in HeLa cells (Figure 3. 3). Additionally, our finding that Bod1 could inhibit PP2A
activity (Figure 3. 2) provided a biochemical mechanism for this essential function of Bod1.
These data strongly support the hypothesis that Bod1 assists chromosome biorientation by
regulating PP2A‐B56 at mitotic kinetochores (Porter et al., 2013).
In vitro production of recombinant PP2A holocomplexes has been described as extremely
challenging (Cho and Xu, 2007; Janssens et al., 2008). Despite these difficulties, a method for
semi‐recombinant assembly for PP2A‐B56 is described in Chapter III. The resultant complex
was not only stable enough to perform subsequent in vitro interaction experiments, but in
contrast to previous methods (Cho and Xu, 2007), it also retained some phosphatase activity
(Figure 3. 8). This suggests that it might be possible to use the semi‐recombinant enzyme for
phosphatase assays on kinetochore proteins in vitro. As discussed in Chapter III, the dynamic
range of the phosphatase assay needs to be significantly improved. To obtain higher yields of

Chapter VI: Discussion and Future Directions
165
PP2A‐B56γ‐GST for providing high molar amounts of the phosphatase in an improved assay,
further optimisation of the protein purification procedure is required. Furthermore, the
reaction conditions might need to be optimised for the particular requirements of purified
PP2A, such as a higher supplement of MnCl2 (Nimmo and Cohen, 1978). Once a reliable in vitro
PP2A assay is established with the PBIP1 phospho‐peptide as a substrate, a repertoire of
different kinetochore substrates such as phospho‐Hec1 peptides could be explored. The assay
could also be used for determining reaction kinetics of PP2A‐B56 with and without Bod1 and
for giving a more detailed understanding of Bod1’s inhibitory mechanism. It is unlikely that
Bod1 acts as a classical inhibitor because of the relatively weak interaction between Bod1 and
PP2A‐B56 in vitro. Moreover, overexpression of Bod1 does not cause any cellular anomalies,
even when tethered to the kinetochore (data not shown). It may however act as an alternative
substrate by decorating outer kinetochore proteins and thus acting as a decoy for PP2A‐B56
activity. This could be an important regulatory mechanism at the kinetochore that accounts for
the fine‐tuning of phosphorylation, especially as other small PP2A inhibitory proteins have
been shown to act in a similar manner, called ‘unfair competition’ (Mochida, 2013).
Bod1regulatesmultiplephospho‐epitopesatthekinetochore
Through label‐free quantitative mass spectrometry (described in Chapter V), it was shown that
Bod1 very reproducibly interacts with the outer kinetochore protein, and Ndc80 complex
component, Hec1 in mitotic HeLa cells (Figure 5. 3 B). Recombinant Bod1 also directly
interacted with the Ndc80Bonsai complex in vitro (Figure 5. 3 E). Additionally, Bod1 localisation
to the kinetochore itself was strongly dependent on the microtubule‐binding protein Hec1
(Figure 5. 6) even though other kinetochore components, such as Knl1 and CENPU, seemed to
be largely unaffected by Hec1 depletion.
Bod1 depletion significantly reduced Hec1 phosphorylation at Ser55 of its N‐terminal tail
region (Figure 5. 5), which substantiates the importance of the interaction between Bod1 and
the Ndc80 complex. Together with MCAK Ser92 (Porter et al., 2007) and PBIP1 Thr78 (Porter et

Chapter VI: Discussion and Future Directions
166
al., 2013), this is the third phospho‐epitope at the kinetochore that has been reported to be
lost upon Bod1 depletion. Bod1 therefore seems to control the phosphorylation of a variety of
different kinetochore proteins, all of which are implicated in the establishment of
biorientation. Therefore, concentrating on one single protein in search of the underlying cause
for the Bod1 phenotype will probably not prove fruitful. On the other hand, single‐site analysis
for different proteins was established as a useful tool for dissecting the substrate spectrum
affected by Bod1. The mass spectrometry data presented in Chapter V of this thesis might
serve as guide in the search for other epitopes that Bod1 can protect from PP2A‐B56 activity.
Candidates could then be tested with phospho‐specific antibodies available for kinetochore
proteins to draw a rough map of kinetochore‐specific phosphorylation sites affected and
unaffected by Bod1 depletion (Chan et al., 2012; DeLuca et al., 2011; Suijkerbuijk et al., 2012;
Welburn et al., 2010). A comprehensive list of PP2A‐B56 substrates at the kinetochore would
also be valuable in estimating the extent of potential Bod1 targets, although they might only
partially overlap. The best approach for this would probably be quantitative phospho‐
enrichment mass spectrometry in the presence and absence of PP2A‐B56 in nocodazole‐
arrested mitotic cells.
Hec1 directly binds microtubules and charge modification of its N‐terminal tail severely
disturbs mitotic progression in vertebrate cells. If nine Aurora B target sites, including S55, are
changed to a phosphomimetic aspartate (Hec1‐9D), end‐associated attachments drop by 60%
compared to control cells in late prophase (Guimaraes et al., 2008). If a neutral charge is
substituted (Hec1‐6A), cells exhibit an increase in merotelic attachments with 40% of cells
showing attachment defects in metaphase compared to 10% in control cells (DeLuca et al.,
2006). Hec1 affinity for microtubules decreases incrementally with the number of phospho‐
mimetic residues that are introduced into the N‐terminal tail (Zaytsev et al., 2014). Another
Bod1‐target, MCAK, is also phosphorylated by Aurora B on multiple sites, all of which
contribute to promote chromosome alignment (Andrews et al., 2004). It would be very

Chapter VI: Discussion and Future Directions
167
interesting to quantify the effects of Bod1 depletion on kinetochore proteins such as MCAK
and Hec1 that are phosphorylated on multiple sites to cooperatively change their behaviour.
However, using antibodies against different phosphorylation sites, or even quantitative
analysis of the phosphorylation sites by mass spectrometry might not suffice to accurately
reflect the effective binding capacity of Hec1. This is because cooperative binding on each
microtubule binding site at the kinetochore is determined by the individual phospho‐profile at
that particular site. However, it is possible to characterise the binding properties of Bod1‐
depleted kinetochores themselves as a functional readout of protein phosphorylation.
Towards this, experiments to determine kinetochore microtubule dynamics in vivo have been
used previously. For example, cells that contain Hec1 with unphosphorylatable N‐termini
display severe defects in microtubule flux (DeLuca et al., 2006). It would thus be informative to
test whether Bod1 depletion can influence (+) end dynamics of kinetochore microtubules. For
example, this could be tested by using cells stably expressing photoactivatable tubulin‐GFP and
measuring the kinetics of fluorescence dissipation after photoactivation in the presence and
absence on Bod1 (Mitchison, 1989).
Bod1’sregulatoryactivityisanearlymitoticevent
Close examination of the interaction between PP2A‐B56 and Bod1 in Chapter III revealed that
their interaction was heavily dependent on Bod1 phosphorylation at T95. For this reason, a
Bod1 T95‐specific phospho‐antibody was generated in sheep and extensively characterised
(described in Chapter IV). The fact that this antibody reacted with intracellular Bod1 in fixed
HeLa cells when used for immunofluorescence staining, enabled the spatio‐temporal
investigation of this phosphorylation event in cells (Figure 4. 5). This revealed that
phosphorylation of this residue coincides with the temporal window at which PP2A‐B56
localises to kinetochores (Foley et al., 2011): Bod1 is strongly phosphorylated at T95 in
prometaphase and phosphorylation drops in metaphase, although it does not disappear
completely. Phosphorylation is high in cells arrested with monopolar spindles using STLC and

Chapter VI: Discussion and Future Directions
168
maximal in cells with unattached kinetochores, generated by nocodazole treatment (Figure 4.
7). PP2A‐B56 antagonises Aurora B activity in early mitosis and allows for stabilisation of
kinetochore‐microtubule interactions by dephosphorylating outer kinetochore proteins;
thereby increasing their affinity for microtubules (Foley et al., 2011). To prevent premature
stabilisation of incorrect kinetochore‐microtubule attachments, the balance of the kinase‐
phospahatase antagonism needs to be slightly in favour of the kinase at immature
kinetochores that have not fully established a bioriented state (Salimian et al., 2011). Apart
from spatial regulation of Aurora B kinase (Andrews et al., 2004; Fuller et al., 2008; Liu et al.,
2009; Welburn et al., 2010), regulation of PP2A‐B56 by Bod1 would provide a good mechanism
for tipping this balance. The finding that PP2A‐B56 localisation to the kinetochore and Bod1
T95 phosphorylation at the kinetochore coincide trough the course of mitosis supports such a
model.
Bod1 T95 phosphorylation peaked in prometaphase (Figure 4. 5), which suggests that PP2A‐
B56 regulation by Bod1 is most efficient at this stage of mitosis. This finding necessitates a
closer look at the early events in the development of the characteristic biorientation defect in
Bod1‐depleted cells. To fully characterise the aetiology of this phenotype, spindle assembly
and initial kinetochore‐microtubule attachments from early prophase should be examined
more closely. The generation of a pan‐specific Bod1 antibody that works in
immunofluorescence enables monitoring of endogenous Bod1 protein levels in intact cells for
the first time. In the future, this antibody will be useful to identify prometaphase cells
depleted of Bod1 to address questions about the early events in the development of Bod1‐
related biorientation defects, before chromosome misalignment develops.
Bod1depletioncompromiseserrorcorrectionmechanisms
Out of a number of different causes for the development of chromosome misalignment (Figure
6. 1), two will be discussed in detail that might pertain to Bod1‐depleted cells. (i) One
possibility is that Bod1‐depleted cells could have a general impairment in forming end‐on

Chapter VI: Discussion and Future Directions
169
kinetochore‐microtubule attachments, as has been reported for both the Ndc80 complex (Cai
et al., 2009; DeLuca et al., 2005) and PP2A‐B56 depletion (Foley et al., 2011). (ii) Alternatively,
a low phosphorylation profile in early mitosis as observed in Bod1‐depleted cells may
compromise error correction in cells that are overwhelmed by syntelic attachments, similar to
Aurora B‐deficient cells (Hauf et al., 2003).
FIGURE6.1DIFFERENTCAUSESFORCHROMOSOMEALIGNMENTDEFECTSINVERTEBRATECELLS
Six causes of chromosome alignment defects are shown (black) with examples of proteins that are
causative for these defects with relevant citations (blue). Examples (i) and (ii) are discussed further in
the text. As Bod1‐depleted cells have no (iii) checkpoint or (v) kinetochore capture defects (Porter et al.,
2007), these options can be excluded as causes for the biorientation defect. (iv) Microtubule motor
defects are phenotypically distinct from the Bod1‐depleted cells, with much fewer chromosomes failing
to align on the metaphase plate (Levesque and Compton, 2001; McEwen et al., 2001). (vi) Loss of spindle
pole integrity is observed in some but not all Bod1‐depleted cells. This phenotype might thus be
secondary to the development of the Bod1 phenotype, not causative. This has been described for other
kinetochore proteins (Mattiuzzo et al., 2011).

Chapter VI: Discussion and Future Directions
170
Bod1‐depletedcellscanestablishend‐onattachments
Disruption of the Ndc80 complex and PP2A‐B56 both cause loss of end‐on attachments. The
Ndc80 complex constitutes part of the primary end‐on binding site from yeast to man
(Cheerambathur et al., 2013; Cheeseman and Desai, 2008; Guimaraes et al., 2008; Maure et
al., 2011). It is therefore not surprising that depletion of Hec1 and Nuf2 removes end‐on
microtubule binding (DeLuca et al., 2005). Similarly, if Hec1 is sterically inhibited from binding
microtubules, this also causes increased lateral attachments (DeLuca et al., 2006; Mattiuzzo et
al., 2011). In B56‐depleted cells, most misaligned chromosomes associate with the microtubule
walls rather than the (+) ends, consistent with increased phosphorylation of outer kinetochore
proteins that prevents them from forming end‐on attachments (Foley et al., 2011).
Since Bod1 interacts with both of these protein complexes, it is reasonable to ask whether its
depletion, too, impairs end‐on attachment formation. If some kinetochores cannot form end‐
on attachments and still congress to the metaphase plate by means of (+) end directed motor
proteins such as CENPE (McEwen et al., 2001; Schaar et al., 1997; Wood et al., 1997), their
unattached kinetochores would activate the spindle assembly checkpoint leading to a
prolonged metaphase arrest and, eventually, cohesion fatigue and cell death (Stevens et al.,
2011). It was originally assumed that biorientation preceded chromosome congeression
(Maiato and Sunkel, 2004). This has been subject to debate, as more recent studies
demonstrate, that chromosomes can align on the metaphase plate without having achieved
biorientation (Kapoor et al., 2006). In fact, chromosome congression can take place in the
complete absence of microtubule attachments, provided that poleward‐directed
motorproteins are depleted and cannot carry the chromosomes away from the metaphase
plate (Cai et al., 2009).
The spindles of Bod1‐depleted cells do contain some laterally attached chromosomes and their
arrest is checkpoint‐mediated (Porter et al., 2007). Most kinetochores, however, are attached
end‐on (Porter et al., 2007). And most importantly, the lateral attachment model does not

Chapter VI: Discussion and Future Directions
171
explain the increase in syntelic attachments observed in Bod1‐depleted cells. Furthermore, for
a general attachment defect like this, more than 30% of cells would be expected to show the
phenotype, particularly as immunoblot analysis of a cell population shows Bod1 protein
depletion efficiencies around 90% following siRNA treatment (Porter et al., 2007).
Bod1‐depletedcellsareunabletocorrectsyntelicattachments
According to the spatial separation model, the competency for correcting attachment errors
depends on the efficiency of Aurora B phosphorylation. High efficiency results in
destabilisation of attachments, low efficiency supports kinetochore‐microtubule interactions
(Cheeseman et al., 2006; DeLuca et al., 2006; Guimaraes et al., 2008; Welburn et al., 2010).
PP2A‐B56 hyperactivity in Bod1‐depleted cells would cause a low efficiency of Aurora B‐
mediated outer kinetochore phosphorylation early in prometaphase, leading to a lower
probability of attachment destabilisation.
Bod1‐depleted cells usually contain at least one unattached kinetochore, which explains SAC
activation. This might be indicative of slower kinetics of the destabilisation of microtubule
attachments in Bod1 depleted cells compared to control cells causing a significant delay in
mitosis. This hypothesis is supported by the higher incidence of syntelic attachments in Bod1‐
depleted cells and their difficulties responding to an artificial increase in such attachments by
monastrol treatment (Porter et al., 2007).
HypotheticalmodelfortheroleofBod1inattachmenterrorcorrection
attheouterkinetochore
A hypothetical model to integrate the findings of this thesis with previous results on the roles
of other molecular players of the error correction machinery (such as: Hec1, Knl1, BubR1, Plk1,
Aurora B, PP2A, and PP1) is presented in the following.

Chapter VI: Discussion and Future Directions
172
PrimingthekinetochoreforerrorcorrectionIn late G2, Aurora B kinase activity picks up through auto‐phosphorylation of Thr‐232 (Yasui et
al., 2004). This enables it to phosphorylate kinetochore substrates such as Mps1 (Saurin et al.,
2011) and Knl1 (Liu et al., 2010; Welburn et al., 2010). When the Ndc80 complex is recruited to
the kinetochore in prophase (Gascoigne and Cheeseman, 2013) (Figure 6. 2 A), it can be
phosphorylated at its N‐terminus (DeLuca et al., 2011) and activated Mps1 can bind to the
Hec1 calponin homology domain (Martin‐Lluesma et al., 2002; Nijenhuis et al., 2013). Mps1
phosphorylation of Knl1 on its MELT repeats recruits Bub3 (Shepperd et al., 2012) which in
turn promotes BubR1 recruitment via the GLEBS motif in BubR1 (Taylor et al., 1998). BubR1 is
phosphorylated by Plk1 to recruit PP2A‐B56 to kinetochores (Suijkerbuijk et al., 2012) in early
prometaphase (Figure 6. 2 B). PP2A can then antagonise Aurora B in phosphorylating the Knl1
N‐terminus at the SSILK and RVSF motifs (Nijenhuis et al., 2014), which relives the Aurora B‐
mediated inhibition of PP1 recruitment (Liu et al., 2010).
FIGURE6.2PRIMINGTHEKINETOCHOREFORERRORCORRECTION

Chapter VI: Discussion and Future Directions
173
ErrorcorrectioninprometaphaseIn control cells, PP2A‐B56 activity is modulated by Bod1 at unattached kinetochores which
moderates the amount of phosphatase activity towards the microtubule binding sites at the
outer kinetochore, keeping the majority of sites phosphorylated as long as biorientation is not
achieved (Figure 6. 3 A‐D). The findings in this thesis indicate that this depends on PP2A, but
whether this is a direct effect or else indirectly influences PP1 recruitment cannot be
concluded. Amphitelic microtubule attachments result in intrakinetochore stretch (Maresca
and Salmon, 2009) concomitant with a microtubule‐dependent conformational change in the
Hec1 complex (Varma et al., 2012).
FIGURE6.3ERRORCORRECTIONINPROMETAPHASE
This could provide a mechanism for relief of PP2A inhibition by Bod1 upon microtubule
attachment, for example by spatial separation of Knl1‐bound PP2A‐B56 and its Hec1‐bound
inhibitor Bod1 (Figure 6. 3 E). At the same time Bod1 is dephosphorylated and its effectivity as
an inhibitor drops. Full activation of PP2A results in a net drop of RVSF phosphorylation as the

Chapter VI: Discussion and Future Directions
174
phosphatase activity surpasses Aurora B kinase activity, thus allowing steady recruitment of
PP1. PP1 fully dephosphorylates outer kinetochore proteins upon chromosome alignment
(Figure 6. 3 F).
PrometaphasewithoutBod1In Bod1‐depleted cells, PP2A‐B56 is fully active at the start of prometaphase (Figure 6. 4 A).
This results in early recruitment of PP1 and dephosphorylation of the outer kinetochore
(Figure 6. 4 B and C). The dephosphorylated kinetochore proteins stably bind to microtubules
(Figure 6. 4 C and D, red circles), impairing error correction in prometaphase. It can further be
speculated that lack of intrakinetochore stretch (Porter et al., 2013) fails to promote an Ndc80
conformational change. This could lead to retention of Mps1 in the vicinity of Knl1 which could
explain that PP2A (Porter et al., 2013) and checkpoint proteins (Porter et al., 2007) are
continually recruited to the kinetochore (Figure 6. 4 D). The cells are maintained in a
checkpoint‐mediated arrest and fail to progress through mitosis.
FIGURE6.4PROMETAPHASEWITHOUTBOD1

Chapter VI: Discussion and Future Directions
175
This hypothetical model incorporates the findings of this thesis, but also speculates on the
potential impact of these findings on molecular components of the error correction machinery
that have not yet been tested, such as PP1 and Mps1. To validate this model, these remaining
gaps need to be addressed. PP1 recruitment to the kinetochore and its activity could be
assessed using immunofluorescence staining and biochemical methods. It would be very
interesting to address the localisation of Mps1 in Bod1 depleted cells and to probe the
phosphorylation status of the MELT repeats. Alternatively, Knl1 could be immunoprecipitated
from Bod1 depleted cells and the continued activity of Mps1 could be assessed indirectly by
immunoblotting for the co‐precipitation of Bub3 and BubR1. If Mps1 activity is continued,
Bub3 should co‐precipitate with Knl1 in Bod1‐depleted cells.

Chapter VI: Discussion and Future Directions
176
Conclusion
Bod1 is an essential part of the outer kinetochore phospho‐regulatory network in early mitotic
stages of vertebrate cells. Data presented in this thesis support the hypothesis that Bod1
regulates PP2A‐B56 at mitotic kinetochores. This places Bod1 alongside a number of small
PP2A inhibitory proteins discovered in recent years, including the mitotic regulators Arpp‐19
and Ensa (Gharbi‐Ayachi et al., 2010; Mochida et al., 2010), the oncoprotein CIP2A (Cancerous
Inhibitor of PP2A) (Junttila et al., 2007) and the putative oncogene I2PP2A/SET (Inhibitor 2 of
protein phosphatase 2A) (Li et al., 1995). Together, these small proteins constitute regulatory
mechanism for cellular activity of phosphatases, enzymes that were previously thought of as
poorly regulated and promiscuous.
Furthermore, the experiments described in this thesis substantiate a model according to which
Bod1 is indispensable in mammalian cells to allow for the correction of syntelic attachment
errors. These types of attachment defects predestine cells for erroneous mitosis that can lead
to aneuploidy and cell death (Gordon et al., 2012). Understanding the molecular machinery
that prevents these types of attachment errors will help shed light on mechanisms of cell
division‐related conditions such as cancer progression, developmental disorders, and
miscarriages. In fact, a homozygous point mutation in the human BOD1 gene co‐segregates
with mental retardation (Iain Porter and Sahar Esmaeeli‐Nieh, unpublished data). This work
highlights the importance of understanding the role of small regulatory proteins like Bod1 in
order to obtain a complete understanding of the molecular mechanisms underlying
chromosome segregation.

References
177
References
Adams, D.G., and B.E. Wadzinski. 2007. Isolation and characterization of PP2A holoenzymes containing FLAG‐tagged B subunits. Methods Mol Biol. 365:101‐11.
Adams, R.R., H. Maiato, W.C. Earnshaw, and M. Carmena. 2001. Essential roles of Drosophila inner centromere protein (INCENP) and aurora B in histone H3 phosphorylation, metaphase chromosome alignment, kinetochore disjunction, and chromosome segregation. J Cell Biol. 153:865‐80.
Allan, C., J.M. Burel, J. Moore, C. Blackburn, M. Linkert, S. Loynton, D. Macdonald, W.J. Moore, C. Neves, A. Patterson, M. Porter, A. Tarkowska, B. Loranger, J. Avondo, I. Lagerstedt, L. Lianas, S. Leo, K. Hands, R.T. Hay, A. Patwardhan, C. Best, G.J. Kleywegt, G. Zanetti, and J.R. Swedlow. 2012. OMERO: flexible, model‐driven data management for experimental biology. Nat Methods. 9:245‐53.
Alushin, G.M., V.H. Ramey, S. Pasqualato, D.A. Ball, N. Grigorieff, A. Musacchio, and E. Nogales. 2010. The Ndc80 kinetochore complex forms oligomeric arrays along microtubules. Nature. 467:805‐10.
Alvarez‐Fernandez, M., R. Sanchez‐Martinez, B. Sanz‐Castillo, P.P. Gan, M. Sanz‐Flores, M. Trakala, M. Ruiz‐Torres, T. Lorca, A. Castro, and M. Malumbres. 2013. Greatwall is essential to prevent mitotic collapse after nuclear envelope breakdown in mammals. Proc Natl Acad Sci U S A. 110:17374‐9.
Andrews, P.D., Y. Ovechkina, N. Morrice, M. Wagenbach, K. Duncan, L. Wordeman, and J.R. Swedlow. 2004. Aurora B regulates MCAK at the mitotic centromere. Dev Cell. 6:253‐68.
Ault, J.G., and C.L. Rieder. 1992. Chromosome mal‐orientation and reorientation during mitosis. Cell Motil Cytoskeleton. 22:155‐9.
Baharians, Z., and A.H. Schonthal. 1998. Autoregulation of protein phosphatase type 2A expression. J Biol Chem. 273:19019‐24.
Barr, F.A., P.R. Elliott, and U. Gruneberg. 2011. Protein phosphatases and the regulation of mitosis. J Cell Sci. 124:2323‐34.
Biggins, S., F.F. Severin, N. Bhalla, I. Sassoon, A.A. Hyman, and A.W. Murray. 1999. The conserved protein kinase Ipl1 regulates microtubule binding to kinetochores in budding yeast. Genes Dev. 13:532‐44.
Bouchoux, C., and F. Uhlmann. 2011. A quantitative model for ordered Cdk substrate dephosphorylation during mitotic exit. Cell. 147:803‐14.
Burgess, A., S. Vigneron, E. Brioudes, J.C. Labbe, T. Lorca, and A. Castro. 2010. Loss of human Greatwall results in G2 arrest and multiple mitotic defects due to deregulation of the cyclin B‐Cdc2/PP2A balance. Proc Natl Acad Sci U S A. 107:12564‐9.
Cai, S., C.B. O'Connell, A. Khodjakov, and C.E. Walczak. 2009. Chromosome congression in the absence of kinetochore fibres. Nat Cell Biol. 11:832‐8.
Caldas, G.V., and J.G. DeLuca. 2014. KNL1: bringing order to the kinetochore. Chromosoma. 123:169‐81.
Castilho, P.V., B.C. Williams, S. Mochida, Y. Zhao, and M.L. Goldberg. 2009. The M phase kinase Greatwall (Gwl) promotes inactivation of PP2A/B55delta, a phosphatase directed against CDK phosphosites. Mol Biol Cell. 20:4777‐89.
Chan, Y.W., A.A. Jeyaprakash, E.A. Nigg, and A. Santamaria. 2012. Aurora B controls kinetochore‐microtubule attachments by inhibiting Ska complex‐KMN network interaction. J Cell Biol. 196:563‐71.
Chao, W.C., K. Kulkarni, Z. Zhang, E.H. Kong, and D. Barford. 2012. Structure of the mitotic checkpoint complex. Nature. 484:208‐13.
Cheerambathur, D.K., R. Gassmann, B. Cook, K. Oegema, and A. Desai. 2013. Crosstalk between microtubule attachment complexes ensures accurate chromosome segregation. Science. 342:1239‐42.

References
178
Cheeseman, I.M., S. Anderson, M. Jwa, E.M. Green, J. Kang, J.R. Yates, 3rd, C.S. Chan, D.G. Drubin, and G. Barnes. 2002. Phospho‐regulation of kinetochore‐microtubule attachments by the Aurora kinase Ipl1p. Cell. 111:163‐72.
Cheeseman, I.M., J.S. Chappie, E.M. Wilson‐Kubalek, and A. Desai. 2006. The conserved KMN network constitutes the core microtubule‐binding site of the kinetochore. Cell. 127:983‐97.
Cheeseman, I.M., and A. Desai. 2008. Molecular architecture of the kinetochore‐microtubule interface. Nat Rev Mol Cell Biol. 9:33‐46.
Chen, C., Z. Shi, W. Zhang, M. Chen, F. He, Z. Zhang, Y. Wang, M. Feng, W. Wang, Y. Zhao, J.H. Brown, S. Jiao, and Z. Zhou. 2014. Striatins contain a noncanonical coiled coil that binds protein phosphatase 2A A subunit to form a 2:2 heterotetrameric core of striatin‐interacting phosphatase and kinase (STRIPAK) complex. J Biol Chem. 289:9651‐61.
Chen, Q., X. Zhang, Q. Jiang, P.R. Clarke, and C. Zhang. 2008. Cyclin B1 is localized to unattached kinetochores and contributes to efficient microtubule attachment and proper chromosome alignment during mitosis. Cell Res. 18:268‐80.
Cho, U.S., S. Morrone, A.A. Sablina, J.D. Arroyo, W.C. Hahn, and W. Xu. 2007. Structural basis of PP2A inhibition by small t antigen. PLoS Biol. 5:e202.
Cho, U.S., and W. Xu. 2007. Crystal structure of a protein phosphatase 2A heterotrimeric holoenzyme. Nature. 445:53‐7.
Ciferri, C., J. De Luca, S. Monzani, K.J. Ferrari, D. Ristic, C. Wyman, H. Stark, J. Kilmartin, E.D. Salmon, and A. Musacchio. 2005. Architecture of the human ndc80‐hec1 complex, a critical constituent of the outer kinetochore. J Biol Chem. 280:29088‐95.
Ciferri, C., S. Pasqualato, E. Screpanti, G. Varetti, S. Santaguida, G. Dos Reis, A. Maiolica, J. Polka, J.G. De Luca, P. De Wulf, M. Salek, J. Rappsilber, C.A. Moores, E.D. Salmon, and A. Musacchio. 2008. Implications for kinetochore‐microtubule attachment from the structure of an engineered Ndc80 complex. Cell. 133:427‐39.
Cimini, D., X. Wan, C.B. Hirel, and E.D. Salmon. 2006. Aurora kinase promotes turnover of kinetochore microtubules to reduce chromosome segregation errors. Curr Biol. 16:1711‐8.
Clarke, P.R., I. Hoffmann, G. Draetta, and E. Karsenti. 1993. Dephosphorylation of cdc25‐C by a type‐2A protein phosphatase: specific regulation during the cell cycle in Xenopus egg extracts. Mol Biol Cell. 4:397‐411.
Compton, S.J., and C.G. Jones. 1985. Mechanism of dye response and interference in the Bradford protein assay. Anal Biochem. 151:369‐74.
Cox, J., and M. Mann. 2008. MaxQuant enables high peptide identification rates, individualized p.p.b.‐range mass accuracies and proteome‐wide protein quantification. Nat Biotechnol. 26:1367‐72.
Cross, F., J. Roberts, and H. Weintraub. 1989. Simple and complex cell cycles. Annu Rev Cell Biol. 5:341‐96.
De Souza, C.P., A.H. Osmani, L.P. Wu, J.L. Spotts, and S.A. Osmani. 2000. Mitotic histone H3 phosphorylation by the NIMA kinase in Aspergillus nidulans. Cell. 102:293‐302.
DeLuca, J.G., Y. Dong, P. Hergert, J. Strauss, J.M. Hickey, E.D. Salmon, and B.F. McEwen. 2005. Hec1 and nuf2 are core components of the kinetochore outer plate essential for organizing microtubule attachment sites. Mol Biol Cell. 16:519‐31.
DeLuca, J.G., W.E. Gall, C. Ciferri, D. Cimini, A. Musacchio, and E.D. Salmon. 2006. Kinetochore microtubule dynamics and attachment stability are regulated by Hec1. Cell. 127:969‐82.
DeLuca, J.G., B. Moree, J.M. Hickey, J.V. Kilmartin, and E.D. Salmon. 2002. hNuf2 inhibition blocks stable kinetochore‐microtubule attachment and induces mitotic cell death in HeLa cells. J Cell Biol. 159:549‐55.
DeLuca, J.G., and A. Musacchio. 2012. Structural organization of the kinetochore‐microtubule interface. Curr Opin Cell Biol. 24:48‐56.

References
179
DeLuca, K.F., S.M. Lens, and J.G. DeLuca. 2011. Temporal changes in Hec1 phosphorylation control kinetochore‐microtubule attachment stability during mitosis. J Cell Sci. 124:622‐34.
Dohadwala, M., E.F. da Cruz e Silva, F.L. Hall, R.T. Williams, D.A. Carbonaro‐Hall, A.C. Nairn, P. Greengard, and N. Berndt. 1994. Phosphorylation and inactivation of protein phosphatase 1 by cyclin‐dependent kinases. Proc Natl Acad Sci U S A. 91:6408‐12.
Domingo‐Sananes, M.R., O. Kapuy, T. Hunt, and B. Novak. 2011. Switches and latches: a biochemical tug‐of‐war between the kinases and phosphatases that control mitosis. Philos Trans R Soc Lond B Biol Sci. 366:3584‐94.
Dong, Y., K.J. Vanden Beldt, X. Meng, A. Khodjakov, and B.F. McEwen. 2007. The outer plate in vertebrate kinetochores is a flexible network with multiple microtubule interactions. Nat Cell Biol. 9:516‐22.
Drechsler, H., and A.D. McAinsh. 2012. Exotic mitotic mechanisms. Open Biol. 2:120140. Duarte, M.L., D.A. Pena, F.A. Nunes Ferraz, D.A. Berti, T.J. Paschoal Sobreira, H.M. Costa‐Junior,
M.M. Abdel Baqui, M.H. Disatnik, J. Xavier‐Neto, P.S. Lopes de Oliveira, and D. Schechtman. 2014. Protein folding creates structure‐based, noncontiguous consensus phosphorylation motifs recognized by kinases. Sci Signal. 7:ra105.
Elkins, J.M., S. Santaguida, A. Musacchio, and S. Knapp. 2012. Crystal structure of human aurora B in complex with INCENP and VX‐680. J Med Chem. 55:7841‐8.
Emanuele, M.J., W. Lan, M. Jwa, S.A. Miller, C.S. Chan, and P.T. Stukenberg. 2008. Aurora B kinase and protein phosphatase 1 have opposing roles in modulating kinetochore assembly. J Cell Biol. 181:241‐54.
Errico, A., K. Deshmukh, Y. Tanaka, A. Pozniakovsky, and T. Hunt. 2010. Identification of substrates for cyclin dependent kinases. Adv Enzyme Regul. 50:375‐99.
Eto, M., and D.L. Brautigan. 2012. Endogenous inhibitor proteins that connect Ser/Thr kinases and phosphatases in cell signaling. IUBMB Life. 64:732‐9.
Field, C.M., K. Oegema, Y. Zheng, T.J. Mitchison, and C.E. Walczak. 1998. Purification of cytoskeletal proteins using peptide antibodies. Methods Enzymol. 298:525‐41.
Foley, E.A., and T.M. Kapoor. 2013. Microtubule attachment and spindle assembly checkpoint signalling at the kinetochore. Nat Rev Mol Cell Biol. 14:25‐37.
Foley, E.A., M. Maldonado, and T.M. Kapoor. 2011. Formation of stable attachments between kinetochores and microtubules depends on the B56‐PP2A phosphatase. Nat Cell Biol. 13:1265‐71.
Fuller, B.G., M.A. Lampson, E.A. Foley, S. Rosasco‐Nitcher, K.V. Le, P. Tobelmann, D.L. Brautigan, P.T. Stukenberg, and T.M. Kapoor. 2008. Midzone activation of aurora B in anaphase produces an intracellular phosphorylation gradient. Nature. 453:1132‐6.
Funabiki, H., and D.J. Wynne. 2013. Making an effective switch at the kinetochore by phosphorylation and dephosphorylation. Chromosoma. 122:135‐58.
Gaitanos, T.N., A. Santamaria, A.A. Jeyaprakash, B. Wang, E. Conti, and E.A. Nigg. 2009. Stable kinetochore‐microtubule interactions depend on the Ska complex and its new component Ska3/C13Orf3. EMBO J. 28:1442‐52.
Gascoigne, K.E., and I.M. Cheeseman. 2013. CDK‐dependent phosphorylation and nuclear exclusion coordinately control kinetochore assembly state. J Cell Biol. 201:23‐32.
Gavet, O., and J. Pines. 2010. Activation of cyclin B1‐Cdk1 synchronizes events in the nucleus and the cytoplasm at mitosis. J Cell Biol. 189:247‐59.
Gharbi‐Ayachi, A., J.C. Labbe, A. Burgess, S. Vigneron, J.M. Strub, E. Brioudes, A. Van‐Dorsselaer, A. Castro, and T. Lorca. 2010. The substrate of Greatwall kinase, Arpp19, controls mitosis by inhibiting protein phosphatase 2A. Science. 330:1673‐7.
Giet, R., and D.M. Glover. 2001. Drosophila aurora B kinase is required for histone H3 phosphorylation and condensin recruitment during chromosome condensation and to organize the central spindle during cytokinesis. J Cell Biol. 152:669‐82.
Gorbsky, G.J., P.J. Sammak, and G.G. Borisy. 1988. Microtubule dynamics and chromosome motion visualized in living anaphase cells. J Cell Biol. 106:1185‐92.

References
180
Gordon, D.J., B. Resio, and D. Pellman. 2012. Causes and consequences of aneuploidy in cancer. Nat Rev Genet. 13:189‐203.
Goto, H., T. Kiyono, Y. Tomono, A. Kawajiri, T. Urano, K. Furukawa, E.A. Nigg, and M. Inagaki. 2006. Complex formation of Plk1 and INCENP required for metaphase‐anaphase transition. Nat Cell Biol. 8:180‐7.
Guimaraes, G.J., Y. Dong, B.F. McEwen, and J.G. Deluca. 2008. Kinetochore‐microtubule attachment relies on the disordered N‐terminal tail domain of Hec1. Curr Biol. 18:1778‐84.
Guttinger, S., E. Laurell, and U. Kutay. 2009. Orchestrating nuclear envelope disassembly and reassembly during mitosis. Nat Rev Mol Cell Biol. 10:178‐91.
Hafner, J., M.I. Mayr, M.M. Mockel, and T.U. Mayer. 2014. Pre‐anaphase chromosome oscillations are regulated by the antagonistic activities of Cdk1 and PP1 on Kif18A. Nat Commun. 5:4397.
Harlow, E., and D. Lane. 1988. Antibodies: A laboratory manual. Cold Spring Harbor Laboratory Press.
Hauf, S., R.W. Cole, S. LaTerra, C. Zimmer, G. Schnapp, R. Walter, A. Heckel, J. van Meel, C.L. Rieder, and J.M. Peters. 2003. The small molecule Hesperadin reveals a role for Aurora B in correcting kinetochore‐microtubule attachment and in maintaining the spindle assembly checkpoint. J Cell Biol. 161:281‐94.
Hayashi, I., and M. Ikura. 2003. Crystal structure of the amino‐terminal microtubule‐binding domain of end‐binding protein 1 (EB1). J Biol Chem. 278:36430‐4.
Hayden, J.H., S.S. Bowser, and C.L. Rieder. 1990. Kinetochores capture astral microtubules during chromosome attachment to the mitotic spindle: direct visualization in live newt lung cells. J Cell Biol. 111:1039‐45.
Hori, T., T. Haraguchi, Y. Hiraoka, H. Kimura, and T. Fukagawa. 2003. Dynamic behavior of Nuf2‐Hec1 complex that localizes to the centrosome and centromere and is essential for mitotic progression in vertebrate cells. J Cell Sci. 116:3347‐62.
Howell, B.J., B.F. McEwen, J.C. Canman, D.B. Hoffman, E.M. Farrar, C.L. Rieder, and E.D. Salmon. 2001. Cytoplasmic dynein/dynactin drives kinetochore protein transport to the spindle poles and has a role in mitotic spindle checkpoint inactivation. J Cell Biol. 155:1159‐72.
Hsu, J.Y., Z.W. Sun, X. Li, M. Reuben, K. Tatchell, D.K. Bishop, J.M. Grushcow, C.J. Brame, J.A. Caldwell, D.F. Hunt, R. Lin, M.M. Smith, and C.D. Allis. 2000. Mitotic phosphorylation of histone H3 is governed by Ipl1/aurora kinase and Glc7/PP1 phosphatase in budding yeast and nematodes. Cell. 102:279‐91.
Indjeian, V.B., and A.W. Murray. 2007. Budding yeast mitotic chromosomes have an intrinsic bias to biorient on the spindle. Curr Biol. 17:1837‐46.
Jackman, M., C. Lindon, E.A. Nigg, and J. Pines. 2003. Active cyclin B1‐Cdk1 first appears on centrosomes in prophase. Nat Cell Biol. 5:143‐8.
Janssens, V., S. Longin, and J. Goris. 2008. PP2A holoenzyme assembly: in cauda venenum (the sting is in the tail). Trends Biochem Sci. 33:113‐21.
Jeyaprakash, A.A., A. Santamaria, U. Jayachandran, Y.W. Chan, C. Benda, E.A. Nigg, and E. Conti. 2012. Structural and functional organization of the Ska complex, a key component of the kinetochore‐microtubule interface. Mol Cell. 46:274‐86.
Jordan, M.A., R.J. Toso, D. Thrower, and L. Wilson. 1993. Mechanism of mitotic block and inhibition of cell proliferation by taxol at low concentrations. Proc Natl Acad Sci U S A. 90:9552‐6.
Juanes, M.A., R. Khoueiry, T. Kupka, A. Castro, I. Mudrak, E. Ogris, T. Lorca, and S. Piatti. 2013. Budding yeast greatwall and endosulfines control activity and spatial regulation of PP2A(Cdc55) for timely mitotic progression. PLoS Genet. 9:e1003575.
Junttila, M.R., P. Puustinen, M. Niemela, R. Ahola, H. Arnold, T. Bottzauw, R. Ala‐aho, C. Nielsen, J. Ivaska, Y. Taya, S.L. Lu, S. Lin, E.K. Chan, X.J. Wang, R. Grenman, J. Kast, T.

References
181
Kallunki, R. Sears, V.M. Kahari, and J. Westermarck. 2007. CIP2A inhibits PP2A in human malignancies. Cell. 130:51‐62.
Kang, Y.H., J.E. Park, L.R. Yu, N.K. Soung, S.M. Yun, J.K. Bang, Y.S. Seong, H. Yu, S. Garfield, T.D. Veenstra, and K.S. Lee. 2006. Self‐regulated Plk1 recruitment to kinetochores by the Plk1‐PBIP1 interaction is critical for proper chromosome segregation. Mol Cell. 24:409‐22.
Kapoor, T.M., T.U. Mayer, M.L. Coughlin, and T.J. Mitchison. 2000. Probing spindle assembly mechanisms with monastrol, a small molecule inhibitor of the mitotic kinesin, Eg5. J Cell Biol. 150:975‐88.
Khoudoli, G.A., I.M. Porter, J.J. Blow, and J.R. Swedlow. 2004. Optimisation of the two‐dimensional gel electrophoresis protocol using the Taguchi approach. Proteome Sci. 2:6.
Kim, M.Y., E. Bucciarelli, D.G. Morton, B.C. Williams, K. Blake‐Hodek, C. Pellacani, J.R. Von Stetina, X. Hu, M.P. Somma, D. Drummond‐Barbosa, and M.L. Goldberg. 2012. Bypassing the Greatwall‐Endosulfine pathway: plasticity of a pivotal cell‐cycle regulatory module in Drosophila melanogaster and Caenorhabditis elegans. Genetics. 191:1181‐97.
Kim, W., E.J. Bennett, E.L. Huttlin, A. Guo, J. Li, A. Possemato, M.E. Sowa, R. Rad, J. Rush, M.J. Comb, J.W. Harper, and S.P. Gygi. 2011. Systematic and quantitative assessment of the ubiquitin‐modified proteome. Mol Cell. 44:325‐40.
Kim, Y., J.E. Heuser, C.M. Waterman, and D.W. Cleveland. 2008. CENP‐E combines a slow, processive motor and a flexible coiled coil to produce an essential motile kinetochore tether. J Cell Biol. 181:411‐9.
King, J.M., and R.B. Nicklas. 2000. Tension on chromosomes increases the number of kinetochore microtubules but only within limits. J Cell Sci. 113 Pt 21:3815‐23.
Kirschner, M., and T. Mitchison. 1986. Beyond self‐assembly: from microtubules to morphogenesis. Cell. 45:329‐42.
Kitajima, T.S., T. Sakuno, K. Ishiguro, S. Iemura, T. Natsume, S.A. Kawashima, and Y. Watanabe. 2006. Shugoshin collaborates with protein phosphatase 2A to protect cohesin. Nature. 441:46‐52.
Klebig, C., D. Korinth, and P. Meraldi. 2009. Bub1 regulates chromosome segregation in a kinetochore‐independent manner. J Cell Biol. 185:841‐58.
Kops, G.J., A.T. Saurin, and P. Meraldi. 2010. Finding the middle ground: how kinetochores power chromosome congression. Cell Mol Life Sci. 67:2145‐61.
Koshland, D.E., T.J. Mitchison, and M.W. Kirschner. 1988. Polewards chromosome movement driven by microtubule depolymerization in vitro. Nature. 331:499‐504.
Kruse, T., G. Zhang, M.S. Larsen, T. Lischetti, W. Streicher, T. Kragh Nielsen, S.P. Bjorn, and J. Nilsson. 2013. Direct binding between BubR1 and B56‐PP2A phosphatase complexes regulate mitotic progression. J Cell Sci. 126:1086‐92.
Kwon, Y.G., S.Y. Lee, Y. Choi, P. Greengard, and A.C. Nairn. 1997. Cell cycle‐dependent phosphorylation of mammalian protein phosphatase 1 by cdc2 kinase. Proc Natl Acad Sci U S A. 94:2168‐73.
Lampson, M.A., and I.M. Cheeseman. 2011. Sensing centromere tension: Aurora B and the regulation of kinetochore function. Trends Cell Biol. 21:133‐40.
Lampson, M.A., K. Renduchitala, A. Khodjakov, and T.M. Kapoor. 2004. Correcting improper chromosome‐spindle attachments during cell division. Nat Cell Biol. 6:232‐7.
Larkin, M.A., G. Blackshields, N.P. Brown, R. Chenna, P.A. McGettigan, H. McWilliam, F. Valentin, I.M. Wallace, A. Wilm, R. Lopez, J.D. Thompson, T.J. Gibson, and D.G. Higgins. 2007. Clustal W and Clustal X version 2.0. Bioinformatics. 23:2947‐8.
Levesque, A.A., and D.A. Compton. 2001. The chromokinesin Kid is necessary for chromosome arm orientation and oscillation, but not congression, on mitotic spindles. Journal of Cell Biology. 154:1135‐1146.

References
182
Li, M., H. Guo, and Z. Damuni. 1995. Purification and characterization of two potent heat‐stable protein inhibitors of protein phosphatase 2A from bovine kidney. Biochemistry. 34:1988‐96.
Li, X., A. Scuderi, A. Letsou, and D.M. Virshup. 2002. B56‐associated protein phosphatase 2A is required for survival and protects from apoptosis in Drosophila melanogaster. Mol Cell Biol. 22:3674‐84.
Liu, D., G. Vader, M.J. Vromans, M.A. Lampson, and S.M. Lens. 2009. Sensing chromosome bi‐orientation by spatial separation of aurora B kinase from kinetochore substrates. Science. 323:1350‐3.
Liu, D., M. Vleugel, C.B. Backer, T. Hori, T. Fukagawa, I.M. Cheeseman, and M.A. Lampson. 2010. Regulated targeting of protein phosphatase 1 to the outer kinetochore by KNL1 opposes Aurora B kinase. J Cell Biol. 188:809‐20.
Loncarek, J., O. Kisurina‐Evgenieva, T. Vinogradova, P. Hergert, S. La Terra, T.M. Kapoor, and A. Khodjakov. 2007. The centromere geometry essential for keeping mitosis error free is controlled by spindle forces. Nature. 450:745‐9.
MacCallum, D.E., A. Losada, R. Kobayashi, and T. Hirano. 2002. ISWI remodeling complexes in Xenopus egg extracts: identification as major chromosomal components that are regulated by INCENP‐aurora B. Mol Biol Cell. 13:25‐39.
Magidson, V., C.B. O'Connell, J. Loncarek, R. Paul, A. Mogilner, and A. Khodjakov. 2011. The spatial arrangement of chromosomes during prometaphase facilitates spindle assembly. Cell. 146:555‐67.
Magnusdottir, A., P. Stenmark, S. Flodin, T. Nyman, T. Kotenyova, S. Graslund, D. Ogg, and P. Nordlund. 2009. The structure of the PP2A regulatory subunit B56 gamma: the remaining piece of the PP2A jigsaw puzzle. Proteins. 74:212‐21.
Maldonado, M., and T.M. Kapoor. 2011. Constitutive Mad1 targeting to kinetochores uncouples checkpoint signalling from chromosome biorientation. Nat Cell Biol. 13:475‐82.
Malvezzi, F., G. Litos, A. Schleiffer, A. Heuck, K. Mechtler, T. Clausen, and S. Westermann. 2013. A structural basis for kinetochore recruitment of the Ndc80 complex via two distinct centromere receptors. EMBO J. 32:409‐23.
Maresca, T.J., and E.D. Salmon. 2009. Intrakinetochore stretch is associated with changes in kinetochore phosphorylation and spindle assembly checkpoint activity. J Cell Biol. 184:373‐81.
Margolis, R.L., and L. Wilson. 1978. Opposite end assembly and disassembly of microtubules at steady state in vitro. Cell. 13:1‐8.
Martin‐Lluesma, S., V.M. Stucke, and E.A. Nigg. 2002. Role of Hec1 in spindle checkpoint signaling and kinetochore recruitment of Mad1/Mad2. Science. 297:2267‐70.
Mattiuzzo, M., G. Vargiu, P. Totta, M. Fiore, C. Ciferri, A. Musacchio, and F. Degrassi. 2011. Abnormal kinetochore‐generated pulling forces from expressing a N‐terminally modified Hec1. PLoS One. 6:e16307.
Maure, J.F., S. Komoto, Y. Oku, A. Mino, S. Pasqualato, K. Natsume, L. Clayton, A. Musacchio, and T.U. Tanaka. 2011. The Ndc80 loop region facilitates formation of kinetochore attachment to the dynamic microtubule plus end. Curr Biol. 21:207‐13.
Mayer‐Jaekel, R.E., H. Ohkura, P. Ferrigno, N. Andjelkovic, K. Shiomi, T. Uemura, D.M. Glover, and B.A. Hemmings. 1994. Drosophila mutants in the 55 kDa regulatory subunit of protein phosphatase 2A show strongly reduced ability to dephosphorylate substrates of p34cdc2. J Cell Sci. 107 ( Pt 9):2609‐16.
McClelland, S.E., and A.D. McAinsh. 2009. Hydrodynamic analysis of human kinetochore complexes during mitosis. Methods Mol Biol. 545:81‐98.
McEwen, B.F., G.K. Chan, B. Zubrowski, M.S. Savoian, M.T. Sauer, and T.J. Yen. 2001. CENP‐E is essential for reliable bioriented spindle attachment, but chromosome alignment can be achieved via redundant mechanisms in mammalian cells. Mol Biol Cell. 12:2776‐89.

References
183
Miller, S.A., M.L. Johnson, and P.T. Stukenberg. 2008. Kinetochore attachments require an interaction between unstructured tails on microtubules and Ndc80(Hec1). Curr Biol. 18:1785‐91.
Miranda, J.J., P. De Wulf, P.K. Sorger, and S.C. Harrison. 2005. The yeast DASH complex forms closed rings on microtubules. Nat Struct Mol Biol. 12:138‐43.
Mitchison, T.J. 1989. Polewards microtubule flux in the mitotic spindle: evidence from photoactivation of fluorescence. J Cell Biol. 109:637‐52.
Mitchison, T.J., and E.D. Salmon. 1992. Poleward kinetochore fiber movement occurs during both metaphase and anaphase‐A in newt lung cell mitosis. J Cell Biol. 119:569‐82.
Mochida, S. 2013. Regulation of alpha‐endosulfine, an inhibitor of protein phosphatase 2A, by multisite phosphorylation. FEBS J.
Mochida, S., S. Ikeo, J. Gannon, and T. Hunt. 2009. Regulated activity of PP2A‐B55 delta is crucial for controlling entry into and exit from mitosis in Xenopus egg extracts. EMBO J. 28:2777‐85.
Mochida, S., S.L. Maslen, M. Skehel, and T. Hunt. 2010. Greatwall phosphorylates an inhibitor of protein phosphatase 2A that is essential for mitosis. Science. 330:1670‐3.
Mumby, M. 2004. Protein phosphatase 2A: A multifunctional regulator of cell signaling. In Protein Phosphatases. Vol. 5. J. Ariño and D. Alexander, editors. Springer Berlin Heidelberg. 45‐72.
Murata‐Hori, M., M. Tatsuka, and Y.L. Wang. 2002. Probing the dynamics and functions of aurora B kinase in living cells during mitosis and cytokinesis. Mol Biol Cell. 13:1099‐108.
Murnion, M.E., R.R. Adams, D.M. Callister, C.D. Allis, W.C. Earnshaw, and J.R. Swedlow. 2001. Chromatin‐associated protein phosphatase 1 regulates aurora‐B and histone H3 phosphorylation. J Biol Chem. 276:26656‐65.
Musacchio, A. 2011. Spindle assembly checkpoint: the third decade. Philos Trans R Soc Lond B Biol Sci. 366:3595‐604.
Musacchio, A., and E.D. Salmon. 2007. The spindle‐assembly checkpoint in space and time. Nat Rev Mol Cell Biol. 8:379‐93.
Nicklas, R.B., J.C. Waters, E.D. Salmon, and S.C. Ward. 2001. Checkpoint signals in grasshopper meiosis are sensitive to microtubule attachment, but tension is still essential. J Cell Sci. 114:4173‐83.
Nigg, E.A. 2001. Mitotic kinases as regulators of cell division and its checkpoints. Nat Rev Mol Cell Biol. 2:21‐32.
Nijenhuis, W., G. Vallardi, A. Teixeira, G.J. Kops, and A.T. Saurin. 2014. Negative feedback at kinetochores underlies a responsive spindle checkpoint signal. Nat Cell Biol.
Nijenhuis, W., E. von Castelmur, D. Littler, V. De Marco, E. Tromer, M. Vleugel, M.H. van Osch, B. Snel, A. Perrakis, and G.J. Kops. 2013. A TPR domain‐containing N‐terminal module of MPS1 is required for its kinetochore localization by Aurora B. J Cell Biol. 201:217‐31.
Nimmo, G.A., and P. Cohen. 1978. The regulation of glycogen metabolism. Phosphorylation of inhibitor‐1 from rabbit skeletal muscle, and its interaction with protein phosphatases‐III and ‐II. Eur J Biochem. 87:353‐65.
Nousiainen, M., H.H. Sillje, G. Sauer, E.A. Nigg, and R. Korner. 2006. Phosphoproteome analysis of the human mitotic spindle. Proc Natl Acad Sci U S A. 103:5391‐6.
Okumura, E., A. Morita, M. Wakai, S. Mochida, M. Hara, and T. Kishimoto. 2014. Cyclin B‐Cdk1 inhibits protein phosphatase PP2A‐B55 via a Greatwall kinase‐independent mechanism. J Cell Biol. 204:881‐9.
Peters, J.M., A. Tedeschi, and J. Schmitz. 2008. The cohesin complex and its roles in chromosome biology. Genes Dev. 22:3089‐114.
Petersen, B., T.N. Petersen, P. Andersen, M. Nielsen, and C. Lundegaard. 2009. A generic method for assignment of reliability scores applied to solvent accessibility predictions. BMC Struct Biol. 9:51.
References
184
Petrovic, A., S. Mosalaganti, J. Keller, M. Mattiuzzo, K. Overlack, V. Krenn, A. De Antoni, S. Wohlgemuth, V. Cecatiello, S. Pasqualato, S. Raunser, and A. Musacchio. 2014. Modular assembly of RWD domains on the Mis12 complex underlies outer kinetochore organization. Mol Cell. 53:591‐605.
Pettersen, E.F., T.D. Goddard, C.C. Huang, G.S. Couch, D.M. Greenblatt, E.C. Meng, and T.E. Ferrin. 2004. UCSF Chimera‐‐a visualization system for exploratory research and analysis. J Comput Chem. 25:1605‐12.
Porter, I.M., S.E. McClelland, G.A. Khoudoli, C.J. Hunter, J.S. Andersen, A.D. McAinsh, J.J. Blow, and J.R. Swedlow. 2007. Bod1, a novel kinetochore protein required for chromosome biorientation. J Cell Biol. 179:187‐97.
Porter, I.M., K. Schleicher, M. Porter, and J.R. Swedlow. 2013. Bod1 regulates protein phosphatase 2A at mitotic kinetochores. Nat Commun. 4:2677.
Posch, M., G.A. Khoudoli, S. Swift, E.M. King, J.G. Deluca, and J.R. Swedlow. 2010. Sds22 regulates aurora B activity and microtubule‐kinetochore interactions at mitosis. J Cell Biol. 191:61‐74.
Prigent, C., and S. Dimitrov. 2003. Phosphorylation of serine 10 in histone H3, what for? J Cell Sci. 116:3677‐85.
Qian, J., B. Lesage, M. Beullens, A. Van Eynde, and M. Bollen. 2011. PP1/Repo‐man dephosphorylates mitotic histone H3 at T3 and regulates chromosomal aurora B targeting. Curr Biol. 21:766‐73.
Queralt, E., C. Lehane, B. Novak, and F. Uhlmann. 2006. Downregulation of PP2A(Cdc55) phosphatase by separase initiates mitotic exit in budding yeast. Cell. 125:719‐32.
Rangone, H., E. Wegel, M.K. Gatt, E. Yeung, A. Flowers, J. Debski, M. Dadlez, V. Janssens, A.T. Carpenter, and D.M. Glover. 2011. Suppression of scant identifies Endos as a substrate of greatwall kinase and a negative regulator of protein phosphatase 2A in mitosis. PLoS Genet. 7:e1002225.
Riedel, C.G., V.L. Katis, Y. Katou, S. Mori, T. Itoh, W. Helmhart, M. Galova, M. Petronczki, J. Gregan, B. Cetin, I. Mudrak, E. Ogris, K. Mechtler, L. Pelletier, F. Buchholz, K. Shirahige, and K. Nasmyth. 2006. Protein phosphatase 2A protects centromeric sister chromatid cohesion during meiosis I. Nature. 441:53‐61.
Rieder, C.L. 2005. Kinetochore fiber formation in animal somatic cells: dueling mechanisms come to a draw. Chromosoma. 114:310‐8.
Rieder, C.L., and S.P. Alexander. 1990. Kinetochores are transported poleward along a single astral microtubule during chromosome attachment to the spindle in newt lung cells. J Cell Biol. 110:81‐95.
Rieder, C.L., R.W. Cole, A. Khodjakov, and G. Sluder. 1995. The checkpoint delaying anaphase in response to chromosome monoorientation is mediated by an inhibitory signal produced by unattached kinetochores. J Cell Biol. 130:941‐8.
Rieder, C.L., A. Schultz, R. Cole, and G. Sluder. 1994. Anaphase onset in vertebrate somatic cells is controlled by a checkpoint that monitors sister kinetochore attachment to the spindle. J Cell Biol. 127:1301‐10.
Ruediger, R., M. Hentz, J. Fait, M. Mumby, and G. Walter. 1994. Molecular model of the A subunit of protein phosphatase 2A: interaction with other subunits and tumor antigens. J Virol. 68:123‐9.
Ruediger, R., J.E. Van Wart Hood, M. Mumby, and G. Walter. 1991. Constant expression and activity of protein phosphatase 2A in synchronized cells. Mol Cell Biol. 11:4282‐5.
Salic, A., J.C. Waters, and T.J. Mitchison. 2004. Vertebrate shugoshin links sister centromere cohesion and kinetochore microtubule stability in mitosis. Cell. 118:567‐78.
Salimian, K.J., E.R. Ballister, E.M. Smoak, S. Wood, T. Panchenko, M.A. Lampson, and B.E. Black. 2011. Feedback control in sensing chromosome biorientation by the Aurora B kinase. Curr Biol. 21:1158‐65.
Santaguida, S., and A. Musacchio. 2009. The life and miracles of kinetochores. EMBO J. 28:2511‐31.

References
185
Santos, S.D., R. Wollman, T. Meyer, and J.E. Ferrell, Jr. 2012. Spatial positive feedback at the onset of mitosis. Cell. 149:1500‐13.
Saurin, A.T., M.S. van der Waal, R.H. Medema, S.M. Lens, and G.J. Kops. 2011. Aurora B potentiates Mps1 activation to ensure rapid checkpoint establishment at the onset of mitosis. Nat Commun. 2:316.
Schaar, B.T., G.K. Chan, P. Maddox, E.D. Salmon, and T.J. Yen. 1997. CENP‐E function at kinetochores is essential for chromosome alignment. J Cell Biol. 139:1373‐82.
Schmitz, M.H., M. Held, V. Janssens, J.R. Hutchins, O. Hudecz, E. Ivanova, J. Goris, L. Trinkle‐Mulcahy, A.I. Lamond, I. Poser, A.A. Hyman, K. Mechtler, J.M. Peters, and D.W. Gerlich. 2010. Live‐cell imaging RNAi screen identifies PP2A‐B55alpha and importin‐beta1 as key mitotic exit regulators in human cells. Nat Cell Biol. 12:886‐93.
Schulman, B.A., D.L. Lindstrom, and E. Harlow. 1998. Substrate recruitment to cyclin‐dependent kinase 2 by a multipurpose docking site on cyclin A. Proc Natl Acad Sci U S A. 95:10453‐8.
Sents, W., E. Ivanova, C. Lambrecht, D. Haesen, and V. Janssens. 2013. The biogenesis of active protein phosphatase 2A holoenzymes: a tightly regulated process creating phosphatase specificity. FEBS J. 280:644‐61.
Shepperd, L.A., J.C. Meadows, A.M. Sochaj, T.C. Lancaster, J. Zou, G.J. Buttrick, J. Rappsilber, K.G. Hardwick, and J.B. Millar. 2012. Phosphodependent recruitment of Bub1 and Bub3 to Spc7/KNL1 by Mph1 kinase maintains the spindle checkpoint. Curr Biol. 22:891‐9.
Shi, Y. 2009. Serine/threonine phosphatases: mechanism through structure. Cell. 139:468‐84. Silverstein, A.M., C.A. Barrow, A.J. Davis, and M.C. Mumby. 2002. Actions of PP2A on the MAP
kinase pathway and apoptosis are mediated by distinct regulatory subunits. Proc Natl Acad Sci U S A. 99:4221‐6.
Skoufias, D.A., S. DeBonis, Y. Saoudi, L. Lebeau, I. Crevel, R. Cross, R.H. Wade, D. Hackney, and F. Kozielski. 2006. S‐trityl‐L‐cysteine is a reversible, tight binding inhibitor of the human kinesin Eg5 that specifically blocks mitotic progression. J Biol Chem. 281:17559‐69.
Songyang, Z., S. Blechner, N. Hoagland, M.F. Hoekstra, H. Piwnica‐Worms, and L.C. Cantley. 1994. Use of an oriented peptide library to determine the optimal substrates of protein kinases. Curr Biol. 4:973‐82.
Stegmeier, F., and A. Amon. 2004. Closing mitosis: the functions of the Cdc14 phosphatase and its regulation. Annu Rev Genet. 38:203‐32.
Stevens, D., R. Gassmann, K. Oegema, and A. Desai. 2011. Uncoordinated loss of chromatid cohesion is a common outcome of extended metaphase arrest. PLoS One. 6:e22969.
Suijkerbuijk, S.J., M. Vleugel, A. Teixeira, and G.J. Kops. 2012. Integration of kinase and phosphatase activities by BUBR1 ensures formation of stable kinetochore‐microtubule attachments. Dev Cell. 23:745‐55.
Sullivan, M., and D.O. Morgan. 2007. Finishing mitosis, one step at a time. Nat Rev Mol Cell Biol. 8:894‐903.
Takeda, D.Y., J.A. Wohlschlegel, and A. Dutta. 2001. A bipartite substrate recognition motif for cyclin‐dependent kinases. J Biol Chem. 276:1993‐7.
Tanaka, K., N. Mukae, H. Dewar, M. van Breugel, E.K. James, A.R. Prescott, C. Antony, and T.U. Tanaka. 2005. Molecular mechanisms of kinetochore capture by spindle microtubules. Nature. 434:987‐94.
Tanaka, T.U. 2010. Kinetochore‐microtubule interactions: steps towards bi‐orientation. EMBO J. 29:4070‐82.
Tanaka, T.U., and A. Desai. 2008. Kinetochore‐microtubule interactions: the means to the end. Curr Opin Cell Biol. 20:53‐63.
Tanaka, T.U., N. Rachidi, C. Janke, G. Pereira, M. Galova, E. Schiebel, M.J. Stark, and K. Nasmyth. 2002. Evidence that the Ipl1‐Sli15 (Aurora kinase‐INCENP) complex promotes chromosome bi‐orientation by altering kinetochore‐spindle pole connections. Cell. 108:317‐29.

References
186
Tang, Z., H. Shu, W. Qi, N.A. Mahmood, M.C. Mumby, and H. Yu. 2006. PP2A is required for centromeric localization of Sgo1 and proper chromosome segregation. Dev Cell. 10:575‐85.
Taylor, S.S., E. Ha, and F. McKeon. 1998. The human homologue of Bub3 is required for kinetochore localization of Bub1 and a Mad3/Bub1‐related protein kinase. J Cell Biol. 142:1‐11.
Tipton, A.R., K. Wang, P. Oladimeji, S. Sufi, Z. Gu, and S.T. Liu. 2012. Identification of novel mitosis regulators through data mining with human centromere/kinetochore proteins as group queries. BMC Cell Biol. 13:15.
Tompa, P. 2002. Intrinsically unstructured proteins. Trends Biochem Sci. 27:527‐33. Tsukahara, T., Y. Tanno, and Y. Watanabe. 2010. Phosphorylation of the CPC by Cdk1 promotes
chromosome bi‐orientation. Nature. 467:719‐23. Umbreit, N.T., D.R. Gestaut, J.F. Tien, B.S. Vollmar, T. Gonen, C.L. Asbury, and T.N. Davis. 2012.
The Ndc80 kinetochore complex directly modulates microtubule dynamics. Proc Natl Acad Sci U S A. 109:16113‐8.
Vader, G., R.H. Medema, and S.M. Lens. 2006. The chromosomal passenger complex: guiding Aurora‐B through mitosis. J Cell Biol. 173:833‐7.
Vagnarelli, P., S. Ribeiro, L. Sennels, L. Sanchez‐Pulido, F. de Lima Alves, T. Verheyen, D.A. Kelly, C.P. Ponting, J. Rappsilber, and W.C. Earnshaw. 2011. Repo‐Man coordinates chromosomal reorganization with nuclear envelope reassembly during mitotic exit. Dev Cell. 21:328‐42.
van der Waal, M.S., A.T. Saurin, M.J. Vromans, M. Vleugel, C. Wurzenberger, D.W. Gerlich, R.H. Medema, G.J. Kops, and S.M. Lens. 2012. Mps1 promotes rapid centromere accumulation of Aurora B. EMBO Rep. 13:847‐54.
van Nuland, R., A.H. Smits, P. Pallaki, P.W. Jansen, M. Vermeulen, and H.T. Timmers. 2013. Quantitative dissection and stoichiometry determination of the human SET1/MLL histone methyltransferase complexes. Mol Cell Biol. 33:2067‐77.
VandenBeldt, K.J., R.M. Barnard, P.J. Hergert, X. Meng, H. Maiato, and B.F. McEwen. 2006. Kinetochores use a novel mechanism for coordinating the dynamics of individual microtubules. Curr Biol. 16:1217‐23.
Vanoosthuyse, V., and K.G. Hardwick. 2009. Overcoming inhibition in the spindle checkpoint. Genes Dev. 23:2799‐805.
Varma, D., S. Chandrasekaran, L.J. Sundin, K.T. Reidy, X. Wan, D.A. Chasse, K.R. Nevis, J.G. DeLuca, E.D. Salmon, and J.G. Cook. 2012. Recruitment of the human Cdt1 replication licensing protein by the loop domain of Hec1 is required for stable kinetochore‐microtubule attachment. Nat Cell Biol. 14:593‐603.
Vigneron, S., E. Brioudes, A. Burgess, J.C. Labbe, T. Lorca, and A. Castro. 2009. Greatwall maintains mitosis through regulation of PP2A. EMBO J. 28:2786‐93.
Wagner, S.A., P. Beli, B.T. Weinert, M.L. Nielsen, J. Cox, M. Mann, and C. Choudhary. 2011. A proteome‐wide, quantitative survey of in vivo ubiquitylation sites reveals widespread regulatory roles. Mol Cell Proteomics. 10:M111 013284.
Wan, X., R.P. O'Quinn, H.L. Pierce, A.P. Joglekar, W.E. Gall, J.G. DeLuca, C.W. Carroll, S.T. Liu, T.J. Yen, B.F. McEwen, P.T. Stukenberg, A. Desai, and E.D. Salmon. 2009. Protein architecture of the human kinetochore microtubule attachment site. Cell. 137:672‐84.
Wang, H.W., V.H. Ramey, S. Westermann, A.E. Leschziner, J.P. Welburn, Y. Nakajima, D.G. Drubin, G. Barnes, and E. Nogales. 2007. Architecture of the Dam1 kinetochore ring complex and implications for microtubule‐driven assembly and force‐coupling mechanisms. Nat Struct Mol Biol. 14:721‐6.
Wang, P., J.A. Galan, K. Normandin, E. Bonneil, G.R. Hickson, P.P. Roux, P. Thibault, and V. Archambault. 2013. Cell cycle regulation of Greatwall kinase nuclear localization facilitates mitotic progression. J Cell Biol. 202:277‐93.
Ward, J.J., L.J. McGuffin, K. Bryson, B.F. Buxton, and D.T. Jones. 2004a. The DISOPRED server for the prediction of protein disorder. Bioinformatics. 20:2138‐9.

References
187
Ward, J.J., J.S. Sodhi, L.J. McGuffin, B.F. Buxton, and D.T. Jones. 2004b. Prediction and functional analysis of native disorder in proteins from the three kingdoms of life. J Mol Biol. 337:635‐45.
Waterhouse, A.M., J.B. Procter, D.M. Martin, M. Clamp, and G.J. Barton. 2009. Jalview Version 2‐‐a multiple sequence alignment editor and analysis workbench. Bioinformatics. 25:1189‐91.
Weis, K. 2003. Regulating access to the genome: nucleocytoplasmic transport throughout the cell cycle. Cell. 112:441‐51.
Welburn, J.P., E.L. Grishchuk, C.B. Backer, E.M. Wilson‐Kubalek, J.R. Yates, 3rd, and I.M. Cheeseman. 2009. The human kinetochore Ska1 complex facilitates microtubule depolymerization‐coupled motility. Dev Cell. 16:374‐85.
Welburn, J.P., M. Vleugel, D. Liu, J.R. Yates, 3rd, M.A. Lampson, T. Fukagawa, and I.M. Cheeseman. 2010. Aurora B phosphorylates spatially distinct targets to differentially regulate the kinetochore‐microtubule interface. Mol Cell. 38:383‐92.
Westermann, S., D.G. Drubin, and G. Barnes. 2007. Structures and functions of yeast kinetochore complexes. Annu Rev Biochem. 76:563‐91.
Westermann, S., H.W. Wang, A. Avila‐Sakar, D.G. Drubin, E. Nogales, and G. Barnes. 2006. The Dam1 kinetochore ring complex moves processively on depolymerizing microtubule ends. Nature. 440:565‐9.
White, G.E., and H.P. Erickson. 2009. The coiled coils of cohesin are conserved in animals, but not in yeast. PLoS One. 4:e4674.
Williams, B.C., J.J. Filter, K.A. Blake‐Hodek, B.E. Wadzinski, N.J. Fuda, D. Shalloway, and M.L. Goldberg. 2014. Greatwall‐phosphorylated Endosulfine is both an inhibitor and a substrate of PP2A‐B55 heterotrimers. Elife. 3:e01695.
Williamson, M.P. 1994. The structure and function of proline‐rich regions in proteins. Biochem J. 297 ( Pt 2):249‐60.
Wong, Y.H., T.Y. Lee, H.K. Liang, C.M. Huang, T.Y. Wang, Y.H. Yang, C.H. Chu, H.D. Huang, M.T. Ko, and J.K. Hwang. 2007. KinasePhos 2.0: a web server for identifying protein kinase‐specific phosphorylation sites based on sequences and coupling patterns. Nucleic Acids Res. 35:W588‐94.
Wood, K.W., R. Sakowicz, L.S. Goldstein, and D.W. Cleveland. 1997. CENP‐E is a plus end‐directed kinetochore motor required for metaphase chromosome alignment. Cell. 91:357‐66.
Wu, J.Q., J.Y. Guo, W. Tang, C.S. Yang, C.D. Freel, C. Chen, A.C. Nairn, and S. Kornbluth. 2009. PP1‐mediated dephosphorylation of phosphoproteins at mitotic exit is controlled by inhibitor‐1 and PP1 phosphorylation. Nat Cell Biol. 11:644‐51.
Xu, Y., Y. Chen, P. Zhang, P.D. Jeffrey, and Y. Shi. 2008. Structure of a protein phosphatase 2A holoenzyme: insights into B55‐mediated Tau dephosphorylation. Mol Cell. 31:873‐85.
Yasui, Y., T. Urano, A. Kawajiri, K. Nagata, M. Tatsuka, H. Saya, K. Furukawa, T. Takahashi, I. Izawa, and M. Inagaki. 2004. Autophosphorylation of a newly identified site of Aurora‐B is indispensable for cytokinesis. J Biol Chem. 279:12997‐3003.
Zaytsev, A.V., L.J. Sundin, K.F. DeLuca, E.L. Grishchuk, and J.G. DeLuca. 2014. Accurate phosphoregulation of kinetochore‐microtubule affinity requires unconstrained molecular interactions. J Cell Biol. 206:45‐59.
Zhou, L., X. Tian, C. Zhu, F. Wang, and J.M. Higgins. 2014. Polo‐like kinase‐1 triggers histone phosphorylation by Haspin in mitosis. EMBO Rep. 15:273‐81.