Embed Size (px)
Citation preview

University of Dundee
A SPE-HPLC-MS/MS method for the simultaneous determination of prioritisedpharmaceuticals and EDCs with high environmental risk potential in freshwaterLi, Yuan; Taggart, Mark A.; McKenzie, Craig; Zhang, Zulin; Lu, Yonglong; Pap, Sabolc
Published in:Journal of Environmental Sciences
DOI:10.1016/j.jes.2020.07.013
Publication date:2021
Licence:CC BY-NC-ND
Document VersionPeer reviewed version
Link to publication in Discovery Research Portal
Citation for published version (APA):Li, Y., Taggart, M. A., McKenzie, C., Zhang, Z., Lu, Y., Pap, S., & Gibb, S. W. (2021). A SPE-HPLC-MS/MSmethod for the simultaneous determination of prioritised pharmaceuticals and EDCs with high environmental riskpotential in freshwater. Journal of Environmental Sciences, 100, 18-27. https://doi.org/10.1016/j.jes.2020.07.013
General rightsCopyright and moral rights for the publications made accessible in Discovery Research Portal are retained by the authors and/or othercopyright owners and it is a condition of accessing publications that users recognise and abide by the legal requirements associated withthese rights.
• Users may download and print one copy of any publication from Discovery Research Portal for the purpose of private study or research. • You may not further distribute the material or use it for any profit-making activity or commercial gain. • You may freely distribute the URL identifying the publication in the public portal.
Take down policyIf you believe that this document breaches copyright please contact us providing details, and we will remove access to the work immediatelyand investigate your claim.
Download date: 02. Apr. 2022

A SPE-HPLC-MS/MS method for the simultaneous determination of prioritised 1
pharmaceuticals and EDCs with high environmental risk potential in freshwater 2
3
Yuan Li1,3, Mark A. Taggart1, Craig McKenzie2, Zulin Zhang3, Yonglong Lu4, Sabolc 4
Pap1,5, Stuart Gibb1 5
6
1. Environmental Research Institute, North Highland College, University of the7
Highlands and Islands, Castle Street, Thurso, Caithness, Scotland, KW14 7JD,8
UK. E-mail: [email protected]
2. Forensic Drug Research Group, Centre for Anatomy and Human Identification,10
School of Science and Engineering, University of Dundee, Nethergate, Dundee,11
DD1 4HN, UK.12
3. Environmental and Biochemical Sciences Group, James Hutton Institute,13
Craigiebuckler, Aberdeen, AB15 8QH, UK.14
4. Research Centre for Eco-Environmental Sciences, Chinese Academy of Sciences,15
18 Shuangqing Road, Haidian District, Beijing, 100085, China.16
5. University of Novi Sad, Faculty of Technical Sciences, Department of17
Environmental Engineering and Occupational Safety and Health, University of18
Novi Sad, 21000 Novi Sad, Serbia.19
20
21
22
© 2020. This manuscript version is made available under the CC-BY-NC-ND 4.0 license http://creativecommons.org/licenses/by-nc-nd/4.0/

Abstract: This work describes the development, optimisation and validation of an 23
analytical method for the rapid determination of 17 priority pharmaceutical compounds 24
and endocrine disrupting chemicals (EDCs). Rather than studying compounds from the 25
same therapeutic class, the analyses aimed to determine target compounds with the 26
highest risk potential with regard to Scotland, providing a tool for further monitoring in 27
different water matrices. Prioritisation was based on a systematic environmental risk 28
assessment approach, using consumption data; wastewater treatment removal efficiency; 29
environmental occurrence; toxicological effects; and pre-existing regulatory indicators. 30
This process highlighted 17 compounds across various therapeutic classes, which were 31
then quantified, at environmentally relevant concentrations, by a single analytical 32
methodology. Analytical determination was achieved using a single-step solid phase 33
extraction (SPE) procedure followed by high-performance liquid chromatography with 34
tandem mass spectrometry (HPLC-MS/MS). The fully optimised method performed well 35
for the majority of target compounds, with recoveries >71% for 15 of 17 analytes. The 36
limits of quantification for most target analytes (14 of 17) ranged from 0.07 ng·L-1 to 1.88 37
ng·L-1 in river waters. The utility of this method was then demonstrated using real water 38
samples associated with a rural hospital/setting. Eight compounds were targeted and 39
detected, with the highest levels found for the analgesic, paracetamol (at up to 105910 40
ng·L-1 in the hospital discharge). This method offers a robust tool to monitor high priority 41
pharmaceutical and EDC levels in various aqueous sample matrices. 42
Keywords: 43
Pharmaceuticals 44
Prioritisation 45
risk assessment 46
trace level determination 47
water quality 48
49
*Corresponding author. E-mail: [email protected] (Yuan Li, Environmental 50
Research Institute, Castle Street, Thurso, Scotland, UK, KW14 7JD51
Introduction 52
The discovery and use of pharmaceuticals is one of society’s greatest advances, leading 53
to increased human lifespan and promoting improved health (Johansson, 1998). An 54
unintended consequence of the widespread use of human pharmaceuticals has however 55
been their inadvertent and now ubiquitous introduction into the aquatic environment. This 56
commonly occurs as a result of the excretion (in urine/faeces) of unmetabolised parent 57
compounds and the improper disposal of unused or expired medicinal products – both of 58
which pass into sewage networks (where these are present) and then remain in treated 59
wastewater discharges (Cahill et al., 2004; Charuaud et al., 2019; Fekadu et al., 2019; 60
Kallenborn et al., 2018). Numerous studies have now demonstrated the incomplete 61
removal of pharmaceuticals by sewage treatment systems, with as much as 80% of the 62
total load of any particular pharmaceutical entering the treatment network ultimately 63
being released into the receiving aquatic environment (Botero-Coy et al., 2018; Östman 64
et al., 2018; Ruan et al., 201; Yuan et al., 2014). 65
The potential effects of pharmaceutical pollution may include the promotion of multi-66
drug resistant bacterial strains and/or deleterious acute or chronic ecotoxicological 67
impacts on non-target organisms (Brodin et al., 2013; Hernando-Amado et al., 2019; 68
Kumar et al., 2019). For example, fluoxetine has been shown to cause reproductive delay 69
in leopard frogs (Foster et al., 2010; Fursdon et al., 2019; Hellström et al., 2016), while 70
ciprofloxacin can cause genotoxic effects in plankton and algae (Carusso et al., 2018) 71
(Dionísio et al., 2020). Further, certain pharmaceuticals are also endocrine disrupting 72
chemicals (EDCs), and have been shown to exert significant reproductive effects even at 73
trace environmental levels. For example, 17α-ethinylestradiol (a synthetic hormone 74
commonly used in birth control pills) has been extensively studied in fish and shown to 75
cause delays in embryonic development (Almeida et al., 2020; Huff et al., 2018), 76
vitellogenin induction (Zhang et al., 2019; Zhou et al., 2019), intersex development 77
(Jackson et al., 2019; Ujhegyi and Bókony, 2020) and thus reduced reproductive success 78
(Colman et al., 2009; Roy et al., 2018). 79
The ongoing discharge of pharmaceuticals and EDCs into the wider environment 80
potentially poses a risk to human health and as such there remains a need to evaluate their 81
presence, fate and behaviour in various environmental compartments. This requires the 82
development of robust, sensitive and accurate analytical methods for the simultaneous 83
extraction, detection and quantification of these chemicals at low, environmentally 84

relevant levels. The most common analytical approach to determine pharmaceuticals and 85
EDC levels in aqueous samples first involves a pre-concentration step (i.e., using solid 86
phase extraction; SPE), and then the use of liquid chromatography with mass 87
spectrometric detection (LC-MS) (Buchberger, 2011;.Hong et al., 2019; Peng et al., 2019). 88
However, many methods focus on compounds that are simply most commonly found (i.e., 89
in water), or, that belong to specific drug classes, i.e., antibiotics (Gurke et al., 2015a, 90
2015b; Rossmann et al., 2014; Scheurer et al., 2009). As such, there remains a need to 91
develop techniques specifically focussed on those substances thought to pose the greatest 92
risk potential within the aquatic environment. Such methods can be informed by existing 93
prioritisation systems such as those which have led to the creation of “Watch Lists” within 94
the EU Water Framework Directive (WFD, EU) and the UK’s Chemical Investigation 95
Program (CIP, UK) (European commission, 2015; UKWIR, 2015). Such regulatory 96
indicators act to highlight those compounds thought to be of most concern and/or 97
requiring more detailed research. 98
In this study, we describe the development of an SPE protocol combined with subsequent 99
HPLC-MS/MS (high performance liquid chromatography with tandem mass 100
spectrometry) analysis for the routine determination of selected pharmaceuticals and 101
EDCs (first prioritised based on their high environmental risk potential). The work 102
presented involves: (1) prioritisation of compounds across a range of therapeutic classes 103
– all with significant potential to pose risks to the aquatic environment; (2) development 104
of a rapid and sensitive method to measure these compounds at environmentally relevant 105
concentrations (ng·L-1); (3) an evaluation of possible matrix effects using different water 106
types; and (4) application of the methodology to real samples collected from a range of 107
sites as part of a hospital discharge focused monitoring study. 108
1. Methodologies and chemicals 109
1.1 Chemicals and reagents 110
All prioritised compound standards were of the highest purity available (>98%) and 111
supplied by Sigma-Aldrich (UK). Isotopically labelled internal standards were purchased 112
from Qmx. Both individual compound stock standards and isotopically labelled internal 113
standards (ILIS) were prepared in methanol, except for ciprofloxacin, which was 114
dissolved in methanol containing 1 µM NaOH to enhance solubility. Mixed compound 115
standards and calibration standards were prepared using appropriate dilutions of 116

individual stock solutions, in 50:50 v/v methanol:Milli-Q® water. All solutions were 117
stored in amber glass vials at −20℃ in the dark. 118
HPLC-grade acetonitrile, ethyl acetate, acetone and methanol were provided by VWR 119
Chemicals (Poole, England). Formic acid, acetic acid, ammonium acetate and ammonium 120
hydroxide were all analytical grade and supplied by Sigma–Aldrich. Oasis HLB 6cc (200 121
mg) and Oasis HLB Prime 6cc (200 mg) SPE cartridges were obtained from Waters 122
Corporation (Milford, MA, USA). 123
1.2 Instrumentation 124
The quantification of target analytes was performed using a HPLC-MS/MS system, 125
consisting of an Agilent 1100 HPLC with a CTC PAL auto-sampler coupled to a 126
Micromass Quattro Ultima Platinum mass spectrometer (Manchester, UK) equipped with 127
an electrospray ionisation source (ESI). Ions were acquired in multiple reaction 128
monitoring (MRM) mode. Precursor ions for each compound were determined by direct 129
infusion of individual compound standards whilst in full-scan mode (at m/z 50-1000). 130
During infusion the optimum cone voltage (CV) to achieve maximum signal response for 131
each ion was selected. Product ion scanning was then performed to obtain product ions, 132
and collision energy (CE) was optimised for each individual analyte. The highest intensity 133
characteristic precursor to product ion MRM transition was used for quantification 134
(quantifier), while a second was used for confirmation (qualifier). To sustain an adequate 135
signal response for every compound, analytes were measured within optimised time 136
windows. Data acquisition and analysis were carried out using MassLynx 4.1 software 137
(Micromass, Manchester, UK). 138
1.3 Sample preparation 139
SPE was employed for sample enrichment and clean-up, and several stationary phases 140
were tested under a range of elution conditions to optimise compound recovery (see Fig. 141
S1 for schematic of the process). All SPE experiments were conducted in triplicate, using 142
20 mL of Milli-Q water spiked to a starting concentration of 10 µg·L-1 for each analyte 143
(ultimately 500 µg·L-1 in final extract/following the SPE process, assuming 100% 144
recovery). For the final protocol, SPE cartridges were preconditioned with methanol (6 145
mL) and then Milli-Q water (6 mL), both at a flow rate of 1 mL·min-1. 20 mL spiked 146
water samples were passed through the cartridges at a flow rate of 1 mL·min-1 and then 147
cartridges were rinsed with Milli-Q water once (1 mL). Cartridges were then dried under 148
vacuum for >30 min to remove excess water. Then, the analytes were eluted with two 149
consecutive 6 mL elution’s using methanol (MEOH), or, acetone (ACE) and ethyl acetate 150
(EAC) at 50:50 v/v (depending on desired recoveries for certain compounds), at 1 151
mL·min-1. The eluates were then evaporated under a gentle stream of high purity nitrogen 152
at 40℃ until they were almost dry, then reconstituted with 0.4 mL of 50:50 v/v 153
MEOH:Milli-Q. Absolute recoveries were determined compared to quality-control (QC) 154
standards of 500 µg·L-1. 155
1.4 Method quantification 156
Compound selectivity was verified by measuring two MRM transitions per analyte. 157
Calibration linearity was studied by analysing standards in triplicate at nine 158
concentrations in the range from 2 to 500 µg·L-1. Satisfactory linearity using weighed 159
(1/x) least squares regression was assumed when the correlation coefficient (R2) was > 160
0.99. Method accuracy and precision (expressed as recovery and repeatability, using 161
relative standard deviation) were studied with recovery experiments (using Milli-Q water 162
spiked with analytes). Instrumental limits of detection (LOD) for each compound were 163
determined as the minimum detectable amount of analyte giving a signal-to-noise (S/N) 164
ratio of 3 (using the quantification transition). 165
For the investigation regarding matrix effects, a known amount of analyte (10 µg·L-1) and 166
ILIS (1 µg·L-1) was added to tap water and river water (filtered and unfiltered). Taking 167
into account an enrichment factor of 50 (whereby 20 mL of water sample was 168
reconstituted into 0.4 mL for analysis following SPE), quality-control (QC) standards of 169
500 µg·L-1 (for the analytes) and 50 µg·L-1 (for the ILIS) were then used for quantification. 170
1.5 Application to real samples 171
A range of water samples were collected from sites associated with/in the vicinity of a 172
rural UK hospital (in Caithness, Scotland). These were (1) the local potable untreated 173
surface water source, (2) the hospital water inflow, (3) the hospital combined wastewater 174
effluent discharge, (4) the combined local municipal WWTP influent and (5) the 175
combined effluent from the same municipal WWTP (for Wick town, Caithness). A sub-176
set of 8 target compounds were monitored over 4 weeks at these sites. Water samples (2 177
L) were collected in amber glass bottles and 1 L was filtered through 0.7 µm glass 178
microfiber filters (47 mm, MF300, Fisher Scientific, UK). Filtrates were spiked with 0.25 179
mL of ILIS mixed standard working solution (at 100 µg·L-1; equivalent to a 25 ng·L-1 180
concentration in 1 L of sample). SPE cartridges were preconditioned with MEOH and 181
Milli-Q water, then 1L water samples were passed through the cartridges at a flow rate of 182
1 mL·min-1. The SPE extract was eluted with 2×6 mL MEOH and reconstituted with 0.5 183
mL of 50:50 v/v MEOH:Milli-Q, leading to an enrichment factor of 2,000 and a final 184
concentration of 100 µg·L-1 ILIS in the analysed sample. Quantification was made using 185
external QC standards and calibration standards, with recovery assessed based on relative 186
responses. To ensure the precision and accuracy of the data required, all targeted 187
compounds in real water analysis have been assigned with their own ILIS standards to 188
correct possible quantification errors. All samples were stored at 4℃ in the dark until SPE 189
extraction, which was performed within 48 hr of sample collection. 190
2. Results and Discussion 191
2.1 Prioritisation of target compounds 192
As there are > 3,000 pharmaceuticals registered for use in the European Union (EU), it is 193
necessary to prioritise these whilst accounting for risk (Boxall et al., 2012). Many 194
prioritisation schemes have been proposed in recent years, commonly based on 195
consumption data, environmental occurrence and/or toxicological effects (Kötke et al., 196
2019; Li et al., 2020; Mansour et al., 2016; Pereira et al., 2016; Roos et al., 2012). 197
However, many field monitoring studies still focus on compounds that are most 198
commonly found in water (López-Serna et al., 2011; Rossmann et al., 2014) – many of 199
which may (or may not) be likely to elicit toxicological effects. 200
Here, a systematic prioritisation approach was first used to identify compounds that may 201
pose the greatest risk in the aquatic environment. For the evaluation of the environmental 202
risk of pharmaceuticals and EDCs, it is difficult to estimate if adverse effects (both acute 203
and chronic toxicity as well as other potentially more subtle biological and behavioural 204
effects) on non-target organisms occur at environmentally relevant concentrations. In this 205
study, a risk score was used as a primary prioritisation parameter to characterize 206
substances that pose potential ecological risks to the aqueous environment by comparing 207
their environmental occurrence with their known toxicologically relevant concentrations. 208
The risk score - hazard quotient (HQ) value was calculated as the ratio between measured 209
environmental concentration (MEC) and the predicted no effect concentration (PNEC; 210
i.e., the environmental level at which no adverse effect on relevant non-target 211
organisms/ecosystem function is expected) (Booth et al., 2020). When the HQ ≥ 1, a high 212
risk of adverse effects is expected (De Souza et al., 2009; Ccanccapa et al., 2016). 213
Although there are (as yet) no legally binding discharge limits set in the EU for 214
pharmaceuticals and EDCs, multiple compounds have been highlighted as ‘priority 215
substances’ for further investigation by EU and UK regulatory frameworks, i.e., through 216
‘Watch Lists’ created as part of the EU Water Framework Directive (WFD) and the 217
priority lists created through the UK’s Chemical Investigation Programme (CIP) 218
(European commission, 2018; UKWIR, 2019). These result in increased monitoring and 219
research and may ultimately lead to statutory discharge limits for certain compounds 220
(Brack et al., 2017; Miarov et al., 2020; Nijsingh et al., 2019; Petrie et al., 2015; 221
Voulvoulis et al., 2017). As such, these regulatory indicators have also been taken into 222
account here. 223
224
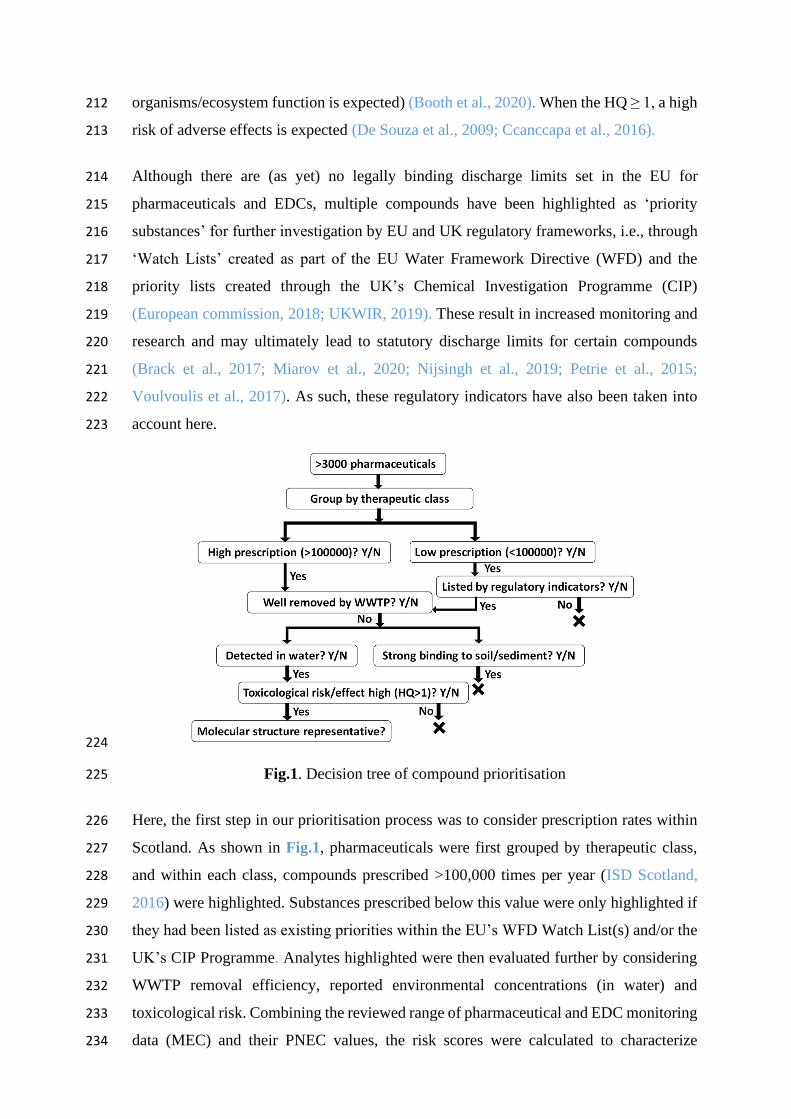
Fig.1. Decision tree of compound prioritisation 225
Here, the first step in our prioritisation process was to consider prescription rates within 226
Scotland. As shown in Fig.1, pharmaceuticals were first grouped by therapeutic class, 227
and within each class, compounds prescribed >100,000 times per year (ISD Scotland, 228
2016) were highlighted. Substances prescribed below this value were only highlighted if 229
they had been listed as existing priorities within the EU’s WFD Watch List(s) and/or the 230
UK’s CIP Programme. Analytes highlighted were then evaluated further by considering 231
WWTP removal efficiency, reported environmental concentrations (in water) and 232
toxicological risk. Combining the reviewed range of pharmaceutical and EDC monitoring 233
data (MEC) and their PNEC values, the risk scores were calculated to characterize 234

substances that have pose potential adverse effects to the aqueous environment at current 235
detection levels. All preliminarily prioritised substances were then considered in terms of 236
their physico-chemical properties – and where these had very similar molecular structures 237
(which may then result in similar environmental fate), a single substance was selected as 238
representative of a certain group. 239
The prioritisation selection criteria applied here were, in summary: a) prescription 240
statistics (ISD Scotland, 2016); b) legislative indicators, i.e., WFD ‘Watch List’ and/or 241
UK CIP listed; c) removal efficiency in WWTP; d) environmental occurrence in water; 242
e) biological toxic effects (informed by HQ calculated with PNEC and MEC); and f) 243
physico-chemical properties. Table 1 shows a summary regarding the prioritised list of 244
compounds targeted in this study (Li et al., 2019). 245

Table 1. Prioritised compounds in this study and the criteria and data used
Class Compounds Use statistics1
(items)
Legislative
indicator
WWTP
removal
efficiency (%)
Environmental
occurrence
(ng·L-1)
PNEC2
(ng·L-1)
HQ3
(>1?) Log Kow pKa
Antibiotic
(anti-infective) Trimethoprim 487128 No 0-50 10-28000 500 56 0.9 7.1
Antibiotic
(macrolide) Clarithromycin 268489 EUa,b+UK4 0-24 3.5-621 250 2.5 3.2 8.9
Antibiotic
(Fluoroquinolone) Ciprofloxacin 99441 EUb+UK 45-78 6–2500 100 25 0.3-0.7
5.9;
8.9
Antimicrobial Triclosan 10-1000 t/yr5 UK 45-89 3.9-434 50 8.68 4.2-4.8 7.9
Analgesic Paracetamol 5482031 No 0-90 160-65000 1000 65 0.5-0.9 9.5
NSAID6 Ibuprofen 915788 UK 72-90 44–990000 1650 600 4.0 4.9
NSAID Diclofenac 595709 EUa+UK 9-60 10–510000 3310 154 4.5 4.2
SSRI7 Fluoxetine 816346 UK 3-60 2.1-2000 110 18.2 1.2 10.1
Antiepileptic Carbamazepine 223601 UK 0-53 290–4596 420 10.9 2.47 13.9
Metabolite Carbamazepine-
10-11-epoxide N/A8 UK N/A 8-2100 N/A N/A 1.26 13.9
β-blocker Propranolol 557628 UK 34-80 108-1130 244 4.63 0.78 9.5
Blood lipid regulator Atorvastatin 1637000 UK 40-80 10-210 86 2.44 6.36 4.46
Anti-diabetic Metformin 1140162 UK 0-85 100-47000 13450 3.49 1.3 12.4
Steroid hormone
(Natural) Estrone (E1) N/A EUab+UK 0-61 1.8-60 6 10 2.45-3.43 10.5
Steroid hormone
(Natural)
17β-Estradiol
(E2) N/A EUab+UK 0-87 0.72-51 2 25.5 3.94-4.01 10.7
Steroid hormone
(Synthetic)
17α-ethynyl
estradiol (EE2) 298045 EUab+UK 0-85 0.36-4.3 0.35 12.3 3.67–4.15 10.4
Steroid hormone
(Natural) 9 Estriol (E3) N/A No 0-90 0.11-18 60 0.3 2.55-2.81 10.4
1. Prescription statistics for Scotland 2014-15 (ISD Scotland, 2016); 2. Predicted no-effect concentration (PNEC); 3. Hazard quotient (HQ) incorporating MEC with PNEC; 4. EU a.
Commission Implementing Decision 2015/495 (European commission, 2015); b. 2018/840 (European commission, 2018); UK, Chemical Investigation Programme (UKWIR, 2019); 5.
Triclosan usage in EU per year; 6. Nonsteroidal anti-inflammatory drugs (NSAIDs); 7. Selective serotonin reuptake inhibitors (SSRIs); 8. N/A, not applicable/available. 9. References
used for the prioritisation data are listed in Table. S1 (supporting information).
Ultimately, 17 compounds were identified as priority substances here, belonging to a wide 246
range of compound classes (11), i.e., antibiotics, antimicrobials, analgesics, non-steroidal anti-247
inflammatory drugs, psychoactive drugs, β-blockers, blood lipid regulators, antidiabetics, anti-248
ulcer agents and estrogens (as well as associated metabolites). Fifteen compounds were 249
associated with high potential risk (HQ>1) within the aqueous environment, including 250
ibuprofen, diclofenac, paracetamol, trimethoprim, E2, ciprofloxacin, fluoxetine, EE2, 251
carbamazepine, E1, propranolol, metformin, clarithromycin, atorvastatin and triclosan (in HQ 252
value order from high to low). This largely aligns with key legislative indicators (given these 253
were also one of our criteria), with the only pharmaceutical compounds in addition to CIP/WFD 254
indicators being trimethoprim and paracetamol. These two compounds have been highlighted 255
as their current occurrence levels outstrip its known toxicologically relevant concentrations 256
(PNEC) as shown in Table 1, the high HQ scores of trimethoprim (56) and paracetamol (65) 257
indicated that the adverse effects on non-target organisms may occur in the aquatic environment. 258
Trimethoprim is the second most commonly prescribed antibiotic in Scotland, and reports show 259
that up to 80% of this is excreted unmetabolised by the human body (De Liguoro et al., 2012; 260
Kasprzyk-Hordern et al., 2009). It has been found to be resistant to the biological wastewater 261
treatment (Lindberg et al. 2006), one of the most frequently occurring antibiotics found in UK 262
wastewaters, being detected in 65% of effluent samples with a maximum concentration of 1,300 263
ng·L-1 (Ashton, Hilton & Thomas 2004). Similarly, paracetamol is one of the most commonly 264
prescribed drugs globally, due to its antipyretic and analgesic properties. Even though the 265
reported removal efficiencies in WWTPs are relatively high (up to 90%), it is often found at 266
high levels in the aquatic environment (e.g., maximum 10,000 ng·L-1 in US natural waters and 267
at 65,000 ng·L-1 in the River Tyne, UK) (Kolpin et al., 2002; Roberts and Thomas, 2006). Such 268
high levels of paracetamol continuously introduced into the aquatic environment have been 269
found to cause negative ecological effects in various wild organisms (Nunes et al., 2014), the 270
high HQ scores of these compounds in this study reinforced the necessity of further 271
investigation of such pollutants. 272
UK CIP (UKWIR, 2019) identified a wide range of substances that may pose a significant risk 273
to the environment in the UK. Following the prioritisation procedure used here, fourteen 274
compounds on CIP were prioritised for investigation. At EU level, priority substances were first 275
introduced under the WFD Commission Implementing Decision (EU) 2015/495, which listed 276
ten watch list substances, and required this list to be updated every two years according to 277
Commission Implementing Decision (EU) 2008/105 (European commission, 2008). 278
Accordingly, diclofenac was originally prioritised in the first WFD watch list (European 279
commission, 2015) and monitored intensively. On the basis of sufficient high-quality 280
monitoring data available for this compound, diclofenac has since been removed from the watch 281
list in June 2018 (European commission, 2018). Meanwhile, the antibiotic ciprofloxacin has 282
been added due to its potential to drive antimicrobial resistance in the environment. Macrolide 283
antibiotics (clarithromycin, erythromycin and azithromycin) have been retained in the watch 284
list, while, clarithromycin, the highest prescribed macrolide, was chosen as the representative 285
compound, based on the fact that these substances have similar molecular structures and 286
physico-chemical properties. 287
As well as ‘parent’ pharmaceutical compounds, one of the 17 compounds listed here is a 288
metabolite. While most studies tend to focus on primary pharmaceuticals, there is now 289
increased recognition that excreted metabolites may also pose risks in the environment (Roberts 290
and Thomas, 2006). Carbamazepine, one of the most prominent anti-epileptic drugs with annual 291
worldwide usage of 1,014 tons and 223,601 prescription in Scotland has been targeted in this 292
study due to the poor removal in WWTP, high detection levels and potential risks in the 293
environment (ISD Scotland, 2016; Radjenović, Petrović & Barceló 2009). As well as ‘parent’ 294
pharmaceutical compound, the metabolite of carbamazepine, carbamazepine-10-11-epoxide 295
has been found to be biologically active and shows similar or higher toxicity relative to its 296
parent compound (Calisto and Esteves, 2009; Miao and Metcalfe, 2003). Therefore, 297
carbamazepine-10-11-epoxide has been included as a representative metabolite. Moreover, 298
there are several potent natural estrogens of concern (estrone (E1), 17 β-estradiol (E2) and 299
estriol (E3)), which are not dissimilar to the synthetic xenoestrogen - 17α-ethynyl estradiol 300
(EE2) which has been of concern for many years (Burkhardt-Holm, 2010; Czarny et al., 2019; 301
Qin et al., 2020; Yu et al., 2019). Three of these four EDCs (E1, E2 and EE2) have also been 302
highlighted by both the EU’s WFD Watch List schemes and the UK’s CIP system. As estriol 303
(E3) poses ecotoxicological effects similar to E1, E2, and EE2, this estrogen has also been 304
targeted for investigation here. 305
2.2 Detection method development 306
2.2.1 HPLC separation and MS/MS optimisation 307
To optimise compound separation and sensitivity, methanol and acetonitrile along with 308
different buffers (ammonium acetate, ammonium hydroxide, formic acid and acetic acid at 309
various concentrations) were tested as mobile phases. MS parameters were optimised to attain 310
maximum sensitivity and selectivity. Of the 17 substances, 10 showed a higher response using 311
the protonated [M+H]+ ions and positive ion (PI) mode while 7 were better using negative mode 312
(detecting the deprotonated [M−H]− ions). For both modes, several HPLC columns and various 313
operational parameters/gradient designs (i.e., different flow rates and slopes) were tested in 314
order to optimise peak separation, signal response and minimise run time. Good peak shape and 315
sensitivity were achieved in PI mode using a reverse-phase Waters XBridge BEH C18 column 316
(2.1 mm I.D. x 100 mm, 2.5 µm) with 0.1% formic acid as the aqueous phase and acetonitrile 317
at 45℃. For the 7 NI compounds, sufficient separation was obtained using 0.025% ammonium 318
hydroxide (in water) and acetonitrile and a Phenomenex Kinetex EVO C18 column (3.0 mm 319
I.D x 100 mm, 2.6 µm) at 25℃. The optimised gradient elution programs used are shown in 320
Table S2 (Supporting Information) alongside representative chromatograms for pure standard 321
mixtures monitored in both modes (Fig. S2). Optimised mass spectrometry parameters, 322
precursor and product ions, retention times (RT) and instrumental LODs in both PI and NI 323
modes are summarised in Table 2 and 3, respectively. 324
325
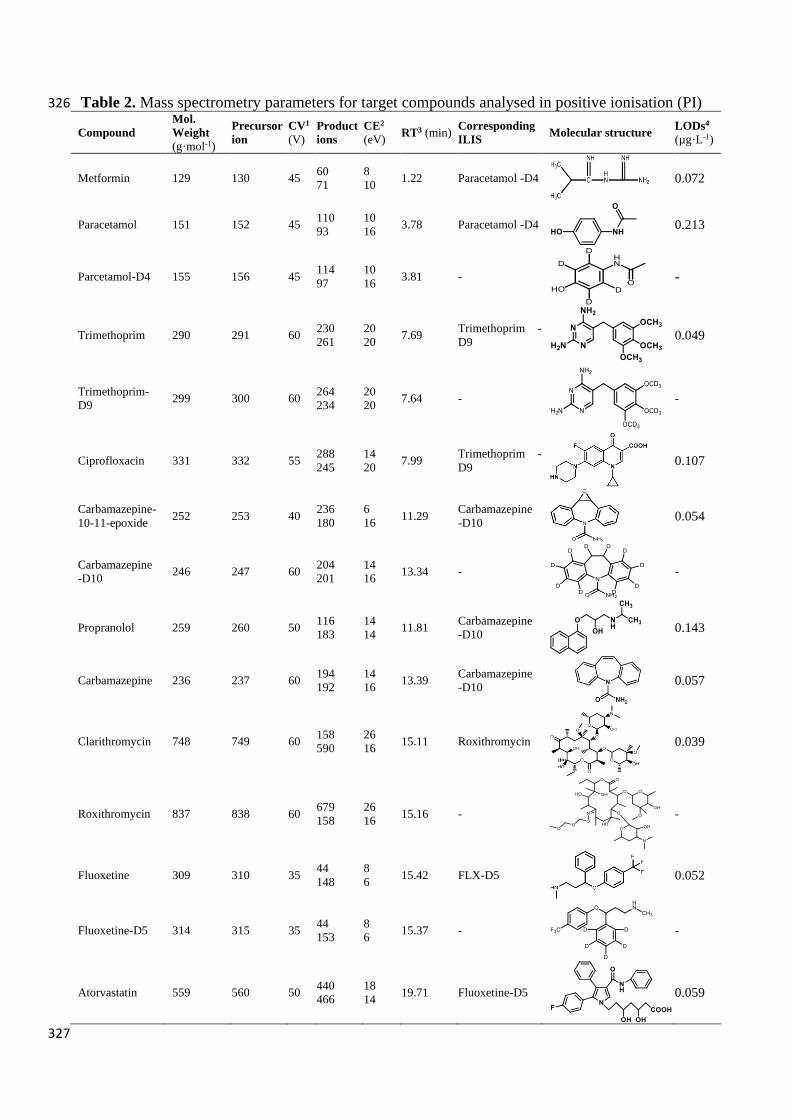
Table 2. Mass spectrometry parameters for target compounds analysed in positive ionisation (PI) 326
Compound
Mol.
Weight
(g·mol-1)
Precursor
ion
CV1
(V)
Product
ions
CE2
(eV) RT3 (min)
Corresponding
ILIS Molecular structure
LODs4
(µg·L-1)
Metformin 129 130 45 60
71
8
10 1.22 Paracetamol -D4
0.072
Paracetamol 151 152 45 110
93
10
16 3.78 Paracetamol -D4
0.213
Parcetamol-D4 155 156 45 114
97
10
16 3.81 -
-
Trimethoprim 290 291 60 230
261
20
20 7.69
Trimethoprim -
D9
0.049
Trimethoprim-
D9 299 300 60
264
234
20
20 7.64 -
-
Ciprofloxacin 331 332 55 288
245
14
20 7.99
Trimethoprim -
D9
0.107
Carbamazepine-
10-11-epoxide 252 253 40
236
180
6
16 11.29
Carbamazepine
-D10
0.054
Carbamazepine
-D10 246 247 60
204
201
14
16 13.34 -
-
Propranolol 259 260 50 116
183
14
14 11.81
Carbamazepine
-D10
0.143
Carbamazepine 236 237 60 194
192
14
16 13.39
Carbamazepine
-D10
0.057
Clarithromycin 748 749 60 158
590
26
16 15.11 Roxithromycin
0.039
Roxithromycin 837 838 60 679
158
26
16 15.16 -
-
Fluoxetine 309 310 35 44
148
8
6 15.42 FLX-D5
0.052
Fluoxetine-D5 314 315 35 44
153
8
6 15.37 -
-
Atorvastatin 559 560 50 440
466
18
14 19.71 Fluoxetine-D5
0.059
327

Table 3. Mass spectrometric parameters for target compounds analysed in negative ionisation (NI) 328
Compound
Mol.
Weight
(g·mol-1)
Precursor
ion
CV1
(V)
Product
ion
CE2
(eV)
RT3
(min)
Corresponding
ILIS Molecular structure
LODs4
(µg·L-1)
Ibuprofen 206 205 35 161 4 2.21 Diclofenac-D4
0.272
Diclofenac 296 294 35 250
214
8
18 4.14 Diclofenac-D4
0.428
Diclofenac-D4 300 298 35 254
217
8
18 4.15 -
-
Estriol 288 287 115 171
145
30
30 5.64 E1-D2
2.177
Estrone-D2 272 271 105 145
159
28
28 11.49 -
-
17β-Estradiol 272 271 125 145
183
28
30 10.46 E1-D2
0.771
17α-
ethynylestradiol 296 295 125
145
159
28
30 11.17 E1-D2
1.082
Estrone 270 269 125 145
159
28
28 11.44 E1-D2
0.376
Triclosan 289 289
287 35
35
35
4
4 13.72 Triclosan-D3
0.891
Triclosan-D3 292 290 35 35
37
4
4 13.72 -
-
1. CV - cone voltage; 2. CE - collision energy; 3. RT - retention time; 4. LOD - limit of detection. 329
All compounds had two abundant product ions, except ibuprofen, for which only one was 330
monitored due to poor fragmentation. Transitions identified here are in agreement with those 331
from other studies (Löffler and Ternes, 2003; Jelić et al., 2009; Ferrer et al., 2010; Golet et al., 332
2001). 333
2.2.2 Optimisation of Solid Phase Extraction (SPE) procedure 334

A number of SPE protocols (different cartridges, elution solvents, pH conditions, etc.) were 335
evaluated for pharmaceutical and EDC recovery. The choice of SPE stationary phase can play 336
a crucial role in enhancing recovery of analytes and SPE selection is frequently based on the 337
physico-chemical properties of target compounds. Here, the lipophilic-hydrophilic-balanced, 338
reverse-phase polymeric sorbent Oasis HLB cartridge was used to accommodate the wide range 339
of physico-chemical characteristics exhibited by the prioritised pharmaceuticals and EDCs 340
(with pKa ranging from 4.2 to 13.9, and Log Kow from 0.28-6.36). This cartridge has also been 341
shown to be less susceptible to matrix effects than other media (Gorga et al., 2013; Van De 342
Steene et al., 2006; Vazquez-Roig et al., 2010). Two HLB cartridges (Oasis HLB and Oasis 343
HLB Prime) were evaluated using methanol and acetone:ethyl acetate at 50:50 v/v as solvents. 344
To study any pH related recovery effects, different solution pH values were tested (i.e., no pH 345
adjustment or pH = 2). The average absolute recoveries (and relative standard deviations (SD)) 346
for each target compound are shown in Table 4. 347
To evaluate possible quantification errors introduced by analyte loss during sample processing 348
and fluctuations in instrument sensitivity, 1 µg·L-1 of ILIS was added as a surrogate to samples 349
prior to extraction (ILIS = 50 µg·L-1 post-SPE, assuming 100% recovery). The ILIS compounds 350
applied in this study were selected based on the following criteria: (i) a 2H-isotope or a 13C 351
labelled isotope compound - which shared the same (or very similar) physico-chemical 352
properties to the analyte; (ii) with a chromatographic retention time close to that of the analyte; 353
(iii) and similar SPE recovery and ionisation response to the analyte. Given the large number 354
of compounds targeted here it was unfeasible to correct each analyte with its own individual 355
ILIS, hence, ILIS analogues were used for certain groups (i.e., E1-D2 for the four estrogens) 356
on the basis of compound similarity, retention time and recovery. Relative recoveries 357
(calculated using the recovery data for the ILIS compounds), and the ILIS compounds used, are 358
presented in Table 5. 359
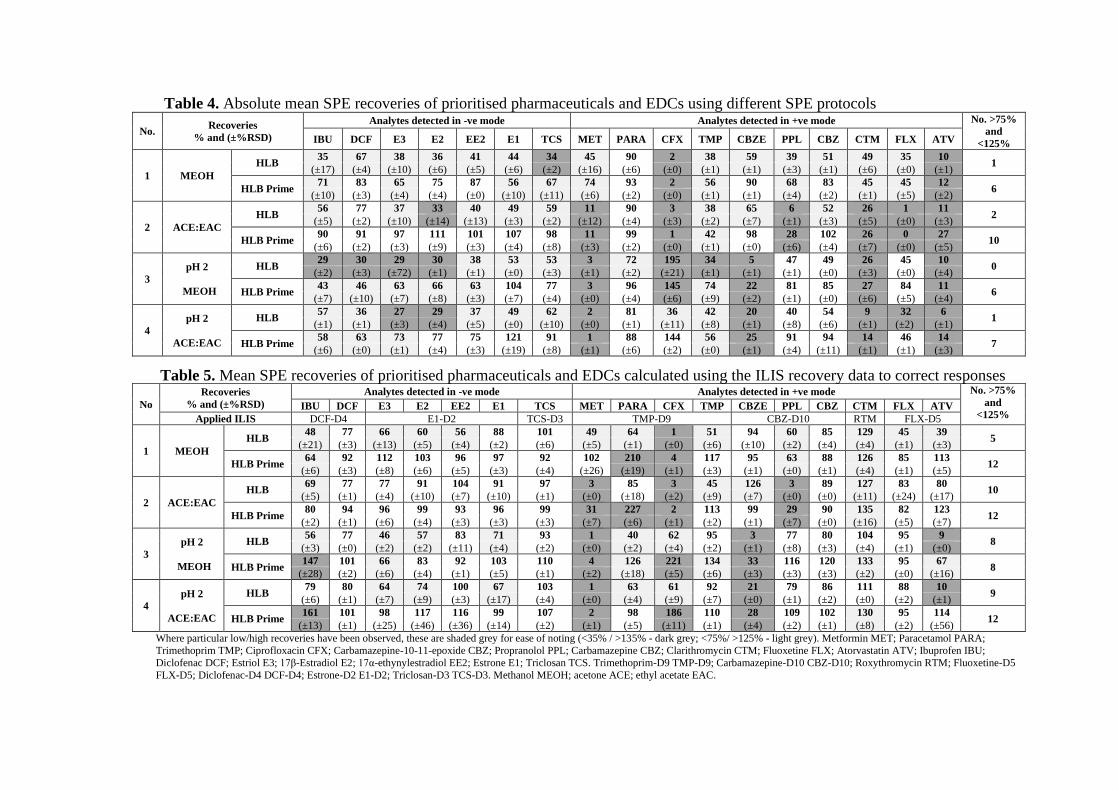
Table 4. Absolute mean SPE recoveries of prioritised pharmaceuticals and EDCs using different SPE protocols
No. Recoveries
% and (±%RSD)
Analytes detected in -ve mode Analytes detected in +ve mode No. >75%
and
<125% IBU DCF E3 E2 EE2 E1 TCS MET PARA CFX TMP CBZE PPL CBZ CTM FLX ATV
1 MEOH
HLB 35 67 38 36 41 44 34 45 90 2 38 59 39 51 49 35 10
1 (±17) (±4) (±10) (±6) (±5) (±6) (±2) (±16) (±6) (±0) (±1) (±1) (±3) (±1) (±6) (±0) (±1)
HLB Prime 71 83 65 75 87 56 67 74 93 2 56 90 68 83 45 45 12
6 (±10) (±3) (±4) (±4) (±0) (±10) (±11) (±6) (±2) (±0) (±1) (±1) (±4) (±2) (±1) (±5) (±2)
2 ACE:EAC
HLB 56 77 37 33 40 49 59 11 90 3 38 65 6 52 26 1 11
2 (±5) (±2) (±10) (±14) (±13) (±3) (±2) (±12) (±4) (±3) (±2) (±7) (±1) (±3) (±5) (±0) (±3)
HLB Prime 90 91 97 111 101 107 98 11 99 1 42 98 28 102 26 0 27
10 (±6) (±2) (±3) (±9) (±3) (±4) (±8) (±3) (±2) (±0) (±1) (±0) (±6) (±4) (±7) (±0) (±5)
3
pH 2
MEOH
HLB 29 30 29 30 38 53 53 3 72 195 34 5 47 49 26 45 10
0 (±2) (±3) (±72) (±1) (±1) (±0) (±3) (±1) (±2) (±21) (±1) (±1) (±1) (±0) (±3) (±0) (±4)
HLB Prime 43 46 63 66 63 104 77 3 96 145 74 22 81 85 27 84 11
6 (±7) (±10) (±7) (±8) (±3) (±7) (±4) (±0) (±4) (±6) (±9) (±2) (±1) (±0) (±6) (±5) (±4)
4
pH 2
ACE:EAC
HLB 57 36 27 29 37 49 62 2 81 36 42 20 40 54 9 32 6
1 (±1) (±1) (±3) (±4) (±5) (±0) (±10) (±0) (±1) (±11) (±8) (±1) (±8) (±6) (±1) (±2) (±1)
HLB Prime 58 63 73 77 75 121 91 1 88 144 56 25 91 94 14 46 14
7 (±6) (±0) (±1) (±4) (±3) (±19) (±8) (±1) (±6) (±2) (±0) (±1) (±4) (±11) (±1) (±1) (±3)
Table 5. Mean SPE recoveries of prioritised pharmaceuticals and EDCs calculated using the ILIS recovery data to correct responses
No
Recoveries
% and (±%RSD)
Analytes detected in -ve mode Analytes detected in +ve mode No. >75%
and
<125% IBU DCF E3 E2 EE2 E1 TCS MET PARA CFX TMP CBZE PPL CBZ CTM FLX ATV
Applied ILIS DCF-D4 E1-D2 TCS-D3 TMP-D9 CBZ-D10 RTM FLX-D5
1 MEOH
HLB 48 77 66 60 56 88 101 49 64 1 51 94 60 85 129 45 39
5 (±21) (±3) (±13) (±5) (±4) (±2) (±6) (±5) (±1) (±0) (±6) (±10) (±2) (±4) (±4) (±1) (±3)
HLB Prime 64 92 112 103 96 97 92 102 210 4 117 95 63 88 126 85 113
12 (±6) (±3) (±8) (±6) (±5) (±3) (±4) (±26) (±19) (±1) (±3) (±1) (±0) (±1) (±4) (±1) (±5)
2 ACE:EAC
HLB 69 77 77 91 104 91 97 3 85 3 45 126 3 89 127 83 80
10 (±5) (±1) (±4) (±10) (±7) (±10) (±1) (±0) (±18) (±2) (±9) (±7) (±0) (±0) (±11) (±24) (±17)
HLB Prime 80 94 96 99 93 96 99 31 227 2 113 99 29 90 135 82 123
12 (±2) (±1) (±6) (±4) (±3) (±3) (±3) (±7) (±6) (±1) (±2) (±1) (±7) (±0) (±16) (±5) (±7)
3
pH 2
MEOH
HLB 56 77 46 57 83 71 93 1 40 62 95 3 77 80 104 95 9
8 (±3) (±0) (±2) (±2) (±11) (±4) (±2) (±0) (±2) (±4) (±2) (±1) (±8) (±3) (±4) (±1) (±0)
HLB Prime 147 101 66 83 92 103 110 4 126 221 134 33 116 120 133 95 67
8 (±28) (±2) (±6) (±4) (±1) (±5) (±1) (±2) (±18) (±5) (±6) (±3) (±3) (±3) (±2) (±0) (±16)
4
pH 2
ACE:EAC
HLB 79 80 64 74 100 67 103 1 63 61 92 21 79 86 111 88 10
9 (±6) (±1) (±7) (±9) (±3) (±17) (±4) (±0) (±4) (±9) (±7) (±0) (±1) (±2) (±0) (±2) (±1)
HLB Prime 161 101 98 117 116 99 107 2 98 186 110 28 109 102 130 95 114
12 (±13) (±1) (±25) (±46) (±36) (±14) (±2) (±1) (±5) (±11) (±1) (±4) (±2) (±1) (±8) (±2) (±56)
Where particular low/high recoveries have been observed, these are shaded grey for ease of noting (<35% / >135% - dark grey; <75%/ >125% - light grey). Metformin MET; Paracetamol PARA;
Trimethoprim TMP; Ciprofloxacin CFX; Carbamazepine-10-11-epoxide CBZ; Propranolol PPL; Carbamazepine CBZ; Clarithromycin CTM; Fluoxetine FLX; Atorvastatin ATV; Ibuprofen IBU;
Diclofenac DCF; Estriol E3; 17β-Estradiol E2; 17α-ethynylestradiol EE2; Estrone E1; Triclosan TCS. Trimethoprim-D9 TMP-D9; Carbamazepine-D10 CBZ-D10; Roxythromycin RTM; Fluoxetine-D5
FLX-D5; Diclofenac-D4 DCF-D4; Estrone-D2 E1-D2; Triclosan-D3 TCS-D3. Methanol MEOH; acetone ACE; ethyl acetate EAC.

Recoveries obtained varied markedly between compounds and SPE conditions used (as 360
may be expected given the physico-chemical diversity of the prioritised compounds). It 361
is evident that data corrected for ILIS recovery (Table 5) provided better results for most 362
target compounds (as compared to absolute recovery data; Table 4). This was most 363
evident for the analytes clarithromycin, fluoxetine, trimethoprim and the estrogens. This 364
indicated that analyte losses occurred throughout the analytical procedure and that ILIS 365
correction helped ensure better quantification (compensating for any losses). 366
In terms of SPE, higher recovery values were achieved using the Oasis HLB Prime 367
cartridges under the tested conditions. The Oasis HLB Prime provided satisfactory 368
recoveries (>75% and <125%) for more analytes (Table 4 and 5), which may be attributed 369
to the strong hydrophobic interaction between analytes and retention sorbent of HLB 370
prime cartridges (Beltran et al., 2010). For the extremely polar compound metformin, 371
which was previously reported as not recoverable using an SPE procedure, satisfactory 372
recoveries (102% ± 26%) were observed in condition 1 (Cahill et al., 2004). 373
A dependency on SPE pH was observed for certain substances. For instance, the ILIS 374
corrected recovery for propranolol and trimethoprim was enhanced at pH 2, while for 375
carbamazepine-epoxide and metformin it was reduced. Notably, ciprofloxacin was 376
overestimated when using acidified conditions, which may be attributed to pH-induced 377
molecular conformation changes. Ciprofloxacin has a zwitterionic nature and exists in 378
cation, zwitterion, and/or anion species under different pH conditions (see Fig. S3). We 379
postulate that the acidification of the SPE process to pH 2 charged the cationic amine 380
moiety positively, resulting in an increased number of ions entering the MS. The 381
dependency of substances with a zwitterionic nature on pH has also been reported by 382
other authors (Rossmann et al., 2014). 383
Regarding the optimal SPE conditions, 12 of 17 compounds were recovered at >75% and 384
<125% in tested conditions 1, 2 and 4 based on the ILIS correction (Table 5). Using 385
absolute recoveries (Table 4), condition 2 was found to be most effective (>75% recovery 386
for 10 compounds with HLB Prime). The ILIS corrected values (Table 5) were generally 387
in agreement with the absolute recoveries (Table 4), with the enhancement of recoveries 388
(Table 5) in conditions 1 and 4 suggesting the ILIS correction appropriately ensured 389
successful quantification by compensating for losses of compounds. 390
The ‘optimal’ SPE condition that provided the best recovery for each compound varied 391
due to the variety of physico-chemical properties represented in the priority list. For most 392
target compounds, condition 2 was found the most effective based on the high values of 393
both absolute and ILIS corrected recoveries, therefore was selected for further study. 394
Meanwhile, low recovery was noted for certain substances (metformin, ciprofloxacin and 395
propranolol <35%) in this condition. To reach a compromise, that gives an acceptable 396
recovery for most compounds with the least loss, condition 1, retaining 16 out of 17 397
compounds, with the exception of ciprofloxacin, was also selected for further 398
investigation. 399
Although quantitation with ILIS assured sufficient recoveries, under certain 400
circumstances, the use of ILIS can be a complicated approach for analytes from a diverse 401
range of chemical classes (Gracia-Lor et al., 2011). Quantitation with ILIS needs to be 402
well characterised when it does not ensure an adequate correction. For instance, 403
undesirable enhancement of ILIS recovery was observed for paracetamol while 404
satisfactory absolute values (72-99%) were obtained under tested conditions. Similar 405
inadequate ILIS recovery was found for ibuprofen. This was attributed to the mass loss 406
of its ILIS analogue not coinciding with the analyte under the same conditions so that the 407
ILIS calculation exaggerated the process efficiency, making the ILIS correction 408
unnecessary (Marín et al., 2009; Renew and Huang, 2004). Therefore, the absolute 409
recoveries of paracetamol and ibuprofen have been adopted for evaluation. 410
2.3 Matrix effect study 411
The influence of environmental matrix on accurate quantitative LC-MS/MS analysis has 412
been widely discussed (Frigerio et al., 2019; Fu et al., 2018; Huang et al., 2020). Non-413
target components present in samples can have a significant impact on analyte recovery 414
and ionisation which may deplete or enhance MS signal intensity and thus affect accurate 415
quantification (Irlam et al., 2019; Meerpoel et al., 2018; Tran et al., 2020). The assessment 416
of matrix effect has been conducted in a number of approaches during the development 417
of quantitative analytical method, the most commonly used one may refer to the “absolute” 418
matrix effect, comparing the signal response of a standard present in an extract containing 419
co-eluting components to the response of a standard in a “not contaminated” neat solvent 420
(Matuszewski et al., 2003). Although the presence of this absolute matrix effect (which 421
is often obtained by a comparison of the response of analyte spiked after extraction to the 422
response in the neat solution) is of some concern, the more important parameter in the 423
evaluation of an analytical method is the demonstration of the absence of a “relative” 424
matrix effect in different sources of environmental water matrices. To validate the overall 425
performance of the analytical method in this study, the effects of water matrices were 426
evaluated by comparing recoveries of analytes in different water matrices (spiked before 427
extraction). The suppression or enhancement of recoveries in Table 6 demonstrated the 428
overall effects of matrices (undetected coeluting components reacting with primary ions 429
formed in the HPLC−MS/MS interface) and recoveries (competition with matrix 430
components, which can largely be compensated by isotope-labeled internal standards) 431
from different water sources. All values presented were corrected using ILIS, except for 432
paracetamol and ibuprofen, where absolute recoveries are given (due to inadequate ILIS 433
correction as discussed above). 434
With a number of exceptions, fairly limited effects of matrix were observed for many of 435
these pharmaceuticals and EDCs, which is consistent with previous findings (Cha et al., 436
2006; Tong et al., 2009; Tuc Dinh et al., 2011). Some effects were noted for 6 compounds, 437
with >50% recovery suppression for two (atorvastatin and ibuprofen), ~20-40% 438
suppression for three (metformin, paracetamol and clarithromycin) and <20% 439
enhancement for trimethoprim. This was likely due to ion suppression in the MS ESI 440
source due to matrix components (Gómez et al., 2006; Kasprzyk-Hordern et al., 2008). 441
The lack of ILIS correction for paracetamol and ibuprofen likely made these effects more 442
obvious and meant effective correction could not be achieved. For atorvastatin, its high 443
Log Kow (6.36) suggests the compound would tend to bind with organic matter present in 444
water – and the SPE process presumably failed to overcome this. For several analytes 445
(e.g., E3, paracetamol, trimethoprim, clarithromycin), a filtered river water matrix 446
resulted in lower recovery versus unfiltered, indicating no filtration is beneficial to remain 447
pharmaceutical compounds when recovering them from environmental water matrices. 448
This may be attributed to the pharmaceutical analytes sorbed onto suspended particular 449
matter present in the river samples, which was then removed during membrane filtration, 450
causing the concentrations of freely dissolved analytes to be lower for further detection. 451
The co-extracting components in river water matrix may also mask the analyte peaks by 452
raising the chromatogram baseline, leading to underestimated integrated peak areas. 453
Meanwhile, the co-extracting matrix may reduce ionisation efficiency of the analytes by 454
taking up some of the limited number of excess charged sites on the surfaces of 455

electrosprayed droplets (Gómez et al., 2006).This is consistent with other studies and may 456
suggest that analysing samples without filtration may sometimes be more appropriate 457
(depending on the analytes concerned and aims of the study) (Berset and Ochsenbein, 458
2012; Tran et al., 2013). For filtered river samples, methanol elution provided better 459
recoveries for most target compounds in this study. In terms of limits of quantification 460
(LOQs) calculated when processing 1 L of water - these were in the range of 0.07 ng·L-1 461
to 9.07 ng·L-1 (as shown in Table 6). For 14 out of 17 compounds (excluding ibuprofen, 462
ciprofloxacin and E3), method LOQs were 0.07 ng·L-1 to 1.88 ng·L-1 , which is somewhat 463
lower than those previously reported in other studies (Choi et al., 2007; Ding et al., 2009; 464
Tuc Dinh et al., 2011). 465
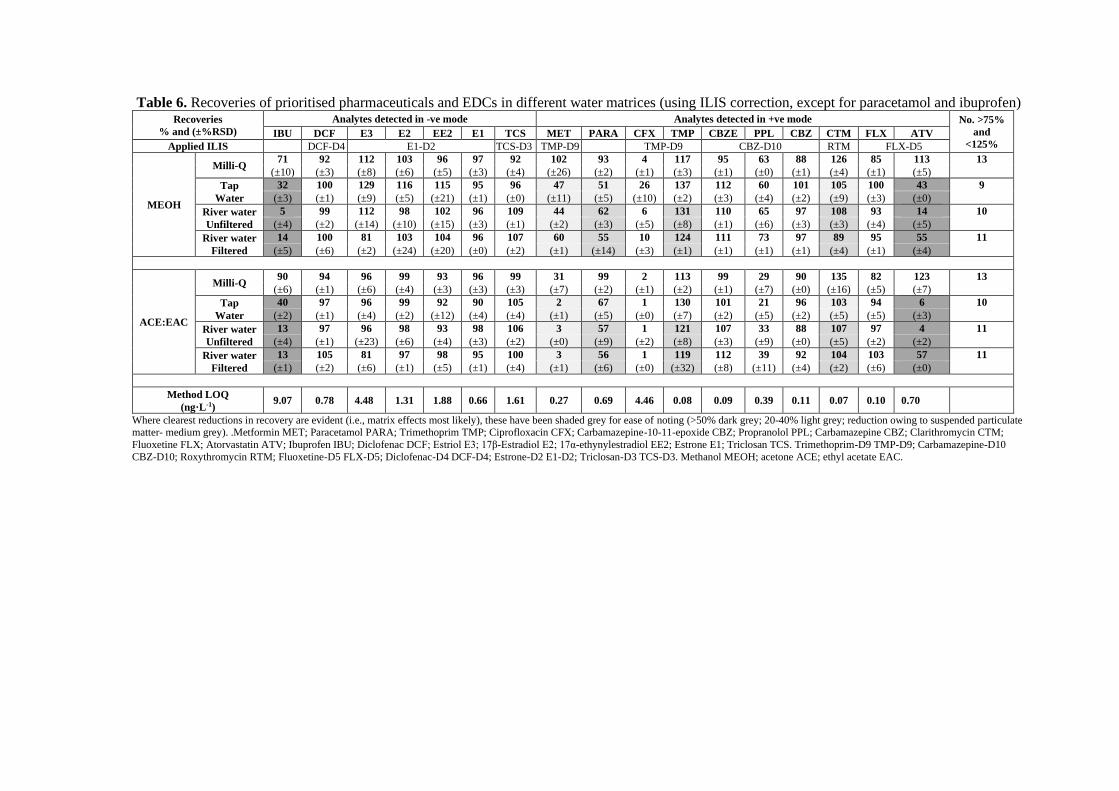
Table 6. Recoveries of prioritised pharmaceuticals and EDCs in different water matrices (using ILIS correction, except for paracetamol and ibuprofen) Recoveries
% and (±%RSD)
Analytes detected in -ve mode Analytes detected in +ve mode No. >75%
and
<125% IBU DCF E3 E2 EE2 E1 TCS MET PARA CFX TMP CBZE PPL CBZ CTM FLX ATV
Applied ILIS DCF-D4 E1-D2 TCS-D3 TMP-D9 TMP-D9 CBZ-D10 RTM FLX-D5
MEOH
Milli-Q 71 92 112 103 96 97 92 102 93 4 117 95 63 88 126 85 113 13
(±10) (±3) (±8) (±6) (±5) (±3) (±4) (±26) (±2) (±1) (±3) (±1) (±0) (±1) (±4) (±1) (±5)
Tap
Water
32 100 129 116 115 95 96 47 51 26 137 112 60 101 105 100 43 9
(±3) (±1) (±9) (±5) (±21) (±1) (±0) (±11) (±5) (±10) (±2) (±3) (±4) (±2) (±9) (±3) (±0)
River water
Unfiltered
5 99 112 98 102 96 109 44 62 6 131 110 65 97 108 93 14 10
(±4) (±2) (±14) (±10) (±15) (±3) (±1) (±2) (±3) (±5) (±8) (±1) (±6) (±3) (±3) (±4) (±5)
River water
Filtered
14 100 81 103 104 96 107 60 55 10 124 111 73 97 89 95 55 11
(±5) (±6) (±2) (±24) (±20) (±0) (±2) (±1) (±14) (±3) (±1) (±1) (±1) (±1) (±4) (±1) (±4)
ACE:EAC
Milli-Q 90 94 96 99 93 96 99 31 99 2 113 99 29 90 135 82 123 13
(±6) (±1) (±6) (±4) (±3) (±3) (±3) (±7) (±2) (±1) (±2) (±1) (±7) (±0) (±16) (±5) (±7)
Tap
Water
40 97 96 99 92 90 105 2 67 1 130 101 21 96 103 94 6 10
(±2) (±1) (±4) (±2) (±12) (±4) (±4) (±1) (±5) (±0) (±7) (±2) (±5) (±2) (±5) (±5) (±3)
River water
Unfiltered
13 97 96 98 93 98 106 3 57 1 121 107 33 88 107 97 4 11
(±4) (±1) (±23) (±6) (±4) (±3) (±2) (±0) (±9) (±2) (±8) (±3) (±9) (±0) (±5) (±2) (±2)
River water
Filtered
13 105 81 97 98 95 100 3 56 1 119 112 39 92 104 103 57 11
(±1) (±2) (±6) (±1) (±5) (±1) (±4) (±1) (±6) (±0) (±32) (±8) (±11) (±4) (±2) (±6) (±0)
Method LOQ
(ng·L-1) 9.07 0.78 4.48 1.31 1.88 0.66 1.61 0.27 0.69 4.46 0.08 0.09 0.39 0.11 0.07 0.10 0.70
Where clearest reductions in recovery are evident (i.e., matrix effects most likely), these have been shaded grey for ease of noting (>50% dark grey; 20-40% light grey; reduction owing to suspended particulate matter- medium grey). .Metformin MET; Paracetamol PARA; Trimethoprim TMP; Ciprofloxacin CFX; Carbamazepine-10-11-epoxide CBZ; Propranolol PPL; Carbamazepine CBZ; Clarithromycin CTM;
Fluoxetine FLX; Atorvastatin ATV; Ibuprofen IBU; Diclofenac DCF; Estriol E3; 17β-Estradiol E2; 17α-ethynylestradiol EE2; Estrone E1; Triclosan TCS. Trimethoprim-D9 TMP-D9; Carbamazepine-D10
CBZ-D10; Roxythromycin RTM; Fluoxetine-D5 FLX-D5; Diclofenac-D4 DCF-D4; Estrone-D2 E1-D2; Triclosan-D3 TCS-D3. Methanol MEOH; acetone ACE; ethyl acetate EAC.
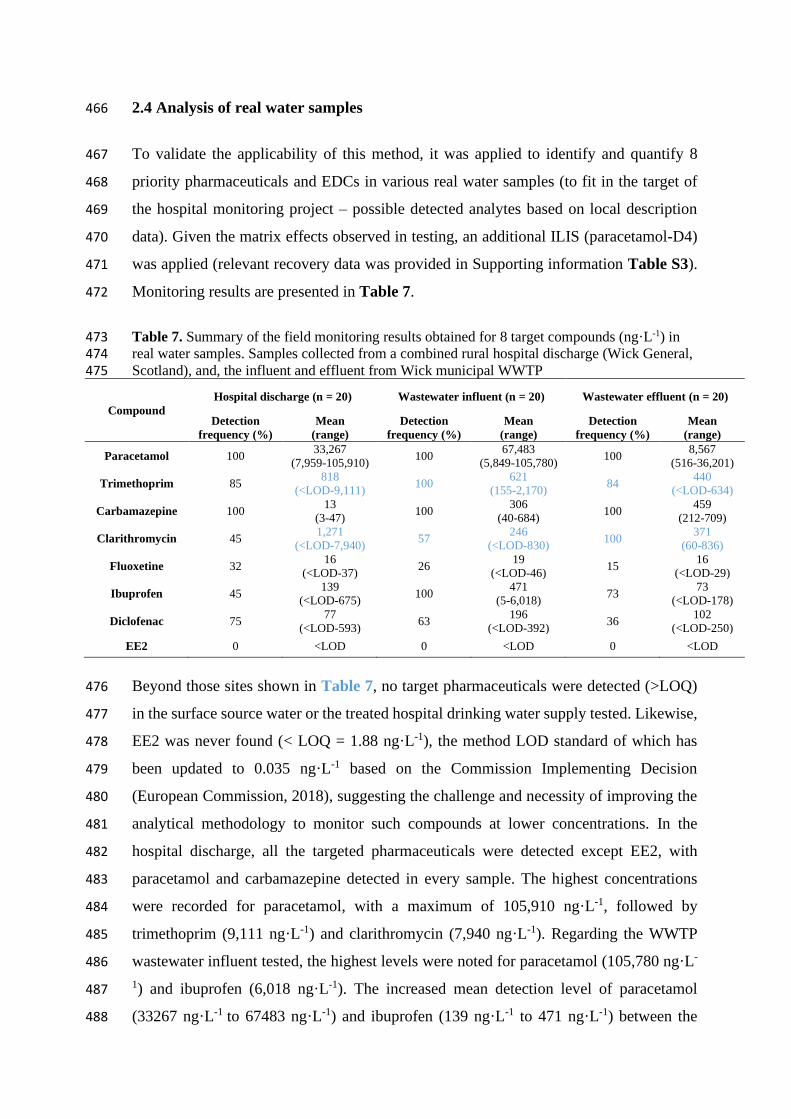
2.4 Analysis of real water samples 466
To validate the applicability of this method, it was applied to identify and quantify 8 467
priority pharmaceuticals and EDCs in various real water samples (to fit in the target of 468
the hospital monitoring project – possible detected analytes based on local description 469
data). Given the matrix effects observed in testing, an additional ILIS (paracetamol-D4) 470
was applied (relevant recovery data was provided in Supporting information Table S3). 471
Monitoring results are presented in Table 7. 472
Table 7. Summary of the field monitoring results obtained for 8 target compounds (ng·L-1) in 473 real water samples. Samples collected from a combined rural hospital discharge (Wick General, 474 Scotland), and, the influent and effluent from Wick municipal WWTP 475
Compound
Hospital discharge (n = 20) Wastewater influent (n = 20) Wastewater effluent (n = 20)
Detection
frequency (%)
Mean
(range)
Detection
frequency (%)
Mean
(range)
Detection
frequency (%)
Mean
(range)
Paracetamol 100 33,267
(7,959-105,910) 100
67,483
(5,849-105,780) 100
8,567
(516-36,201)
Trimethoprim 85 818
(<LOD-9,111) 100
621
(155-2,170) 84
440
(<LOD-634)
Carbamazepine 100 13
(3-47) 100
306
(40-684) 100
459
(212-709)
Clarithromycin 45 1,271
(<LOD-7,940) 57
246
(<LOD-830) 100
371
(60-836)
Fluoxetine 32 16
(<LOD-37) 26
19
(<LOD-46) 15
16
(<LOD-29)
Ibuprofen 45 139
(<LOD-675) 100
471
(5-6,018) 73
73
(<LOD-178)
Diclofenac 75 77
(<LOD-593) 63
196
(<LOD-392) 36
102
(<LOD-250)
EE2 0 <LOD 0 <LOD 0 <LOD
Beyond those sites shown in Table 7, no target pharmaceuticals were detected (>LOQ) 476
in the surface source water or the treated hospital drinking water supply tested. Likewise, 477
EE2 was never found (< LOQ = 1.88 ng·L-1), the method LOD standard of which has 478
been updated to 0.035 ng·L-1 based on the Commission Implementing Decision 479
(European Commission, 2018), suggesting the challenge and necessity of improving the 480
analytical methodology to monitor such compounds at lower concentrations. In the 481
hospital discharge, all the targeted pharmaceuticals were detected except EE2, with 482
paracetamol and carbamazepine detected in every sample. The highest concentrations 483
were recorded for paracetamol, with a maximum of 105,910 ng·L-1, followed by 484
trimethoprim (9,111 ng·L-1) and clarithromycin (7,940 ng·L-1). Regarding the WWTP 485
wastewater influent tested, the highest levels were noted for paracetamol (105,780 ng·L-486
1) and ibuprofen (6,018 ng·L-1). The increased mean detection level of paracetamol 487
(33267 ng·L-1 to 67483 ng·L-1) and ibuprofen (139 ng·L-1 to 471 ng·L-1) between the 488

hospital discharge and wastewater influent indicated the possible presence of other 489
inputting sources of such pharmaceuticals besides the hospital discharge. Lower levels of 490
trimethoprim (818 ng·L-1 to 621 ng·L-1) and clarithromycin (1271 ng·L-1 to 246 ng·L-1) 491
in WWTP influent versus the hospital discharge may be attributed to the degradation 492
and/or dilution in the aquatic environment between those two sites (Gracia-Lor et al., 493
2011). Higher levels of carbamazepine and ibuprofen may reflect greater (human) intakes 494
in the community versus the hospital. In terms of the final WWTP effluent, all the 495
previously detected pharmaceuticals remained detectable – albeit at reduced levels in 496
some cases. Five of the pharmaceuticals monitored were at lower mean levels in discharge 497
versus influent – but, two (carbamazepine, clarithromycin) were more elevated in 498
discharge water. These results reinforce the need to apply multiclass pharmaceutical 499
monitoring methods in order to gain a better understanding of the fate/behaviour of these 500
compounds at the catchment scale. Likewise, they highlight the ongoing need to create 501
WWTP processes that can efficiently eliminate these bioactive pollutants of concern. 502
Compared to levels reported in other European countries for these target compounds 503
(Gros et al., 2010; Gros et al., 2007; López-Serna et al., 2011), the surface water data 504
collected here demonstrated how relatively ‘pristine’ source water can be in the Scottish 505
Highlands (in a remote inland lake, currently entirely ‘free’ of these contaminants). 506
However, the WWTP concentrations seen here (both influent and effluent) were highly 507
comparable with data from Germany, Belgium and the US (Cahill et al., 2004; Gurke et 508
al., 2015a; Rossmann et al., 2014; Vergeynst et al., 2015). This clearly highlights the 509
impact that pharmaceutical consumption is and can have – even in remote and otherwise 510
pristine hydrological systems. 511
3. Conclusion 512
A sensitive analytical methodology for the simultaneous determination of up to 17 513
priority pharmaceuticals and EDCs was developed and validated using an optimised SPE 514
protocol and HPLC-ESI-MS/MS detection. A risk-based approach was applied to identify 515
compounds that may pose the greatest environmental concern. The diversity of analytes 516
selected meant that some compromises were needed when applying this analysis (i.e., 517
accepting reduced recovery for certain compounds). The optimal SPE protocol used Oasis 518
HLB Prime cartridges with no pH adjustment and elution with methanol. The use of ILIS 519
improved the reliability of the entire process and helped evaluation of matrix effects. 520
Application of the method to ‘real’ environmental samples from a rural catchment in 521
Scotland, illustrated the occurrence of pharmaceuticals in various wastewater matrices. 522
The highest concentrations found were for paracetamol, with a mean level of 67,483 ng·L-523
1 in municipal WWTP influent. The successful application of this method to real water 524
matrices validated its applicability within routine monitoring studies regarding these 525
priority pharmaceutical and EDC contaminants. 526
Appendix A. Supplementary material 527
Supplementary data associated with this article is present in the Supporting 528
Information. 529
Acknowledgements 530
This work has been undertaken as part of The Hydro Nation Scholars Programme 531
and supported by The Centre of Expertise for Waters (CREW) on behalf of the Scottish 532
Government. The authors would like to thank the support from the Scottish Government’s 533
Rural and Environment Science and Analytical Service Division (RESAS). 534
535
536
537
List of tables 538
539
List of figures 540
541
References
Almeida, Â., Silva, M.G., Soares, A.M., Freitas, R., 2020. Concentrations levels and
effects of 17alpha-Ethinylestradiol in freshwater and marine waters and bivalves: A
review. Environ. Res. 109316
Ashton, D., Hilton, M. & Thomas, K.V., 2004. Investigating the environmental transport
of human pharmaceuticals to streams in the United Kingdom. Sci. Total Environ.
333 (1–3), 167-184
Beltran, A., Borrull, F., Marcé, R.M., Cormack, P.A.G., 2010. Molecularly-imprinted
polymers: useful sorbents for selective extractions. Trends Analyt Chem. 11, 1363-
1375
Berset, J.-., Ochsenbein, N., 2012. Stability considerations of aspartame in the direct
analysis of artificial sweeteners in water samples using high-performance liquid
chromatography-tandem mass spectrometry (HPLC-MS/MS). Chemosphere. 5,
563-569
Booth, A., Aga, D.S., Wester, A.L., 2020. Retrospective analysis of the global antibiotic
residues that exceed the predicted no effect concentration for antimicrobial
resistance in various environmental matrices. Environ. Int. 105796
Boxall, A.B., Rudd, M.A., Brooks, B.W., Caldwell, D.J., Choi, K., Hickmann, S., et al.,
2012. Pharmaceuticals and personal care products in the environment: what are the
big questions?. Environ. Health Perspect. 9, 1221
Botero-Coy, A.M., Martínez-Pachón, D., Boix, C., Rincón, R.J., Castillo, N., Arias-Marín,
L., et al., 2018. An investigation into the occurrence and removal of pharmaceuticals
in Colombian wastewater. Sci. Total Environ. 842-853
Brack, W., Dulio, V., Ågerstrand, M., Allan, I., Altenburger, R., Brinkmann, M., et al.,
2017. Towards the review of the European Union Water Framework Directive:
Recommendations for more efficient assessment and management of chemical
contamination in European surface water resources. Sci. Total Environ. 720-737
Brodin, T., Fick, J., Jonsson, M., Klaminder, J., 2013. Dilute concentrations of a
psychiatric drug alter behavior of fish from natural populations. Science. 6121, 814-
815
Buchberger, W.W., 2011. Current approaches to trace analysis of pharmaceuticals and
personal care products in the environment. J. Chromatogr. A. 4, 603-618

Burkhardt-Holm, P., 2010. Endocrine disruptors and water quality: A state-of-the-art
review. Int. J. Water Resour. Dev. 3, 477-493
Cahill, J.D., Furlong, E.T., Burkhardt, M.R., Kolpin, D., Anderson, L.G., 2004.
Determination of pharmaceutical compounds in surface- and ground-water samples
by solid-phase extraction and high-performance liquid chromatography–
electrospray ionization mass spectrometry. J. Chromatogr. A. 1, 171-180
Calisto, V., Esteves, V.I., 2009. Psychiatric pharmaceuticals in the environment.
Chemosphere. 10, 1257-1274
Carusso, S., Juárez, A., Moretton, J., Magdaleno, A., 2018. Effects of three veterinary
antibiotics and their binary mixtures on two green alga species. Chemosphere. 821-
827
Ccanccapa, A., Masiá, A., Navarro-Ortega, A., Picó, Y., Barceló, D., 2016. Pesticides in
the Ebro River basin: occurrence and risk assessment. Environ. Pollut. 414-424
Cha, J.M., Yang, S., Carlson, K.H., 2006. Trace determination of β-lactam antibiotics in
surface water and urban wastewater using liquid chromatography combined with
electrospray tandem mass spectrometry. J. Chromatogr. A. 1, 46-57
Charuaud, L., Jardé, E., Jaffrézic, A., Thomas, M., Le Bot, B., 2019. Veterinary
pharmaceutical residues from natural water to tap water: Sales, occurrence and fate.
J. Hazard. Mater. 169-186
Choi, K., Kim, S., Kim, C., Kim, S., 2007. Determination of antibiotic compounds in
water by on-line SPE-LC/MSD. Chemosphere. 6, 977-984
Colman, J.R., Baldwin, D., Johnson, L.L., Scholz, N.L., 2009. Effects of the synthetic
estrogen, 17α-ethinylestradiol, on aggression and courtship behavior in male
zebrafish (Danio rerio). Aquat. Toxicol. 4, 346-354
Czarny, K., Szczukocki, D., Krawczyk, B., Skrzypek, S., Zieliński, M., Gadzała-
Kopciuch, R., 2019. Toxic effects of single animal hormones and their mixtures on
the growth of Chlorella vulgaris and Scenedesmus armatus. Chemosphere. 93-102
De Liguoro, M., Di Leva, V., Dalla Bona, M., Merlanti, R., Caporale, G., Radaelli, G.,
2012. Sublethal effects of trimethoprim on four freshwater organisms. Ecotoxicol.
Environ. Saf. 114-121
De Souza, Sandra Maria Lopes, de Vasconcelos, E.C., Dziedzic, M., de Oliveira, Cíntia
Mara Ribas, 2009. Environmental risk assessment of antibiotics: an intensive care
unit analysis. Chemosphere. 7, 962-967
Ding, J., Ren, N., Chen, L., Ding, L., 2009. On-line coupling of solid-phase extraction to
liquid chromatography–tandem mass spectrometry for the determination of
macrolide antibiotics in environmental water. Analytica Chimica Acta. 2, 215-221
Dionísio, R., Daniel, D., de Alkimin, G.D., Nunes, B., 2020. Multi-parametric analysis
of ciprofloxacin toxicity at ecologically relevant levels: Short-and long-term effects
on Daphnia magna. Environ. Toxicol. Pharmacol. 103295
European commission, 2018,Commission Implementing Decision (EU) 2018/840 of 5
June 2018 establishing a watch list of substances for Union-wide monitoring in the
field of water policy pursuant to Directive 2008/105/EC of the European Parliament
and of the Council and repealing Commission Implementing Decision (EU)
2015/495, OJ L141, 7.6.2018, pp.9-12
European Commission, 2015, European Commission Implementation Decision
2015/495/EC establishing a watch list of substances for Union-wide monitoring in
the field of water policy pursuant to Directive 2008/105/EC of the European
Parliament and of the Council, Off. J. Eur. Union, 58 (2015), pp. 40-42
European Commission. 2008, Directive 2008/105/EC of the European Parliament and of
the Council on environmental quality standards in the field of water policy,
amending and subsequently repealing Council Directives 82/176/EEC, 83/513/EEC,
84/156/EEC, 84/491/EEC, 86/280/EEC and amending Directive 2000/60/EC of the
European Parliament and of the Council,Off. J. Eur. Union, 51 (2008), pp. 84-97
Fekadu, S., Alemayehu, E., Dewil, R., Van der Bruggen, B., 2019. Pharmaceuticals in
freshwater aquatic environments: A comparison of the African and European
challenge. Sci. Total Environ. 324-337
Ferrer, I., Zweigenbaum, J.A., Thurman, E.M., 2010. Analysis of 70 Environmental
Protection Agency priority pharmaceuticals in water by EPA Method 1694. Journal
of Chromatography A. 36, 5674-5686
Foster, H.R., Burton, G.A., Basu, N., Werner, E.E., 2010. Chronic exposure to fluoxetine
(Prozac) causes developmental delays in Rana pipiens larvae. Environ. Toxicol.
Chem. 12, 2845-2850
Frigerio, G., Mercadante, R., Polledri, E., Missineo, P., Campo, L., Fustinoni, S., 2019.
An LC-MS/MS method to profile urinary mercapturic acids, metabolites of
electrophilic intermediates of occupational and environmental toxicants. J.
Chromatogr. A. 66-76

Fu, L., Lu, X., Tan, J., Wang, L., Chen, J., 2018. Multiresidue determination and potential
risks of emerging pesticides in aquatic products from Northeast China by LC-
MS/MS. J. Environ. Sci. 116-125
Fursdon, J.B., Martin, J.M., Bertram, M.G., Lehtonen, T.K., Wong, B.B., 2019. The
pharmaceutical pollutant fluoxetine alters reproductive behaviour in a fish
independent of predation risk. Sci. Total Environ. 642-652
Golet, E.M., Alder, A.C., Hartmann, A., Ternes, T.A., Giger, W., 2001. Trace
determination of fluoroquinolone antibacterial agents in urban wastewater by solid-
phase extraction and liquid chromatography with fluorescence detection. Anal.
Chem. 15, 3632-3638
Gómez, M.J., Petrovic, M., Fernández-Alba, A.R., Barceló, D., 2006. Determination of
pharmaceuticals of various therapeutic classes by solid-phase extraction and liquid
chromatography-tandem mass spectrometry analysis in hospital effluent
wastewaters. J. Chromatogr. A. 2, 224-233
Gorga, M., Petrovic, M., Barceló, D., 2013. Multi-residue analytical method for the
determination of endocrine disruptors and related compounds in river and waste
water using dual column liquid chromatography switching system coupled to mass
spectrometry. J. Chromatogr. A. 57-66
Gracia-Lor, E., Sancho, J.V., Hernández, F., 2011. Multi-class determination of around
50 pharmaceuticals, including 26 antibiotics, in environmental and wastewater
samples by ultra-high performance liquid chromatography–tandem mass
spectrometry. J. Chromatogr. A. 16, 2264-2275
Gros, M., Petrović, M., Ginebreda, A., Barceló, D., 2010. Removal of pharmaceuticals
during wastewater treatment and environmental risk assessment using hazard
indexes. Environ. Int. 1, 15-26
Gros, M., Petrovic, M., Barceló, D., 2007. Wastewater treatment plants as a pathway for
aquatic contamination by pharmaceuticals in the ebro river basin (northeast Spain).
Environ. Toxicol. Chem. 8, 1553-1562
Gros, M., Petrovic, M., Ginebreda, A., Barceló, D., 2010. Removal of pharmaceuticals
during wastewater treatment and environmental risk assessment using hazard
indexes. Environ. Int. 1, 15-26
Gurke, R., Rößler, M., Marx, C., Diamond, S., Schubert, S., Oertel, R., Fauler, J., 2015a.
Occurrence and removal of frequently prescribed pharmaceuticals and

corresponding metabolites in wastewater of a sewage treatment plant. Sci. Total
Environ. 762-770
Gurke, R., Rossmann, J., Schubert, S., Sandmann, T., Rößler, M., Oertel, R., Fauler, J.,
2015b. Development of a SPE-HPLC–MS/MS method for the determination of most
prescribed pharmaceuticals and related metabolites in urban sewage samples. J.
Chromatogr. B. 23-30
Hellström, G., Klaminder, J., Finn, F., Persson, L., Alanärä, A., Jonsson, M., Fick, J.,
Brodin, T., 2016. GABAergic anxiolytic drug in water increases migration
behaviour in salmon. Nature communications. 13460
Hernando-Amado, S., Coque, T.M., Baquero, F., Martínez, J.L., 2019. Defining and
combating antibiotic resistance from One Health and Global Health perspectives.
Nature microbiology. 9, 1432-1442
Hong, Y., Lee, I., Lee, W., Kim, H., 2019. Mass-balance-model-based evaluation of
sewage treatment plant contribution to residual pharmaceuticals in environmental
waters. Chemosphere. 378-387
Huang, S., Zhang, H., Ng, T.C.A., Xu, B., Shi, X., Ng, H.Y., 2020. Analysis of N-Acy-
L-homoserine lactones (AHLs) in wastewater treatment systems using SPE-LLE
with LC-MS/MS. Water Res. 115756
Huff, M., da Silveira, W.A., Carnevali, O., Renaud, L., Hardiman, G., 2018. Systems
analysis of the liver transcriptome in adult male zebrafish exposed to the plasticizer
(2-ethylhexyl) phthalate (DEHP). Scientific reports. 1, 1-17
Information Services Division (ISD)., 2016. Prescribing And Medicines: Prescription
Cost Analysis.
Irlam, R.C., Parkin, M.C., Brabazon, D.P., Beardah, M.S., O'Donnell, M., Barron, L.P.,
2019. Improved determination of femtogram-level organic explosives in multiple
matrices using dual-sorbent solid phase extraction and liquid chromatography-high
resolution accurate mass spectrometry. Talanta. 65-76
Jackson, L.M., Felgenhauer, B.E., Klerks, P.L., 2019. Feminization, altered gonadal
development, and liver damage in least killifish (Heterandria formosa) exposed to
sublethal concentrations of 17α-ethinylestradiol. Ecotoxicol. Environ. Saf. 331-337
Johansson, S.R., 1998. The Greatest Benefit to Mankind: A Medical History of Humanity
from Antiquity to the Present. Population and Development Review. 3, 624-624
Kallenborn, R., Brorström-Lundén, E., Reiersen, L., Wilson, S., 2018. Pharmaceuticals
and personal care products (PPCPs) in Arctic environments: indicator contaminants
for assessing local and remote anthropogenic sources in a pristine ecosystem in
change. Environ. Sci. Pollut. Res. 33, 33001-33013
Kasprzyk-Hordern, B., Dinsdale, R.M., Guwy, A.J., 2008. The occurrence of
pharmaceuticals, personal care products, endocrine disruptors and illicit drugs in
surface water in South Wales, UK. Water Res. 13, 3498-3518
Kasprzyk-Hordern, B., Dinsdale, R.M., Guwy, A.J., 2009. The removal of
pharmaceuticals, personal care products, endocrine disruptors and illicit drugs
during wastewater treatment and its impact on the quality of receiving waters. Water
Res. 2, 363-380
Kolpin, D.W., Furlong, E.T., Meyer, M.T., Thurman, E.M., Zaugg, S.D., Barber, L.B.,
Buxton, H.T., 2002. Pharmaceuticals, hormones, and other organic wastewater
contaminants in US streams, 1999-2000: A national reconnaissance. Environ. Sci.
Technol. 6, 1202-1211
Kötke, D., Gandrass, J., Xie, Z., Ebinghaus, R., 2019. Prioritised pharmaceuticals in
German estuaries and coastal waters: Occurrence and environmental risk assessment.
Environ. Pollut. 113161
Kumar, M., Ram, B., Honda, R., Poopipattana, C., Canh, V.D., Chaminda, T., Furumai,
H., 2019. Concurrence of antibiotic resistant bacteria (ARB), viruses,
pharmaceuticals and personal care products (PPCPs) in ambient waters of Guwahati,
India: Urban vulnerability and resilience perspective. Sci. Total Environ., 133640
Li, Y., Zhang, L., Ding, J., Liu, X., 2020. Prioritization of pharmaceuticals in water
environment in China based on environmental criteria and risk analysis of top-
priority pharmaceuticals. J. Environ. Manage. 109732
Lindberg, R.H., Olofsson, U., Rendahl, P., Johansson, M.I., Tysklind, M., Andersson,
B.A., 2006. Behavior of fluoroquinolones and trimethoprim during mechanical,
chemical, and active sludge treatment of sewage water and digestion of sludge.
Environ. Sci. Technol. 3, 1042-1048
Löffler, D., Ternes, T.A., 2003. Determination of acidic pharmaceuticals, antibiotics and
ivermectin in river sediment using liquid chromatography–tandem mass
spectrometry. J. Chromatogr. A. 1–2, 133-144
López-Serna, R., Petrović, M., Barceló, D., 2011. Development of a fast instrumental
method for the analysis of pharmaceuticals in environmental and wastewaters based
on ultra high performance liquid chromatography (UHPLC)–tandem mass
spectrometry (MS/MS). Chemosphere. 8, 1390-1399
Mansour, F., Al-Hindi, M., Saad, W., Salam, D., 2016. Environmental risk analysis and
prioritization of pharmaceuticals in a developing world context. Sci. Total Environ.
31-43
Marín, J.M., Gracia-Lor, E., Sancho, J.V., López, F.J., Hernández, F., 2009. Application
of ultra-high-pressure liquid chromatography-tandem mass spectrometry to the
determination of multi-class pesticides in environmental and wastewater samples.
Study of matrix effects. J. Chromatogr. A. 9, 1410-1420
Matuszewski, B., Constanzer, M., Chavez-Eng, C., 2003. Strategies for the assessment of
matrix effect in quantitative bioanalytical methods based on HPLC-MS/MS. Anal.
Chem. 13, 3019-3030
Meerpoel, C., Vidal, A., di Mavungu, J.D., Huybrechts, B., Tangni, E.K., Devreese, M.,
Croubels, S., De Saeger, S., 2018. Development and validation of an LC–MS/MS
method for the simultaneous determination of citrinin and ochratoxin a in a variety
of feed and foodstuffs. J. Chromatogr. A. 100-109
Miao, X., Metcalfe, C.D., 2003. Determination of carbamazepine and its metabolites in
aqueous samples using liquid chromatography-electrospray tandem mass
spectrometry. Anal. Chem. 15, 3731-3738
Miarov, O., Tal, A., Avisar, D., 2020. A critical evaluation of comparative regulatory
strategies for monitoring pharmaceuticals in recycled wastewater. J. Environ.
Manage. 109794
Nijsingh, N., Munthe, C., Larsson, D.J., 2019. Correction to: Managing pollution from
antibiotics manufacturing: charting actors, incentives and disincentives. Environ.
Health. 1, 108
Nunes, B., Antunes, S.C., Santos, J., Martins, L., Castro, B.B., 2014. Toxic potential of
paracetamol to freshwater organisms: A headache to environmental regulators?.
Ecotoxicol. Environ. Saf. 178-185
Östman, M., Fick, J., Tysklind, M., 2018. Detailed mass flows and removal efficiencies
for biocides and antibiotics in Swedish sewage treatment plants. Sci. Total Environ.
327-336
Peng, Y., Gautam, L., Hall, S.W., 2019. The detection of drugs of abuse and
pharmaceuticals in drinking water using solid-phase extraction and liquid
chromatography-mass spectrometry. Chemosphere. 438-447
Pereira, A.M.P.T., Silva, L.J.G., Lino, C.M., Meisel, L.M., Pena, A., 2016. Assessing
environmental risk of pharmaceuticals in Portugal: An approach for the selection of

the Portuguese monitoring stations in line with Directive 2013/39/EU. Chemosphere.
2507-2515
Petrie, B., Barden, R., Kasprzyk-Hordern, B., 2015. A review on emerging contaminants
in wastewaters and the environment: Current knowledge, understudied areas and
recommendations for future monitoring. Water Res. 3-27
Petrović, M., Hernando, M.D., Díaz-Cruz, M.S., Barceló, D., 2005. Liquid
chromatography–tandem mass spectrometry for the analysis of pharmaceutical
residues in environmental samples: a review. J. Chromatogr. A. 1-2, 1-14
Qin, G., Zhang, Y., Zhang, B., Zhang, Y., Liu, Y., Lin, Q., 2020. Environmental estrogens
and progestins disturb testis and brood pouch development with modifying
transcriptomes in male-pregnancy lined seahorse Hippocampus erectus. Sci. Total
Environ. 136840
Radjenović, J., Petrović, M. & Barceló, D., 2009. Fate and distribution of pharmaceuticals
in wastewater and sewage sludge of the conventional activated sludge (CAS) and
advanced membrane bioreactor (MBR) treatment. Water Res. 43 (3), 831-841
Renew, J.E., Huang, C.-., 2004. Simultaneous determination of fluoroquinolone,
sulfonamide, and trimethoprim antibiotics in wastewater using tandem solid phase
extraction and liquid chromatography-electrospray mass spectrometry. J.
Chromatogr. A. 1-2, 113-121
Roberts, P.H., Thomas, K.V., 2006. The occurrence of selected pharmaceuticals in
wastewater effluent and surface waters of the lower Tyne catchment. Sci. Total
Environ. 1, 143-153
Roos, V., Gunnarsson, L., Fick, J., Larsson, D., Rudén, C., 2012. Prioritising
pharmaceuticals for environmental risk assessment: towards adequate and feasible
first-tier selection. Sci. Total Environ. 102-110
Rossmann, J., Schubert, S., Gurke, R., Oertel, R., Kirch, W., 2014. Simultaneous
determination of most prescribed antibiotics in multiple urban wastewater by SPE-
LC–MS/MS. J. Chromatogr. B. 162-170
Roy, R.Y., Peterson, D.R., Kitamura, S., Segner, H., Seemann, F., Au, D.W., 2018. Sex-
specific immunomodulatory action of the environmental estrogen 17α-
ethynylestradiol alongside with reproductive impairment in fish. Aquat. Toxicol. 95-
106

Ruan, Y., Wu, R., Lam, J.C., Zhang, K., Lam, P.K., 2019. Seasonal occurrence and fate
of chiral pharmaceuticals in different sewage treatment systems in Hong Kong: Mass
balance, enantiomeric profiling, and risk assessment. Water Res. 607-616
Scheurer, M., Brauch, H.-., Lange, F.T., 2009. Analysis and occurrence of seven artificial
sweeteners in German waste water and surface water and in soil aquifer treatment
(SAT). Anal. Bioanal. Chem. 6, 1585-1594
Tong, L., Li, P., Wang, Y., Zhu, K., 2009. Analysis of veterinary antibiotic residues in
swine wastewater and environmental water samples using optimized SPE-
LC/MS/MS. Chemosphere. 8, 1090-1097
Tran, N.H., Li, Y., Reinhard, M., He, Y., Gin, K.Y., 2020. A sensitive and accurate
method for simultaneous analysis of algal toxins in freshwater using UPLC-MS/MS
and 15N-microcystins as isotopically labelled internal standards. Sci. Total Environ.
139-727
Tran, N.H., Hu, J., Ong, S.L., 2013. Simultaneous determination of PPCPs, EDCs, and
artificial sweeteners in environmental water samples using a single-step SPE
coupled with HPLC–MS/MS and isotope dilution. Talanta, 82-92
Ujhegyi, N., Bókony, V., 2020. Skin coloration as a possible non-invasive marker for
skewed sex ratios and gonadal abnormalities in immature common toads (Bufo bufo).
Ecol. Ind., 106175
UKWIR, 2014, Risk Based Prioritisation of Pharmaceuticals UKWIR Report,
14/WW/17/16 (August 2014), (ISBN: 1840577355)
UKWIR, 2019, Chemical Investigation Programme (CIP). National Report - Risk
assessment of CIP data with respect to implications for drinking water sources
Van De Steene, J.C., Mortier, K.A., Lambert, W.E., 2006. Tackling matrix effects during
development of a liquid chromatographic-electrospray ionisation tandem mass
spectrometric analysis of nine basic pharmaceuticals in aqueous environmental
samples. J. Chromatogr. A. 1, 71-81
Vazquez-Roig, P., Segarra, R., Blasco, C., Andreu, V., Picó, Y., 2010. Determination of
pharmaceuticals in soils and sediments by pressurized liquid extraction and liquid
chromatography tandem mass spectrometry. J. Chromatogr. A. 16, 2471-2483
Vergeynst, L., Haeck, A., De Wispelaere, P., Van Langenhove, H., Demeestere, K., 2015.
Multi-residue analysis of pharmaceuticals in wastewater by liquid chromatography–
magnetic sector mass spectrometry: Method quality assessment and application in a
Belgian case study. Chemosphere. S2-S8
Verlicchi, P., Al Aukidy, M., Galletti, A., Petrovic, M., Barceló, D., 2012. Hospital
effluent: investigation of the concentrations and distribution of pharmaceuticals and
environmental risk assessment. Sci. Total Environ. 109-118
Voulvoulis, N., Arpon, K.D., Giakoumis, T., 2017. The EU Water Framework Directive:
From great expectations to problems with implementation. Sci. Total Environ. 358-
366
Yu, H., Caldwell, D.J., Suri, R.P., 2019. In vitro estrogenic activity of representative
endocrine disrupting chemicals mixtures at environmentally relevant concentrations.
Chemosphere. 396-403
Yuan, L., 2019. The removal of pharmaceuticals and EDCs from water by low-cost
sorbents, PhD thesis, University of Aberdeen
Yuan, X., Qiang, Z., Ben, W., Zhu, B., Liu, J., 2014. Rapid detection of multiple class
pharmaceuticals in both municipal wastewater and sludge with ultra high
performance liquid chromatography tandem mass spectrometry. J. Environ. Sci. 9,
1949-1959
Zhang, Z., Wang, J., Pan, Z., Zhang, Y., Zhang, X., Tian, H., et al., 2019. Distribution of
vitellogenin in Japanese flounder (Paralichthys olivaceus) for biomarker analysis of
marine environmental estrogens. Aquat. Toxicol. 105-321
Zhou, X., Li, Y., Li, H., Yang, Z., Zuo, C., 2019. Responses in the crucian carp (Carassius
auratus) exposed to environmentally relevant concentration of 17α-Ethinylestradiol
based on metabolomics. Ecotoxicol. Environ. Saf. 109-501.