Embed Size (px)
Citation preview
Univers
ity of
Cap
e Tow
n
THE FEASIBILITY OF USING REMOTE SENSING
AND
THE
FIELD-BASED CHECKS TO MONITOR
IMPACT CAUSED BY COLLECTION OF
IN THE EASTERN CAPE/CISKEI FOREST
AND THICKET FORMATIONS
Karl Lane
Submitted in fulfilment of the requirements for the MSc degree
in the Department of Botany, University of Cape Town
Cape Town 1988
WOOD
The copyright of this thesis vests in the author. No quotation from it or information derived from it is to be published without full acknowledgement of the source. The thesis is to be used for private study or non-commercial research purposes only.
Published by the University of Cape Town (UCT) in terms of the non-exclusive license granted to UCT by the author.
Univers
ity of
Cap
e Tow
n

Univers
ity of
Cap
e Tow
n
( i)
ACKNOWLEDGEMENTS
I wish to thank the following persons/organizations most sincerely for
their assistance:
The Foundation for Research Development of the CSIR, for funding the
study in 1986 and 1987.
The University of Cape Town for their facilities, and my supervisor,
Prof E J Moll of the Botany Department, for his guidance,
Dr B McKenzie of the Botany Department of the University of the
Western Cape, co-superviser of the project, for his guidance.
Dr R M Cowling, Prof RI Yeaton and Mr MT Hoffman, for commenting on
earlier drafts.
My wife, Tisha Greyling, for encouragement.
(ii)
EXECUTIVE SUMMARY
A variety of studies have shown the problems of energy supply faced by
low-income
dependent
communities
communities in southern Africa. Most of these communities are
upon indigenous fuelwood supplies. In addition, many of these
use indigenous wood for construction. This largely
uncontrolled utilisation imposes severe threats on woody vegetation
The Eastern Cape/Ciskei region is an area where energy
are particularly severe and impacts on woody vegetation
communities.
supply problems
correspondingly
of using remote
collection of
communities.
severe. This study aimed to investigate the feasibility
sensing techniques to monitor the the impact caused by
wood in the Eastern Cape/Ciskei forest and thicket
A variety of remote sensing techniques for landcover analysis were
investigated. In all cases, visual interpretation was used because it is
considerably cheaper and demands less technical expertise than would
computer processing. In addition, many studies have shown visual
interpretation to be superior.
Maps were drawn from multitemporal aerial photograph sequences and from
Landsat and SPOT satellite images. These maps showed that there has been
relatively little change in area of woody vegetation in the study area
since 1956. However, field studies showed that vegetation community
structure had been degraded as a result of intense and sustained human
impact. This qualitative decline also reflected a decline in usefulnes$
of the woody vegetation of the area to local communities. This
substantial degradation was not visible on any of the remote sensing
imageries. This emphasises that field-based checks to monitor human
impacts on forest and thicket formations are essential.
Strategies for reducing the dependence of low-income communities on
indigenous vegetation for energy supplies and constructional timber have
been reviewed from the literature and these are descibed in Appendix 1.
Most successful strategies in other parts of the world have been the
result of a national commitment to tree planting, recognition of a
multiplicity of constraints and the voluntary involvement of the
communities the strategies are intended to assist.
(iii)
TABLE OF CONTENTS
ACKNOWLEDGEMENTS
EXECUTIVE SUMMARY
1.
1.1
1. 2
1. 3
1.4
INTRODUCTION
WOOD USE PATTERNS AS MOTIVATION FOR THE STUDY
FUELWOOD USE
ALTERNATIVES TO WOOD
STUDY AREA: LUJIKO, CISKEI
2. OVERVIEW OF SOME REMOTE SENSING IMAGERIES
USED FOR LANDCOVER ANALYSIS
2. 1
2.2
2. 2. 1
2.2.2
2.2.3
2.2.4
2.3
2.3.1
2.3.2
INTRODUCTION
SOURCES AND KINDS OF PHOTOGRAPHIC IMAGERY
Standard aerial photographs
Orthophoto's
Unconventional photography
Photographic multispectral method
NON-PHOTOGRAPHIC AIRBORNE lMAGERIES
Aircraft multispectral scanner data acquisition
Image degradations in airborne remote
sensing
2.3.2.1 Spatial distortion due to terrain
2.3.2.2 Spatial distortion due to aircraft instability
2.3.2.3 Radiometric degradations
2.4 SPACE PLATFORM IMAGERY
2.4.1 Landsat imagery
2.4.2. SPOT imagery
2.4.3 Computer processing of Landsat and Spot
Page number
(i)
(ii)
1
1
2
6
6
10
10
11
11
12
12
13
14
14
15
15
15
15
16
18
20
22
(iv)
2.5 THE SELECTION OF IMAGERY 25
2.6 MAPPING FROM REMOTELY SENSED IMAGES 26
2.6.1 Mapping of space platform imagery 26
2.6.2 Mapping of aerial photography 27
2.6.2.1 Planimetric mapping 29
2.6.2.2 Some problems with mapping 30
3. WOODY VEGETATION CHANGE IN THE LUJIKO AREA:
MAPPING AND FIELD STUDY 31
3. 1 MAPPING 31
3. 1 • 1 Aerial photographs 31
3 .1. 2 Landsat 32
3, 1. 3 SPOT 33
3.2 OOT SAMPLING 33
3.3 FIELD METHODS 35
3. 3. 1 Ground truthing 35
3.3.2 Fuelwood size 35
3.3.3 Vegetation transects 35
3.3.4 Profile diagrams 36
4. RESULTS AND DISCUSSION 37
4. 1 INTRODUCTION 37
4.2 WOODY VEGETATION MAPS 37
4. 2. 1 Satellite maps 38
4.2.1.1 Landsat 38
4.2.1.2 SPOT 41
4.2.2 Aerial photograph maps 43
4.3 DOT SAMPLING 47
4.4 FIELD STUDY 49
4. 4. 1 Fuelwood size 49
4.4.2 Stem density 49
4.4.3 Profile diagrams 52
(v)
4.4.4 Species composition 55
4.4.5 Height classes 60
4.4.6 Basal area 62
4.4.7 Stem diameter 64
4.4.8 Canopy cover 64
5. CONCLUSIONS AND RECOMMENDATIONS 66
5. 1 CONCLUSIONS 66
5. I. 1 Impact caused by colletion of wood in the
Eastern Cape/Ciskei 66
5 .1. 2 The feasibility of using remote sensing 67
5.2 RECOMMENDATIONS 68
5.2.1 Monitoring 68
5.2.2 Utilisation of indigenous vegetation 69
5.2.3 Tree planting strategies 69
REFERENCES 71
APPENDIX 1: REVIEW OF TREE PLANTING STRATEGIES
INTRODUCTION 1
CONSTRAINTS 4
Cultural constraints
Perceptual constraints
Land tenure
Ownership of trees
Conflicting responsibilities
The time factor
4
5
5
6
6
7
TREE PLANTING STRATEGIES
Farm forestry
Family tree growing
Community forestry
Agrof ores try
(vi)
ESTABLISHMENT OF TREE PLANTING PROGRAMMES
Education and extension
Availability and distribution of seedlings
Species
PROJECTS IN SOUTHERN AFRICA
Transkei
Ciskei
KwaZulu
Lesotho
POTENTIAL IMPACTS OF ALIEN SPECIES PLANTED FOR FUEL
CONCLUSIONS
7
7
8
10
12
14
15
16
1 7
19
20
21
22
23
23
27
- 1 -
CHAPTER 1
INTRODUCTION
1.1 WOOD USE PATIERNS AS MOTIVATION FOR THE STUDY
Like many countries attempting to alleviate the spectre of under-
development
increasingly
Many authors
pointed out
and its concomitant socio-economic problems, South Africa is
tackling the question of basic human needs (Le Roux 1985).
of publications on the consequences of development have
that the poor are often least likely to benefit from any
development programme. Keeton <1984) says that "the primary effect of
economic development .••. is, on the average to decrease both the absolute
and the relative income of the poor. Not only is there no automatic
trickle down of the benefits of development but on the contrary, the
development process leads typically to a trickle up in favour of the
middle class and the rich."
Simkins (1984) has shown that in South Africa, as in other less developed
countries, the bottom 15% income group have experienced an absolute
decline in per capita income since 1960. Le Roux (1985) suggests that 15%
may even be a conservative estimate and that the true percentage may lie
between 20% and 30%. Le Roux also points out that these figures represent
only observations of income growth/decline rates. The actual number of
families living below the "bread line" was possibly as high as 80% of
South African families even in 1980.
The basic needs approach has been variously defined and the collection of
services and facilities which provide for basic needs will obviously be
- 2 -
different from country to country. Nevertheless Burki and Ul Haq (in Le
Roux 1985) identify "a common core that includes nutrition, education,
health, water, sanitation and shelter". It is self-evident that fuel and
constructional timber are essential for the fulfillment of at least some
of these services. This study was therefore implemented to investigate
possible monitoring techniques and the nature of human impacts on the
woody vegetation in the eastern Cape/Ciskei.
Where indigenous timber
construction of houses
is still plentiful, it is extensively used for
(Cunningham 1988). In the forested areas of the
Transkei, species such as B~xus macowanii, Buxus natalensis,
Cryptocaria woodii, Duvernoia adhatodoides, Pavetta lanceolata
are favoured as poles and laths for construction (Johnson 1983). In
addition, Cunningham (1988) mentions Apodytes dimidiata and
Ptaeroxylon obliquum as favoured species and points out that these are
cut as live wood. These species are favoured because of their durability
and resistance to termite attack but this also means they have low annual
increments (Cunningham 1988). Indigenous forests are also under pressure
to varying degrees from many other forms of utilisation ranging from
timber for furniture to foods and traditional medicines (Cunningham 1988).
1.2 FUELWOOD USE
Wood
fires.
Tuohy
used
has been utilised for many thousands of years as fuel for household
Through studies of charcoals in shelters in Swaziland Prior and
(1987) have shown that where choice was possible, the plant species
as firewood in Swaziland has remained the same over the last 9 000
years. The most favoured species have been species of Leguminosae and
Combretaceae. Variations in Combretaceae and Leguminosae residues in
charcoals have been used to indicate changes in abundance of these plants
which have been attributed to climatic variation. Today fuelwood still
forms the major energy source of black people in Africa (Harrison 1987).
3
Mo 11 er ( 1985) notes that "Over 4/5ths of rura 1 and white farm blacks
(ie black workers on white owned farms) stated that they used wood
for cooking or heating in their homes. However, less than 45% of the
rural blacks collect their wood nearby. 45% of rural blacks must buy
firewood and a further 10% must walk over 30 minutes to collect
firewood
Gandar (1983) notes that in KwaZulu, one day per week was given over
to wood collection by the woman of the household. In an extreme
case, women of a community walked a round trip of over 19km to
collect a single headload of 40kg (+/-0,068m 3). This occupied 9,5
hrs per person and contributes to the total of 50 million man-hours
per annum spent on wood collection in KwaZulu.
Research by Best (1979), Gandar (1983), Liengme (1983) Furness (1981)
indicate similar expenditure of time and effort harvesting similar
quantities is other regions of southern Africa. In general it has
been found that as the wood supply declines and trees become scarce
the volume of wood used declines Gandar {1983). This reflects the
logistical and financial problems associated with harvesting timber
over large distances. Overall consumption figures vary from
0,2t/capita/yr in Jozanna's Nek in the Transkei to 1,13t/capita/yr in
Mozambique <Table 1.1 Eberhard, 1986). Sasson {1987) reports that
51% of the energy of low income groups in South Africa is obtained
from wood.
It has been estimated that total current fuelwood consumption in
South Africa and the National States amounts to 13,6 million t/yr
(Eberhard 1986). This amounts to about 6% of the primary energy
consumption of the country {Williams 1986).
Traditionally dead wood is
estimates that at present
woodlands could yield 50%
collected for fuel and Gandar (1983)
dead wood from the KwaZulu forests and
of the total rural fuelwood requirement.
Increasing population however increases pressure on woodland until
it can no longer supply the community requirements if dead wood
alone is harvested. Gandar (1983} observed that in KwaZulu 8% of
the fuelwood collected in valley lowveld areas was green, but in
areas of greater scarcity such as on the high grassland this figure
rose to 42%. Prior and Tuohy (1987) point out that
- 4 -
Table 1. Domestic Rural Energy Consumption/cap/yr in Southern
Africa (Eberhard 1986)
WOOD
Area tonne
Angola .523
Botswana .797
Lesotho .463
Lesotho .288
Malawi .628
Malawi .587
Mozam. 1 • 135
Transkei . 960
Transkei • 271
KwaZulu 1.124
KwaZulu .62
KwaZulu .74
Gazankulu .76
S Africa .43
Swaziland .495
Zambia .94
Zimbabwe 1.031
Zimbabwe .616
x: not reported
GJ: gigajoules
RESIDUES
tonne
.025
.059
.348
.260
.033
X
. 134
X
X
X
X
X
X
X
.033
.035
.013
X
DUNG PARAFFIN OVERALL
tonne litre GJ
3 9.35
2.3 14.46
11.1 13.44
5.08 10. 33
0.3 11. 16
X 9.98
3.1 21. 35
X X 16.32
.08 10.24 7.69
5.68 23.86
.o 12 2% 10 .68
.2% 2% 12.58
X X 12.92
.058 X 8.0
5.1 9 .37
1. 7 17.32
3. 1 17.89
X 10. 47
some green woods give acceptable fires in spite of the high moisture content,
However, removing greenwood from trees slows or halts growth and may eventually
kill individual trees.
In the Transkei, tradition has prevented wholesale cutting of live timber
- 5 -
(McKenzie 1986) by prohibiting sharp implements in the Transkei forests.
As a result McKenzie showed that the area of forest in Transkei had not
decreased over a period of many years. It is, however, evident that
cutting of live timber is taking place inside these forests (pers obs
1987) probably due to the increasing pressures from population growth. By
contrast in parts of Natal and KwaZulu forests have in historical times
contracted (Marshall B 1985 pers comm). Ashton (1952) and Sheddick (1954)
state that indigenous trees and forest are traditionally protected in
Lesotho although brushwood may be freely collected.
Prior and Tuohy(l987) state that in Swaziland the firewood collectors
those species which will coppice readily. This practice choose for fuel
has considerable
of the preferred
advantage in that it provides numerous regenerated stems
diameters and lengths for fuel wood, In terms of
is efficient in that it encourages harvesting whilst management it
productivity is
riverine areas
high, A similar situation is reported in Venda in
(Yeaton R I 1987 pers comm). This kind of practice has
been the norm in Europe for centuries and is practiced in South Africa in
Acacia and Eucalyptus plantations.
It is clear therefore that there is considerable demand for wood in rural
areas and that impacts on wooded areas can be severe. Impacts caused by
fuelwood collection are exacerbated by browsing stock (Wyatt-Smith 1982).
It may be that in many areas the real constraints on the maintenance of
forest systems are imposed by browsing. As a result of browsing pressure,
understorey is destroyed (Wyatt-Smith 1982) and the canopy may
subsequently be opened. Regeneration patterns are changed due to a changed
microclimate and to continuing browsing pressure. In moderation this may
be of benefit to forest communities since many species recruit by
exploiting the gaps created by tree fall or other clearance. Browsing
animals reduce regeneration growth from coppiced stumps and also consume
seedlings and suckers. Thus, whilst a forest or woodland may sustain wood
collection, it may not sustain both wood collection and browsing.
- 6 -
1.3. ALTERNATIVES TO WOOD
There is a marked reluctance to move away from wood as a fuel for various
reasons (Eberhard 1986). For example the cost of alternatives, such as
coal and paraffin, is prohibitive, gas is relatively unfamiliar to rural
people and household and crop residues are too few. Dung may cause health
problems because of smoke generation (Eberhard 1986).
Electrification is
this facility is
seen as an acceptable alternative but the provision of
subject to political and economic constraints. The
Institute of Race Relations states that ESCOM has the capacity to supply
electricity to every city, town and village in the country but comments
that local authorities are unwilling or unable to provide the necessary
infrastructures. Many engineers however believe that electrification
should not be considered the ultimate goal for all rural areas. They
point out that electrification in developed countries expanded at a time
when fuel was cheap and abundant. A centralised electrification system
also combined well with the existing centralised infrastructures. In
developing areas where conditions are very different electrification may
not be the optimal solution (El Mahagry and Biswas 1985).
It is therefore clear that dependence on wood as a fuel and as a
constructional material, is likely to persist for some considerable time.
Against this background it was therefore seen as essential to devise an
effective and efficient technique to monitor and describe rural community
impacts on woody vegetation. This study was funded by the CSIR's
Foundation for Research Development as a step in this direction.
1.4 STIJDY AREA: LUJIKO, CISKEI
Eberhard worked
varying parts of
was designed to
including areas
in several areas of different environmental qualities in
South Africa to assess energy use patterns. This study
utilise Eberhard's data for the eastern Cape region,
of the Ciskei and Transkei. The criteria for the
- 7 -
selection of a study area that it should support woody vegetation, be
accessible within the travel budget allocated for the project, support a
large fairly traditional rural population, be close to a similar area
which was relatively unutilised, and be covered by several years of aerial
photography.
Only one of Eberhard's study areas met these criteria. This was Lujiko in
the Ciskei which has some 600-700 households Eberhard (1986). It is
located in the Peddie district at 33°22'S and 27°22'E on the edge of
the Great Fish River Valley and within LO km of the coast. A 1:50 000 map
of this area accompanies this document. Annual rainfall is in the range
1000mm-1200mm pa. Acocks (1953) describes the vegetation types of the
area as Valley Bushveld, and Eastern Province Thornveld. More recently,
the vegetation of this eastern Cape/Ciskei region has been studied in some
depth. Gibbs et al (1981) estimate that the vegetation of the region is
comprised of 3 600-4 000 vascular species. Cowling (1982a and 1982b)
emphasises the diversity and describes the area as a convergence zone of
four major phytochoria resulting in a complex mosaic of communities. This
diversity of species has a profound impact on the way the vegetation is
represented by remotely sensed images and therefore also on the subsequent
interpretation of the images.
Within the limits of the study area the communities were described by
Lubke et al (1986) as (codes in brackets are Acocks Veld Types):
a) Subtropical thicket including
Dune Thicket (Al(d))
Valley Bushveld or Succulent Thicket (A23)
b) Acacia Savanna, including
Coastal Acacia Savanna (A7)
Upland Acacia Savanna (A21, A22, A68)
c) False Thornveld Grasslands (A21, A22, A68)
d) Mixed Grasslands of several kinds.
Everard (1985) describes
vegetation in which the
the vegetation in more detail and defines the
field sampling was carried out as Kaffrarian
- 8 -
Thicket. Of the two kinds which he identifies, Coastal and Inland
Kaffrarian Thicket, all sampling was within the latter.
This vegetation type
thicket community in
is characterised by a dense woody shrub and tree
which woody components comprise 63 per cent of the
life forms (Everard 1985). It is found in river valleys and on slopes
rainfall is in excess of 800 mm per annum. Spinescent,
sclerophyllous species predominate with some drought deciduous
where the
evergreen,
species.
The thicket communities in the study area which are exploited for fuelwood
and for constructional timber are considered by Cowling (1984) to be
stable but of low resilience. This view is supported by Aucamp and
Barnard (1980) who describe these communities as vulnerable to
overstocking and slow to recover from disturbance. The vulnerability of
the communities to disturbance is demonstrated by the close correlation of
low species diversity with high grazing pressure (Everard 1985).
Direct and indirect human impacts on thicket com~unities represent serious
threats. These impacts include clearance for agricultural and urban
development, and the collection of timber and grazing of stock within the
communities (Everard 1985).
Eberhard noted
valley and that
that indigenous
dead wood was
restrictions on the harvesting
considerable quantities of wood
nearby plantation.
wood was collected from the Fish river
becoming scarce. There were however
of green wood. He noted also that
were brought into the community from a
Within this area two valley slopes were selected for the detailed field
investigation of plant community structure which is an important component
of this study. One of these was within 1 km of Lujiko on the Fish river,
and
This
was
the other was almost directly opposite on the RSA side of the river.
second site was not easily accessible to any community although there
a single household within 1 km. Goats from this household were seen
passing through the study site on several occasions and these were assumed

- 9 -
to have only a minor impact on the vegetation. The sites were selected to
be as alike as possible in terms of morphology, aspect and altitude. Both
sites were at approximately 150m altitude faced south-west and had an
angle of slope of 23°.
OF SOME
USED
2.1 INTRODUCTION
- 10 -
CHAPTER 2
OVERVIEW
REMOTE SENSING IMAGERIES
FOR LANDCOVER ANALYSIS
Remote sensing is, in theory, a quick and accurate method of gathering
data to define an area or to monitor change. It suffers however from
certain limitations.
The importance of long-term monitoring of land cover change cannot be
overemphasised. One-off land cover studies are in themselves of interest
and importance, but their usefulness is greatly enhanced if the surveys
are made repeatedly. This necessitates a monitoring programme using
compatible survey techniques to assess both spatial and temporal change.
An outline of various techniques is presented together with some
considerations of their effectiveness in terms of constraints and ease of
use.
There are numerous definitions of remote sensing and the term and
technology has in recent years become increasingly fashionable. It has
been increasingly understood by the non specialist to mean space platform,
and specifically Landsat imagery. For the sake of simplicity remote
sensing can be summed up as any method of data collection from an object
at a distance without actual contact with that object. In these terms the
human eye
unable, as
Any form
becomes a reliable and efficient remote sensing device although
pointed out by Thalen {1979), to produce a permanent record.
of photography of distant objects is remote sensing which does
produce a permanent record. There should perhaps be a distinction between
remote and proximal sensing, although it is not pertinent at this time to
attempt to establish at what point remote becomes proximal. For the
purposes of this presentation all sensing of this nature will be
- 11 -
considered under the umbrella of remote sensing.
obtained from Landsats 1, 2, 3, Landsat D and from the Satellite imagery
1986 launch of the SPOT satellite has revolutionised remote sensing
Resolution has improved from the 80mx56m of Landsat and
Landsat thematic mapper to the 20mx20m multispectral and
capabilities.
30mx30m of the
lOmxlOm panchromatic imagery of SPOT.
2.2. SOURCES AND KINDS OF PHOTOGRAPHIC IMAGERY
2.2.1. Standard Aerial Photographs
The most accessible are the standard aerial photographic products of the
Department of Surveys and Mapping, These include photographs at various
scales ranging from 1:10 000 to 1:150 000. The photographs are available
in stereo pairs which considerably aid interpretation, improving speed and
accuracy. Stereo pairs are necessary if cartographic plotters are to be
used when mapping from the photographs. The scale available depends in
part on the year in which the photography was taken. Prior to about 1950
photographs were of a large scale, about 1:30 000 and even larger, whilst
more recently scales have been reduced to 1:50-60 000. Very small scale
photography of the order of 1:150 000 is available for selected areas
only. These standard products are panchromatic (black and white). Some
colour photography is available for specific areas, but it is very
limited.
These standard photo products provide complete coverage of South Africa.
Each part of the country is re-flown and photographed approximately every
10 years. Only a portion of the country is photographed in any given
year. Pilot skill in maintaining aircraft stability and instability
caused by turbulence are factors which influence image quality. The small
scale of the standard photo products presents problems with regard to
interpretation of fine detail. This imposes limitations on their
usefulness in interpretation of vegetation community structure.
- 12
Using these photographs it is possible to distinguish between scrub
and dense
difficult
differences
tree cover on a textural and tonal basis, but it is
or impossible to distinguish any but gross community
between different stands of the same vegetation type. It
is thus easy and relatively cheap to utilise these products to make
gross quantitative statements about vegetation change, but
qualitative data is much more difficult to extract. Much depends on
the interpreter's experience and on his familiarity with the study
area. It is also difficult with small scale photography to make the
subjective decisions necessary to delineate vegetation type
boundaries. For example, at what point does open canopy woodland
become scattered woodland? This problem is exacerbated when
multitemporal imagery of different scales is used. At large scales
individual canopy diameters can be measured and these diameters used
as a yardstick for defining woodland types. Similar indicators of
scale can be used with respect to analysis of other vegetation
types. At scales of 1:10 000 it is relatively easy to identify,
sometimes even at a species level, the more conspicuous trees.
2.2.2. Orthophotos
These are limited and are for those areas which are of some
particular importance to central government or local authorities such
as urban areas. Orthoohotos are produced at a scale of 1:10 000 and
are corrected to remove distortion. Direct measurements of area can
therefore be made and the large scale makes orthophotos useful for
vegetation studies. However, orthophotos suffer from some loss of
sharpness since they are printed on ammonia paper and are
unfortunately not available as photographic prints.
2.2.3. Unconventional Photo.9..!'.:E_.P..b.:t.'.
The
near
and
photography
vertical
formats.
discussed up to this point has been conventional,
photography using standard aerial photography cameras
Where great accuracy is not required various forms of

unconventional
low precision
mapping may be
Scope can also
useful maps.
- 13 -
photography may be used. In addition, if low precision if
is required then relatively cheap and simple methods of
used (Dowman 1981). The Bausch and Lomb Zoom Transfer
be used with some of this kind of photography to produce
Unconventional photography is defined by Dowman (1981) as "that which is
not taken from an aircraft with a metric camera ... ith near vertical axis".
This type
hand-held
of photography should therefore be seen also to include
35mm lateral photography which, if carried out from fixed points
at regular
this can be
intervals can be invaluable. An exarr.ple of the usefulness of
seen in Peterken (1981) who illustrated changes in Scottish
woodland using a comparison of the same scene on an early postcard and a
recent photograph. Claveran (1966) used polaroid film which produced
positive prints which could be annotated in the field. More sophisticated
ground photography techniques for monitoring various ground covers are
available (Wimbush et al, 1967, Wells, 1971) although these are not
relevant at the scales under consideration in this paper.
A hand-held 35mm camera may yield very useful results when used from an
aircraft. Over smal 1,
data base
be used
familiar areas these photographs may provide a
(Huntley B J, 1987 pers comm). This kind of
to produce vertical or oblique imagery. But is
useful mapping
photography may
too imprecise to be used for the production of stereo pairs.
A recent
Africa's
submission to a symposium on long-tern data series in southern
natural resources highlighted the value of historical
unconventional photographic records. This study showed an increase in
woody vegetation in parts of Natal by using archival photographs of farms
and hunting trips taken with an ordinary camera.
2.2.4. Photographic Multispectral Method
A recent technique developed at the University of Natal in Durban utilises
a twin
standard
camera system beneath a light aircraft. One camera is loaded with
colour film, the other with black and white/infrared. After
- 14 -
processing the images from the two cameras are digitally combined
resulting in an extremely high resolution, multispectral image (Piper and
Scoggins 1987). This method is extremely precise and this may be of prime
importance in long term studies when exact location of ground study sites
is necessary, particularly when referenced to satellite imagery. It has
the capacity to provide a link between satellite imagery such as that
available from SPOT and a field study.
2.3. NON-PHOTOGRAPHIC AIRBORNE IMAGERIES
2.3.1. Aircraft Multispectral Scanner Data Acquisition
This is a method of acquiring a wide range of data over a range of
spectral bands. A variety of scanners are in use around the world. That
which is most accessible to researchers in South Africa is the Daedalus
system. Project Daedalus 1268 is a multispectral image airborne
acquisition programme flown by the Aircraft Operating Company of
Johannesburg and coordinated by the CSIR. Although it is potentially an
expensive technique it yields excellent results. The pixel size of
5m-7,5m provides high resolution and consequently high interpretability.
The programme is able to simulate the spectral bands of Landsat-3, SPOT
and the Landsat-D Thematic Mapper. Image processing is offered by the
company flying the mission for those users who do not have access to their
own image processing facilities. Coordination by the CSIR of the needs of
a number of users considerably reduces costs. The system is subject to
the limitations described in the section covering "image degradations."
Planning is extremely important as in all aerial survey work. Resolution
is a critical factor and the chosen resolution determines the flying
height of the aircraft. This may not be possible in the Daedalus project
since the needs of a wide variety of users need to be accommodated.
Resolution over an image varies from the chosen resolution beneath the
aircraft to 50% at a scan angle of .45°. Spectral contrast is obviously
of extreme importance to resolution. The greater the contrast, the less
- 15 -
variation in resolution particularly towards the edge of the image (Thomas
et al 1987)
Flying height may not be determined by resolution requirements. It may be
fixed by the area to be flown and the available funding, Higher altitude
flights give broader swathe widths and so greater coverage.
Flying conditions are
stability and reduce
considered. Around
effects are reduced.
also important. Calm conditions improve aircraft
distortions. The time of day should also be
midday is best for this kind of scan since sun angle
2.3.2. Image Degradations in Airborne Remote Sensing
Scanner induced degradations may be routinely removed from the imagery
during processing. Degradations introduced by characteristics of the
survey flight need to be understood. These are covered in some detail by
Thomas et al (1987) but are briefly outlined here:
2.J.2.1. Spatial distortion due to terrain: In areas of undulating
or rugged terrain there is a change in pixel size. Since pixel size is a
function of the height of the aircraft above ground, a 1% variation in
altitude will result in a 1% variation in pixel size. Pixel size
variations are also induced by parallax. A 30m change in terrain altitude
viewed at a 45° scan angle will result in a 3 pixel displacement in the
data (Thomas et al 1987).
2.J.2.2. Spatial distortion due to aircraft instability: Relatively
small aircraft movements of yaw, pitch and altitude can result in large
data losses as well as spatial distortions. These effects can be reduced
by experienced crew, stable air conditions and roll stabilised scanning
units.
2.3.2.J
that there
the edge.
Radiometric degradations: Thomas et al (1987) point out
is a "radiance fall off" along the scan line from the nadir to
This is due to radiation attenuation and scattering since it
- 16 -
must pass through more of the atmosphere on its path from the ground to
the airborne scanner. Water bodies can also produce problems, intensely
bright reflections from the water surface may saturate the scanner,
2.4. SPACE PLATFORM IMAGERY
Since the early 1970's satellite and other space platform imageries have
been used to develop resource monitoring systems. The most well known and
widely used of these to date is Landsat. Many authors have discussed the
capabilities and limitations of Landsat multispectral imagery. Much of
the work relevant to this study has shown relationships between soil
exposure and canopy or other vegetation cover (Milton 1978, Tucker and
Maxwell 1976, Robinove et al 1981). More recently Allen and Richards
(1983) noted that soils in semi-arid areas are highly reflective due to a
low moisture content at the surface, Masking of this reflectance by the
canopy should be a good indicator of the degree of cover of the canopy.
Griffiths and Collins (1983) showed a significant relationship between
non-green woody vegetation cover and reflectance levels on rangeland in
Kenya. Lane (1983) however was unable to show significant relationships
between Landsat MSS data and various vegetation parameters, including
woody vegetation cover, in Tanzania. Vujakovic (1986) was successful in
using computer processed Landsat MSS data to map woody vegetation bounding
the Okavango Swamp area in Botswana. He states that the terrain over
which he worked was "level or gently undulating, sand ridges forming
shallow rises with intervening swales (wave length between 300 and 450 m,
amplitude between 2 and )m)." He describes vegetation structure as being
relatively simple with areas of shrubs dominated by Grewia species
and a scattering of Acacia species, Grainger (1984) proposes
satellite imagery as the only practical way in which to monitor global
deforestation despite its present limitations. Landsat can be excellent
in areas of relatively flat terrain and simple vegetation communities. It
is also useful at the small scale appropriate to global monitoring
programmes. •
Multispectral
Every object
- 17 -
sensing is based on the concept of the spectral signature.
and surface reflects sunlight modified in some way from that
which arrived at the surface of that object or surface. The modification
is a function of a variety of factors which define that object or
surface. Theoretically the infinite minute variations in surface
qualities permit all surfaces to be identified in terms of a unique
spectral reflectance signature. Signatures described by Mason in Thomas
et al (1987) as "fingerprints of life".
Vegetation has
1980). This
characteristics
discontinuities
reflection.
photosynthetic
absorbed red,
a readily recognisable spectral reflectance curve (Curran
is determined by the structural and photosynthetic
of the vegetation. Gausman (1974) showed that
in the refractive index within a leaf determine infrared
Whittingham, (1974) showed that the four primary
pigments, chlorophyll A, B, beta carotene and xanthophyll
blue and green light at specific wavelengths. This gives
low reflectance in the visible spectrum associated with energy absorption
for photosynthesis. High reflectance portions of the reflectance curve
reflect those parts of the spectrum not absorbed and utilised by the
plant. Senescence and disease produce a decline in vigour, a
corresponding decline in chlorophyll production and energy absorption and
therefore an altered spectral reflectance curve. These factors combined
lead not only to a characteristic spectral signature for vegetation but to
a characteristic spectral signature for plants of particular species, age
and vigour.
Vegetation canopy reflectance is also influenced by degree of cover,
characteristics of non-leafy components of the vegetation, characteristics
of the ground cover, shadow and environmental variables (Colwell 1974,
Hoffer 1978). As would be expected, an increase in the leaf area index,
(ie the area of leaf in the canopy relative to the ground sensed through
the canopy), leads to an increase in the infrared reflectance Orientation
of the leaves in the canopy also affects reflectance so that wilting may
change the reflectance characteristics. These characteristics are further
affected by incident reflectance, soil characteristics and even wind
(Suits 1972 in Thomas et al 1987),
- 18 -
It is clear that the relationships between spectral signatures and
vegetation are complex. This complexity is increased when it is realised
that the spectral signatures produced by the scanners are not of
individual plants but are generalised signatures for an area of ground
which in the case of Landsat is large. Thus identification of vegetation
qualities, especially in complex mosaics may be difficult or impossible.
This situation is exacerbated by rugged terrain.
2.4.1 Landsat Imagery
Landsat is one of a series of satellites launched since 1972 to receive
and relay to earth based stations spectral data which describe the earth's
surface. It is also capable of describing the conditions immediately
above and immediately below.
A brief outline of the nature and function of the Landsat system follows
but for details about the satellite and its operation the reader is
referred to Sabins (1978), Barrett and Curtis (1976).
The
of
Landsat
800-900
satellites are in a sun synchronous orbit at a nominal height
km This means that the satellites pass over a given ground
point
data
at
are
has four
visible
to the
the same local time, 09h30, every 18 days. Reflected spectral
collected by the multispectral scanner (MSS ) sensors. The MSS
spectral bands, 4, 5, 6, and 7 corresponding to visible green,
red and two near infrared channels. The MSS scans at right angles
satellite's track and builds up an image by assembling successive
scans into a complete scene. A single scene represents a ground area of
about 180krnxl80km with a nominal resolution of 80m. All data are stored
on tape. Each unit of data represents a nominal ground area of 80m x
56m which corresponds to a particular picture element or pixel on the
Although the satellite passes over the same point every 18 days
is not exact and so it should be remembered that for comparison
purposes each picture element or pixel of a given image does not exactly
image.
this
correspond
that the
with the pixel of the succeeding image. This in effect means
useful resolution of Landsat is increased to several hectares.
- 19 -
Each pixel represents an average of the spectral reflectances for the area
on the ground which it represents. A displacement of the pixel relative
to the ground may
reflectance. Thus
actually exists.
mean a different set of data with a different average
the pixels may appear different where no difference
Landsat imagery is available in several formats. Computer compatible
tapes (CCT's), paper and transparency false colour composite images
(FCC's) and as panchromatic images. False colour images are coloured but
not in true colours. Green vegetation for example is represented by
shades of red and orange depending upon its species composition,
physiognomy and vigour.
CCT's can be translated into a visual image which can be interpreted by
standard photographic interpretation techniques. Visual interpretation
can represent a considerable saving over the cost of computer processing.
At the time of writing, processing costs were in the region of RlOO/hr at
the Satellite Remote Sensing Centre facility at Hartebeeshoek near
Pretoria. This includes access to considerable expertise. In addition,
computer processing requires considerably more ground truthing than does
visual analysis Ultimately in areas where extrapolation can be
successfully carried out, (ie uniform vegetation and on flat to
undulating terrain) the technique can save a considerable amount of
money. However, where vegetation mosaics are complex, and the terrain
rugged then computer processing may be more expensive and yield less
useful data that would aerial photography and field trips.
The imagery is available at a variety of scales although there is often an
unacceptable loss of discrimination at scales greater than 1:500 000.
Relatively large scale, say 1:250 000, paper prints can be particularly
difficult to interpret.
Transparencies can be projected by means of an overhead projector and thus
enlarged to a desired scale or alternatively they can be photographed with
slide film and the slide projected onto a glass plate covered with a
tracing film. The image can be enlarged to fit a base map of a particular

- 20 -
chosen scale and areas of interest can then be outlined with ease. It
should be remembered however that this may also cause demarcation of
spurious cover types.
In spite
defining
studies.
forestry.
vegetation
of these constraints Landsat has been extremely useful in
areas of particular characteristics in a large number of
In particular are studies which relate to agriculture and to
It should be borne in mind that in both these instances the
types of interest have been uniform or of only a few species.
Images can be enhanced or improved in various ways, for example, problems
of rugged terrain can be overcome by extensive ground truthing and in part
by band ratioing as used by Newby (1985). These enhancement techniques
increase the accuracy of point locations and thus of mapping, improve
boundary definitions and emphasise differences between selected cover
types.
The imagery is best at scales smaller than 1:250 000. It is particularly
good at a scale of 1:1000 000. Each project goal must be considered
separately when deciding upon the scale of imagery desired.
2.4.2 SPOT Imagery
The SPOT (Systeme Probatoire d'Dbservation De La Terre) satellite was
launched in February 1986. The satellite operates as a commercial
venture. Imagery is available in South Africa only through the satellite
remote sensing centre at Hartebeeshoek.
The SPOT satellite is in a circular orbit at a nominal height of 830km
with a cycle of 26 days. Vertical images for a given area can be
collected every 26 days. If use is made of the side-looking facility then
images for a given area can be collected every +/-3 days. This greatly
improves the chances of obtaining a cloud free image, The image is system
corrected and may provide some advantage over a vertical image in rugged
areas since it allows greater penetration of valleys.
- 21 -
Data are available in various formats ie panchromatic, 3 band
multispectral FCC prints and transparencies and as CCTs. At the time of
writing there were no processing programmes for SPOT data outside the
satellite remote sensing centre, although in the near future, several
universities, in particular Natal and Cape Town should have processing
suites available.
SPOT imagery has immense promise, particularly for visual interpretation.
Resolution has been improved from Landsat's best (30mx30m using the
thematic mapper) to lOmxlOm in the panchromatic mode. The SPOT
multispectral mode imagery has a resolution of 20mx20m and a fusion of the
two modes is possible with a resulting resolution of 15mxl5m. Nominal
ground coverage of an image is 60kmx60km. Simulated SPOT multispectral
imagery in visual terms "comes close to taking the place of 1:40 000 and
1:50 000 colour infra-red photography" (Colwell and Poulton 1985). A
particular advantage of this imagery is its potential to show slight
variations in canopy cover over flat to undulating ground. The infrared
component of the imagery is extremely sensitive to plant cover and this
sensitivity, coupled with its extreme low sensitivity to soil allows
disruptions of cover to be readily recognised.
The images can be obtained as precision-corrected or system-corrected
images. This means that the displacement of ground points which is
apparent in aerial photography is removed and thus the image allows direct
and accurate measurements of area. This represents an enormous saving in
time and an improvement in accuracy. It also obviates the need for access
to expensive equipment This saving may far outweigh the cost of initial
purchase of SPOT imagery. It is too early to say whether or not SPOT will
fulfill all its potential but the early results are startlingly good.
A 1:100 000 FCC for example, so clearly shows woody vegetation and
agricultural land boundaries that cover types of interest can be digitised
directly from the print into a data base. Comparisons and other data
interrogations can subsequently be readily carried out.
- 22 -
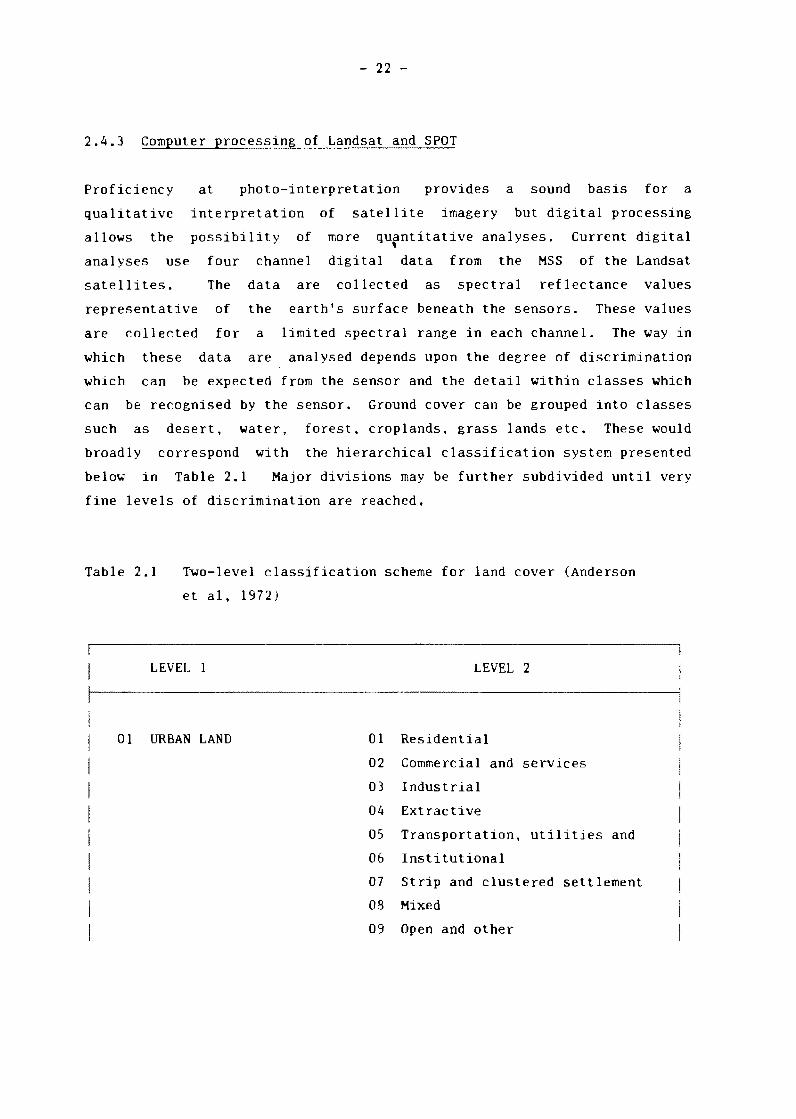
2.4.3 Computer processing of Landsat and SPOT
Proficiency at photo-interpretation provides a sound basis for a
qualitative interpretation of satellite imagery but digital processing
allows the possibility of more qurntitative analyses. Current digital
analyses use four channel digital data from the MSS of the Landsat
satellites. The data are collected as spectral reflectance values
representative of the earth's surface beneath the sensors. These values
are collected for a limited spectral range in each channel. The way in
which these data are analysed depends upon the degree of discrimination
which can be expected from the sensor and the detail within classes which
can be recognised by the sensor. Ground cover can be grouped into classes
such as desert, water, forest. croplands, grass lands etc. These would
broadly correspond with the hierarchical classification system presented
below in Table 2.1 Major divisions may be further subdivided until very
fine levels of discrimination are reached.
Table 2.1 T~o-level classification scheme for land cover (Anderson
et al, 1972)
LEVEL 1 LEVEL 2
01 URBAN LAND 01 Residential
02 Commercial and services
03 Industrial
04 Extractive
05 Transportation, utilities and
06 Institutional
07 Strip and clustered settlement
08 Mixed
09 Open and other

- 23 -
02 AGRICULTURAL LAND 01 Cropland and pasture
02 Orchards, groves, vinyards
and horticulture
03 Feeding operations
04 Other
03 RANGELAND 01 Grass
02 Savannas (Palmetto prairies)
03 Chaparral
04 Desert shrub
04 FOREST LAND 01 Deciduous
02 Evergreen (coniferous)
and other
03 Mixed
05 WATER 01 Streams and waterways
02 Lakes
03 Reservoirs
04 Bays and estuaries
05 Other
06 NON-FORESTED WETLAND 01 Vegetated
02 Bare
07 BARREN LAND 01 Salt flats
02 Reaches
03 Sand other than beaches
04 Bare, exposed rock
05 Other
08 TUNDRA 01 Tundra
09 PERMANENT SNOW AND 01 Permanent snow and icefields
ICEFIELDS
- 24 -
These levels of discrimination are dependent upon the characteristics of
the cover type such as its homogeneity, its variable signature through the
growth cycle and the terrain. It is these qualifications which can induce
problems and which should be well understood before a computer analysis is
begun, In Natal, Brough and Bromley (1984) found that visual
interpretation of a Landsat FCC yielded greater accuracy than computer
analysis, 79% vs 84%
The fynbos biome map produced by computer processing of a CCT relied
heavily on existing photographic imagery and in particular on a
comprehensive knowledge of the region by the researchers (Bossi and Moll,
1985). The indications from the literature were that computer processing
in this study would not have yielded the information sought, for reasons
of vegetation complexity, terrain dissection and scale.
Image enhancement is part of the process of computerised image
processing. Visual analysis of a photographic product is improved or
enhanced by this process and it improves the accuracy and speed of human
visual interpretation.
2.4.4. Space Shuttle Large format Camera
This imagery is briefly mentioned because of its potential when shuttle
missions are re-established. The imagery is obtained using a large format
camera of 23cm x 46cm The processed negatives can be used to produce
prints at a desired scale. The imagery would be available in panchromatic
as well as colour formats. The scale at which the image is produced is
dependent upon the orbital height of the shuttle. Doyle (1985) notes that
when enlarged it should be expected to perform at least as well as high
quality aerial photography of the scale of 1:40 000. The advantage of
this imagery is that it is cheap, readily reproducible and large areas can
be covered by a single image Each image represents a ground area of
178km x 356km
- 25 -
2. 5. THE SELECTION OF IMAGERY
The selection of imagery depends upon the scale at which cover is to be
mapped and the nature of the terrain. This has a profound effect on the
visibility of cover pattern, particularly with regard to satellite
imagery. It is the responsibility of the researcher to acquaint himself
with the strengths and weaknesses of the various imageries and to evaluate
his own expertise in the various methods of interpretation. These factors
should be weighed against time, funds and the objectives to be fulfilled.
Often, after consideration of these points there is little choice
available.
Very careful consideration should be given to the standard aerial
photographic products before embarking on a programme using space platform
imagery. Space platform imagery is expensive and has, in vegetation
studies dealing with complex mosaics of species and age structure, severe
limitations. Jarman et al (1981) point out that although success was
achieved in mapping the marsh vegetation communities at the Langebaan
lagoon, "Marsh communities tend to grow in single species stands, giving a
greater degree of homogeneity within types. The marsh area is also flat
and featureless. There was no confusing spectral information introduced
due to topographic features." Complex mosaics and rugged terrain can
inhibit delineation of vegetation boundaries and recognition of vegetation
types and thus prejudice the accuracy of mapping, particularly at scales
greater than 1:500 000. Tupper (1981) also concluded that there were
considerable problems associated with Landsat mapping where species mix
and soil backgrounds vary. Many authors, for example Jensen (1983) and
Brough and Bromley (1984), have emphasised the desirability of specialised
training before embarking on a computer processing programme.
SPOT imagery is well suited to visual interpretation and at the smaller
scales of about l:100 000 it provides good results in many instances
allowing interpretation of landcover to Anderson's (1972) level 2. It
would be cost effective in many surveys especially over large areas since
the mapping time is greatly reduced and accuracy greatly increased.
- 26 -
Whatever imagery is
subsequently produced.
chosen, its usefulness depends on the maps
Some general considerations when mapping are
presented in the following section:
2.6 MAPPING FROM REMOTELY-SENSED IMAGES
Sophisticated mapping requires considerable investment in specialised
equipment and skills. If accurate and detailed maps are required it may
be most cost effective to contract out the work to a specialist. This is
particularly so at the larger scales. For botanical studies the larger
scales, detailed (1:10 000) and ultra-detailed (1:500 and larger) are most
appropriate (Aldred and Sayn-Wittgenstein, 1972; Edwards and Jarman
1972). The inadequacy of standard aerial photo's and satellite imagery
was also clearly demonstrated in this study. Satisfactory maps of limited
detail can, however, be drawn using the techniques which follow.
2.6.1 Mapping of Space Platform Imagery
Mapping from space platform imagery is relatively simple. If maps are to
be drawn visually then a geometrically corrected image can be purchased
from the
be simply
available
satellite remote sensing centre. Vegetation-type boundaries can
traced from these images. The precision corrected images
are so accurate that they may be used for the direct production
of photogrammetric maps.
If maps are computer-drawn
coordinates are located on
computer. A correct map
digitiser or directly from
are particularly useful.
the process is again simple. Reference
the imagery and on the base map used by the
can then be drawn automatically by use of a
a CCT. As already discussed SPOT FCC images
- 27 -
2.6.2. Mapping of Aerial Photography
The scale (S) of the aerial photograph is determined by the focal length
(f) of the camera lens and the flying height (H) of the aircraft :-
Where:-
s = f
H-h
S = scale
f focal length
H = flying height
h = height of object or surface above datum
The scale is an important consideration. The conventional range of scales
commonly used has been recommended by the Botanical Research Institute
(Edwards and Jarman, 1972). These are:-
1) Ultra detailed 1:500 and larger
2) Detailed 1 : 10 000
3) Semi detailed 1: 20 000 and 1:50 000
4) Reconnaissance 1:250 000
5) General reconnaissance 1:1000 000
Satisfactory maps of considerable accuracy can be drawn from the standard
aerial photography products of the Department of Survey and Mapping using
a variety of techniques. Each technique is subject to its own errors. It
should be remembered that vegetation boundaries are rarely easily and
accurately defined. Error was frequtntly introduced in this study during
the subjective decision making as to where a vegetation boundary actually
lay. Since this is so, it may often be unnecessary to use extremely
sophisticated equipment to map to photograrnmetric precision.
Unconventional photography can be used to produce reasonably acceptable
maps provided care is taken to include locatable reference points from the
map base in the photographs. Cover types can then be mapped by inspection
or by using a transfer scope such as the Bausch and Lomb Zoom Transfer
Scope.
- 28 -
It should be remembered that the scale of aerial photography is a nominal
scale only, calculated for a given datum. Over flat ground this factor
may be constant but over mountainous terrain the tops of mountains and the
bottoms of valleys may fall well outside the datum and thus be at quite
different scales. Adjacent photographs and strips may also be at
different scales due to changes in altitude of the aircraft resulting from
turbulence and varying pilot skills. The scale for each photograph used
in a study should therefore be calculated using the formula:-
photo scale map distance x map scale
photo distance
When
the
using
effect
aerial photographic products the researcher should be aware of
of the focal length of the camera lens on the relative
visibility or frequency of recording canopy cover and the ground. Howard
(1970) points out that for the same scale photography and for trees at the
same distance apart the base of trees is more frequently recorded using a
lens of longer focal length. Smith et al (in Howard 1970) found that when
measuring the closure of tree crowns and the height of the trees,
photographs taken using a 12" lens were preferable to photographs of a
similar scale taken using a 6" lens. Knowledge of the focal length is
also of great importance when using a dot template to measure frequency of
particular cover types.
Single aerial photographs are useful in the field where actual boundaries
can readily be related to boundaries and features on the photograph.
Single members of stereo pairs may be assembled into a photo mosaic and
the mosaic used as a basis for a working map. In some situations,
particularly when the terrain is flat, adequately accurate maps which can
be used to monitor relative changes in vegetation can be traced. The area
must fall within the central portion of the photograph since point
displacement increases towards the edge.
Alternatively,
coloured wax
vegetation
crayon or
boundaries can be marked on photographs using
felt-tipped marker and then transferred by
inspection onto a transparent overlay over a topographical map of an
appropriate scale.
accurate.
Accuracy can
photographs.
be
This
laboratory or with
allow perception of
- 29 -
This method is relatively quick and may be acceptably
considerably improved by using stereo pairs of
is particularly important when working in the
an area which is not intimately known. Stereo pairs
great detail and considerably improve interpretation
in vegetation community studies. On rugged terrain it is essential to use
stereo pairs if any reasonable accuracy is to be achieved in mapping.
Although it is possible to draw maps using stereo pairs and to transfer
vegetation boundaries to an overlay on a topographical map, superior
accuracy can be achieved using one or other of the planimetric methods
which follow.
2.6.2.1.
by Howard
depending
less than
Planimetric Mapping: Details of techniques are described
(1970).
upon the
1:10 000
Ecological maps can be produced at a range of scales
application.
and Howard
Few details can be shown at scales of
(1970) suggests scales of 1:10 000 and
larger are necessary for detailed vegetation analysis and mapping. Most
of the standard aerial photo products available from the Department of
Survey and Mapping are at scales of 1:50 000 and smaller.
A Hilger and Watts radial line plotter was found to produce accurate maps
when used in conjunction with a topographic map. Similar instruments of
other makes are available. A particular advantage of this kind of
instrument is that it allows a map to be drawn on an overlay over the
standard 1:50 000 topographical map. The scale difference which may be
present in adjacent pairs of photo~raphs is readily accommodated by means
of the pantograph attached to the plotter and an accurate map of a
constant 1:50 000 scale can be drawn from any of the readily available
aerial photography. Maps of larger scale can be drawn using the
instrument but these do not have available the reliable control provided
by the 1:50 000 maps and therefore are less accurate.
Use of a machine of this type is highly recommended particularly since the
photographs are viewed in stereo during the mapping process.
- 30 -
The Bausch and Lomb Zoom Transfer Scope (ZTS) is a rather more
sophisticated instrument which enormously accelerates mapping. This
instrument superimposes a stereoscopic image of the photography onto a
blank paper base. Vegetation boundaries can be drawn by outlining the
boundaries as they appear on the base sheet. A transparent overlay may
also be used over a topographic map. This method is extremely quick and
accurate. Photographs can be enlarged by the instrument from 0,6x - 16x
and the map to lx, 2x, and 4x actual size giving a range of useful
scales. The stretch facility allows correction of distortion caused by
tilt and relief. McGivern et al (1972) state that '' •••• the accuracy
obtainable with the ZTS can meet (US) national map accuracy standards"
2.6.2.2. Some problems with mapping: It was found in this study
that a major problem associated with the use of aerial photography for
mapping vegetation boundaries over a period of time was the variety of
scales of imagery which must be used. The early aerial photography is
generally at a large scale such as 1:20 000 whilst much of the most recent
is at a scale of 1:55 000 and greater. This means that decisions made at
one scale are not necessarily the same decisions that would be made at
another. A researcher's perceptions of what constitutes a vegetation
boundary, or of what identifies a particular vegetation type, change at
different scales. When the photographs are from several different years
and thus of several different scales it is often not possible to be
accurate as to what constitutes a real change and what is a result of a
change in perception. In many studies therefore it is not cost effective
to attempt to produce accurate maps. Maps to form the basis of a
monitoring programme should be of the greatest accuracy possible. Aerial
photos and satellite images are in future likely to be available at a
variety of scales including the current small scales. Maps could be drawn
using photography of more nearly uniform scale thus eliminating perceptual
problems.
Ideally, in detailed botanical studies, photography should be specially
flown at the required, large scale.
- 31 -
CHAPTER 3
WOODY VEGETATION CHANGE
IN THE LUJIKO AREA:
MAPPING AND FIELD STUDY
As a result of a review of available remote sensing and mapping techniques
two main approaches were adopted to investigate woody vegetation change
for the purposes of this study:
a) Satellite images and aerial photographs were visually interpreted
and vegetation changes mapped and measured using a dot matrix.
b) A field investigation to describe actual change was carried out.
The field study also served to groundtruth (test the validity) of the
interpretations of the imagery.
3.1 Mapping
3.1.1. Aerial Photographs: The 1:50 000 topographical map, Prudhoe
3327AC, was obtained for the study area (Figure 1 at the back of this
document). Photographs of the study area were obtained for a range of
years and at a range of scales as available from the Department of Survey
and Mapping. These were as follows:-
Year
1938
1956
1973
Nominal Scale
1: 20 000
1: 30 000
1: 50 000
Stereo pairs of the relevant photographs were purchased. Mapping was
carried out for the years 1938, 1956 and 1973 these being the only years
for which photography of a useful scale was available.
- 32 -
Mapping of aerial photographs was initially carried out manually using the
Arundel method (Howard, 1970). This provided reasonably accurate results
when carried out with the aid of the standard 1:50 000 base map but proved
to be extremely time consuming and not cost effective. Accuracy and speed
were considerably improved by the use of a Hilger and Watts Radial Line
Plotter. Planimetric maps were drawn using the standard 1:50 000 sheet as
a base map. This was used to correct drift away from reference points.
Nominal scale was calculated for each of the photographs. Scale variation
was accommodated by adjustment of the pantograph of the plotter so that
reference points on each pair of photographs coincided with the same
points on the base map. Maps for aerial photo's were produced at a scale
of 1:50 000 and are presented as Figures 4.4 to 4.6 in the next chapter
(Chapter 4).
3.1.2. Landsat: Computer processing of Landsat computer compatible
tapes (CCT's) was considered inappropriate because of the degree of
expertise necessary to extract the best results from the processing.
Visual interpretation was the alternative and therefore a false colour
composite (FCC) transparency of scene ID22169 WRS182-83 for 30 December
1980 was obtained. This was at a scale of 1:1 000 000. A 35mm colour
slide of the study area on the FCC was made using a macro lens. This was
projected in a darkened room onto a plate glass sheet to which was affixed
a tracing film bearing a base map traced from the 1:50 000 topographic
map. The size of the image was adjusted using a zoom lens until it
matched the base map. This represented a 1:50 000 Landsat image of the
study area. Areas of different hue were then outlined on the tracing
film. Eighteen apparently different cover types could be recognised.
Several maps were drawn with varyine degrees of aggregation of apparently
different areas. The aggregation decisions were based on the results
obtained from aerial photography interpretation which were confirmed
during two field trips to the area. Field trips took place during the
actively growing season in early May 1986 and 1987 These maps were
produced at 1:50 000 and reduced maps are presented as Figures 4.1 and 4.2
in the next chapter (Chapter 4).
- 33 -
3.1.J SPOT:
360878T 13S-417)
The SPOT FCC paper image for February 1988 (SPOT
at a scale of 1:100 000 was interpreted visually. The
image
areas
(Figure
was of
of woody
4.3 in
for
SPOT
overlay
sufficiently good quality to allow a direct tracing of the
vegetation to produce a map at a scale of 1:100 000,
the next chapter). A 2x enlargement gave a map suitable
over a standard topographic map at a scale of 1:50 000. The
map was superior in every way to the Landsat map. In particular it
required only a fraction of the time to produce.
3.2. Dot Sampling
The same aerial photographs as used for the mapping were sampled by means
of a dot matrix template using the method of Wilson (1949}. This method
is described below:
The minimum number of samples (dots} required was calculated using the
formula (Wilson 1949):-
N (100-P)38 400
P(AE) 2
N number of dots
P assumed percentage of the study area occupied by the
cover class of interest
AE = acceptable error in per~ent (0,05)
Note: 38 400 is derived from the statistical standard 1,962 x 100 2 to
fix probability
It was assumed that the cover classes of interest occupied more than 10%
of the total study area. This was greater for the woody vegetation
categories but assumption of a lower area than actually present corrected
the possibility of under sampling. Acceptable error was taken to be 10%.
- 34 -
Thus, the number of dots required to sample the study area is calculated
as follows:
N ~ (100-10)38 400
10(10) 2
N 3 456
Number of dots required per photo 3 456
Therefore, for each year:
Year
1938
1956
1973
no. of photos
No. of Photos
144
23
10
Dots per Photo
24
150
320
It was important that the same areas were not sampled twice in adjacent
photographs. It was therefore necessary to ensure that the dot template
sampled only the central area of each photograph. Assuming the use of
standard 230mm x 230mm photographs with a 60% overlap along the strip and
30% overlap between strips, this effective sampling area will measure
approximately 160mm x 90mm. As pointed out by Wilson, (1949) however, the
overlap on rugged terrain may vary very substantially and therefore the
template
115mm X
dimensions
65mm.
should be further reduced to approximately
These dimensions were proportionately reduced to
accommodate variations from the standard photograph size in the case of
the 1938 photography.
The dot template was drawn on an acetate sheet and dots spaced evenly over
the template, The template was overlaid on the centre of each photo in
turn, orientated so that the long axis of the template was perpendicular
to the flight line. The cover type on which the dots f e 11 was then
recorded. The ratio of the dots falling on any particular cover type to
- 35 -
the total number of dots within the boundaries of the study area,
represented the percentage of that cover type.
3.3 Field Methods
3.3.1 Ground Truthing: Field verification or ground truthing is an
essential component of any remote sensing study (Hoffer, 1971). In this
case it was of particular importance since the images showed only slight
changes in area of woody vegetation. Common sense suggested that a large
community utilising a woody vegetation resource would have had a greater
impact on that resource. In fact field observations showed that whilst
there were not substantial changes in area there were considerable
differences in physiognomy and community structure between high impact and
low impact areas. These were not visible on the images.
Ten sites were selected in the Fish River valley These were selected by
means of a grid overlay on the woody vegetation maps. All sites had been
correctly interpreted. Ten additional sites across the map were selected
in a similar manner. In four of these sites, green grass and
Phragmites beds in narrow river valleys had been incorrectly
classified as woody vegetation.
3.3.2. Fuelwood size: Timber in two fuel wood piles at different
and separated households was measured. The lengths and average diameters
of 30 poles pulled at random out of each of the piles were measured. This
was done to obtain some broad guidelines as to the fuelwood size and
species preferences. Since this wood had been purchased it was assumed
that people would only buy preferred species. The size guidelines were
used to select the sizes of stems to be quantified on the transects.
These data would give an indication of the present capability of the
nearby woody thicket to provide fuelwood.
3.3.3.
using
slope.
Vegetation Transects: Slope of the study sites was measured
an Abney level. Two transects of 100m x 2m were surveyed on each
All woody stems greater than 5cm circumference at 30cm above
- 36 -
ground were identified. Basal area and height were also measured. Two
additional transects were surveyed measuring only those stems greater than
5cm diameter and longer than 200cm as these stem sizes reflected the
composition of stems found in local wood piles. The following data were
collected from all transects:-
Species
Basal area
Height
3.3.4. Profile Diagrams: One 26m x lm profile was drawn for each
slope. These
4.9. Profile
displaying the
sites.
were drawn to scale and are presented in Figures 4.8 and
diagrams were chosen as a quick and effective way of
great differences between the high impact and low impact
Results obtained from the above-descibed mapping and field study are
presented and discussed in the following chapter.
- 37 -
CHAPTER 4
RESULTS AND DISCUSSION
4.1 INTRODUCTION
This study was not intended to define or to describe the detailed
vegetation community structure of the study area. Logistical problems
associated
mitigated
with budgetary constraints and distance to the study site
against extensive field work. The aim of the study was two
fold. Firstly, to ground truth the maps drawn from the various imageries
and secondly, to obtain an indication of the severity of human impacts on
woody vegetation which were not apparent on the remotely sensed images.
Consequently a transect sampling method was used. This was limited to
three 2x100metre transects at each site. The total sampling area at each
site was therefore 600m 2• This is considerably less than required for a
meaningful statistical analysis and classification. Cowling (1984),
determined an optimum plot size of 10m x 10m in his study area which
included Kaffrarian Thicket. This size gave a compromise between effort
expended and information gained and yielded 50% of the species present in
one hectare. The same plot size was also used by Palmer (1981) and by
Everard (1985).
his study was
level of the
Even at this intensity of sampling, Everard stated that
not intended to accurately classify the vegetation at the
association but rather with the characterisation of the
floristic variation.
4.2 WOODY VEGETATION HAPS
1:50 000 maps were drawn from the satellite images and from the aerial
photographs as described in the previous chapter. These maps have been
reduced to A3 size and are presented as follows:
Maps drawn from Landsat images:
Figure 4.1
Figure 4.2
Map drawn from SPOT image:
Figure 4.3
- 38 -
Maps drawn from aerial photographs:
Figure 4.4
Figure 4.5
Figure 4.6
The land cover type of significance to this study is principally that of
the closed canopy (CC) woody vegetation. Riverine vegetation was not
drawn on the maps made from the 1956 and 1973 aerial photography because
at the scale of the photography this appeared of little significance
forming little more than a thin dark line on the photograph. Dune thicket
communities along the coast were mapped from the satellite images but not
from the aerial photographs since this region fell outside the study area
and photographs were not purchased to cover it.
4.2.1. Satellite maps
4.2.1.1. Landsat: Two visually interpreted and manually drawn maps
taken from the image discussed in the text are presented. The first is
Figure 4.1 showing all 18 recognisable areas of different hue. This map
clearly shows the subtropical thicket, Everard's Inland Kaffrarian
Thicket, of the Fish River. The boundary of this vegetation zone
correlates well with that shown on the 1:50 000 topographic map and
corresponds to the upper contour boundary between the valley slopes and
the undulating, grass-covered upland. Ground truthing showed that many
areas identified on this map as cover types 1 and 3 were also woody
vegetation. In Figure 4.2 therefore, these areas have been combined and
it is this second map which most clearly represents the woody vegetation
distribution. These additional areas of vegetation differed in density,
height and species composition from the Fish River valley thicket but the
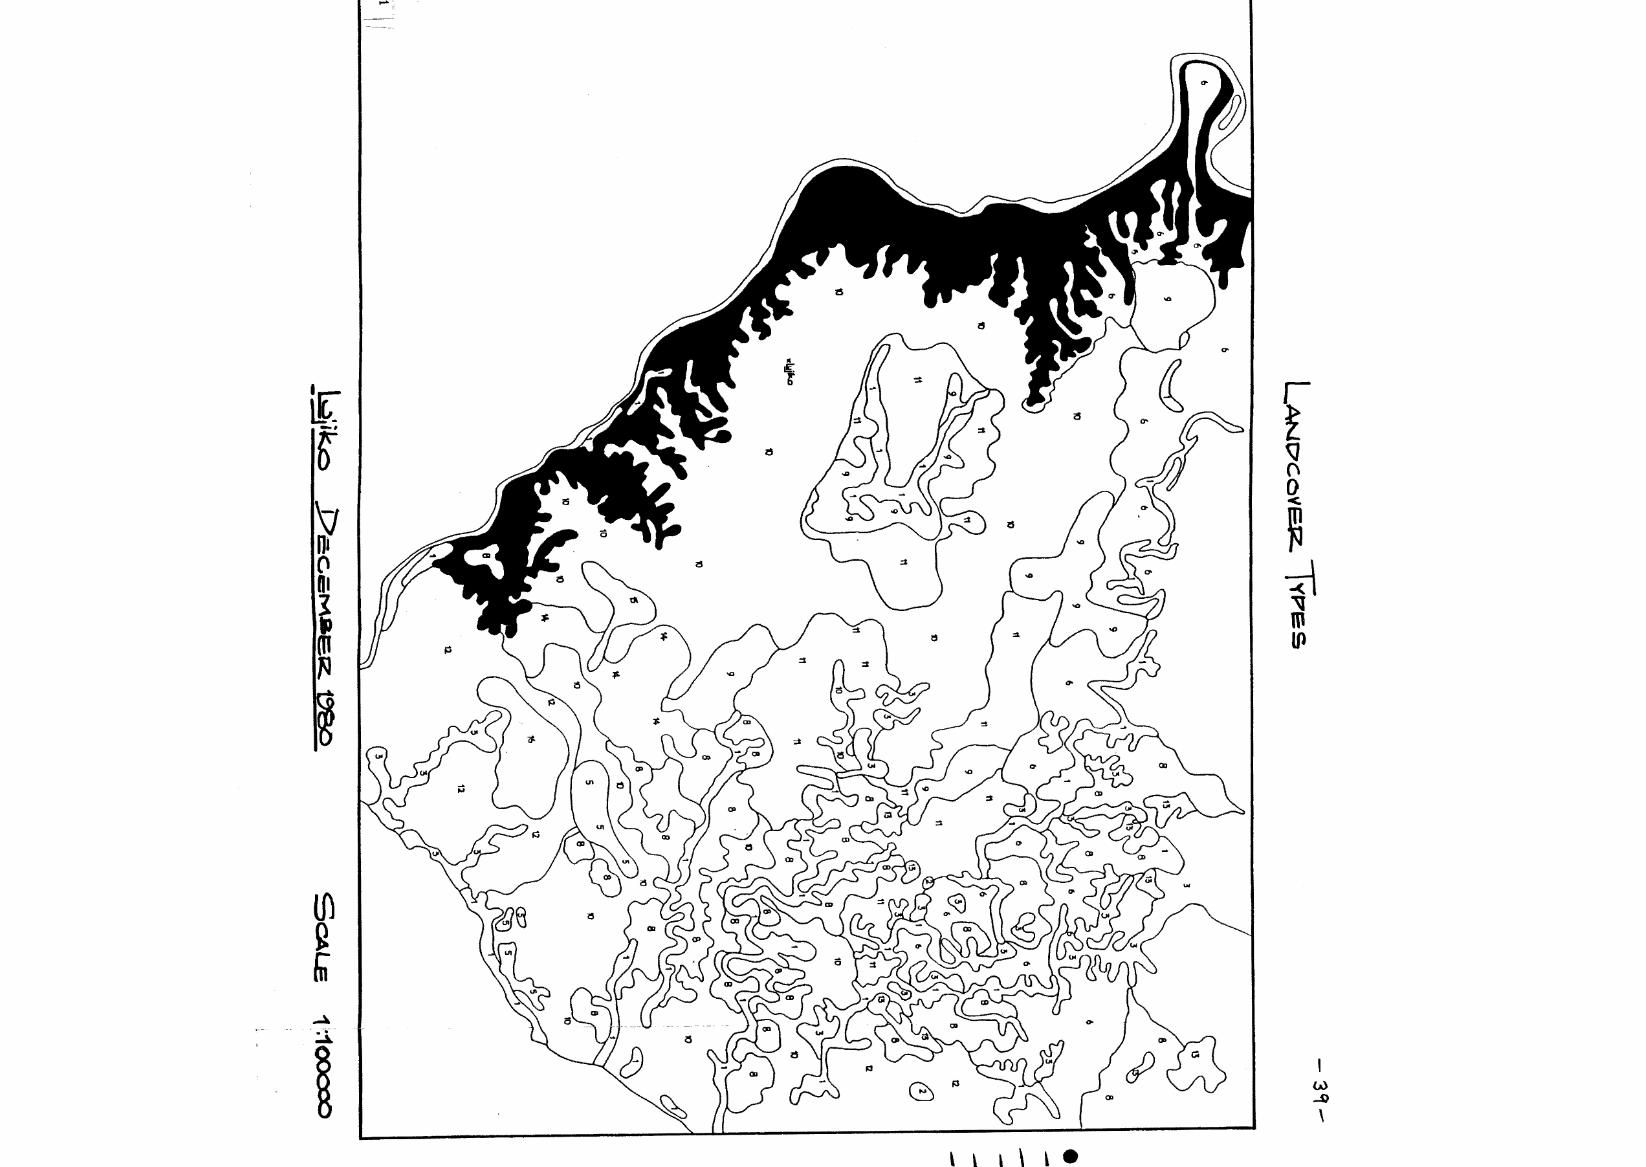
{
LM
JD'cove:iz. T
vP
es
-3
9-
ke.:,·": •
R".ra
T /W
ot::Dl.A
""'7' -
Aq
rjo.L
.~ /c, eA
~&
;P'
-'1
~
-C
iRA
e&LA
,-.p wrrw Troses
-SC
Al'fl=a:l!!P' H
.eiTATI'c::N
12
-.S
a,rta
MB
NT
cJ
Fig
ure
4
.1
-~ik
.o
J:?
e<
:,c::M
AE
IZ.. e
eQ
S
CA
Le
1 :~1ooo:x:,
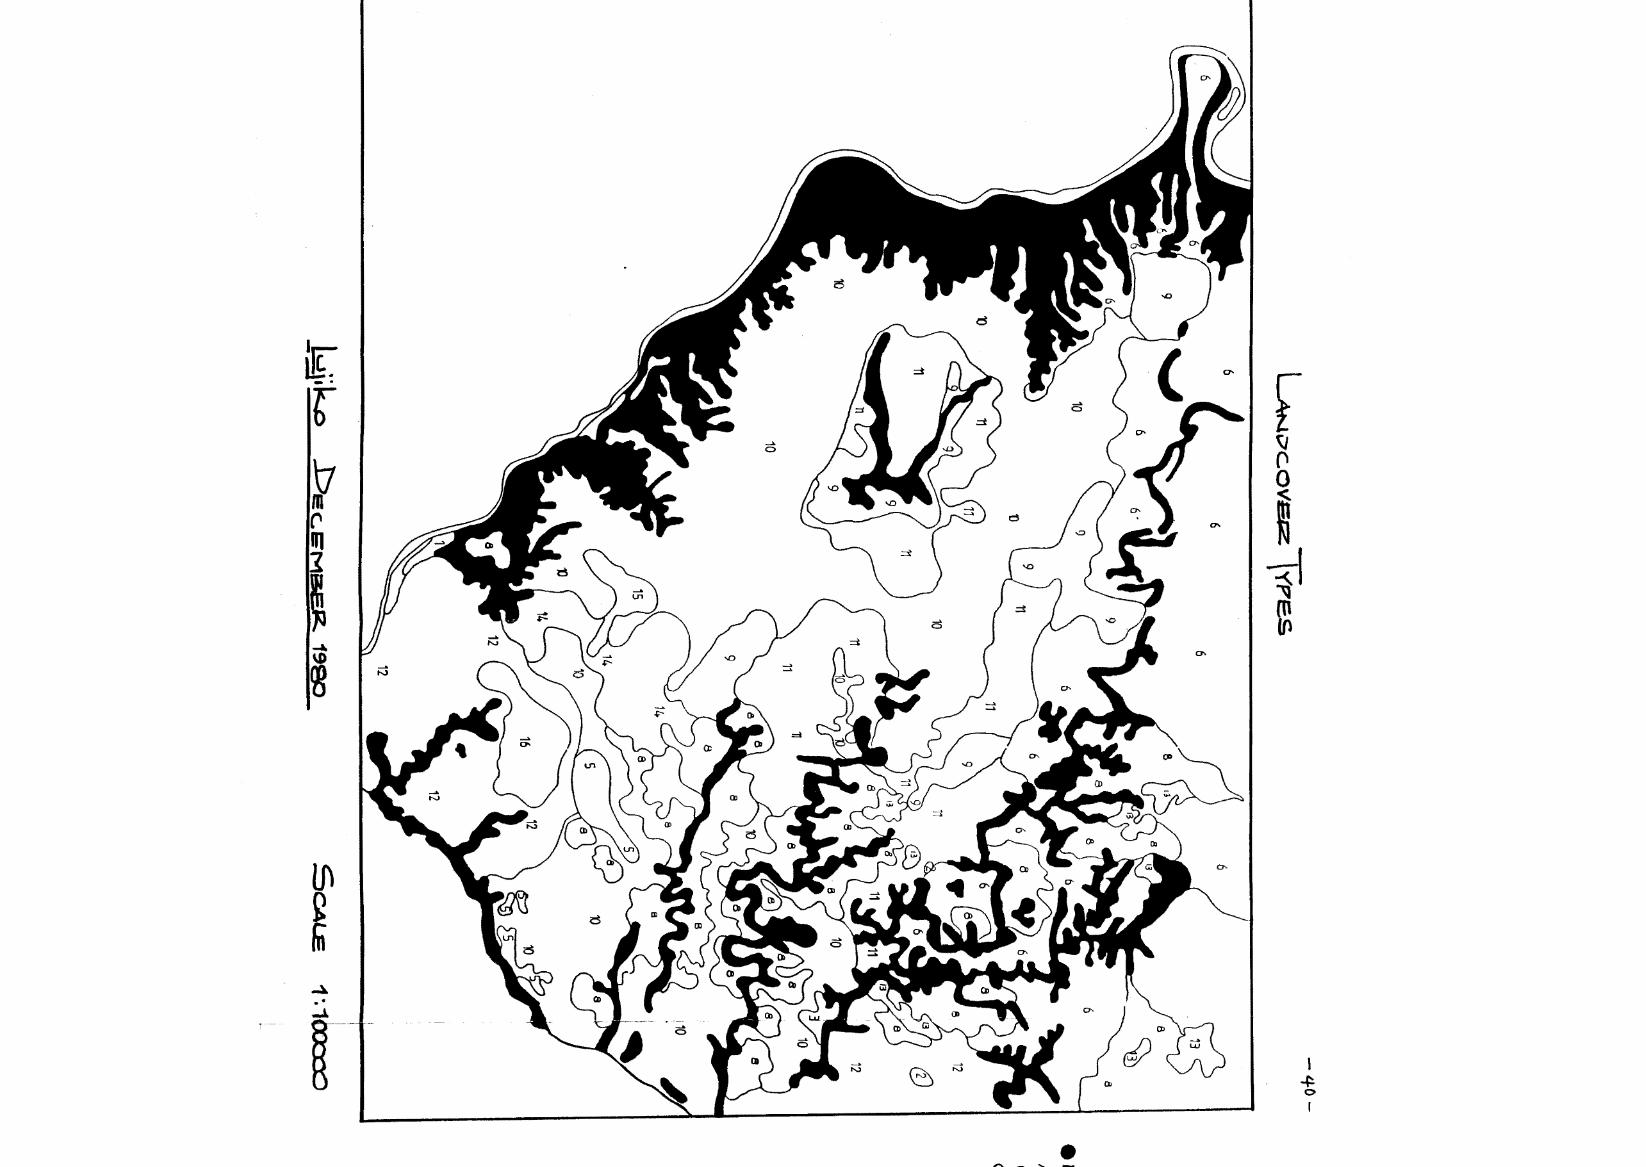
~vC
.OV
&P
"
\ '(PE
.S
6 6
6
fi)gure 4 .•. 2
~~
k.,o
J:::>
ec..1
:Ma
.eg
.. 19
8')
SC
AL
E
-4
0-
12 cD
I I
1 ·.1C:XXXX:,
ke:..Y:
• fiia
:&&
T /~~
Ac;r,jo. L,,.-..e= /c, .a
AIC
'&P
,
q~
C
tRA
s&L
Ac-.p w
;,,. Tm
es S
CA
l'f&O
!p ~
iTA
Ti'c:N
Se
l'ftSM
BN
T
extent of
this study.
- 41 -
this difference was not measured as it is outside the scope of
Ground truthing showed that some of these areas were
identified as woody vegetation. Notably in narrow river incorrectly
valleys.
classified
green Phragmites beds and agricultural land had been
as woody vegetation. This kind of misclassification of bright
green vigorously growing grass and crops was also experienced by van der
Zel (1988) in his work on the preparation of a forest map for southern
Africa. All 10 sites in the Fish River valley thicket which were used for
ground truth were correctly classified but four of the other 10 sites in
narrow river valleys in other parts of the map were incorrectly identified
as woody vegetation.
Areas of Acacia karoo invasion were not identified on the Landsat map
although they were known to have been present for some years. It is
possible that heavy browsing pressure by goats reduced the green growth
sufficiently to mask its presence. Much of this scrub is covered with
long white thorns which are highly reflective. This factor could be
expected to affect the reflectance characteristics of this vegetation
type.
Small thickets which are found widely scattered over the grassland could
not be identified on this image. The potential contribution of these
thickets to the total fuel resource of the area may be considerable but
most of the thickets are of less than 30m in diameter and therefore fall
well inside a Landsat pixel and cannot be resolved. The variations which
these thickets would introduce into the spectral signature of the
grassland in which they are found could not be recognised visually.
4.2.1.2. SPOT: A map drawn from a 1:100 000 print as described in
the text is presented in Figure 4.3. This map was considerably more useful
in the field than was the Landsat map. Cover types were more readily
recognised and accuracy for a variety of cover types was greater. In
ground truthing no errors in terms of the cover classes of interest were
made except in river valleys. As with the Landsat map, vigorously growing
grasses in narrow river valleys were sometimes classified as woody
vegetation.
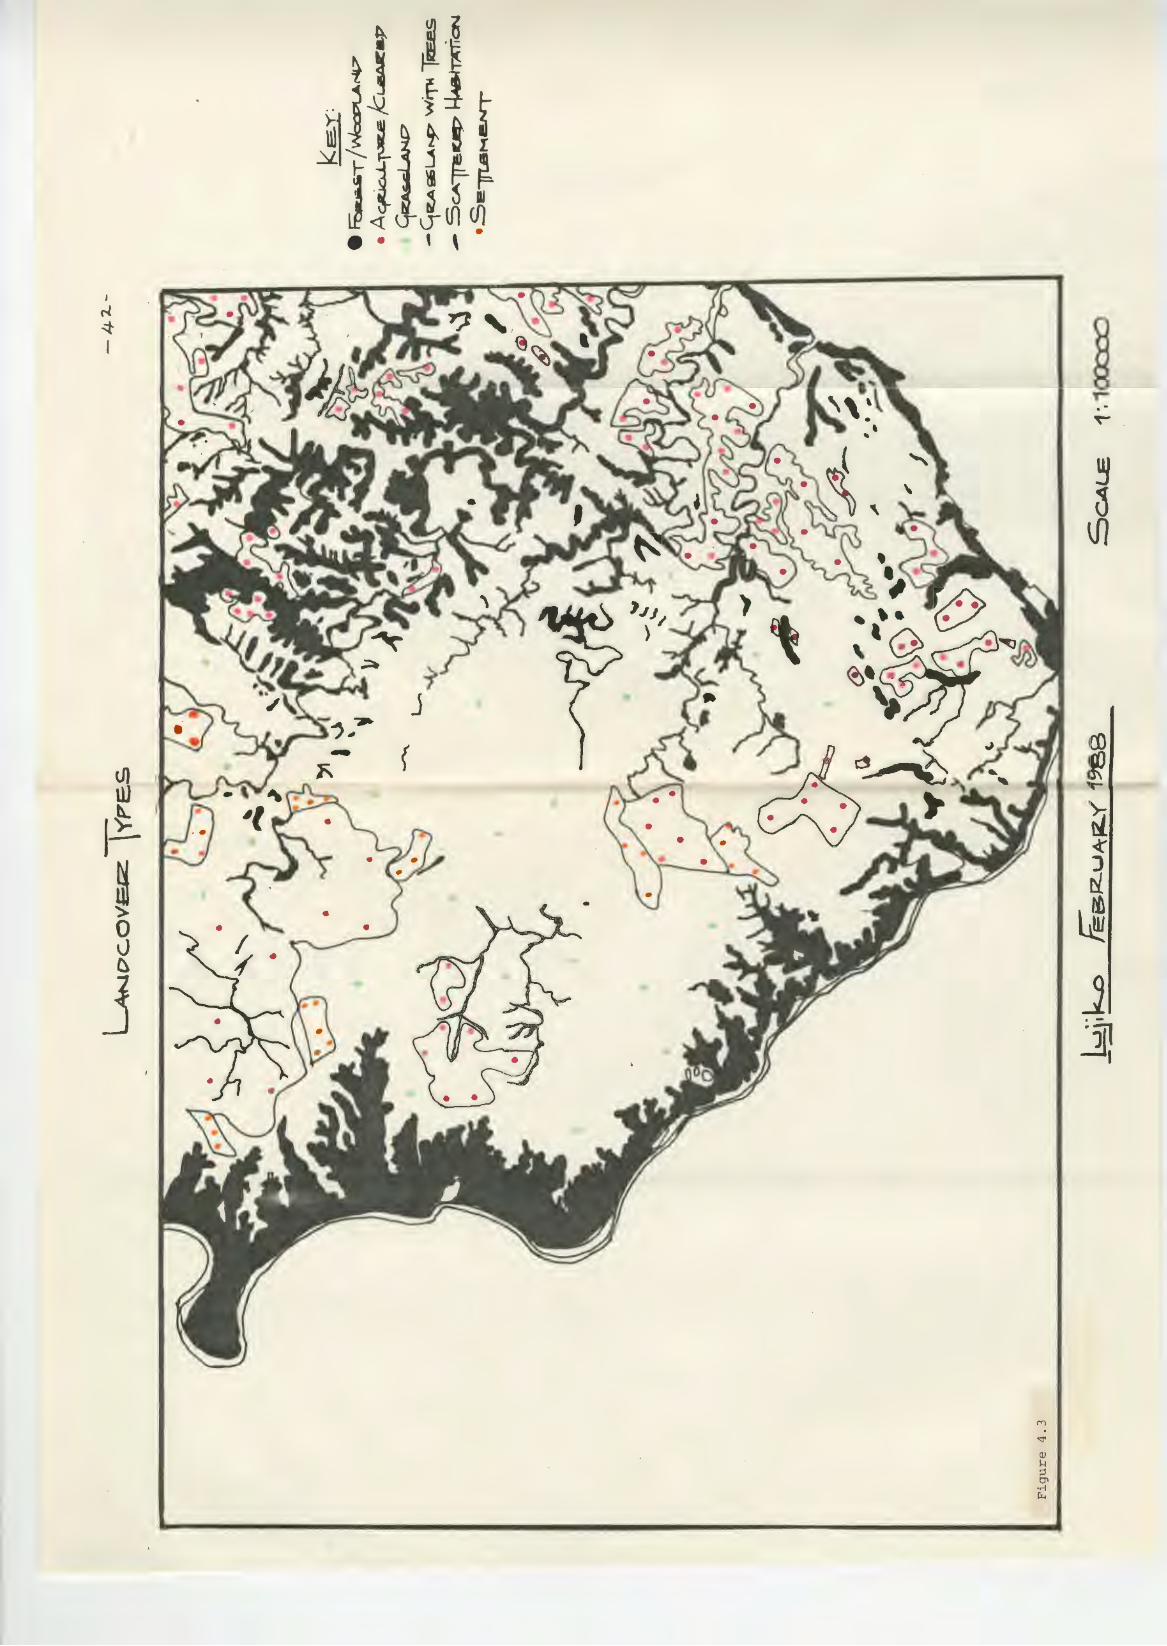
,-.. ~
j J
( C1)
u) f! ll]
~- I
~
.. ~ •
~ < )
• rJ.
0 • ~ u ~
J 1 . -jj1
I
- 43 -
Small dams, roads, sports fields and areas of bare ground were readily
identified. A small Eucalyptus plantation was clearly visible but the
thickets scattered over the grassland were not. Acacia karoo invasion
in the south of the region which could not be seen on the Landsat map was
clearly visible as red-orange blotches scattered over the grassland.
However no difference in the quality of the vegetation on the transect
sites could be seen.
4.2.2. Aerial photograph maps
The three maps drawn from stereo pairs of photographs for the years 1938,
1956 and 1973 are presented in Figures 4.4, 4.5 and 4.6.
Riverine vegetation was drawn on the 1938 map but not on the later maps.
Most apparent change in woody vegetation took place in the years between
1938 and 1956. By 1956 most consolidation of agriculture in this area had
taken place. In the years between 1956 and 1973 a small amount of further
consolidation took place and some areas which had been fanned in the south
of the Fish River valley had been abandoned and subsequently invaded by
scrub. These have in fact been classified as "thinned canopy" on the 1973
map when in fact they are areas of recolonisation. This was verified in
the field. In the extreme north-west of the region a substantial area of
vegetation was cleared. This has been caused by human impacts following
the establishment of a large settlement adjacent to this area. The
thicket vegetation in the Fish River valley otherwise shows little change
in area between 1938 and 1973.
In the east of the region there has been substantial apparent clearance
but this should be treated with a degree of circumspection since it must
be remembered that the photography for this year was of a very much larger
scale than that of 1973.
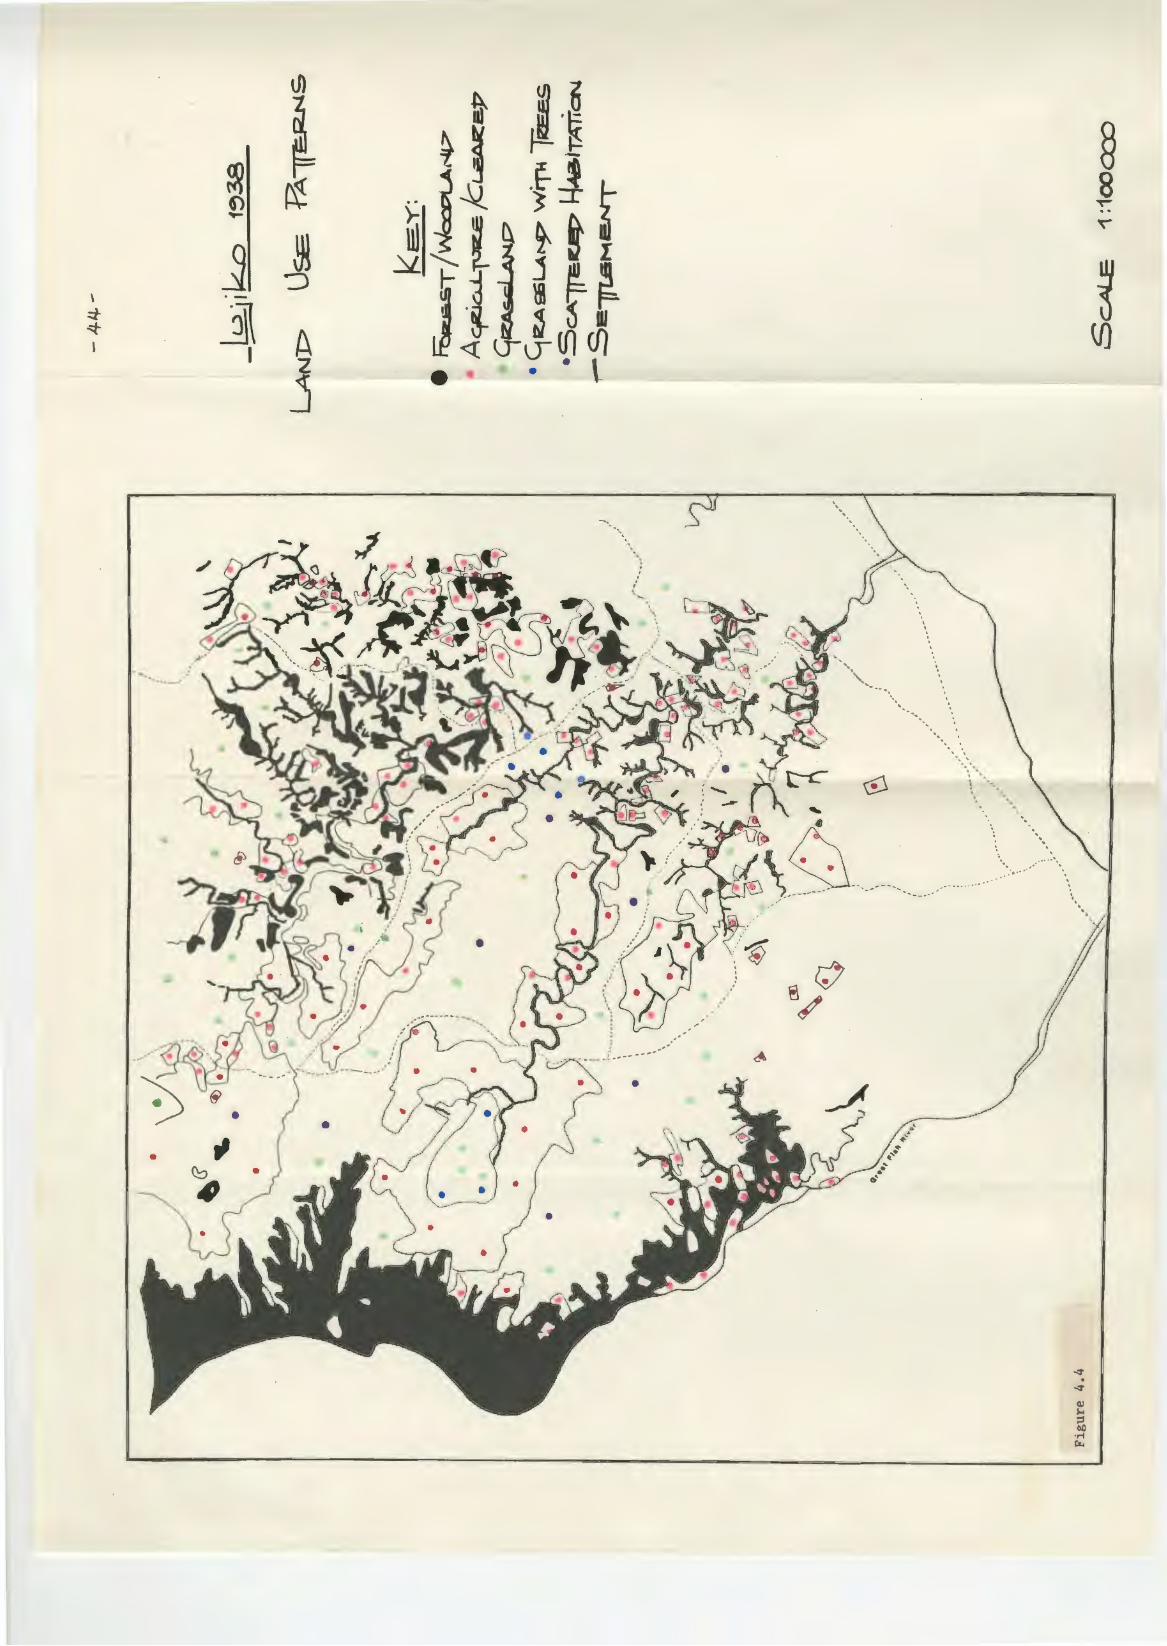
t l·i ~ ·3 :r
ra ltl~tI j J . -
<{ u-'! (!l r j\ I ~
j •
-.
' -. ··- .. ·---~·
•
. · ..
• .. ...... ,
"· -- .. ··•
. ' . . ' . . .
"......... ·. ·. . ·. . .. . ..... " -..
....... . .. ·. ·. •, ........ (\t:-< ~ \ •, ·· ... : ...... . ·. ; - .. ·, · .. . . . . : ('),._ ~· \ .\.
, ,.
. . . .
I>" ••• ••· •• ...... \ \ . -~ ·· ... -----. ____ .---············· .. \. . ,-- . ~.,,,,.,---
§ 8 ~ .. ~
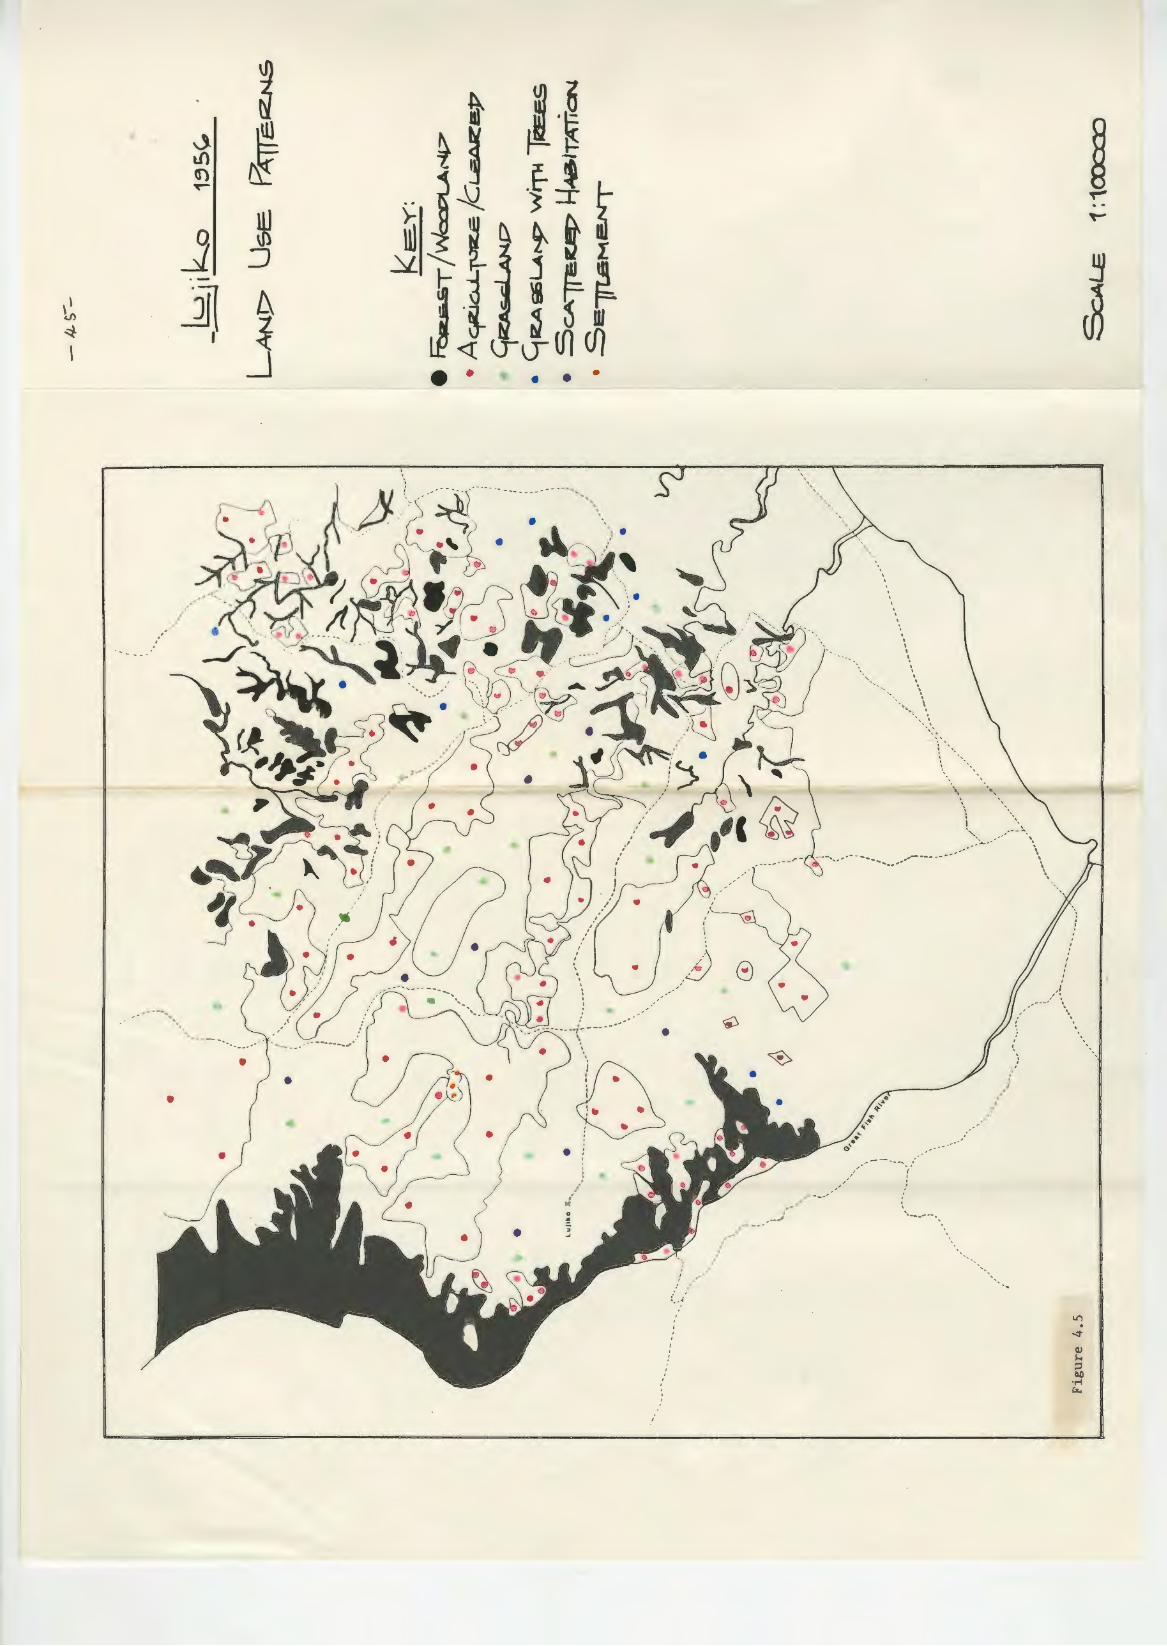
j ·-jJl
. I
---- ......
~- -----
• •
• •
•
------ ..........
• ' ' ..
0
~ ~ ~
•
, ' / ~ ,. . .' / . '
:..1 . I .
I
I
, . I . . I .
. !
' '
_,,,, ... ---
\ . . . . . . • . . • I
' \ \ • . ~. ..
' . ··.,. \ ", .. I
........ '- .. ' .... ~ ' .. ,
I ', \ ...... I '
\\ · .... ,
. ' ' '•, .. i .. --~. '- ,,-·
- - .... _ I ,...... ..,, , I , .
, I , . ,,' , ,. , ,.., --1' \
.".. ,_ ..... ....... • •• J
---.. :!... ....
........
J
'
I . ./
.......... ',
'•
. I .
. I . .
I I I . .
,I '. ' . ,.., ... --" "\ .. . .
,-
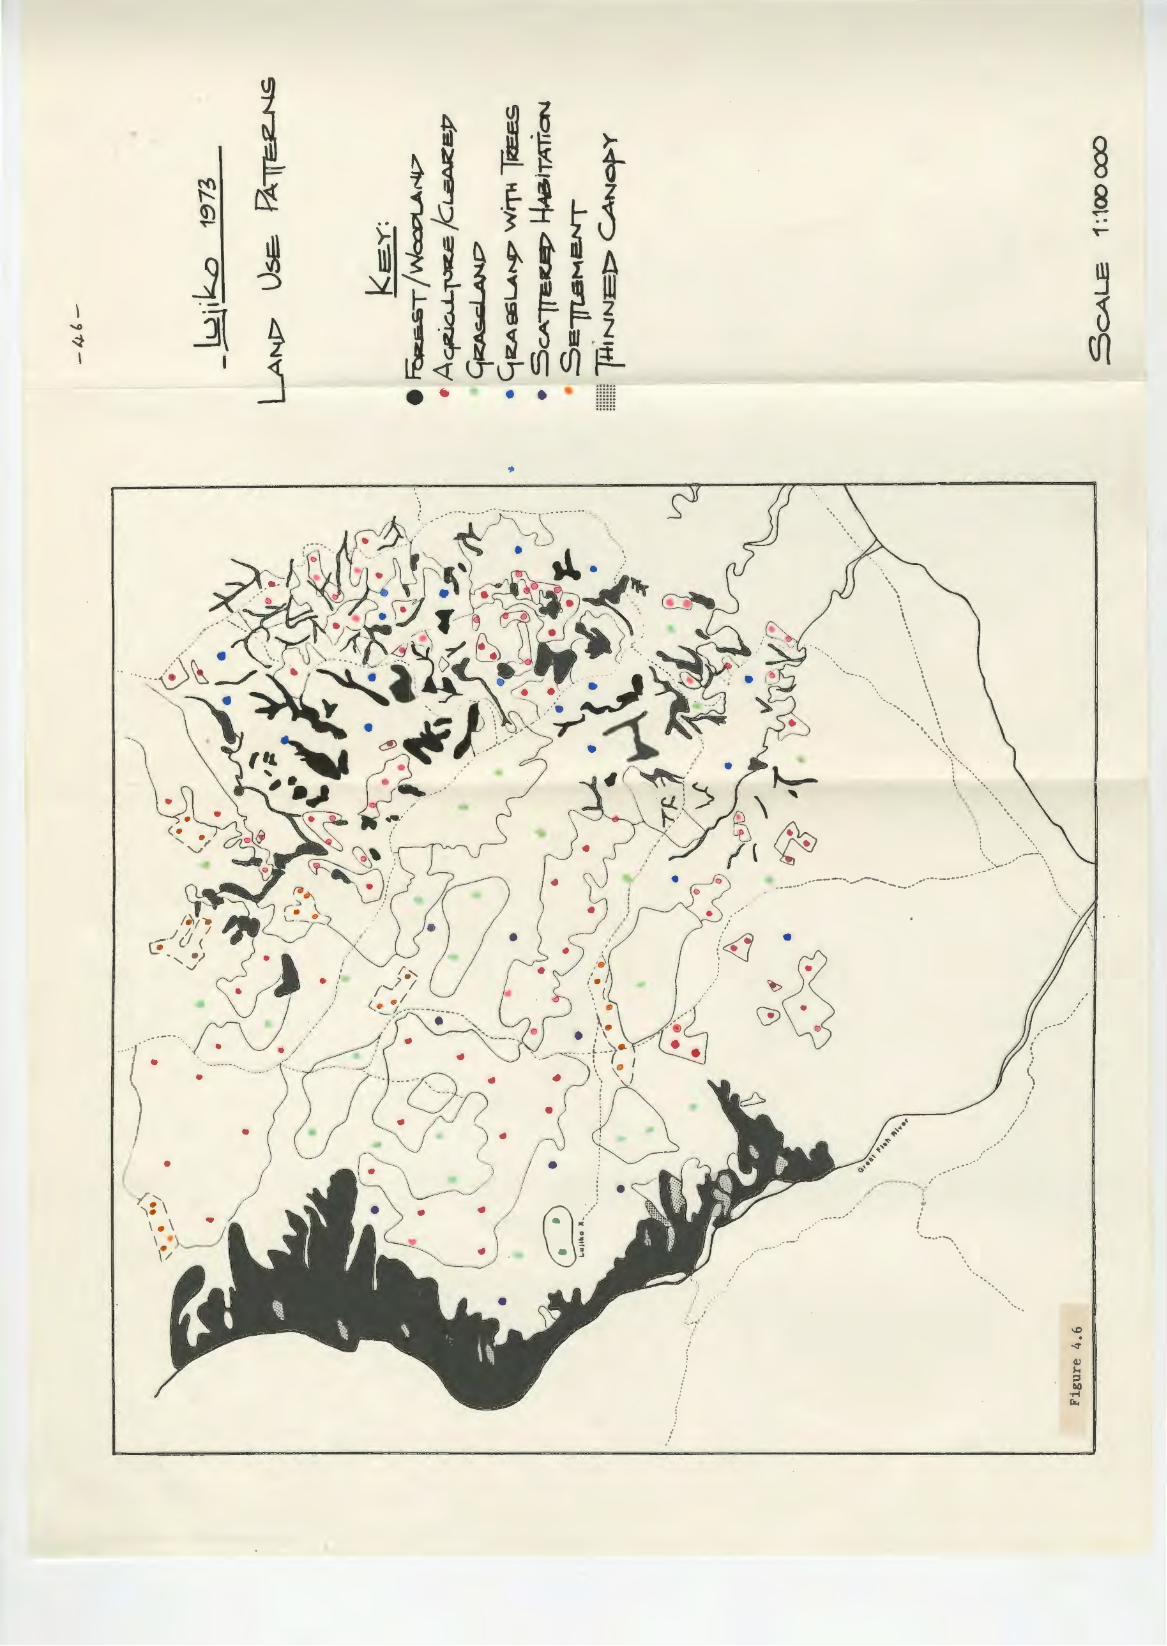
•
• I
( •
• •
' ' I .
• •
,.
..
·--
....... ---··----..... -..... _ ......... -·------~--· ......
•
,' I ---- ••-'•~"I
j
. . '.. ..•... ......,.,\
§ 8 ~ ..
4. 3 OOT SAMPLING - 47 -
Figure 4.7 shows a land cover frequency histogram for various land cover
types in 1938, 1956 and 1973.
The closed canopy thicket (CC) showed unexpected stability with only a
small
5% by
method.
decline of 2% between 1938 and 1956 and a small overall increase of
1973. This falls well within the acceptable error of the sampling
This stability is interesting in the light of the fuelwood
pressure, and the almost universally accepted view that
clearance is being caused by this collection (Everard 1985,
Barnard 1980). Some areas which have been invaded by Acacia
collection
widespread
Aucamp and
karoo have been included in the closed canopy cover class and this would
have contributed to some of the increase.
The discontinuous canopy class (DC) has shown a striking increase of 10%
whilst the area of scattered trees in grassland (ST) and grassland (G)
have declined. This is probably due to an increase in settlement and to
increased Acacia invasion. The thicket which was cleared in the north
of the region fell outside the dot sampling area.
The slight decrease in frequency of agricultural land was caused by
government consolidation through the "betterment schemes" and this would
have allowed recolonisation and invasion of abandoned lands thus
contributing to the increased woody vegetation classes.
Habitation shows a marked increase, almost doubling since 1956. This
reflects the rapid population growth and emphasises the need to develop
fuelwood production strategies.
- 48 -
Land Cover Dot Sampling
=-~ : ~
... L~--.J~=~
CC Closed canopy DC Discontinuous canopy ST Scattered trees and grassland G Grassland A Agriculture TH Traditional habitation S Recent concentrated settlement
Figure 4.7 Land-cover histogram from dot sampling
- 49 -
4.4. FIELD STUDY
4. 4. 1 Fuelwood size
Two fuelwood piles were examined in order to obtain some indication
of the preferred fuelwood size. Where possible species were also
identified. A total of 60 lengths of wood from two piles at two
separate households in different areas were measured with the
following results:-
Mean length 175cm
Mean diameter 5,6cm
Families
little
were
wood
informally
was collected
interviewed. It
in the nearby
was revealed that very
Fish River valley. The
reasons given were that the available sticks were too small except
for kindling. Most fuelwood was purchased from sellers who harvest
indigenous timber on the South African (low impact) side of the Fish
River
green
trip.
or inland in
wood
this
the Ciskei. Several truck and trailer loads of
in the study area during the field indigenous
Much of
were
was
seen
suitable for construction
timber greater than 10cm in diameter and
purposes. It included popular
as Olea europaea ssp aFricana and constructional species such
Ptaeroxylon obliquum.
During the same period onlv two headloads of wood were seen and these
were small and comprised of slender sticks of around 2-Scm diameter.
4.4.2 Stem density_
The 1 ow
than 5cm
shown in
impact site
diameter per
tables 4.1
much greater volume
nevertheless be more
has approximately 30% more stems greater
hectare than does the high impact site as
and 4.2. Whilst the low impact area has a
of timber the high impact site could
productive in terms of useful fuelwood
since smaller sticks are more easily cut. Williams (1986) comments
are more that "Rural inhabitants in developing countries
- 50 -
Tabie 4.1 Stem density: Low impact site. Combined data from 3 transects 100m x 2m for all stems equal to or greater than 5cm diameter.
I SPECIES STEMS PER HECTARE
Allophylus decipiens /7'7 _....;,.._;,
Apodytes dimidiata 16 Azima tetracantha 11 7 Brachylaena elliptica 1 "7 "7 -.:J...)
Carissa haematocarpa 0 Cassine aethiopica 150 Chaetacme ar1stata 100 Cler-odendr-um glabrum 16 Cussonia spicata 50 Ehretia rigida 183 Euclea undulata 283 Euphor-bia grandi dens * 583 Euphor-bia tr-iangular-is * 450 Grewia occidental is 67 Har-pephyl lum caffrum * 83 Kigellar-ia a-fr-icana 16 Maytenus heter-ophylla 217 Maytenus undata 167 Ochna a,- bore a 100 Pappea capensis 50 Ptaer-oxylon obliquum 317 Rhus r-efracta 117 Schotia afr-a 467 Schotia latifolia 83 Scolopia sp 33 Scutia myrtina 66 Suregada africana 33
TOTAL 4 130
TOTAL, MINUS NON-UTILIZED SPECIES(*) 3 014
- 51
Table 4.2 Stem density: High impact site. Combined data fr-om 3 transects 100m x 2m for all stems equal to or greater than 5cm diameter.
SPECIES
Acokanthera oblongifolia Allophylus decipiens Br-achylaena elliptica Canthium inerme Car-issa haematocarpa Chaetacme aristata Clerodendrum glabrum Coddia rudis Cussonia spicata Diospyr-os lycioides Diospyros scabrida Ehr-etia rigida Eugenia zeyher-i Euphor-bia grandidens * Euphor-bia triangular-is* Ficus sp Gr-ewia occidentalis Har-pephyllum caffrum * Maer-ua racemosa Maytenus heterophylla Ochna ar-bor-ea Olea europaea-africana Pappea capensis Pavetta capensis Psychotria capensis Rhus refr-acta Scolopia mundii Scutia myr-tina Zanthoxylum capense
TOTAL
TOTAL MINUS NON-UTILIZED SPECIES<*)
STEMS PER HECTARE
33 200
0 100
33 50
100 67 50
217 33
100 267 517 11 7
17 17
100 0 .,...,.
-..)-..)
133 50 17
0 0
100 33
333 50
3 067
2 333
- 52 -
interested in the production of fuelwood sticks than in the production of
trees with large trunks. Thus tree and shrub species which respond well
to pollarding or coppicing are preferred". The low impact site however
has the capacity to provide a great deal of dead timber which does not
need cutting and which does not deplete the stock of live wood. It should
not be forgotten however that large scale removal of dead wood can be
expected to have impacts on nutrient cycles.
4.4.3 Profile diagrams
Profile diagrams for the high and low impact sites are presented in
Figures 4.8 and 4.9. These diagrams represent 26m x Im strips of
Kaffrarian Thicket (Everard 1985) and illustrate the enormous physiognomic
differences between the two sites. The low impact site is comprised
largely of mature trees such as Ptaeroxylon obliquum, Harpephyllum
caffrum and two species of Euphorbia. The trees form an almost
continuous canopy at 4-5 metres through which the crowns of taller
species, in particular Euphorbia, protrude. Light intensity beneath
the canopy is considerably reduced and consequently the ground here is
largely bare of grass and shrubs. There is a deep deposition of litter
and seedlings of Maytenus heterophylla and Ptaeroxylon obliquum
are plentiful. Open patches at the sites of tree fall carried more grass,
herbs and shrubs. Vines and lianes were abundant.
The canopy of the high impact site by contrast differs markedly. Of the
large tree species which contribute to the canopy on the low impact site
only Harpephyllum caffrum and Euphorbia spp grow much over 2m on
the high impact site. These species have survived because
Harpephyllum is a useful fruit bearing species (Cunningham AB 1987
pers comm) and Euphorbia is unsuitable for fuel. The remainder of the
vegetation on the high impact site is comprised of shrubs and coppice.
The ground layer is largely Panicum maximum and the area is both
browsed and grazed by cattle and goats. Suckers, especially from coppiced
plants were numerous but seedlings were found only in the shade of
Harpephyllum.
me
tres
5
4 3
2 'N\ehes 1,, 1
S / 1
9
2
.3 .I' 4-
s " 7 8 1
0
11.., 17;' 18
1.2.11" 11,
14-
Fig
ure 4
.8
C.~
12
:LM
-
53
-
f3 l:>HC'IJ2" E
!:,~ qe..A
NPic>e.N
.s fr!f-iLE
: ~!.5!!_ _Tu~cJ. S~
-
..
. /UI
6Jt=--H
orc:s.i A
C:~".11:::~1D
EN
.S
Pro5J>Y
R..c..s
L yc,0
11
:>e
.s
• •
SC
.OL.O
f>f A
z:e.. Yt/E
k!-1 .
GtZ..e WlA
, O
c:ctl:>E
.NT
AL
i s P
ovyA
L,is
Z
EY
J,f
~
. C
AN
Tt+,.....,M
JN
~E
:
.::t:>·to.sf=>Y~S
eu.if=>TiCA..:>.s;;.. T
2-iC
Jlfo
c.L
A.b
us
Fe ,tp.nc..us
• ..Bre.Ac:J-f Y
LA
E:N
A
el • ''/>
Tic.A
l>iosp,.YtZ, ,s
L
Yc..io
lhss
AL.Lop.t-f Y
l LU
s
bE=
crJ:=>
teN~
lv1
AV
Je
=~
s.
H-~
HY
LJ A
OQ
-f"-lA
Ae
.e.oc: e.A
.. .
&H
'!.E:TT_Ac.
'2J
c,tb
A
cA
SG
.i~
s·1sp
,,iNo
~
CA
N-p:ti~
M
JNE
::J<:..t....te:
~Y
LL
UM
~ I
Eu
t>4
ld<
:SC
A
. .
<;1
Z.A
t,..>1
:>1
~N
S
t::)a
osp
.~
L YC
:.01
.1::>
e:s
. A
I
L
" o,....,.u
! , t:'"" n '( L
I-,\.J$
\~ '·'' t:e
c,.p
i--·~
. '
.. ""· 'C
:1
1~
26
me
tres
me
tres
5
4 3 2
~A
AflrJ~
\tiJ ~IA
'1
1c!'.A
~~
s
Af4
;i,e4
9JA
.
~T
aA
. Af=eA
P
f..Aeee>
XY
LO
~. C
SL
iq\..A
..tM
-5
4
-
~;L
-E
: : Low r~~A
G:f. &
i lfL
1 E
L.tC
LE
A
UN
I:::>L
.lLA
TA
W\dres
1..,2.
5,4
.5
MA
'( P--
t-,..:)US
H
e:. TE'2..of>'+ YL
..L.A
,
.Azit---1A
1e1J:l.A
CA
tJT4fA
SU
'2.J=
:C,A
DA
~
'=1 a..,S
S>
oN
1A
~
ic.A
'°I;'\-
Fig
ure 4
.9
~Y
U.U
M
~
, S
i...aeGA
bA
~
GA
t>
A
' {>'"fER-o')(~LoN
OB
U~
L>
c...)M
. E
....,p,tiolZ..S
lA
~l~
S..
~~
fi=T
~f"'Y
I l
Ar
26
me
tres
- 55 -
4.4.4. Species composition
The total number of woody species for the two sites is almost the same, 29
and 27 species, as indicated in Tables 4.3 and 4.4. This approximates the
numbers counted by Everard (1985). He found in his study, a mean of 37,3
species
species
species
common
per lOOm 2 but only 61,7% (23) of these were woody species. The
composition of the two sites however is quite different. Of
comprising more than 5% of the total number of stems only two are
to both sites as shown in the frequency histogram in Figure 4.10.
are Maytenus heterophylla and Euphorbia grandidens. On the These
high impact site Diospyros lycioides is easily the most numerous
comprising 33% of all stems. This proportion is more than twice that of
the next most numerous species, Maytenus heterophylla. Diospyros
lycioides was not recorded on the low impact site. This species is
characteristic of disturbed areas and is therefore a useful indicator
species. By contrast in the low impact area, the forest species
Ptaeroxylon obliquum is dominant comprising more than 20% of stems.
Brachylaena elliptica is absent from the high impact site in the >5cm
stem diameter class as shown in Table 4.4. This is of significance since
it is a browse species and its absence or scarcity may prove to be a
valuable indicator of browsing pressure.
In the >5cm diameter class the high impact area has seven species as
compared to the eight of the low impact site. For species comprising more
than 5% of the total and greater than 5cm in diameter only the unutilised
Euphorbia spp and Allophylus decipiens were common to both sites.
The two sites therefore are clearly very different in terms of their
respective woody vegetation communities as shown in Figure 4.11. Both
however are classified as Kaffrarian Thicket and both appear the same on
aerial photography and satellite images of the area.
construction species include Ptaeroxylon obliquum and
Desirable
Euclea
undulata (Cunningham 1988). Removal of these large canopy species would
be expected to substantially change the microclimate in the high impact
site and this may therefore mitigate against growth of these canopy
species. Light intensity, temperature and competition with grasses are
- 56 -
Table 4.3 Species composition and basal area: Low impact site. Column A shows all stems from 2 transects 100m x 2m. Column 8 shows all stems equal to or greater than 5cm diameter from 3 transects 100m x 2m.
COLUMN A COLUMN 8 SPECIES
NO % NO % m2 /ha '/.
Allophylus decipiens 15 3. 18 14 5.62 2.42 1. 92 Apodytes dimidiata 1 0.20 1 0.40 0.05 0.04 Azima tetracantha 20 4.25 7 2.81 0.51 0,41 Brachylaena elliptica 8 1. 70 8 3.21 1. 15 0.92 Car-issa haematocar-pa 7 1. 49 0 0.00 0.00 0.00 Cassine aethiopica 9 1. 91 9 3.61 2.05 1.64 Chaetacme ar-istata 6 1. 27 6 2.41 0.53 0.42 Clerodendrum glabrum 1 0.20 1 0.40 0.06 0.05 Cussonia spicata 3 0.64 3 1. 20 1. 33 1. 06 Ehretia rigida 14 2.97 12 4.82 1. 14 0.90 Euclea undulata 11 2.34 17 6.83 5. 16 4. 10 Euphorbia grandidens 30 6.37 35 14.06 29.20 23. 19 Euphor-bia tr-iangularis 27 5.73 27 10.84 31. 47 24.99 Grewia occidental is 18 3.82 4 1. 61 0.26 0.21 Har-pephyllum caffrum 5 1. 06 5 2.01 8.39 6.66 Kigellar-ia afr-icana 2 0.42 1 0.40 0.56 0.45 Maytenus heter-ophylla 85 18.05 13 5.22 1. 13 0.90 Maytenus undata 16 3.40 10 4.02 14.32 11. 37 Ochna arbor-ea 7 1. 49 6 2.41 5.86 4.66 Pappea capensis 4 0.85 3 1. 21 0. 19 0. 15 Ptaer-oxylon obliquum 100 21. 23 19 7.63 10.79 8.57 Rhus refracta 8 1. 70 7 2.81 4.54 3.61 Schotia afra 31 6.58 28 11 . 24 1. 58 1. 26 Schotia latifolia 4 0.85 5 2.01 0.69 0.55 Scolopia Sp 4 0.85 2 0.80 1. 38 1. 10 Scutia myr-tina 12 2.55 4 1. 61 0.88 0.70 Suregada afr-icana 21 4.46 2 0.80 0.25 0.20
TOTAL 471 249 125.92
- 57 -
Table 4.4 Species compos1tion and basal area: High impact site. Column A shows all stems from 2 transects 100m x 2m. Column B shows all stems equal to or greater than 5cm diameter from 3 transects of 100m x 2m.
COLUMN A COLUMN B SPECIES
NO % NO % m2 /ha 1.
Acokanthera oblongifolia 4 0.94 2 1. 30 0.72 0.65 Allophylus decipiens -, '? ,e__ 5. 18 12 7.79 1. 14 1. 04 Brachylaena elliptica 1 0.24 0 o.oo 0.00 0.00 Canthium inerme 10 2.35 6 3.90 1. 75 1. 60 Carissa haematocarpa 26 6. i 2 2 1. 30 0. 1 7 0. 16 Chaetacme aristata 4 0.94 7 1. 95 0.26 0.24 .J
Clerodendrum glabrum 6 1. 41 6 3.90 1. 79 1. 64 Coddia rudis 9 2. 12 4 2.60 0.37 0.33 Cussonia spicata 5 1. 18 3 1. 95 2.40 2. 19 Diospyros lycioides 132 31. 06 13 8.44 2.81 2.57 Oiospyros scabrida 18 4.24 2 1 . 30 0. 11 0. 10 Ehretia rigida 17 4.00 6 3.90 0.57 0.52 Eugenia zeyheri 34 8.00 16 10.39 3.23 2.95 Euphorbia grandidens 26 6. 11 31 20. 13 68.43 62.53 Euphorbia triangular-is 6 1 . 41 7 4.55 10.46 9.56 Ficus sp 1 0.24 1 0.65 0.33 0.30 Grewia occidental is 37 8.70 1 0.65 0. 16 0. 15 Harpephyllum caffrum 5 1. 18 6 3.90 13.50 12.34 Maerua racemosa 6 1. 41 0 0.00 0.00 0.00 Maytenus heterophylla 53 12.47 2 1. 30 0.63 0.58 Ochna arborea 22 5. 18 8 5. 19 0.67 0.60 Olea europaea-africana 3 0.71 3 1. 95 1. 20 1. 10 Pappea capensis 10 2.35 1 0.65 0.05 0.05 Pavetta capensis 10 2.35 0 0.00 0.00 0.00 Psychotria capensis 1 0.24 0 0.00 0.00 0.00 Rhus refracta 9 2. 12 6 3.90 2.86 2.61 Scolopia mundii '""l 0.47 2 1. 30 0.09 0.08 .::..
Scutia myrtina 20 4.71 8 5. 19 2.38 2. 18 Zanthoxylum capense 3 0.71 3 1. 95 0.38 0.35
TOTAL 425 154 109.42
Figure 4 .10
40%
30%
2C)%
1C%
0% D:
- 58 -
Species Frequency Stems • />5°/o of Total
I I! 11
~'
~1: Mr, Go ;= - ~ Oa Srn Ad Po Sa c......:... -
- rnoa:· ~\\\~~~~~ Lovv : moac:
Ad Allophylus decipiens Dl Diospyros lycioides Eg Euphorbia grandidens
I ~' ·. ,, Er
Et Euphorbia triangularis Mh Maytenus heterophylla Mu Maytenus undata Oa Ochna arborea Po Ptaeroxylon obliquum Sa Schotia afra Sm Scutia myrtina Go G~ewia occidentalis Ez Eugenia zeyheri Ch Carissa haematocarpa
Frequency histogram for species comprising 5% or more of
total stems
Figure 4.11
- 59 -
Species Frequency Stems •/>Scmd and •/> So/o Tot
Freowe,,cy 25%
20%
15%
10%
5%
Ez DI Ad - Oa Srn Sa Po :::J Mr M:_:
- : mpac'. tc~'*'Z~ Low ! :r,oac '.
Ad Allophylus decipiens Dl Diospyros lycioides Eg Euphorbia grandidens Et Euphorbia triangularis Mh Maytenus heterophylla Mu Maytenus undata Oa Ochna arborea Po Ptaeroxylon obliquum Sa Schotia afra Sm Scutia myrtina Ez Eugenia zeyheri
Frequency histogram for stems greater than 5cm diameter and
comprising 5% or more of the total.
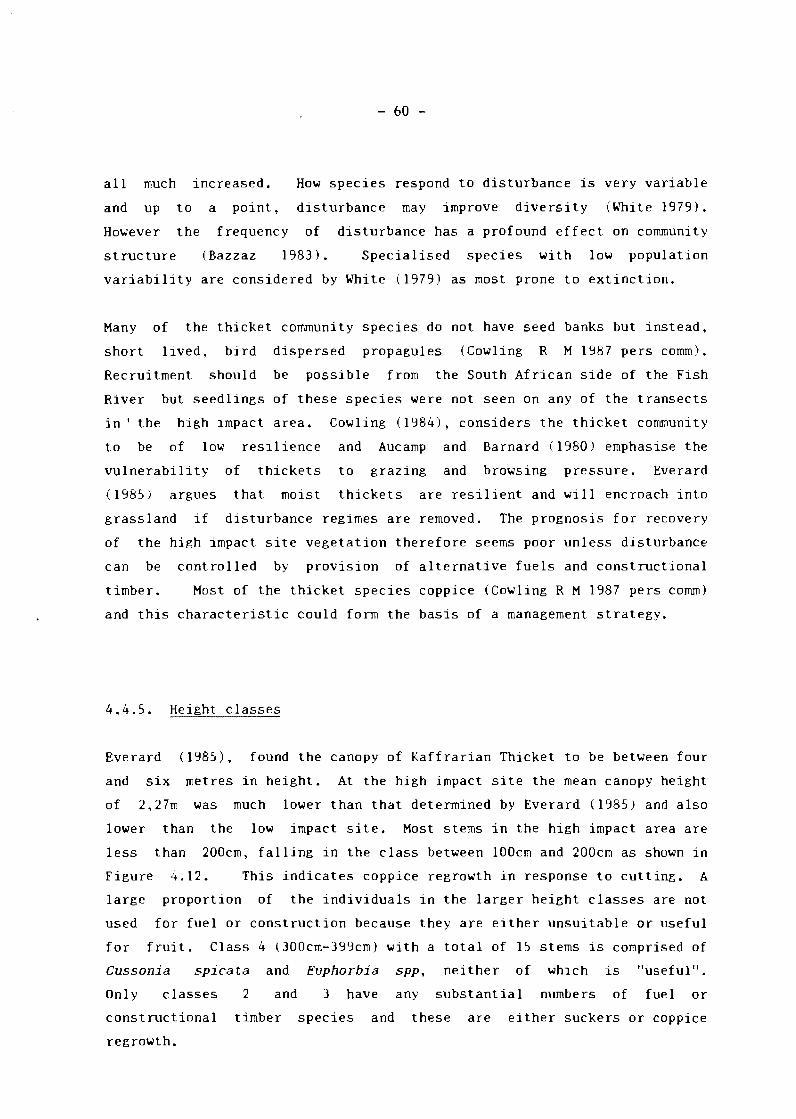
- 60 -
all much increased. How species respond to disturbance is very variable
and up to a point, disturbance may improve diversity (White 1979).
However the frequency of disturbance has a profound effect on community
structure (Bazzaz 1983). Specialised species with low population
variability are considered by White (1979) as most prone to extinction.
Many of the thicket community species do not have seed banks but instead,
short lived, bird dispersed propagules (Cowling R M 1987 pers comm).
Recruitment should be possible from the South African side of the Fish
River but seedlings of these species were not seen on any of the transects
in 1 the high impact area. Cowling ( 1984), considers the thicket community
to be of low resilience and Aucamp and Barnard (1980) emphasise the
vulnerability of thickets to grazing and browsing pressure. Everard
(1985) argues that moist thickets are resilient and will encroach into
grassland if disturbance regimes are removed. The prognosis for recovery
of the high impact site vegetation therefore seems poor unless disturbance
can be controlled by provision of alternative fuels and constructional
timber. Most of the thicket species coppice (Cowling RM 1987 pers comm)
and this characteristic could forn1 the basis of a management strategy.
4.4.5. Height classes
Everard (1985), found the canopy of Kaffrarian Thicket to be between four
and six metres in height. At the high impact site the mean canopy height
of 2,27m was much lower than that determined by Everard (1985) and also
lower than the low impact site. Most stems in the high impact area are
less than 200cm, falling in the class between 100cm and 200cm as shown in
Figure 4.12. This indicates coppice regrowth in response to cutting, A
large proportion of the individuals in the larger height classes are not
used for fuel or construction because they are either unsuitable or useful
for fruit. Class 4 (300cm-399cm) with a total of 15 stems is comprised of
Cussonia spicata and Euphorbia spp, neither of which is "useful 11•
Only classes 2 and 3 have any substantial numbers of fuel or
constructional timber species and these are either suckers or coppice
regrowth.
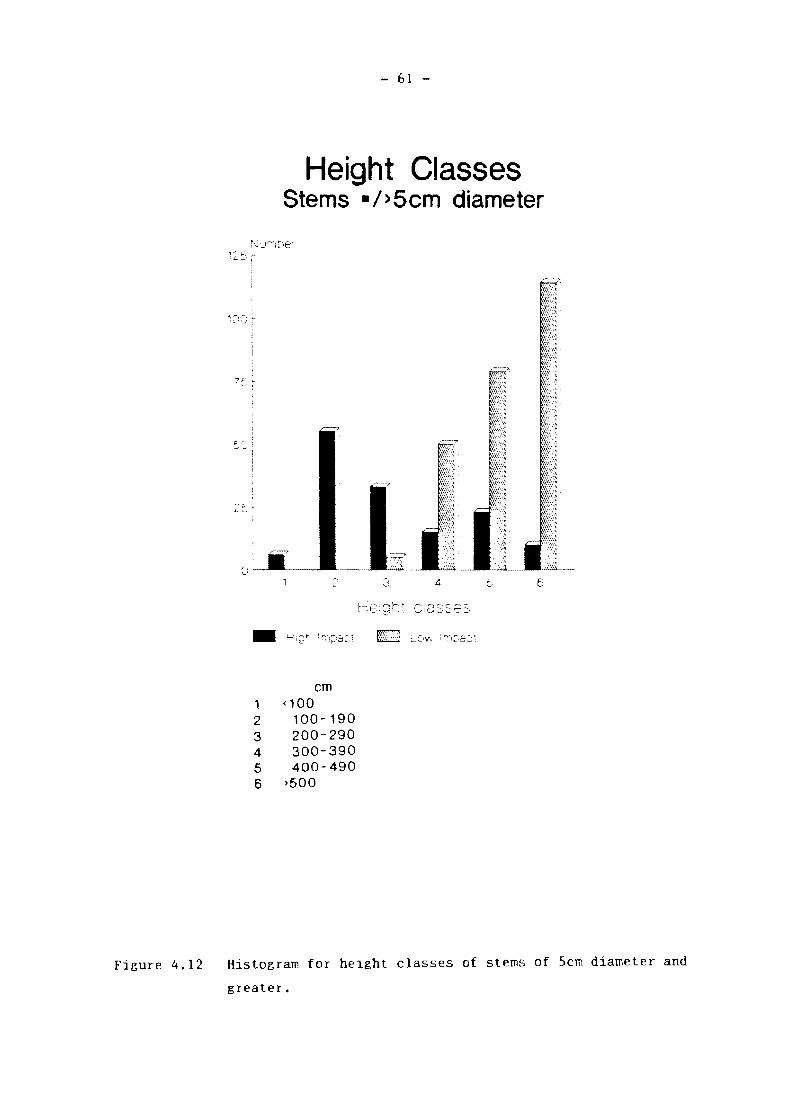
- 61 -
Height Classes Stems •/>5cm diameter
cm 1 < 100 2 100-190 3 200- 290 4 300-390 5 400-490 6 >500
Figure 4.12 Histogram for height classes of stems of 5cm diameter and
greater.
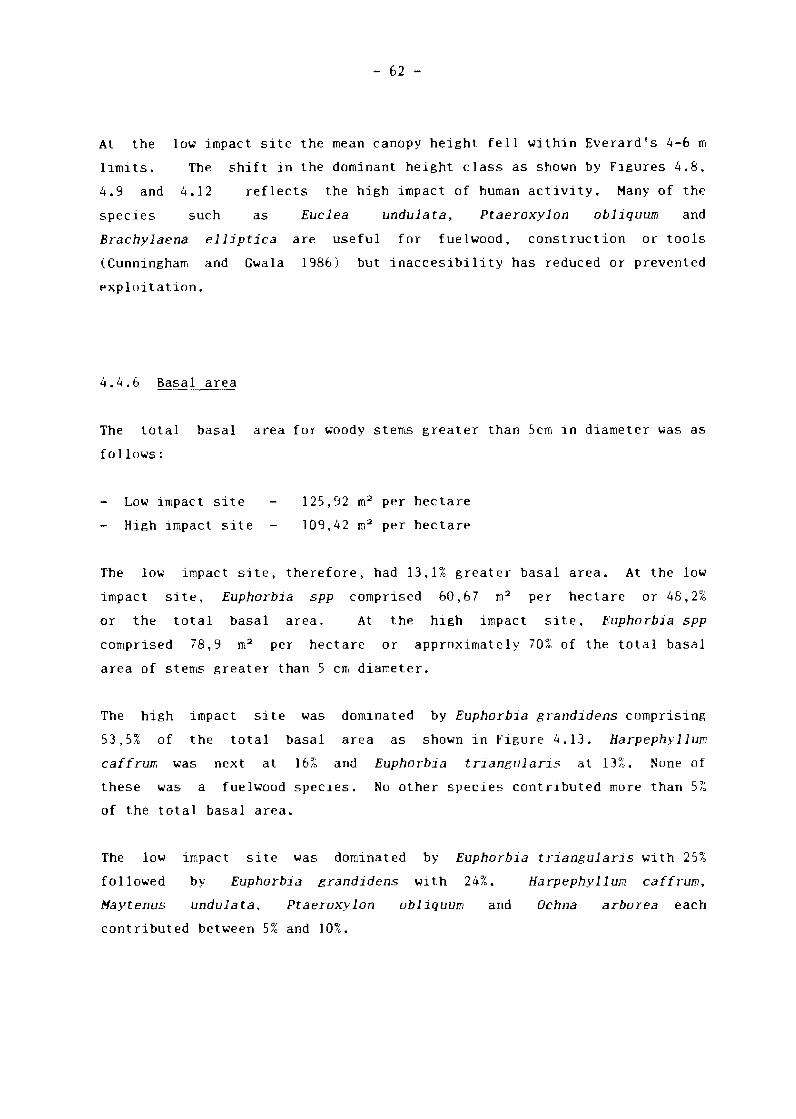
- 62 -
At the low impact site the mean canopy height fell within Everard's 4-6 m
limits. The shift in the dominant height class as shown by Figures 4.8,
4.9 and 4.12 reflects the high impact of human activity. Many of the
species
Brachylaena
such as Euclea undulata, Ptaeroxylon obliquum and
elliptica are useful for fuelwood, construction or tools
(Cunningham and Gwala 1986) but inaccesibility has reduced or prevented
exploitation.
4.4.6 Basal area
The total basal area for woody stems greater than 5cm in diameter was as
fol lows:
Low impact site
High impact site
125,92 m2 per hectare
109,42 m2 per hectare
The low impact site, therefore, had 13,1% greater basal area. At the low
impact
or the
site, Euphorbia spp comprised 60,67 rn 2 per hectare or 48,2%
total basal area, At the high impact site, Euphorbia spp
comprised 78,9 m2 per hectare or approximately 70% of the total basal
area of stems greater than 5 cm diameter.
The high impact site was dominated by Euphorbia grandidens comprising
53, 5% of the total basal area as shown in Figure 4. 13. Harpephyll um
caftrum was next at 16~~ and Euphorbia triangularis at 13%, None of
these was a fuelwood species. No other species contributed more than 5%
of the total basal area.
Euphorbia triangularis with 25% The low impact site was dominated by
followed by Euphorbia grandidens with
Maytenus undulata, Ptaeroxylon obliquum
contributed between 5% and 10%.
24%. Harpephyllum caffrum,
and Ochna arborea each
- 63 -
Basal Area (BA) Stems •I> 5 cmd and > 5 °/o of total
-= \I\
Eg Euphorbia grandidens Et Euphorbia triangularis He Harpephyllum caffrum Mu Maytenus undata Po Ptaeroxylon obliquum Oa Ochna arborea
Figure 4.13 Species contributions to basal area for stems of 5cm
diameter and greater and of 5% or greater of total basal
area.
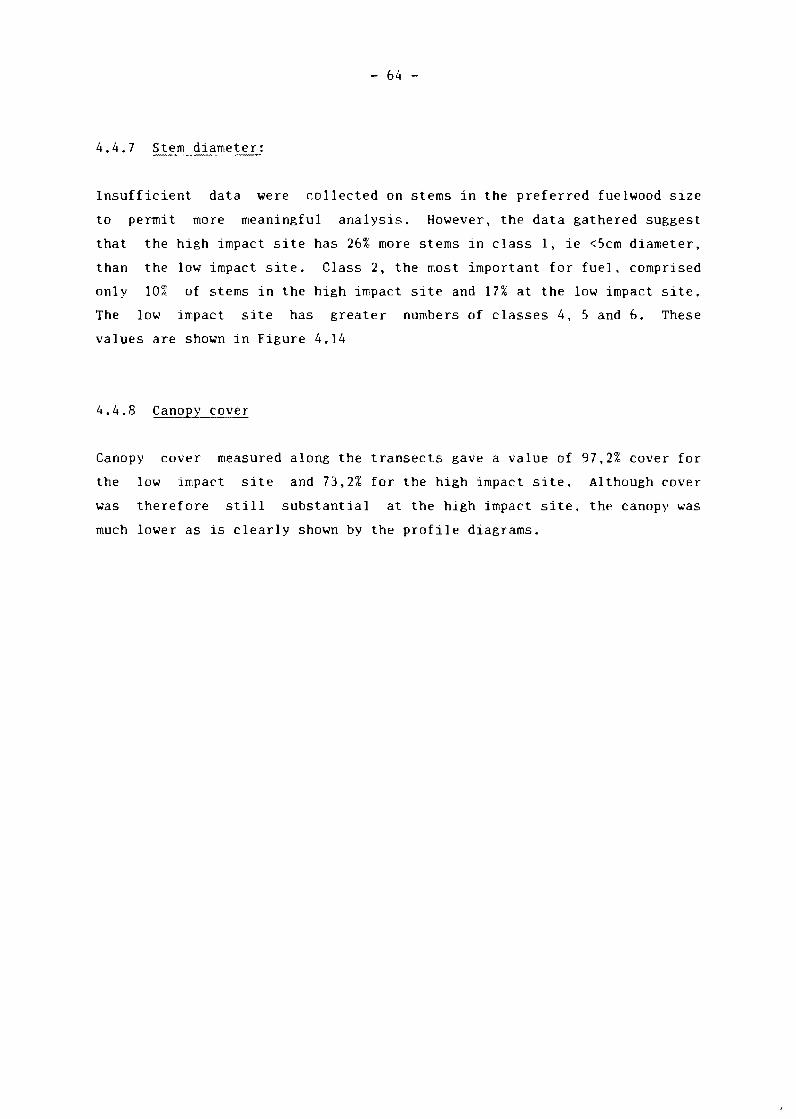
- 64 -
4.4.7 Stem diameter:
Insufficient data were collected on stems in the preferred fuelwood size
to permit more meaningful analysis. However, the data gathered suggest
that the high impact site has 26% more stems in class 1, ie <5cm diameter,
than the low impact site. Class 2, the most important for fuel, comprised
only 10% of stems in the high impact site and 17% at the low impact site.
The low impact site has greater numbers of classes 4, 5 and 6. These
values are shown in Figure 4.14
4.4.8 Canopy cover
Canopy cover measured along the transects gave a value of 97,2% cover for
the low impact site and 73,2% for the high impact site. Although cover
was therefore still substantial at the high impact site, the canopy was
much lower as is clearly shown by the profile diagrams.
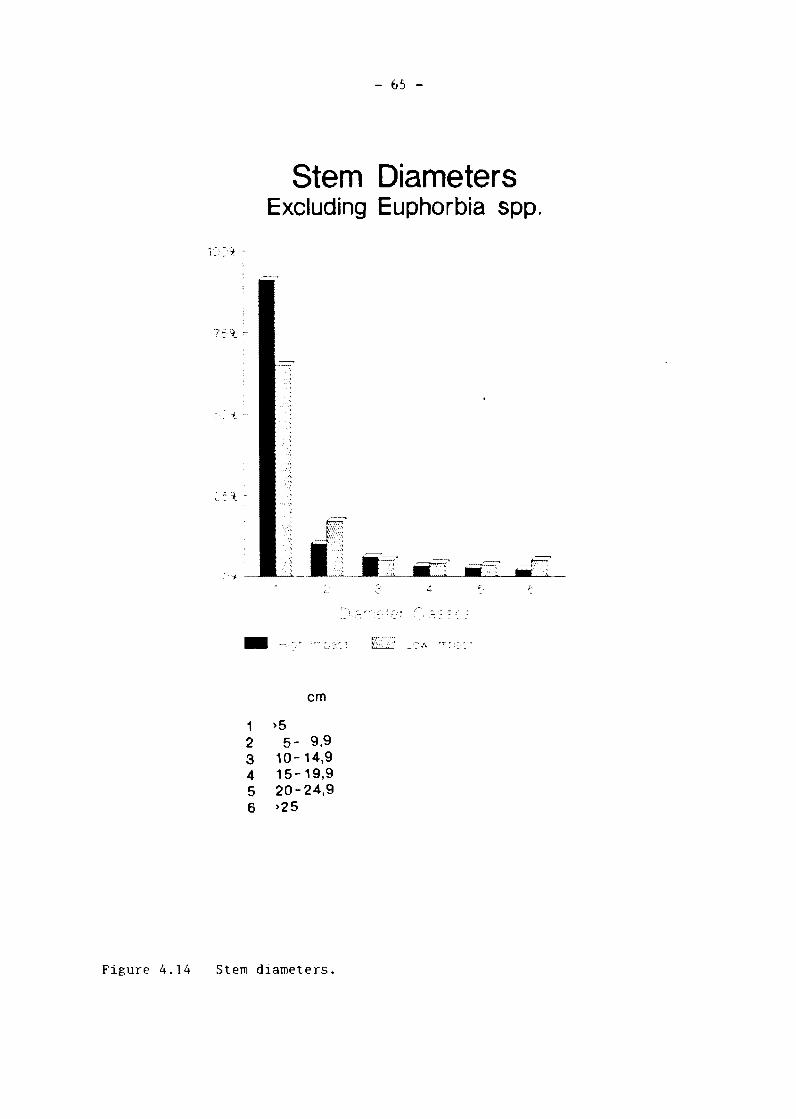
- 65 -
Stem Diameters Excluding Euphorbia spp.
- '-.
cm
1 >5 2 5- 9,9 3 10-14,9 4 15-19,9 5 20-24,9 6 >25
Figure 4.14 Stem diameters.
- 66 -
CHAPTER 5
CONCLUSIONS AND RECOMMENDATIONS
5.1 CONCLUSIONS
Based on the available literature and on the results obtained from this
study, woody vegetation suitable for fuel and constructional timber in the
study area is a limited and vulnerable resource. Trollope (1974) cites
fire as an important controlling factor which limits the spread of
thickets and burns were evident in the grasslands of the study area on the
images and in the field. Thicket communities are also limited by edaphic
components (Heydorn and Tinley 1980; Cowling 1984). Thicket communities
have therefore probably never occurred over the upland grasslands and have
always been a limited resource. Population growth and a dwindling fuel
supply has caused increasing pressure on the woody vegetation. Everard
(1985) identified a variety of threats to thicket communities. Of
relevance to this study are the direct and indirect human impacts on these
woody communities. Direct human impacts are those which involve clearance
of land for agriculture or for industrial and urban development. Poor
farming activities, particularly overgrazing, constitute major threats.
According to Aucamp (in Everard 1985) 150 000 hectares of thicket in the
Eastern Cape are so badly overgrazed that recovery is impossible.
S.1.1 Impact caused by collection of wood in the Eastern Cape/Ciskei
Human impacts on the woody vegetation communities in the Eastern
Cape/Ciskei region are severe. At the high impact study site, impacts
have been so great that the thicket vegetation is probably beyond the
point of recovery. Collection of firewood has changed vegetation
community structure in such a way that few useful species of a useful size
remain. The canopy height of the thicket has been reduced by 50% and
there is little evidence of seedling regeneration. Most of those species
- 67 -
which are useful for firewood or constructional timber have been
repeatedly cut and remain as small-diameter coppice remnants. With the
loss of the canopy, species composition has changed and most of the useful
constructional species have been replaced by others. This situation is
exacerbated by uncontrolled grazing and browsing by stock. This degraded
vegetation is not able to provide for the fuelwood and constructional
timber needs of local people. In addition, these human impacts pose a
severe threat to the species diversity of the Eastern Cape flora.
5.1.2 The feasibility of using remote sensing
The extreme differences described in the woody vegetation in this study
showed that panchromatic aerial photography at the small scales currently
available is not adequate for the monitoring of qualitative vegetation
change as described in the results. These structural changes can be
measured satisfactorily and accurately only when the scale is 1:12 000 or
greater (Aldred and Kippen 1967, Aldred and Sayn-Wittgenstein 1972 and
Edwards and Jarman 1972). If qualitative vegetation analyses are
required, large-scale photography is essential and if the work must be
conducted by means of aerial photography then photography of the necessary
scale must be specially flown.
Satellite images have severe limitations in this kind of study. They are,
however, useful in rapid visual mapping prograrr~es. Landsat is adequate
for monitoring of broad boundaries over large areas at small scales. Of
the satellite images available, SPOT is far superior to Landsat. SPOT FCC
paper prints at a scale of 1:100 000 provide a very quick and accurate
method of mapping boundaries of broad vegetation types. The high cost of
a SPOT image is far outweighed by the immense savings in time, equipment
and level of expertise required for accurate mapping of vegetation
boundaries.
Where vegetation mosaics
imposed upon qualitative
and terrain are complex, severe limitations are
interpretation using not only SPOT but all
satellite imageries. If vegetation quality is to be monitored, extensive
- 68 -
field support studies are essential.
be most useful in this kind of
SPOT and other satellite images may
study by allowing identification of
clearance for agriculture and urban development and expanding areas of low
socio-economic settlement. These areas invariably have severe impacts
upon the surrounding woody vegetation. Identification of such areas would
be sufficient reason to establish vegetation monitoring plots in the
field.
5.2 RECOMMENDATIONS
If the fuelwood and constructional timber needs of low-income communities
are to be met, optimal use of a variety of resources is necessary.
Clearance of invasive bush from agricultural land could be used for
charcoal. For example, in Kenya, Tarchonanthus camphoratus clearance
yields raw material for charcoal production (Gandar 1983), Forest wastes
and improved processing of wood for charcoal would greatly increase fuel
supplies. The recommendations relate to measures for monitoring woody
vegetation change and to alleviate pressure on indigenous fuelwood
supplies. These focus on monitoring and planting strategies.
5.2.1 Monitoring
SPOT FCC paper prints at a scale of 1:100 000 should be used from time to
time according to the vulnerability of an area, to identify areas of new
settlement, agricultural and industrial expansion, and areas of
accelerated erosion or other degradation. These areas could be rapidly
mapped using a digitiser and stored on a data base. Subsequent mapping
would allow changes in landcover to be identified. Areas of increased
human impacts should be investigated in the field. Fixed plots and
transects should be established to permit ongoing monitoring of human
impacts in areas of impact and vulnerability.

- 69 -
5.2.2. Utilisation of indigenous vegetation
Where possible, sustained
estimated to permit some
implemented.
yields of woody vegetation should be at least
kind of controlled harvesting strategy to be
Research prograrr~es to investigate the sustained yield potential of woody
vegetation communities must be established.
5.2.3. Tree planting strategies
A multi-faceted nation-wide
must be implemented. The
education programme to promote tree-planting
present Arbor Day and Tree of the Year
programmes
inhabitants
are totally inadequate and have no meaning to most of the rural
of the study area. It is reasonable to suppose that this is
the case throughout the country.
A multi-lingual. multi-media programme is essential. This must be seen to
have the full support of popular and authority figures and should draw on
charismatic figures from a wide range of fields. The prime target group
must be the black communities who most need the benefits of tree-planting.
A national plan for the establishment of nurseries and demonstration
projects from which rural people can choose and purchase trees, must be
established. This must be augmented by all kinds of planting strategies,
as described in Appendix 1 to this document. Different approaches will be
necessary in different areas.
Government departments responsible for forestry, agriculture and nature
conservation should approach the problem as one of shared responsibility.
All should be involved in planting of woodlots which will provide
employment, learning opportunities and entreprenurial marketing
opportunities. These should only be established with due regard for the
constraints described in Appendix 1. At present, it is these departments
which have the infrastructures to establish such a programme. The concept
of agroforestry should be more widely promoted.

- 70 -
Whilst trials of possible fuel and construction species are in progress,
trees which are known from experience elsewhere to have proven successful,
should be planted. The problem of invasives is well understood but many
of the good fuel species are invasive only under specific conditions.
There may well be situations where the choice is between the planting of
potentially invasive species or complete loss of soil and a complete lack
of energy resources for increasingly impoverished communities
Trials and plantings with indigenous species, particularly various
Acacia species should be begun without delay. Acacia karroo is
considered by some to be the best woodlot species since it yields good
coals and is familiar to rural people (Bond W J 1988 pers comm). Acacia
albida has been widely used to combat desertification in th~ Sahel
(Kinnse and Norton 1984).
We should not be spending years on experiment and discussion before
embarking on a programme. The needs of communities dependent on dwindling
energy supplies are urgent and they cannot wait for the ideal tree in
order to cook their next meal.
- 71 -
REFERENCES
Acocks JP H 19S3. Veld types of South Africa. Memoirs of the Botanical
Survey of South Africa 28, 1-128.
Aldred A H and Kippen J A 1967. Plot volumes from large scale 70mm air
photographs. Forestry Science 13, (4).
Aldred AH and Sayn-Wittgenstein L 1972. Tree diameters and volumes from
large scale aerial photographs. Forestry Management Institute, Inf.
Report FMR-X-40, Department of Environment. Canada.
Allen J P and Richards T S 1983. Remote sensing for identifying low
density vegetation cover in semi-arid, coastal, north-west Egypt. Remote
sensing for rangeland monitoring and management. Reading Remote Sensing
Society, 69-74.
Anderson J R, Hardy EE, Roach J T, and Witner RE 1976.
landcover classification system for use with remote
Geological Survey Professional Paper 964, Washington DC.
A land-use and
sensor data.
Ashton M 19S2. In:
study in three villages.
Best M 1979. The scarcity of domestic energy: a
SALDRU working paper No 27. Cape Town.
Aucamp A J and Barnard H H 1980. Die ontplooiing van die
veekundepotensiaal van die droegras-bosgemeenskappe in die oos-kaap.
Hand. Weidingsveren Suid Afrika, IS, 137-140
Barrett E C and Curtis L F 1976. Introduction to environmental remote
sensing. Chapman and Hall. London.
Bazzaz F
disturbance
Gordon M
New York.
A 1983. Characteristics of population in relation to
in natural and man modified systems. In: Mooney HA and
(eds) Disturbance and ecosystems. Springer Verlag, Berlin and
2S9-277.
- 72 -
Bembridge T J and Tarlton J E 1986. Ciskei woodlot survey and fuelwood
strategy. Internal project report. University of Fort Hare. Ciskei.
Best M 1979, The scarcity of domestic energy: a study in three
villages. SALDRU working paper 27. University of Cape Town.
Bossi L 1983, Mapping the vegetation of the Fynbos Biome with the aid of
Landsat imagery. MSc thesis. University of Cape Town.
Breytenbach G J 1986. Impacts of alien organisms on terrestrial
communities of the south western Cape. In: Macdonald I AW, Kruger F J,
Ferrar A A (eds) The ecology and management of biological invasions in
southern Africa. Oxford University Press, Cape Town,
Brown C J and Gubb A A 1986. Invasive alien organisms in the Namib
desert, upper Karoo and the arid and semi-arid savannas of western
southern Africa. In: Macdonald I AW, Kruger F J, Ferrar A A (eds) The
ecology and management of biological invasions in southern Africa. Oxford
University Press, Cape Town. 93-108.
Brough P J and Bro~ley KA 1984. An experimental land cover map of the
Natal midlands using Landsat imagery. Natal Town and Regional Planning
Supplementary Report No 4. Pietermaritzburg.
Burki S J and Ul Haq 1985. In: Le Roux P J du P (ed) Basic needs in
rural areas: A report on a seminar held in Cape Town on 19 February 1985.
SANSP Report 116. FRD, CSIR, Pretoria.
Cameron M et al 1988. In: McKenzie B (ed) Guidelines for the sustained
use of indigenous
FRD CSIR Pretoria.
forests and forest products.
12-26.
Occasional Report No 35,
Claveran R A
charting method.
1966. Two modifications to the vegetation photographic
Journal of Range Management, 19, 371-373.

Colwell R N and Poulton C E
monitoring: a comparison with
altitude colour photography.
Sensing, 51, (8), 1093-1101.
- 73 -
1985. SPOT simulation imagery for urban
Landsat TM and MSS imagery and with high
Photogrammetric Engineering and Remote
Cowling RM, Moll E J and Campbell BM 1976. The ecological status of the
understory communities of pine forests on Table Mountain. South African
Forestry Journal 99, 13-24.
Cowling R M 1982a. Vegetation studies in the Humansdorp region of the
Fynbos Biome. Unpublished PhD thesis, University of Cape Town.
Cowling R M 1982b. Patterns of plant endemisrn in the south-eastern Cape.
The Naturalist, 27, 17-20.
Cowling R M 1984. A syntaxonomic and synecological study in the
Humansdorp region of the Fynbos Biome. Bothalia 15, 175.
Cunningham A
people in a
Cape Town.
B 1985. The resource value of indigenous plants to rural
low agricultural potential area. PhD thesis. University of
Cunningham A B and Gwala BR 1986.
used in Thembe-Thonga hut construction.
91-511.
Building material and plant species
Annals Natal Museum, 27 (2),
Cunningham A B et al 1988. In: MacKenzie B ted) Guidlines for the
sustained use of indigenous forests and forest products. Occasional
Report No 35. FRD, CSIR Pretoria. 2-11.
Curran P 1980. Multispectral remote sensing of vegetation amount.
Progress in Physical Geography, 4 (3), 315-341.
Department of Agriculture 1984.
Agricultural Economic Trends
Pretoria.
Abstract of agricultural statistics.
Division, Department of Agriculture,
- 74 -
Department of Environment Affairs 1981/1982. Commercial timber resources
and roundwood processing. Department of Environment Affairs, Pretoria.
Dowman I J 1981. The use of unconventional photographs in mapping. In:
Proceedings of a symposium on ecological mapping from ground, air and
space. Institute of Terrestrial Ecology, Monks Wood, United Kingdom.
Downing B
in South
420-422.
H 1978. Environmental consequences of agricultural expansion
Africa since 1850. South African Journal of Science, 74,
Doyle F J 1985. The large format camera on shuttle mission 41-G.
Photogrammetric Engineering and Remote Sensing.
Eberhard A A 1986. Energy consumption patterns in underdeveloped areas
in South Africa. Energy Research Institute, University of Cape Town.
Edwards D and Jarman N G 1972. The role of aerial photography in
vegetation survey. Unpublished paper read at a seminar on the application
of aerial techniques to surveying natural resources. Natal Parks and Fish
Preservation Board. Durban.
ElMahgary Y and Biswas A K 1985.
Butterworth Scientific, London.
Integrated rural energy planning,
The conservation status of some unique plant Everard D
communities
A 1985.
in the eastern Cape. Unpublished MSc thesis, Rhodes
University, Grahamstown.
Fenn T and Underwood M 1986. The role of agroforestry landuse systems in
future deve loprnent agriculture. Paper presented at symposium on
development, University of Cape Town.
FAO 1982. 1980 yearbook of forest products. FAD, Rome.
Foley G and Barnard G
London.
1984. Farm and community forestry. Earthscan,
- 75 -
Fox J 1982. Land use and environmental degradation in a Nepali
village. 11th annual conference on South Asia, University of Wisconsin.
French D 1982. The 10 commandments of renewable energy analysis. World
Development 10, I.
Furness C K 1981. Some aspects of fuel-wood usage and consumption in
African rural and urban areas in Zimbabwe-Rhodesia. Suid-Afrikaanse
Bosboutydskrif 117, 10-12.
Gandar M V 1982. Some social and environmental aspects of the use of
fuelwood in KwaZulu. In; Bromberger N and Lea J teds\ Rural studies in
KwaZulu, University of Natal Press, Pietennaritzburg.
Gandar M V 1983. Wood as a source of fuel South Africa. Monograph 4,
Institute of Natural Resources, Pietermaritzburg.
Gausmann H W 1974. Leaf reflectance of near infrared. Photogrammetric
Engineering, 40, 183-191.
Geldenhuys C
management.
Stellenbosch,
C
J 1983. A critical
Proceedings of the
Faris 98, 497-524.
evaluation of indigenous forest
Jubilee Symposia, University of
J Le Roux P J and Cooper K H 1986. Alien invasions in Geldenhuys
indigenous evergreen forest, In: Macdonald I A W Kruger F J and
Ferrar A A
South Africa.
(eds) The ecology and management of biological invasions in
Oxford University Press, Cape Town.
Gibbs-Russell G E and Robinson ER 1981. Phytogeography and speciation
in the vegetation of the eastern Cape. Bothalia 13, 467-472.
Grainger A 1984. Quantifying changes in forest cover in the humid
tropics: overcoming current limitations. Journal of World Forest Resource
Management 1, Academic publishers, 3-63.
- 76 -
Griffiths G H and Collins W G 1983. Mapping the greenness of semi-arid
rangeland vegetation in northern Kenya from Landsat digital data. In:
Remote sensing for rangeland monitoring and management. Reading Remote
Sensing Society, 108-122.
Harrison P 1987a.
(1559), 35-39.
A green revolution for Africa. New Scientist 114
Harrison P 1987b. The greening of Africa. International Institute for
Environment and Development- Earthscan, Paladin, London.
Hamburger H H 1985. Unpublished proceedings Nature conservation meeting,
Department of Development Aid, Pretoria.
Henderson
Transvaal,
L and Musil K
Bothalia 15, 1,2
J 1984. Exotic woody plant invaders of the
297-313.
Henderson L and Wells M J 1986. Alien plant invasions in the grassland
and savanna biomes. In: Macdonald I AW, Kruger F J and Ferrar A A, The
ecology and management of biological invasions in southern Africa. Oxford
University Press, Cape Town 109-117.
Heydorn A E F and Tinley
Synopsis of the Cape coast.
K L 1980. Estuaries of the Cape, Part 1.
CSIR research report 380, CSIR, Pretoria.
Hoffer R M 1971. Remote sensing potentials for resource management.
Biological effects on the hydrological cycle. Proceedings of the 3rd
International Seminar for Hydrology Professors. UNESCO, New York.
Hoffer R M and Fleming MD 1978.
aided analysis of satellite data.
University.
Mapping vegetation cover by computer
LARS Technical Report 011178. Purdue
Hoskins M W 1982. Social forestry in West Africa: Myths and Realities.
Paper presented at the American Association for the Advancement of Science
annual meeting. Washington, D c.
- 77 -
Howard J A 1970. Aerial photoecology, Faber and Faber, London.
Huntley B
P de V
ecosytems.
J 1984. Characteristics of South African biomes. In: Booysen
and Tainton NM (eds) Ecological effects of fire in South African
Springer-Verlag, Berlin, 2-17.
Jarman M
studying
usefulness
Cape Town.
L,
and
of
Bossi L
mapping
various
and Moll E J
the Fynbos
techniques.
1981. Remote sensing products for
Biome: an investigation into the
Department of Botany, University of
Jensen J R 1983. Educational image processing, an overview.
Photogrammetric Engineering and Remote Sensing, 49 (8), 1151-1157,
Johnson CT 1983. The forests and trees of Transkei. Veld and Flora 68,
109-110.
Kaale 1982 In: Foley G and Barnard G 1984. Farm and Community
Forestry, Earthscan, London.
Keeton G R 1984. The basic needs approach: a missing ingredient in
Development Southern Africa l (3&4), 276-293. development theory?
Kirmse R D and Norton B E 1984. The potential of Acacia albida for
desertification control and increased productivity in Chad. Biological
Conservation, 29. Elsevier, United Kingdom 121-141.
Lane I R
rangeland
management
1983. Estimation of carrying capacity of woody Tanzanian
from Landsat. Remote sensing for rangeland monitoring and
15. Reading remote sensing society, United Kingdom.
Le Roux P J du P 1985. The relevance of the basic needs approach to the
South African situation. In: Basic needs in rural areas: A report on a
seminar held in Cape Town on 19 February 1985. South African National
Scientific Programmes Report No 116. CSIR, Pretoria, 1-10.
- 78 -
Liengme C A
of Gazankulu.
1983. A study of wood use for fuel and building in an area
Bothalia 14, 2, 245-257.
Lubke R A, Tinley KL and Cowling RM 1986. Vegetation of the eastern
Cape: Tension zones and chorological complexity. In: Bruton MN and
Gess F W (eds) Towards an environmental plan for the eastern Cape.
Rhodes University, Grahamstown.
Mason 1981. In: Thomas I L, Benning V M and Ching NP 1987.
Classification of remotely sensed images. Adam Hilger. Bristol.
Macdonald I A W, Kruger F J and
management of biological invasions
Press, Cape Town.
Ferrar A A 1986. The ecology and
in South Africa. Oxford University
Macdonald I A W and Richardson D M 1986. Alien species in terrestrial
ecosystems of the Fynbos biome. In: Macdonald I AW, Kruger F J and
Ferrar A A (eds) The ecology and management of biological invasions in
southern Africa. Oxford University press, Cape Town, 77-91.
McGivern R, Martin D, Benjamin J 1972. Planimetric map revision with the
Bausch and Lomb Zoom Transfer Scope, Proceedings Annual Meeting American
Society of Photogram.~etry, 38, 615-616.
McKenzie B (ed) 1988.
forest and forest products.
Guidlines for the sustained use of indigenous
Occasional Report No 35, FRD, CSIR, Pretoria.
Milton M 1978.
presented at the
Durham.
A portable handheld
5th annual conference
"Landsat" radiometer. Paper
of the Remote Sensing Society
Milton S J and Siegfried WR 1981. Above ground biomass of Australian
acacias in the southern Cape, South Africa. Journal of South African
Botany, 47, 4.
- 79 -
Mnzava E M 1982. Village afforestation: Lessons of experience in
Tanzania. FAO, Rome.
Moller V 1985. Rural black's perceptions of basic need fulfilment. In:
Basic needs in rural areas: A report on a seminar held in Cape Town on 19
February 1985 South African National Scientific Programmes Report No
116, CSIR, Pretoria, 67-94.
Murray G F 1983. Reforestation in Haiti. Earthscan seminar, Cartagena,
Colombia.
National Academy of Science 1980. Firewood Crops. Shrub and tree species
for energy production. Board on Science and Technology for International
Development, NAS, Washington, DC.
Newby T S 1985. The use of digitally interpreted satellite imagery with
special reference to topographical shadow effects as an aid to vegetation
mapping in the Hottentots Holland Mountains catchment are in the western
Novaes R A 1979. Recent accomplishments and expectations of remote
sensing applications to Brazil. Proc. Remote Sensing for Natural
Resources. University of Idaho, Moscow, USA. 313-326.
Cape Province.
Palmer A R 1981. A study of the vegetation of the Andries Vosloo Kudu
Reserve Cape Province. Unpublished MSc thesis. Rhodes University,
Grahams town.
Peterken G 1981. Woodland conservation and management. University
press, Cambridge.
Prior J and Tuhoy J 1987. Fuel for Africa's fires. New
Scientist, 115 (1571), 48-51.
Robinove C J, Chavez P Jr, Gehring D, and Holmgren R 1981. Arid land
monitoring using Landsat albedo difference images. Remote Sensing of the
Environment 11 (2). 133-156.
- BO -
Sabins F F 1978. Remote sensing, principles and interpretation. W H
Freeman and Co. USA.
Sagar G R
populations
1, 163-176.
and
of
Harper
Plantago
J L 1961. Controlled interference with natural
lanceolata, P major and P media. Weed Research,
Scoggins DA and Piper SE 1985. Development of digital image processing
techniques for use with aerial survey and as an aid to current research in
remote sensing. University of Natal, Durban.
Sheddick 1954. In: Best M 1979. The scarcity of domestic energy. A
study in three villages. SALDRU working paper No 27, University of Cape
Town.
Simkins C 1984. What
poverty in the homelands?
has been happening to income distribution and
Development Southern Africa 1 (2), 142-152.
H, Lewy and Doby 1960. Intensive assesment of factors Smith J
influencing
best. In:
photocruising shows that local expressions of photo volume are
Howard J A 1970. Aerial photoecology. Faber and Faber,
London.
Steele and Ncholu 1983. Woodlot marketing study (north) final report.
Lesotho Woodlots Project, Maseru.
Taylor G F and Soumare M 1983. Strategies for forestry development in the
semi-arid tropics: Lessons from the Sahel. International symposium on
strategies and designs for reforestation and tree planting, Agricultural
University, Wagenheim, Netherlands.
Thalen D C P 1979. On photographic techniques in permanent plot
studies. Vegetation 39 (3), 185-190.
Thomas I L, Benning V Mand Ching NP 1987. Classification of remotely
sensed images. Adam Hilger, Bristol.
- 81 -
Thomson
firewood
Nicholson
J T 1979. Public choice analysis of institutional constraints on
production strategies in the West African Sahel. In: Russel and
(eds) Public choice and rural development. Choices for the
future, Washington D.C .•
Trollope W s W 1973. Fire as a method of controlling Macchia (Fynbos)
vegetation in the Amatola mountains of the eastern Cape. Proceedings of
the Grassland Society of South Africa, 8, 35-41.
Trollope WSW 1974.
the eastern Cape.
9, 67-72.
The role of fire in preventing bush encroachment in
Proceedings of the Grassland Society of South Africa,
Tucker C J, Ma;..vell E 1976. Sensor design for monitoring vegetation
canopies Photogrammetric Engineering and Remote Sensing 42, 1399-1410.
Tupper G J 1981. A preliminary evaluation of the applicability of
Landsat for the assesment of range conditions in the semi arid woodland in
the Cobar district of New South Wales. Technical Memorandum 81/2. CSIRO
Division of Land Resources Management, Perth.
Van Wilgen B Wand Richardson D M 1985. The effects of alien invasions
on vegetation structure and fire behaviour in South African Fynbos
shrublands: a simulation study. Journal of Applied Ecology, 22, 955-966.
Vujakovic P 1987. Monitoring
application for satellite imagery.
extensive "buffer zones" in Africa: An
Biological Conservation 39, 195-208.
Weber 1982. In Foley G and Barnard G 1984. Farm and Community Forestry,
Earthcan, London.
Wells K F 1971. Measuring vegetation changes on fixed quadrats by
vertical ground stereography. Journal of Range Management 24, 233-236.
- 82 -
Wells M J, Balsinhas A A, Joffe H, Englebrecht V M, Harding
G and Stirton CH 1986. Catalogue of problem plants of southern Africa.
Memoirs of the Botanical Survey of South Africa 53. Government Printer,
Pretoria.
Wells M J, Poynton R J, Balsinhas A A, Musil K J, Joffe H,
van Hoepen E and Abbott S K 1986. History of the introduction of
invasive alien plants to southern Africa. In: Macdonald I AW, Kruger F J
and Ferrar A A (eds) The ecology and management of biological invasions
in southern Africa. Oxford University Press, Cape Town 21-35.
Whittingham C P 1974. The mechanisms of photosynthesis. Edward Arnold,
London.
Williams A T 1986. The potential for the production of energy from
biomass in southern Africa. Unpublished MSc thesis, Department of
Engineering, University of Cape Town.
Wilson RC 1949.
by dot templets
225-236.
The relief displacement factor in forest area estimates
on aerial photographs. Photogra~~etric Engineering 15,
White P S 1979. Pattern, process and natural disturbance 1n vegetation.
Botanical Review 45, 229-299
Wickstead M
Project, Maseru.
1984. Woodlot marketing study tsouth), Lesotho Woodlots
Wimbush D J, Marrow MD, and Costin AB 1967. Colour stereography for
measurement of vegetation Ecology 48, 150-152.

- 83 -
Wyatt-Smith J 1982. The agricultural system in the hills of Nepal. The
ratio
In:
of agricultural to forest
Foley G and Barnard G
Earthscan, London.
land and the problem of animal fodder.
1984, Farm and community forestry.
APPENDIX 1
REVIEW OF TREE PLANTING STRATEGIES
INTRODUCTION
This project has shown that whilst large-scale clearance of indigenous
bush and trees can easily be monitored by remote sensing techniques,
gradual depletion is much more difficult to monitor. In this study this
has largely been due to the rugged terrain which introduces parallax
problems causing the canopy to obscure the understory and ground layers.
However, over any terrain the canopy can obscure understory. Complex
vegetation mosaics can also complicate the interpretation of remotely
sensed data thus making it difficult to monitor changes. Thus, using the
techniques of this study, degradation is only discernible when it has
reached an advanced stage. Foley and Barnard, (1984), state that" in the
majority of countries, this (gradual depletion) is the greatest single
cause of deforestation and the breakdown of traditional systems for
managing tree resources,"
In some areas, livestock grazing was found to be the greatest threat to
environmental stability. Fox (1982), says of a region of Nepal. "The
undue emphasis placed on firewood as the cause of deforestation has
obscured the role played by livestock". Numerous authors have discussed
the problems of overstocking throughout southern Africa. The total number
of cattle in South Africa including the National States and the TBVC
states (Transkei, Bophuthatswana, Venda and Ciskei) was estimated to be
10,3 million in 1983/84. The number in the TBVC States has remained at
around 2 million for the past few years (Department of Agriculture, 1984).
The number of goats is difficult to estimate. Throughout the study area
cattle and goats freely grazed and browsed within the woodlands and
although not quantified, casual observations showed a profusion of browsed
plants and exposed roots of woody species.
Indigenous
constitute
nevertheless
communities.
- 2 -
forests (including the woody thicket communities of this study)
the smallest biome in southern Africa (Huntley 1984). It
makes a considerable contribution to the basic needs of rural
Cunningham and Gwala (1986) stress the value of indigenous
plants as building materials. These species provide a cheap and renewable
resource which helps fulfill the urgent need for low-cost housing for a
rapidly expanding population.
A variety of woody plants are used in construction. Timber collection for
construction is potentially far more damaging to the plant communities in
which this takes place than is collection of firewood. Livewood is
collected for poles and laths. Dense and durable, termite resistant
species are required for construction and these species have a low annual
increment (Cunningham et al 1987). Colophospermum mopane is
recommended as a suitable species for cultivation and it is favoured for
construction by rural people in southern Africa in those areas in which it
occurs (Liengme 1983, Cunningham 1985). In the Transkei, where forest
species are very similar to those of the lower Fish River Valley, the
species favoured for poles and laths are Pavetta lanceolata, Duvernoia
adhatodoides, Chaetacme aristata, Ptaeroxylon obliquum and Apodites
dimidiata (Johnson 1983). Where building timber is scarce then
alternatives such as pine beams, gum poles and concrete blocks are used.
Indigenous forest exploitation is permitted on a limited scale in the
Transkei. Unless forest products are specifically protected by the
Transkei Forestry Act they may be sold for construction and other domestic
use. Firewood may be collected under the "theza" system (where dead and
fallen timber may be collected and removed free of charge). These
products are not sold or harvested on a sustained yield basis and since
most of the demand for livewood is for small diameter poles the forest
structure is rapidly changing (Cameron et al 1987).
- 3 -
In the Ciskei the situation is less severe. Hughes R (1987. cers
comm) in the government owned for·ests, species such
as Ptaeroxylon
melanophloeos are
"theza" collection
obliauum, Olea
sold
is
as sa,"' logs
permitted but
by
it
eu.rooaea.
the
is
road.
felt
Rapanea
Here too
that in the
long-term this
be detrimental
will affect nutrient cycles and other systems and
to the forests. Forests in private hands are
little utilised but are susceotible to complete clearance for
agricultural or industrial expansion. Forests under control of a
Headman are the most at risk and are being devastated due to a
total lack cf control.
According
population
part of
wood are
to the World Bank (in Harrison 1987b). 75% of the
in Asia and Africa use traditional fuels. The largest.
this is timber. In the third world 1,14 billion m3 of
burned as fuel each year (FAD, i982). As a result many
have been funded to remedy the increasing discreoancy pr·ojects
between the supoly and demand for fuel. Foley and Barnard
( 1 984) ,
over· the
list 140 projects funded by international donor agencies
last two decades. Of these, 71 are projects in Africa
(outside of South Africa> and 47 of these have been implemented
since 1980. The mean investment per African project was of the
order of USS3,73 million and totalled some USS264,85 million.
Five established projects are known for South Africa. In spite
of this considerable investment there has been a poor record of
successful projects in Africa. By contrast the Asian projects
have been far more successful. The reasons for this are complex
and are the result of soil and climatic variations between the
two continents and di ffer·ences in the socio-economic,
philosophical and political bases (Harrison 1987).
In time
commercial
fuelwood
some projects have expanded
ventures, often responsible for
and sometimes food situation.
to become purely
worsening of the
This has come about
because some projects have
the result that the more
generated competition for land with
expropriated the land
successful commercial
of the less successful
farmers have
and turned
- 4 -
agricultural land over to timber production. The timber products have
then frequently been sold in distant urban areas where demand is high and
prices frequently greater.
The demand for fuelwood and constructional timber is growing with the
population and the consequent environmental stresses imposed on natural
vegetation, soil and water resources by the fuelwood demand are severe.
Thus it is imperative to evolve successful wood growing strategies.
CONSTRAINTS
It is appropriate to look first at constraints to wood production
programmes. These range from socio-political to economic and perceptual.
It is from within this framework of constraints that the problem and any
proposed solutions must be viewed.
Cultural constraints
Tradition may mediate
variety of reasons,
of pests, competition
religious taboo.
against the planting of trees close to homes for a
spurious or otherwise. These include the harbouring
with crops for water, sunlight and nutrients and
Mnzava (1982), points out that some expressed antipathy towards trees may
be an excuse not to participate in planting projects. This may be
particularly so where there is direct government involvement in the
project.
- 5 -
Perceptual constraints
The perception by a community of the problem of deforestation may be such
that there is a lack of incentive to plant trees. During this study some
local people in the Ciskei expressed the view that there was still wood
available in the forest and if that supply were exhausted then it could be
purchased from other areas. There was therefore little incentive to take
on the extra work load which would be imposed by a planting programme.
All agreed however that some kind of planting scheme would be a good idea.
A lack of education
problems also appears
in long-term projects.
Land tenure
and extension, coupled with immediate economic
in part to be responsible for the lack of interest
"The most favourable position for tree growing is where the land is
privately owned and individuals hold secure title .•• " (Foley and Barnard,
1984). In many areas of Africa, including South Africa, rural peasants do
not own the land they farm (Gandar 1982 ). Traditionally land tenure in
Africa before colonial times was communal. Although the land was not
owned by a particular farmer, he had rights to its produce and the
produce of any trees which they planted (Harrison 1987). Where land is
not owned by the peasants they cannot be reasonably expected to grow a
crop whose harvest they may be unable to enjoy. This problem is
exacerbated where there exists the threat of forced removal.
Communal grazing may also inhibit tree planting programmes since
protection of tree seedlings may cause conflict through the restrictions
placed on the grazier's stock.
- 6 -
The success of the various agroforestry and green belt schemes in Kenya is
largely due to the fact that in that country the old communal user rights
have been converted to permanent ownership. Most smallholders in Kenya
therefore, own their land.
Ownership of trees
The question of the eventual ownership of trees, even where the land is
privately owned may create problems.
Thomson
planted
could be
farmers.
(1979) noted problems in the Sahel where indigenous trees had been
by farmers but permits had to be obtained before indigenous trees
cut. This restriction intended to protect trees also alienated
In Haiti, trees bought and planted by the government on rural
peasants' land were seen as a step towards expropriation of the land by
the government (Murray 1983)
Conflicting responsibilities
The scale of the contribution of women to household and subsistence
farming in Africa has been highlighted by many authors (Gandar 1982,
Eberhard 1986). Men frequently work in the cities away from their rural
homes. Women therfore bear the burden of home and smallholding
maintenance. They are also responsible for the management of any wood
production programmes which involve the community whilst still carrying
the responsibility of wood collection until the planted trees are
harvested. Mnzava (1982), notes that in Tanzania "tree planting coincides
with agricultural activities and naturally the latter get priority."
Men frequently see their responsibility as one requiring their migration
to the urban areas to obtain paid employment.
- 7 -
These conflicts generate a labour shortage in a situation where human
labour supplies 84% of the energy input into rural agriculture. This
contrasts with the Asian situation where draft animals contribute twice as
much energy to agriculture as do draft animals in Africa (Harrison 1987) ••
The time factor
The long-term nature of tree growing is a serious constraint. However, if
tree species are correctly chosen and growing conditions are not unduly
hostile, then short-term benefits may be enjoyed within as little as two
years. This is of particular relevance to the agroforestry situation.
TREE PLANTING STRATEGIES
These fall into 5 main categories:-
Any of
systems
systems:
farm forestry
family tree growing
community forestry
agroforestry
these approaches
or land may be
Farm Forestry
may be adapted to fit existing land tenurial
re-allocated for use in one or other of the
To date these systems have been used to promote commercial tree growing on
privately owned land. In India, fanning of Eucalyptus spp has become
extremely lucrative yielding a return greater than from other cash crops
- 8 -
This approach was however less successful in the Phillipines (Foley and
Barnard 1984). The yields are greatest where inputs are greatest and thus
the poorest farmers may be unable to participate. According to French
(1982), the desirability of subsidy should be carefully considered before
embarking on a subsidised programme, as these have often failed. Market
stability needs to be assesed and assured. This has been achieved in
India through co-operatives. However, there are undesirable effects
associated with this system. The more important of these have been
recognised by various authors and the following are selected as the most
important:-
The rich benefit most since they are best placed to take advantage of
subsidies.
The system does not
promised and expected.
utilise it most. It
short term, to plant
survival will be lower.
deliver the social and environmental benefits
This is because the rich benefit most and thus
does not make economic sense, at least in the
trees on marginal land where growth rates and
It may
wealthy
be harmful
land owners
to the poor since they cannot compete with the
and may therefore be forced to sell their land.
Thus agricultural land is lost to commercial timber production. Even
the eventual timber harvest may be sold to commercial concerns or by
the land-owner himself, but in urban areas. Thus fuelwood and the
other benefits accruing from the project are often unavailable to
those whom the sytem was established to help.
Family Tree Growing
This type of programme relies on non-commercial incentives. It also
depends upon local people perceiving a need for planting and according it
sufficient priority. This approach has enjoyed relative success in Africa

- 9 -
and elsewhere. This kind of project may require little input other than
to provide access to appropriate seedlings and to provide technical advice
through extension workers. The multiple-use tree Neem, Azadirachta
indica, is potentially one of the most valuable of all arid area trees
(National Academy of Science 1980). It is the most important plantation
species
due to
in Nigeria (Harrison, 1987) and it has spread rapidly in the Sahel
its acceptability to local people (Foley and Barnard, 1984). Its
popularity is due to its rapid growth, resistance to pests and drought,
ready coppicing and its unpalatability to stock, thus making protection of
seedlings easier. Fencing of palatable seedlings to protect them from
stock represents a major expense and labour input (Kirmse and Norton
1984). Unpalatable species however are less useful in some agroforestry
systems.
leucocephala has spread rapidly as a component of
and has been selected and planted by farmers at a
1986 pers comm). Many projects at this level have
In Kenya, leucaena
agroforestry systems
family level (Fenn T
failed because of the
whereas shade, fruit
assumption that fuelwood is the priority need
and food may be more important (Weber 1981). Thus
species choice and location of the plantings may be other than expected by
the development agency. It may be more appropriate to encourage people to
plant trees at this level in small clumps within and bounding compounds.
Common sense and the experience with Azadirachta suggests that
multiple use trees would be the most attractive a proposition. This also
highlights the value of the agroforestry approach since the trees serve
important functions almost from planting.
This
that
space
will
are
good.
family approach to tree planting has, as a major advantage, the fact
the trees planted do not compete with crops or livestock for growing
or grazing and they may also provide environmental benefits. People
only plant trees in this situation if they want to and if the species
acceptable to them. If trees are planted, then survival rates are
This kind of planting is also unlikely to compete with traditional
labour demands. However, trees will only be planted if people perceive a
- 10 -
need. If they live near to woody vegetation there may be little incentive
to plant even if they recognise that deforestation is taking place. This
system also demands that families have security of land tenure and can
therefore anticipate benefits from the planting.
Research programmes are needed to detennine best species for particular
situations but there is sufficient information and urgency to establish
programmes based on present knowledge immediately. What is of very great
importance is an indication of the potential sustainable yields and
possible management strategies for a variety of vegetation types within
South Africa and the TBVC States.
In the Sahel region of Nigeria it had been estimated that indigenous trees
would yield +/- O,Sm3 of wood per year. Research showed the true yield
to be two to four times greater. Controlled use of the natural vegetation
for fuel avoided destruction of the natural vegetation for woodlots and an
expenditure of US$700-SOO per hectare on establishment of Eucalyptus
or Azadirachta plantations (Harrison, 1987)
Community forestry
This has
widespread
be driven
systems,
rewards.
particular significance in the African situation because of the
communal land tenure system. A community forestry system may
by both commercial and noncommercial interests but, as in all
the participants must believe that they will reap substantial
China achieved great communal tree planting success through political
motivation. More than 28 million hectares were planted in the 20 years up
to 1978.
South Korea launched a 10 year planting programme in 1973 with a goal of
1 million hectares. The programme was underpinned by a network of village
- 11-
forestry associations which managed projects with government direction.
65% of the programme costs were provided by the government. 35% was
provided by the communities and took the form of services and labour. The
programme was accompanied by a broad range of socio-economic strategies
and the community participated in a profit-sharing scheme. The planting
goal was acheived 5 years ahead of target. It should be noted that at the
start of the programme 75% of forests were privately owned and managed,
thus an existing responsibility and skills structure could be easily
adapted.
funding to
The government was also in a position to inject large-scale
subsidise planting, nurseries and extension progammes.
(Barnard and Foley, 1984)
In India, community forestry programmes have achieved success through
schemes managed jointly by the village community and by the forestry
departments. Initially trees were planted along roads, railways and
canals.
community.
At harvest the proceeds were split between government and the
Some villages allowed the establishment by the forestry
department of four hectare woodlots on communal lands in return for the
rights to fuel, food and fodder plus a 50% share in profits at harvest.
After an initial period of suspicion these supervised woodlots expanded to
over 28 000 ha in 8 years although in some schemes seedling survival has
been very poor. Even so, this type of government-managed scheme has
achieved greater success than similar projects which required the active
participation of villagers.
In Africa the picture has been very different. In the Sahel, despite an
estimated US$160 million spent on woodlot projects between 1975 and 1982,
achievements have been poor. Of the estimated 25 000 ha planted,
approximately 33% have grown so poorly that little if any wood is produced
(Weber 1982). Similar failures have been reported in Tanzania where
success has been achieved only where villagers have been employed as
labourers in plantations established and managed by forestry departments
(Tucker et al in Barnard and Foley, 1984). Hoskins (1982) said of the
Sahel: "Some social scientists have gone so far as to suggest that no
communal projects are possible ••• "
- 12 -
A major problem which can be anticipated in community forestry is that of
access to the resource. This may be more than the problems associated
with policing of harvesting, but also as a result of a hierarchically
tiered community. The people do the work but the chief receives the
lion's share of the products. This may extend into the domain of profit
sharing. This is in line with the traditional control of the chief in
community affairs in Africa. It is therefore obviously important to
establish agreement on questions of work distribution, responsibility and
profit sharing before commencement of the project. Failure to do so may
result in community dissatisfaction and failure of the programme.
Community forestry is attractive from the point of view of surmounting the
problems associated with projects under the cow~unal land tenure system
but it demands a good deal of community responsibility and cooperation and
may therefore only be appropriate in selected situations.
Agroforestry
Agroforestry
components of
used to shade
with oil and
and have been
systems of one kind or another have been traditional
some of the worlds agricultural systems. Trees have been
coffee and tea crops and food crops have been intercropped
coconut palm.
described by
The advantages of these systems are numerous
many authors. The benefits are related to
increased protection for crops from sun and wind, soil enrichment roles
where leguminous trees are grown, increased fodder supply if palatable
species are used, fuelwood supply and environmental protection. Fenn and
Underwood (1986), remark that most of the current agroforestry development
is taking place in arid developing countries. International research is
lead by the International Council For Research in Agroforestry (ICRAF). A
variety of systems based on different species, agricultural regimes and
edaphic conditions are currently under investigation. Some research in
South Africa has been carried out by the ARDRI programme for agroforestry
research at Fort Hare University in the Ciskei (Fenn and Underwood, 1986)
- 13 -
Research is also being undertaken by the Institute of Natural Resources at
the University of Natal and by the Legume Research Centre at the
Rietondale Experimental Farm of the Department of Agriculture and Water
Supply in Pretoria. In particular, this latter organisation is
investigating leaf yield of multi-purpose trees for fodder and mulch
production.
Agroforestry systems have the potential to increase food production in
rural areas and to improve the quality of life of people in these areas,
not least by reducing the time which has to be spent collecting fuel. Any
agroforestry development must be accompanied by an extension programme,
demonstration plots and a nursery network. This is particularly important
where the system is alien to traditional farming systems.
Kenya has the most developed agroforestry programme in Africa. The system
is that of "alley cropping",· where trees are grown in rows with crops
between, The programme is based on six agroforestry centres managed by
the Ministry of Energy but originally established through a USAID
programmme. The centres are primarily for research and training. Of
great interest is the departure from normal forestry planting and
management methods. Trees are more closely planted both within and
between rows. Coppiced or pollarded yields are increased up to tenfold
(Harrison, 1987). The project provides cheap seedlings and allows the
farmer to choose his own trees from a range of over 125 species.
Demonstration plots allow farmers to see various species in an
agricultural situation. Tendencies have been towards the selection of
citrus, Eucalyptus, and the rapid growing, multi-purpose tree,
leucaena leucocephala. Harrison (1987) concludes his discussion by
saying: "Agroforestry is arguably the most important discipline for the
future of sustainable development in Africa". It is an approach which
should be given great priority and support.
- 14 -
ESTABLISHMENT OF TREE PLANTING PROGRAMMES
Programmes may either be initiated and managed entirely by an agency
outside the community of the region in which the project is developed, or
the programmes may involve to a greater or lesser degree members of the
community.
In the first instance, recommendations as to identifying suitable tree
species, community priority needs and availability of land are of
paramount importance. However, responsibility for the programme remains
in the hands of a responsible organisation with expertise and
infrastructure. The community may be involved as a source of paid labour
which may in the long-term be of most benefit since, in the South African
context, jobs in rural areas are badly needed.
Where the community is expected to participate voluntarily in any
programme then the situation becomes more complex.
Forestry department nurseries are, by and large, orientated towards
commercial production and this may have to change in order to provide the
species acceptable to the local communitites. Appropriate species may be
different from region to region, not just for climatic or edaphic reasons,
but because of traditional utilisation patterns.
It should be borne in mind that rural people of a limited educational
background tend to be resistant to change and to government interference
in their traditional lifestyle. Any planting scheme involving the
community should be properly introduced by an awareness programme followed
by a continuous extension programme. At least in the early stages,
traditional planting methods and familiar species should be used. New
species and techniques should be introduced gradually.
Success in terms
achieved in Chad.
of community participation and seedling survival was
Over a four-year period a community planting effort
- 15 -
planted a total of 470 000 seedlings of Acacia albida, a familiar
multi-use indigenous species. In the long term the programme failed
because of inadequate extension and support services (Kirmse and Norton,
1984).
A network of nurseries is also essential. The people expected to
participate in the planting programmes are for the most part poor and thus
experience severe logistical problems with regard to transport of
seedlings. In Kenya, demonstration plots associated with large scale
nursery development have played an important role in generating
considerable public interest in agroforestry (Fenn T 1986 pers comm).
Education and extension
It is evident that in South Africa, even amongst adequately educated
whites, conservation awareness is severely retarded. Where awareness does
exist there is little evidence of motivation to respond positively.
Amongst the black community the situation is far worse. Any attempt to
encourage tree planting would require an extensive and carefully planned
and executed awareness programme. The KwaZulu Bureau of Natural Resources
has achieved considerable success in generating nature conservation
awareness by means of an intensive programme extending over several
years. The support of the Chief Minister, Chief Buthlezi, has lent
importance to this programme and community leaders at all levels have
visited environmental projects. A similar kind of effort would be needed
to promote tree planting. Tree planting is already promoted by nature
conservation departments and by national institutions such as Arbor Day
and World Environment Day. The present effort is however no more than a
token, being largely ceremonial in character.
Publicity campaigns mounted in Tanzania have reportedly been successful in
generating public awareness of the need for tree planting. (Kaale 1982 in
Foley and
seedlings
Barnard 1984),
from forestry
- 16 -
reports a five fold
department nurseries
increase in demand for
during an awareness
campaign. In India, an intensive campaign during 1972 resulted in a three
fold increase in seedling demand. Political support is also very
important. In Kenya on the other hand, President Moi has given tree
planting priority and support. In 1980 he required every district
commissioner and chief to establish a tree nursery. In 1983 this was
extended to every school. By this time more than 1 300 government
nurseries throughout the country had a stock of over 80 million
seedlings. During the national soil and water conservation week over
3 million trees are planted (Harrison 1987). Any awareness campaign must
extend throughout all strata of society and for a prolonged and continuous
period.
of a
Such a prograrr~e must be accompanied by simultaneous development
nursery network and other infrastructural components appropriate to
Following creation of demand it is vital that the supply
maintained and that negative associations relating to
legislation and uniformed officers are eradicated.
identifies the single, multi-purpose agricultural
extension officer at the village level as the most valuable channel for
the progra~me.
of seedlings is
official forestry
Harrison (1987),
the promotion of new ideas.
Availability and distribution of seedlings
This is only considered from the point of view of supplying seedlings for
planting by individuals and communities. Two priorities are of the
greatest importance. There must be a network of nurseries which is
sufficiently extensive to enable seedlings to be accessible to anyone who
wishes to plant. The seedlings must be big enough to have a reasonable
chance of survival. Personal experience in the National States suggests
that teacher training colleges and schools could and would greatly assist
in establishment and management of nurseries and demonstration plots.
More than 66% of the 18 000 nurseries in Gujarat in India were school or
- 17 -
privately owned nurseries (Foley and Barnard,
non-government and voluntary organisations such
Council of Women are of particular significance
programme (Fenn T 1987 pers comm).
1984). In Kenya,
as the Kenya National
to the tree planting
Seedling distribution has been a problem because of the great weight of
seedlings and soil in traditional polythene bags. In India seedlings have
been grown in lots of 1 000 in shallow wicker baskets. Transport of large
numbers of small seedlings is thereby possible but these must be
transplanted into conventional polythene pots until large enough to plant
out. This is important - a major cause of plantation failure has been
planting of too small seedlings.
Seedlings grown in narrow polythene tubes in Haiti have enabled 60 times
as many to be carried as would be the case using conventional polythene
pots (Murray 1983).
Direct sowing of seeds reduces distribution costs and other problems but
this method requires considerably more husbandry and failure rate is
high. The method is, however, in use in Malawi and other parts of the
world (Fenn T 1987 pers comm.). Seeds may be broadcast successfully where
pest resistant, nutrient rich and water absorbent coatings are used. One
person can broadcast tree seed over 6-8 hectares per day depending upon
conditions. Considerable success has been achieved in the United States
and New Zealand with aerial sowing of tree seed. Aircraft achieve sowing
rates, under good conditions, of about 80 hectares per hour (National
Academy of Science 1980).
Species
The concept of intensive, large scale tree planting programmes is a new
one in the rural areas which need the trees. Rural people tend to be
critical and suspicious of new approaches and technologies particularly if
- 18 -
these are government directed. Failure of an early planting may very
considerably reduce confidence in the programme. The choice of species
and approach is therefore of prime importance. Reliability and resistance
to drought and disease should be of more importance in the species choice
than ultimate production capability. Species should also fulfill the
needs of the people as seen by themselves. Additional benefits from the
planting should be seen as valuable spin-off.
Species
species
of the
are
for
most
extensively described in "Firewood Crops: shrub and tree
energy production" (National Academy of Science 1980). ~o
promising species are Eucalyptus spp, successfully and
and Leucaena leucocephala which has displayed great
parts of the world. Both of these species are however
widely used,
success in some
susceptible to
planted.
failure if the wrong varieties for a given situation are
Indigenous species as candidates for wood production in plantations have
been largely ignored in South Africa mainly due to their longer harvest
cycle and the fact that many are difficult to establish. Indigenous
species however have several advantages. They are familiar to rural
people and are traditionally used, they are often multiple use species and
they are suited to local environmental conditions. Use of these species
is also more desirable from an environmental protection point of view. In
some areas, management of existing bush may provide greater wood
production than plantations of exotic species. In an area of less than
000 mm per annum rainfall in the Sahel, Acacia senegal, an
indigenous species, has averaged the same wood production of l,S tons per
hectare under no management, as have planted and managed Eucalyptus
spp (Taylor and Soumare 1983). It would be economically advantageous to
devise a management strategy for existing woody vegetation since there is
no expenditure on clearance or planting. It may still be necessary to
expend resources on seedling protection within the indigenous woody
communities because of the need to exclude stock.
- 19 -
PROJECTS IN SOUTIIERN AFRICA
For the purposes of this review, southern Africa includes the Republic of
South Africa and its so-called National States within its borders, the
Kingdom of Lesotho and the TBVC states (Transkei, Bophuthatswana, Venda
and Ciskei) of South Africa.
1,2 million hectares of land in South Africa are given over to commercial
forestry projects (Department of Environment Affairs 1981/1982). Only 6%
of this falls within the TBVC states , where demands for timber as a fuel
and constructional timber are great (Williams 1986). An additional 300
000 ha of land is covered by indigenous forests,
Commercial afforestation in South Africa is based on introduced species
which provide timber principally for construction, mining, veneer, plywood
and board and the paper and pulp industries (Williams 1986). Very little
of this timber or the residues resulting from its processing are available
for firewood. This is largely because of the logistics which make it
uneconomical to pack and transport firewood long distances (Gandar M V
1986 pers corr~). In addition, the energy requirements of drying kilns and
sometimes of self-generated electricity require that all the residues be
used in situ ( Williams 1986).
Charcoal is currently
mately 104 000 tonnes
produced in South Africa and in 1981/82 approxi
were produced of which only 31% was used for
domestic purposes in South Africa. The rest was either exported or used
in industrial applications (Williams 1986).
It is estimated that the total fuelwood demand in South Africa, the TBVC
States and the National States is in the region of 4,4 million m3 per
year. The area of plantation required to provide this total is estimated
to be 600 000 ha, half the present total area of commercial forestry.
Existing woodlots cannot nearly meet this demand.
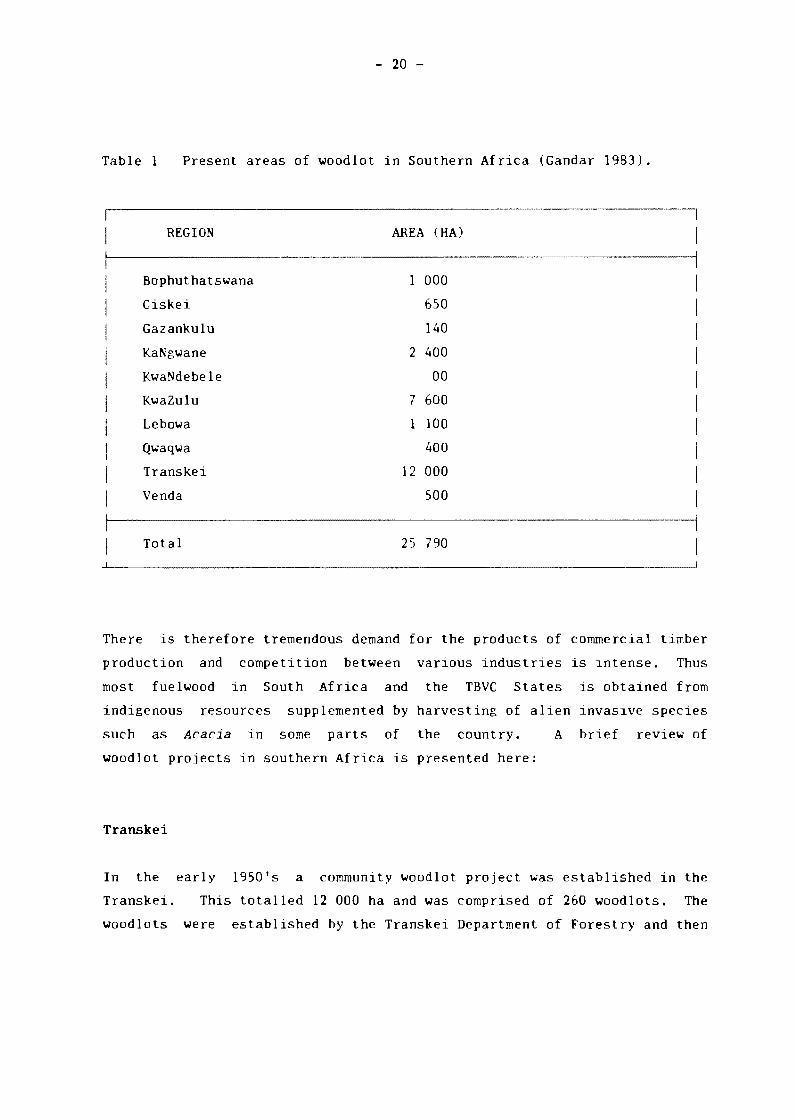
- 20 -
Table l Present areas of woodlot in Southern Africa (Gandar 1983).
REGION AREA (HA)
Bophuthatswana 1 000
Ciskei 650
Gazankulu 140
KaNgwane 2 400
KwaNdebele 00
KwaZulu 7 600
Lebowa 1 100
Qwaqwa 400
Transkei 12 000
Venda 500
Total 25 790
There is therefore tremendous demand for the products of commercial timber
production and competition between various industries is intense. Thus
most fuelwood in South Africa and the TBVC States is obtained from
indigenous resources supplemented by harvesting of alien invasive species
such as Acacia in some parts of the country.
woodlot projects in southern Africa is presented here:
Transkei
A brief review of
In the early 1950's a community woodlot project was established in the
Transkei. This totalled 12 000 ha and was comprised of 260 woodlots. The
woodlots were established by the Transkei Department of Forestry and then
- 21 -
given to Tribal Authorities for management. The project is considered to
have failed because of poor management and over-utilisation and the
woodlots have now reverted to the Department of Forestry (Eberhard A A
1986 pers comm). The reasons for the failure are unknown but it is known
that many of the constraints in this report were not considered or even
appreciated 30 years ago. It is known that many early projects in the
Transkei such as the grazing strategies failed because of the failure of
the responsible department to "carry the people along with the project",
In other words there was frequently inadequate preparation, education and
extension (Hamburger 1985),
The Transkei government recently applied for Development Bank funding to
establish a forestry programme with an afforestation target of 9000 km 2
by the year 2020. Minimal community involvement was planned, This is in
direct conflict with the pre-requisites for success presented in this
report.
Ciskei
The present woodlots in the Ciskei are not making a significant
to either fuelwood or constructional timber supplies to rural
As a result the Ciskeian rural community does not perceive
a sufficient source of energy or constructional timber
contribution
communities.
woodlots
(Bembridge
as
and Tarlton 1986). The Agricultural and Rural Development
Research Institute (ARDRI), at the University of Fort Hare in the Ciskei
has for some time had a programme of woodlot research to remedy this
situation. This programme is based on an introduced tree, Leucaena
leucocephala. This species, which has several hundreds of varieties, is
a multi-purpose tree providing building poles, fuel, fodder, fertiliser
(from the leaves) and since it is a legume, nitrogen fixing bacteria in
nodules on the roots increase the nitrogen content of the soil. It is
very fast growing and has acheived some of the highest total yields of
biomass recorded (National Academy of Science, 1980). In addition it will
- 22 -
grow in a variety of growth forms from trees to hedges and responds well
to coppicing.
ARDRI is presently conducting trials under different climatic conditions
and is researching this species' application in agroforestry systems.
KwaZulu
The South African Pulp and Paper Industry (SAPP!) together with funding
from the Gencor Development Fund has established a timber project close to
a major mill at Mandini. The project is designed to help rural
communities as well as to supply the timber industry with timber. The aim
of the project is not production of fuelwood but thinnings and other
residues will be available to local communities for fuel.
Potential participants in the scheme undertake to sell timber to SAPPI at
the prevailing market price. In return SAPPI provides seedlings and
interest free funding to maintain the plantation until the timber is sold
at which time outstanding loans must be paid. The project is underpinned
by a supporting infrastructure of extension services and nurseries. As a
result the project has met with a great deal of success and by 1985 the
project had 67 participants and 104 ha under trees. Plantations are of a
small size, the largest being 5,7 ha and the smallest 1,7 ha.
A woodlot project has been established at Embongolwane with the assistance
of the Institute of Natural Resources of the University of Natal. A key
factor in this project has been the support of the headman of the
community who gave his own land to the project. The project is still in
its early stages but it is attracting much interest and support. British
Petroleum (BP) has produced an educational videotape which is being used
by the KwaZulu Bureau of Natural Resources and other institutions to
promote woodlots. As a result there have been a number of new
participants to the project. The membership fee is used to expand the
woodlot.
- 23 -
Lesotho
The most successful project to date is the one established in Lesotho.
The project was well ·funded with a budget of over R4 million. The
long-term goal of the project is to establish a viable afforestation
programme supported by adequate and appropriate extension services. The
area planned is in excess of 50 000 ha and is designed not only to provide
fuel and constructional timber but also to stabilise catchments. As in
most such projects, development was based on alien tree species, notably
Eucalyptus. A major problem associated with monospecific developments
such as this is their susceptibility to pests. More recently,
Eucalyptus plantings are giving way to conifers which, however, do not
coppice. Re-planting after harvesting increases costs and the production
time. Present anticipated fuel production cycles are in the order of 7-12
years (Steele and Ncholu 1983, Wickstead 1984).
Although felling of the earlier plantings has cow~enced, difficulties have
been experienced in selling the timber although it costs only 50 cents
per headload. This problem seems related to the relative inaccessibility
of plantations which are frequently on hilltops.
There are few other fuelwood planting strategies in Lesotho although some
families obtain wood from their own trees or from communal forests (Steele
and Ncholu, 1983), The balance of the fuel needs are supplied by
alternative fuels such as dung, paraffin and scrub.
POTENTIAL IMPACTS OF ALIEN SPECIES PLANTED FOR FUEL
The most promising species for timber production, whether in plantations,
woodlots or agroforestry systems, have the potential to be invasive. This
is a major disadvantage but is inevitable since "good" species are
necessarily vigorous.

- 24 -
The National Academy of Science (1983) opens its catalogue of fuelwood
species with a warning. It states that the recommended species are
agressive and grow rapidly. They are appropriate for areas in which there
is an acute fuelwood shortage. In areas where fuelwood is still available
these recommended species should be introduced with great care and in any
local species should be given priority. To date all the fuelwood
established in southern Africa have used introduced species. The
trials,
projects
National Academy catalog, however. includes nine species and 14 genera
which are indigenous to southern Africa. These are as follows:
Indigenous genera
Duvernoia
Albizia
Calliandra
Cassia
Commiphora
Croton
Dalbergia
Excoecaria
Sapium
Tamarix
Terminalia
Trema
Ximenia
Zizyphus
Indigenous species
Acacia nilotica
Acacia senegal
Acacia tortilis
Balanites aegyptiaca
Brachylaena illicifolia
Colophospermum mopane
Hibiscus tiliaceus
Tarchonanthus camphoratus
Tarchonanthus minor
Wells
total
(1986) lists 789 species of alien plants in South Africa. This
excludes approximately 200 other species which may have originated
the country. Most of the species with the potential to transform
are woody shrubs and trees (Wells et al. 1986). the very kinds of
outside
habitats
- 25 -
plants needed as fuelwood, The spread and establishment of many of these
species is facilitated by human impacts (Sagar and Harper 1961). These
include clearance of indigenous vegetation, abandonment of agricultural
land, collection of timber in indigenous communities and its consequent
opening up of the canopy, and grazing and browsing pressures. Some
species introduced in the past for forestry have since become invasive
transformer species, for example Acacia dealbata, A melanoxylon, Hakea
sauveolens, Caesalpinia decapetalaand a variety of Eucalyptus and
Pinus species (Wells et al 1986).
In spite of the potential impact of alien woody species on indigenous
plant communities there has been very little research into the biology of
these species outside of the fynbos biome, A notable exception is
Acacia melanoxylon because of its impact in indigenous forests
(Macdonald et al 1986).
The potential effects of alien invasive species differ from biome to biome
according to climatic and competitive factors. Woody plants are popularly
considered to reduce erosion but it has been shown that dense stands of
such as Pinus can increase erosion rates particularly
are harvested and burned (Cowling et al 1976, Henderson and
This may be due to the reduced herb layer growing under
some
where
Wells
species
stands
1986).
dense alien canopies. Along river courses, some species such as Acacia,
Pinus and Sesbania have been responsible for accelerated erosion.
These species are not adapted to flash floods and are consequently easily
torn out of the river bank and so dislodging and exposing large volumes of
soil (Henderson and Musil 1984, Brown and Gubb 1986).
Fires in the fynbos biome are more intense and environmentally damaging
where there are stands of alien vegetation (Van Wilgen and Richardson
1985).
woody
likely
In the grassland biome this is also true since rapidly growing
invaders increase the fuel load (Henderson and Wells 1986), This is
to be true in all those situations where woody alien growth is more
rapid than that of the indigenous species.
- 26 -
Acacia species invaders increase the nutrient levels in soils. In
particular, nitrogen, phosphorus and carbon cycles are greatly changed.
In indigenous communities this may have severe impacts on species adapted
to low nutrient levels (Macdonald and Richardson 1986). Invasion of the
fynbos by invasive species has reduced both floral and fauna! species
richness (Macdonald et al 1986).
In other biomes the phenological characteristics of a species may be
responsible for its success. Earlier and more rapid germination, drought
tolerance and high seed production with efficient dispersal mechanisms are
major contributory factors in the arid and semi-arid biomes (Brown and
Gubb 1986). Particular threats in this regard are Prosopis species
and Melia azedarach. These two species, together with Eucalyptus
species, are the most successful invaders of this region although
Caesalpinia gilliesii, Casuarina equisetifolia and Tamarix
ramosissima are also cause for concern. Expensive eradication
programmes are in operation to control Prosopis around Windhoek and in
the Swakop river but the species is still planted in other areas (Brown
and Gubb 1986). The spread of these species is associated with human
settlement and agriculture where it is planted, and seeds dispersed by way
of water courses.
In the wetter grassland and savanna biomes alien species are again
associated with human impacts such as abandoned lands, railways and roads
(Henderson and Musil 1984). Acacia species, Caesalpinia, Sesbania
and Prosopis are the major threats to these indigenous habitats.
Invasions are particularly heavv in the eastern Cape, Ciskei and Transkei
where there is a considerable overlap of the ranges of a number of alien
species. This is because of the region's dense settlement, the rainfall
patterns and the associated increased planting of aliens.
Forests represent less than 1% of the land area of South Africa estimated
at 2 000km 2 -3 OOOkm 2 (Huntley 1984). Such a small biome is
particularly at risk should it become threatened by invasive species.
- 27 -
In the past,forests have been exploited by commercial interests and by
communities. This has resulted in their degradation.
exacerbated by clearance for agriculture and by
stock within the forests (Geldenhuys 1983). Impacts such
traditional peasant
This has been
grazing/browsing
as these open up the canopy and the gaps created are particularly
susceptible to colonisation by alien invader species. Apart from the gaps
and the forest margins however, the forests are generally resistant to
invasion (Geldenhuys 1986). Indeed Geldenhuys observes further that
indigenous species such as Pterocelastrus tricuspidatus, Rapanea
melanophloeos, Podocarpus species, Olea capensis and Ocotea bullata
have developed as understory vegetation in old stands of Pinus and
Eucalyptus. There are however some alien species such as Cestrum
laevigatum, Pittosporum undulatum and Psidium guajava which have
shown the capacity to invade closed forest. This latter species is
recommended by the National Academy of Science as a suitable
fuelwood/fruit tree.
Finally, large scale plantings of alien species may seriously disrupt
water tables. Eucalyptus species in particular are deep rooted trees
which utilise large volumes of water. This is so to the extent that
Eucalyptus have been planted in order to assist with the drainage and
drying of marshlands. A particular example is that of the Coto de Donana
in Spain where Eucalyptus plantations have had a major impact on the
ecology of the marsh. A component of the conservation programme for the
area has been to fell large areas (Axell HE pers comrr:).
CONCLUSIONS
There is
timber.
population.
a great and immediate need
This need will increase in
An enormous commitment on
for wood fuel and constructional
the future with the increasing
the part of the government is

- 28 -
necessary if community living standards are to be even maintained at
existing levels. When the needs for environmental conservation are taken
into account the issue assumes even greater urgency and complexity. Any
hope for a solution will require urgent and widespread action ranging from
reserach into management strategies for indigenous and exotic woody
vegetation to planting strategies and public awareness campaigns.
-- ----- ---~
CONVERSION TABLE OMSETTINGST AFEL i,1EHES FEET METER VOET
- 12 000
3 500
- 11000
3 000 _:-10 ooo
9 000
2 500 8 ODD
7 ODD
1 000
6 000
1 !iOO s r.oo
l 000
-- 1000
500
I 000
1 •. 5 O 000 SOUTH AFRICA SUill-AFRIKA 3327AC PRUD HOE
Refecto th,s Map as SOUTH AFR ICA I 50000 Sheet 3327AC PRU DH OE VerWl,'S na h 1e rd 1e Kaart as SU ID-AF fll KA 1 50 000 Ve l SECOND EDITION I WEED[ UITGAWE
1---~o~v==========~~-=-=====-===-======L----~====::::i==========ci::==----------_:'.'."'========_:=_:=_ccc___c=___c=_,:=_ ===::::;=====:::E="1'====-======i==========:::E==========;3,;';=========::::i==========a::::========:::;:::::i='~=========3::========-- ----i' -------. 05' - lY 10' - 2Y
27°00' 33°15
~ 369X
I 25 1
I
h 370X
I .:::::--
Figure 1.1
\ QY '-- ,i:--::====~=~==========,-----=:--:--
~
,,0/ '4~
0 °"'v
Approximate study area boundary
"*\.,<:>
<("/:,-c{!'"" 05' - 1Y 10'
'
P11hl 1sfrnl1 tiy tl1a Chief Di rector of Survcv5.Jrd Mnpp1ng Pr1vntr i,og Mowbrnv Gcoubl1~c() r deur die Hootdn.' kteu r van Oi;rnet ir,\J8 en Karter1ng Pri v1Hc1ti;ak ,\.fowl ~, CONTOUR INTERVAL 20 METRES 1:50000 KONTOERTUSSENRU I MTE 20 MfTFR
~ State Copyright Staatsouteursreg
REFE RENCE
International B0undc1r 1es
Prov1 nc1al Bo lirrlar ,es
Mul ti ple 1 rack Raill':avs
'>irgle Track Railways
Elec1 •,t1ed RJ 11w.J •;5
Narr ow Gauge R,ul\~avs
Serv1cr. R01l ,:11a y s
Fr!':eways and Arterial Roads
Mam Rt: a:.i~
Sr.r.cndary Roads
Other Roads
Tracks and Hiking TrJJis
Power Lines .
Telephone Lines
Post Oli ,ces, Pol ice Srnt1ons ilnd Posts. }
Stores Hotels Schools ilnd
Places of Vvor ~h1r:;
L1 gh:houses and Marine L,g l,t:,;
Ma r 1ne B<c1a cons
• ~ 11-'S•W , H 1S •K
* * +
VERKLARING
lnrr, rn ,1°1onale Grense
Provins1ale Grrn"";r,
Veelvoud 1ge Spno rl yne
[ 1 ke l spoo rlyno
Geelekml1sr.0r d0 ~roo rlvne
Smal;poor l ,•ne
D,~n;~poorl',·ne
Deurpaa re an Hoofverkaa rspaa 1a
. Hoofpaaia
Se kond ere Paa1e
AruJcu P<:1 0 ,t,
Dowwe Paa1e en Voetslaanpaa 1e
Kr ag lyrit
Te letoon lvne
{
Puskan lute Po l1s1es tas1!!::; !!1 1 ·poste,
V'.'mkels Hl'lle ll e SkOIR en
Plckkc viln AJn:l 1ddmg
VJi.;rtor,ng~ eri See11aar t l1gtc
Scevaar·hA<en::.
Metres 1 ODO O 1 000 2 000 3 000 4 000 5 000 Meter
B:Ea:::E:::a:::s::l========3:= ~ ---=--- b ___ ~ ____ ==~--- -~ Eng l ish Feet 5 000 0 5 000 10 000 15 000 Enge lse Voet
= ==E=t=----===:E======== ~ ==-------=:::::I Statute M Iies I
111>< qr ti I,_ ot u., Swtr Alr0oan Co · ord narn S,5 te m are nd1 ~a1cd 1n the nrn,g,, , by s!H I tOftt'~ 1Wk~ ~! 1000CJ m~tr~ ,~ten,a s with co - c·o,~a·e
<dlue, on uruls of 10 OCO m~1rns ,n t>i Ufl
2 0
,~±========::J===================r===== 3 Landmyl
-=1
lle1!'.J hts arc in metres abcve mean sea 1!:!vr,I
Hoogtes 1s 111 mflttn bo gam ,dde lde sees p1ee1
Gauss Cortorm Pro,ection. Ccnt:JI rvl~ridm,, 27° Fast Cla r ke 1880 Sphero d
Gau :,; s se Konforme Pro1 ek ~1c Jv.1doclmerid1aan 27° Oos Clark!! 1880 Sleto1f!d
IN DEX TO SHEETS IND EKS VAN VE L LE
,; · 33°
15'
27°
-' .. -....-3V 6BR_
\;·.12
3326B D
RH
,s· ''1,"
3327AA 3327AB GISH!
De ru ,t l) nB v~n c,c Su1d - Afo kaJ1~0 KoOrd,~aa·~1el~el ;, ,;,, :I ,n d,~ <~nt·u ,mte J;Jni}Cto:,n dou· ken swa rt st rep es 1()(()() rnet~r van rna<aHr "'"1
kWd rl<!J lwaa rde~ 1n oo~hede va n 1 U (XC met~r ,r •>w
RE F ERENCE
Milg ne11r Still1:-,n~ ;inc Grauno S gr~
Tri;i BtJcn.:r.m~ {Num lrn1 and ground height)
Monurr,ents
0 1pp ,ng T<:11 ,k~
\'\/1ndm1I '.:
',\'ill l s
A nti erosion \/;'il l ls .
EXC il l1ill l ::ins
Perennial V,/~ler
Non pc·cnn1al '8a\ (,H
Dry Pans
Spr ngs, \NJtP.rho•e~ oncl \Nr, l lc
Ma rches, sv,,J mps an:.i Vle1s
P1pcl111e,
Prcm1110m Rock Outc rcps
Terrac f. s
CJl t ,v.Jted I nnd~
Orchar ds and Vme,·ard~
T· ees and Ou~li
'),,
27°15'
20'
+ 36!JX
25'
--'- J70X
27°15' - ?Y
Pri nted b',' the Gcvornmcnt Printer r'r1v<11r. l>ilg X8h r' rr. tm1,1 Ge d r J k dc>ur d 1Ft S lll Al~,J r ,H.!!r P r1v>t>t lSi,1 k XSE. Prt!l'v "'-"'
::J ~
t,,. !8(; 546.2
1
--------. F
~I~~--~ -P------ -
11'r-lf.aw,=11:;;w '!l111f.m
;;~ t!li!l::i:im::miii
Q O Q. Q. 11,;,0 Q.0.Q
VERKLARING
Mar:i•ct1es e Stc1~ie~ er Grur i_l ,,-,,crns
Trig Bekens (Nommer en grondhoogtel
Dwbakke
\\• ndpompe
Mure
Gr o r ,obe•,..,.ri ng~wH I le
U 1\<jl8A' l l1 ;JS
Stanchou dende Water
Nie - stancnoucende WatBr
Droe P,: nne
Pyµ lyn !!
. 1'1 nn,n en1R K l1pbilnk~
Te1,asse
13~we r k tei uJ 11 de
B,,o rd e en v\'ingude
Bo me "" rl Ros
I 1
l I 1
I 1