Embed Size (px)
Citation preview
UNIVERSITY OF CAPE COAST
FARMERS’ PERCEIVED EFFECT OF URBAN VEGETABLE
PRODUCTION ON THEIR LIVELIHOODS IN THE KUMASI
METROPOLIS OF ASHANTI REGION OF GHANA
SOLOMON KODJO DARKEY
2011
i
UNIVERSITY OF CAPE COAST
FARMERS’ PERCEIVED EFFECT OF URBAN VEGETABLE
PRODUCTION ON THEIR LIVELIHOODS IN THE KUMASI
METROPOLIS OF ASHANTI REGION OF GHANA
BY
SOLOMON KODJO DARKEY
Thesis Submitted to the Department of Agricultural Economics and Extension,
School of Agriculture, University of Cape Coast, in partial fulfillment of the
requirements for the award of Master of Philosophy Degree in Agricultural
Extension
NOVEMBER, 2011

ii
DECLARATION
Candidate’s Declaration
I hereby declare that this thesis is the result of my own original work and that
no part of it has been presented for another degree in this university or
elsewhere.
Candidate’s Name: Solomon Kodjo Darkey
Signature: ………………………………. Date: …………………
Supervisor’s Declaration
We hereby declare that the preparation and presentation of the thesis were
supervised in accordance with the guidelines on supervision of thesis laid
down by the University of Cape Coast.
Principal Supervisor’s Name: Ernest L. Okorley (Prof)
Signature: ………………………………… Date: …………………
Co-Supervisor’s Name: Nathan A. Gyimah (Mr)
Signature: …………………………………. Date: ………………...
iii
ABSTRACT
The study examined farmers’ perceived effect of urban vegetable
production on their livelihoods in the Kumasi Metropolis of Ashanti Region of
Ghana. Descriptive survey design was used for the study. Based on a simple
random sampling technique, 300 urban vegetable farmers were selected and
interviewed for the primary data from mid June to July 2010. The data was
analysed using Statistical Package for Social Sciences (SPSS) version 15.
From the study, lettuce was the most cultivated vegetable crop with a
production area of 39.7ha and French beans the least (0.4ha). The study also
revealed that the vegetable industry was male dominated. The effect of
vegetable production on farmers’ livelihoods was perceived generally to be
‘low’. However, it impacted ‘moderately high’ on their natural and physical
capitals. Farmers’ vegetable production and marketing challenges such as high
input cost, inadequate credit facilities, fluctuating demand and low price offer
affected the level of impact on their livelihoods. From the ANOVA results,
there were statistically significant differences among the mean livelihood
assets at 0.05 alpha level.
The formation of formal or informal farmer associations would provide
the platform to address common challenges of high input cost, inadequate
credit facilities and improve marketing avenues to improve farmers’ incomes
and livelihoods. The associations’ functions should be diversified to include
training on new innovations to increase productivity of members. Research-
Extension-Farmer Linkage should be strengthened to enhance contacts with
farmers and also update their knowledge and skill levels for improved
productivity.
iv
ACKNOWLEDGEMENTS
A grateful mind is a great mind that eventually attracts to itself a lot of
great things (Plato, n. d). I am grateful to the entire staff of the Department of
Agricultural Economics and Extension, especially the lecturers for their pieces
of advice that went into the preparation of this study. Exceptional gratitude is
extended to Prof. E.L. Okorley and Mr. N.A Gyimah, my principal and co-
supervisors respectively for their guidance and mentorship which culminated
in this study. I am also thankful to the National Agribusiness Development
Programme (NADEP) especially the co-ordinator, Rev. Dr. S. Asuming for
providing funding for this study.
I am also indebted to my employer Council for Scientific and
Industrial Research of Crops Research Institute (CSIR-CRI) for granting me
study leave to pursue my second degree. Much appreciation is also extended
to my superior and mentor, Mr. B. M. Dzomeku particularly for his time and
material support towards the successful completion of this study. Similar
gratitude also goes to Messrs Appiah-Danquah, John Vinoagbe, Emmanuel
M.K. Sosu, Alex Adu-Appiah and Bright Owusu Asante, all of CSIR-CRI for
their invaluable contributions.
The contributions of Mrs. Lawrencia Donkor Acheampong and Mr.
Eric Aduko, Librarian and Senior Library Assistant respectively of CSIR-CRI
library are much appreciated. The support offered by Edem K. Nutakor of
Cocoa Swollen Shoot Virus Disease (CSSVD) control unit of Ghana Cocoa
Board is also well acknowledged. I am also appreciative of all who
contributed in diverse ways towards the successful completion of this work.
God bless you all.

v
DEDICATION
I dedicate this work to my lovely wife Patience Nyuiemedi and the entire
Darkey family especially my parents Mr. Andreas Yao Darkey and Mrs
Veronica Awushie. Darkey all at Natriku, Akuse
vi
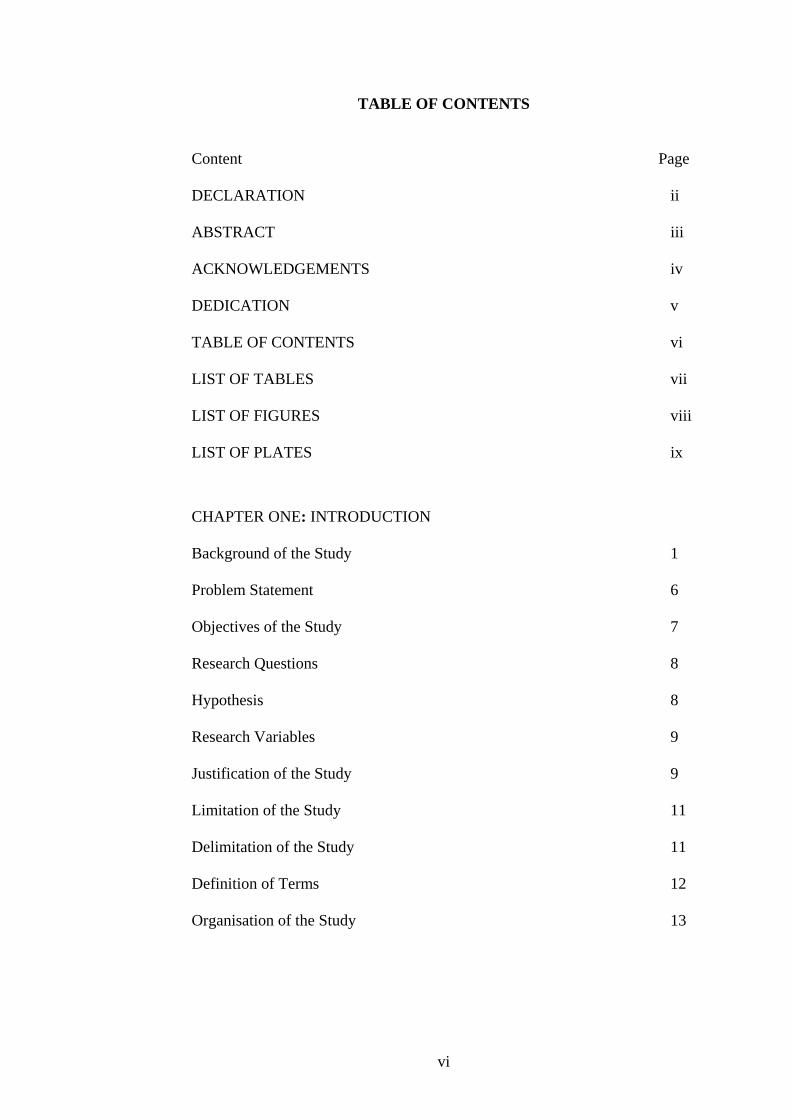
TABLE OF CONTENTS
Content Page
DECLARATION ii
ABSTRACT iii
ACKNOWLEDGEMENTS iv
DEDICATION v
TABLE OF CONTENTS vi
LIST OF TABLES vii
LIST OF FIGURES viii
LIST OF PLATES ix
CHAPTER ONE: INTRODUCTION
Background of the Study 1
Problem Statement 6
Objectives of the Study 7
Research Questions 8
Hypothesis 8
Research Variables 9
Justification of the Study 9
Limitation of the Study 11
Delimitation of the Study 11
Definition of Terms 12
Organisation of the Study 13
vii
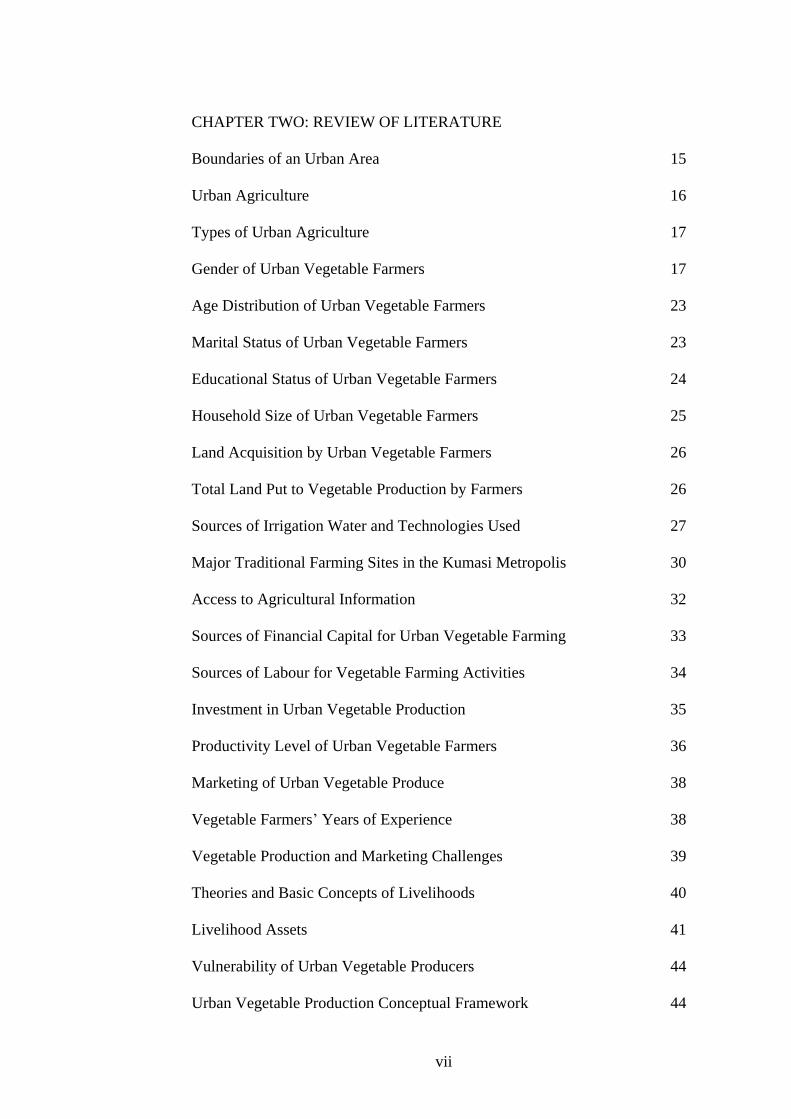
CHAPTER TWO: REVIEW OF LITERATURE
Boundaries of an Urban Area 15
Urban Agriculture 16
Types of Urban Agriculture 17
Gender of Urban Vegetable Farmers 17
Age Distribution of Urban Vegetable Farmers 23
Marital Status of Urban Vegetable Farmers 23
Educational Status of Urban Vegetable Farmers 24
Household Size of Urban Vegetable Farmers 25
Land Acquisition by Urban Vegetable Farmers 26
Total Land Put to Vegetable Production by Farmers 26
Sources of Irrigation Water and Technologies Used 27
Major Traditional Farming Sites in the Kumasi Metropolis 30
Access to Agricultural Information 32
Sources of Financial Capital for Urban Vegetable Farming 33
Sources of Labour for Vegetable Farming Activities 34
Investment in Urban Vegetable Production 35
Productivity Level of Urban Vegetable Farmers 36
Marketing of Urban Vegetable Produce 38
Vegetable Farmers’ Years of Experience 38
Vegetable Production and Marketing Challenges 39
Theories and Basic Concepts of Livelihoods 40
Livelihood Assets 41
Vulnerability of Urban Vegetable Producers 44
Urban Vegetable Production Conceptual Framework 44
viii
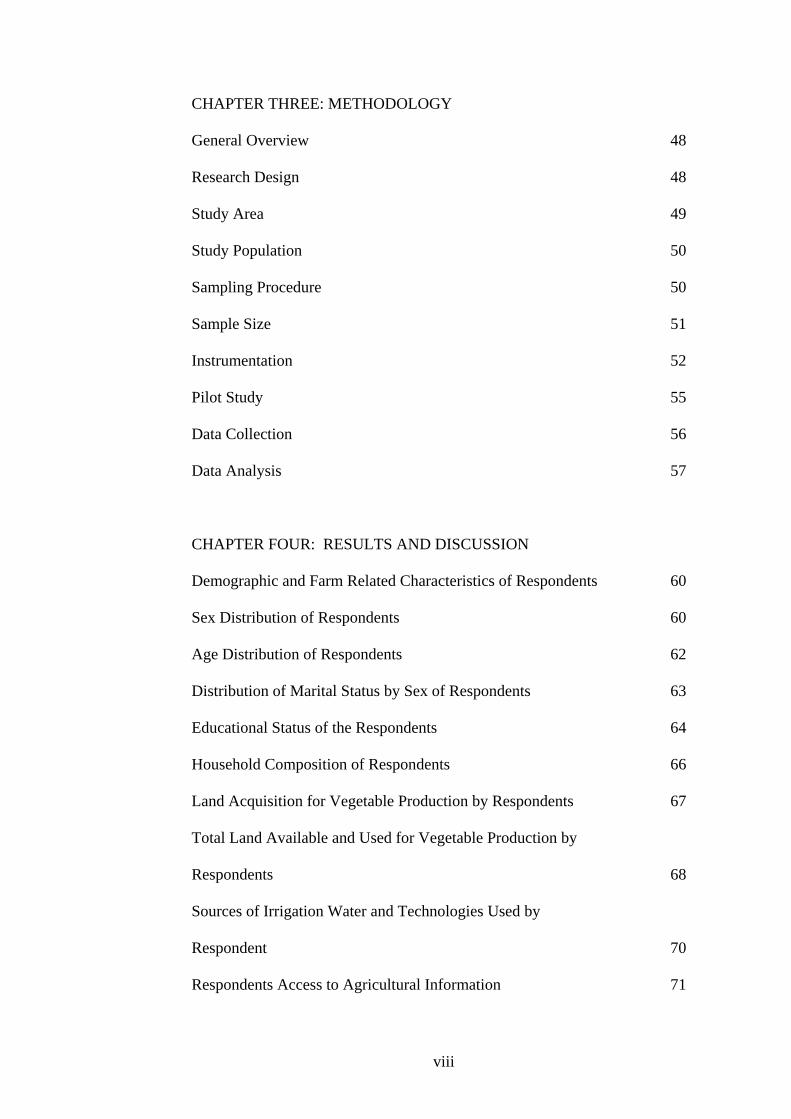
CHAPTER THREE: METHODOLOGY
General Overview 48
Research Design 48
Study Area 49
Study Population 50
Sampling Procedure 50
Sample Size 51
Instrumentation 52
Pilot Study 55
Data Collection 56
Data Analysis 57
CHAPTER FOUR: RESULTS AND DISCUSSION
Demographic and Farm Related Characteristics of Respondents 60
Sex Distribution of Respondents 60
Age Distribution of Respondents 62
Distribution of Marital Status by Sex of Respondents 63
Educational Status of the Respondents 64
Household Composition of Respondents 66
Land Acquisition for Vegetable Production by Respondents 67
Total Land Available and Used for Vegetable Production by
Respondents 68
Sources of Irrigation Water and Technologies Used by
Respondent 70
Respondents Access to Agricultural Information 71
ix
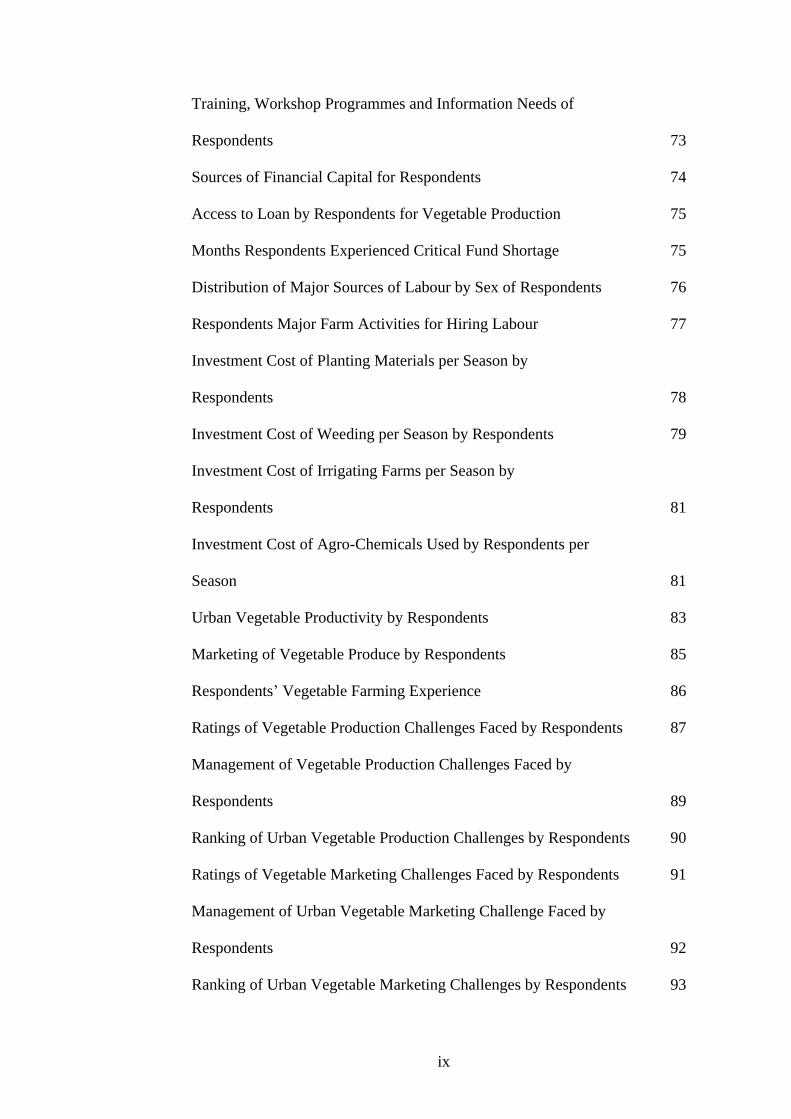
Training, Workshop Programmes and Information Needs of
Respondents 73
Sources of Financial Capital for Respondents 74
Access to Loan by Respondents for Vegetable Production 75
Months Respondents Experienced Critical Fund Shortage 75
Distribution of Major Sources of Labour by Sex of Respondents 76
Respondents Major Farm Activities for Hiring Labour 77
Investment Cost of Planting Materials per Season by
Respondents 78
Investment Cost of Weeding per Season by Respondents 79
Investment Cost of Irrigating Farms per Season by
Respondents 81
Investment Cost of Agro-Chemicals Used by Respondents per
Season 81
Urban Vegetable Productivity by Respondents 83
Marketing of Vegetable Produce by Respondents 85
Respondents’ Vegetable Farming Experience 86
Ratings of Vegetable Production Challenges Faced by Respondents 87
Management of Vegetable Production Challenges Faced by
Respondents 89
Ranking of Urban Vegetable Production Challenges by Respondents 90
Ratings of Vegetable Marketing Challenges Faced by Respondents 91
Management of Urban Vegetable Marketing Challenge Faced by
Respondents 92
Ranking of Urban Vegetable Marketing Challenges by Respondents 93
x
Farmers’ Perceived Level of Effect of Urban Vegetable Production on
their Livelihoods 94
Farmers’ Perceived Level of Effect of Urban Vegetable Production on
their Natural Capital 95
Farmers’ Perceived Level of Effect of Urban Vegetable Production on
their Information Capital 96
Farmers’ Perceived Level of Effect of Urban Vegetable Production on
their Financial Capital 99
Farmers’ Perceived Level of Effect of Urban Vegetable Production on
their Human Capital 101
Farmers’ Perceived Level of Effect of Urban Vegetable Production on
their Social Capital 102
Farmers’ Perceived Level of Effect of Urban Vegetable Production on
their Physical Capital 105
One – Way ANOVA of Farmers’ Livelihood Assets 109
CHAPTER FIVE: SUMMARY, CONCLUSIONS AND
RECOMMENDATIONS
General Overview 113
Summary 113
Conclusions 116
Recommendations 117
Suggestions for Future Research 119
REFERENCES 120
APPENDICES 136
xi
LIST OF TABLES
Table Page
1 Gender Ratio in Vegetable Farming in Various Cities in
West Africa 19
2 Interpretation of Likert-Type Scale on Farmers’ Perceived
Level of Contribution of Urban Vegetable Production to their
Livelihoods 54
3 Interpretation of Likert-Type Scale on Production Challenges 54
4 Interpretation of Likert-Type Scale on Marketing Challenges 55
5 Age Distribution of Respondents 63
6 Distribution of Marital Status by Sex of Respondents 64
7 Educational Status of the Respondent 66
8 Land Acquisition for Vegetable Produce by Respondents 68
9 Sources of Irrigation Water and Technologies Used by
Respondents 71
10 Respondents’ Access to Agricultural Information 73
11 Distribution of Major Sources of Labour by Sex of
Respondents 77
12 Respondents’ Major Farm Activities for Hiring Labour 78
13 Investment Cost of Planting Material per Season by
Respondents 79
14 Investment Cost of Weeding per Season by Respondents 78
15 Investment Cost of Agro-Chemicals Used per Season by
Respondents 83
16 Urban Vegetable Productivity by Respondents 85
xii
17 Respondents’ Vegetable Farming Experience 87
18 Ranking of Urban Vegetable Production Challenges by
Respondents 91
19 Ranking of Respondents Urban Vegetable Marketing Challenges 94
20 Mean Perceived Level of Contribution to Famers’ Natural Capital 96
21 Mean Perceived Level of Contribution to Famers’ Information
Capital 99
22 Mean Perceived Level of Contribution to Famers’ Financial
Capital 100
23 Mean Perceived Level of Contribution to Famers’ Human Capital 102
24 Mean Perceived Level of Contribution to Famers’ Social Capital 104
25 Mean Perceived Level of Contribution to Famers’ Physical
Capital 108
26 ANOVA of Farmers’ Mean Livelihood Assets 109
27 Tamhane’s T2 Post-Hoc Multiple Comparisons of
Farmers’ Livelihood Assets 110
xiii
LIST OF FIGURES
Figure Page
1 Some Vegetable Production Site in the Kumasi
Metropolis 31
2 Department for International Development Sustainable
Livelihood Framework 46
3 Conceptual Framework for Urban Vegetable Production 47

xiv
LIST OF PLATES
Plate Page
1 A Stream Used by Some Vegetable Farmers for Irrigation 28
2 Irrigation of Spring Onions with Watering Cans 29
3 Spring Onions Growing in One of the Production Sites 32
xv
LIST OF ACRONYMS
CSIR-CRI Council for Scientific and Industrial Research of
Crops Research Institute
DFID Department for International Development
FAO Food and Agricultural Organisation
FBOs Farmer Based Organisations
FFD Farmer Field Day
FFS Farmer Field School
GSS Ghana Statistical Service
IARC International Agency for Research on Cancer
ICT Information and Communication Technology
ISSER Institute of Statistical, Social and Economic Research
IWMI International Water Management Institute
KNRMP Kumasi Natural Resource Management Project
KNUST Kwame Nkrumah University of Science and
Technology
MoFA Ministry of Food and Agriculture
NGOs Non-Government Organisations
UN United Nations
UNCHS United Nation Centre for Human Settlement
UNDP Unites Nations Development Programme
UNHCS United Nations Centre for Habitable Settlement
UNPD United Nations Populations Division
US Unites States
WHO World Health Organisation
1
CHAPTER ONE
INTRODUCTION
Background of the Study
Half the world’s population is already urban and another 1.5 billion
people will be living in cities by 2020 (Maxwell, 1998). This explosive
growth of urban settlement which is occurring mostly in developing countries,
bring with it two critical challenges. The first challenge is that migration of
people towards the urban world has brought with it a migration of poverty
which cities are ill-equipped to deal with. The second challenge is that
unplanned urban growth is accompanied by environmental pollution, health
risks, and a decline in the quality of life. Population growth and migration
over the past 30 years and structural adjustment policies introduced in the
1980s undermined whatever ‘urban bias’ that has existed during the post –
Second World War (Maxwell, 1998).
According to United Nations Population Division (2004), population
growth in Africa is estimated to triple by 2050. It is also projected that by
2015, there would be 25 countries in Sub - Saharan Africa including Ghana
with higher urban than rural populations. It is further estimated that by 2030,
this would increase to 41 countries. Already, about 44 percent of the
population in West Africa Sub region lays in urban areas compared to only 4
percent in 1920. It is reported in 2000 that 38 percent of Africans lived in
2
urban areas. This figure is expected to increase to about 55 percent by 2030
(United Nations, 1995). Urban population in Ghana has also witnessed
considerable upsurge over the years. For instance, urban population increased
from 32 percent in 1984 to 43.8 percent in 2000 (Ghana Statistical Service,
2002). Difficult economic conditions especially in the urban areas have
affected job opportunities. Many migrants to urban cities, especially in Africa
face the reality of increasing unemployment and food insecurity among others.
As a result, many urban dwellers undertake farming activities within the cities
either on part-time or full-time basis to improve their livelihoods (Kyessi,
1997). The phenomenon is known as Urban Agriculture and it involves the
rearing of animals and the growing of crops (mostly vegetables) on rented
small scale lands in the city centres for sale to the immediate urban
communities. There are two types of urban agriculture and these are open-
space and backyard gardening. For the purposes of this study, the former will
be treated.
Cities have enormous potential for food production. Smit, Ratta, and
Nasr (1996) reported that the 1980 United States census revealed that urban
metropolitan areas produced 30 percent of the dollar value of US agricultural
production. This figure increased to 40 percent by 1990. There are 80,000
community gardeners on municipal land in Berlin, Germany with 16,000 more
on the waiting list. Presently, 65 percent of Moscow families are involved in
urban food production compared with 20 percent in 1990. Singapore produces
25 percent of its vegetable needs in the urban centres. Dar-es Salam, one of
the world’s fastest growing cities, now has 65 percent of families engaged in
farming compared with 18 percent in 1967. Denninger, Egero, and Lee-Smith
3
(1998) also estimated that nearly 25million out of the 65 million people living
in urban areas of Eritrea, Ethiopia, Tanzania and Kenya currently obtain part
of their food from urban vegetable production and that by 2020, at least 35-40
million urban dwellers will depend on urban agriculture to feed themselves.
Smit et al. (1996) claimed that an estimated 800 million people are
commercial producers, employing about 150 million people full-time.
Altieri et al. (1999) noted that in Havana (Cuba) urban gardens have
significantly increased the quantity and quality of food available to the
producers, households, neighbourhood, improved the financial welfare of the
households and enhanced the environmental quality of the community. Cepal
(1999) reported that while the majority of developing countries poor people
continue to be rural in absolute terms, this no longer holds true for Latin
America where the urban share of poverty has dramatically increased from 37
percent in 1970 to 62 percent in 1997. According to the United Nations Centre
for Human Settlement (2001), Africa and Asia have experienced similar
changes. In Africa, about 40 percent of the poor are now urban, though there is
considerable variation among countries.
World Bank (2000) reported that in Asia, rapid urbanisation occurred
in populous countries such as Bangladesh. This has led to about 15 million
poor people living in urban areas, about 24 percent of the total poor. Despite
the limited availability of poverty data disaggregated for urban population and
even fewer datasets that permit analysis of trends, it is still clear that urban
poverty is growing steadily and significantly. This is partly through continuing
migration but now, more significantly through new generations of urban
dwellers being unable to escape from poverty (Bouquier, 2004). The absolute
4
and relative growth in urban poverty and under nutrition raises two important
issues. First, there is a clear link with food insecurity among poor urban
populations. This in turn is connected to the inability of families to purchase
food. Secondly, there is evidence of a link between poverty and instability in
the urban labour market and its vulnerability to economic shocks (Amis,
2002).
Urbanisation presents both opportunities and challenges, but
indications for Africa are that the challenges outweigh the opportunities.
Unlike many other parts of the world, Africa’s increasing urbanisation has not
been matched by infrastructure and economic development. As Stren (1989)
has noted, across much of the continent, basic urban services and
infrastructure - housing, road repair, water supply, health, educational
facilities, public transportation and garbage removal are insufficient and in a
state of deterioration.
Increase in urban poverty is accompanying the urbanisation process
and poverty is gradually concentrating in the urban areas ‘urbanisation of
poverty’ (Baud, 2000). The effects of rapid urbanisation in Ghana include
unemployment, reduction of wages of some urban dwellers and high prices of
food (Okorley & Kwarteng, 2002). In response to this situation, an increasing
number of city dwellers have resorted to all kinds of income generating
activities in the urban informal sector. Among these is the intensive irrigated
agriculture, mostly vegetables which takes advantage of urban demand for
perishable crops and water resources for all-year or dry season production
(Cofie, van Veenhuizen & Drechsel, 2003). Although urban agriculture
demands considerable technical skills, it receives little or no research attention
5
and is frequently ignored and sometimes outlawed by municipal authorities.
This has compelled local people to engage in agricultural systems operating
well-below their potential and frequently to use unacceptable production
practices.
Kumasi, the study area, is a rapidly growing city with an annual
growth rate of 5.4 percent (Ghana Statistical Service, 2002). The main crops
grown in urban Kumasi are often accompanied by dry-season vegetable
farming especially along streams. It is estimated that about 41ha of land in the
urban areas is put under informal dry-season vegetable production which is
more than twice the area currently under formal irrigation in the entire country
(Ghana) (Cornish & Lawrence, 2001). According to Danso, Drechsel, Wiafe-
Antwi and Gyiele (2002), a collaborative study by International Water
Management Institute (IWMI) in Kumasi and other cities in Ghana (Accra and
Tamale) showed that between 40 and 80 percent of urban farmers consider
urban farming as their main income generating activity. Furthermore, urban
vegetable farmers generate at least twice the income of their rural colleagues,
which is an important contribution to poverty alleviation and livelihoods
improvements.
Vegetables are rich sources of essential micronutrients (especially
vitamins, iron and calcium) and generally have high fiber content. Inadequate
consumption of vegetable is recognised as one of the key risk factors for
cardiovascular diseases and some form of cancers, the two leading causes of
death the world over today. Chronic degenerative diseases are spreading
within the developing world at unprecedented rates. The World Health
Organization (WHO) (2004) estimates that low vegetable and fruit intake
6
accounts for approximately 2.7 million deaths a year from chronic diseases
and causes about 31 percent of ischaemic heart diseases and 11 percent of
strokes worldwide.
Low intake of vegetables and fruits is ranked as the sixth main risk
factor for mortality in the world. The consumption of vegetable is grossly
inadequate in both developed and developing countries despite ample
evidence of their protective effects. Only three countries Israel, Italy and Spain
are able to meet the recommended minimum per capita consumption rate of
146 kg per year (International Agency for Research on Cancer, 2003).
Though, it is impossible to meet the recommended minimum per capita
consumption level in the immediate future in Ghana, efforts should be made to
increase the current production and consumption levels of vegetables
considering the numerous health benefits.
Problem Statement
The upsurge of urban vegetable production in Ghana has been
attributed to unemployment in the formal sector, declining purchasing power
and the potential profitability of the enterprise (Mougout, 1993). Kumasi, the
second largest city in Ghana after Accra has a population of 1,170,250. The
2000 census further projected the population to 1,889,934 by 2009 (Ghana
Statistical Service, 2002). The total land area under informal dry-season
vegetable production in the metropolis is estimated to be 41 hectares (Cornish
& Lawrence, 2001)
The income level of all-year-round vegetable production can reach
US$400 to $800 while irrigated vegetable farming (lettuce, cabbage and
7
onions) figure was US$2,000-$8,000/ha/year (Drechsel, Danso & Keraita,
2002). Urban vegetable farming no doubt contributes substantially to the
economy of Ghana in general and the Metropolis in particular beyond the
provision of livelihoods and food security. Though, some work has been done
on urban vegetable production over the years in Ghana and Kumasi
Metropolis in particular, farmers’ perceived level of impact of urban vegetable
production on their livelihoods such as access to biophysical resources for
vegetable production (natural capital) and other capitals including information,
financial, human, social and physical capital have not been adequately
examined. The study seeks to fill in this information gap.
Objectives of the Study
The general objective of the study is to assess farmers’ perceived effect
of urban vegetable production on their livelihoods in the Kumasi Metropolis
of Ashanti Region of Ghana. The specific objectives of the study are to:
1. describe the demographic characteristics of urban vegetable
farmers in the Kumasi Metropolis.
2. describe the farm related characteristics of urban vegetable
farmers.
3. determine the production and marketing challenges of urban
vegetable farming.
4. examine farmers’ perceived level of effect of urban vegetable
production on their livelihoods.
8
5. determine whether there are significant differences in the
livelihood assets of farmers as a result of their urban vegetable
production.
Research Questions
The study attempts to answer the following questions:
1. What are the demographic characteristics of urban vegetable
farmers in the Kumasi Metropolis?
2. What are the farm related characteristics of urban vegetable
farmers in the Kumasi Metropolis?
3. What are the production and marketing challenges of urban
vegetable farmers?
4. What is the urban vegetable farmers’ perceived level of effect of
urban vegetable production on their livelihoods?
5. Are there significant differences in the livelihood assets of farmers
as a result of their urban vegetable production?
Hypothesis of the Study
1. H0: There are no significant differences in the farmers’ perceived
level of effect of urban vegetable production on their livelihoods in
terms of natural, information, financial, human, social, and
physical capitals.
H1: There are significant differences in the farmers’ perceived level
of effect of urban vegetable production on their livelihoods in terms
of natural, information, financial, human, social, and physical
capitals.
9
Research Variables
The variables to be examined for the study include demographic and
farm related characteristics of urban vegetable farmers. Variables that were
considered in the former include sex, age, marital status, educational status
and household size. Those variable captured under farm related characteristics
are land acquisition, total land put to vegetable production, sources of
irrigation water, irrigation methods and technologies used, access to
agricultural information, sources of financial capital, sources of labour,
investment level, productivity level, marketing of vegetable produce and
vegetable farmers years of experience. Livelihood assets of urban vegetable
farmers in terms of natural, information, financial, human, social and physical
capitals were also considered for the study.
Whilst the variables for production challenges faced by urban
vegetables producers include high input cost, lack of credit facilities, incidence
of pests and diseases, inadequate water, poor soil fertility and irrigation, those
for marketing challenges consist of lack of cold transport and storage facilities,
fluctuating demand, postharvest losses, female dominance and low price offer.
Justification of the Study
The outcome of the study will assist in the following directions:
Urban vegetable production is a viable intervention strategy for the urban poor
to earn extra income and grow their own food. However, policy makers and
governments have neglected this important sector. The study would highlight
the potentials and constraints to its development and assist Ministry of Food
10
and Agriculture (MoFA) and other stakeholders to capitalise on the potentials
and integrate it into the city system in a more viable and sustainable way.
The growing awareness in recent years of the health promoting and
protecting properties of non-nutrient bioactive compounds found in vegetables
and fruits have directed increased attention to vegetables as vital components
of daily diets. The study results would assist MoFA and other stakeholders to
promote vegetable production and consumption.
As urban population soars, the role of urban agriculture in supplying
perishable food to cities becomes increasingly important. The study results
would therefore inform the decision of MoFA and other stakeholders in the
industry to create the enabling environment for its integration into the
ecosystem in view of the added advantages besides employment creation, food
security improvement and livelihood enhancement.
Furthermore, the study results would provide a road map for other
stakeholders in the industry such as Non-governmental Organizations (NGOs),
input dealers and financial institutions who may want to promote or support
urban vegetable production.
The study results would also assist the MoFA, research institutes and
other stakeholders in the industry to identify and address some if not all the
production and marketing challenges faced by urban vegetable farmers in
order to increase not only production to ensure food security and address
nutritional inadequacies and malnutrition but also improve their sustainable
livelihoods to alleviate poverty as spelt out in the Millennium Development
Goal 1.
11
Lastly, the study results would add to the body of knowledge. This is
because it would help to understand, appreciate the contribution of urban
vegetable farming to the livelihoods of farmers and also serve as a platform
for further studies.
Limitation of the Study
This study is not immune to the general limitation inherent in research
based upon interviewing techniques and structured interview schedule. Factors
militated against the conduct of this study include the absence and or
inadequate record keeping by farmers compelled the study to rely on farmers’
ability and willingness to recall. This made the data generated varied widely
with different farmers in terms of the possibility of farmers giving inaccurate
answers to certain question. The study was also limited by individual farmer’s
perceptions and interpretation of the items on the instrument. Furthermore,
inadequate information from MoFA on vegetable farming, led to information
gap on urban vegetable farmers in the Kumasi Metropolis. Though, a complete
list of vegetable farmers was generated, the information gap affected the
sampling of the population since a complete list of the population (vegetable
farmers) could not be obtained for effective randomisation to be done.
Delimitation of the Study
Though, the study seeks to access the urban vegetable farming and its
effects on farmers’ livelihoods, not all vegetable farmers in the urban Kumasi
were assessed. This is because the focus of this study was solely on open-
12
space vegetable farmers in the Metropolis. It excluded all enclosed or
backyard vegetable farmers.
Definition of Terms
This section indicates the optional definition of terms used in the study.
An urban area refers to land area covered by the Kumasi Metropolis.
Vegetables refer to the leafy green, stem, root and flower stalk portion of an
edible plant.
Open – space vegetable production refers to cultivation of vegetables in an
open area usually for commercial purpose.
Informal irrigation refers to the kind of irrigation that is practiced by
individuals or groups of farmers without reliance on planned irrigation
infrastructure operated through the intervention of a government or donor
agency.
Livelihoods refer to the ways and means by which urban open-space vegetable
farmers obtain income to take care of their household.
Critical Fund Shortage refers to the period in the vegetable production process
where farmers are in dire need of funds.
Natural capital comprises all the biophysical resources that are utilised to
generate income by the household.
Information capital is the availability of facts used to access other capital
assets.
Financial capital refers to income, financial savings and debt levels of the
household.
13
Human capital is the quantitative and qualitative of labour in terms of skills
and health.
Social capital is the relationship of mutual interdependence.
Physical capital refers to ownership and or access to production tools and
equipment.
Vulnerability refers to the susceptibility of farmers to external shocks.
Organization of the Study
The study is divided into five chapters. Chapter one provides an
introduction to the study. It covers various areas such as background of the
study, problem statement, objectives of the study, research questions,
hypothesis, justification of the study, scope of the study and definition of
terms.
Chapter two reviews related literature relevant to the study. Literature
was reviewed on boundaries of an urban area, urban agriculture, types of
urban agriculture, gender of urban vegetable farmers, age distribution, marital
status, educational level and household composition of urban vegetable
farmers. Other issues reviewed include land acquisition by urban vegetable
farmers, total land put to vegetable production, sources of irrigation water and
technologies used, major traditional farming sites, access to agricultural
information, sources of financial capital for urban vegetable farming, sources
of labour for vegetable farming activities and investment in urban vegetable
production. The rest are productivity level of urban vegetable farmers,
marketing of vegetable produce, farmers’ years of experience, vegetable
production and marketing challenges, theories and basic concept of
14
livelihoods, livelihood assets and vulnerability of vegetable farmers and
conceptual framework for urban vegetable production.
The third chapter of this study considers the methodology that was
employed for the study. It captures research design, study area, study
population, sampling procedure, sample size, instrumentation, pilot study, data
collection and analysis.
Chapter four deals with the results and discussion whiles chapter five
contains the summary, conclusions, recommendations of the study and
suggestions for future research.
15
CHAPTER TWO
REVIEW OF LITERATURE
Boundaries of an Urban Area
The most fundamental source of potential confusion in the study of
urbanisation is the measurement of urban itself. There is no universal
definition of what constitute an ‘urban area’. The implication is that the
definition of what constitute an ‘urban area’ is country specific (Frey &
Zimmer, 2001). A similar view is held by Simon, McGregor and Thompson
(2006) that there is no accepted universal definition of what constitute urban
and peri-urban area. The census definition of an urban centre in Ghana is any
settlement with a population of about 5,000 or more persons (Nabila, 1998).
According to Rakodi (1999) and Simon, McGregor and Thompson
(2006), while it is practical to delimit the administrative boundary of a city as
the ‘urban area’, general commonalities define the ‘peri-urban area’ more as a
dynamic interface with urban and rural features rather than a fixed
geographical zone. The extent of the urban area of Kumasi is estimated
following the methodological approach described by Blake and Kasanga
(1997) and Adam (2001) that the peri- urban area of Kumasi has a radius of
approximately 40km from the city centre. Erenstein, Moussa, Oswald and
Keijzer (2004) and Drechsel, Graefe and Fink (2007) also buttressed the
16
findings by Blake and Kasanga (1997) and Adam (2001) by estimating rural-
urban interface to be about 30-40km from urban centres.
Urban Agriculture
Urban agriculture has been defined differently by various authors but
there are key features that characterise the activity. Urban agriculture involves
crops, livestock and poultry production, but it may also include fisheries, agro-
forestry and fuel production and it is practiced both within the urban boundary
and its periphery. Madden and Chaplowe (1997) defined urban agriculture as
the practice of crop cultivation and livestock rearing within the boundaries or
the immediate periphery of the city. The definition provided by United
Nations Development Programme (UNDP) (1996) goes beyond that provided
by Madden & Chaplowe (1997). It defines urban agriculture as an industry
that produces, processes and markets food, and fuel, largely in response to
daily demand of consumers’ within a town, city, or metropolis, on land and
water dispersed throughout the urban area, applying intensive production
methods, using and recycling natural resources and waste, to yield a diversity
of crops and livestock. The definition offered by Bailkey and Nasr (2000) that
urban agriculture is the growing, processing and distribution of food and other
products through intensive plant cultivation and animal husbandry in and
around cities is in line with that offered by UNDP (1996). The definition by
Butler and Marone (2002) on ‘urban agriculture’ is also similar to that offered
by UNDP but oversteps the traditional core activities into areas described as
multiplicity of other benefits and services including recreation and leisure,
economic vitality and well-being, landscape beautification, and environmental
restoration and remediation.
17
Types of Urban Agriculture
There are two main types of urban agriculture: enclosed (backyard)
and open-space cultivations. People who cultivate in enclosed areas around
their residences are called enclosed cultivators. The term ‘open-space
cultivation’ is used for any cultivation away from the individual’s residence.
These areas are not enclosed by any wall. Operators of this cultivation have
lower socio-economic status, unskilled and formally unemployed compared to
enclosed cultivators (Obosu-Mensah, 1999).
Among the authors who focused attention on enclosed (backyard)
production (Lee-Smith, Manundu, Lamba and Gathuru-Kuria, 1987; Freeman,
1999) and those who studied open-space production Mbiba (1994) admit these
two types of urban agriculture described by Obosu-Mensah (1999). The only
difference however, lies in the terminologies used for their description. They
also argued that the description of these two types of cultivation is based on
location and development status of the site of farm. In Ghana, urban farming
comprises of two types: (a) open-space production for the urban market and
(b) backyard gardens cultivated mostly, but not only for home consumption.
The views of Drechsel, Graefe, Sonou and Cofie (2006) confirm the earlier
findings by Obosu- Mensah, Lee -Smith et al. and Freeman that two types of
urban agriculture exist. This study however focuses on urban open-space
vegetable production.
Gender of Urban Vegetable Farmers
Gender relations are influenced by traditions, religion, ethnic origin,
age and marital status. In agriculture these include access to land and control
18
of tangible and intangible resources as well as division of labour at the
household level and among farming activities. Traditions of patrilineal
inheritance, according to Wilbers (2003), limit women’s access to land
acquisition for subsistence farming. Gender differences also exist between
men and women heads of households. Female farmers in female headed
households tend to limit their labour in farm activities because of heavy
commitment to productive role such as nurturing and caring for children and
attending to the elderly members of the household (Kamara & Denkabe,
1993).
Most of the open-space vegetable farmers in West African cities
including Dakar, Lome, Cotonou, Bamako and Ouagadougou are men
(Kessler, Streiffeler & Obuobie, 2004). Only 10 percent of all urban open-space
farmers on the average are women (Obosu-Mensah, 1999; Gbireh, 1999;
Armar-Klemesu & Maxwell, 1998). Drechsel, Blumenthal and Keraita (2002)
argued that though women and men play similar roles in crop production,
urban vegetable farming is mostly done by men. The findings of Kessler et al.
also confirm the earlier studies by Drechsel et al. and Obosu-Mensah (1999)
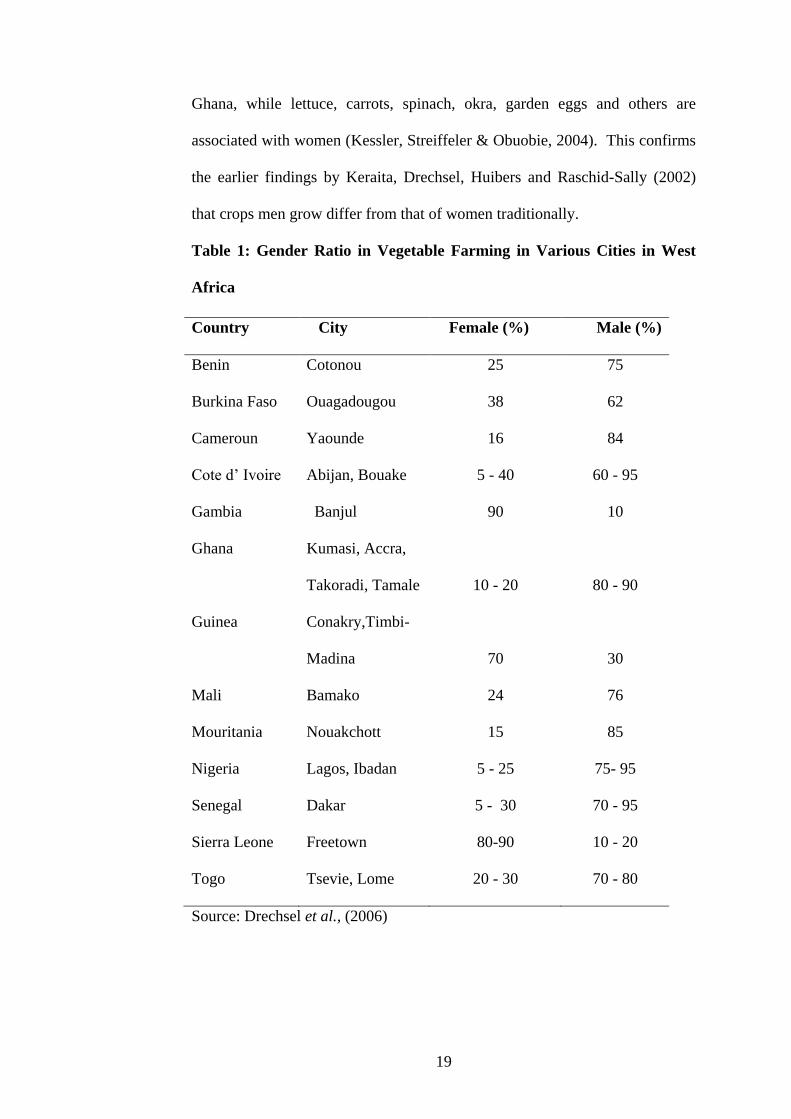
that men dominate urban agriculture production. Men dominated open-space
vegetable farming in 16 cities in 10 of 13 countries in a study comparing 21
countries in West Africa as shown in Table 1.
In contrast to vegetable farming, women both in Ghana and elsewhere
dominate vegetable marketing sector, particularly retailing (Gerstl, 2001). On
urban vegetable production, there are crops which are traditionally handled by
men, while others are considered preserve of women. Among the vegetables,
cabbage, sweet pepper and cucumber are normally associated with men in
19
Ghana, while lettuce, carrots, spinach, okra, garden eggs and others are
associated with women (Kessler, Streiffeler & Obuobie, 2004). This confirms
the earlier findings by Keraita, Drechsel, Huibers and Raschid-Sally (2002)
that crops men grow differ from that of women traditionally.
Table 1: Gender Ratio in Vegetable Farming in Various Cities in West
Africa
Source: Drechsel et al., (2006)
Country City Female (%) Male (%)
Benin Cotonou 25 75
Burkina Faso Ouagadougou 38 62
Cameroun Yaounde 16 84
Cote d’ Ivoire Abijan, Bouake 5 - 40 60 - 95
Gambia Banjul 90 10
Ghana Kumasi, Accra,
Takoradi, Tamale
10 - 20
80 - 90
Guinea Conakry,Timbi-
Madina
70
30
Mali Bamako 24 76
Mouritania Nouakchott 15 85
Nigeria Lagos, Ibadan 5 - 25 75- 95
Senegal Dakar 5 - 30 70 - 95
Sierra Leone Freetown 80-90 10 - 20
Togo Tsevie, Lome 20 - 30 70 - 80
20
Women dominance in urban vegetable marketing has also been
confirmed by Flynn-Dapaah (2002) and Obuobie, Drechsel, Danso and
Raschid-Sally (2004) that women handle about 60-90 percent of farm produce
from the point of origin to consumption in coastal West Africa. The views of
Drechsel, Graefe, Sonou and Cofie (2006) that the activities of these women
vendors are their primary means of obtaining cash income for household
expenditure is consistent with the previous assertions.
Influences of Gender Disparity in Land Access for Vegetable production
Various studies have assigned reasons or attempted to explain
influences of men and women dominance in vegetable production and
marketing in urban Ghana respectively. Among the reasons offered include
access to land, the nature of vegetable production, traditional role of farmers,
unwillingness to take risks and economic strategy. Land issues are major
constraint in urban vegetable production. According to Hosna (1998),
Ghanaians have asserted that women do not own land either in their marital or
natal ancestral home. It might imply that women may not be able to cultivate
because they do not own land. In some regions under customary law, women
do not have the right to hold land except through male relatives or as widows.
However, they can have user rights unless land is in short supply. Sometimes
they are pushed towards more marginal lands (Zibrilla & Salifu, 2004). The
findings by Cornish and Lawrence (2001) and Jacobi, Amend and Kiango
(2000) that women farmers in Eastern African cities like Nairobi and Dar es
Salaam dominate urban vegetable production is at variance with those reported
in Ghana.
21
The Nature of Vegetable Production
The difficult nature of most of the farm tasks account for male
dominance in open-space vegetable farming (Cornish & Aidoo, 2000). Land
has to be cleared and prepared followed by the raising of beds, nursing of
seeds, transplanting, weeding, watering and stirring. Cornish and Lawrence
(2001) study results agree with earlier findings by Cornish and Aidoo that
vegetable production is difficult and most women will not dare. Another
decisive activity in the cultivation of some exotic vegetables is the nursery
management (Cornish, Aidoo & Ayamba, 2001). Cornish and Lawrence
(2001) again reported that generally women do not have this knowledge and
skill making nursery management a male task, occasionally assisted by
women and their children in watering. The findings of Cornish and Lawrence
that women have little knowledge in nursery management and will not dare to
take risk are consistent with his earlier results.
The Traditional Roles of Farmers
The conventional function of men and women provide a
supplementary explanation as to why men dominate open-space vegetable
production in urban Ghana. Generally, farming is considered in most
Ghanaian communities as preserve of men particularly if it is market oriented.
Zakaria, Lamptey and Maxwell (1998) reported that it is still unacceptable for
women who hail from the northern part of Ghana to farm by themselves in any
city. They could only work on their husbands farms where they are made to
concentrate on food crop production for home consumption whilst their
husbands focus on commercial crops. The findings of Hosna (1998) that
22
women do not own land in their marital or ancestral home confirms the report
by Zakaria et al. (1998).
Unwillingness to take Risks
Nursery management practices though not difficult; it requires special
knowledge and or skills in early detection of pests and diseases and careful
study of seedlings growth. Vegetable seeds are relatively expensive and yet
one could easily lose the seedlings without the necessary nursery skills and
knowledge (Cornish, Aidoo & Ayamba, 2001). These findings are in line with
that report by Cornish and Lawrence (2001) that generally, women lack
nursery management practices making it a preserve of men but occasionally
assist these men together with their children in watering. This is an indication
that, most women are reluctant to take the risk of nursing their own seedlings.
It also makes it difficult for the few women cultivating to become independent
cultivators.
Economic Strategy
Economic factor is last but not the least reasons assigned for men and
women’s dominance in the vegetable industry. Cofie, van Veenhuizen and
Drechsel (2003) reported that between 40 and 80 percent of urban farmers in
Kumasi consider urban farming to be their main income generating activity.
For most of them, it is their only source of income. According to Zakaria,
Lamptey and Maxwell (1998), the cost of transportation to and from the farm
deters women from cultivating. Unlike their men counterparts most of whom
have bicycles which they use to commute between their farms and places of
23
residence. Obuobie, Drechsel, Danso and Raschid-Sally (2004) however,
argued that irrigation with two cans per walk is what actually daunts women
who would have otherwise been engaged in the industry.
Age Distribution of Urban Vegetable Farmers
A random sample of urban vegetable farmers conducted by IWMI
(2006) in three cities (Kumasi, Accra and Tamale) in Ghana showed that 54 -
79 percent of vegetable farmers were between the ages of 20 and 40 years.
Again, 4 percent of the vegetable farmers were below age 20 whilst 28 percent
were over 40 years. The findings of Ojo, Connaughton, Kintomo, Olajide-
Taiwo and Afolayan (2010) in Southern Nigeria (Lagos) also revealed that
only 20 percent out of a total of 113 vegetable farmers were below age 30. The
report further indicated that 80 percent fell between the age ranges of 30 and
50 indicating that no farmer aged above 50. Though, the result of the former
study is inconsistent with the latter, it is clear from both studies that the
majority of the farmers were in their prime age and therefore stronger than the
aged. Another study by Lewu and Assefa (2009) on 48 urban vegetable
farmers indicated that about 70 percent were in their active age affirming the
prime age group of the urban vegetable farmer.
Marital Status of Urban Vegetable Farmers
In a study conducted in three cities in Ghana (Kumasi, Accra and
Tamale) by IWMI (2006), indicated that more than half of the respondents
were married and occasionally involve their wives in the marketing of the
produce. Similarly, the findings of Keraita (2002), Obosu-Mensah (1999) and
24
Ojo, Connaughton, Kintomo, Olajide-Taiwo and Afolayan (2010) that the
majority of urban vegetable farmers in cities like Lagos (80 percent) and
Abeokuta (93.3 percent) were married is in line with IWMI’s (2006) claim.
The study results of Egyir and Beipuo (2009) that about 81 percent of urban
vegetable farmers were found to be married compared to 19 percent
unmarried further support the earlier assertion that the majority of urban
farmers are married.
Educational Status of Urban Vegetable Farmers
Farmers who are better educated are generally more open to innovative
ideas and new technologies that promote technical change (Lepar & Ehui,
2003). Educated farmers are also more open to improve farming techniques
and hence have better production efficiency than the less educated or those
without formal education (Obwona, 2000). The findings by Das (1997) that
educational background and active labour have significant positive effects on
adoption of technologies further buttressed the previous study results.
According to a survey conducted by IWMI (2006), in three cities in Ghana
(Kumasi Accra and Tamale), there is high level of literacy among farmers in
Kumasi (65 percent) and Accra (52 percent). Tamale however recorded the
highest illiteracy rate of 79 percent. The majority of farmers in Kumasi and
Accra have either acquired primary or secondary education or both. According
to the fifth round of the Ghana Living Standards Survey report (GLSS-5), only
13.6 percent of students possessed Senior High School or higher qualification
(Ghana Statistical Service, 2008) Furthermore, a study conducted in Abeokuta,
Abanla and Akufo by Ojo, Connaughton, Kintomo, Olajide-Taiwo and
25
Afolayan (2010), that 73.3 percent of the farmers are not educated beyond
primary school level agree in part with the findings of IWMI (2006). On the
contrary, the results of the same study conducted in Lagos and Bode that the
majority of the respondents had secondary school education contradict the
findings reported in Abeokuta, Abanla and Akufo. Nonetheless, it is obvious
that urban vegetable farmers have at least acquired basic education.
Household Size of Urban Vegetable Farmers
Urban vegetable farmers’ household in this study is described in terms
of those who eat from the same pot. Household size of urban vegetable
farmers in three cities studied in Ghana (Kumasi, Accra and Tamale)
according to IWMI (2006) indicates a wide distribution in household size in
Accra and Tamale. Household size of farmers in Kumasi were either single or
had households up to 5 members. Only few farm household exceeded this. The
mean household size was 2 for Kumasi and 4 for both Accra and Tamale
against the average figure of 5.1, 4.5 and 6.1 for Kumasi, Accra and Tamale
respectively according to the 2000 population and housing census. The largest
households had 8, 16 and 18 members for Kumasi Accra and Tamale
respectively. According to Egziabher et al. (1994), a household size ranged
from one person to over 10. Those with 4 to 6 member represented about 50
percent of the household. Their findings are consistent with the outcome of
IWMI’s studies except that in Kumasi which did not record any household
size above 10 members.
26
Land Acquisition by Urban Vegetable Farmers
According to Cornish and Lawrence (2001) and Flynn-Dapaah (2002),
most urban vegetable production sites belong to government institutions and
private developers who have not commenced construction. Other production
sites include reserved areas along streams and other water bodies. Mostly,
farmers enter into informal agreement with the land owners or care takers and
do not necessarily pay for the use of such lands. As a result of this there is no
security of tenure as farmers are permitted to cultivate only as long as the
owners do not require immediate use of the land. The findings of Obosu-
Mensah (1999) that most urban farmers (both male and female) cultivated
land that belong to either government or private developers agree with the
earlier assertions but further added that access to these lands depend on the
individual’s ability to lobby and not influenced by gender.
The situation is however different in cities like Lagos and Abeokuta
where about 50 percent each of urban vegetable farmers leased and rented land
in Lagos. The majority (93 percent) also leased land for similar purpose in
Abeokuta (Ojo, Connaughton, Kintomo, Olajide-Taiwo & Afolayan, 2010).
According to Van den Berg (2002), urban vegetable farming appears
unsustainable as a result of low tenure security. He therefore likened urban
vegetable production to ‘shifting cultivation’ due to the frequent relocation of
urban farms to pave way for infrastructural developments.
Total Land Put to Vegetable Production by Farmers
Land is a major factor of production or natural asset which supports
production. Most of the urban vegetable farmers do not own the land on
27
which they cultivate (Cornish & Lawrence, 2001 and Flynn-Dapaah 2002).
According to Ojo, Connaughton, Kintomo, Olajide-Taiwo and Afolayan
(2006), most of the urban vegetable producers, are small scale farmers
cultivating farm sizes ranging between 0.1ha and 0.33ha with average farm
size of 0.02ha. To Moustier, Moumbele and Huat (2004), urban vegetable
farm sizes are dependent on land and labour availability. They indicated that
though farm sizes ranged between 0.2ha and 0.3ha, typical farm sizes ranged
between 0.05ha and 0.1ha. The findings of Moutier et al. are consistent with
that of Ojo et al. but further stated that farm sizes could be larger where small
motor pumps are used to support irrigation. The findings by Tallaka (2005)
and Zalle (1997) however, differ from the earlier assertions. To them, farm
sizes in Kumasi or Dakar ranges from 0.1ha to 0.8ha but revealed that they
could reach about 1.5ha to 2.5ha or more in cities such as Bamako and Lome.
Sources of Irrigation Water and Technologies Used
Irrigation water is obtained from a range of sources, conveyed to the
fields and applied to the crops using different methods (Cornish & Aidoo,
2000). The quality of irrigated water varies between pipe-borne water and raw
wastewater. The views of Keraita, Danso and Drechesel (2003) are consistent
with the findings of Cornish and Aidoo (2000) and Tandia (2002) that most
water used for irrigation is stream and drain water which is highly polluted
with domestic grey water. Polluted rivers and streams are the main sources of
water for 70 percent of farmers. There is an extensive use of shallow dug wells
on valley bottoms (27 percent). More than 75 percent of the 70 farmers
interviewed confirmed they use the source of water that is accessible and
28
reliable. Pipe-borne water is not only inaccessible to farmers but also
expensive and unreliable (Keraita, et al., 2003). Vegetable farmers in Kumasi
Metropolis use watering cans, buckets, motorised pumps with hosepipe,
surface, drip and sprinkler irrigation methods.
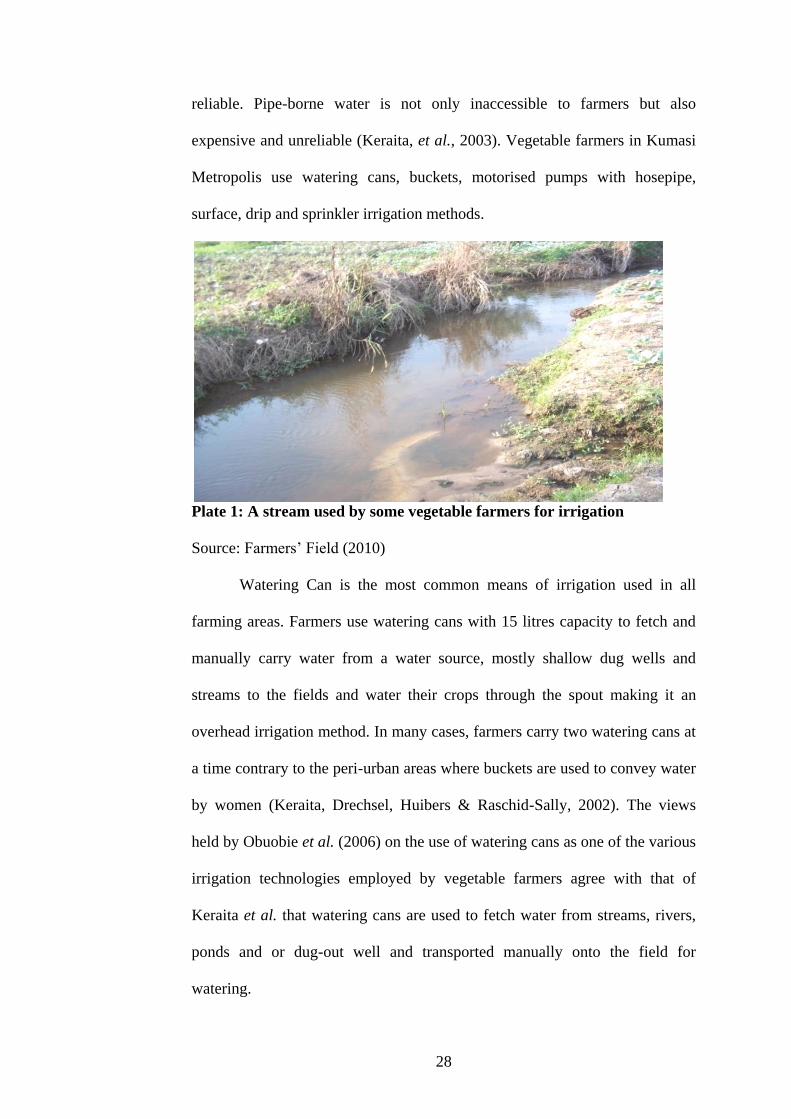
Plate 1: A stream used by some vegetable farmers for irrigation
Source: Farmers’ Field (2010)
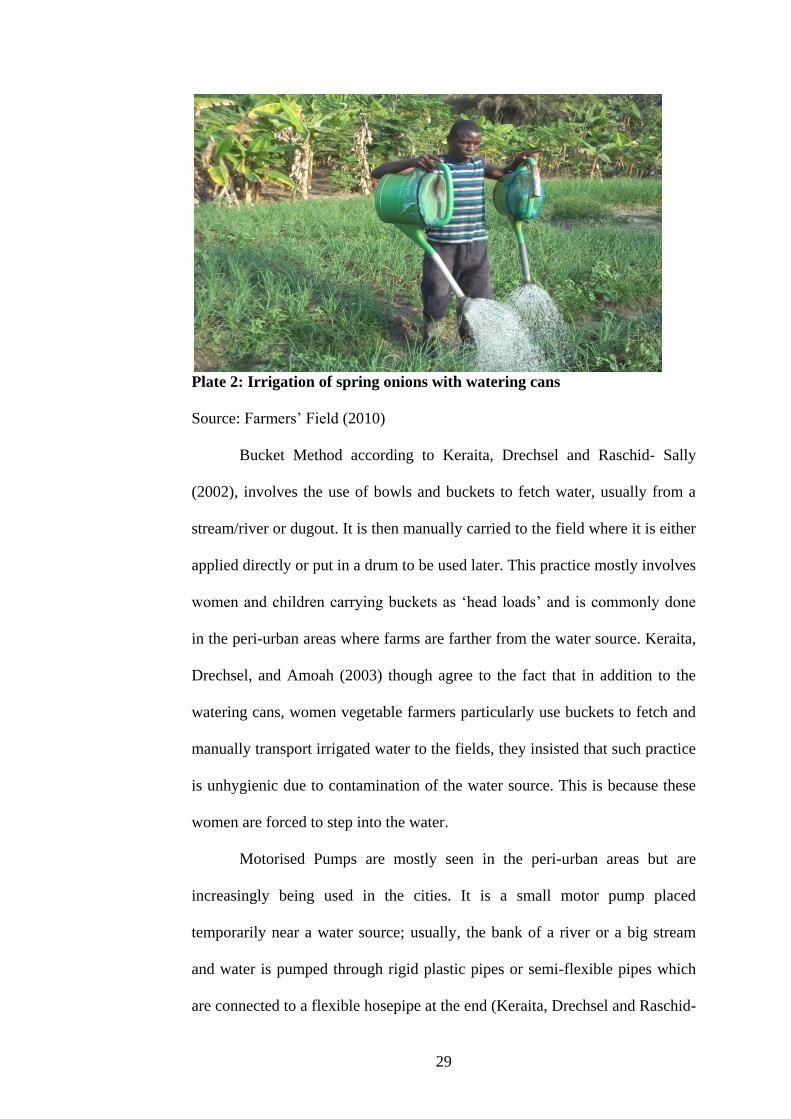
Watering Can is the most common means of irrigation used in all
farming areas. Farmers use watering cans with 15 litres capacity to fetch and
manually carry water from a water source, mostly shallow dug wells and
streams to the fields and water their crops through the spout making it an
overhead irrigation method. In many cases, farmers carry two watering cans at
a time contrary to the peri-urban areas where buckets are used to convey water
by women (Keraita, Drechsel, Huibers & Raschid-Sally, 2002). The views
held by Obuobie et al. (2006) on the use of watering cans as one of the various
irrigation technologies employed by vegetable farmers agree with that of
Keraita et al. that watering cans are used to fetch water from streams, rivers,
ponds and or dug-out well and transported manually onto the field for
watering.
29
Plate 2: Irrigation of spring onions with watering cans
Source: Farmers’ Field (2010)
Bucket Method according to Keraita, Drechsel and Raschid- Sally
(2002), involves the use of bowls and buckets to fetch water, usually from a
stream/river or dugout. It is then manually carried to the field where it is either
applied directly or put in a drum to be used later. This practice mostly involves
women and children carrying buckets as ‘head loads’ and is commonly done
in the peri-urban areas where farms are farther from the water source. Keraita,
Drechsel, and Amoah (2003) though agree to the fact that in addition to the
watering cans, women vegetable farmers particularly use buckets to fetch and
manually transport irrigated water to the fields, they insisted that such practice
is unhygienic due to contamination of the water source. This is because these
women are forced to step into the water.
Motorised Pumps are mostly seen in the peri-urban areas but are
increasingly being used in the cities. It is a small motor pump placed
temporarily near a water source; usually, the bank of a river or a big stream
and water is pumped through rigid plastic pipes or semi-flexible pipes which
are connected to a flexible hosepipe at the end (Keraita, Drechsel and Raschid-
30
Sally (2002). Farmers use the hose to apply water to their crops either
overhead or near the roots on the surface. Pumps helps to reduce transport
ways: water was pump into a dugout from where water was fetched with cans.
The opinion of Keraita, Drechsel and Amoah (2003); Obuobie et al. (2006)
that motorised pump usage is no longer confined to the peri-urban areas
concurs with the findings of Keraita et al. (2002). However, they admitted that
its usage is on limited scale as a result of high initial cost out lay on the use of
motorised pump.
Sprinkler Irrigation is confined to a few sites in urban Kumasi behind
Georgia Hotel. In this method, the sprinkler system is connected to a pipe
borne water source. Improvise materials were used such as bamboo for the
sprinkler risers (Keraita, Drechsel & Raschid- Sally 2002). The findings of
WHO (2007) are consistent with Keraita, Drechsel, and Konradsen (2007) that
the use of localised irrigation technologies like bubbler, trickle and drip could
offer healthy protection for vegetable farmers who use untreated wastewater
for irrigation. Though Kay (2001) and Postel (2001) admit this irrigation
technology offer vegetable farmers’ protection from untreated wastewater they
indicated that its high cost impedes its large scale adoption in Ghana unlike
India and Cape Verde.
Major Traditional Farming Sites in the Kumasi Metropolis
Most urban land in Kumasi used for urban vegetable production does
not belong to the individual farmers. There are about 41ha of land in the urban
areas under informal dry-season vegetable irrigation (Cornish & Lawrence,
2001). Some open-space (traditional) vegetable production sites in the
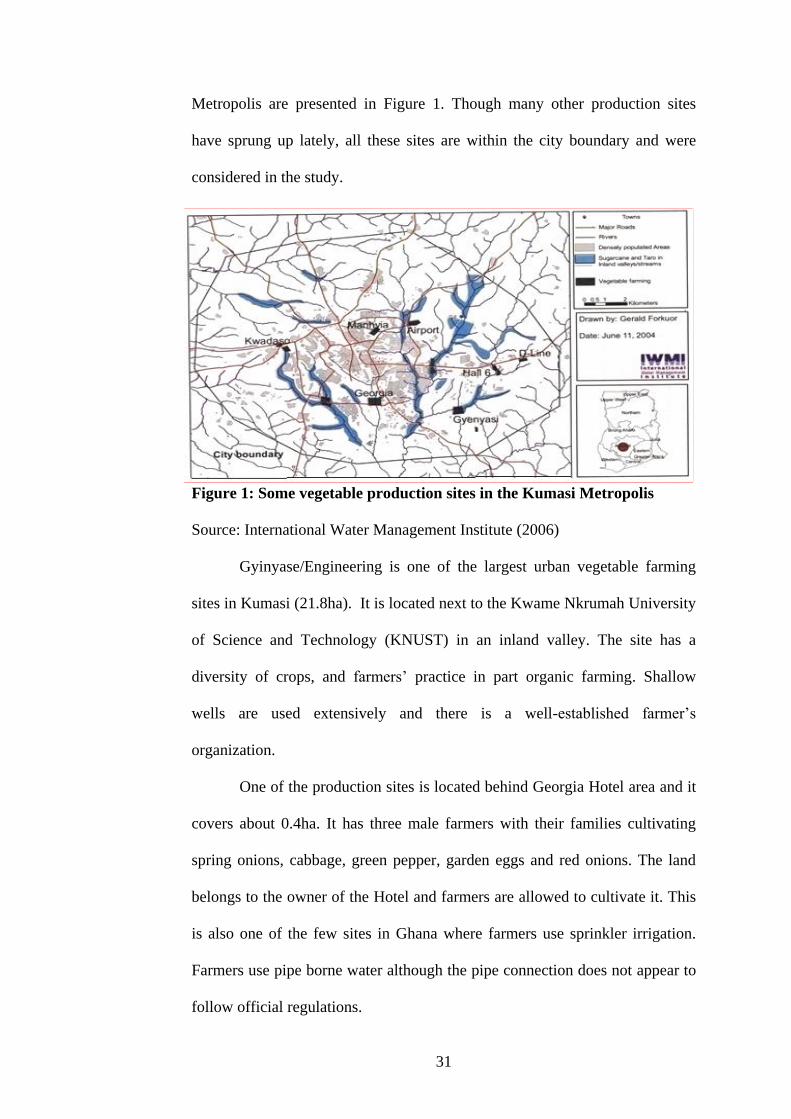
31
Metropolis are presented in Figure 1. Though many other production sites
have sprung up lately, all these sites are within the city boundary and were
considered in the study.
Figure 1: Some vegetable production sites in the Kumasi Metropolis
Source: International Water Management Institute (2006)
Gyinyase/Engineering is one of the largest urban vegetable farming
sites in Kumasi (21.8ha). It is located next to the Kwame Nkrumah University
of Science and Technology (KNUST) in an inland valley. The site has a
diversity of crops, and farmers’ practice in part organic farming. Shallow
wells are used extensively and there is a well-established farmer’s
organization.
One of the production sites is located behind Georgia Hotel area and it
covers about 0.4ha. It has three male farmers with their families cultivating
spring onions, cabbage, green pepper, garden eggs and red onions. The land
belongs to the owner of the Hotel and farmers are allowed to cultivate it. This
is also one of the few sites in Ghana where farmers use sprinkler irrigation.
Farmers use pipe borne water although the pipe connection does not appear to
follow official regulations.
32
D-Line/Weweso site covers an area of about 3.1 ha and is located
beside the Kumasi-Accra high way (next to the KNUST police station) and
farmers predominantly cultivate spring onions. It has about 30 farmers
organised in an association. The source of water is a small stream which
receives untreated effluents from a significant number of households.
Vegetable production in the metropolis is on the ascendancy as new
production sites have emerged lately and have been included in this study.
Plate 3: Spring onion growing in one of the production sites
Source: Farmers’ Field (2010)
Access to Agricultural Information
According to Danso, Fialor and Drechsel (2002), out of the 30 farmers’
interviewed on the access to agricultural extension services and market
information in Accra, 80 percent mentioned that they (both men and women)
have equal access to market information on the demand for their produce and
extension services. They indicated that these results were not different from
that reported in Kumasi. To Drechsel and Kunze (1999) lack of knowledge
33
among farmers hinders their access to markets or prevents them from
producing for markets even when it was profitable to do so. The findings of
Van den Berg (1997) that inadequate or lack of agricultural information
orientate small-scale farmers towards proving to feed their families rather than
for the markets is consistent with previous assertion. Gockowski and
Ndoumbé (2004) noted that lack of extension services particularly among
small-scale farmers can impede intensification as well as production levels of
crops. Their findings agree with the earlier assertion by Van den Berg about
lack of or inadequate access of farmers’ to agricultural extension services.
Sources of Financial Capital for Urban Vegetable Farming
Agriculture is the main stay of the economy of Ghana. It contributes
more than 36 percent of Gross Domestic Product and employs about 60
percent of Ghana’s labour force (Institute of Statistical, Social and Economic
Research, 2002). Unfortunately, most urban farmers do not have access to
formal credit scheme in Ghana. This is mainly due to the fact that farmers
cannot meet the collateral demands of the financial institutions. In addition,
most of the urban farmers have limited space for cultivation and do not own
the land. In spite of these problems, some urban vegetable farmers have
informal negotiations with the vegetable sellers in terms of access to informal
credit. Sellers pre-finance farming activities by providing seeds, fertilizer,
pesticides or cash in order to produce for them. Farmers can sell to other
traders only after the regular customers have made their choices. Other West
African countries also experienced like situation (Danso & Drechsel, 2003).
Similar observations was made by Cornish and Lawrence (2001) and Tallaki
34
(2005) that urban vegetable farmers have myriad of challenges especially
financial capital as a result most of them depend on either their meagre
resources or customers for production. The report by Abaidoo et al. (2009)
that only a small proportion of urban farmers interviewed had access to credit
facilities is consistent with the previous findings.
Sources of Labour for Vegetable Farming Activities
According to Drechsel, Giordano and Gyiele (2004) urban vegetable
production is labour intensive. All the activities involved in vegetable
production require the use of labour. Initial land clearing, raising of beds,
nursery management practices, transplanting and all the cultural practices
make use of labour. The sources of farm labour for urban vegetable farming
are family labour and or hired labour. Contrary to hired labour, family labour
receives no wage when engaged in farm activities. The opinions of Faruqui,
Niang and Redwood (2004) that to perform all the cultural practices required
in vegetable production or to irrigate larger areas, most producers use family
labour and paid workers agree with the findings of Drechsel et al. According
to Ezedinma and Chukuezi (1999), watering and land preparation are the most
labour intensive vegetable production operations. They further indicated that
hired labour is engaged for major activities, namely, land preparation,
transplanting, weeding, irrigation and harvesting. Other activities for which
hired labour may be required include organic manure and pesticides
application. The findings of Ezedinma and Chukuezi that hired labour is
engaged in major vegetable production activities is inconsistent with the
observations made by Drechsel et al. (2004) and Faruqui et al. (2004). The
35
opinion held by Flynn-Dapaah (2000) that urban farmers depended on
personal labour departs from the earlier submissions.
Investment in Urban Vegetable Production
Most people engaged in urban agriculture due to its quick returns and
low capital investment. As a user of inputs (land, water, seeds, agro-chemicals,
labour), urban agriculture provide very little economic injection into the local
market economy. This is because the inputs used are minimal often available,
free and not of higher value. These low costs of production are a primary
reason that urban agriculture is attractive to low-income people, as they can
take up the activity with little investment and operating expenses (United
Nations Centre for Human Settlement, 1999). Traders occasionally provide
farmers with credit and inputs, especially seeds in order to produce crops for
them to sell. Mostly, farmers use watering cans to convey water from dug
wells, drains and streams to irrigate their crops. Manual irrigation requires
frequent trips making it labour intensive as water application rates are high
(Keraita, Drechsel, Huibers & Raschid (2002). Labour for watering accounts
for 40-75 percent of the total cost (excluding family labour) and 38 percent of
farmers’ time. Even higher percentages are possible in drier areas and sandy
soils (Tallaki, 2005). The findings agree with the earlier studies by Danso,
Drechsel, Wiafe-Antwi and Gyiele (2002) that vegetable production is labour
intensive and time consuming. When water is pumped, the cost for hiring
pump is estimated to be from US$ 40-70 per dry season. Manual labour in
general, is more expensive per volume of water delivered (US$ 3-6 per m3)
36
compared to using pumps (US$ 0.6-5per m3) (Cornish, Aidoo & Ayamba,
2001).
The major investments in urban vegetable farming include the cost of
water which includes hiring of pump, cost of labour (for watering and other
activities). Weeding, which is also labour intensive was rated as the most
expensive activity by the farmers accounting for an average of about 23
percent of the total cost. Most farmers who depend on family labour rarely
pay for it. They hired labour occasionally for lager number of vegetable beds,
but hardly pay more than US$ 11 per season. Significant number of vegetable
farmers also uses other types of soil amendments as well as pesticides. The use
of poultry manure is very common due to its availability and low price (US$
0.2 per sack). However, only a few vegetable farmers use mineral fertilizers
(US$ 14 per 50kg NPK) in addition to the organic manure (mostly for
cabbage) (Drechsel, Giordano & Gyiele, 2004). The findings of Drechsel,
Giordano and Enters (2005) that crops like cabbage require synthetic
fertilizers and further mentioned that manure application rates can be as high
(20-100t/ha/yr) agree with the results of Drechsel et al. (2004).
Productivity Level of Urban Vegetable Farmers
The productivity of the land is the ratio of gross revenue obtained from
production to the land put under production. One common assumption about
urban agriculture according to Nugent (1999) and FAO (1998) is that, yields
are quite low, largely because of poor-quality inputs, low-technology farm
practices and high losses from a variety of sources. They went on to say that
such conditions are not universal since high yields have been documented by
37
urban farmers in some cases. It is also revealing that vegetable farmers in
urban Kumasi with access to irrigation water are able to cultivate all-year-
round to attain annual income levels of US$ 400-800. This is twice the income
they would earn in the rural settings. Urban farming is land and labour
constrained as such typical farm sizes range between 0.05ha and 0.2ha. Even
with plot sizes that are significantly smaller than in rural areas, urban farmers
earn at least as much as rural farmers (Danso, Drechsel, Wiafe-Antwi &
Gyiele, 2002) and Drechsel, Blumenthal & Keraita, 2002). The range of farm
sizes is consistent with the findings of Moustier, Moumbele and Huat (2004)
who mentioned farm sizes between 0.02ha and 0.3ha as pertaining throughout
the sub-region. He further indicated that land sizes could be smaller in areas
where land is scarce. To Tallaki (2005) and Eaton (2003) farm sizes range
from 0.1 to 0.8ha which far exceeds the range indicated by Moustier et
al.(2004)
To Danso, Drechsel, Akinbolu and Gyiele (2003) monthly net income
from mixed vegetable production ranges between US$ 10 and US$ 300 per
farmer depending on farm size. The annual net income estimated by Faruqui,
Niang and Redwood (2004) was US$ 365 per farmer, a figure lower than what
Danso, Drechsel, Wiafe-Antwi and Gyiele (2002) and Drechsel, Blumenthal
and Keraita (2002) estimated. Irrigated vegetable farming (lettuce, cabbage
and onions) figures was US$2,000-8,000/ha/year while dry season irrigation
vegetable farming was only US$300-350/ha/year as reported by Danso, et al.
(2002). These figures confirm the findings by Drechsel et al. (2002) that
vegetable production is lucrative. However, they indicated that it was risky to
generalise productivity from urban farming because the farming conditions
38
vary greatly from season to season and location to location. Cornish and
Lawrence stated that about 95 percent of the lettuce produced in Kumasi
comes from urban farms. The findings of Cornish and Lawrence (2001) that
urban vegetable production is for income generation is in line with that of
Drechsel et al. (2002).
Marketing of Urban Vegetable Produce
The production of vegetables in urban open-space in Ghana is
purposely for the market, which explains why few women are involved.
Women’s dominance in marketing urban farm produce is partly attributed to
the Ghanaian tradition that marketing of vegetables is a preserve of women.
Furthermore, women held the opinion that marketing is more lucrative and
less risky than farming. Maxwell (1997) cited in Obosu-Mensah (1999)
reported that urban retail marketing and petty trading are sectors that have
been dominated by women in West Africa. Gerstl (2001) also held similar
views that women glut the market for the sale of vegetables. Traders usually
purchase vegetables at farm gate level. Prices vary significantly from one
season to another. The findings of Abaidoo et al. (2009) that all farmers sell
their produce at farm gate level confirm the earlier assertion by Gerstl (2001).
Vegetable Farmers Years of Experience
The number of years of farming experience impact positively on the
production efficiency of farmers. According to a survey carried out by Ojo,
Connaughton, Kintomo, Olajide-Taiwo and Afolayan (2010), about farming
experience, revealed that 48.0 percent of vegetable farmers in Lagos had over
39
15 years farming experience. Fourty-five percent had less than 10 years
experience and 7 percent had farming experience between 10 and 15 years.
The findings of a similar study conducted in Abeokuta also indicated that
majority (58.0%) of the vegetable farmers had between 10 to 15 years farming
experience (Ojo, et al., 2010). The findings by Abaidoo et al. (2009) about
farmers production experience was less due to the youthful nature of the
respondents. These findings are inconsistent with the earlier assertion by Ojo
et al. (2010).
Vegetable Production and Marketing Challenges
According to Obuobie, Keraira, Danso, Amoah, Cofie, Raschid-Sally
and Drechsel (2006), a survey on vegetable farmers to identify and rate their
perception on production challenges revealed that inadequate water especially
during the dry season was their main production challenge. Vegetable farmers
(68 percent) also identified inputs cost (seeds, agro-chemicals, fertilizer or
manure and tools) as a production challenge. In addition, 59 percent of the
farmers in Kumasi specified the exact marketing problem as ‘fluctuating
demand’. More than two-thirds of the respondents indicated crop pests and
diseases as responsible for crop damage. None of the constraints was ranked
on average as ‘most important’. Farmers ranked crop pests and diseases as
important constraints. Soil fertility, credit facilities and marketing were ranked
‘less important’. To Cornish, Aidoo and Ayamba (2001) poor price
information and lack of cold transport and storage facilities were identified as
common bottlenecks of traditional marketing structures. The views held by
Drechsel and Kunze (1999) that fluctuating demand and absence of storage
40
facilities were some of the marketing challenges urban vegetable farmers face
is consistent with the findings of Cornish, Aidoo & Ayamba (2001).
Theories and Basic Concepts of Livelihoods
Most agencies’ definition of livelihood is similar and adopted from
Chamber and Conway’s (1992) definition of livelihood despite their varied
terminologies employed. The word “livelihood” is used in many fields, but the
term as used in the Department for International Development (DFID)
‘Sustainable Livelihood Guidance Sheet’ is understood as follows: ‘A
livelihood comprises the capacities, assets and activities required for a means
of living. A livelihood is sustainable when it can cope with and recover from
stresses and shocks and maintain or enhance its capacities and assets both now
and in the future, without undermining the natural resource base’ (Chamber &
Conway, 1992). The definition offered by FAO (2002) suggests that
‘livelihood’ does not just mean the activities that people carry out to earn a
living. It means all the different elements that contribute to, or affects their
ability to ensure a living for themselves and their household. This includes:
1) All the activities which are transformed by the livelihood assets
that the household depend on for a living, such as natural,
information, financial, human, social and physical capitals.
2) The strategies and activities that allow the household to use those
assets to satisfy basic needs.
3) The different factors that the household itself may not be able to
control directly, like the seasons, natural disasters or economic
trends that affect its vulnerability.
41
4) Policies and processes that may help or make it more difficult for
them to achieve adequate livelihood (FAO, 2002).
It is clear that the four elements in concert direct the household
processes of decision making on urban vegetable production activities. In
summary, the Livelihoods Approach put the livelihoods of vegetable farmers
at the centre of analysis and action. It focuses on the main production
processes and factors that affect these farmers’ livelihoods and the typical
relationships between these factors.
Livelihood Assets
Livelihood assets may be described as stocks of capital that can be
utilised directly or indirectly to generate the means of survival of the
households (Ellis, 2000; FAO, 2002). There are six division or categories of
assets that can provide a useful starting point for a household livelihood
analysis as well as a guide, which can help a researcher appreciate a complete
picture of the household and its livelihood assets (FAO, 2002). These
livelihood categories were adopted from DFID’s Sustainable Livelihood
Guidance Sheets (2000) and they include natural, information, financial,
human social and physical capitals.
Natural Capital is clearly important to those who derive all or part of
their livelihoods from natural resource-based activities such as farming,
fishing and gathering in forests (DFID, 1999). In term of natural processes (e.g
flood, drought and seasonality), there is a close relationship between natural
capital and the vulnerability context in which many of the shocks devastate the
livelihoods of the poor (DFID, 1999). Multiple benefits can be derived from
42
natural capital. For instance, secured access to land may also mean well-
endowed with financial capital as such land can be used for both productive
activities as well as collateral to access credit facilities (Akaba, 2008).
Information Capital provides a strong leverage that can be used to
assess other forms of capital. Information capital has been defined differently
by many authors: ‘Information as resource’ (Martin, 1995); ‘Information as a
commodity’ (Brama, 1989) and ‘Information as an intangible, which involves
either the telling of something or that which is being told’ (Machlup &
Mansfield, 1983). Martin suggested that the idea of information as a resource
is not only inherently attractive and intuitively credible; it is also well
established in fact. ‘Information capital’ means different kinds of data
endowed with relevance and purpose used by people to make decisions in
pursuit of their livelihood objectives. Information capital is such a
fundamental and vital livelihood asset that it ought to be integrated into the
livelihood framework. Information is such a critical component in people’s
lives that it is inconceivable to talk about livelihood without referring to the
role of information. Indeed, one of the core objectives of sustainable
livelihoods approach is to enhance people’s access to information. Urban
farmers base their livelihoods on the six types of assets that they own or can
access, to build livelihood activities involving vegetable farming and
improving capacity for their livelihood.
Financial capital for household livelihoods sometimes is not only in the
form of money. Each household converts it into forms of productive physical
assets such as vehicles, irrigation pumps, knapsack sprayers, wheelbarrows
43
and watering cans that depends on choices of investment. Its importance is as
a result of its versatility of the six categories of assets.
Human Capital - the poor have their own labour as key livelihood
assets (FAO, 2002). Human capital is increased by investment in education
and training, as well as, by the skills acquired through pursuing one or more
occupations (Ellis, 2000). Emphasising education and skills, it is clear that
gaining improvement in human capital is not easy and quick, especially to the
peasants who are confronted by shocks and risks. However, this asset is
important because it is both the object and subject of development. It is also
required for the utilisation of remaining capital.
Social Capital - the importance of social capital seems to be considered
as ‘resource of last resort’ – a shock and ‘a safety net to ensure survival during
periods of intensive insecurity’. Also, in social networks, households develop
knowledge and share that knowledge. It further helps to reduce the ‘free rider’
problem associated with the use of public goods and facilitates innovation.
Social capital according to Coleman (1990) is productive making possible the
achievement of certain ends that would not be attained in its absence. In a
livelihood framework, social capital entails the social networks and
associations to which people belong.
Physical Capital includes infrastructure such as buildings, roads,
electricity supply and machinery (Ellis, 2000). However, for the purposes of
this study, physical capital will be confined to facilities, equipment and tools
such as irrigation pumps and sprinkler, knapsack sprayers, watering cans,
wheel barrows and seeds that assist in production. According to Bosompim
(2006), in an attempt to enhance productivity, farmers’ physical capital is
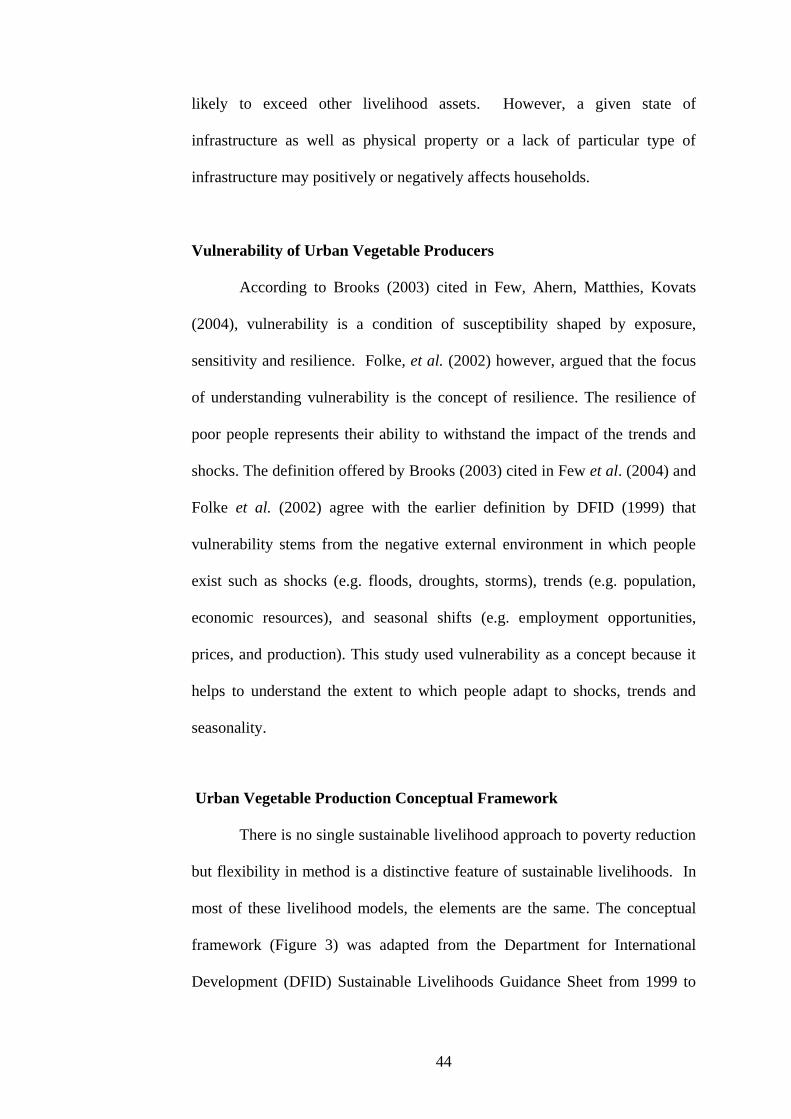
44
likely to exceed other livelihood assets. However, a given state of
infrastructure as well as physical property or a lack of particular type of
infrastructure may positively or negatively affects households.
Vulnerability of Urban Vegetable Producers
According to Brooks (2003) cited in Few, Ahern, Matthies, Kovats
(2004), vulnerability is a condition of susceptibility shaped by exposure,
sensitivity and resilience. Folke, et al. (2002) however, argued that the focus
of understanding vulnerability is the concept of resilience. The resilience of
poor people represents their ability to withstand the impact of the trends and
shocks. The definition offered by Brooks (2003) cited in Few et al. (2004) and
Folke et al. (2002) agree with the earlier definition by DFID (1999) that
vulnerability stems from the negative external environment in which people
exist such as shocks (e.g. floods, droughts, storms), trends (e.g. population,
economic resources), and seasonal shifts (e.g. employment opportunities,
prices, and production). This study used vulnerability as a concept because it
helps to understand the extent to which people adapt to shocks, trends and
seasonality.
Urban Vegetable Production Conceptual Framework
There is no single sustainable livelihood approach to poverty reduction
but flexibility in method is a distinctive feature of sustainable livelihoods. In
most of these livelihood models, the elements are the same. The conceptual
framework (Figure 3) was adapted from the Department for International
Development (DFID) Sustainable Livelihoods Guidance Sheet from 1999 to
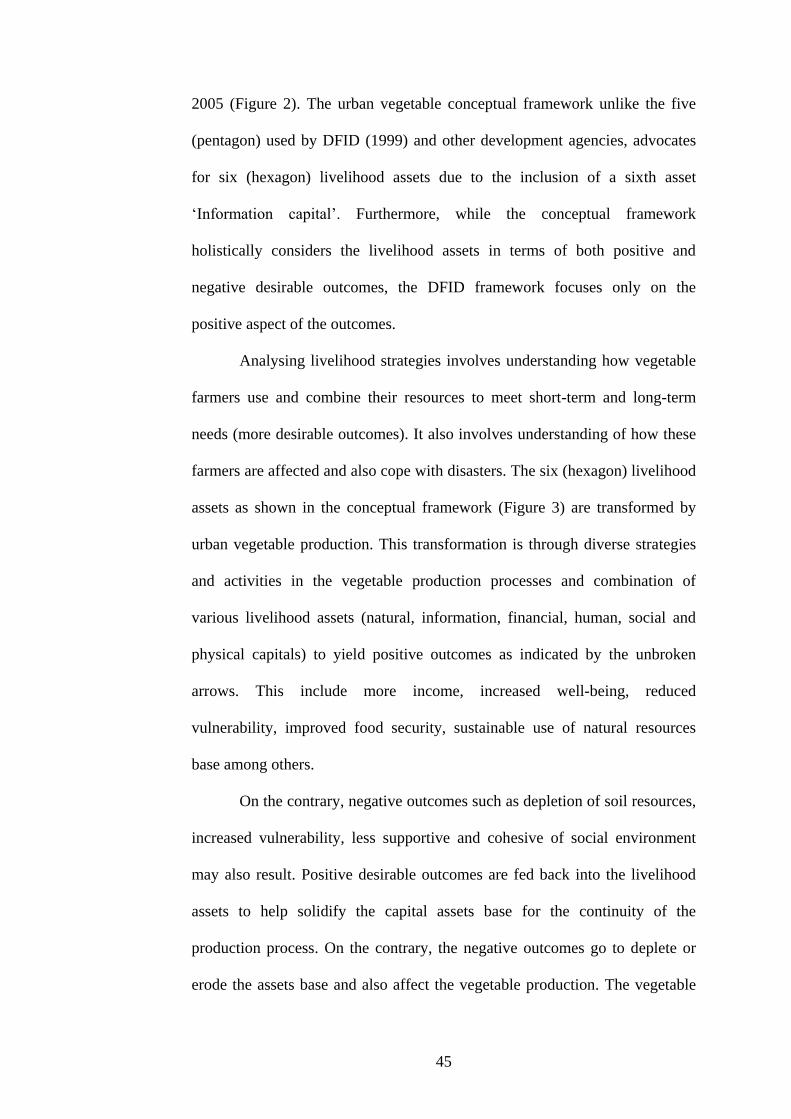
45
2005 (Figure 2). The urban vegetable conceptual framework unlike the five
(pentagon) used by DFID (1999) and other development agencies, advocates
for six (hexagon) livelihood assets due to the inclusion of a sixth asset
‘Information capital’. Furthermore, while the conceptual framework
holistically considers the livelihood assets in terms of both positive and
negative desirable outcomes, the DFID framework focuses only on the
positive aspect of the outcomes.
Analysing livelihood strategies involves understanding how vegetable
farmers use and combine their resources to meet short-term and long-term
needs (more desirable outcomes). It also involves understanding of how these
farmers are affected and also cope with disasters. The six (hexagon) livelihood
assets as shown in the conceptual framework (Figure 3) are transformed by
urban vegetable production. This transformation is through diverse strategies
and activities in the vegetable production processes and combination of
various livelihood assets (natural, information, financial, human, social and
physical capitals) to yield positive outcomes as indicated by the unbroken
arrows. This include more income, increased well-being, reduced
vulnerability, improved food security, sustainable use of natural resources
base among others.
On the contrary, negative outcomes such as depletion of soil resources,
increased vulnerability, less supportive and cohesive of social environment
may also result. Positive desirable outcomes are fed back into the livelihood
assets to help solidify the capital assets base for the continuity of the
production process. On the contrary, the negative outcomes go to deplete or
erode the assets base and also affect the vegetable production. The vegetable
46
production and marketing challenges also affect production hence production
outcome and ultimately farmers’ livelihood assets as ecosystem feedback. The
vulnerability of the environment in terms of trends, shocks and seasonality
also influence production, livelihood assets and production outcomes as shown
by the broken arrows. This conceptual framework (Figure 3) was developed to
assist, understand and analyse the livelihoods of vegetables farmers in the
Metropolis.
KEY
H = Human Capital S = Social Capital
N = Natural Capital P = Physical Capital
F = Financial Capital
Figure 2: Department for International Development Sustainable
Livelihood Framework
POLICIES
INSTITUTIONS
PROCESSES
Levels of
Government
Private
Sector Laws
Culture
Policies
Institutions
H
S N
P F
LIVELIHOOD
STRATEGIES
LIVELIHOOD ASSETS
LIVELIHOOD
OUTCOMES
More income
Increase well-
being
Reduced
Vulnerability
Improved food
Security
More-
sustainable use
of NR base
VULNERABILIT-
Y CONTEXT
Shocks
Trends
Seasonality
47
Figure 3: Conceptual Framework for Urban Vegetable Production
Source: Adapted from DFID Sustainable Livelihoods Framework (1999 -
2005)
Legend
PC = Physical Capital HC = Human Capital
FC = Financial capital SC = Social Capital
NC = Natural capital IC = Information Capital
VEGETABLE
PRODUCTION
PRODUCTION
OUTCOME
Positive
1. More income
2. Improved wellbeing
3. Reduced vulnerability 4. Improve food security
Negative
1. Increased vulnerability
2. Depletion of soil resources
3. Less cohesion
CHALLENGES
Production
1. High input cost
2. Poor soil fertility
3. Inadequate water
4. Lack of credit facilities
Marketing
1. Fluctuating demand
2.Low price offer
2. Post harvest losses
3. Female dominance
4. Lack of cold transport
FC
HC
NC IC
SC
PC
Production Process
Ecosystem feedback
48
CHAPTER THREE
METHODOLOGY
General overview
This chapter describes the procedure and techniques that were used to
collect and analyse data for the study. It includes the research design, study
population, sample procedure, sample size, instrumentation, data collection,
processing and analysis that were employed as well as the rationale behind the
techniques that were chosen for the study.
Research Design
A descriptive survey design was used for the study. This design was
used because, according to Glass and Hopkins (1984), it involves the
collection of quantitative information that can be tabulated along a continuum
in numerical form, such as scores on a test. It can describe categories of
information such as gender or patterns of interaction when using technology in
a group situation. Descriptive research involves gathering data that describe
events and then organises, tabulates, depicts, and describes the data collected.
According to Ary, Jacobs and Razavieh (2002); Borg and Gall (1989),
descriptive research asks questions about the nature, incidence, or distribution
of variables, and is primarily concerned with identifying the characteristics of
a population. To Borg and Gall (1989) descriptive research utilises
instruments such as questionnaires and interviews to gather information from
49
groups of respondents and is usually based upon data obtained from
participant observation. This study is however, not dissimilar from the various
assertions stated above.
Study Area
Kumasi is the second largest city of the nation and the capital of the
Ashanti Region. It is located about 270 km north of the national capital, Accra.
The city is between latitude 6.400 N and longitude 1.300- 1.350 W, an elevation
which ranges between 250-300 metres above sea level with metropolitan area
of about 254 square kilometers (KMA, 2006). The region lies within the forest
zone of Ghana. Kumasi falls within the wet sub-equatorial type of climate
with minimum and maximum average temperatures of 21.50C and 30.70C
respectively. The rainfall pattern of the area is bimodal from March to July
and from September to November. The vegetation of the metropolis falls
within the moist semi-deciduous South-East ecological zone and forest
ochrosol formed the major soil type. The topography of Kumasi is undulating
with major rivers and streams including Subin, Wewe, Susan, Aboabo, Oda,
Owabi, Suntreso, Acheampomene, Akrudu and Asuyeboa.
The total land area of the Ashanti Region is about 24,389 square
killometres with the metropolitan area comprising of 254sq km. The
population of Kumasi Metropolis is 1,170,270 (GSS, 2002). It was however
projected to 1,889,934 by 2009 with an annual growth rate of 5.4 %. The
metropolitan area of Kumasi shares boundaries with Kwabre East District to
the north, Atwima District to the west, Ejisu-Juaben Municipal to the east and
Bosomtwe - Atwima District to the south (KMA, 2006). At least two of three
50
households have some kind of backyard farming. A much higher percentage of
the population grows few plantain crops and keeps poultry (Kumasi Natural
Resource Management Project, 1999). The dominant staple food crops grown
include cassava, plantain and maize on upland sites, often accompanied by dry
- season vegetable farming especially along streams.
Study Population
The population of the study consists of all open-space vegetable
farmers in the Kumasi Metropolis. The population size is about 408 (M. Boafo
personal communication, June 10, 2010).
Sampling Procedure
A simple random sampling procedure was used for the study. This
probability sampling was employed due to its high degree of
representativeness, reliability and high generalisability of results. In simple
random sampling, each member of the population under study has equal
chance of being selected. This is because the method involves selecting at
random from a list of the population that required number of the subjects for
the sample. Consequently, for any complete randomisation to be effected, a
total list of the population is required. Cohen and Marion (1995) agree that this
method needs a complete list of the population which is not always readily
available. For this study, however, a good estimate of the population was
obtained from the records kept by MoFA office that provides extension
services to the farmers.
51
Sample Size
A common goal of a survey is to collect data representative of a
population. In the conduct of any research, one of the major decisions for the
researcher is how to determine the appropriate sample size representative of
the population. Nwana (1992) however, recommended that for a few hundred
population, sample size of about 40 percent or more can be adequate
representative; for many hundreds population, sample size of 20 percent will
be enough; for population of a few thousands, 10 percent sample size is
sufficient and for several thousand population, sample size of 5 percent or less
is recommended. It can be inferred from Nwana’s (1992) assertion that for
larger population, smaller percentage of the population should be used as the
sample size and for smaller population sizes; higher percentage sample size is
required.
The views held by Best and Kahn (1995) however, differ from
Nwana’s (1992). To them, there is no fixed number or percentage of subjects
that influence the size of a tolerable sample and debated that sample size may
depend on the nature of the population, data to be collected, type of analysis to
run and funds available for the research. To Cohen and Marion (1995), there
is no clear cut answer to how large a sample size should be in order to conduct
an adequate survey which will be representative and reliable. What they
however said is that correct sample size depends upon the purpose of the study
and the nature of the population under investigation. The views of Cohen and
Marion (1995) agree with those of Best and Kahn (1995) but went further to
say that a sample size of thirty is held by many to be the minimum number of
cases if researchers plan to use some form of statistical data.
52
There is also a growing amount of software used to determine adequate
sample size of population considered representative enough. These include
nQuery Advisor (Elashoff, 2000) and PASS (Hintze, 2000). To be able to state
with sufficient probability that any difference(s) found between groups is
likely to be due to the intervention, rather than the particular samples you
have, it is necessary to have a large enough sample size (Macfarlane, 2003).
Conceiving all these assertions, a total of 300 vegetable farmers were
randomly selected from all vegetable growing sites in the metropolis. For
descriptive research such as this, where the population is a little over 400,
sample size of 300 is considered representative in view of the above
reflections.
Instrumentation
Interview schedule (see Appendix 11) was used to elicit information on
the urban vegetable farming and its effects on farmers’ livelihoods. There are
basically about six ways to collect data as revealed by MacMillan and
Schumacher (1989). They stated them as observation, questionnaire,
interview, document, tests and unobtrusive measures. All research uses a
variation of one or more of the instruments mentioned above according to
MacMillan and Schumacher. However, they cautioned that the use of any of
the instruments depend on the strengths and limitations of each and other
considerations.
This instrument was used because of the numerous advantages it has
over other instruments. These include its high degree of flexibility making it
easily adjustable to meet many diverse conditions. Also the physical presence
53
of the enumerator as well as the opportunity to discuss participation in the
study with the respondent when there are objections, results quite often in a
high response rate. Furthermore, the interview schedule unlike the
questionnaire also provides the opportunity to record spontaneous responses
because the respondent in an interview does not have as much time available
to answer questions as when questionnaires are employed. This instrument
was employed more importantly because it does not require respondents to
have the ability to read or handle complex documents as in the case of
questionnaires.
Both face and content validity of the instrument was ensured. The
instrument’s face validity was checked by the researcher while the content
validity was done by the researcher’s supervisors in the Department of
Agricultural Economics and Extension, University of Cape Coast and
researchers at the Socio-economics division of Crops Research Institute of the
Council for Scientific and Industrial Research (CSIR-CRI). The structure of
the questions in the instrument was a combination of close-ended, open-ended
and partially close-ended questions.
The instrument consisted of five sections. In the first section, the
instrument included the background information of vegetable farmers. The
second section focused attention on factors of production and access to
information and it included land, planting materials/seeds, agro-chemicals,
water for irrigation, labour, funds, and extension information. Production,
marketing and income constituted the third section. The fourth section of the
research instrument also considered farmers’ perceived level of effect of urban
vegetable farming on their livelihoods. Vegetable production and marketing
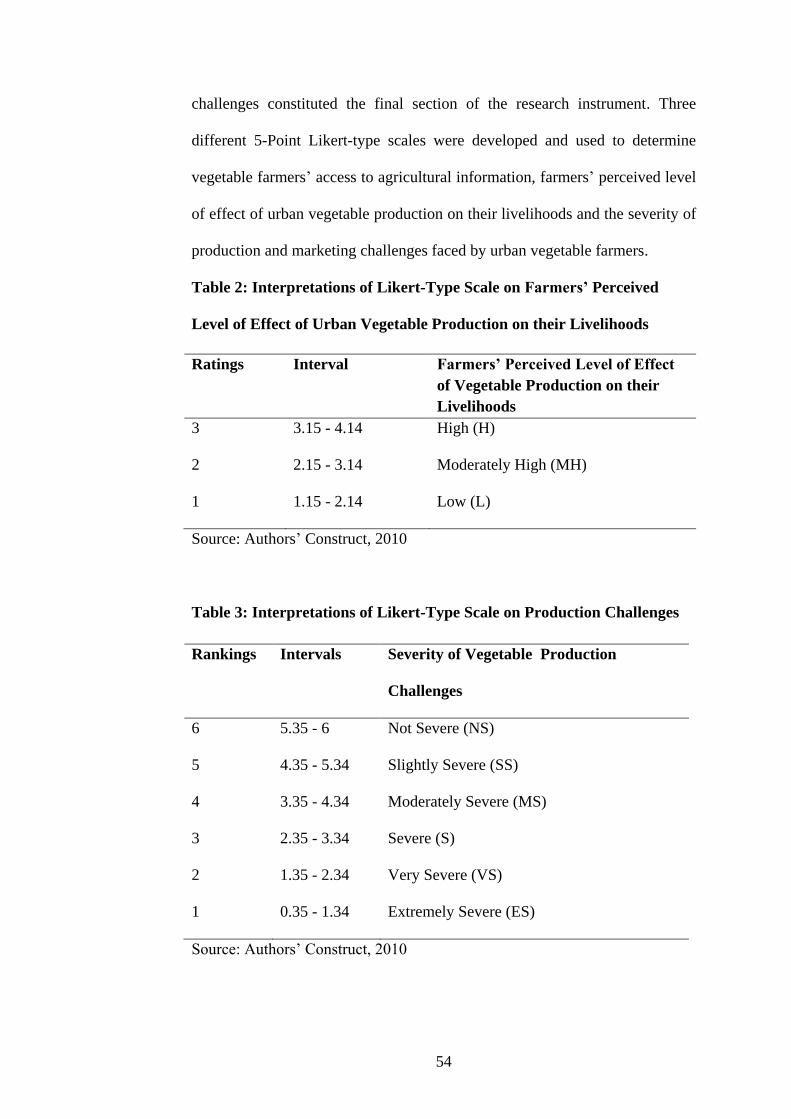
54
challenges constituted the final section of the research instrument. Three
different 5-Point Likert-type scales were developed and used to determine
vegetable farmers’ access to agricultural information, farmers’ perceived level
of effect of urban vegetable production on their livelihoods and the severity of
production and marketing challenges faced by urban vegetable farmers.
Table 2: Interpretations of Likert-Type Scale on Farmers’ Perceived
Level of Effect of Urban Vegetable Production on their Livelihoods
Source: Authors’ Construct, 2010
Table 3: Interpretations of Likert-Type Scale on Production Challenges
Source: Authors’ Construct, 2010
Ratings Interval Farmers’ Perceived Level of Effect
of Vegetable Production on their
Livelihoods
3 3.15 - 4.14 High (H)
2 2.15 - 3.14 Moderately High (MH)
1 1.15 - 2.14 Low (L)
Rankings Intervals Severity of Vegetable Production
Challenges
6
5
5.35 - 6
4.35 - 5.34
Not Severe (NS)
Slightly Severe (SS)
4 3.35 - 4.34 Moderately Severe (MS)
3 2.35 - 3.34 Severe (S)
2 1.35 - 2.34 Very Severe (VS)
1 0.35 - 1.34 Extremely Severe (ES)
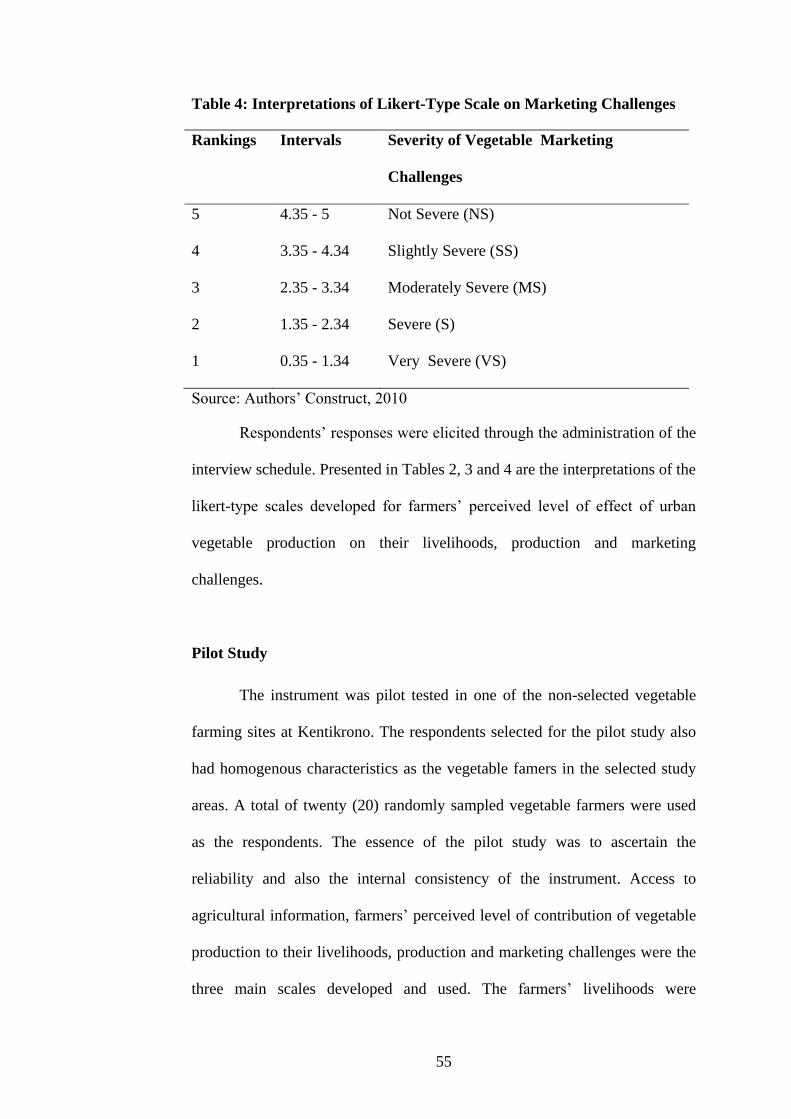
55
Table 4: Interpretations of Likert-Type Scale on Marketing Challenges
Source: Authors’ Construct, 2010
Respondents’ responses were elicited through the administration of the
interview schedule. Presented in Tables 2, 3 and 4 are the interpretations of the
likert-type scales developed for farmers’ perceived level of effect of urban
vegetable production on their livelihoods, production and marketing
challenges.
Pilot Study
The instrument was pilot tested in one of the non-selected vegetable
farming sites at Kentikrono. The respondents selected for the pilot study also
had homogenous characteristics as the vegetable famers in the selected study
areas. A total of twenty (20) randomly sampled vegetable farmers were used
as the respondents. The essence of the pilot study was to ascertain the
reliability and also the internal consistency of the instrument. Access to
agricultural information, farmers’ perceived level of contribution of vegetable
production to their livelihoods, production and marketing challenges were the
three main scales developed and used. The farmers’ livelihoods were
Rankings Intervals Severity of Vegetable Marketing
Challenges
5 4.35 - 5 Not Severe (NS)
4 3.35 - 4.34 Slightly Severe (SS)
3 2.35 - 3.34 Moderately Severe (MS)
2 1.35 - 2.34 Severe (S)
1 0.35 - 1.34 Very Severe (VS)
56
subscaled under natural, information, financial, human, social and physical
capitals. Statistical Package for Social Sciences (SPSS) version 15 was used to
determine the reliability of the scales used (Huerta & Lugo 1996; Colosi, n. d).
Cronbach’s alpha coefficient of the reliability values of the pilot study ranges
between 0.648 and 0.914 for the livelihood subscales. Financial capital
recorded the lowest value whiles the highest value went for natural capital.
Access to Agricultural Information, Production and Marketing challenges
scales recorded values above 0.800. This indicates the reliability and internal
consistency of the instrument (See Appendix 1 for the results of the reliability
test of the scales and subscales of the various items).
According to Pallant (2001), the Cronbach’s alpha coefficient value of
0.70 is considered reliable. Huerta and Lugo (1996) however, argue that the
reliability coefficient value of 0.50 to 0.60 is adequate for predictor tests in the
early stages of a research. Although, Huerta and Lugo and Pallant held
different views regarding the Cronbach’s alpha coefficient value that actually
determines instrument’s reliability, the Cronbach’s alpha coefficients in this
study using Huerta and Lugo’s (1996) standard and to a very large extent that
of Pallant’s (2001) makes the instrument reliable with respect to what it was
designed to measure. The pilot study was conducted in April 2010. The final
structured interview schedule was developed for administration and collection
of the main data.
Data Collection
Four (4) enumerators consisting of two (2) assistant research scientists
including the student researcher from Crops Research Institute (CSIR-CRI)
57
and two (2) students who were trained by the student researcher on the
research instrument administration. The training focused mainly on the
meaning and interpretation of individual items on the interview schedule. The
validated and pretested structured interview schedule was then translated into
the local dialect for easy understanding of the respondents and their responses
ticked or written on the schedule. The data was collected in Mid June to Mid
July, 2010. The entire 300 completed interview schedule were received from
enumerators by middle of July 2010 and the response rate was 100 percent.
Data Analysis
Statistical Package for Social Sciences (SPSS) version 15.0 was
employed for the analyses. Measures of central tendency, frequency and
percentage distributions, standard deviations, cross-tabulation, descriptive
statistics, multiple response, Kendall’s coefficient of concordance and
Analysis of variance were the statistical tools employed to analyse the data.
Each of the specific objectives was analysed using the analytical techniques as
follows:
Objectives One and Two - were to describe the demographic and farm
related characteristics of urban vegetable farmers in the Kumasi Metropolis
respectively. Frequencies, percentages, mean, mode, standard deviations,
cross-tabulations and multiple responses were computed from respondents’
responses to describe the demographic and farm related characteristics of the
respondents’ general profile. These statistical tools were used because
according to Poate and Daplyn (1993), they are the fundamental steps required
in an analysis to ascertain data for distribution of responses.
58
Objective Three – the statistical tool that was used to determine the
production and marketing challenges of urban vegetable production is
Kendall’s Coefficient of Concordance. This statistical tool was used because it
measures the agreement among raters considering the fact that each case is a
rater and each variable is an item to be rated.
Objective Four - descriptive statistics involving central tendencies and
standard deviation were computed for farmers’ perceived level of effect of
urban vegetable production on their livelihoods. This statistical tool was
employed because it displays summary statistics for several variables in a
single table and calculates standardised values. In addition, there is the
flexibility of ordering variables by the size of their means in ascending or
descending order, alphabetically, or by the order in which the variables are
selected.
Objective Five - this objective was to determine whether there are
significant differences in the farmers’ livelihood assets as a result of their
urban vegetable production. One-Way Analysis of Variance (ANOVA) was
the statistical tool used to analyse this objective. This statistical tool was used
because it produces a one-way analysis of variance for a quantitative
dependent variable by a single factor (independent) variable. Post-hoc multiple
comparisons analysis was done because Levene’s test of homogeneity of
variance showed statistically significant mean differences among farmers’
livelihood assets at 0.05 alpha level. Tamhane’s T2 was chosen as the
appropriate post-hoc multiple comparisons test for the mean differences. Eta
squared statistics was also calculated to determine the strength of association

59
between the mean livelihood assets and the result interpreted using Cohen
(1988) conversion guidelines.
60
CHAPTER FOUR
RESULTS AND DISCUSSION
This chapter focuses on the presentation of the results obtained from
the study and the discussion of the findings in relation to the specific
objectives set.
Demographic and Farm Related Characteristics of Respondents
Demographic and farm related characteristics of urban vegetable
farmers in the Kumasi Metropolis were investigated and the findings presented
below.
Sex Distribution of Respondents
Sex distribution of respondents was investigated and the results
showed that 282 of the respondents representing 94 percent were males. On
the contrary, only 18 of the respondents representing 6 percent were females.
The higher number of male respondents recorded in this study is in line with
the findings of Obuobie (2004) that men dominate most of the open-space
vegetable production in West African cities including Darkar, Lome, Cotonou,
Bamako and Ouagadougou. The argument by Drechsel, Blumenthal and
Keraita (2002) that though women and men play similar roles in crop
production, urban vegetable production is mostly practiced by men agrees
with this study result. The findings of Obosu-Mensah (1999); Gbireh, (1999);
61
Armar-Klemesu and Maxwell (1998) that only 10 percent of all urban open-
space farmers on the average are women further buttress this study result that
men dominate the industry. According to Flynn-Dapaah (2002); Obuobie,
Drechsel, Danso and Rachid-Sally (2004), women instead dominate urban
vegetable marketing sector. Generally, the higher number of male respondents
in the industry may be due to the difficult nature of the production processes
such as vegetable bed preparation, transplanting, weeding and watering as
reported by Cornish and Aidoo (2000); Drechsel, Danso & Raschid-Sally
(2004). Furthermore, farming is considered in most Ghanaian communities as
a preserve of men especially if it is market oriented. This might have also
contributed to the fewer number of females involved in the industry. The
assertion that Ghanaian women do not own land either in their marital or natal
ancestral home might have also accounted for the fewer number of female
respondents (Hosna, 1998).
According to Cornish, Aidoo and Ayamba (2001), urban vegetable
production also requires skills and knowledge especially for nursery practices.
Most of the women do not possess these qualities and might have created a
barrier for them to engage in the industry hence their fewer numbers. Most of
the urban vegetable farms are also located far away from residential areas and
men unlike their women counterpart have bicycles which they use to commute
between their farms and places residence (Zacharia, Lamptey & Maxwell,
1998). This might have also contributed to the high number of men engaged in
the industry since women do not have means of transport of their own hence
their fewer numbers in the sector. The findings by Cornish and Lawrence
(2001) and Jacobi, Amend and Kiango (2000) that women dominate urban
62
vegetable production sector in Eastern African cities like Nairobi and Dar es
Salaam is inconsistent with this study result.
Age Distribution of Respondents
The study result on age distribution (Table 5) of urban vegetable
farmers revealed that respondents between the ages of 15 - 63 years
constituted 97.4 percent of the labour force of the vegetable industry in the
study area. This observation is relevant because vegetable production is
described as tedious, capital and labour intensive. The youthful nature of the
age structure of the respondents suggests that they are energetic, physically
strong and would be quick to adopt and disseminate new technologies and
innovations than the ageing and the aged who constituted only 2.6 percent of
the respondents. The mean age of 37 years of the farmers further confirms the
age structure of the respondents. Their modal age was 30 and the standard
deviation value (1.14) shows considerable age variations among the
respondents.
The result of the study also revealed that the ages of the farmers range
from 18 - 80 years. The relevance of these observations is that with the
provision of the necessary inputs and efforts to address production and
marketing constraints, the industry could attract more youth to increase
vegetable production, improves food security and more importantly better the
livelihoods of the farmers. This is because the youth are more energetic than
the aged. Though, the studies of Ojo, Connaughton, Kintomo, Olajide-Taiwo
and Afolayan (2010) and Lewu and Assefa (2009) indicated varied age group
of vegetable farmers, nevertheless, the majority of them falls within the age
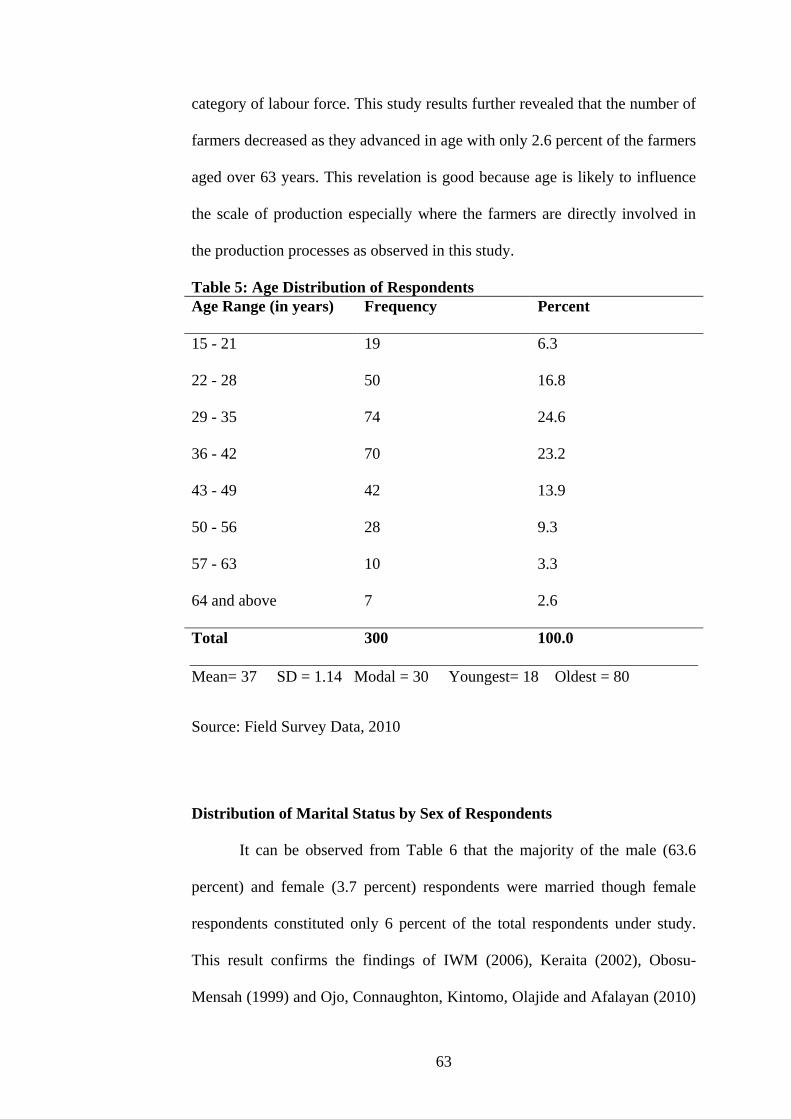
63
category of labour force. This study results further revealed that the number of
farmers decreased as they advanced in age with only 2.6 percent of the farmers
aged over 63 years. This revelation is good because age is likely to influence
the scale of production especially where the farmers are directly involved in
the production processes as observed in this study.
Table 5: Age Distribution of Respondents
Age Range (in years) Frequency Percent
15 - 21 19 6.3
22 - 28 50 16.8
29 - 35 74 24.6
36 - 42 70 23.2
43 - 49 42 13.9
50 - 56 28 9.3
57 - 63 10 3.3
64 and above 7 2.6
Total 300 100.0
Mean= 37 SD = 1.14 Modal = 30 Youngest= 18 Oldest = 80
Source: Field Survey Data, 2010
Distribution of Marital Status by Sex of Respondents
It can be observed from Table 6 that the majority of the male (63.6
percent) and female (3.7 percent) respondents were married though female
respondents constituted only 6 percent of the total respondents under study.
This result confirms the findings of IWM (2006), Keraita (2002), Obosu-
Mensah (1999) and Ojo, Connaughton, Kintomo, Olajide and Afalayan (2010)
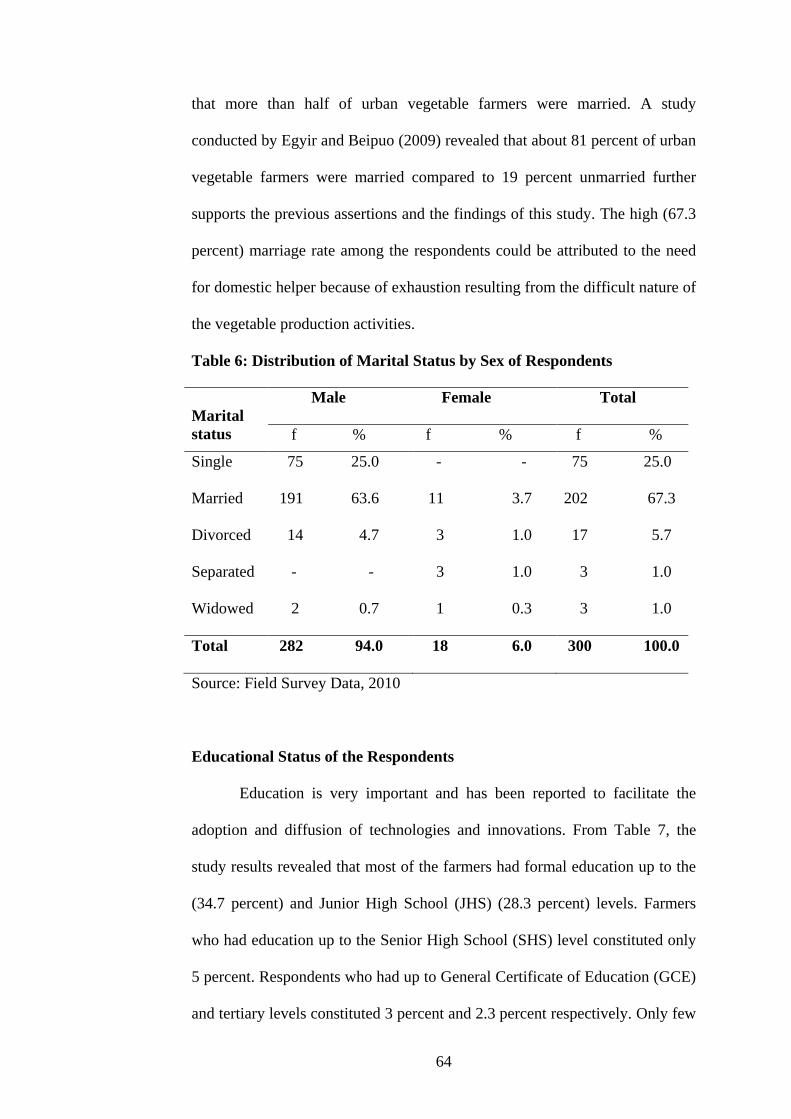
64
that more than half of urban vegetable farmers were married. A study
conducted by Egyir and Beipuo (2009) revealed that about 81 percent of urban
vegetable farmers were married compared to 19 percent unmarried further
supports the previous assertions and the findings of this study. The high (67.3
percent) marriage rate among the respondents could be attributed to the need
for domestic helper because of exhaustion resulting from the difficult nature of
the vegetable production activities.
Table 6: Distribution of Marital Status by Sex of Respondents
Source: Field Survey Data, 2010
Educational Status of the Respondents
Education is very important and has been reported to facilitate the
adoption and diffusion of technologies and innovations. From Table 7, the
study results revealed that most of the farmers had formal education up to the
(34.7 percent) and Junior High School (JHS) (28.3 percent) levels. Farmers
who had education up to the Senior High School (SHS) level constituted only
5 percent. Respondents who had up to General Certificate of Education (GCE)
and tertiary levels constituted 3 percent and 2.3 percent respectively. Only few
Marital
status
Male Female Total
f % f % f %
Single 75 25.0 - - 75 25.0
Married 191 63.6 11 3.7
202 67.3
Divorced 14 4.7 3 1.0 17 5.7
Separated - - 3 1.0 3 1.0
Widowed 2 0.7 1 0.3 3 1.0
Total 282 94.0 18 6.0 300 100.0
65
(1.7 percent) of the respondents had Middle School Living Certificate (MSLC)
education. The number of respondents who had MSLC and JHS qualifications
(30 percent) was far lower than the fifth round report of the Ghana Living
Standards Survey (GLSS-5) figure (39 percent) (Ghana Statistical Service,
2008). Similarly, the proportion of the respondents that possessed SHS or
higher qualification (7.3 percent) was lower than 13.6 percent figure reported
by GLSS-5 figure (Ghana Statistical Service, 2008). This implies that the
number of pupils who are unable to further their education after the JHS level
is declining at an alarming rate. Respondents with no formal education also
formed 25 percent of the farmers. Generally, the literacy level of the
respondents implies that if any technologies or innovations on vegetable
production are introduced, the probability for their adoption and diffusion
among the farmers would be high. This is because educated farmers are
expected to be more receptive to improve farming techniques and practices
and therefore has higher level of efficiency than the less educated or
uneducated (Obwona, 2000). This result is supported by IWMI (2006) that,
though there are wide variations in the literacy level among farmers many of
them are still illiterate.
The low number (2.3 percent) of farmers in the tertiary level might be
due to the fact that individuals of higher academic qualifications perceived
farming as occupation for the less privileged in society. The studies conducted
in Abeokuta, Abanla and Akufo by Ojo, Connaughton, Kintomo, Olajide-
Taiwo and Afolayan (2010) that the majority (73.3 percent) of the farmers are
not educated beyond primary school level is consistent with the outcome of
this study as well as that of IWMI (2006). Similar studies conducted by Ojo et
66
al. (2010) indicated that the majority of the respondents on the contrary, had
secondary school education in Lagos (50 percent) and Bode (74.1 percent).
This suggests that educational status of urban vegetable farmers may vary
within countries and between countries. Generally, most of the farmers (34.7
percent and 28.3 percent) have at least acquired Primary and JHS education as
shown in Table 7.
Table 7: Educational Status of Respondents
Educational level Frequency Percent
Primary education 104 34.7
Junior High School (JHS) 85 28.3
No formal education 75 25.0
Senior High School (SHS) 15 5.0
General Cert. of Education (GCE) 9 3.0
Tertiary 7 2.3
Middle School Living Cert.(MSLC) 5 1.7
Total 300 100.0
Source: Field Survey Data, 2010
Household Composition of Respondents
The size and household composition of the respondents were also
investigated. The size and composition of the household influences the amount
of food consumed in the household daily. Out of the 300 farmers interviewed
the majority (83.7 percent) had household size ranging from 1- 6 members.
The household size of the respondents’ ranges from a minimum of 1 to a
maximum of 15 members with a mean value of 2.2 which is similar to the
67
mean household size reported on by IWMI (2006) in Kumasi. Contrary, the
mean household size figure is lower than the 2000 population and housing
census figure of 5.1. The implication is that household welfare might improve
with decreasing household size. The standard deviation figure of 1.1 also
suggests that household size varies among the respondents. The findings by
Egziabher, Lee-Smith, Maxwell, Memon, Mougeot and Sewio (1994) that a
household size ranged from one person to over 10 is at variance with this
study results. This suggests that household size does not only differ among
countries but within country as well.
Land Acquisition for Vegetable Production by Respondents
Table 8 shows the various methods that urban vegetable farmers
acquire land for production. It is evidenced that most of the lands put to
vegetable production were either for the state (44 percent) or private
individuals (36 percent). Whilst a few (9.7 percent) number of the farmers
acquired stool land for production, very few of them (about 1.7 percent) each
relied on their own land and family land respectively for production. The
implication is that investment and productivity are likely to be affected due to
low security of tenure. This is because the farmers do not have control over
greater proportion of the cultivated land and are therefore uncertain about the
faith of any investment such as sinking of permanent wells and mounting of
treadle pumps on the land. The farmers also indicated that there was virtually
and absolutely no tenancy agreement (rental payment, abunu and abusa) for all
the adopted land tenure. These findings agree with that of Cornish and
Lawrence (2001), Flynn-Dapaah (2002) and Obosu-Mensah (1999) that most
68
urban vegetable production sites belong to institutions of government and
private developers who have no immediate use of such lands. The type of land
tenure system employed by the respondents also agree with Van den Berg’s
(2002) assertion that low security of tenure renders farmers insecure due to
uncertainty of land use. The findings of Ojo, Connaughton, Kintomo, Olajide-
Taiwo and Afolayan (2010) that the majority (50 percent) of the vegetable
farmers each leased and rented land in Lagos whilst 93 percent also leased
land for similar intent in Abeokuta are at variance with this research findings.
Table 8: Land Acquisition for Vegetable Production by Respondents
Source: Field Survey Data, 2010
Total Land Available and Used for Vegetable Production by Respondents
The study results showed that more than half (51.7 percent) of the
respondents though, did not own the land they cultivate, land acquisition for
vegetable production was ‘easy’. This revelation is consistent with the report
by Cornish and Lawrence (2001) and Flynn-Dapaah (2002) that farmers do
not own the land they cultivate. It was also observed that the total land
Type of tenure Frequency Percent
Government land 132 44.0
Private land 108 36.0
Stool land 29 9.7
Lease land 21 7.0
Family land 5 1.7
Own land 5 1.7
Total 300 100.0
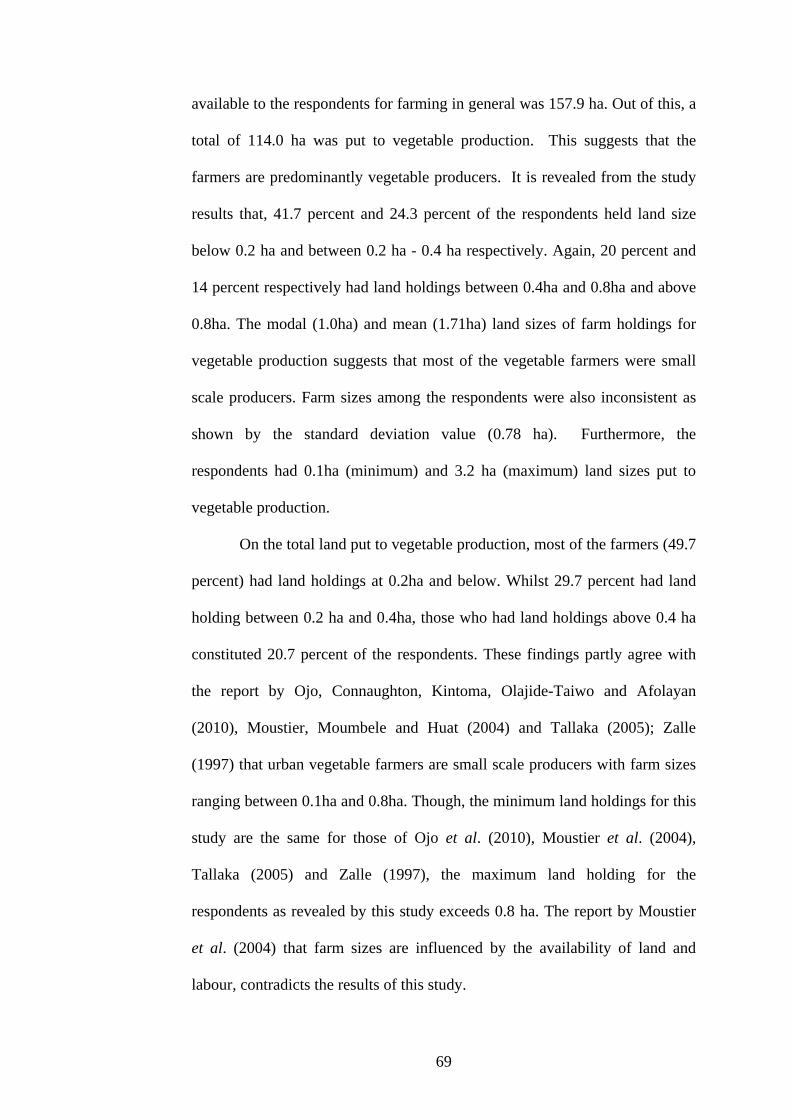
69
available to the respondents for farming in general was 157.9 ha. Out of this, a
total of 114.0 ha was put to vegetable production. This suggests that the
farmers are predominantly vegetable producers. It is revealed from the study
results that, 41.7 percent and 24.3 percent of the respondents held land size
below 0.2 ha and between 0.2 ha - 0.4 ha respectively. Again, 20 percent and
14 percent respectively had land holdings between 0.4ha and 0.8ha and above
0.8ha. The modal (1.0ha) and mean (1.71ha) land sizes of farm holdings for
vegetable production suggests that most of the vegetable farmers were small
scale producers. Farm sizes among the respondents were also inconsistent as
shown by the standard deviation value (0.78 ha). Furthermore, the
respondents had 0.1ha (minimum) and 3.2 ha (maximum) land sizes put to
vegetable production.
On the total land put to vegetable production, most of the farmers (49.7
percent) had land holdings at 0.2ha and below. Whilst 29.7 percent had land
holding between 0.2 ha and 0.4ha, those who had land holdings above 0.4 ha
constituted 20.7 percent of the respondents. These findings partly agree with
the report by Ojo, Connaughton, Kintoma, Olajide-Taiwo and Afolayan
(2010), Moustier, Moumbele and Huat (2004) and Tallaka (2005); Zalle
(1997) that urban vegetable farmers are small scale producers with farm sizes
ranging between 0.1ha and 0.8ha. Though, the minimum land holdings for this
study are the same for those of Ojo et al. (2010), Moustier et al. (2004),
Tallaka (2005) and Zalle (1997), the maximum land holding for the
respondents as revealed by this study exceeds 0.8 ha. The report by Moustier
et al. (2004) that farm sizes are influenced by the availability of land and
labour, contradicts the results of this study.
70
Sources of Irrigation Water and Technologies Used by Respondents
Table 9 shows sources of water for irrigation and irrigation
technologies employed by respondents. Irrigation facilitates all-year-round
vegetable production. Farmers relied on various sources of water for irrigation.
On the sources of irrigation water, the study results showed that 47.7 percent
sourced their irrigation water from dug-out-wells. Also, 39.3 percent and 8.7
percent of the total farmers used stream and both stream and dug-out-wells
respectively as their sources of water for irrigation. Only few (2.3 percent, 1.7
percent, and 0.3 percent) of the respondents claimed they used tap water,
rainfall and water from the drains respectively. This suggests that most of the
vegetables produced in the metropolis might be free from pathogens resulting
from the use of contaminated drains water.
In addition, the farmers could engage in all-year-round vegetable
production as they are not likely to experience any serious water shortage
during the dry spell. These findings are consistent with the earlier report by
Keraita, Danso and Drechsel (2003) that rivers and streams were the main
sources of water for the majority of farmers in the metropolis for irrigation
even though there was extensive use of dug-out-wells as well. The results
further showed that the irrigation technology adopted by 78.3 percent of the
farmers was the use of watering cans. This is in line with the report made by
Keraita, Drechsel, Huibers and Raschid-Sally (2002) that watering can was the
most common means of irrigation used in all farming areas. This implies that
if urban vegetable farmers want to graduate from their prevailing small-scale
farming to large scale production then, there is the need to modify the current
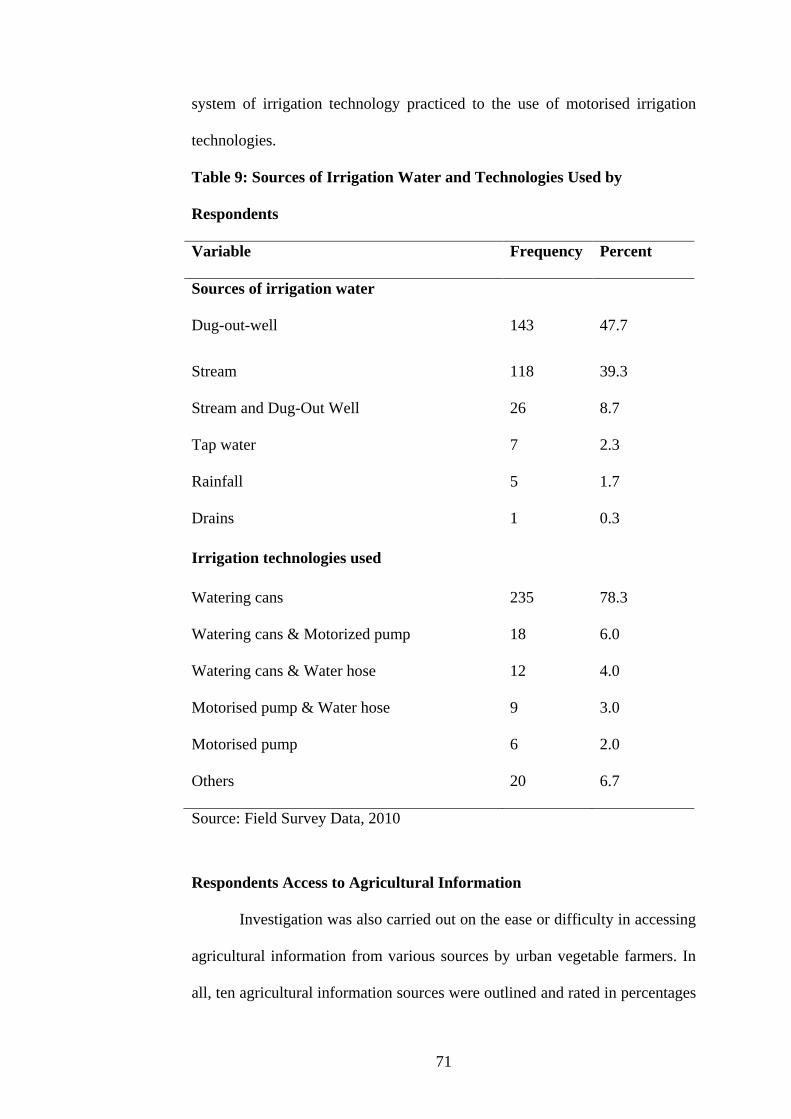
71
system of irrigation technology practiced to the use of motorised irrigation
technologies.
Table 9: Sources of Irrigation Water and Technologies Used by
Respondents
Variable Frequency Percent
Sources of irrigation water
Dug-out-well 143 47.7
Stream 118 39.3
Stream and Dug-Out Well 26 8.7
Tap water 7 2.3
Rainfall 5 1.7
Drains 1 0.3
Irrigation technologies used
Watering cans 235 78.3
Watering cans & Motorized pump 18 6.0
Watering cans & Water hose 12 4.0
Motorised pump & Water hose 9 3.0
Motorised pump 6 2.0
Others 20 6.7
Source: Field Survey Data, 2010
Respondents Access to Agricultural Information
Investigation was also carried out on the ease or difficulty in accessing
agricultural information from various sources by urban vegetable farmers. In
all, ten agricultural information sources were outlined and rated in percentages
72
using the scale: 1 = very difficult, 2 = difficult, 3 = moderately difficult, 4 =
easy and 5 = very easy as shown in Table 10. Out of these sources, the
majority of the respondents claimed it was ‘very difficult’ obtaining
agricultural information from private extension services (83.3 percent),
research institutes (85 percent), market providers (83.3 percent), the print
media (94 percent), television (92 percent) and internet sources (95.7 percent).
The mean ranges from 0 to 2.9 for internet sources and fellow farmers
respectively. The respondents also claimed it was ‘difficult’ for them to access
agricultural information from agricultural extension agents (58.7 percent) and
from radio sources (67.3 percent). As a result, the respondents depended on
colleague farmers (68.3 percent) and input dealers (75.7 percent) since these
were the ‘easiest’ sources of agricultural extension information. The standard
deviation values for these sources 0.85 and 0.82 respectively imply that the
farmers were inconsistent in their choices for sources of agricultural extension
information. Source of agricultural information such as private extension
services (0.39), television (0.39) and internet sources (0.48) showed some
level of consistency. The findings therefore suggest that services from
agricultural extension agents were unavailable compelling the farmers to
depend on other colleague farmers and input dealers for information support.
Urban vegetable farmers have not been receiving agricultural extension
services perhaps because the practice is seen as unsafe and informal. This
might have affected their productivity levels because the credibility of the
information they receive from sources other than agricultural extension agents
might be unscientific and or obsolete. This study results however depart from
the findings by Danso, Fialor and Drechsel (2002) that the majority of the
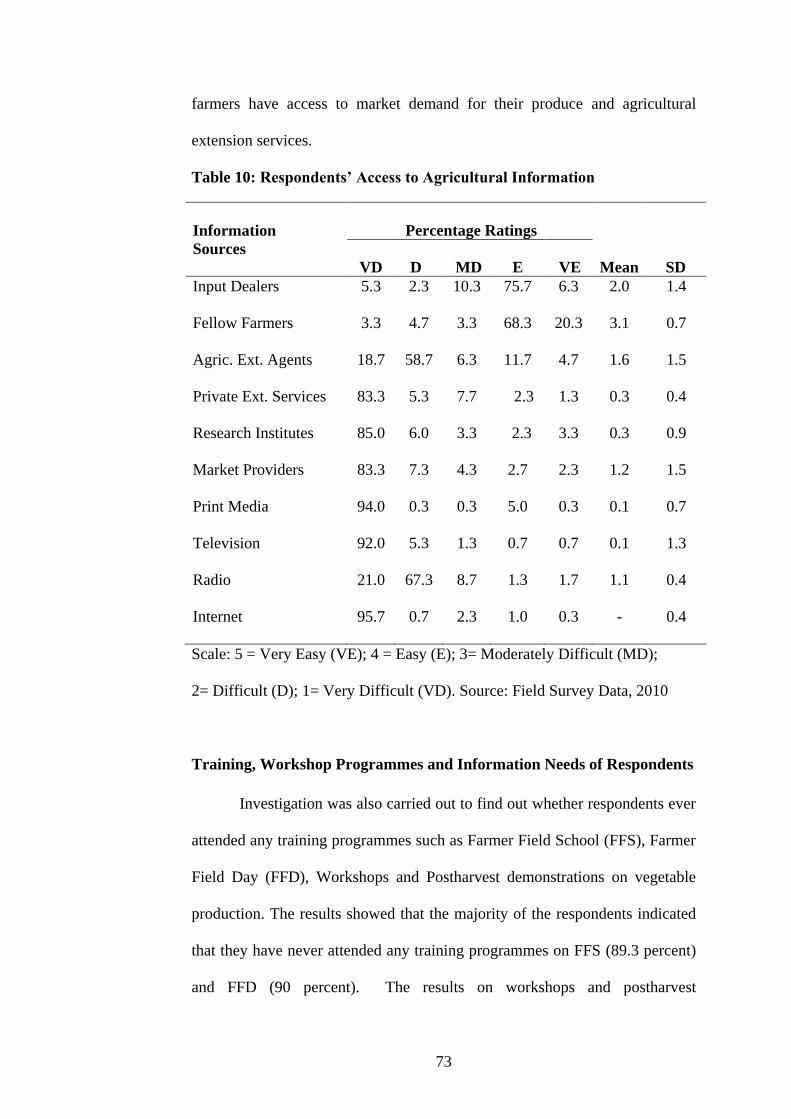
73
farmers have access to market demand for their produce and agricultural
extension services.
Table 10: Respondents’ Access to Agricultural Information
Information
Sources
Percentage Ratings
Mean
SD VD D MD E VE
Input Dealers 5.3 2.3 10.3 75.7 6.3 2.0 1.4
Fellow Farmers 3.3 4.7 3.3 68.3 20.3 3.1 0.7
Agric. Ext. Agents 18.7 58.7 6.3 11.7 4.7 1.6 1.5
Private Ext. Services 83.3 5.3 7.7 2.3 1.3 0.3 0.4
Research Institutes 85.0 6.0 3.3 2.3 3.3 0.3 0.9
Market Providers 83.3 7.3 4.3 2.7 2.3 1.2 1.5
Print Media 94.0 0.3 0.3 5.0 0.3 0.1 0.7
Television 92.0 5.3 1.3 0.7 0.7 0.1 1.3
Radio 21.0 67.3 8.7 1.3 1.7 1.1 0.4
Internet 95.7 0.7 2.3 1.0 0.3 - 0.4
Scale: 5 = Very Easy (VE); 4 = Easy (E); 3= Moderately Difficult (MD);
2= Difficult (D); 1= Very Difficult (VD). Source: Field Survey Data, 2010
Training, Workshop Programmes and Information Needs of Respondents
Investigation was also carried out to find out whether respondents ever
attended any training programmes such as Farmer Field School (FFS), Farmer
Field Day (FFD), Workshops and Postharvest demonstrations on vegetable
production. The results showed that the majority of the respondents indicated
that they have never attended any training programmes on FFS (89.3 percent)
and FFD (90 percent). The results on workshops and postharvest
74
demonstrations were not different. Again, 83.7 percent of the respondents
mentioned that they had never attended any workshop programmes and
postharvest demonstrations (96.3 percent). More than half (53.3 percent) of
the respondents mentioned market opportunities or ready market as their most
important information needs. The implication is that the productivity of these
farmers might be considerably low perhaps due to their unawareness of new
innovations and agronomic practices on vegetable production and marketing
avenues thereby affecting their livelihoods.
Sources of Financial Capital for Respondents
Finance is very important since it allows farmers to achieve their
livelihood objectives. Its availability however, reduces the farmers’
vulnerability to food security by allowing them to adopt different livelihood
strategies. From the findings of the study, it came to light that 86.7 percent of
the farmers self-finance their farming operations. This study results is in line
with the findings made by Danso and Drechsel (2003) that urban farmers in
general do not have access to formal credit scheme in Ghana due to their
inability to provide collateral securities demanded by financial institutions.
This is probably because the majority of the farmers do not own the land on
which they farm. This situation might have affected the scale of production
hence the farmers’ livelihoods. This is because the farmers would have to
depend on their meagre financial resources for vegetable production. The
implication is that even if the market was very attractive, vegetable farmers
could not have ceased the opportunity due to their financial restrictions.
75
Access to Loan by Respondents for Vegetable Production
Out of the 300 respondents, 40 of them representing 13.3 percent
claimed to have access to loan from various sources for their farm operations.
The minority (13.3 percent) of the respondents who had access to credit
facilities claimed they always pay back the credit on schedule through
proceeds from the vegetable sales. The respondents (86.7 percent) who were
unable to access loan facilities for their farm operations sited lack of collateral
as the principal factor (E. Aferi personal communication, July 5, 2010). In
addition, most of the urban farmers have limited space for cultivation and do
not own land as reported by Obosu-Mensah (1999), Cornish and Lawrence
(2001) and Flynn-Dapaah (2002). This makes collateralisation very difficult.
Van den Berg (2002) further buttressed the earlier assertions when he
indicated that lack of ownership of land for farming leads to unsustainable
production as a result of low tenure of security. He went on to say that this
subsequently affects prospective investment in the form of erection of farm
structures and provision of treadle pumps for irrigation to increase vegetable
production, improves farmers’ livelihoods and enhanced food security.
Months Respondents Experienced Critical Fund Shortage
The findings from the study revealed that 93.6 percent of the
respondents admitted having experienced severe fund shortage once upon a
time in their production processes. The study results revealed that the farmers
experienced severe fund shortage from the month of April to September.
Whilst some of the farmers (43.3 percent) experienced fund shortage from
April to June, about 36.3 percent indicated that it was between July and
76
September. However, few respondents (9.3 percent and 4.7 percent) indicated
that they experienced critical fund shortage between January and March and
October to December respectively. Few (6.4 percent) of the respondents
however, indicated that they had never witnessed funds shortage since they
entered the industry. In addition, 93.6 percent of the respondents who
experienced critical fund shortage assigned various reasons for this condition.
These reasons range from price fluctuation, excessive rainfall, high disease
incidence, low market demand and glut on the market to high input cost,
scarce resources and poor planning. The implication is that should any
financial institutions and or cooperate organisations want to advance credit to
these farmers, timing should be considered critical especially from the month
of April to September.
Distribution of Major Sources of Labour by Sex of Respondents
Table 11 shows cross-tabulation between major sources of labour and
sex of respondents. Labour which constitutes human capital represents the
skills, knowledge and good health that enable people to pursue different
livelihood strategies and achieve their livelihood objectives. Despite the small
proportion of female (6 percent) in this study, the majority (5 percent) of them
and male respondents (75.3 percent) depended on personal labour for their
farm operations. The reliance on personal labour could be attributed to the
scarcity and or high labour cost. The small farm sizes of respondents might
also be a contributive factor for the use of personal labour. It can be observed
from the results also that the choice and use of personal labour was not
confined to one particular sex. This suggests that despite the difficult nature of
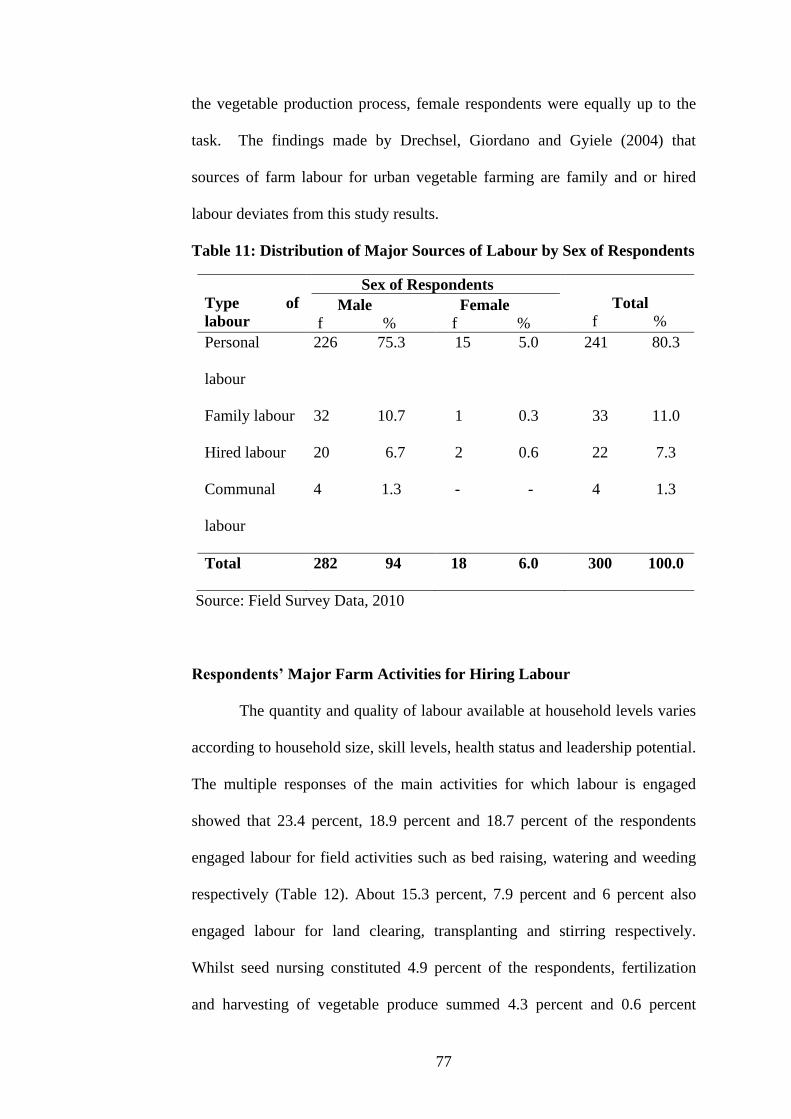
77
the vegetable production process, female respondents were equally up to the
task. The findings made by Drechsel, Giordano and Gyiele (2004) that
sources of farm labour for urban vegetable farming are family and or hired
labour deviates from this study results.
Table 11: Distribution of Major Sources of Labour by Sex of Respondents
Source: Field Survey Data, 2010
Respondents’ Major Farm Activities for Hiring Labour
The quantity and quality of labour available at household levels varies
according to household size, skill levels, health status and leadership potential.
The multiple responses of the main activities for which labour is engaged
showed that 23.4 percent, 18.9 percent and 18.7 percent of the respondents
engaged labour for field activities such as bed raising, watering and weeding
respectively (Table 12). About 15.3 percent, 7.9 percent and 6 percent also
engaged labour for land clearing, transplanting and stirring respectively.
Whilst seed nursing constituted 4.9 percent of the respondents, fertilization
and harvesting of vegetable produce summed 4.3 percent and 0.6 percent
Type of
labour
Sex of Respondents
Male Female
f % f %
Total
f %
Personal
labour
226 75.3 15 5.0 241 80.3
Family labour 32 10.7 1 0.3 33 11.0
Hired labour 20 6.7 2 0.6 22 7.3
Communal
labour
4 1.3 - - 4 1.3
Total 282 94 18 6.0 300 100.0
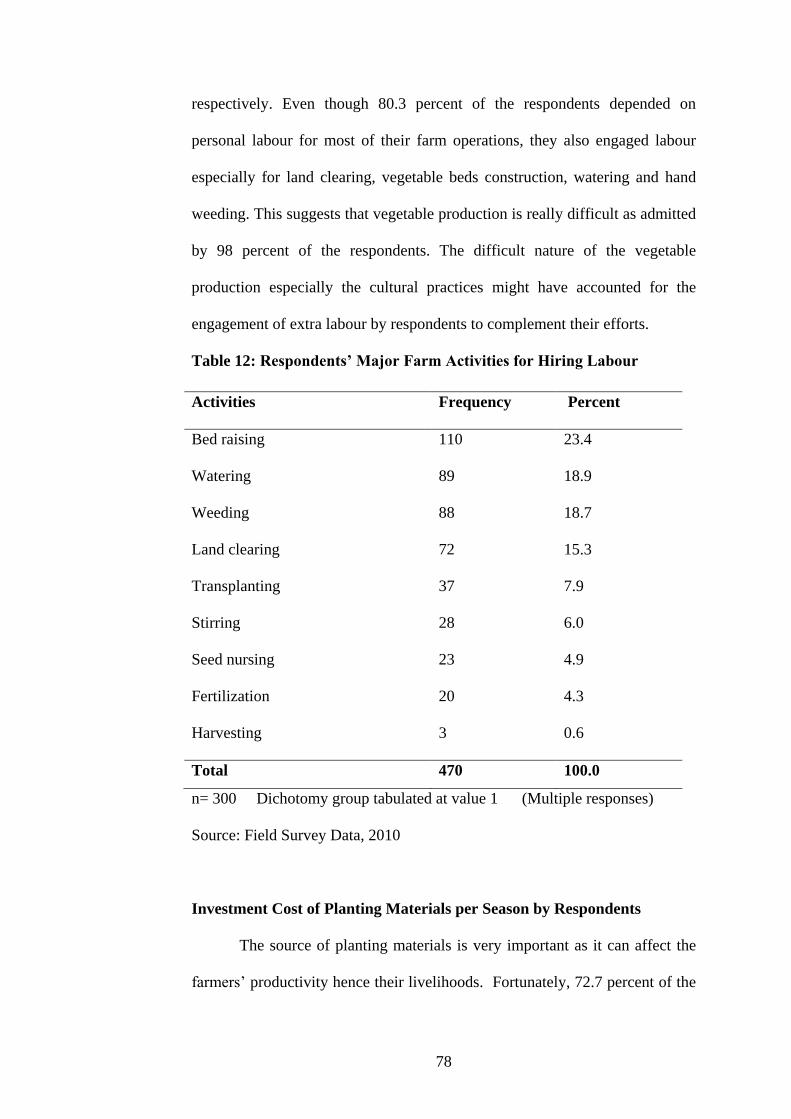
78
respectively. Even though 80.3 percent of the respondents depended on
personal labour for most of their farm operations, they also engaged labour
especially for land clearing, vegetable beds construction, watering and hand
weeding. This suggests that vegetable production is really difficult as admitted
by 98 percent of the respondents. The difficult nature of the vegetable
production especially the cultural practices might have accounted for the
engagement of extra labour by respondents to complement their efforts.
Table 12: Respondents’ Major Farm Activities for Hiring Labour
n= 300 Dichotomy group tabulated at value 1 (Multiple responses)
Source: Field Survey Data, 2010
Investment Cost of Planting Materials per Season by Respondents
The source of planting materials is very important as it can affect the
farmers’ productivity hence their livelihoods. Fortunately, 72.7 percent of the
Activities Frequency Percent
Bed raising 110 23.4
Watering 89 18.9
Weeding 88 18.7
Land clearing 72 15.3
Transplanting 37 7.9
Stirring 28 6.0
Seed nursing 23 4.9
Fertilization 20 4.3
Harvesting 3 0.6
Total 470 100.0
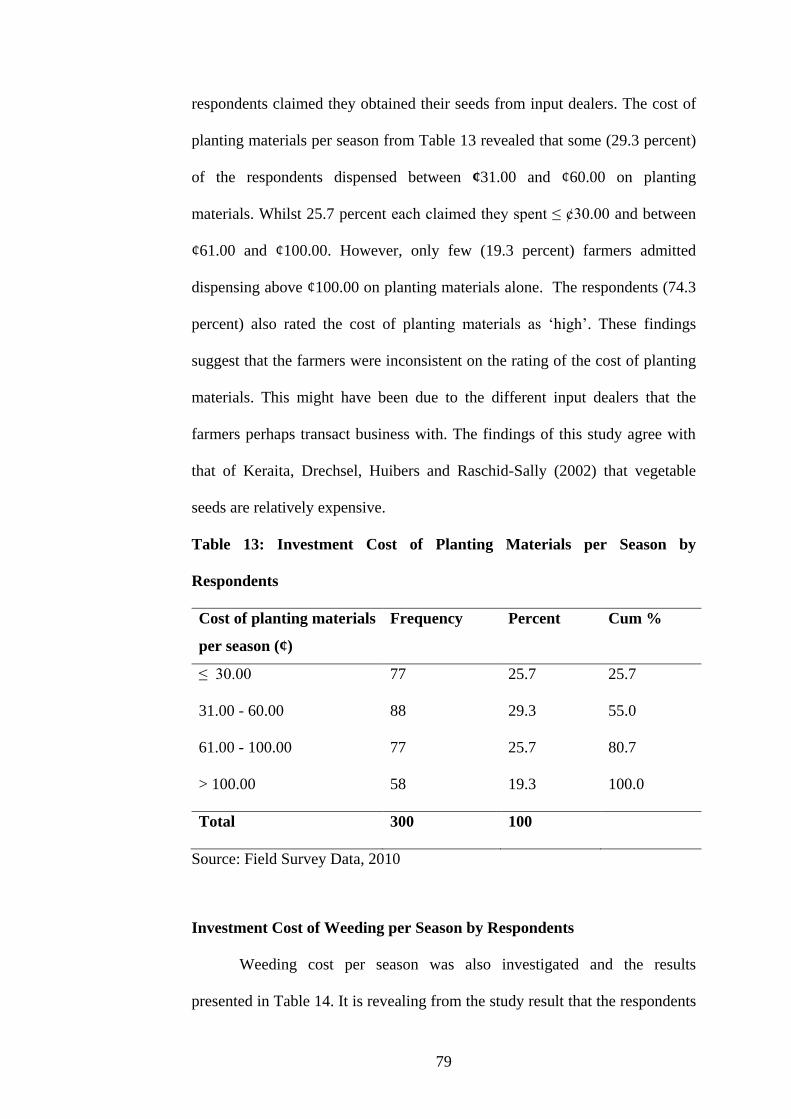
79
respondents claimed they obtained their seeds from input dealers. The cost of
planting materials per season from Table 13 revealed that some (29.3 percent)
of the respondents dispensed between ¢31.00 and ¢60.00 on planting
materials. Whilst 25.7 percent each claimed they spent ≤ ¢30.00 and between
¢61.00 and ¢100.00. However, only few (19.3 percent) farmers admitted
dispensing above ¢100.00 on planting materials alone. The respondents (74.3
percent) also rated the cost of planting materials as ‘high’. These findings
suggest that the farmers were inconsistent on the rating of the cost of planting
materials. This might have been due to the different input dealers that the
farmers perhaps transact business with. The findings of this study agree with
that of Keraita, Drechsel, Huibers and Raschid-Sally (2002) that vegetable
seeds are relatively expensive.
Table 13: Investment Cost of Planting Materials per Season by
Respondents
Cost of planting materials
per season (¢)
Frequency Percent Cum %
≤ 30.00 77 25.7 25.7
31.00 - 60.00 88 29.3 55.0
61.00 - 100.00 77 25.7 80.7
> 100.00 58 19.3 100.0
Total 300 100
Source: Field Survey Data, 2010
Investment Cost of Weeding per Season by Respondents
Weeding cost per season was also investigated and the results
presented in Table 14. It is revealing from the study result that the respondents
80
(34.4 percent) did not engage the services of labour for manual weeding
probably either because labour was not readily available or perhaps they
wanted to cut down on production cost due to high labour cost. The small farm
sizes of the famers might have also prompted this development. This is
because it would be economically unwise to engage labour on very small plot
of land unless under very critical situations and or conditions of the farmer
such as ill-health. Whilst 26 percent incurred weeding cost between ¢21.00
and ¢60.00 per season, 23.3 percent pegged the cost above ¢60.00. Farmers
who incurred cost between ¢1.00 and ¢20.00 were about 16.3 percent. The
majority (77.7 percent) of the respondents also indicated that they hand
weeded their farms more than 5 times per season. This suggests that the more
frequent weeding is done, the higher the production cost especially as the cost
of weeding was perceived to be high.
On the rating of the cost of weeding, 36.3 percent of the respondents
rated it as ‘high’. Whilst 15.7 percent mentioned the weeding cost as ‘very
high’, 13.3 percent and 0.3 percent also rated it as ‘low’ and ‘very low’
respectively. The results revealed that the farmers were different in the
investment cost of weeding. The high labour cost of weeding might have
informed some of the respondents (34.4 percent) to resolve to personal or own
labour for some of the cultural practices. The finding of Drechsel, Giordano
and Gyiele (2004) that weeding was the most expensive among the cultural
practices by vegetable farmers is consistent with the results of this study.
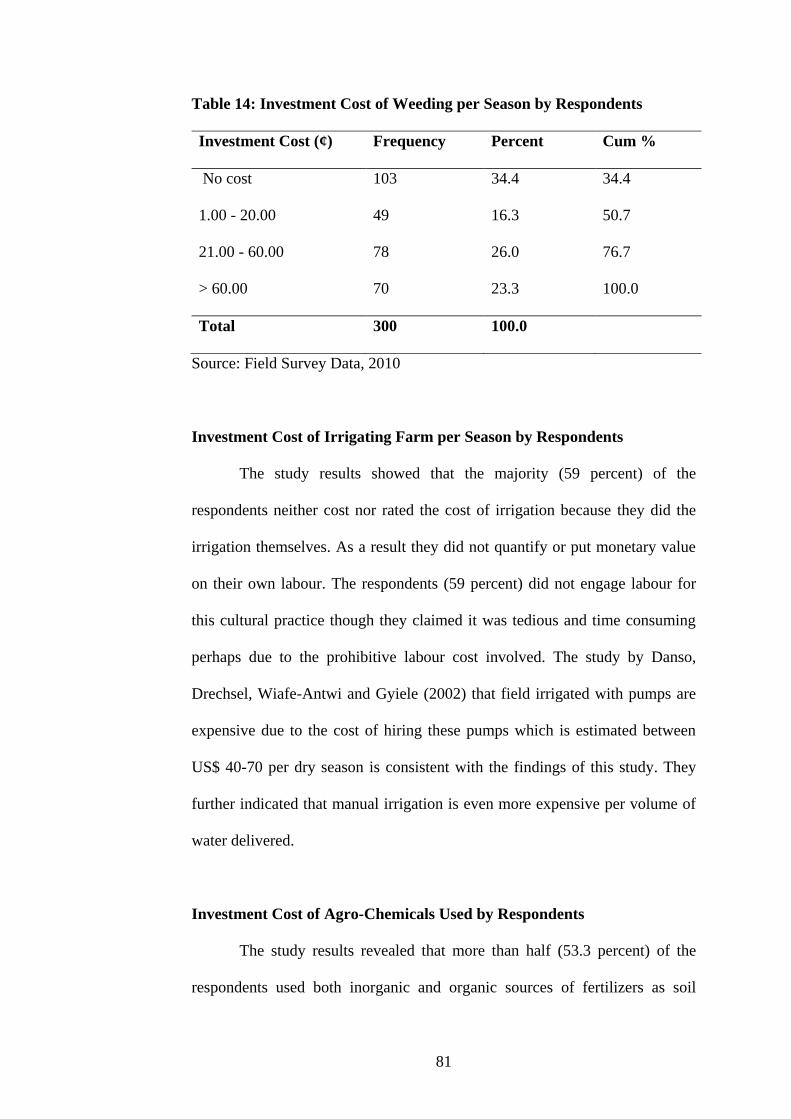
81
Table 14: Investment Cost of Weeding per Season by Respondents
Investment Cost (¢) Frequency Percent Cum %
No cost 103 34.4 34.4
1.00 - 20.00 49 16.3 50.7
21.00 - 60.00 78 26.0 76.7
> 60.00 70 23.3 100.0
Total 300 100.0
Source: Field Survey Data, 2010
Investment Cost of Irrigating Farm per Season by Respondents
The study results showed that the majority (59 percent) of the
respondents neither cost nor rated the cost of irrigation because they did the
irrigation themselves. As a result they did not quantify or put monetary value
on their own labour. The respondents (59 percent) did not engage labour for
this cultural practice though they claimed it was tedious and time consuming
perhaps due to the prohibitive labour cost involved. The study by Danso,
Drechsel, Wiafe-Antwi and Gyiele (2002) that field irrigated with pumps are
expensive due to the cost of hiring these pumps which is estimated between
US$ 40-70 per dry season is consistent with the findings of this study. They
further indicated that manual irrigation is even more expensive per volume of
water delivered.
Investment Cost of Agro-Chemicals Used by Respondents
The study results revealed that more than half (53.3 percent) of the
respondents used both inorganic and organic sources of fertilizers as soil
82
fertility amendments in their production. The respondents (75 percent and 25
percent) claimed they sourced these fertilizers from various poultry farms and
input dealers respectively in the metropolis. The majority (98.7 percent) of the
respondents also admitted sourcing other agro-chemicals (pesticides,
fungicides, nematicide and herbicides) from input dealers for use on their
vegetable farms. Presented in Table 15 is the total cost of agro-chemicals used
by the respondents per season on their farms. The results revealed that
between ¢51.00 and ¢100.00 was dispensed on agro-chemicals per season by
31 percent of the farmers on their farms. The results again showed that 26.7
percent spent an amount of ¢50.00 or less on agro-chemical per season.
Twenty-four percent and 18.3 percent claimed they spent over ¢150.00 and
between ¢101.00 and ¢150.00 respectively on agro-chemicals per season on
their production.
The farmers (83 percent) also rated the cost of agro-chemicals used per
season on their farms as ‘high’. The high cost of agro-chemicals reported by
the respondents suggests that the farmers purchased them in bits thereby
attracting no discount from these input dealers. The amount of money
dispensed on agro-chemicals was inconsistent among the farmers perhaps
because of varied farm sizes coupled with the different vegetable crops
cultivated. This is because some of the vegetable crops cultivated especially
the leafy ones are more susceptible to insect-pests attack and therefore require
frequent application of pesticides. This findings fall in line with the report of
Drechsel, Giordano and Gyiele (2004) that significant number of vegetable
growers use soil fertility amendments and pesticides. Obuobie et al. (2006)
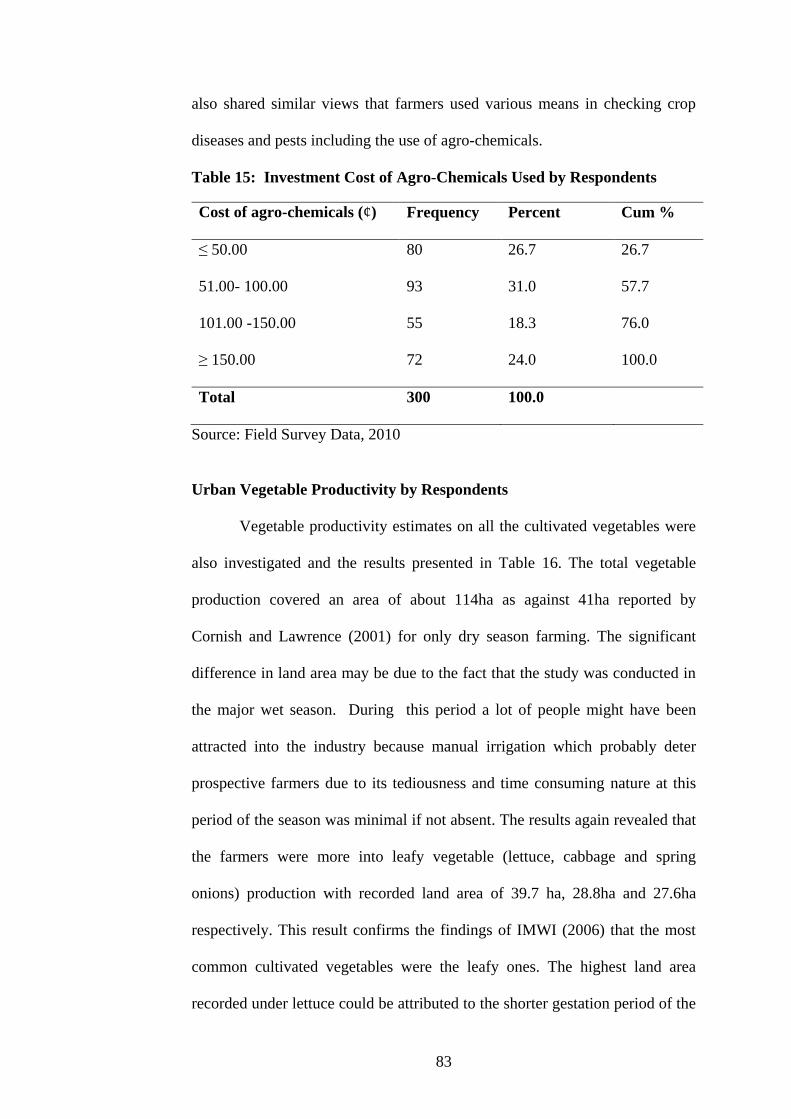
83
also shared similar views that farmers used various means in checking crop
diseases and pests including the use of agro-chemicals.
Table 15: Investment Cost of Agro-Chemicals Used by Respondents
Cost of agro-chemicals (¢)
Frequency Percent Cum %
≤ 50.00 80 26.7 26.7
51.00- 100.00 93 31.0 57.7
101.00 -150.00 55 18.3 76.0
≥ 150.00 72 24.0 100.0
Total 300 100.0
Source: Field Survey Data, 2010
Urban Vegetable Productivity by Respondents
Vegetable productivity estimates on all the cultivated vegetables were
also investigated and the results presented in Table 16. The total vegetable
production covered an area of about 114ha as against 41ha reported by
Cornish and Lawrence (2001) for only dry season farming. The significant
difference in land area may be due to the fact that the study was conducted in
the major wet season. During this period a lot of people might have been
attracted into the industry because manual irrigation which probably deter
prospective farmers due to its tediousness and time consuming nature at this
period of the season was minimal if not absent. The results again revealed that
the farmers were more into leafy vegetable (lettuce, cabbage and spring
onions) production with recorded land area of 39.7 ha, 28.8ha and 27.6ha
respectively. This result confirms the findings of IMWI (2006) that the most
common cultivated vegetables were the leafy ones. The highest land area
recorded under lettuce could be attributed to the shorter gestation period of the
84
crop hence yields frequent income to the farmer. This study results fall in line
with the findings of Cornish and Lawrence (2001) that about 95 percent of the
lettuce produced in Kumasi comes from urban farms.
Furthermore, the three (3) leafy vegetables (lettuce, cabbage and spring
onions) have high market preference probably because of factors such as
increase in hospitality industry, influx of expatriates and increase in food
joints in the metropolis. These findings are buttressed by Drechsel, Graefe,
Sonou and Cofie (2006) report that short duration crops such as lettuce and
spring onion are generally preferred for quick cash returns and also in view of
the farmers’ insecure tenure situations. The seasonal average productivity of
land/ha presented in Table 16 ranges from ¢300.00 to ¢16,350.00 for okra and
carrot respectively. The seasonal average productivity figure of approximately
¢9,200.00/ha reported by Abaidoo et al. (2009) is higher than all the seasonal
average productivity figures revealed by this study except for carrot and kenaf.
Carrot registered a higher seasonal average productivity figure
probably because of its’ less susceptibility to insect/pests attack and also has a
high plant population/unit area resulting from its intimate planting distance. In
general, the findings of this study revealed that the farmers were seriously
under-producing perhaps due to their ignorance about modern and scientific
technologies and agronomic practices. This may be due to the absence of
agricultural extension information, lack of or inadequate training programmes
and Farm Based Organisations (FBOs). Productivity generally might have
been affected by both natural and environmental factors such as pests and
diseases, lack of resources, droughts and floods (Folke et al, 2002). The total
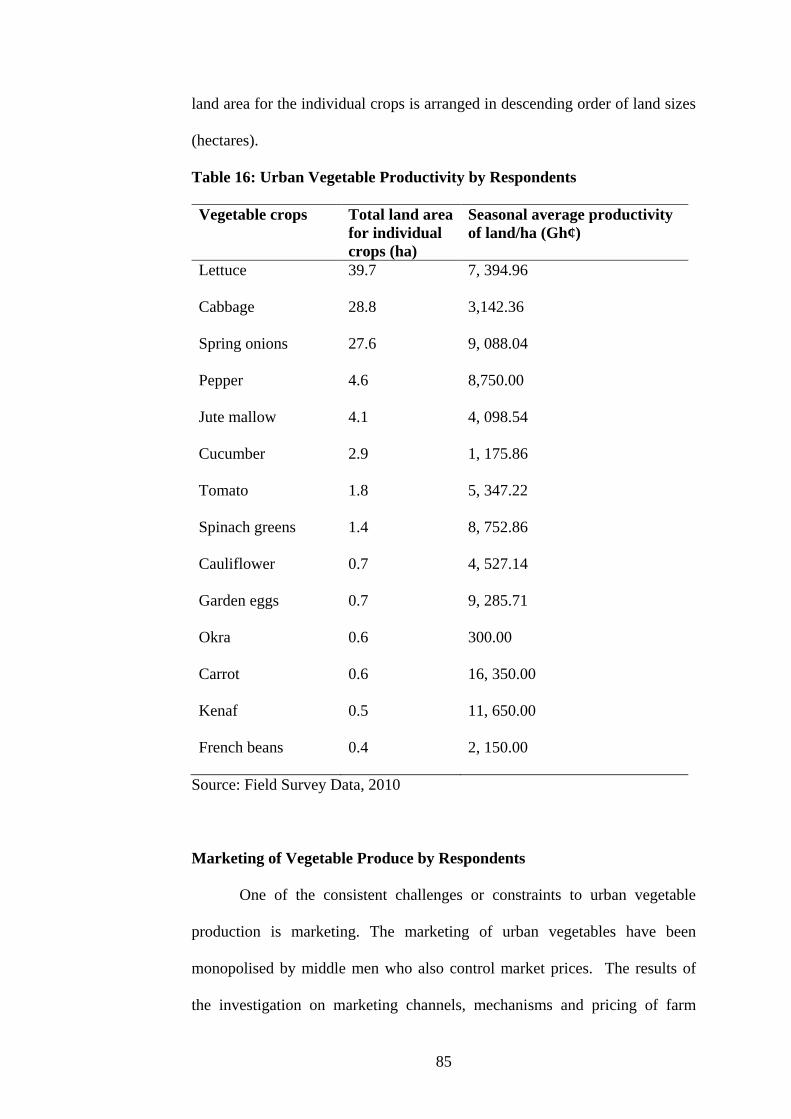
85
land area for the individual crops is arranged in descending order of land sizes
(hectares).
Table 16: Urban Vegetable Productivity by Respondents
Vegetable crops Total land area
for individual
crops (ha)
Seasonal average productivity
of land/ha (Gh¢)
Lettuce 39.7 7, 394.96
Cabbage 28.8 3,142.36
Spring onions 27.6 9, 088.04
Pepper 4.6 8,750.00
Jute mallow 4.1 4, 098.54
Cucumber 2.9 1, 175.86
Tomato 1.8 5, 347.22
Spinach greens 1.4 8, 752.86
Cauliflower 0.7 4, 527.14
Garden eggs 0.7 9, 285.71
Okra 0.6 300.00
Carrot 0.6 16, 350.00
Kenaf 0.5 11, 650.00
French beans 0.4 2, 150.00
Source: Field Survey Data, 2010
Marketing of Vegetable Produce by Respondents
One of the consistent challenges or constraints to urban vegetable
production is marketing. The marketing of urban vegetables have been
monopolised by middle men who also control market prices. The results of
the investigation on marketing channels, mechanisms and pricing of farm
86
produce revealed that the respondents marketed their farm produce through
middle men (97.3 percent) and at farm gate (97.7 percent) level. The sale of
vegetable produce directly to traders at farm gate level suggests that the
farmers were more vulnerable to cheating and manipulation in the market
pricing of their produce by middle men due to the absence of effect FBOs
which champion their welfare. This might have adversely affected the
farmers’ livelihoods. On the pricing of farm produce, though the respondents
(64.7 percent) claimed it was their prerogative, the influence of middle men
cannot be ignored. Though, these farmers are unaware how much these middle
men sell their produce, they are certain that they are not being paid a fair price.
The findings of Obuobie et al. (2006) that significant amount of vegetable
produced in the city is sold at farm gate level is consistent with this study
results.
Respondents’ Vegetable Farming Experience
Experience in vegetable production is very important because it leads
to increase in production efficiency. The results of vegetable production
experience presented in Table 17 showed that 56 percent out of the 300
respondents had been producing vegetables between 1 and 6 years. Whilst
vegetable farmers with production experience between 7 and 9 years
constituted 22.3 percent, those with 10 to 13 years and above 13 years
production experience formed 12.7 percent and 9 percent of the respondents
respectively. The number of years that farmers had been in production was
less perhaps due to the youthful nature of their age structure. This also
suggests a greater potential and efficiency of the vegetable industry. The
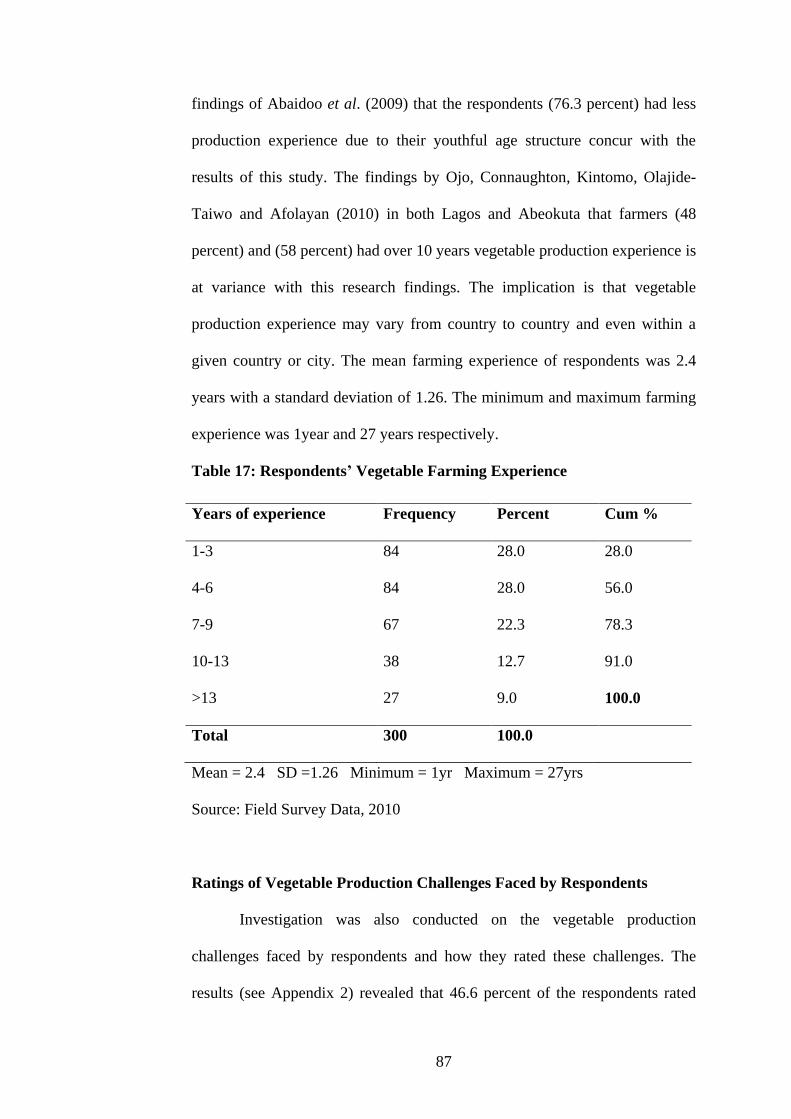
87
findings of Abaidoo et al. (2009) that the respondents (76.3 percent) had less
production experience due to their youthful age structure concur with the
results of this study. The findings by Ojo, Connaughton, Kintomo, Olajide-
Taiwo and Afolayan (2010) in both Lagos and Abeokuta that farmers (48
percent) and (58 percent) had over 10 years vegetable production experience is
at variance with this research findings. The implication is that vegetable
production experience may vary from country to country and even within a
given country or city. The mean farming experience of respondents was 2.4
years with a standard deviation of 1.26. The minimum and maximum farming
experience was 1year and 27 years respectively.
Table 17: Respondents’ Vegetable Farming Experience
Mean = 2.4 SD =1.26 Minimum = 1yr Maximum = 27yrs
Source: Field Survey Data, 2010
Ratings of Vegetable Production Challenges Faced by Respondents
Investigation was also conducted on the vegetable production
challenges faced by respondents and how they rated these challenges. The
results (see Appendix 2) revealed that 46.6 percent of the respondents rated
Years of experience Frequency Percent Cum %
1-3 84 28.0 28.0
4-6 84 28.0 56.0
7-9 67 22.3 78.3
10-13 38 12.7 91.0
>13 27 9.0 100.0
Total 300 100.0
88
input cost of vegetable production as ‘extremely severe’. Whilst some
respondents (26 percent) rated it as ‘very severe’, 14 percent mentioned that it
was ‘severe’. About 7.7 percent and 3.7 percent also rated it as ‘moderately
severe’ and ‘slightly severe’ respectively. Only few (2 percent) of the farmers
rated input cost as ‘not severe’. Production challenges of pests and disease
incidence was also rated by 31 percent and 25.3 percent as ‘severe’ and
‘moderately severe’ respectively. Again, 14 percent rated it as ‘very severe’
and 13.3 percent as ‘slightly severe’. Whilst 8.7 percent indicated that the
incidence of pests and diseases was ‘not severe’, 7.7 percent on the contrary,
believed it was ‘extremely severe’. Poor soil fertility as a production challenge
was ranked by 31.3 percent of the respondents as ‘not severe’. Whilst 24
percent rated it as ‘slightly severe’, 15.7 percent each mentioned that it was
‘moderately severe’ and ‘very severe’. About 8.7 percent and 4.7 percent rated
poor soil fertility as ‘severe’ and ‘extremely severe’ among the production
challenges respectively. Twenty-six percent of the respondents rated
inadequate water as ‘slightly severe’ production challenge. In addition, 21.7
percent and 21.3 percent rated it as ‘moderately severe’ and ‘not severe’
respectively. Nine percent and 7.7 percent of the respondents, respectively
rated water inadequacy as ‘extremely severe’ and ‘very severe’.
The challenge of crops irrigation was rated by 27.7 percent and 24.7
percent as ‘not severe’ and ‘slightly severe’ respectively. About 18.3 percent
and 11.3 percent also rated it as ‘moderately severe and ‘extremely severe’
respectively. Nine percent each rated the challenge of crops irrigation as ‘very
severe’ and ‘severe’ respectively. Lastly, lack of credit facilities as a
production challenge was rated by 28.7 percent, 24.3 percent, 20.3 percent and
89
12.7 percent of the respondents as ‘very severe’, ‘severe’, ‘extremely severe’
and ‘moderately severe’ respectively. This suggests that generally,
respondents were varies in their opinion regarding the rating of the vegetable
production challenges. The implication is that different respondents rated
vegetable production challenges differently according to their perceived
severity level.
Management of Vegetable Production Challenges Faced by Respondents
Management of production challenges was also investigated. The
results of the investigation revealed that high input cost was rated as ‘very
severe’ of the production challenges. Out of the 300 respondents, 46.7 percent
indicated that they had no option than to purchase these inputs irrespective of
their prices. In addition, 33.7 percent and 19.6 percent of the respondents
admitted purchasing only what they could afford and cutting down on
production respectively as their intervention measures. Lack of credit facilities
was also rated as ‘very severe’ among the production challenges. The
respondents (86.7 percent) mentioned the intervention measure as depending
on their own meagre resources. Pests and diseases incidence was rated as
‘severe’.
The respondents (56.3 percent) claimed they used agro-chemicals
(fungicides and pesticides) to manage these challenges. Inadequate water for
irrigation was also rated as ‘moderately severe’. Whilst, 47 percent did not
consider water inadequacy as a challenge, digging of extra wells was
employed by 36 percent of the farmers and 17 percent reduce their farm size to
contain the situation. Poor soil fertility challenge was ranked as ‘slightly
90
severe’. As a remedial measure, the respondents (55.3 percent) applied both
inorganic and organic fertilizers as soil fertility amendments. To the majority
(81.7 percent) of the respondents, irrigation of crops was a minor challenge
that needed any intervention. Most of the intervention measures implemented
by the respondents could have been resolved through the formation of FBOs.
This is because a group has the strong ability to access certain facilities
including credits, extension services, inputs and marketing than individuals.
Ranking of Urban Vegetable Production Challenges by Respondents
Urban vegetable production challenges were ranked according to the
level of severity using Kendall’s Coefficient of Concordance analysis. The
results from Table 18 showed that there was 51.8 percent agreement among
the farmers on the ranking of the vegetable production challenges they
encountered. The coefficient of concordance (W) was significant at 5 percent.
Whilst high input cost and lack of credit facilities were ranked as ‘very
severe’, incidence of pests and diseases were ranked as ‘severe’ among the
production challenges. Inadequate water was ranked as ‘moderately severe’.
Poor soil fertility and crops irrigation challenges were also ranked as ‘slightly
severe’ among the production challenges. The vegetable production challenges
are arranged in order severity of mean ranking by respondents. Whilst high
input cost was ranked as ‘extremely severe’ of the production challenges,
crops irrigation was ranked as not ‘severe’. This results deviate partly from
that of Obuobie et al. (2006) who indicated that input cost, crop diseases and
inadequate water were very important production challenges faced by urban
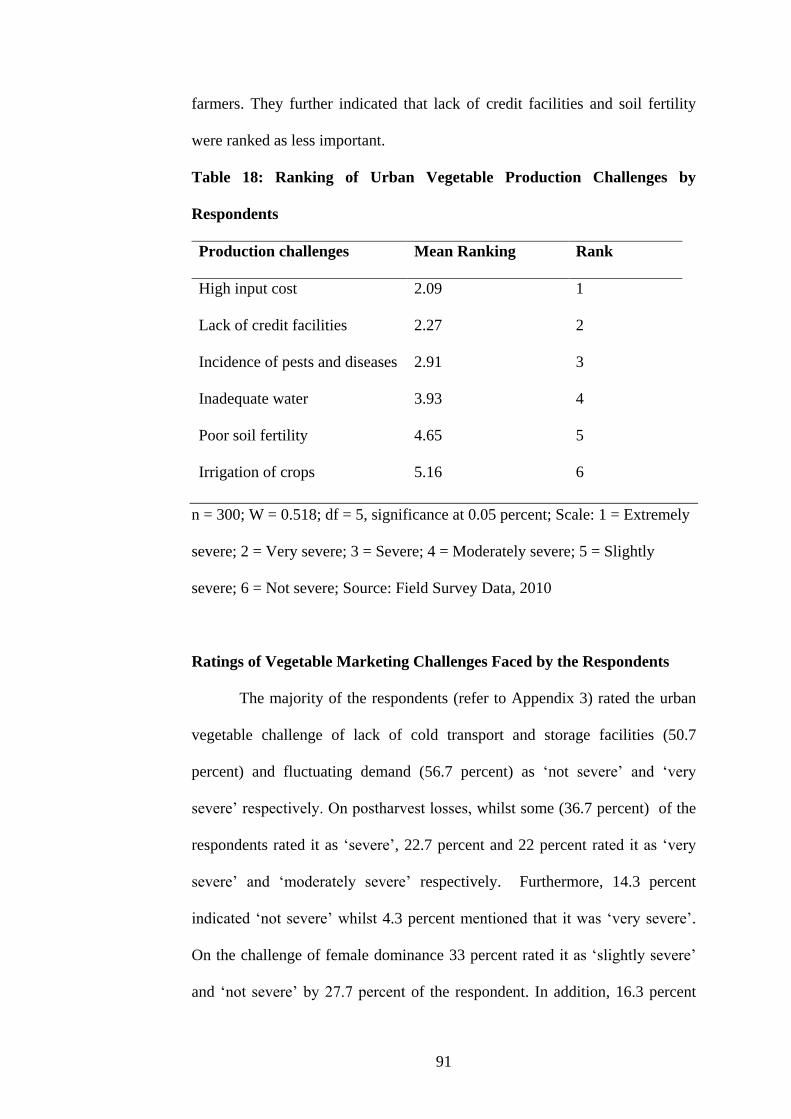
91
farmers. They further indicated that lack of credit facilities and soil fertility
were ranked as less important.
Table 18: Ranking of Urban Vegetable Production Challenges by
Respondents
Production challenges Mean Ranking Rank
High input cost 2.09 1
Lack of credit facilities 2.27 2
Incidence of pests and diseases 2.91 3
Inadequate water 3.93 4
Poor soil fertility 4.65 5
Irrigation of crops 5.16 6
n = 300; W = 0.518; df = 5, significance at 0.05 percent; Scale: 1 = Extremely
severe; 2 = Very severe; 3 = Severe; 4 = Moderately severe; 5 = Slightly
severe; 6 = Not severe; Source: Field Survey Data, 2010
Ratings of Vegetable Marketing Challenges Faced by the Respondents
The majority of the respondents (refer to Appendix 3) rated the urban
vegetable challenge of lack of cold transport and storage facilities (50.7
percent) and fluctuating demand (56.7 percent) as ‘not severe’ and ‘very
severe’ respectively. On postharvest losses, whilst some (36.7 percent) of the
respondents rated it as ‘severe’, 22.7 percent and 22 percent rated it as ‘very
severe’ and ‘moderately severe’ respectively. Furthermore, 14.3 percent
indicated ‘not severe’ whilst 4.3 percent mentioned that it was ‘very severe’.
On the challenge of female dominance 33 percent rated it as ‘slightly severe’
and ‘not severe’ by 27.7 percent of the respondent. In addition, 16.3 percent
92
rated it as ‘moderately severe’, 12.7 percent (severe) and 10.3 percent rated it
‘very severe’ marketing challenge. Thirty-six percent of the respondents’ rated
low price offer as ‘severe’. Whilst 25.7 percent rated it as ‘moderately severe’,
25.3 percent rated as ‘very severe’ marketing challenge. Low price offer was
further rated ‘moderately severe’ by 7.3 percent and ‘not severe’ by 5.7
percent of the respondents. This suggests that the farmers were different in
their ratings of the marketing challenges except for lack of cold transport and
storage facilities and fluctuating demand. The findings of Drechsel and Kunze
(1999) that both fluctuating demand and lack of cold transport and storage
facilities are marketing challenges are consistent with the results of this study.
However, this study rated the latter as ‘not severe’ a production challenge.
Management of Urban Vegetable Marketing Challenges Faced by
Respondents
Lack of cold transport and storage facilities was rated as ‘not severe’.
The respondents (80.7 percent) indicated that they do not need these facilities
since they readily dispose of their produce. Fluctuating demand was also rated
as ‘very severe’ of the vegetable marketing challenges. Various reasons were
offered by the respondents for the management of this challenge. About 56.7
percent mentioned price reduction as an intervention measure to this
challenge. The respondents (100 percent) could not assign any intervention
measures to the postharvest challenge which was ranked as ‘severe’. Female
dominance was rated as ‘moderately severe’ of all the marketing challenges.
Sixty-one percent were not bothered about this marketing challenge. The male
respondents mentioned that they sometimes infiltrated the market but often
93
incurred the displeasure of market women who have monopolised the sale of
these produce. About 53 percent of the respondents indicated that they had no
option but to accept the low price offered them by middle men. This portrays
the extent of vulnerability confronting these farmers. Middle men therefore
ceased the opportunity to exploit these innocent farmers to their advantage.
These adversely affected the farmers’ livelihoods in particular and food
security in general.
Ranking of Urban Vegetable Marketing Challenges by Respondents
Urban vegetable marketing challenges were ranked according to the
extent of severity. From the results revealed in Table 19, about 40.8 percent of
the vegetable farmers basically agreed on the rankings of the urban vegetable
marketing challenges using Kendall’s Coefficient of Concordance analysis.
This implies that the respondents were different in opinion regarding their
ranking of the marketing challenges. The coefficient of concordance (W) was
significant at 5 percent. The findings of this study revealed that fluctuating
demand and low price offer were ranked as ‘severe’ and ‘moderately severe’
marketing challenges respectively. Whilst postharvest losses was ranked as
‘moderately severe’, ‘female dominance’ and lack of cold transport and
storage facilities were both ranked as ‘slightly severe’. Though, the
respondents were different in their opinion regarding the most important
marketing challenges, the results from Kendall’s coefficient of concordance
analysis tagged fluctuating demand, low price offer and postharvest losses as
the most important vegetable marketing challenges. This result partly agree
with that of Cornish, Aidoo, Ayamba (2001) and Drechsel and Kunze (1999)
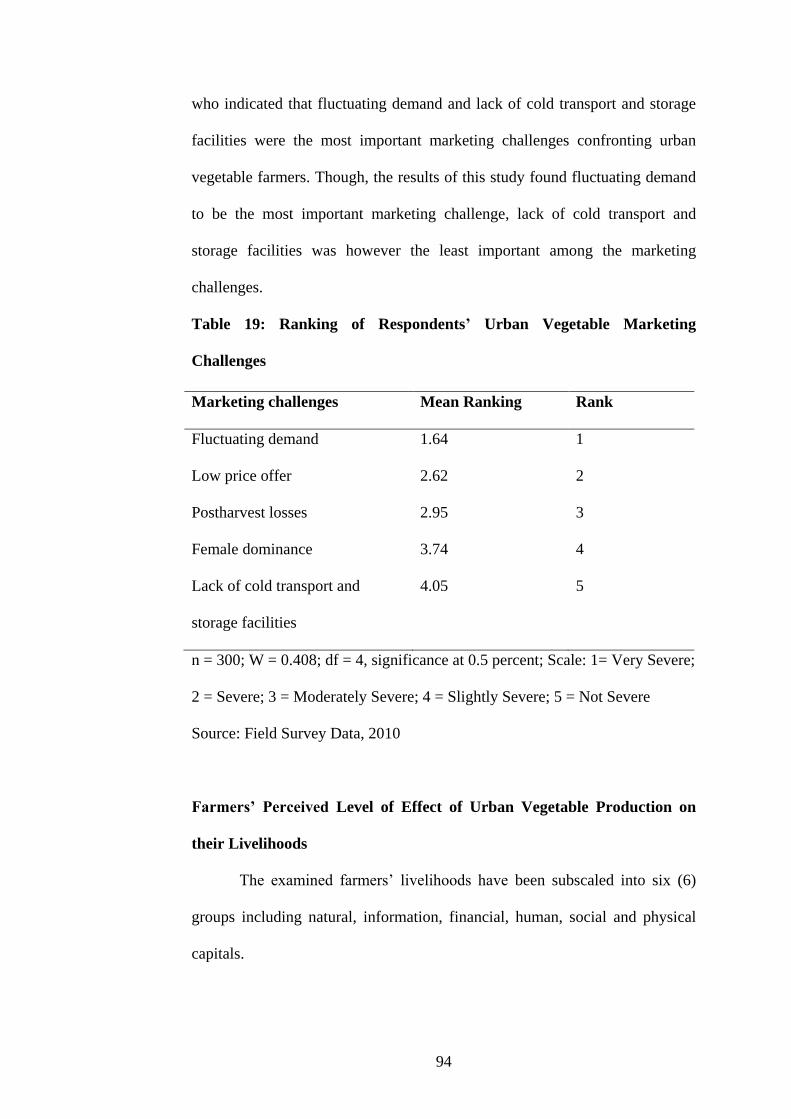
94
who indicated that fluctuating demand and lack of cold transport and storage
facilities were the most important marketing challenges confronting urban
vegetable farmers. Though, the results of this study found fluctuating demand
to be the most important marketing challenge, lack of cold transport and
storage facilities was however the least important among the marketing
challenges.
Table 19: Ranking of Respondents’ Urban Vegetable Marketing
Challenges
n = 300; W = 0.408; df = 4, significance at 0.5 percent; Scale: 1= Very Severe;
2 = Severe; 3 = Moderately Severe; 4 = Slightly Severe; 5 = Not Severe
Source: Field Survey Data, 2010
Farmers’ Perceived Level of Effect of Urban Vegetable Production on
their Livelihoods
The examined farmers’ livelihoods have been subscaled into six (6)
groups including natural, information, financial, human, social and physical
capitals.
Marketing challenges Mean Ranking Rank
Fluctuating demand 1.64 1
Low price offer 2.62 2
Postharvest losses 2.95 3
Female dominance 3.74 4
Lack of cold transport and
storage facilities
4.05 5
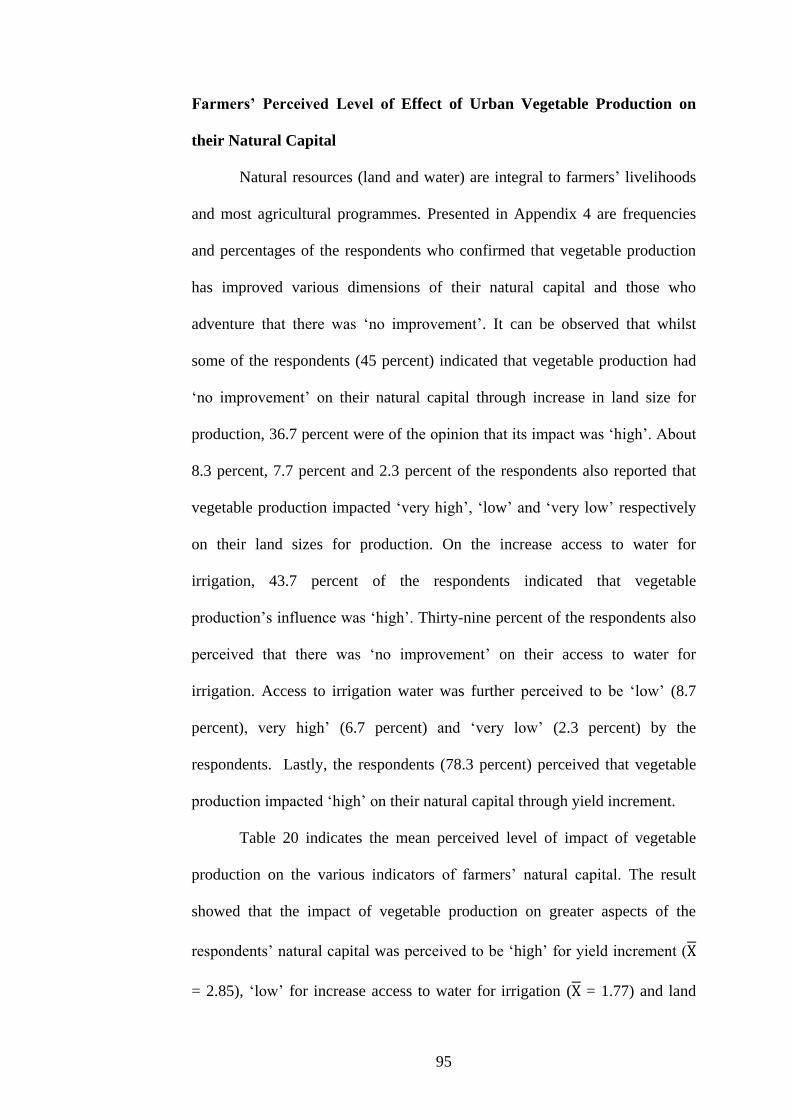
95
Farmers’ Perceived Level of Effect of Urban Vegetable Production on
their Natural Capital
Natural resources (land and water) are integral to farmers’ livelihoods
and most agricultural programmes. Presented in Appendix 4 are frequencies
and percentages of the respondents who confirmed that vegetable production
has improved various dimensions of their natural capital and those who
adventure that there was ‘no improvement’. It can be observed that whilst
some of the respondents (45 percent) indicated that vegetable production had
‘no improvement’ on their natural capital through increase in land size for
production, 36.7 percent were of the opinion that its impact was ‘high’. About
8.3 percent, 7.7 percent and 2.3 percent of the respondents also reported that
vegetable production impacted ‘very high’, ‘low’ and ‘very low’ respectively
on their land sizes for production. On the increase access to water for
irrigation, 43.7 percent of the respondents indicated that vegetable
production’s influence was ‘high’. Thirty-nine percent of the respondents also
perceived that there was ‘no improvement’ on their access to water for
irrigation. Access to irrigation water was further perceived to be ‘low’ (8.7
percent), very high’ (6.7 percent) and ‘very low’ (2.3 percent) by the
respondents. Lastly, the respondents (78.3 percent) perceived that vegetable
production impacted ‘high’ on their natural capital through yield increment.
Table 20 indicates the mean perceived level of impact of vegetable
production on the various indicators of farmers’ natural capital. The result
showed that the impact of vegetable production on greater aspects of the
respondents’ natural capital was perceived to be ‘high’ for yield increment (X
= 2.85), ‘low’ for increase access to water for irrigation (X = 1.77) and land
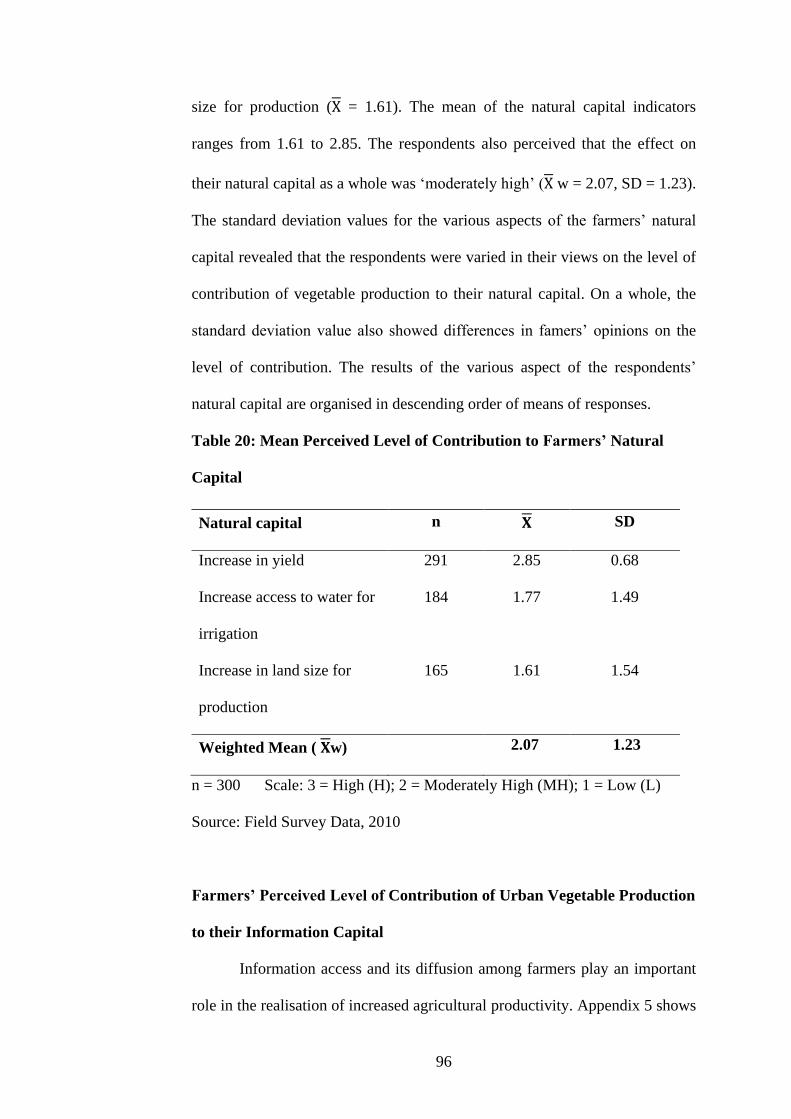
96
size for production (X = 1.61). The mean of the natural capital indicators
ranges from 1.61 to 2.85. The respondents also perceived that the effect on
their natural capital as a whole was ‘moderately high’ (X w = 2.07, SD = 1.23).
The standard deviation values for the various aspects of the farmers’ natural
capital revealed that the respondents were varied in their views on the level of
contribution of vegetable production to their natural capital. On a whole, the
standard deviation value also showed differences in famers’ opinions on the
level of contribution. The results of the various aspect of the respondents’
natural capital are organised in descending order of means of responses.
Table 20: Mean Perceived Level of Contribution to Farmers’ Natural
Capital
n = 300 Scale: 3 = High (H); 2 = Moderately High (MH); 1 = Low (L)
Source: Field Survey Data, 2010
Farmers’ Perceived Level of Contribution of Urban Vegetable Production
to their Information Capital
Information access and its diffusion among farmers play an important
role in the realisation of increased agricultural productivity. Appendix 5 shows
Natural capital n 𝐗 SD
Increase in yield 291 2.85 0.68
Increase access to water for
irrigation
184 1.77 1.49
Increase in land size for
production
165 1.61 1.54
Weighted Mean ( 𝐗w) 2.07 1.23
97
frequency distribution of farmers’ perceived level of contribution of vegetable
production to the various facets of their information capital. Whilst 24 percent
of the respondents perceived that vegetable production’s level of contribution
to their’ information capital in terms of awareness of land and water resources
management was ‘high’, 23.3 percent on the contrary thought it had no impact
(no improvement). Again, 13.3 percent perceived the level of influence to be
‘low’ and 9 percent mentioned that the level of impact was ‘very low’. Only
few (3.7 percent) of the respondents however, perceived that vegetable
production impacted ‘very high’ on their awareness of land and water
resources management.
In addition, the majority (79 percent) of the respondents perceived that
increase in the level of their decision making ability resulting from their
vegetable production was ‘high’. Furthermore, over half (55.3 percent) of the
respondents’ perceived that vegetable production had ‘not improved’ their
access to services from change agents. Again, the results (see Appendix 5)
revealed that 86.6 percent indicated that vegetable production had ‘not
improved’ their awareness level of Information and Communication
Technology (ICT) to information access. Similarly, 85.3 percent indicated that
vegetable production had not impacted on their access to credit facilities (no
improvement). Fifty-five percent of the respondents mentioned that their
awareness level of farmer’s association result from the vegetable production
was ‘moderately ‘low’. The results further revealed that 53.3 percent of the
respondents perceived that vegetable production contributed nothing (no
improvement) to their level of access to marketing avenues of their
information capital.
98
Table 21 also shows the mean perceived level of contribution of
vegetable production to the various aspects of famers’ information capital. The
mean of responses are also arranged in descending order. The results indicated
that the level of contribution of vegetable production to the respondents’
various aspects of their information capital was ‘high’ for decision making
ability (X =2.74). Whilst awareness of farmer association (X=1.80) recorded
‘low’, ‘very low’ was registered for awareness of land and water resources (X
=1.22), increase access to marketing avenues (X = 1.18) and increase access to
services from change agents (X =1.11). Increase access to credit facilities (X =
0.37) and awareness of ICT to access information (X= 0.35) also recorded ‘no
improvement’ from the vegetable production.
The mean of the various aspects of information capital ranges from
0.35 to 2.74. The standard deviation also showed that the majority of the
respondents’ held similar opinions regarding the level of contribution of
vegetable production to their information capital. However, respondents’
differ in their views on awareness of land and water resources management
(1.37), increase access to marketing avenues (1.35) and services from change
agents (1.34). The respondents also perceived the level of contribution of
vegetable production to their information capital in general as ‘low’ (X w =
1.25, SD = 1.09). The views of the respondents on the contribution of
vegetable production to the various aspects of their information capital in
totality showed variations in their opinions as shown by the standard deviation
value (1.09).
99
Table 21: Mean Perceived Level of Contribution to Farmers’ Information
Capital
n = 300 Scale: 3 = High (H); 2 = Moderately High (MH); 1 = Low (L)
Source: Field Survey Data, 2010
Farmers’ Perceived Level of Contribution of Urban Vegetable Production
to their Financial Capital
The respondents (78 percent) who claimed that vegetable production
influenced their financial capital through increase in their income level also
perceived that the level of influence was ‘high’ (see Appendix 6). Whilst 48
percent perceived that the level of impact was ‘high’ on savings, about 30.7
percent perceived that it had no influence (no improvement). Again, 17.3
percent of the respondents perceived the level of contribution to be ‘low’
whilst 2 percent each perceived ‘very low’ and ‘very high’ contributions to
Information Capital n 𝐗
SD
Increase your decision making ability 287 2.74 0.76
Awareness of farmers association 262 1.80 0.99
Awareness of land & water resources
management
150
1.22
1.37
Increase access to marketing avenues 140 1.18 1.35
Increase access to services from change
agents
134
1.11
1.34
Increase access to credit facilities 40 0.37 0.95
Awareness of ICT to access information 44 0.35 0.91
Weighted Mean (𝐗 w) 1.25 1.09
100
their savings. The respondents (44 percent) admitted that vegetable production
contributed to a decrease in their level and that the level of contribution was
‘high’. Thirty-two percent and 11.7 percent claimed that there was ‘no
improvement’ and ‘low’ impact respectively on their debt level as far as
vegetable production is concerned. In addition, whilst 9 percent perceived the
effects to be ‘very high’, 3.3 percent held a contrary view of ‘very low’ effects
on their debt level. Lastly, the respondents (approximately 87 percent)
perceived that there was ‘no improvement’ on their access to financial
facilities as a result of the vegetable production.
Table 22: Mean Perceived Level of Contribution to Farmers’ Financial
Capital
n = 300 Scale: 3 = High (H); 2 = Moderately High (MH); 1 = Low (L)
Source: Field Survey Data, 2010
Table 22 shows that mean perceived level of contribution of vegetable
production to the various indicators of farmers’ financial capital was ‘high’ for
increased income level (X = 2.78), ‘low’ for decrease debt level (X =1.94) and
the level of savings ( X = 1.88).
For access to financial facilities (X = 0.61) vegetable production
impacted ‘very low’. The level of effect of vegetable production on their
Financial Capital
n 𝐗
SD
Increase in income level 289 2.78 0.71
Decrease in debt level 204 1.94 1.45
Increase in savings 208 1.88 1.34
Increase access to financial facilities 40 0.61 1.12
Weighted Mean (𝐗w) 1.80 1.15
101
financial capital in totality was ‘low’ (Xw = 1.80, SD = 1.15). The standard
deviations for the various financial capital indicators indicate that the
respondents were diverse in their opinion regarding the level of contribution of
vegetable production to their financial capital. Similarly, the standard
deviation for the financial capital in totality (1.15) showed that the farmers
were different in their views about the level of effect of vegetable production
on their financial capital.
Farmers’ Perceived Level of Contribution of Urban Vegetable Production
to their Human Capital
The majority of the respondents’ also perceived that the vegetable
production impacted ‘high’ on their human capital through increase access in
knowledge and skill levels (82.7 percent) (refer to Appendix 7). Vegetable
production was perceived to make ‘no improvement’ on farmers’ increase
level of access to health facilities (67 percent), training (60 percent) and labour
(62 percent).
Table 23 shows mean perceived level of effect of vegetable production
on the various aspects of famers’ human capital. The result indicated that the
level of effect of vegetable production on the respondents’ various aspects of
human capital was perceived to be ‘high’ (X = 2.88) for increase in knowledge
and skill levels. Increase access to training (X = 1.01), labour (X = 0.84) and
health facilities (X = 0.67) were perceived by the respondents to be ‘very low’.
The mean of the various aspects of the respondents’ human capital ranges
from 0.67 to 2.88. The standard deviation also showed the respondents’ held
varied opinions on the level of contribution of vegetable production to their
102
human capital. The respondents also perceived that the level of contribution of
vegetable production to their human capital in totality was ‘low’ (Xw = 1.35,
SD = 1.06). The standard deviation also indicates that the respondents shared
varied views on the level of contribution of the vegetable production to their
human capital in totality. The mean of responses of respondents’ human
capital are arranged in descending order from.
Table 23: Mean Perceived Level of Contribution to Farmers’ Human
Capital
n = 300 Scale: 3 = High (H); 2 = Moderately High (MH); 1= Low (L)
Source: Field Survey Data, 2010
Farmers’ Perceived Level of Contribution of Urban Vegetable Production
to their Social Capital
Appendix 8 shows the frequency distribution of farmers’ perceived
level of contribution of vegetable production to the various aspects of their
social capital. The results revealed that 80.3 percent each of the respondents
perceived that the vegetable production did not influence (no improvement)
their social capital through membership and support received from the
association. The support from other individual farmers was perceived to be
Human Capital n 𝐗 SD
Increase in knowledge/skill levels 290 2.88 0.68
Increase access to training 120 1.01 1.33
Increase access to labour 114 0.84 1.19
Increase access to health facilities 99 0.67 1.06
Weighted Mean (𝐗w) 1.35 1.06
103
‘high’ according to 47.7 percent of the respondents. Whilst 21.3 percent
perceived the level of impact to be ‘low’, 16.7 percent on the contrary, thought
it was ‘very high’. Thirteen percent and 1.7 percent perceived that the
vegetable production did ‘not impact’ and impacted ‘very low’ on the level of
support received from other individual farmers respectively.
Whilst the majority of the respondents claimed that the level of care for
the household (69.3 percent), payment of school fees (54.7 percent) and the
level of support offered other family members (57.7 percent) were ‘high’, 59.7
percent perceived that it was ‘very low’ when it comes to the level of support
offered friends. Again, the results revealed that the level of contribution of the
vegetable production was ‘very low’ (28.3 percent), ‘low’ (27.3 percent) and
’high’ (27 percent) for the payment of funeral dues and other levies. In
addition, whilst 13.3 percent perceived that the vegetable production did not
impact on their payment of funeral dues and other levies, 4 percent on the
contrary, believed it impacted ‘very high’ on their social capital.
Table 24 further shows mean farmers’ perceived level of contribution of
vegetable production to the various aspects of their social capital. The various
facets of farmers’ social capital are also set out in descending order of mean of
responses. The results showed that the level of impact of vegetable production
on the various aspects of respondents social capital was ‘high’ for care for the
household (X = 2.69), payment of school fees (X = 2.56) and support from
other individual farmers (X = 2.54). The level of contribution was also
perceived to be ‘low’ (X = 2.49, 1.80) for support to other family members and
payment of funeral dues and other levies respectively. It was again perceived
to be ‘very low’ for support offered friends (X = 1.30), membership to
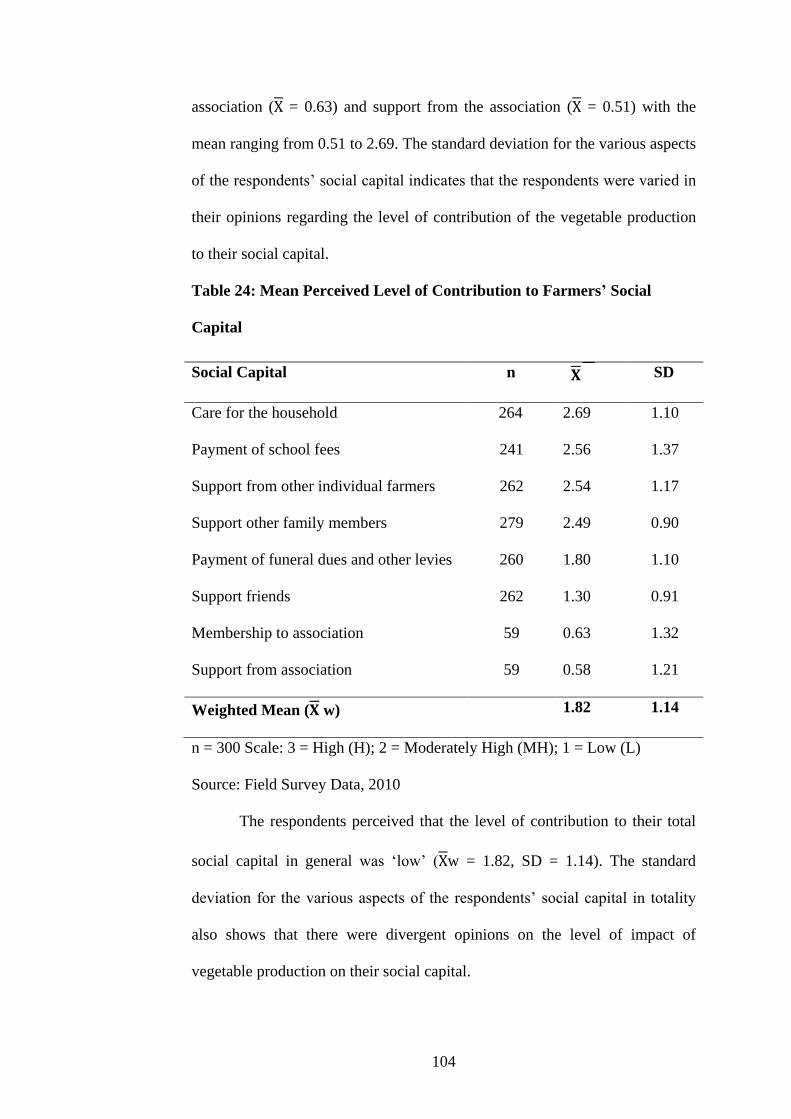
104
association (X = 0.63) and support from the association (X = 0.51) with the
mean ranging from 0.51 to 2.69. The standard deviation for the various aspects
of the respondents’ social capital indicates that the respondents were varied in
their opinions regarding the level of contribution of the vegetable production
to their social capital.
Table 24: Mean Perceived Level of Contribution to Farmers’ Social
Capital
n = 300 Scale: 3 = High (H); 2 = Moderately High (MH); 1 = Low (L)
Source: Field Survey Data, 2010
The respondents perceived that the level of contribution to their total
social capital in general was ‘low’ (Xw = 1.82, SD = 1.14). The standard
deviation for the various aspects of the respondents’ social capital in totality
also shows that there were divergent opinions on the level of impact of
vegetable production on their social capital.
Social Capital n 𝐗 SD
Care for the household 264 2.69 1.10
Payment of school fees 241 2.56 1.37
Support from other individual farmers 262 2.54 1.17
Support other family members 279 2.49 0.90
Payment of funeral dues and other levies 260 1.80 1.10
Support friends 262 1.30 0.91
Membership to association 59 0.63 1.32
Support from association 59 0.58 1.21
Weighted Mean (𝐗 w) 1.82 1.14
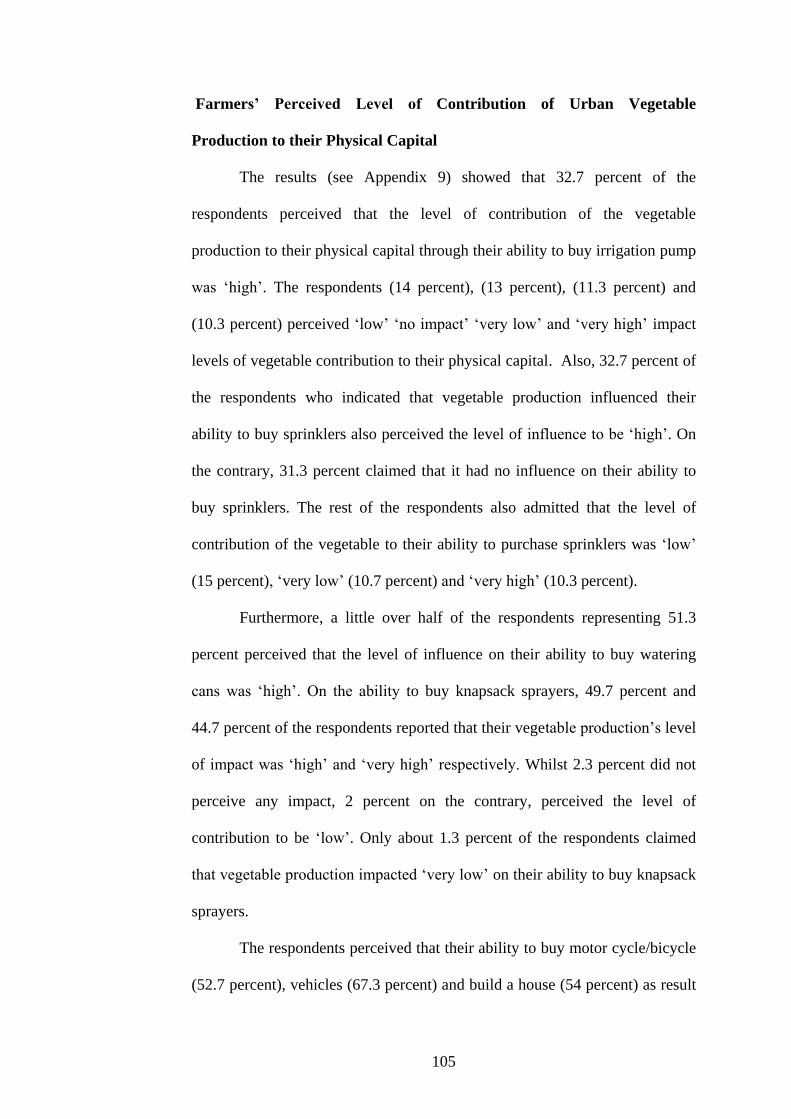
105
Farmers’ Perceived Level of Contribution of Urban Vegetable
Production to their Physical Capital
The results (see Appendix 9) showed that 32.7 percent of the
respondents perceived that the level of contribution of the vegetable
production to their physical capital through their ability to buy irrigation pump
was ‘high’. The respondents (14 percent), (13 percent), (11.3 percent) and
(10.3 percent) perceived ‘low’ ‘no impact’ ‘very low’ and ‘very high’ impact
levels of vegetable contribution to their physical capital. Also, 32.7 percent of
the respondents who indicated that vegetable production influenced their
ability to buy sprinklers also perceived the level of influence to be ‘high’. On
the contrary, 31.3 percent claimed that it had no influence on their ability to
buy sprinklers. The rest of the respondents also admitted that the level of
contribution of the vegetable to their ability to purchase sprinklers was ‘low’
(15 percent), ‘very low’ (10.7 percent) and ‘very high’ (10.3 percent).
Furthermore, a little over half of the respondents representing 51.3
percent perceived that the level of influence on their ability to buy watering
cans was ‘high’. On the ability to buy knapsack sprayers, 49.7 percent and
44.7 percent of the respondents reported that their vegetable production’s level
of impact was ‘high’ and ‘very high’ respectively. Whilst 2.3 percent did not
perceive any impact, 2 percent on the contrary, perceived the level of
contribution to be ‘low’. Only about 1.3 percent of the respondents claimed
that vegetable production impacted ‘very low’ on their ability to buy knapsack
sprayers.
The respondents perceived that their ability to buy motor cycle/bicycle
(52.7 percent), vehicles (67.3 percent) and build a house (54 percent) as result
106
of their vegetable production was ‘high’ and had ‘no influence’ on both (their
ability to buy vehicles and build a house) respectively (see Appendix 9).
Whilst 38 percent claimed that the vegetable production did not impact’ on
their access to irrigation pump, 27.7 percent and 23.3 percent perceived that
the level of influence was ‘very high’ and ‘high’ respectively. In addition,
‘low’ (6 percent) and ‘very low’ (5 percent) impacts were reported by the
respondents as the contribution of vegetable production to their physical
capital. The impact of vegetable production to the respondents’ ability to
access sprinklers was ‘high’ (43.3 percent), ‘very high’ (26 percent) and ‘no
impact’ (19.3 percent). The respondents also admitted that though there was
influence on their ability to access sprinklers, such influence was perceived to
be ’moderately high’ (6 percent) and ‘low’(5.3 percent). The respondents
perceived that access to watering cans (59.7 percent), knapsack sprayers (58.7
percent) and motor cycle/bicycle (52 percent) was ‘very high as a result of the
vegetable production’. Whilst 33.7 percent of the respondents claimed that the
level of impact was ‘very high’, on the contrary, 32.7 percent reported that it
did not influence their access to vehicles. Furthermore, the respondents also
perceived the level of impact to be ‘high’ (22.3 percent), ‘low’ (6.3 percent)
and ’very low’ (5 percent) on their physical capital. Lastly, the respondents
(66.3 percent) perceived as ‘high’ the level of influence of vegetable
production on their ability to rent a house.
Table 25 also shows mean perceived level of impact of vegetable
production on the various aspects of farmers’ physical capital. The various
aspects of farmers’ physical capital are also arranged in descending order of
mean of responses. The results show that the level of impact of vegetable
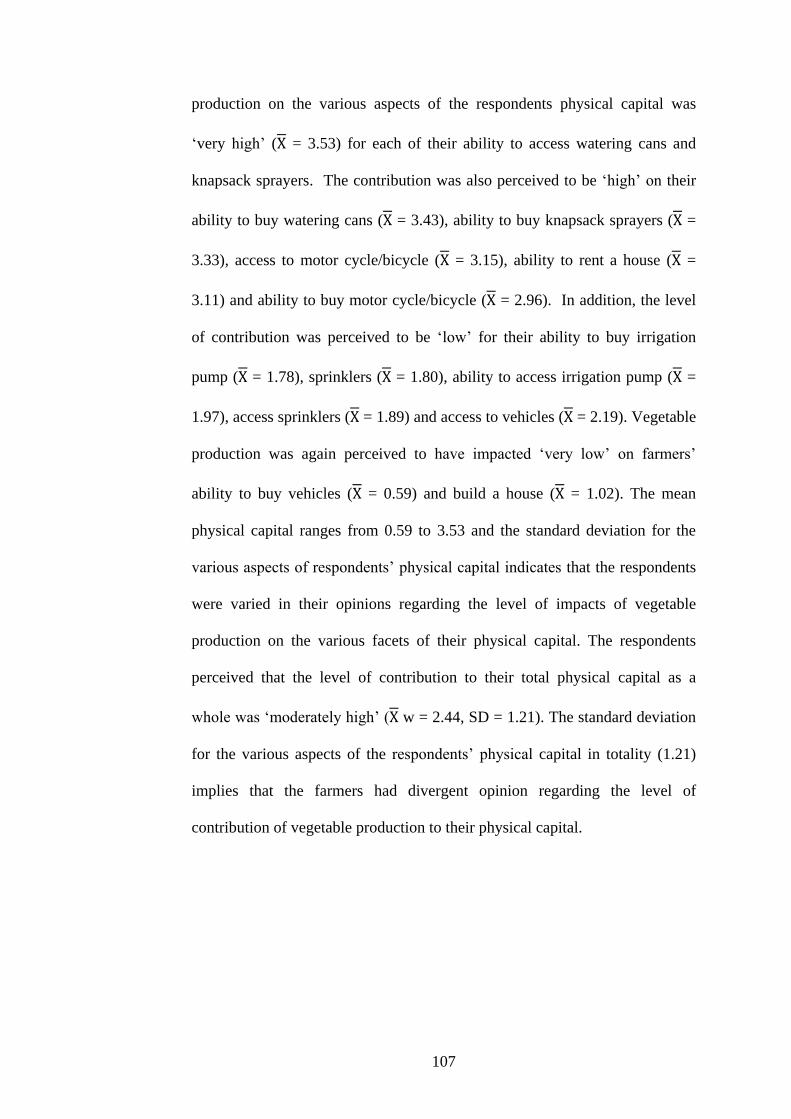
107
production on the various aspects of the respondents physical capital was
‘very high’ (X = 3.53) for each of their ability to access watering cans and
knapsack sprayers. The contribution was also perceived to be ‘high’ on their
ability to buy watering cans (X = 3.43), ability to buy knapsack sprayers (X =
3.33), access to motor cycle/bicycle (X = 3.15), ability to rent a house (X =
3.11) and ability to buy motor cycle/bicycle (X = 2.96). In addition, the level
of contribution was perceived to be ‘low’ for their ability to buy irrigation
pump (X = 1.78), sprinklers (X = 1.80), ability to access irrigation pump (X =
1.97), access sprinklers (X = 1.89) and access to vehicles (X = 2.19). Vegetable
production was again perceived to have impacted ‘very low’ on farmers’
ability to buy vehicles (X = 0.59) and build a house (X = 1.02). The mean
physical capital ranges from 0.59 to 3.53 and the standard deviation for the
various aspects of respondents’ physical capital indicates that the respondents
were varied in their opinions regarding the level of impacts of vegetable
production on the various facets of their physical capital. The respondents
perceived that the level of contribution to their total physical capital as a
whole was ‘moderately high’ (X w = 2.44, SD = 1.21). The standard deviation
for the various aspects of the respondents’ physical capital in totality (1.21)
implies that the farmers had divergent opinion regarding the level of
contribution of vegetable production to their physical capital.
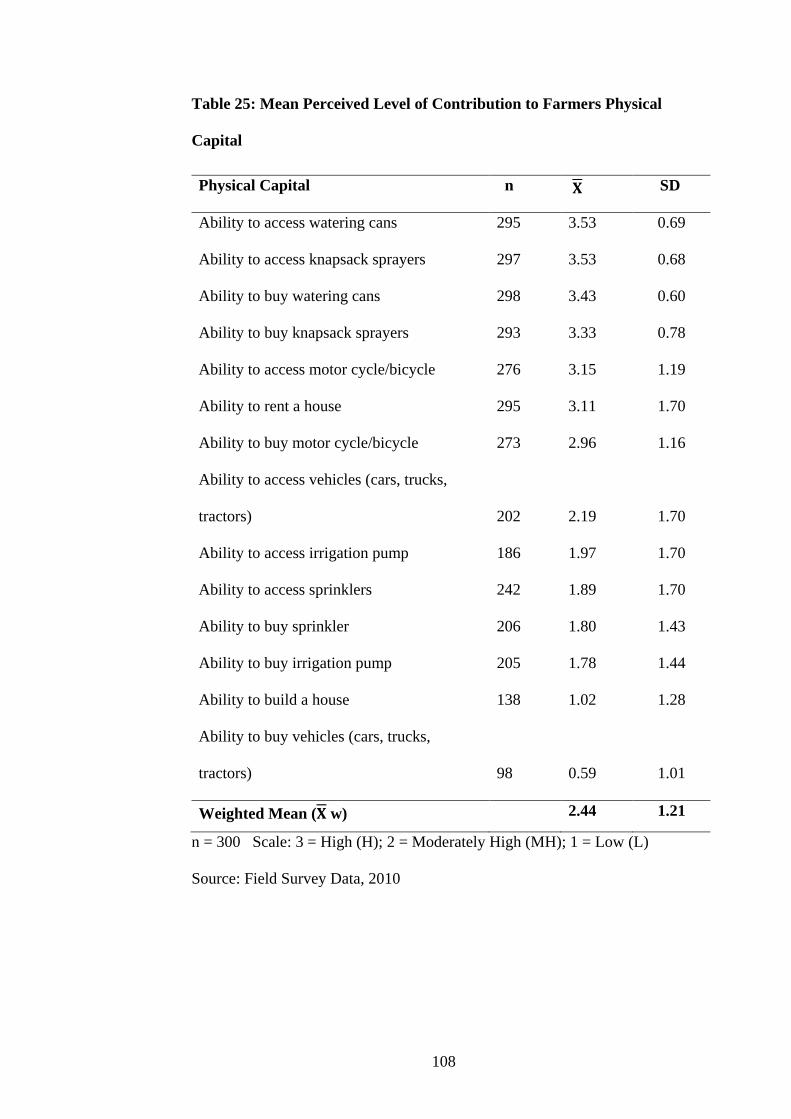
108
Table 25: Mean Perceived Level of Contribution to Farmers Physical
Capital
n = 300 Scale: 3 = High (H); 2 = Moderately High (MH); 1 = Low (L)
Source: Field Survey Data, 2010
Physical Capital
n 𝐗 SD
Ability to access watering cans 295 3.53 0.69
Ability to access knapsack sprayers 297 3.53 0.68
Ability to buy watering cans 298 3.43 0.60
Ability to buy knapsack sprayers 293 3.33 0.78
Ability to access motor cycle/bicycle 276 3.15 1.19
Ability to rent a house 295 3.11 1.70
Ability to buy motor cycle/bicycle 273 2.96 1.16
Ability to access vehicles (cars, trucks,
tractors)
202
2.19
1.70
Ability to access irrigation pump 186 1.97 1.70
Ability to access sprinklers 242 1.89 1.70
Ability to buy sprinkler 206 1.80 1.43
Ability to buy irrigation pump 205 1.78 1.44
Ability to build a house 138 1.02 1.28
Ability to buy vehicles (cars, trucks,
tractors)
98
0.59
1.01
Weighted Mean (𝐗 w) 2.44 1.21
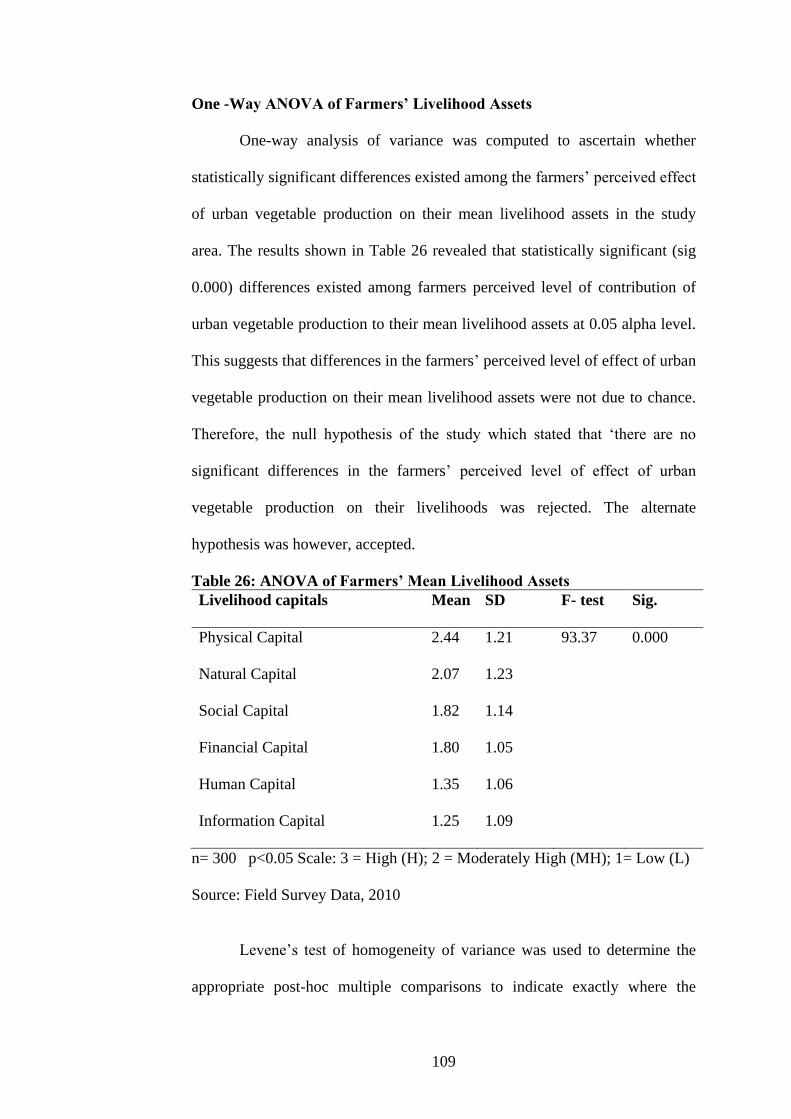
109
One -Way ANOVA of Farmers’ Livelihood Assets
One-way analysis of variance was computed to ascertain whether
statistically significant differences existed among the farmers’ perceived effect
of urban vegetable production on their mean livelihood assets in the study
area. The results shown in Table 26 revealed that statistically significant (sig
0.000) differences existed among farmers perceived level of contribution of
urban vegetable production to their mean livelihood assets at 0.05 alpha level.
This suggests that differences in the farmers’ perceived level of effect of urban
vegetable production on their mean livelihood assets were not due to chance.
Therefore, the null hypothesis of the study which stated that ‘there are no
significant differences in the farmers’ perceived level of effect of urban
vegetable production on their livelihoods was rejected. The alternate
hypothesis was however, accepted.
Table 26: ANOVA of Farmers’ Mean Livelihood Assets
Livelihood capitals Mean SD F- test Sig.
Physical Capital 2.44 1.21 93.37 0.000
Natural Capital 2.07 1.23
Social Capital 1.82 1.14
Financial Capital 1.80 1.05
Human Capital 1.35 1.06
Information Capital 1.25 1.09
n= 300 p<0.05 Scale: 3 = High (H); 2 = Moderately High (MH); 1= Low (L)
Source: Field Survey Data, 2010
Levene’s test of homogeneity of variance was used to determine the
appropriate post-hoc multiple comparisons to indicate exactly where the
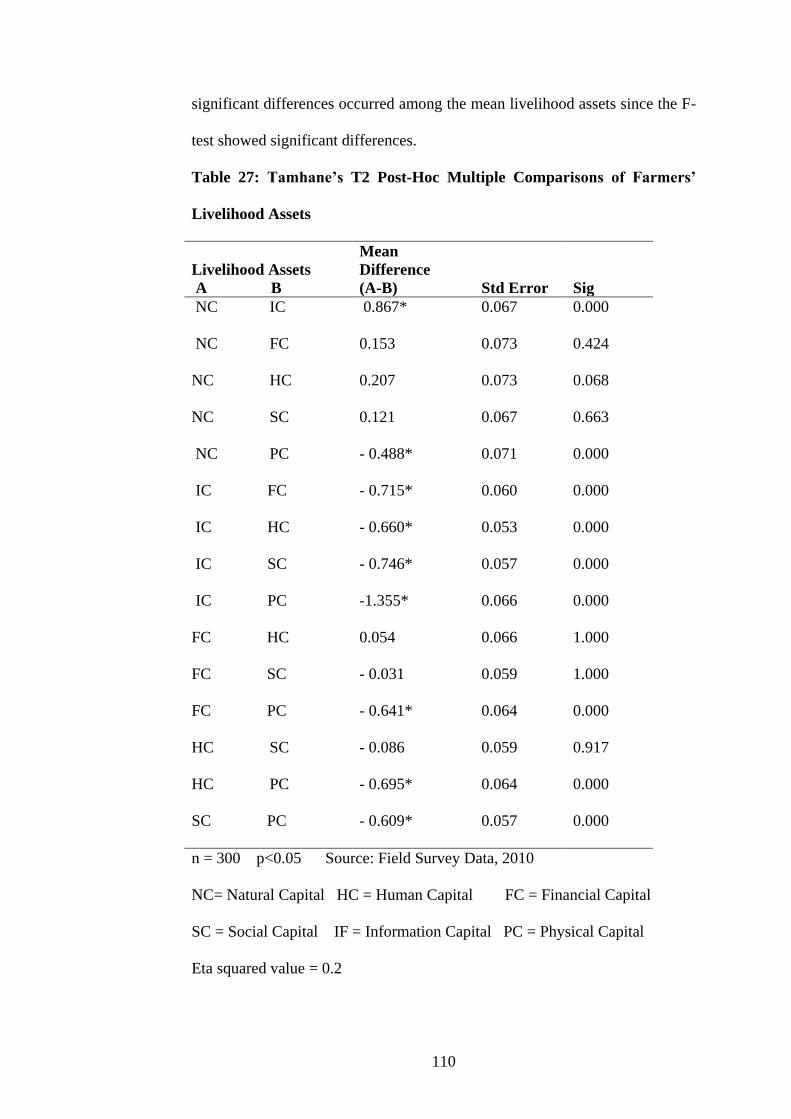
110
significant differences occurred among the mean livelihood assets since the F-
test showed significant differences.
Table 27: Tamhane’s T2 Post-Hoc Multiple Comparisons of Farmers’
Livelihood Assets
Livelihood Assets
Mean
Difference
A B (A-B) Std Error Sig
NC IC 0.867* 0.067 0.000
NC FC 0.153 0.073 0.424
NC HC 0.207 0.073 0.068
NC SC 0.121 0.067 0.663
NC PC - 0.488* 0.071 0.000
IC FC - 0.715* 0.060 0.000
IC HC - 0.660* 0.053 0.000
IC SC - 0.746* 0.057 0.000
IC PC -1.355* 0.066 0.000
FC HC 0.054 0.066 1.000
FC SC - 0.031 0.059 1.000
FC PC - 0.641* 0.064 0.000
HC SC - 0.086 0.059 0.917
HC PC - 0.695* 0.064 0.000
SC PC - 0.609* 0.057 0.000
n = 300 p<0.05 Source: Field Survey Data, 2010
NC= Natural Capital HC = Human Capital FC = Financial Capital
SC = Social Capital IF = Information Capital PC = Physical Capital
Eta squared value = 0.2
111
The results revealed that variances that existed among the mean
livelihood assets were highly significant. This suggests that equal variances
are not assumed among the mean livelihood assets. Tamhane’s T2 test (Table
27) was therefore chosen as the appropriate post-hoc multiple comparisons for
the mean livelihood assets based on the Levene’s test result.
Table 27 shows Post-hoc multiple comparisons of mean livelihood
assets of farmers using Tamhane’s T2 test. The results revealed that mean
differences among farmers’ natural (X =2.07; SD = 1.23), information (X =
1.25; SD = 1.09), financial (X = 1.80; SD = 1.15), human (X = 1.35; SD =
1.06), social (X = 1.82; SD = 1.14) and physical capitals (X = 2.44; SD = 1.21)
were statistically significant with one another at 0.05 alpha level. This
suggests that the significant differences among the mean livelihood assets
were as a result of the farmers’ urban vegetable production. The results also
revealed that natural and physical capitals which were the most affected and
recorded ‘moderately high’ means according to the scale of measurement,
were significantly higher than information, financial, human and social
capitals. The result is not surprising as it is partly consistent with the findings
of Bosompim (2006) that farmers are likely to invest profits accrued from their
farms in the purchase of inputs and other equipment that will assist them
maintain their farms than investing it in other aspects of their livelihoods. The
findings of Akaba (2008) that urban vegetable contributed ‘high’ to farmers’
natural capital and ‘low’ to their financial and human capitals further agree
with this study result.
On the contrary, the ‘high’ impact recorded on farmers’ social capital
and ‘low’ contribution to their physical capital by Akaba are at variance with
112
this research result. Generally, vegetable production in the study area
significantly improved on farmers’ natural and physical capitals compared to
their information, financial, human and social capitals.
To find the strength of association statistics (magnitude of the
differences between means) of farmers’ livelihood assets, Eta squared was
calculated based on the formula below:
Eta squared = Sum of squares between groups = 0.2
Total sum of squares
The value (0.2) suggests large effect size of mean livelihood assets of
farmers using Cohen (1988) conversion guideline (see Appendix 10). The Eta
squared value (0.2) implies that the differences among the mean livelihood
assets are statistically and practically significant.
113
CHAPTER FIVE
SUMMARY, CONCLUSIONS AND RECOMMENDATIONS
General Overview
This chapter presents the summary, conclusions and recommendations
of the study. It also suggests areas that future studies should be focused.
Summary
Increase in urban poverty is accompanying urbanisation process and
poverty is gradually creeping into the urban areas the world-over.
Unemployment, high prices of food commodities and food insecurity are but a
few of the effects of the urbanisation challenges. Many of these urban dwellers
as a remedy to these challenges have taken to all kinds of income generating
activities especially vegetable production due to its potential profitability.
Vegetable production offers opportunities to city dwellers nutritionally; it also
improves the socioeconomic development of these producers. Unfortunately,
the benefits of the vegetable production in terms of its effects on farmers’
livelihoods have not been empirically examined in the areas where these
vegetables are cultivated in the Kumasi metropolis.
The study broadly examines urban vegetable production and its effects
on farmers’ livelihoods in the Kumasi Metropolis in the Ashanti region of
Ghana. The study was guided by the following specific objectives:
114
1. describe the demographic characteristics of urban vegetable
farmers in the Kumasi Metropolis.
2. describe farm related characteristics of urban vegetable farmers in
the Kumasi Metropolis.
3. determine production and marketing challenges of urban vegetable
farming.
4. examine farmers’ perceived level of effect of urban vegetable
production on their livelihoods.
5. determine whether there are significant differences in the farmers’
livelihood assets as a result of their urban vegetable production.
Based on the specific objectives of the study, structured and validated
interview schedule was used to elicit information from 300 vegetable farmers
in the study area. Measures of central tendency, descriptive statistics, cross-
tabulations, Kendall’s coefficient of concordance, multiple response and
Analysis of Variance (ANOVA) were the statistical tools used to analyse the
data. The summary of the major findings included the following:
Sex Distribution of the respondent revealed that men dominate the
vegetable production industry generally. Marketing of urban vegetable
produce is however the prerogative of women.
The age distribution of the respondents also revealed that the majority
of them were youth. Members of this age structure are expected to be active
and stronger than the ageing and the aged.
On the educational status of respondents, the study results revealed that
about 60 percent of the farmers had either primary or Junior High School
(JHS) education.
115
The greater proportion (114.0 ha) of land available to the respondents
was put to vegetable production. The majority of the respondents were also
small scale producers who cultivated land belonging to either the government
or private individuals.
The study result revealed that the majority of the farmers sourced their
irrigation water from both dug- out wells and streams. The use of watering
cans was the irrigation method employed by 78.3 percent of the farmers
The majority of the respondents sourced their agricultural extension
information from colleague farmers and input dealers rather than agricultural
extension agents. Farmers (87 percent) also have limited access to credit
facilities from financial institutions and training on vegetable production.
The results of the study also indicated that the cost of planting
materials and agro-chemicals were high.
The total land area under vegetable production was 114.0 ha with
farmers cultivating more leafy vegetables. Generally, the seasonal average
productivity of land/ha for the majority of the cultivated crops was low.
Vegetable farmers market their farm produce through middle men and
at farm gate level leading to the due to the exploitation by prospective buyers.
The study results revealed that there was agreement among a little over
half (51 percent) of the farmers on the ranking of vegetable production
challenges they encountered. On the contrary, 59.2 percent disagreed on the
ranking of the vegetable marketing challenges they faced.
Generally, farmers’ perceived level of effect of urban vegetable
production on their livelihoods was ‘low’ except for natural and physical
capitals which recorded ‘moderately high’ impact.
116
The results indicated that there were statistically significant differences
among the mean livelihood capitals of the farmers at 0.05 alpha level. The
magnitude of association (eta squared) value (0.2) further revealed that these
differences were of much practical importance.
Conclusions
From the findings of the study, the following conclusions are drawn:
1. Urban vegetable producers in the Kumasi metropolis are
predominantly male youth with basic level of education.
2. Vegetable production in the Kumasi metropolis is done mainly on
small scale and usually on government and or private lands.
3. The greater proportion of the available land to farmers is put to
vegetable production
4. The majority of the farmers’ source irrigation water from dug-out
wells and steams. Farmers also depend on watering cans for
irrigation.
5. Generally, vegetable producers in the metropolis have limited
access to agricultural extension information, credit facilities and
training on vegetable production.
6. The cost of planting materials and agro-chemicals is expensive to
the vegetable farmers
7. The seasonal average productivity (yield/ha) of urban vegetable
farmers in the study area is generally low.
8. The majority of the vegetable farmers market their farm produce
through middle men and at farm gate level.
117
9. The most important production challenges faced by vegetable
farmers in the Kumasi metropolis are high input cost, lack of credit
facilities and incidence of pests and diseases.
10. The level of contribution of urban vegetable production to the
farmers’ livelihoods in the Kumasi metropolis is generally ‘low’.
However, it impacted ‘moderately high’ on their natural and
physical capitals.
11. Through vegetable production, farmers in the Kumasi metropolis
can improve on their natural and physical capital assets more and
significantly than information, financial, human and social capital
assets.
Recommendations
Based on the study results, the following recommendations are
suggested:
1. Farmers should form Farmer Based Organisations (FBOs) such as
production and consumer co-operatives. The formation of these
farmer associations is a mechanism by which several interventions
could be established. These associations should be effective and
strengthened to provide farmers with varied opportunities such as
assisting them to save money towards bulk purchasing of farm
inputs to benefit from discounts and also sell their farm produce
collectively. This would enhance their bargaining power and
protect them against exploitation from prospective buyers. FBOs
would help address common challenges confronting members
118
including high input cost, lack of credit facilities and inadequate
marketing avenues. This is because a group’s ability to access
certain facilities such as agricultural extension services, inputs,
credits and marketing is usually stronger than individual.
2. The functions of the Farmer Based Organisations (FBOs) should be
diversified to include training of its members on new technologies,
innovations and modern agronomic practices to increase
productivity for more income and better livelihoods for its
members. The training must also encompass ways to use their
existing physical capital more effectively and efficiently
(information capital), or shared with other farmers (social capital)
for increased productivity. Farmers’ associations are very
important sources of new technologies and also provide the
platform for their diffusion.
3. Financial capital should be made easily accessible to farmers
through formal and informal farmer based associations to improve
the incomes and businesses of members and also offer them the
opportunity to invest in physical capital to increase their scale of
production.
4. Agricultural Extension Agents (AEAs) of the Ministry of Food and
Agriculture (MoFA) should endeavour to develop and improve
contacts with farmers by strengthening Research-Extension-Farmer
Linkage to bridge the existing agriculture extension information
gap. This will enable farmers to adequately access agricultural
119
extension information to update their knowledge and skill levels,
increase their productivity levels and better their livelihoods.
5. The government through MoFA and other stakeholders should
design specific training programmes such as Farmer Field Schools
(FFS), Farmer Field Days (FFD) and Workshops targeted
especially at vegetable farmers aimed at updating them on new
agronomic packages leading to change in knowledge, attitude,
skills and aspirations of the farmers towards increased production
and food security.
Suggestions for Future Research
Whilst the objectives of the study were well realised, it is suggested
that future research should be directed towards:
1. The effective and efficient use of farmers’ livelihood capitals in
terms of natural, information, financial, human, social and physical
capitals.
2. Replication of the study in the study area after a period of time to
assess the trend of impact of urban vegetable production on
farmers’ livelihoods.
120
REFERENCES
Abaidoo, R.C., Keraita, B., Amoah, P., Drechsel, P., Bakang, J., Kranjac-
berisavljevic, G., et al. (2009). Safeguarding Public Health Concerns
Livelihoods and Productivity in Wastewater Irrigated Urban and
Periurban Vegetable Farming.
Adam, M. (2001). Definition and Boundaries of the Peri-urban Interface:
Patterns in the Patchwork. In: P., Drechsel, & D., Kunze (eds) Waste
Composting for Urban and Peri-urban Agriculture: Closing the Rural-
Urban Cycle in Sub-Saharan Africa. CABI Publishing, Wallingford,
pp. 193-208.
Altieri, M.A., Companioni, N., Canizares, K., Murhpy, C., Rosset, P.,
Bourque, M., et al. (1999). The greening of the ‘barrios’: urban
agriculture for food security in Cuba. Agriculture and Human
Values 16 (2): 131-140.
Amis, P. (2002). Thinking About Chronic Urban Poverty. Chronic Poverty
Research Centre (CPRC) Working paper No.12. University of
Birmingham, United Kingdom
Akaba, S. (2008). Household food security and perceived improvement in
livelihood benefits of vegetable producers in the Ketu District of the
Volta Region of Ghana
Armar-Klemesu, M. & Maxwell, D. (1998). Urban Agriculture in Greater
Accra Metropolitan Area. Project 003149. Final report to IDRC.
Nouguchi Memorial Institute for Medical Research, University of
Ghana.
121
Ary, D., Jacobs, L.C. & Razavieh, A. (2002). Introduction to Research in
Education. Sixth ed. Belmont CA: Wadsworth.
Bailkey, M & Nasr, J. (2000). ‘From Brownfields to Greenfields: Producing
Food in the North American Cities.’ Community Food Security News
Fall/Winter: pp 6-8.
Baud, I. S. A. (2000). Coping with globalization. The need for research
concerning the local response to globalization in developing countries.
Den Haag, RAWOO.
Best, J.W. & Kahn, J.V. (1995). Research in Education. Prentice- Hall of India
Private Limited, M-97, Connought Circus New Delhi- 110001.
Blake, B. & Kasanga, K. (1997). Kumasi Natural Resources Management
Research Project, Inception Report; NRI, National Resource Institute,
The University of Greenwich, U.K and University of Science and
Technology, Kumasi, Ghana.
Borg, W.R. & Gall, M.D. (1989). Educational research: An introduction. (5th
ed.) New York: Longman.
Bosompim, M. (2006). Cocoa farmers’ perceived Impart of the cocoa high
technology programme on their livelihoods in the Eastern Region of
Ghana.
Bourquier, P. (2004). ‘Analyzing Urbanization in Sub-Saharan Africa’. In
Tony Champion and Graeme Hugo,eds., New Forms of Urbanization.
Beyond the Rural-Urban Dichotomy. Aldershot, UK: Ashgate
Publishing, pp 133-150.
Braman, S. (1989). ‘Defining Information: An Approach for Policy Makers’,
Telecommunications Policy, Vol. 13 No. 3. Pp. 233-242 A
122
Brooks, N. (2003). ‘Vulnerability, risks and adaptation: A conceptual
framework’. Working paper 38, Tyndall Centre for Climate Change
Research. University of East Angelia: Norwich.
Butler, L. & Marone, D.M., (eds) (2002). Urban and agricultural communities:
Opportunities for common ground. Council for Agricultural Science
and Technology. Ames Iowa.
Cepal, D. (1999). Panorama Social de America Latina, LC/G. 2050-P,
Santiagode Chile.
Chambers, R. & Conway, G. (1992). Sustainable Rural Livelihoods: Practical
Concepts for the 21st century, Brighton, Institute of Development
Studies Discussion Papers, No. 296. Cambridge.
Cofie, O.O, van Veenhuizen, R., & Drechsel, P. (2003). Contribution of
urban and peri-urban agriculture to food security in Sub-Saharan
Africa. Paper presented at the Africa Day of the 3rd WWF in Kyoto,
17-3-2003.
Cohen, L. & Marion, L. (1995). Research Methods in Education. London:
Routledge.
Cohen, J. (1988). Statistical Power Analysis for the Behavioural Sciences,
Hillsdale, NJ: Erlbaum
Coleman, J. S. (1990). Foundations of Social Theory, Cambridge, Mass:
Harvard University Press.
Colosi (n.d.). Social Research Methods. . Retrieved September 29, 2010 from:
http://www.socialresearchmethods.
123
Cornish, G. A. & Aidoo, J. B. (2000). Informal Irrigation in peri-urban areas
of Kumasi, Ghana. Findings from an initial questionnaire survey:
Report 0D/TN 97 March 2000. HR Wallingford, UK, 41 pp.
Cornish, G.A, Aidoo, J. B. & Ayamba, I. (2001). Informal irrigation in the
peri-urban zone of Kumasi, Ghana. An analysis of farmer activity and
productivity. Report OD/TN 103, February 2001.DFID’s Water KAR
Project R7132.HR Wallingford, UK, 39 pp.
Cornish, G.A. & Lawrence, P. (2001). Informal irrigation in areas: A
summary of findings and recommendations, DFID’s Water KAR.
Danso, G., & Drechsel, P. (2003). The marketing manager in Ghana. Urban
Agricultural Magazine 9: 7.
Danso, G., Fialor, S.C. & Drechsel, P. (2002) Perceptions of organic
agriculture by urban vegetable farmers and consumers in Ghana.
Urban Agricultural Magazine 6: 23-24.
Danso, G., Drechsel, P., Wiafe-Antwi, T & Gyiele, L. (2002). Income of
farming system around Kumasi, Ghana. Urban Agriculture Magazine
7: 5-6.
Danso, G., Drechsel, P., Akinbolu, S. & Gyiele, L. (2003). Review of Studies
andLiterature on the Profitability and Sustainability of Urban and Peri-
urban Agriculture. Final Report (PR 25314) submitted to FAO, IWMI,
Accra. Danso, G., Drechsel, P., Wiafe-Antwi, T., Gyiele, L. 2002a.
Income of farming systems around Kumasi, Ghana. Urban Agriculture
Magazine 7: 5-6.
124
Das, S.K. (1997). Socio economics factors affecting the adoption of livestock
technologies by farmers in West Bengal India. Veterinary Journal.74
(3)233-236.
Denninger, M., Egero, B., & Lee-Smith, D. (1998). Urban food production:
a survival strategy of urban Households. Report of a Workshop on
East and Southern Africa. RELMA Workshop series 1. Regional
Land Management Unit (RELMA). Mazingira Institute, Nairobi.
DFID (1999). Sustainable livelihoods guidance sheets. Retrieved March 30,
2010 from http://www.livelihoods.org
DFID (2000). Sustainable livelihoods guidance sheets, London: Department
for International Development.
Drechsel, P. & Kunze, D. (1999). Synopsis from International Workshop on
Urban and Peri-urban Agriculture: Closing the Nutrient Cycle for
Urban Food Security and Environmental Protection, Accra, august
1999. Retrieved June 28, 2010 from http://www.CityFarmer.org
Drechsel, P., Danso, G. & Keraita, B. (2002). Soil nutrient depletion versus
environmental pollution: the dilemma of intensive urban agriculture.
Paper for ISCO 2002, Beijing, 26-31 May.
Drechsel, P., Giordano, M. & Gyiele, L. (2004). Valuing Nutrients in Soil and
Water: Concepts and Techniques with Examples from IWMI
Studies in the Developing World. IWMI Research Report 82,
Colombo.
Drechsel, P., Graefe, S., Sonou, M. & Cofie, O.O. (2006). Informal
irrigation in Urban West Africa: An Overview. IWMI Research
Report (in press).
125
Drechsel, P., Graefe, S. & Fink, M. (2007). Rural-urban food, nutrient and
water flows in West Africa, IWMI Research Report (in preparation).
Drechsel, P., Giordano, M. & Enters, T. (2005). Valuing Soil Fertility
Change: Selected Methods and Case Studies. In Natural Resources
Management in Agriculture: Methods for Assessing Economic and
Environmental Impacts, ed. B. Shiferaw, H.A. Freeman & S.M.
Swinton. Wallingford: ICRISAT-CABI. pp. 199-221.
Eaton, D. (2003). Recycling Urban Waste in Agriculture. Final Report.
APUGEDU project.
Egyir, I.S. & Beipuo, E.N. (2009). Strategic Innovations in Urban Agriculture,
Food Supply and Livelihood Support System performance in Accra,
Ghana.
Elashoff, J. (2000). nQuery Advisor Release 4.0, Statistical Solutions, Cork,
Ireland, Software for MS-DOS system.
Ellis, F. (2000). Rural livelihoods and Diversity in Developing Countries,
Oxford, Oxford University Press.
Erenstein, O., Moussa, M., Oswald, A. & Keijzer, P. (2004). Characterization
of peri-urban lowland use along an ecological and market access
gradient in West Africa. Abidjan, Cote d’Ivoire: West Africa Rice
Development Association (WARDA) –The Africa Rice Center.
Ezedinma, C. & Chukuezi, C. (1999). A Comparative Analysis of Urban
Agricultural Enterprises in Lagos and Port Harcourt, Nigeria.
Ezgiabher, A.G., Lee-Smith, D., Maxwell, D.G., Memon, P.A., Mougeot,
L.J.A., & Sawio, C.J. (1994). Cities Feeding People. An Examination
of Urban Agriculture in East Africa.
126
FAO (2002). Inter-agency Experiences and Lession. From the Furum
Operationilising Sustainable Livelihoods Approaches. Pontigano
(Siena) 7-11 March, 2000. FAO.
FAO (1998). Urban and peri- urban agriculture: policy issues and FAO’s role.
COAG 99/13. Rome: FAO.
Faruqui, N. I. Niang, S. & Redwood, M. (2004). Untreated wastewater use in
market gardens; a case study of Dakar, Senegal. In Wastewater Use in
Irrigated Agriculture: Confronting the Livelihood and Environmental
Realities (ed). C., Scott, N.I., Faruqui, L., Raschid. Wallingford:
IWMI- IDRC-CABI. pp. 113-125.
Few, R., Ahern, M., Matthies, F & Kovats, S. (2004). Floods, Health and
Climate Change: A Strategic Review, Working Paper No. 63. Tyndall
Centre for Climate Research. University of East Anglia, Norwich,
Norfolk, 24 pp
Flynn-Dapaah, K. (2002). Land negotiations and tenure relationships:
Access land for urban and agriculture in the Sub-Saharan Africa. CFP
Report Series 36. IDRC: Ottawa.
Folke, C., Carpenter, S., Elmqvist, T., Gunderson, L., Holling, C.S., & Water,
B. (2002). “Resilience and sustainable development: building adaptive
capacity in a world of transformation”. Ambio 31, No.5.
Freeman, D.B. (1999). A city of farmers: informed urban agriculture in the
open-spaces of Nairobi, Kenya. Montreal: Mc Gill-Queen’s
University Press.
127
Freeman, D.B. (1991). A city of farmers: informal urban agriculture in the
open spaces of Nairobi, Kenya. McGill-Queens University Press,
Montreal, QC, Canada.
Frey, W.H. & Zimmer, Z. (2001). Defining the city. In: R. Paddish (Ed) Hand
book of Urbook Studies (pp14-35). London: SAGE Publications.
Gbireh, Z. A. (1999). Development of urban and peri-urban irrigation for
food security within and around Accra Metropolitan Area: FAO
Technical Report (unpublished).
Gerstl, S. (2001). The economic cost and impact of home gardening in
Ouagadougou, Burkina Faso. PhD dissertation, university of Basel,
Switzerland. Retrieved July 31, 2010 from http://www.sti.unibas.ch
Ghana Statistical Service (2002). 2000 Population and Housing Census,
summary report of final results. Accra, Ghana: Ghana Statistical
Service
Ghana Statistical Service (2008). Report of the Fifth Round of the Ghana
Living Standards Survey (GLSS). September.
Glass, G.V. & Hopkins, B.K. (1984). Statistical Methods in Education and
Psychology (2nd ed.), New York: Prentice-Hall.
Gockowski, J. & Ndoumbé, M. (2004). “The Adoption of Intensive
Monocrop Horticulture in Southern Cameroon”, Agricultural
Economics, Vol. 30, pp. 195–202.
Hasna, M.K. (1998). NGO Gender Capacity in Urban agriculture: Case study
from Harare (Zimbabwe), Kampala (Uganda) and Accra (Ghana).
Cities feeding people series. Report 21.
128
Hintze, J. (2000). PASS 2000, Number Cruncher Statistical System,
Kaysville, UT, Software for MS-DOS system.
Huerta, J.M., & Lugo, D. (1996). FCL Program Impact on Extension
Volunteers and Leaders in Puerto Rico. Impact Evaluation of Family
Community Leadership Conference San Juan, Puerto Rico: pp. 1-11
International Agency for Research on Cancer (2003). Handbooks on Cancer
Prevention. Vol. 8: Fruit and Vegetable. Lyon, France: IARC Press.
Institute of Statistical Social and Economic Research (2002). The State of
Ghanaian Economic. The Institute of Statistical Social and Economic
Research (ISSER).University of Ghana, Legon. University Press.
International Water Management Institute (2006). Irrigated Urban Vegetable
Production in Ghana. Characteristics, Benefits and Risks. IWMI-
RUAF-CPWF.
Jacobi, P., Amend, J., Kiango, S. (2000). Urban agriculture in Dar es Salaam:
providing for an indispensable part of the diet. In Growing Cities,
Growing Food: Urban Agriculture on the Policy Agenda, ed. N.
Bakker, M. Dubbeling, S. Gündel, U. Sabel-Koschella and de
Zeeuw, H. Deutsche Stiftung für Internationale Entwicklung (DSE).
Feldafing/ Germany: Zentralstelle für Ernährung und Landwirtschaft.
pp. 257-283.
Kamara, S. & Denkabe, A. (1993). Gender in development. Freedom
puplications. Accra, Ghana. 35pp.
129
Kay, M. (2001). Smallholder irrigation technology: prospects for sub-Saharan
Africa. International Programme for Technology and Research in
Irrigation and Drainage, Knowledge Synthesis Report No.3. Rome,
IPTRI/FAO.
Keraita, B. (2002). Waste water use in urban and peri-urban vegetable farming
in Kumasi, Ghana. Unpublished Msc. Thesis. Wageningen University,
The Netherlands.
Keraita, B., Danso, G. & Drechsel, P. (2003). Urban irrigation methods and
practices in Ghana and Togo. Urban Agriculture Magazine 10: 6-7.
Keraita, B., Drechsel, P., Huibers, F., & Rachid-Sally, L. (2002). Wastewater
use in informal irrigation in Urban and Peri-Urban areas of Kumasi,
Ghana. Urban Agricultural Magazine 8: 11-13.
Keraita, B., Drechsel, P. & Konradsen, F. (2007). Safer options for irrigated
urban farming. LEISA Magazine 23(3) 26-28. September 2007.
Keraita, B., Drechsel, P. & Amoah, P. (2003). Influence of urban wastewater
on stream water quality and agriculture in and around Kumasi, Ghana.
Environments and Urbanisation 15(2): 171-178.
Keraita, B., Drechsel, P. & Raschid-Sally, L. (2002) Wastewater use in
informal irrigation in urban and peri-urban areas of Kumasi, Ghana.
CTA/ETC-RUAF/CREPA, Atelier International sur la Réutilisation
des Eaux Usées en Agriculture Urbaine. 3-8 June 2002, Ouagadougou.
Final Report, p. 124-141.
Kessler, A., Streiffeler, F. & Obuobie, E. (2004). Women in Urban
Agriculture in West Africa. Urban Agriculture Magazine 12: 16-1.
130
KNRMP (1999). Kumasi Natural Resources Management Research Project,
KNUST/NRI/DFID.
Kumasi Metropolitan Assembly (2006). Retrieved September 29, 2010 from:
http://www.kma.ghanadistricts.gov.gh/
Kyessi, A. (1997). City Expansion and Urban Agriculture in Dar es Salam:
Lessons for Planning. In: Journal of Building and Land Development.
Dar es Salaam, Tanzania, Vol. 4, No. 2: 28-37.
Lee-Smith, D., Manundu, M., Lamba, D., & Gathuru-Kuria, P. (1987).
Urban food production and the cooking fuel situation in urban
Kenya- National report: results of a 1985 national survey. Nairobi:
Mazingira Institute.
Lepar, M.L.A & Ehui, S. (2003). Adoption of dual-purpose forages: some
policy implications. Tropical Grasslands 37:284-291.
Lewu, F.B. & Assefa, Y. (2009). Farmers Knowledge in the cropping systems
of northern KwaZulu- Natal South Africa. Current challenges and
solutions for sustainable future food production. African Journal
Research 4 (11):148-153.
Macfarlane, T. (2003). Sample size determination for research projects
(Editorial). Journal of Orthodontics. 30(2): 99-100.
Machlup, F. & Mansfield, U. (Eds) (1983). The Study of Information:
Interdisciplinary Messages. New York: Wiley.
MacMillan, J.J. & Schumacher, S. (1989). Research in education: A
conceptual introduction. New York: Harper Collins.
Madden, J. P. & Chaplowe, S.G. (ed) (1997). ‘For All Generations: Making
world Agriculture more sustainable’. Glendale: O.M. Publishing.
131
Martin, W. J. (1995). Global Information Society, Aldershot, Aslib
Gower. 233p.
Maxwell, D. (1998). The political Economy of Urban Food Security in Sub-
Saharan Africa. FCND Discussion paper No. 41, IFPRI, Washington.
Mbiba, B. (1994). Institutional responses to uncontrolled urban cultivation in
Harare: Prohibitive or accommodative? Environment and
Urbanization 6 (1):188-202.
Moustier, P., Moumbélé, M. & Huat, J. (2004). La gestion concertée et
durable des filières maraîchères urbaines. In Développement durable
de l’agriculture urbaine en Afrique francophone. Enjeux, concepts et
méthodes, (ed.) O. Smith, P. Moustier, L.J.A. Mougeot & S.A. Fall,
CIRAD, Montpellier and IDRC, Ottawa, pp. 79-113.
Mougout, L. (1993). “Urban Food Self-Reliance: Significance and Prospects,”
in Farming in the City: The Rise of Urban Agriculture. Reports
Vol.21, No.3. Ottawa: IDRC.
Nabila, J.S. (1988). Urbanization in Ghana, Accra: Population Impact Project
(PIP). Legon: University of Ghana
Nugent, R. (1999). A framework for measuring the sustainability of urban
agriculture. In: Koc M. et al. (eds), For hunger-proof cities: sustainable
urban food systems (Ottawa: IDRC), pp 95-99.
Nwana, O.C. (1992). Introduction to educational research for student teachers:
Designing the study. Nigeria: Heineman Educational Books (Nig.)
PLC.
132
Obosu-Mensah, K. (1999). Food Production in Urban Areas. A study of
Urban Agriculture in Accra, Ghana. Ashgate, Publishing Aldershot,
UK, England. 227pp.
Oboubie, F., Drechsel, P., Danso, G., & Rachid-Sally, l. (2004). Gender in
open-space irrigated urban vegetable farming in Ghana. Urban
Agricultural Magazine 12: 13-15.
Obuobie, E., Keraira, B., Danso, G., Amoah, P., Cofie, O.O., Raschid-Sally,
L., et al. (2006). Irrigated urban vegetable production in Ghana:
Characteristics, benefits and risks. IWMI-RUAF-CPWF,
Accra,Ghana: IWMI, 150 pp.
Obwona, M. B. (2000). Determinants of Technical Efficiency Differentials
among Small and Medium Scale Farmers in Uganda: A case of
Tobacco Growers. Final Report, AERC Workshop, Kenya.
Ojo, O.D., Connaughton, M., Kintomo, A.A., Olajide-Taiwo, L.O. &
Afaloyan, S.O. (2010). Assessment of irrigation Systems for dry
season vegetable production in urban and peri-urban zones of Ibadan
and Lagos, Southwestern Nigeria.
Okorley, E.L. & Kwarteng, J.A. (2002). An investigation into the use of
pesticides by urban vegetable growers in the central region of
Ghana. Conference paper: SADAOC Conference Internationale de
Bamako les 9-11 September 2002.
Pallant, J. (2001). SPSS Survival Manual: A Step-by Step Guide to Data
Analysis Using SPSS for Windows (version 10). Crow’s Nest, New
South Wales: Allen & Unwin, Autralia. Project R7 132, Report OD
144, HR Willingford, Willingford, UK, 54pp.
133
Poate, C.D. & Daplyn, P. F. (1993). Data for Agrarian Development. Wye
Studies in Agricultural and Rural Development, Cambridge.
Cambridge University Press.
Postel, S. (2001). Growing more food with less water. Scientific American,
February 2001, pp 34-37.
Rakodi, C. (1999). Poverty in the Peri-urban Interface. Natural Resources
Systems Programme (NRSP) Research Advances No. 5. London:
DFID.
Simon, D., McGregor, D. & Thompson, D. (2006). Contemporary
perspectives on the peri-urban zones of cities in developing countries.
In: The Peri-urban Interface: Approaches to sustainable natural and
human resource use (ed). D. McGregor, D. Simon & D. Thompson
London: Earthscan. pp. 3-17.
Smit, J., Ratta, A. & Nasr, J. (1996). Urban Agriculture: food, jobs, and
sustainable cities. Publications Series for Habitat II, Vol. 1. New York:
United Nations Development Programme (UNDP).
Stren, R. (1989). “Urban Local Government in Africa,” In: R. Stren & R.
White (eds.). African Cities in Crisis: Managing Rapid Urban
Growth. Boulder: West-view Press.
Tallaki, K. (2005). The pest control systems in the market gardens of Lome,
Togo. In: Mougout, L. (ed.). AGROPOLIS. The social, political and
environmental dimensions of urban agriculture. IDRC, Ottawa,
Earthcan, London, p. 51-67.
134
Tandia, M. (2002). Urban farming in a context of water scarcity. The case of
the Tel Zaatar market gardening site in Nouakchott (Mauritania).
African Cities (Special Issue), December 2002: 11-12.
United Nations Development Programme (UNDP). (1996). Urban Agriculture:
Food, Jobs and Sustainable Cities. Publication for Habitat II Series,
Vol.1. New York, USA.
United Nations Centre for Habitable Settlement (UNHCS) (1999). Global
Urban Indicators Database, Best Practice and Local leadership
Programme, Nairobi, Kenya.
U N C H S (2001).United Nations Centre for Human Settlement. The state of
the World’s Cities.
United Nations Population Division (2004) World Population Prospects: The
2003 Revision. Department of Economics and Social Affairs of the
United Nations Secretariat, New York, USA
United Nations (1995).World urbanization prospects: the 1994 revision. New
York.
Van den Berg, L. (1997). Market gardening, urban growth and sustainable use
of income generation on the Jos plateau, Nigeria. Scientific Report
Submitted to Netherlands-Israel Development Research Program, The
Netherlands.
Van den Berg, L. (2002). Urban agriculture between allotment and market
gardening: contributions to the sustainability of African and Asian
cities. In: The Sustainable City II. Urban Regeneration and
Sustainability, (ed). J.F. Brebbia, Martin-Duque & L.C. Wadhwa,
Southampton, Boston: WIT Press, pp. 946-959.
135
Wilbers, J. (2003). Urban Agriculture and Gender: Some key issues.
Discussions paper 1RUAF, ETC. 15pp.
World Bank (2000). Entering the 21st Century. World Developing Report
1999/2000. New York: Oxford University Press for the World Bank.
World Health Organisation (WHO) (2007). Guidelines for the safe use of
wastewater, excreta and greywater. Vol. 2: Wastewater use in
agriculture. World Health Organisation, Geneva, Switzerland.
Zakaria, S., Lamptey, M. G., & Maxwell, D. (1998). Urban Agricultural in
Accra: A Descriptive Analysis. In: M. Armar-Klemesu & D.
Maxwell (eds). Urban Agriculture in Greater Accra Metropolis Area.
Financial Report to IDRC.
Zalle, D.T. (1997). Le maraichage intra-urban á Bamako. Thėse de Doctorat.
Universitė du Mali, Institut Superieur de Formation et de Recherch
Appliquėe.
Zibrilla, I. & Salifu, A.A. (2004). Information gathering from urban and
communities with potential land areas for vegetable production.
Report submitted to Urban Agriculture Network- Northern Ghana. 30th
June 2004, 16 pp. (mimeo).
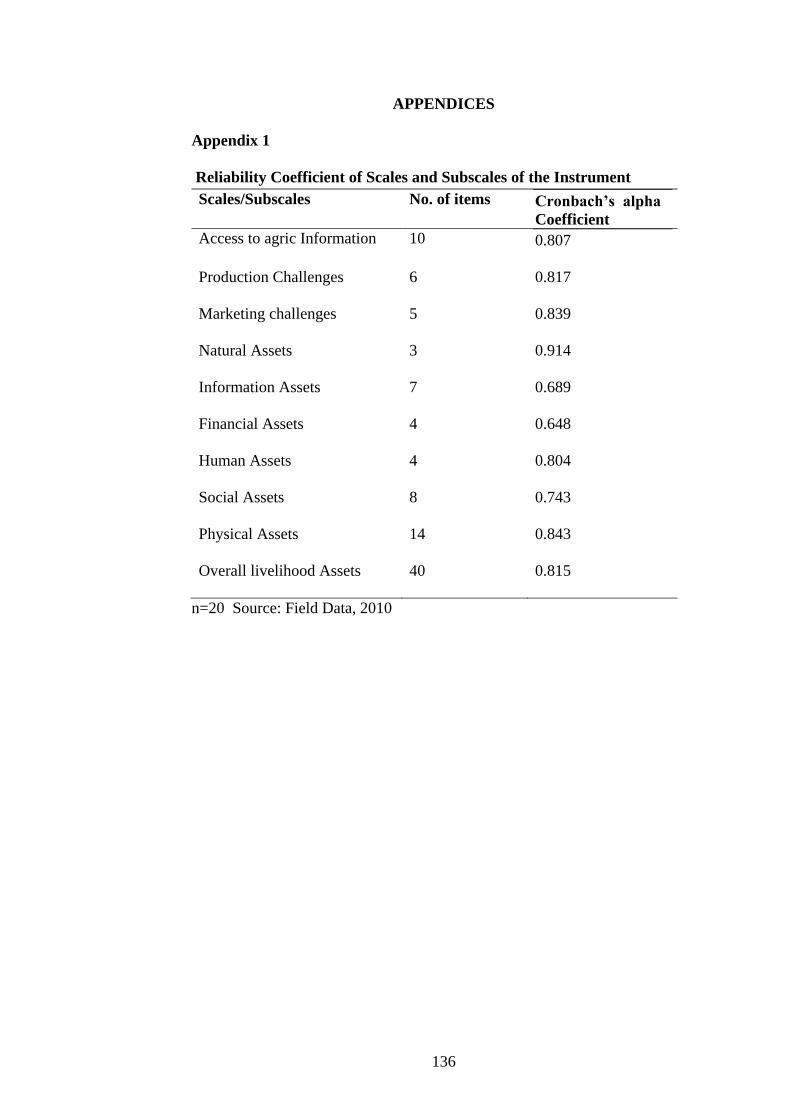
136
APPENDICES
Appendix 1
Reliability Coefficient of Scales and Subscales of the Instrument
n=20 Source: Field Data, 2010
Scales/Subscales No. of items Cronbach’s alpha
Coefficient
Access to agric Information 10 0.807
Production Challenges 6 0.817
Marketing challenges 5 0.839
Natural Assets 3 0.914
Information Assets 7 0.689
Financial Assets 4 0.648
Human Assets 4 0.804
Social Assets 8 0.743
Physical Assets 14 0.843
Overall livelihood Assets 40 0.815
137
Appendix 2
Rating of Vegetable Production Challenges Faced by Respondents
Production
challenges
Percentage Ratings
1 2 3 4 5 6
% % % % % %
High input cost 46.6 26.0 14.0 7.7 3.7 2.0
Incidence of
pests & diseases
7.7 14.0 31.0 25.3 13.3 8.7
Poor soil
fertility
4.7 15.7 8.7 15.7 24.0 31.3
Inadequate
water
9.3 7.7 14.0 21.7 26.0 21.3
Irrigation of
crops
11.3 9.0 9.0 18.3 24.7 27.7
Lack of credit
facilities
20.3 28.7 24.3 12.7 7.0 7.0
n = 300 1= Extremely Severe; 2 =Very Severe; 3 = Severe; 4 = Moderately
Severe; 5 =Slightly Severe; 6 = Not Severe; Source: Field Survey Data, 2010
138
Appendix 3
Ratings of Urban Vegetable Marketing Challenges Faced by the
Respondents
n = 300 1 = Very Severe; 2 = Severe; 3 =Moderately Severe; 4 = Slightly
Severe; 5 = Not severe; Source: Field Survey Data, 2010
Marketing
challenges
Percentage Ratings
1 2 3 4 5
% % % % %
Lack of cold
transport and storage
facilities
3.7 4.7 11.0 30.0 50.7
Fluctuating demand 56.7 24.3 11.3 6.7 1.0
Postharvest losses 4.3 22.7 36.7 22.0 14.3
Female dominance 10.3 12.7 16.3 33.0 27.7
Low price offer 25.3 36.0 25.7 7.3 5.7
139
Appendix 4
Farmers’ Perceived Level of Effect of Urban Vegetable Production on
their Natural Capital
Perceived
Contribution
to Natural
Capital
NI
f %
VL
f %
L
f %
H
f %
VH
f %
Increase in
land size for
production
135 45.0 7 2.3 23 7.7 110 36.7 25 8.3
Increase
access to
water for
irrigation
116 38.7 7 2.3 26 8.7 131 43.7 20 6.7
Increase in
yield
9 3.0 3 1.0 32 10.7 235 78.3 21 7.0
n= 300 Scale: 300 4 = Very High (VH); 4 = High (H); 2 = Low (L); 1 =
Very Low (L); 0 = No Improvement (NI). Source: Field Survey Data, 2010
140
Appendix 5
Farmers’ Perceived Level of Contribution of Urban Vegetable Production
to their Information Capital
Perceived
contribution
to
Information
Capital
NI
f %
VL
f %
L
f %
H
f %
VH
f %
Awareness
of land &
water
resources
management
150 23.3 27 9.0 40 13.3 72 24.0 11 3.7
Increase
your
decision
making
ability
13 4.3 10 3.3 29 9.7 237 79.0 11 3.7
Increase
access to
services
from change
agents
166 55.3 19 6.3 35 11.7 75 25.0 5 1.7
Awareness
of ICT to
access
information
256 85.3 8 2.7 12 4.0 22 7.3 2 0.7
Increase
access to
credit
facilities
260 86.6 5 1.7 9 3.0 23 7.7 3 1.0
Awareness
of farmers’
association
38 12.7 49 16.3 165 55.0 29 9.7 19 6.3
Increase
access to
marketing
avenues
160 53.3 12 4.0 44 14.7 80 26.7 4 1.3
n = 300 4 = Very High (VH); 4 = High (H); 2 = Low (L); 1 = Very Low (L);
0 = No Improvement (NI). Source: Field Survey Data, 2010
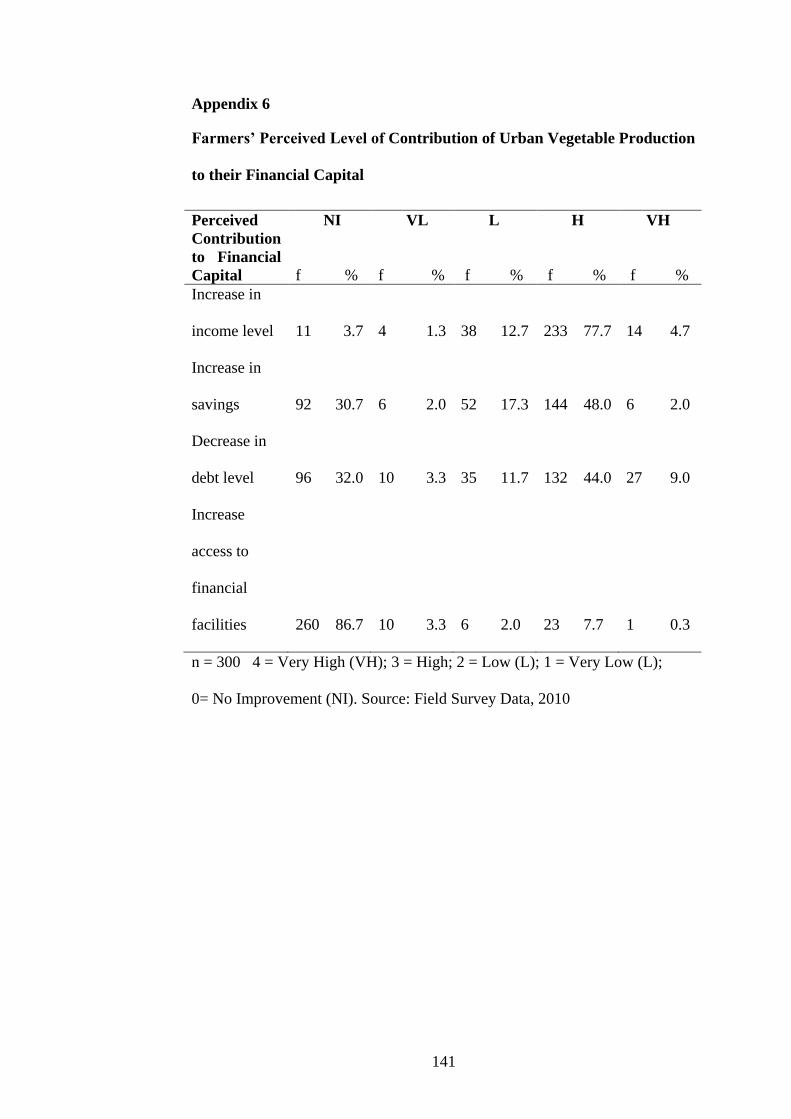
141
Appendix 6
Farmers’ Perceived Level of Contribution of Urban Vegetable Production
to their Financial Capital
n = 300 4 = Very High (VH); 3 = High; 2 = Low (L); 1 = Very Low (L);
0= No Improvement (NI). Source: Field Survey Data, 2010
Perceived
Contribution
to Financial
Capital
NI
f %
VL
f %
L
f %
H
f %
VH
f %
Increase in
income level
11 3.7
4 1.3
38 12.7
233 77.7
14 4.7
Increase in
savings
92 30.7
6 2.0
52 17.3
144 48.0
6 2.0
Decrease in
debt level
96 32.0
10 3.3
35 11.7
132 44.0
27 9.0
Increase
access to
financial
facilities
260 86.7
10 3.3
6 2.0
23 7.7
1 0.3
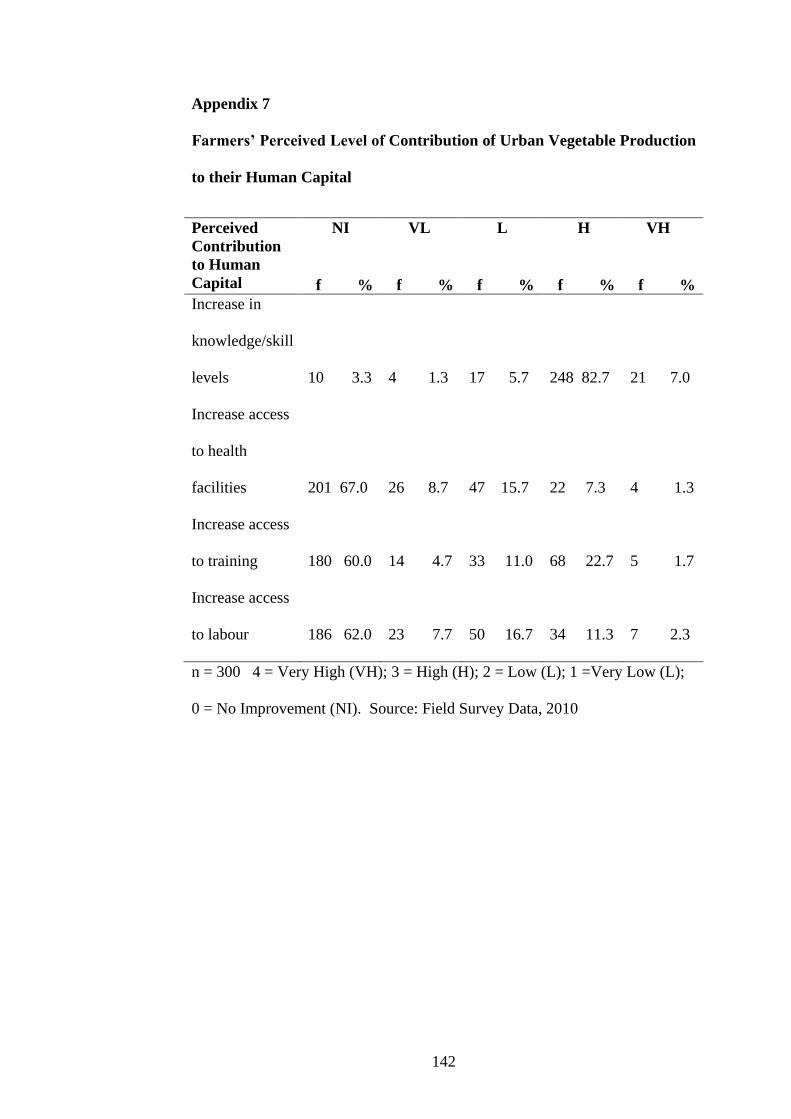
142
Appendix 7
Farmers’ Perceived Level of Contribution of Urban Vegetable Production
to their Human Capital
Perceived
Contribution
to Human
Capital
NI
VL
L
H
VH
f %
f %
f %
f %
f %
Increase in
knowledge/skill
levels
10 3.3
4 1.3
17 5.7
248 82.7
21 7.0
Increase access
to health
facilities
201 67.0
26 8.7
47 15.7
22 7.3
4 1.3
Increase access
to training
180 60.0
14 4.7
33 11.0
68 22.7
5 1.7
Increase access
to labour
186 62.0
23 7.7
50 16.7
34 11.3
7 2.3
n = 300 4 = Very High (VH); 3 = High (H); 2 = Low (L); 1 =Very Low (L);
0 = No Improvement (NI). Source: Field Survey Data, 2010
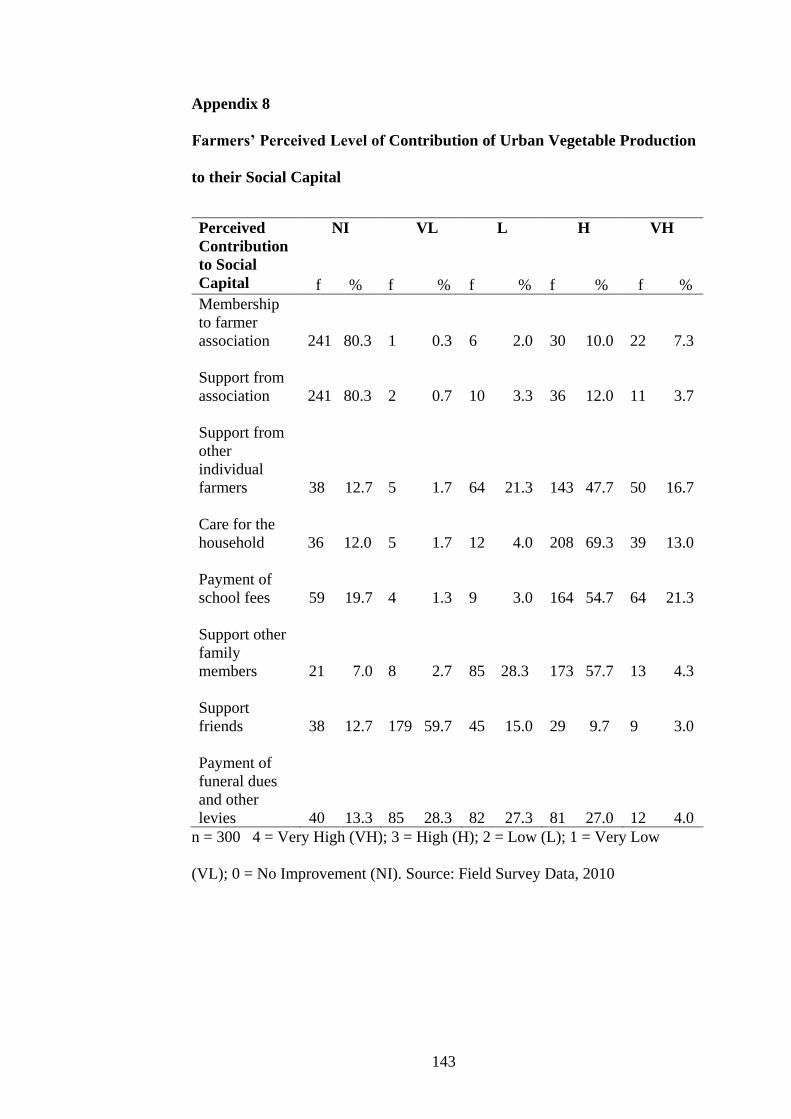
143
Appendix 8
Farmers’ Perceived Level of Contribution of Urban Vegetable Production
to their Social Capital
Perceived
Contribution
to Social
Capital
NI
VL
L
H
VH
f %
f %
f %
f %
f %
Membership
to farmer
association
241 80.3
1 0.3
6 2.0
30 10.0
22 7.3
Support from
association
241 80.3
2 0.7
10 3.3
36 12.0
11 3.7
Support from
other
individual
farmers
38 12.7
5 1.7
64 21.3
143 47.7
50 16.7
Care for the
household
36 12.0
5 1.7
12 4.0
208 69.3
39 13.0
Payment of
school fees
59 19.7
4 1.3
9 3.0
164 54.7
64 21.3
Support other
family
members
21 7.0
8 2.7
85 28.3
173 57.7
13 4.3
Support
friends
38 12.7
179 59.7
45 15.0
29 9.7
9 3.0
Payment of
funeral dues
and other
levies
40 13.3
85 28.3
82 27.3
81 27.0
12 4.0
n = 300 4 = Very High (VH); 3 = High (H); 2 = Low (L); 1 = Very Low
(VL); 0 = No Improvement (NI). Source: Field Survey Data, 2010
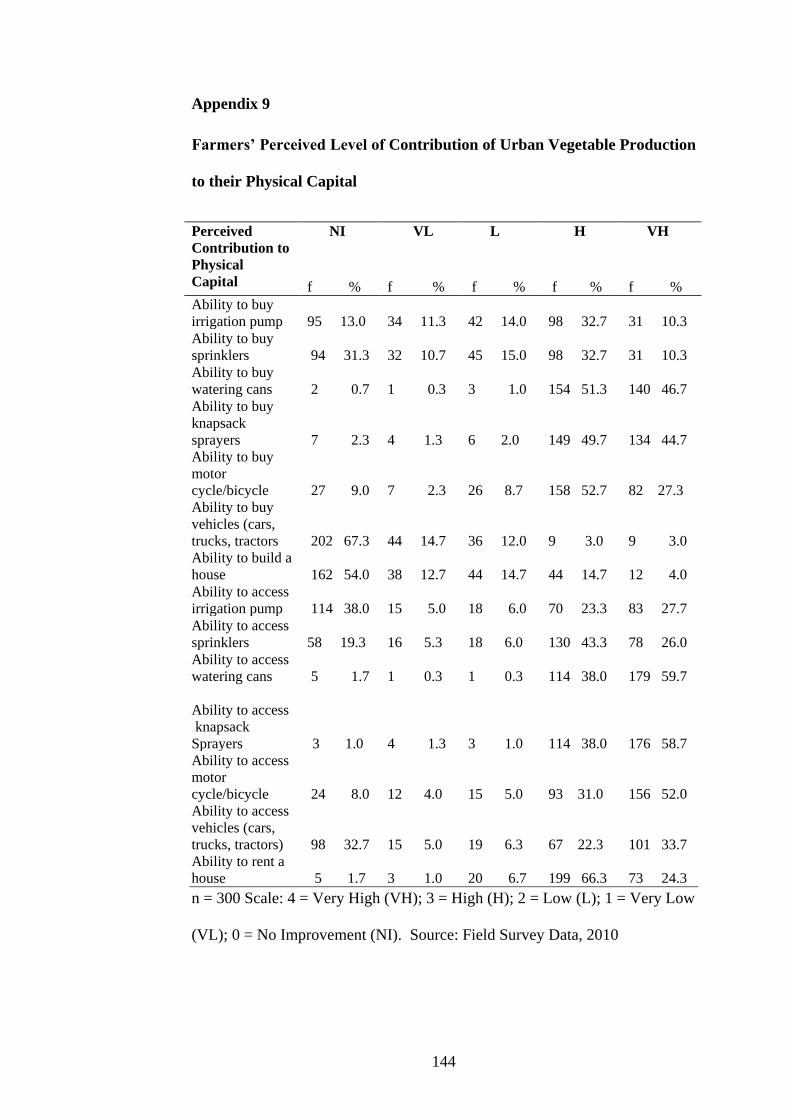
144
Appendix 9
Farmers’ Perceived Level of Contribution of Urban Vegetable Production
to their Physical Capital
Perceived
Contribution to
Physical
Capital
NI
VL
L
H
VH
f %
f %
f %
f %
f %
Ability to buy
irrigation pump
95 13.0
34 11.3
42 14.0
98 32.7
31 10.3
Ability to buy
sprinklers
94 31.3
32 10.7
45 15.0
98 32.7
31 10.3
Ability to buy
watering cans
2 0.7
1 0.3
3 1.0
154 51.3
140 46.7
Ability to buy
knapsack
sprayers
7 2.3
4 1.3
6 2.0
149 49.7
134 44.7
Ability to buy
motor
cycle/bicycle
27 9.0
7 2.3
26 8.7
158 52.7
82 27.3
Ability to buy
vehicles (cars,
trucks, tractors
202 67.3
44 14.7
36 12.0
9 3.0
9 3.0
Ability to build a
house
162 54.0
38 12.7
44 14.7
44 14.7
12 4.0
Ability to access
irrigation pump
114 38.0
15 5.0
18 6.0
70 23.3
83 27.7
Ability to access
sprinklers
58 19.3
16 5.3
18 6.0
130 43.3
78 26.0
Ability to access
watering cans
5 1.7
1 0.3
1 0.3
114 38.0
179 59.7
Ability to access
knapsack
Sprayers 3 1.0
4 1.3
3 1.0
114 38.0
176 58.7
Ability to access
motor
cycle/bicycle
24 8.0
12 4.0
15 5.0
93 31.0
156 52.0
Ability to access
vehicles (cars,
trucks, tractors)
98 32.7
15 5.0
19 6.3
67 22.3
101 33.7
Ability to rent a
house
5 1.7
3 1.0
20 6.7
199 66.3
73 24.3
n = 300 Scale: 4 = Very High (VH); 3 = High (H); 2 = Low (L); 1 = Very Low
(VL); 0 = No Improvement (NI). Source: Field Survey Data, 2010
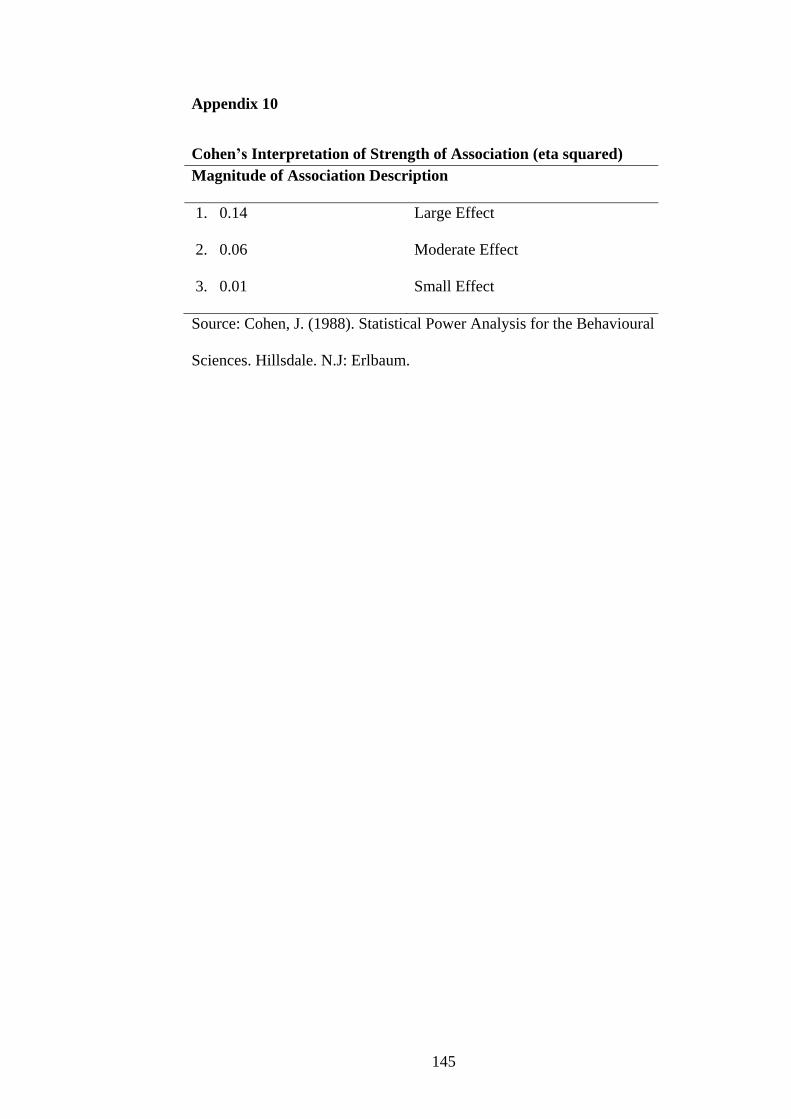
145
Appendix 10
Cohen’s Interpretation of Strength of Association (eta squared)
Magnitude of Association Description
1. 0.14 Large Effect
2. 0.06 Moderate Effect
3. 0.01 Small Effect
Source: Cohen, J. (1988). Statistical Power Analysis for the Behavioural
Sciences. Hillsdale. N.J: Erlbaum.
146
Appendix 11
UNIVRSITY OF CAPE COAST
DEPARTMENT OF AGRICULTURAL ECONOMICS AND
EXTENSION
URBAN VEGETABLE FARMING AND ITS EFFECTS ON FARMERS’
LIVELIHOODS IN THE KUMASI METROPOLIS OF ASHANTI
REGION OF GHANA
STRUCTURED INTERVIEW SCHEDULE FOR FIELD DATA
COLLECTION
Any information you provide will be kept strictly confidential. It is mainly for
academic purposes and only pooled results will be reported or published to
improve the vegetable enterprise in the Kumasi Metropolis.
INSTRUCTION: Please tick [√] in the boxes provided or write your answers
where applicable to answer the questions.
SECTION A – BACKGROUND INFORMATION
1. Community Name . . . . . . . . . . . . . . . . . . . . . . . . . . . . . . . . . . . . . . . . . . . .
2. Sex: Male [ ] Female [ ]
3. Please indicate your age at your last birthday in years . . . . . . . . . . . . . . . . . .
4. What is your highest level of formal education?
No formal education [ ] Primary education [ ] Junior High School [ ]
Senior High School [ ] General Certificate of Education [ ] Tertiary [ ]
Others (specify) . . . . . . . . . . . . . . . . . . . . . . . . . . . . . . . . . . . . . . . . . . . . .
5. Marital status: Single [ ] Married [ ] Divorced [ ] Separated [ ]
Widowed [ ]
6. What is your ethnicity? . . . . . . . . . . . . . . . . . . . . . . . . . . . . . . . . . . . . . . .
7. What is the size of your household dependants? . . . . . . . .. . . . . . . . . . . . .
147
8. How long have you been growing vegetables?
1-3years [ ] 4-7years [ ] 8-11years [ ] 12-15years [ ]
Above 16 years [ ]
9. Do you belong to a farmer association?
Yes [ ]: Give the name . . . . . . . . . . . . . . . . . . . . . . . . . No [ ]
10. If ‘Yes’ to Q 9 what major benefit(s) do you receive for belonging to this
association?
Farm inputs [ ] Credit [ ] Transport services [ ]
Marketing of produce [ ] None [ ] Others (specify) . . . . . . . . . . . . .
SECTION B: FACTORS OF PRODUCTION
A. Land
11. What is your land tenure?
Family land [ ] Own land [ ] Lease land [ ] Private land [ ]
Government land [ ] Stool land [ ] Others (specify) . . . . . . . . . . . .
12. What is the tenancy agreement on the land you are using for the vegetable
production?
Rental payment [ ] Abunu [ ] Abusa [ ] No tenancy agreement [ ]
13. How easy or difficult it is to acquire land for vegetable production in your
Community?
Very difficult [ ] Difficult [ ] Easy [ ] Very easy [ ]
14. What is the total land available (acres) to you or household for farming?.
. . . . . . . . . . . . . . .. . . . . . . . . . . . . . . . . . . . . . . . .. . . . . . . . . . .. . .. .
15. How many acres of the total land do you put to vegetable production each
season? . . . . . . . . . . . . . . . . . . . . . . . . . . . . . . . . . . . . . . . . . . . . . . . . .
B. Planting Materials/seeds
16. What is the source of your planting materials/seeds?
Certified seed producers [ ] Input dealers [ ] Market providers [ ]
Other farmers [ ] Extension agent [ ] Seeds saved [ ]
Others (specify) . . . . . . . . . . . . . . . . . . . . . . . . . . . . . .. . . . . . . . . .
17. Why did you choose this source?
Reliable source [ ] Proximity [ ] Good quality [ ] Others (specify)
. . . . . . . . . . . . . . . . . . . . . . . . . . . . . . . . . . . . . . . . . . . . . . . . . . . . . . . .
148
18. How much do you spend on planting materials per season? GH¢ . . . . . . . .
19. Please, indicate how you will rate your total cost of planting material/seed
per season?
Very low [ ] Low [ ] High [ ] Very high [ ]
C. Agro-Chemicals
20. What type of fertilizer do you use on your vegetable production?
Inorganic fertilizer [ ] Organic fertilizer [ ] Inorganic & Organic
fertilizers [ ] None [ ]
21. What are the source(s) of the fertilizers used on your vegetable farm?
Input dealers [ ] Market providers [ ] Association(s) [ ]
Livestock farms [ ] Poultry farms [ ] Input dealers & Poultry farms [ ]
Market providers & Poultry farms [ ]
22. What other agro-chemical(s) do you use on your vegetable farm?
Pesticides [ ] Fungicides [ ] Nematicides [ ] Herbicides [ ]
Others (specify) . . . . . . . . . . . . . . . . . . . . . . . . . . . . . . . . . . . . . . . .
23. What is the source(s) of the agro-chemicals mentioned above?
Input dealers [ ] Market providers [ ] Association(s) [ ]
Input dealers & Market providers [ ]
24. What is the total cost of agro-chemicals used (fertilizers & other
chemicals) per season? GH¢ . . . . . . . . . . . . . . .
Note: Add all the individual cost of agro-chemicals mentioned by farmer
plus transport
25. How will you rate the total cost of agro-chemicals per season?
Very low [ ] Low [ ] High [ ] Very high [ ]
D. Water for Irrigation
26. From which source(s) do you get water to irrigate your vegetable crops?
Stream [ ] Tap water [ ] Rainfall [ ] Drains [ ]
Dug- out- well [ ] Others (specify) . . . . . . . . . . . . . . . . . . . . . . . . .
27. What methods/ technologies do you employ for irrigating your
vegetables?
Bucket method [ ] Watering cans [ ] Sprinkler irrigation [ ]
Motorised pump [ ] Water hose [ ] Drip irrigation [ ]
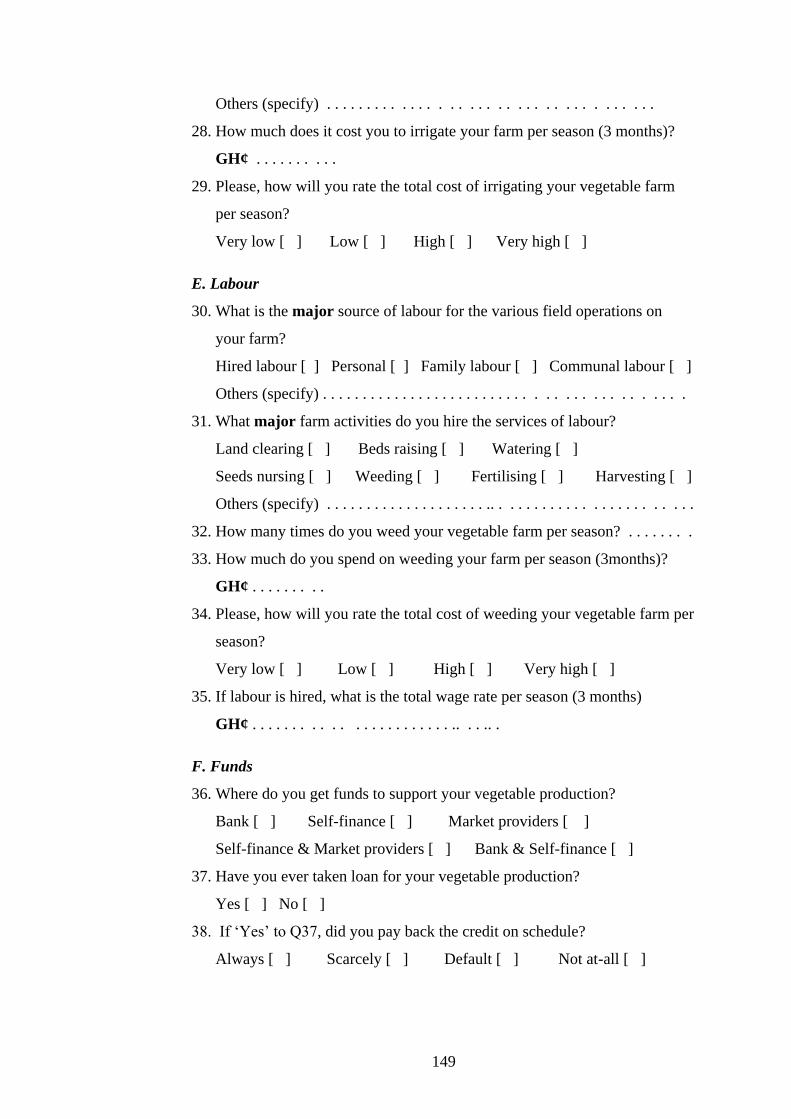
149
Others (specify) . . . . . . . . . . . . . . . . . . . . . . . . . . . . . . . . . . . .
28. How much does it cost you to irrigate your farm per season (3 months)?
GH¢ . . . . . . . . . .
29. Please, how will you rate the total cost of irrigating your vegetable farm
per season?
Very low [ ] Low [ ] High [ ] Very high [ ]
E. Labour
30. What is the major source of labour for the various field operations on
your farm?
Hired labour [ ] Personal [ ] Family labour [ ] Communal labour [ ]
Others (specify) . . . . . . . . . . . . . . . . . . . . . . . . . . . . . . . . . . . . . . . . . .
31. What major farm activities do you hire the services of labour?
Land clearing [ ] Beds raising [ ] Watering [ ]
Seeds nursing [ ] Weeding [ ] Fertilising [ ] Harvesting [ ]
Others (specify) . . . . . . . . . . . . . . . . . . . . .. . . . . . . . . . . . . . . . . . . . . . . .
32. How many times do you weed your vegetable farm per season? . . . . . . . .
33. How much do you spend on weeding your farm per season (3months)?
GH¢ . . . . . . . . .
34. Please, how will you rate the total cost of weeding your vegetable farm per
season?
Very low [ ] Low [ ] High [ ] Very high [ ]
35. If labour is hired, what is the total wage rate per season (3 months)
GH¢ . . . . . . . . . . . . . . . . . . . . . . . .. . . .. .
F. Funds
36. Where do you get funds to support your vegetable production?
Bank [ ] Self-finance [ ] Market providers [ ]
Self-finance & Market providers [ ] Bank & Self-finance [ ]
37. Have you ever taken loan for your vegetable production?
Yes [ ] No [ ]
38. If ‘Yes’ to Q37, did you pay back the credit on schedule?
Always [ ] Scarcely [ ] Default [ ] Not at-all [ ]
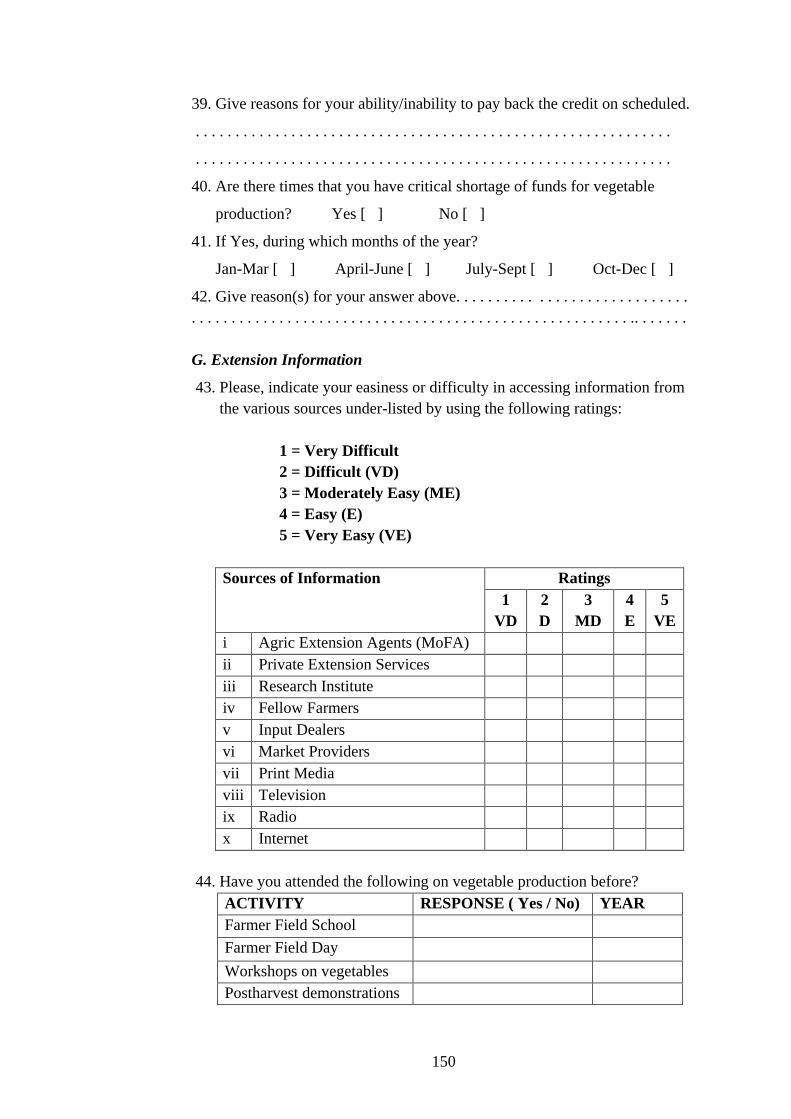
150
39. Give reasons for your ability/inability to pay back the credit on scheduled.
. . . . . . . . . . . . . . . . . . . . . . . . . . . . . . . . . . . . . . . . . . . . . . . . . . . . . . . . . . . .
. . . . . . . . . . . . . . . . . . . . . . . . . . . . . . . . . . . . . . . . . . . . . . . . . . . . . . . . . . . .
40. Are there times that you have critical shortage of funds for vegetable
production? Yes [ ] No [ ]
41. If Yes, during which months of the year?
Jan-Mar [ ] April-June [ ] July-Sept [ ] Oct-Dec [ ]
42. Give reason(s) for your answer above. . . . . . . . . . . . . . . . . . . . . . . . . . . . .
. . . . . . . . . . . . . . . . . . . . . . . . . . . . . . . . . . . . . . . . . . . . . . . . . . . . . . . .. . . . . . .
G. Extension Information
43. Please, indicate your easiness or difficulty in accessing information from
the various sources under-listed by using the following ratings:
1 = Very Difficult
2 = Difficult (VD)
3 = Moderately Easy (ME)
4 = Easy (E)
5 = Very Easy (VE)
Sources of Information
Ratings
1
VD
2
D
3
MD
4
E
5
VE
i Agric Extension Agents (MoFA)
ii Private Extension Services
iii Research Institute
iv Fellow Farmers
v Input Dealers
vi Market Providers
vii Print Media
viii Television
ix Radio
x Internet
44. Have you attended the following on vegetable production before?
ACTIVITY RESPONSE ( Yes / No) YEAR
Farmer Field School
Farmer Field Day
Workshops on vegetables
Postharvest demonstrations
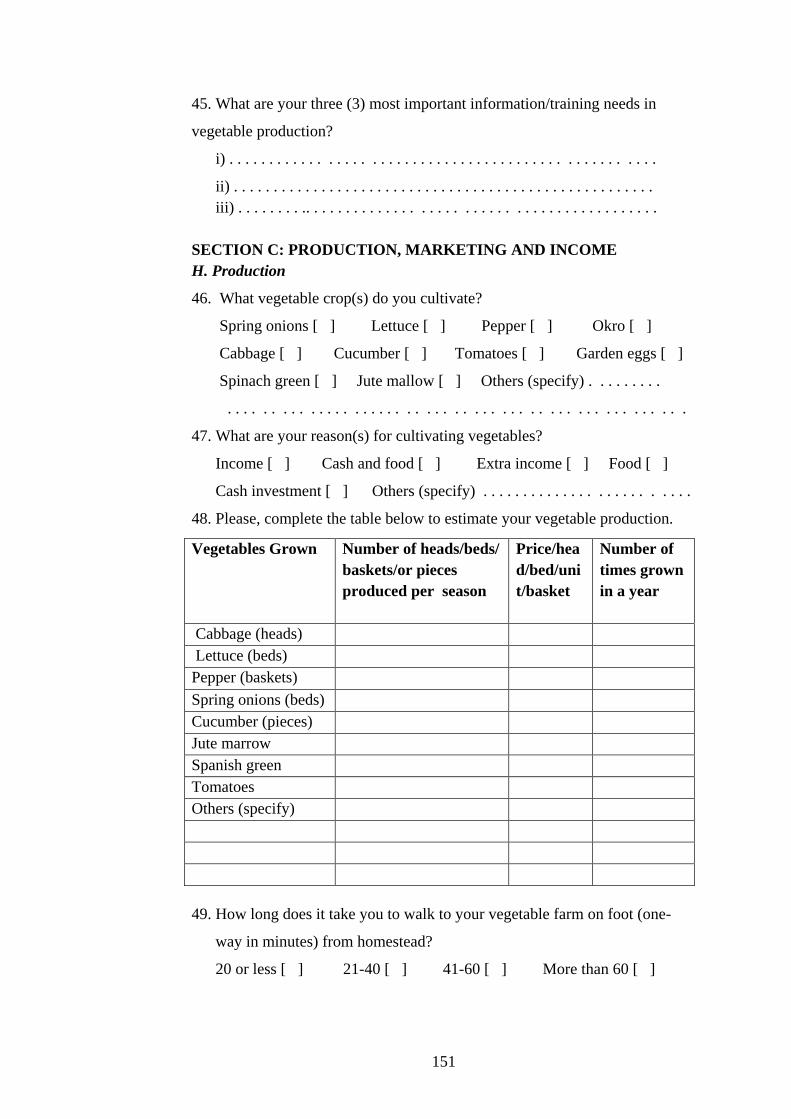
151
45. What are your three (3) most important information/training needs in
vegetable production?
i) . . . . . . . . . . . . . . . . . . . . . . . . . . . . . . . . . . . . . . . . . . . . . . . . . . . .
ii) . . . . . . . . . . . . . . . . . . . . . . . . . . . . . . . . . . . . . . . . . . . . . . . . . . . . .
iii) . . . . . . . . .. . . . . . . . . . . . . . . . . . . . . . . . . . . . . . . . . . . . . . . . . . .
SECTION C: PRODUCTION, MARKETING AND INCOME
H. Production
46. What vegetable crop(s) do you cultivate?
Spring onions [ ] Lettuce [ ] Pepper [ ] Okro [ ]
Cabbage [ ] Cucumber [ ] Tomatoes [ ] Garden eggs [ ]
Spinach green [ ] Jute mallow [ ] Others (specify) . . . . . . . . .
. . . . . . . . . . . . . . . . . . . . . . . . . . . . . . . . . . . . . . . . . . . . . . . . . .
47. What are your reason(s) for cultivating vegetables?
Income [ ] Cash and food [ ] Extra income [ ] Food [ ]
Cash investment [ ] Others (specify) . . . . . . . . . . . . . . . . . . . . . . . . .
48. Please, complete the table below to estimate your vegetable production.
49. How long does it take you to walk to your vegetable farm on foot (one-
way in minutes) from homestead?
20 or less [ ] 21-40 [ ] 41-60 [ ] More than 60 [ ]
Vegetables Grown Number of heads/beds/
baskets/or pieces
produced per season
Price/hea
d/bed/uni
t/basket
Number of
times grown
in a year
Cabbage (heads)
Lettuce (beds)
Pepper (baskets)
Spring onions (beds)
Cucumber (pieces)
Jute marrow
Spanish green
Tomatoes
Others (specify)
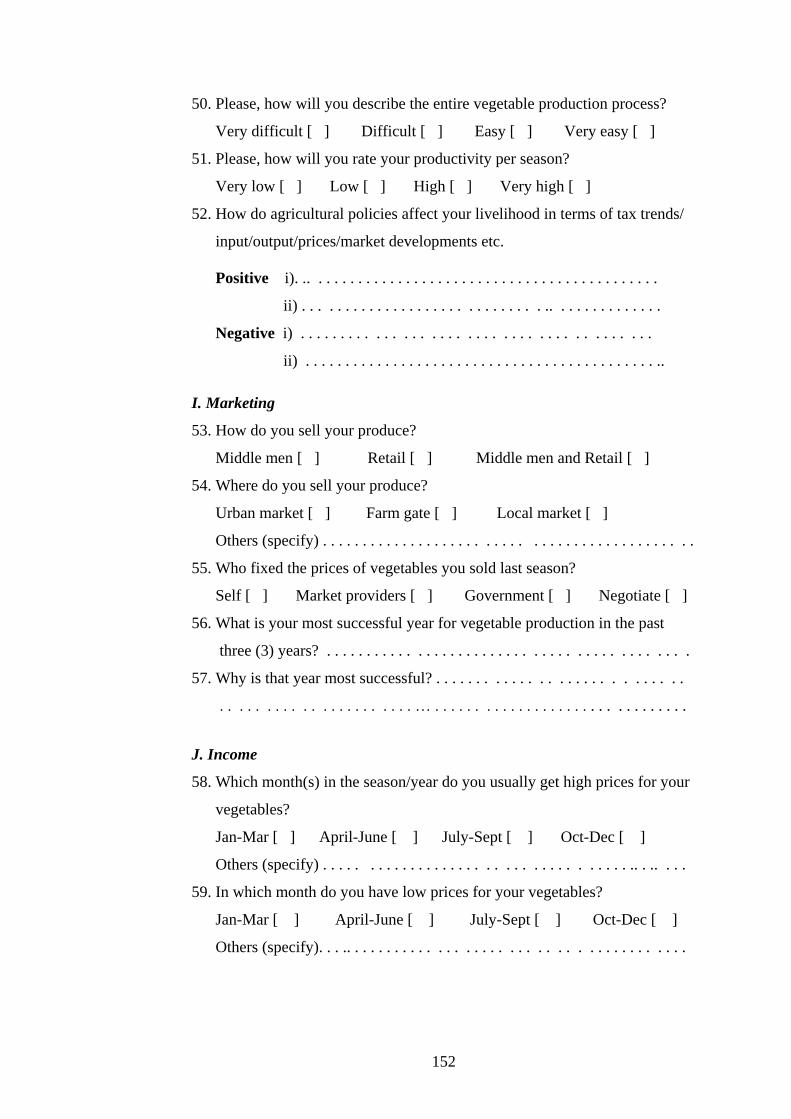
152
50. Please, how will you describe the entire vegetable production process?
Very difficult [ ] Difficult [ ] Easy [ ] Very easy [ ]
51. Please, how will you rate your productivity per season?
Very low [ ] Low [ ] High [ ] Very high [ ]
52. How do agricultural policies affect your livelihood in terms of tax trends/
input/output/prices/market developments etc.
Positive i). .. . . . . . . . . . . . . . . . . . . . . . . . . . . . . . . . . . . . . . . . . . . .
ii) . . . . . . . . . . . . . . . . . . . . . . . . . . . . . .. . . . . . . . . . . . . .
Negative i) . . . . . . . . . . . . . . . . . . . . . . . . . . . . . . . . . . . . . . . .
ii) . . . . . . . . . . . . . . . . . . . . . . . . . . . . . . . . . . . . . . . . . . . . ..
I. Marketing
53. How do you sell your produce?
Middle men [ ] Retail [ ] Middle men and Retail [ ]
54. Where do you sell your produce?
Urban market [ ] Farm gate [ ] Local market [ ]
Others (specify) . . . . . . . . . . . . . . . . . . . . . . . . . . . . . . . . . . . . . . . . . . . . .
55. Who fixed the prices of vegetables you sold last season?
Self [ ] Market providers [ ] Government [ ] Negotiate [ ]
56. What is your most successful year for vegetable production in the past
three (3) years? . . . . . . . . . . . . . . . . . . . . . . . . . . . . . . . . . . . . . . . . . . .
57. Why is that year most successful? . . . . . . . . . . . . . . . . . . . . . . . . . . . .
. . . . . . . . . . . . . . . . . . . . . . … . . . . . . . . . . . . . . . . . . . . . . . . . . . . . . .
J. Income
58. Which month(s) in the season/year do you usually get high prices for your
vegetables?
Jan-Mar [ ] April-June [ ] July-Sept [ ] Oct-Dec [ ]
Others (specify) . . . . . . . . . . . . . . . . . . . . . . . . . . . . . . . . . . . .. . .. . . .
59. In which month do you have low prices for your vegetables?
Jan-Mar [ ] April-June [ ] July-Sept [ ] Oct-Dec [ ]
Others (specify). . . .. . . . . . . . . . . . . . . . . . . . . . . . . . . . . . . . . . . . . . .
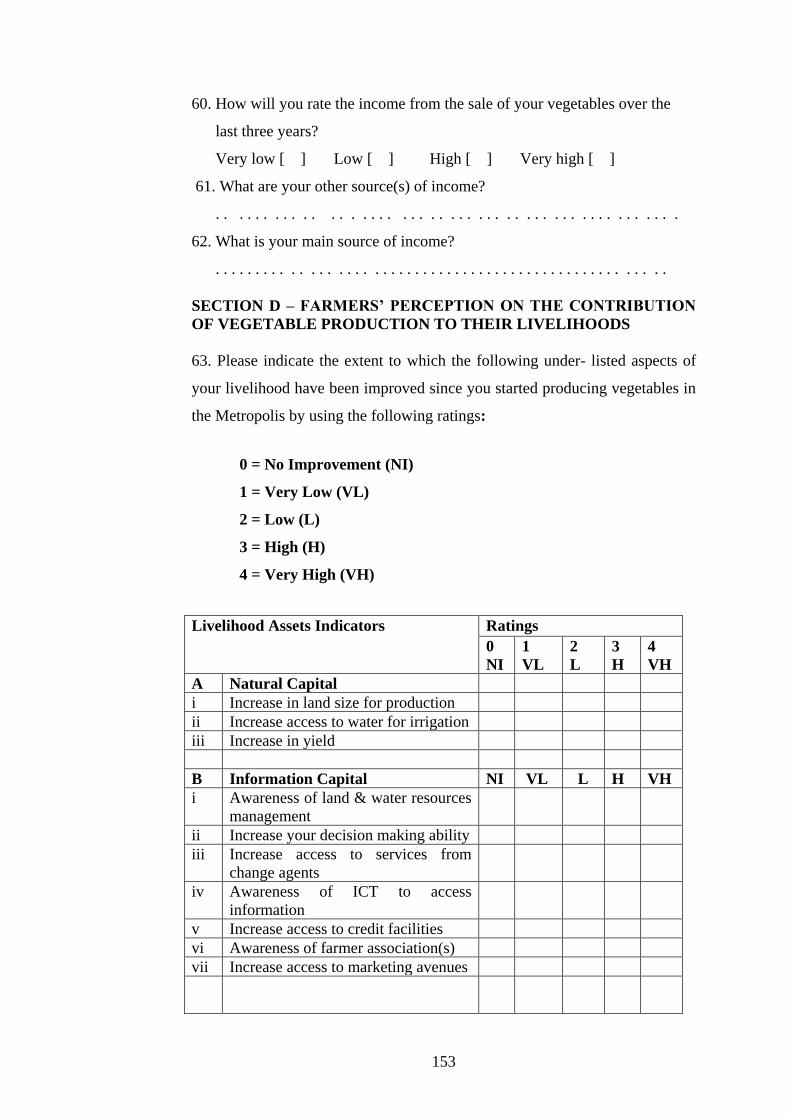
153
60. How will you rate the income from the sale of your vegetables over the
last three years?
Very low [ ] Low [ ] High [ ] Very high [ ]
61. What are your other source(s) of income?
. . . . . . . . . . . . . . . . . . . . . . . . . . . . . . . . . . . . . . . . . . . . . . . .
62. What is your main source of income?
. . . . . . . . . . . . . . . . . . . . . . . . . . . . . . . . . . . . . . . . . . . . . . . . . . . . . .
SECTION D – FARMERS’ PERCEPTION ON THE CONTRIBUTION
OF VEGETABLE PRODUCTION TO THEIR LIVELIHOODS
63. Please indicate the extent to which the following under- listed aspects of
your livelihood have been improved since you started producing vegetables in
the Metropolis by using the following ratings:
0 = No Improvement (NI)
1 = Very Low (VL)
2 = Low (L)
3 = High (H)
4 = Very High (VH)
Livelihood Assets Indicators Ratings
0
NI
1
VL
2
L
3
H
4
VH
A Natural Capital
i Increase in land size for production
ii Increase access to water for irrigation
iii Increase in yield
B Information Capital NI VL L H VH
i Awareness of land & water resources
management
ii Increase your decision making ability
iii Increase access to services from
change agents
iv Awareness of ICT to access
information
v Increase access to credit facilities
vi Awareness of farmer association(s)
vii Increase access to marketing avenues
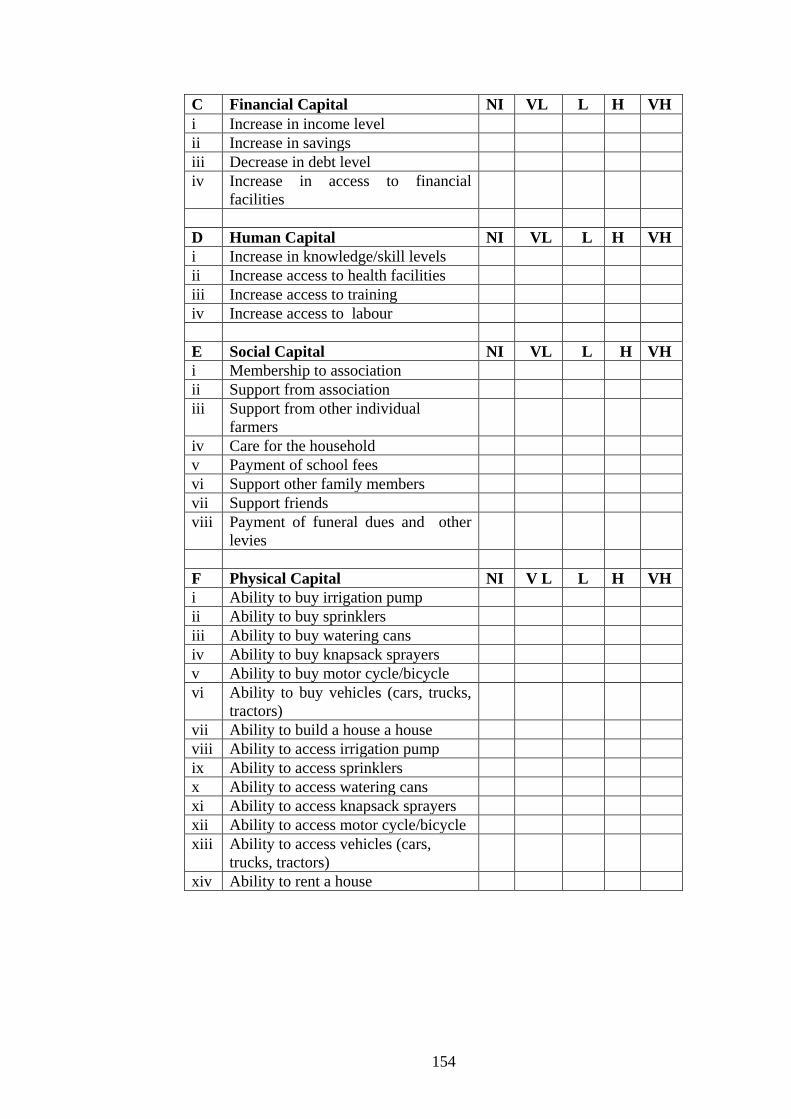
154
C Financial Capital NI VL L H VH
i Increase in income level
ii Increase in savings
iii Decrease in debt level
iv Increase in access to financial
facilities
D Human Capital NI VL L H VH
i Increase in knowledge/skill levels
ii Increase access to health facilities
iii Increase access to training
iv Increase access to labour
E Social Capital NI VL L H VH
i Membership to association
ii Support from association
iii Support from other individual
farmers
iv Care for the household
v Payment of school fees
vi Support other family members
vii Support friends
viii Payment of funeral dues and other
levies
F Physical Capital NI V L L H VH
i Ability to buy irrigation pump
ii Ability to buy sprinklers
iii Ability to buy watering cans
iv Ability to buy knapsack sprayers
v Ability to buy motor cycle/bicycle
vi Ability to buy vehicles (cars, trucks,
tractors)
vii Ability to build a house a house
viii Ability to access irrigation pump
ix Ability to access sprinklers
x Ability to access watering cans
xi Ability to access knapsack sprayers
xii Ability to access motor cycle/bicycle
xiii Ability to access vehicles (cars,
trucks, tractors)
xiv Ability to rent a house
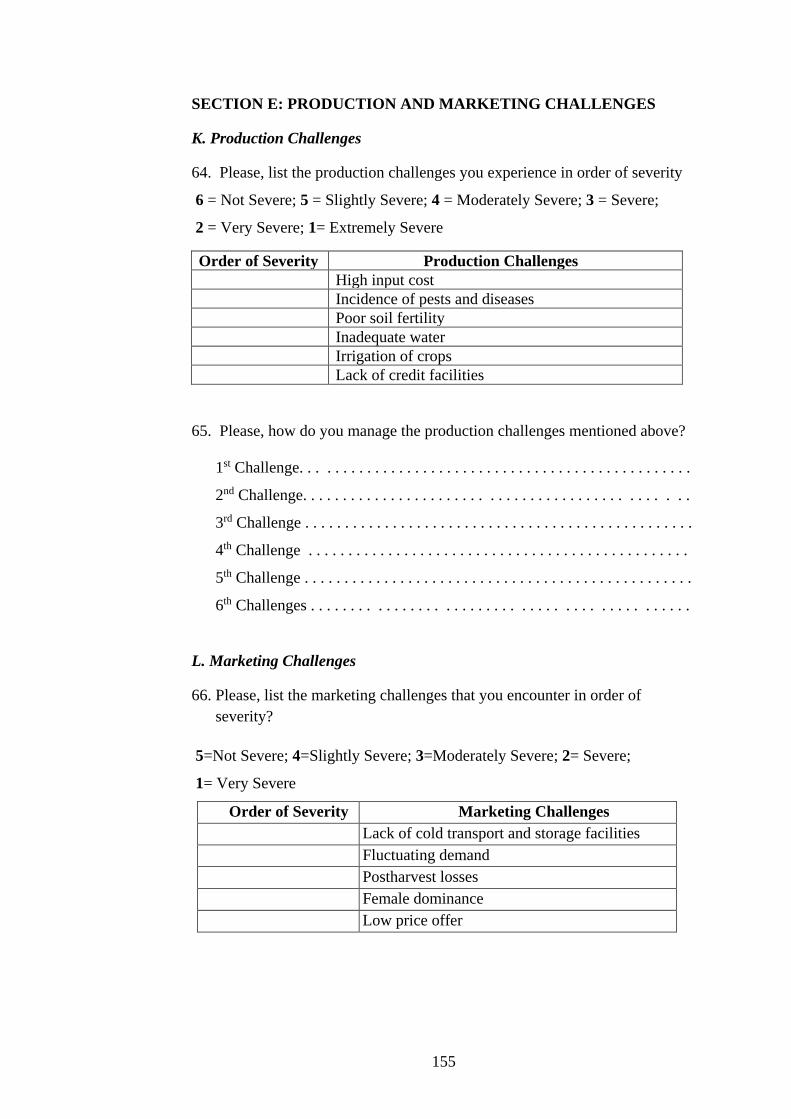
155
SECTION E: PRODUCTION AND MARKETING CHALLENGES
K. Production Challenges
64. Please, list the production challenges you experience in order of severity
6 = Not Severe; 5 = Slightly Severe; 4 = Moderately Severe; 3 = Severe;
2 = Very Severe; 1= Extremely Severe
65. Please, how do you manage the production challenges mentioned above?
1st Challenge. . . . . . . . . . . . . . . . . . . . . . . . . . . . . . . . . . . . . . . . . . . . . . . . .
2nd Challenge. . . . . . . . . . . . . . . . . . . . . . . . . . . . . . . . . . . . . . . . . . . . . . .
3rd Challenge . . . . . . . . . . . . . . . . . . . . . . . . . . . . . . . . . . . . . . . . . . . . . . . . .
4th Challenge . . . . . . . . . . . . . . . . . . . . . . . . . . . . . . . . . . . . . . . . . . . . . . . .
5th Challenge . . . . . . . . . . . . . . . . . . . . . . . . . . . . . . . . . . . . . . . . . . . . . . . . .
6th Challenges . . . . . . . . . . . . . . . . . . . . . . . . . . . . . . . . . . . . . . . . . . . . .
L. Marketing Challenges
66. Please, list the marketing challenges that you encounter in order of
severity?
5=Not Severe; 4=Slightly Severe; 3=Moderately Severe; 2= Severe;
1= Very Severe
Order of Severity Marketing Challenges
Lack of cold transport and storage facilities
Fluctuating demand
Postharvest losses
Female dominance
Low price offer
Order of Severity Production Challenges
High input cost
Incidence of pests and diseases
Poor soil fertility
Inadequate water
Irrigation of crops
Lack of credit facilities

156
67. Please, how do you manage the marketing challenges mentioned above?
1st Challenges. . . . . . . . . . . . . . . . . . . . . . . . . . . . . . . . . . . . . . . . . . . . . . .
2nd Challenges. . . . . . . . . . . . . . . . . . . . . . . . . . . . . . . . . . . . . . . . . . . . .
3rd Challenges. . . . . . . . . . . . . . . . . . . . . . . . . . . . . . . . . . . . . . . . . . . . . . . . .
4th Challenges.. . . . . . . . . . . . . . . . . . . . . . . . . . . . . . . . . . . . . . . . . . . . . .
5th Challenges . . . . . . . . . . . . . . . . . . . . . . . . . . . . . . . . . . . . . . . . . . . . . . . .
Thank you very much for your information and time.