Embed Size (px)
Citation preview

University of Birmingham
Hydropower generation, flood control and damcascades:Nguyen-Tien, Viet; Elliott, Robert J.R.; Strobl, Eric A.
DOI:10.1016/j.jhydrol.2018.02.063
License:Creative Commons: Attribution-NonCommercial-NoDerivs (CC BY-NC-ND)
Document VersionPeer reviewed version
Citation for published version (Harvard):Nguyen-Tien, V, Elliott, RJR & Strobl, EA 2018, 'Hydropower generation, flood control and dam cascades: Anational assessment for Vietnam', Journal of Hydrology, vol. 560, pp. 109-126.https://doi.org/10.1016/j.jhydrol.2018.02.063
Link to publication on Research at Birmingham portal
Publisher Rights Statement:Published in Journal of Hydrology on 08/03/2018
DOI:10.1016/j.jhydrol.2018.02.063
General rightsUnless a licence is specified above, all rights (including copyright and moral rights) in this document are retained by the authors and/or thecopyright holders. The express permission of the copyright holder must be obtained for any use of this material other than for purposespermitted by law.
•Users may freely distribute the URL that is used to identify this publication.•Users may download and/or print one copy of the publication from the University of Birmingham research portal for the purpose of privatestudy or non-commercial research.•User may use extracts from the document in line with the concept of ‘fair dealing’ under the Copyright, Designs and Patents Act 1988 (?)•Users may not further distribute the material nor use it for the purposes of commercial gain.
Where a licence is displayed above, please note the terms and conditions of the licence govern your use of this document.
When citing, please reference the published version.
Take down policyWhile the University of Birmingham exercises care and attention in making items available there are rare occasions when an item has beenuploaded in error or has been deemed to be commercially or otherwise sensitive.
If you believe that this is the case for this document, please contact [email protected] providing details and we will remove access tothe work immediately and investigate.
Download date: 16. Jan. 2022

Accepted Manuscript
Research papers
Hydropower generation, flood control and dam cascades: A national assessmentfor Vietnam
Viet Nguyen-Tien, Robert J.R. Elliott, Eric A. Strobl
PII: S0022-1694(18)30145-8DOI: https://doi.org/10.1016/j.jhydrol.2018.02.063Reference: HYDROL 22612
To appear in: Journal of Hydrology
Please cite this article as: Nguyen-Tien, V., Elliott, R.J.R., Strobl, E.A., Hydropower generation, flood control anddam cascades: A national assessment for Vietnam, Journal of Hydrology (2018), doi: https://doi.org/10.1016/j.jhydrol.2018.02.063
This is a PDF file of an unedited manuscript that has been accepted for publication. As a service to our customerswe are providing this early version of the manuscript. The manuscript will undergo copyediting, typesetting, andreview of the resulting proof before it is published in its final form. Please note that during the production processerrors may be discovered which could affect the content, and all legal disclaimers that apply to the journal pertain.

Hydropower generation, flood control and dam
cascades: A national assessment for Vietnam
Viet Nguyen-Tien 1, Robert J. R. Elliott1, Eric A. Strobl2
1 University of Birmingham, UK
2University of Bern, Switzerland
Abstract
Vietnam is a country with diverse terrain and climatic conditions and a dependencyon hydropower for a significant proportion of its power needs and as such, is particu-larly vulnerable to changes in climate. In this paper we apply SWAT (Soil and WaterAssessment Tool) derived discharge simulation results coupled with regression anal-ysis to estimate the performance of hydropower plants for Vietnam between 1995 tomid-2014 when both power supply and demand increased rapidly. Our approach is toexamine the watershed formed from three large inter-boundary basins: The Red River,the Vietnam Coast and the Lower Mekong River, which have a total area of 977,964km2. We then divide this area into 7,887 sub-basins with an average area of 131.6km2
(based on level 12 of HydroSHEDS/HydroBASINS datasets) and 53,024 Hydrologi-cal Response Units (HRUs). Next we simulate river flow for the 40 largest hydropowerplants across Vietnam. Our validation process demonstrates that the simulated flows aresignificantly correlated with the gauged inflows into these dams and are able to serve asa good proxy for the inflows into hydropower dams in our baseline energy regression,which captures 87.7% of the variation in monthly power generation In other resultswe estimate that large dams sacrifice on average around 18.2% of their contempora-neous production for the purpose of flood control. When we assess Vietnam’s currentalignment of dams we find that the current cascades of large hydropower dams appearto be reasonably efficient: each MWh/day increase in upstream generation adds 0.146MWh/day to downstream generation. The study provides evidence for the multiple ben-efits of a national system of large hydropower dams using a cascade design. Such asystem may help overcome future adverse impacts from changes in climate conditions.However, our results show that there is still room for improvement in the harmoniza-tion of cascades in some basins. Finally, possible adverse hydro-ecological impacts dueto the proliferation of large upstream dams, including those located beyond Vietnam’sborder, need to be carefully considered.
1

Keywords: Hydropower, climate change, Vietnam, large scale, cascade, flood control.
Acknowledgements: We would like to thank Hai Phong University and Hai Phong City’s Peo-ple Committee for administrative support during the time that this study was conducted. We areparticularly grateful to Dr. Nguyen Trinh Hoang Anh (Clean Energy and Sustainable Developmentlab, University of Science and Technology of Hanoi), Dr Hoang Tien Dung and Mr Nguyen ManhCuong (Vietnam Institute of Energy) and staff at Vietnam National Committee on Large Dams andWater Resources Development for data support. Thanks also for comments from participants at the2017 Warsaw International SWAT Conference and Workshops, and the tenth Vietnam Economist An-nual Meeting (VEAM 2017). We have benefited from helpful conversation and correspondence withAssoc.Prof.Dr. Hoang Minh Tuyen (Research Center of Hydrology and water resources, VietnamInstitute of Meteorology, Hydrology and Environment), Assoc. Prof. Dr. Le Anh Tuan (ResearchInstitute for Climate Change, Can Tho University), Dr Nga Dao (Center for Water Resources Conser-vation and Development). All mistakes are our own. We declare that we have no relevant or financialinterests that relate to the research in this paper.
1 Introduction1
Hydropower, which utilizes running or falling water as the chief input into electricity gen-2
eration, is the leading renewable source for electricity generation globally, supplying 71%3
of all renewable electricity. Reaching 1,064 GW of installed capacity in 2016, it generated4
16.4% of the world’s electricity from all sources (World Energy Council, 2017). Although5
attractive as a cheap, long-lasting, flexible and low-polluting renewable energy source, it6
is sensitive to changes in hydrology as a result of variation in weather conditions partic-7
ularly rainfall and temperature (Kumar et al., 2011; IFC, 2015). To assess the state of a8
hydropower system requires an evaluation of water availability. However, the absence of a9
consistent data at the country level means such an evaluation can be challenging. In many10
cases, measures of the inflow into a hydropower dam is not available or accessible. Mod-11
elling hydropower production is further complicated by hydrpower dams being increasingly12
2
spatially connected so that they form cascades.113
There is a small but growing literature that incorporates rainfall-runoff models and re-14
gression analysis to estimate the energy generation from a hydropower system conditional15
on weather-induced variations in river flow. Rainfall-runoff models, in conjunction with16
remote-sensing datasets, are one of the solutions employed to overcome the lack of consis-17
tent data on a large scale. Meanwhile, regression analysis enables the researcher to establish18
the relationship between water availability and power generation. Notable papers include19
Cole et al. (2014) who use the GeoSFM model and regression techniques to assess the po-20
tential risks to energy supply in hydro-dependent African countries under different IPPC cli-21
mate change scenarios.2 Studies for Vietnam include Gebretsadik et al. (2012) who employ22
the CLIRUN-II model to simulate river flow for Vietnam in an integrated study while (Arndt23
et al., 2015) evaluate the impact of climate change on multiple water-dependent sectors in-24
cluding energy in Vietnam.3 However, these studies do not take into account the multiple25
purpose use of hydropower dams and the interactions between them. Indeed, a recent paper26
by de Faria et al. (2017) looking at the local socio-economic impact of large dams highlights27
the lack of (1) quantitative studies looking at impacts over an extended period and (2) a lack28
of studies that consider multiple projects in the context of a developing country.29
The purpose of this paper is fill this gap in the literature and to estimate the performance30
of the hydropower system across the whole of Vietnam using new data and advanced re-31
gression modelling techniques. More specifically, our main contribution is to estimate the32
1In addition to power production, hydropower dams typically serve multiple purposes including, but notlimited to, flood control, irrigation, and navigation
2The GeoSFM model is a semi distributed, physically based catchment scale hydrological model originallydeveloped by the National Centre for Earth Observation and Science (EROS) to support the Famine EarlyWarning System Network (FEWSNET) through river flow monitoring. See Cole et al. (2014) for more details.
3CLIRUN-II is the latest in a family of hydrologic models developed specifically for the analysis of theimpact of climate change on river-runoff. See Gebretsadik et al. (2012) for details.
3

impact of water availability, flood control and the interconnected cascades of dams on hy-33
dropower production for the period 1995 to 2014. With floods being the most common34
natural disaster in the country and with climate change predicted to lead to more extreme35
weather patterns it is important that we gain a better understanding of the role of hydropower36
dams in both the mitigation of floods and droughts as well as providing a reliable and clean37
source of energy.4 Our methodological approach allows us to answer a number of questions38
relevant for water resource management and Vietnam future energy strategy: (1) How is39
national hydropower generation affected by variations in weather and is it robust to extreme40
hydrological changes? (2) What is the trade-off between power generation and flood con-41
trol? and (3) Is the location of large hydropower dams appropriate to enable coordination42
among dams through the use of dam cascades and how do cascades affect production? A43
second contribution is that our methodology will allow future researchers to identify how44
variations in weather may impact those economic activities that are dependent on electric-45
ity via variation in power supply. This source of exogenous variation is useful as it allows46
researchers to address a number of endogeneity concerns in studies of the relationship be-47
tween firm performance and electricity provision (Allcott et al., 2016; Fisher-Vanden et al.,48
2015; Alam, 2013) or household welfare and electrification (Grogan, 2016; Khandker et al.,49
2009; Walle et al., 2013).50
To model river flow we use the HydroSHEDS/HydroBASINS dataset (Lehner, 2014;51
Lehner et al., 2008), which is derived from the detailed SRTM DEM at three arc-seconds.552
4Flooding is the most common weather-related disaster and is estimated to affect 2.3 billion people(mainly in the Asia) (CRED, 2015). In Vietnam, floods rank second among natural disasters. Accord-ing to national statistics, natural disasters in Vietnam are responsible for 750 deaths annually and eco-nomic losses equivalent to 1.5% of GDP (IFAD, 2010). In October 2017 floods killed 72 people and dam-aged 22,000 hectares of rice with deforestation being blamed for the floods being more severe than usual(https://www.nytimes.com/reuters/2017/10/16/world/asia/16reuters-asia-storm-vietnam.html).
5A digital elevation model (DEM) is a digital model or 3D representation of a terrain’s surface createdfrom terrain elevation data. Source: https://en.wikipedia.org/wiki/Digital _ elevation _ model. DEM data isstored in a format that utilizes three, five, or 30 arc-seconds of longitude and latitude to register cell values.
4

Consequently, the river network and nested basin system created by HydroSHEDS/HydroBASINS53
has a higher resolution than the popular Hydro1K dataset.6 As a result we are able to under-54
take our analysis at a more disaggregated spatial level which we believe is necessary if one55
is to accurately model dam interactions. To the best of our knowledge, we are also the first56
to apply the SWAT model for Vietnam at the national scale.57
To model river-flow we use the SWAT (Soil and Water Assessment Tool) river-runoff58
model. SWAT is “one of the most widely used water quality watershed and river basin–scale59
models and is applied extensively to a broad range of hydrologic and/or environmental prob-60
lems” (Gassman et al., 2014, p. 1). SWAT has been applied to large-scale watersheds all over61
the world, for example China (Hao et al., 2004), West Africa (Schuol and Abbaspour, 2006),62
and Europe (Abbaspour et al., 2015). For a summary of SWAT applications for the US and63
EU see Arnold and Fohrer (2005).64
There is also an emerging literature that applies the SWAT model to Vietnamese wa-65
tersheds. For example, it has been used to study the hydrological process and sediment66
transport in the trans-boundary basin of Lower Mekong River (LMR), which is shared by67
Cambodia, Laos, Thailand, Myanmar, and Vietnam (Rossi et al., 2009; Piman et al., 2013).68
A part of the LMR, the Sesan, Srepok, and Sekong rivers (widely referred to as the 3S rivers)69
shared by Vietnam, Laos and Cambodia is particularly attractive to researchers because of70
the recent boom in hydropower (Wild and Loucks, 2014; T.Piman et al., 2013; Shrestha71
The geographic reference system treats the globe as if it were a sphere divided into 360 equal parts calleddegrees. An arc-second represents the distance of latitude or longitude traversed on the earth’s surface whiletravelling one second (1/3600th of a degree). At the equator, an arc-second of longitude approximately equalsan arc-second of latitude, which is 1/60th of a nautical mile (or 101.27 feet or 30.87 meters). Arc-secondsof latitude remain nearly constant, while arc-seconds of longitude decrease in a trigonometric cosine-basedfashion as one moves toward the earth’s poles. Source: http://www.esri.com/news/arcuser/0400/wdside.html.
6The Hydro1K dataset which is a comprehensive global geographic database at a resolution of 1 km thatincludes streams, drainage basins and ancillary layers derived from the 30 arc-second digital elevation model(DEM) of the world (GTOPO30) generated by the U.S. Geological Survey (USGS, 2015) and has been usedfor large scale river flow modelling by (Cole et al., 2014; Gebretsadik et al., 2012).
5
et al., 2016). There are also a series of studies that apply SWAT to separate basins in dif-72
ferent parts of Vietnam: the North (Wang and Ishidaira, 2012; Phan et al., 2011; Ngo et al.,73
2015), the Central Coast (Giang et al., 2014; Le and Sharif, 2015), the Central Highland74
(Vu et al., 2012; Tram et al., 2014; Vu et al., 2015; Quyen et al., 2014), and the South (Ho75
et al., 2013; Khoi and Suetsugi, 2014). Although a frequent application of SWAT is to as-76
sess the impact of climate change on hydrological processes (Phan et al., 2011; Giang et al.,77
2014; Le and Sharif, 2015; Vu et al., 2015) they have also been used to evaluate the impact78
of human activities that take into account deforestation (Khoi and Suetsugi, 2014), forest79
planting, soil protection, crop conversion (Ngo et al., 2015; Quyen et al., 2014), and hy-80
dropower construction and operation (Wang and Ishidaira, 2012; Le et al., 2014). Although81
the application of these models varies they all attempt to inform policy makers on various82
aspects of water management, agricultural land use, and energy supply. However, none of83
these papers examine Vietnam at a national scale.84
The remainder of this paper is organised as follows. Section 2 describes the evolution85
of hydropower in Vietnam. Section 3 describes our methodology and data including the86
materials needed for our hydrological simulation, the SWAT model, the consolidation and87
transformation of hydropower and the regression techniques used in the paper. We present88
our results in Section 4. The final section concludes.89
2 Hydropower in Vietnam90
Understanding the hydrology of Vietnam is important for the reasons highlighted in the91
introduction. Located in the south-east of the Indochinese peninsula, Vietnam’s terrain is92
dominated by tropical hills and densely forested highlands. This means that Vietnam’s low-93
6

lands, which are suitable for agricultural cultivation, cover less than 25% of its area with94
production concentrated in the Red River Delta (in the North) and the Cuu Long River Delta95
(in the South). The majority of water resources (63.9% of total flows) are concentrated in96
these basins while other parts of the country, that occupy more than 75% of the total area of97
Vietnam, receive just over 35% of the national total river-runoff. Yet Vietnam is abundant98
in water resources with 2,360 rivers above 10 km in length and 16 river basins above 2,50099
km2 in area. The annual run-off volume is around 847 km3. However a population of nearly100
100 million means that the total water volume per capita is still only around 9,560m3 per101
year compared to an average of global value of 10,000m3 according to the International102
Water Resources Association (IWRA) (MONRE, 2012).103
In the future, a rapidly growing economy and continued urbanization is expected to104
increase pressure on water resources. In addition, Vietnam’s river network is connected to105
neighbouring countries with 72% of its largest combined basin of about 1.167 million km2106
located beyond its border (MONRE, 2012). This means Vietnam’s water availability could107
be severely affected if upstream countries were to change their demand or decide to divert108
or manipulate the river flow. Finally, although the monsoon tropical climate brings about a109
high average of annual rainfall of around 1940mm, the mountainous and hilly terrain causes110
a high degree of inter-annual rainfall variability. As a result, Vietnam’s water availability can111
change dramatically throughout the year. This means that foods and prolonged droughts can112
occur within the same year and region. As a rule, the dry season lasts around 6 – 9 months113
(with exact times varying across the country) and accounts for only 20-30% of annual run-114
off. At the same time, half of the 15 major basins experience a shortage of water (MONRE,115
2012).116
Under such challenging circumstances, dams, reservoirs, and their associated irrigation117
7

systems play an important role in the water management of Vietnam. The combined total118
storage capacity of reservoirs across the country is about 37 billion m3, which is equivalent119
to 4.5% of Vietnam’s average annual run-off. The network of over 7,000 dams means that120
Vietnam is one of the most dammed in the world alongside the US and China (Pham and121
Pham, 2014).122
Our study covers the period 1995-2014 which is a time when Vietnam experienced rapid123
growth in the demand for electricity. Between 1995-2005, demand for electricity grew on124
average by 15% per annum as a result of an economic growth rate of around 7.5% per year125
(Huu, 2015). At current growth rates, projections are that Vietnam’s energy supply will need126
to triple by 2020 with additional supply coming chiefly from petroleum, coal, natural gas,127
and hydropower (ADB, 2015b). As a result, per capita energy consumption is projected to128
increase to 5,400 kilowatt-hours by 2030 from 985 kilowatt-hours in 2010 (ADB, 2013). As129
an inexpensive and available source of power, hydropower is a key component of the national130
energy mix. The ten major rivers suitable for hydropower construction have an approximate131
total potential capacity of 21,000-24,000 MW (UNIDO and ICSHP, 2013).7 In the last two132
decades, Vietnam has increased construction of hydropower plants to the extent that it has133
exploited nearly 70% of its theoretical hydropower potential (Huu, 2015).8 Hydropower cur-134
rently contributes 44% of Vietnam’s installed power capacity (ADB, 2015a). As part of its135
development plan looking ahead to 2035 (PDP7 revised) (Prime Minister, 2016), Vietnam136
continues to prioritise the development of hydropower, especially multi-purpose projects137
that combine flood control, irrigation, and electricity generation. The total capacity of hy-138
dropower plants is planned to increase from approximately 17,000 MW (2016) to 21,600139
7For comparison, the total power installed capacity of Vietnam in 2015 is 38,642 MW. Hence, if hy-dropower’s potential was to be fully exploited it could account for 54% - 62 % of the total power installedcapacity in 2015.
8Compared to a global average rate of 35%
8

MW (2020)9. In addition, the pumped storage electricity plants are scheduled to have a total140
capacity of 1,200 MW in 2025 and 2,400 MW in 2030.10141
3 Material and methods142
3.1 Material for hydrological simulation143
To develop the SWAT model for Vietnam we use data generated through remote sens-144
ing. For the administrative boundary maps, we use the Global Administrative unit layers145
(GAUL) (version 2015), which provides “the most reliable spatial information on admin-146
istrative units for all countries in the world” (FAO, 2015). Our hydrographic data comes147
from HydroSHEDS (Hydrological data and maps based on SHuttle Elevation Derivatives148
at multiple Scales) (Lehner et al., 2008) and its subset HydroBASINS (Lehner and Grill,149
2013). HydroSHEDS is a derivative of the digital elevation model (DEM) at a 3 arc-second150
resolution of the Shuttle Radar Topography Mission (SRTM). The elevation data was void-151
filled, hydrologically processed, and corrected to produce a consistent and comprehensive152
suite of geo-referenced data that enables the analysis of upstream and downstream connec-153
tivity of watersheds. Among the subsets of the HydroSHEDS database, the polygon layers154
that depict watershed boundaries and sub-basin delineations at a global scale critical for155
hydrological analysis are termed HydroBASINS. HydroBASINS delineates and codes sub-156
9However, the share of hydropower in national electricity production is predicted to fall to 29.5% by 2020and 15.5% by 2030 (due to faster growth of other components of the energy sector).
10Vietnam is predicted to be among the countries likely to be most affected by climate change (WB & MPI,2016). This vulnerability has come to the attention of the government and international organizations (ADB,2013; FAO, 2011; IFAD, 2010, 2014; IMHEN, 2010; IPCC, 2007; ISPONRE, 2009; MONRE, 2003, 2009,2010, 2011; WB, 2010, 2011; WB and MPI, 2016) with the main threats being increasing temperature, alteredrainfall patterns, and rising sea levels. For hydropower, higher temperatures are thought to lead to an increasein demand for energy (MONRE, 2010) whilst also affecting stream flows into hydropower plants (WB, 2011).
9

basins purely based on topographic and hydrographic bases without any local information157
(for example the name of rivers/ basins). To mitigate this, we utilize the basin and river158
layers of the dataset named “Rivers in South and East Asia” derived from HydroSHEDS159
by FAO (2014) which provides a river and basins network that simplifies HydroBASINS to160
include annotated attributes, such as the name of each large river and basin and the tentative161
classification of perennial and intermittent streams.162
For our analysis we require a large amount of consistently collected weather data. Al-163
though Vietnam has an intensive network of meteorological stations, access to the data to164
such a large number of stations over a long time period is prohibitively costly. Even if access165
were possible, inconsistencies in data availability (especially the missing data in weather se-166
ries) prevents us using this data for watershed analysis on a large scale. In addition, since167
Vietnam shares river basins with Laos, Cambodia and China, the weather data outside of168
Vietnam would also be needed since variations in rainfall and temperature in the neighbour-169
ing countries could affect the discharge of downstream rivers in Vietnam. Our solution is to170
use a high quality gridded weather database that supports SWAT applications from the Cli-171
mate Forecast System Reanalysis (CFSR) by the US’s National Centers for Environmental172
Prediction (NCEP) (Saha et al., 2010, 2014). To obtain information on soil profile, we use173
the Digital Soil Map of the World (DSMW) version 3.6 (FAO, 2007). The (physical and174
chemical) characteristics of each soil unit are tabulated by Schuol et al. (2008). For land175
cover information, we use the University of Maryland Department of Geography (UMD)176
Land Cover classification collection at the 1km pixel resolution (Hansen et al., 1998, 2000).177
The resolution of materials for the simulation are summarized in Table 1.178
[Table 1 about here]179
10

3.2 The SWAT hydrological simulator180
SWAT (Arnold et al., 1998) is a continuation of thirty years of non-point source modelling by181
the US Department of Agriculture (USDA), the Agricultural Research Service (ARS), and182
Texas A&M University.11 The model is a physically based, continuous, semi-distributed183
model that was initially developed to project the impact of land management practices on184
water, sediment and agricultural chemical yields in large complex catchment areas under185
various soil conditions, land use and management over a long time period (Neitsch et al.,186
2009). More recently it has been incorporated into a variety of GIS interfaces such as SWAT/187
GRASS (Srinivasan and Arnold, 1994), ArcView-SWAT (AVSWAT) (Di Luzio et al., 2004)188
and ArcSWAT (Olivera et al., 2006).189
SWAT enables the simulation of numerous physical and chemical processes: discharge,190
erosion, nutrients, pesticides and management (rotations and water use) (Neitsch et al.,191
2009). It divides a given watershed into a number of sub-basins mainly based on topog-192
raphy characteristics given a chosen number or size of sub-basin. This process is typically193
referred to as watersheds delineation. However, each sub-basin is not treated as a lump but194
instead each sub-basis in broken down into different hydrologic response units (HRU) each195
considered as a homogenous unit with their own unique set of land cover, soil and manage-196
ment features. The hydrological cycle of a watershed is simulated based on two processes.197
First, the land phase controls the amount of water flowing to the main channel of each sub-198
basin and second, the routing phase controls the movement of water through the channel199
(river) network to an outlet of the watershed.200
11Other federal agencies also contributed to the model, including the US Environmental Protection Agency,the Natural Resources Conservation Service, the National Oceanic and the Atmospheric Administration andthe Bureau of Indian Affairs.
11

The land phase The land phase of the hydrological cycle is based on the water balance201
equation:202
S Wt = S W0 +
t∑i=1
(Rday − Qsur f − Ea − wseep − Qgw
)(mm H2O) (1)
where the final soil water content (S Wt) is made up of the sum of initial soil water203
content (S W0) and a daily-time-step summation of the difference between the amount of204
precipitation(Rday
), and the sum of the amount of surface runoff
(Qsur f
), evapotranspiration205
(Ea) , percolation and bypass flow exiting the soil profile bottom(wseep
), and return flow206 (
Qgw
).207
Equation (1) captures potential pathways of water movement simulated by SWAT. Once208
precipitation descends, it is either intercepted or held in the vegetation canopy or falls to the209
soil surface. Water on the soil surface infiltrates into the soil profile or flows overland as210
runoff. Runoff moves relatively quickly toward a stream channel and contributes to a short-211
term stream response. Infiltrated water is either held in the soil and later evapotranspried or212
slowly makes its way to the surface water system via underground paths. Different crops213
and soils appear with varying evapotranspiration. Runoff is projected individually for each214
HRU then combined to obtain a total runoff for the watershed. Details about each phase can215
be found in Arnold et al. (1998); Neitsch et al. (2009).216
Routing phase The lump of runoff in each sub-basin is calculated and then routed to217
the main channel through the stream network using either the variable storage coefficient218
method by Jimmy (1969) or the Muskingum routing method. The underlying principle is219
that water discharges downstream except for that part that is lost due to evaporation and220
12

transmission through the bed of the channel and the removal for agricultural and human use.221
3.3 Hydrological simulation222
In this paper we simulate river flow for Vietnam using the ArcSWAT 10.2 interface (SWAT223
model incorporated in ArcGIS 10.2).224
The first step is to delineate the watershed. The watershed we study is a combination225
of three large basins as defined by the “FAO Rivers in South and East Asia”: Red River226
(165,007 km2), Vietnam Coast (186,187 km2), and a part of Mekong River (similar to Lower227
Mekong River with an area of 626,771 km2). The total area of the watershed is 977,964228
km2.229
Figure 1 shows the transboundary watershed shared by Vietnam, China, Myanmar, Lao230
PDR, Thailand and Cambodia. The area within Vietnam accounts for 32.22% the total area231
of the watershed and covers 96.15% (315,122 km2/327,727 km2) of Vietnam’s mainland232
area. The remainder belongs to the Bang Giang – Ky Cung river basin, which makes no233
meaningful contribution to Vietnam’s overall hydropower production. ArcSWAT offers two234
options for breaking the watersheds into smaller sub-basins: burning a river network from235
a DEM input or using layers that predefine sub-basins and the river network. We chose236
the second option to take advantage of the HydroBASINS dataset. Hence, the watershed is237
divided into 7,887 sub-basins at level 12 of HydroBASINS.238
[Figure 1 about here]239
Table 2 summarises the sub-basin data and shows that their areas vary from 0.2 km2240
to 368.6 km2, with a mean of 131.6 km2. The use of HydroBASINS has two advantages241
13

over using DEM. First, HydroBASINS was derived from HydroSHEDS, which already242
hydrographically conditioned DEM. DEM like SRTM has some characteristics, artefacts,243
and anomalies unfavourable for hydrologic application (Lehner, 2013).12 Second, Hy-244
droBASINS provides two nested coding systems (Pfafstetter codes and HydroSHEDS ID).245
These codes are a useful for our spatial analysis as they help us to determine systematically246
the upstream- downstream relationship between dams. Despite using predefined basins, a247
DEM is still required to calculate the topography characteristics of each basin and hence we248
used the HydroSHEDS void-filled DEM for this purpose.249
[Table 2 about here]250
ArcSWAT divides each sub-basin into HRUs using a combination of soil, land use and251
slope layers. The soil and land use layers are listed in subsection 3.1. The slope layer was252
created by ArcSWAT using the HydroSHEDS void-filled DEM. We determined three classes253
of slope in line with the soil slope classification of DSMW: 0-8% (class 1), 8-30% (class254
2) and above 30% (class 3), which respectively contribute 64.12%, 31.51%, and 4.37% to255
the area of the watershed. Based on the above layers, ArcSWAT assigned multiple HRUs to256
each watershed given our sensitivity thresholds (5% for land use and soil and 20% for slope).257
In our final data set the watershed is divided into 7,887 sub-basins and 53,024 HRUs. Daily258
data for each sub-basin on the maximum and minimum temperature, precipitation, wind259
speed, relative humidity, and solar radiation were supplied from 2,755 weather gridded-260
stations from the CFSR/NCEP dataset.261
We simulated monthly river flow for the whole watershed for the period January 1995 to262
July 2014. The simulation period was chosen to best fit the available performance data of263
12HydroSHEDS reduces errors by deepening open water surfaces, weeding coastal zones, burning stream,filtering, moulding valley courses, filling sinks and carving through barriers.
14

hydropower plants, subject to the availability of weather data. The model was also run for264
5 years prior to this period for warming up purposes, which helps to establish the equalized265
initial condition of soil water before simulation. The simulation used the method integrated266
in ArcSWAT (Arnold et al., 1998; Neitsch et al., 2009) that modify the SCS curve number267
procedure (SCS, 1972) to take into account the varying conditions of land uses and soil types268
to estimate surface runoff and use the Penman-Monteith method (Allen, 1986; Allen et al.,269
1989; Monteith, 1981) to estimate evapotranspiration.270
3.4 Hydropower data consolidation and transformation271
Our analysis focuses on river flow to the 40 largest hydropower plants in Vietnam, which272
belong to the 12 basins shown in Figure 2 and listed in Table 3. The location of these hy-273
dropower dams is mapped using a GIS software (ArcGIS) based on information from various274
sources including the Vietnam Energy Map of Japan External Trade Organization (JETRO),275
WB (2014), United Nations Framework Convention on Climate Change - Clean Develop-276
ment Mechanism (UNFCCC-CDM) database, hydropower companies’ websites, and local277
news websites. Finally, we validated and refined the dataset using observations from Google278
Earth.279
[Figure 2 about here]280
[Table 3 about here]281
Our hydropower operation data at the plant level is from Electricity of Vietnam (EVN,282
2015). The report provides information on total capacity, monthly gauged river flow data283
of each plant, and electricity generation of 40 of the largest hydropower plants of Vietnam284
15
between 1995-2014. Vietnam classifies hydropower plants into two categories: small (un-285
der 30 MW and managed by local governments) and large (above 30MW and managed by286
central government). WB (2014) further divides the latter group into medium (from 30MW287
to under 100MW) and large hydropower plants (above 100 MW). The majority of plants on288
our list of 40 are defined as large and all of them are managed by the central government.289
Figure 3 shows that the combined installed capacity of these plants accounts for 75-85% of290
all hydropower sources which in turn accounts for 35% -53% of all energy sources across291
Vietnam.292
[Figure 3 about here]293
As part of the data cleaning process we transformed the data in a number of ways. The294
original power generation data was monthly and measured in million kWh. However, the295
number of days within a month varies between 28 to 31. Our solution is to divide the296
monthly electricity generation by the number of days per month and re-scale it into MWh.297
Initially we had a simple measure of the installed capacity of plants after full installation.298
However, as there were no additional developments to existing hydropower plants during our299
period of analysis, this variable is time-invariant and would be absorbed by the fixed effects300
in our regressions. In other words, under such circumstances, we would n2ed to exclude the301
capacity variable as there would be perfect multicollinearity between it and the dam fixed302
effects, which already capture any time-invariant dam-specific characteristics. To mitigate303
this, we take advantage of the fact that each plant is comprised of several generators that304
are typically commissioned at different times. More precisely, it can take a plant months or305
even years to be fully operational after the commissioning of its first generator. Hence, in306
reality the installed capacity of each plant is time varying during the installation phase and307
time-invariant from that point onwards. We gather information on the operation date of each308
16

generator from the website of plants or local online newspapers, and then adjust the installed309
capacity of each plant to reflect the real operation of each generator. Fortunately, the first run310
of each generator in a large hydropower plant is an important event to investors and local311
residents and hence this information is fully recorded. As a result, the installed capacity312
variable, after transformation, became time-varying and can be included in a regression313
with fixed effects. All plants in our sample are of the storage type and many have large314
government regulated reservoirs. The total capacity of reservoirs ranges from 30.4 million315
m3 to 9.8 billion m3 and the mean size is 1.1 billion m3. 13316
To enable us to investigate the interaction between dams on the same river system, we317
need to determine the upstream-downstream relationship between dams. To do this we318
use the HydroSHEDS identifiers from the HydroBASINS dataset at the most disaggregated319
level. HydroBASINS provides two systems of basin coding: HydroSHEDS identifiers and320
Pfafstetter code (Verdin and Verdin, 1999). We use the former as the HydroSHEDS identi-321
fiers is more consistent and each sub-basin is assigned one unique identifier and routed to322
(only) one immediate downstream sub-basin or the sea/itself (if it is an outlet) or an out-323
let (if it is an endorheic sink).14 Table 4 shows that, after tracing all routes, that there are324
13 hydropower cascades detected in 9 of the 12 basins studied comprised of 36 upstream-325
downstream pairs. We then consolidated with local information (websites of hydropower326
plants, local newspapers and so on). The distance between each upstream plant and its327
downstream counterparts in Table 4 is measured by the number of HydroSHEDS sub-basins328
13Information about these reservoirs is from the 11 most recent PM decisions on inter-reservoir manage-ment procedures in 11 basins: Ba (1077/QD-TTg -2014), Sesan (1182/QD-TTg 2014), Srepok (1201/QD-TTg2014), Ca (2125/QD-TTg 2015), Huong (2482/QD-TTg 2015), Kon Ha Thanh (1841/QD-TTg 2015), Ma(1911/QD-TTg 2015), Tra Khuc (1840/QD-TTg - 2015), Red River (1622/QD-TTg -2015), Vu Gia Thu Bon(1537/QD-TTg 2015), Dong Nai (471/QD-TTg -2016). For smaller reservoirs, data were collected from inter-net sources. The smallest plant among those studied has a full installed capacity of 44 MW. The largest one ismore than 50 times greater (2,400 MW) and the average one is about 300 MW.
14Because of the challenges in the latter in determining the downstream plants; for example, the differencein routing between inter-basins and basins and the skip of coding due to endorheic sinks and islands.
17

shared between them. The exception is Ham Thuan and Da Mi where the zero-distance329
reflects the fact that the dams are located in the same sub-basin.330
[Table 4 about here]331
We create two proxies for the operation of an upstream dam: the combined installed332
capacity of upstream dams and the combined production of upstream dams. Some dams333
have many upper dams that are operated at different times and we need to fill in all missing334
values before aggregating. The installed capacity and production of plants before they begin335
their operation are assigned zero values. Any missing values from upstream dams are filled336
in using the predicted values of a double log regression of non-missing production values337
on its installed capacity and simulated discharge.15 The double-log regression has lower338
predictability than the double-level regression; however, it ensures that the predicted values339
are positive. The variable coefficients then measure the average impact of upstream dams340
nationwide.341
Table 5 provides summary statistics for our key variables of interest. We model monthly342
hydropower generation using data on installed capacity and simulated discharge. We con-343
sider the period from January 1995 to July 2014 and since the majority of Vietnam’s hy-344
dropower plants were commissioned after 1995, the panel is unbalanced. Our final sample345
includes 2,984 observations with a mean generation of 4.39 MWh per day. The highest pro-346
duction record is 46.8 MWh (Son La on August 2014). Recall that the installed capacity,347
disaggregated at the generator level, is time variant and ranges from 22MW to 2,400 MW348
with a mean of 376.3 MW. The simulated flows in the sample vary from 0.12 – 9,105 cubic349
metres per second and the combined installed capacity of upstream dams varies from 0 to350
15The model for each plant (i) is ln(Gent) = β0 + β1ln(CAPt) + β2ln(Flowt) + εt.
18

2,820 MW. The combined production of upstream dams varies from 0 to 45,781 MWh/day.351
[Table 5 about here]352
3.5 Simulation validation353
To evaluate the performance of the river flow model in general and the SWAT application in354
particular, a common approach is to compare the gauged flow with the simulated flow based355
on statistics established and documented prior to the modelling. There are numerous statis-356
tics that can be used for this purpose that are usually put into 3 different categories: standard357
regression, dimensionless, and error index (Moriasi et al., 2007). In this study, since river358
flows are simulated to serve as as an explanatory variable in subsequent regression analyses,359
we are interested in the variation in discharge rather than the level. Hence, for validation we360
intend to use two standard regression statistics: Pearson’s correlation coefficient r and the361
coefficient of determination R2. The gauged data for validation are monthly average inflows362
to dams from the same source as hydopower generation data. The data are only available363
for dams during their operation time hence the length of gauged series vary across dams.364
It should also be noted that there are many missing values hence gauged series are shorter365
than the generation series. Validation is applied for dams with gauged series long enough366
(at least 30 observations) to provide statistically reliable results.367
Pearson’s correlation coefficient r measures the degree of the linear relationship between368
two types of data, ranging from -1 (perfect negative correlation) to 1 (perfect positive corre-369
lation) (Krause et al., 2005; Moriasi et al., 2007). To have confidence in our simulated data370
we expect a sensible river flow model to have a positive r with a magnitude close to one. As371
we do not have any guide on specific threshold to classify the fit of the model based on r,372
19

we report the significance at conventional levels (i.e., whether two variables are significantly373
correlated or not).374
r =
∑ni=1
(Yobs
i − Yobs) (
Y simi − Y sim
)√∑n
i=1
(Yobs
i − Yobs)2√∑n
i=1
(Y sim
i − Y sim)2
(2)
The coefficient of determination R-squared measures the percentage of the change in375
observed data explained by a best-fit regression line using simulated data as an explanatory376
variable. The value is bounded between 0 and 1, and the higher it is, the better the match377
between observed data and simulated data. A value above 0.5 is considered acceptable378
(Santhi et al., 2001; Van Liew et al., 2007).379
3.6 Regression method380
To estimate hydropower generation using simulated flows, we rely on the linear panel data381
model and the pooled ordinary least squares (POLS) estimator. See Appendix A for more382
details. For inference purposes, we make minimal assumptions about the error term and rely383
on standard errors that are robust to heteroscedasticity and contemporaneous and lagged384
spatial correlation computed by statistical package STATA and command xtscc (Hoechle,385
2007). They are derived from the non-parametric covariance matrix estimator by Driscoll386
and Kraay (1998) adjusted for an unbalanced panel . Driscoll and Kraay (1998) standard387
errors are used because the normal i.i.d assumptions are not appropriate as the variances in388
the errors are likely to be larger for the larger plants. In addition, power generation from389
different plants, especially those within the same basin, are likely to be correlated with each390
other. Finally, the electricity generation from any given plant at a particular time is not in-391
20

dependent of its lagged values. To assess the goodness-of-fit of our models, we consider392
the adjusted R-squared (R2) that measures the percentage of variation in the dependent vari-393
able explained by a model with a penalty for excessive regressors. We employ a number of394
specifications to model hydropower generation as follows:395
Baseline regression In the first stage we examine the degree to which simulated river flow396
explains the production of electricity from hydropower plants. Our baseline specification397
follows Cole et al. (2014) and assumes that the main determinants of hydropower generation398
(Gen) are a quadratic function of river flow (Flow) and dam capacity (CAP):399
Genit = β0 + β1Flowit + β2Flow2it + β3CAPit + λt + µi + εit (3)
where subscripts i and t refer to a hydropower plant and our unit of time, respectively.400
λt is included to capture all time-specific factors (monthly) that have a uniform effect on all401
hydropower plants. µi is the unobservable time-invariant hydropower plant fixed effect and402
εit is an idiosyncratic error term. One should note that our specification differs from Cole403
et al. (2014) in that they studied hydropower generation on a continental scale for Africa at404
yearly intervals, while our study is on a national scale for Vietnam using monthly data.405
The calculation of electricity production from a hydropower plant is given by:406
P = η × ρ × g × Q × H (4)
where P is the power produced at the transformer (million MW), η is the overall effi-407
21

ciency of the power plant, ρ is the density of water (1000 kg/m3), g is the acceleration due408
to gravity (9.81 m/s2), Q is the volume flow rate passing through the turbine (m3/s), and H409
is the net head (m). By assigning a typical overall efficiency of 87% (IFC, 2015) it reduces410
the formula to:411
P(kW) = 8.5 × Q × H (5)
The installed capacity is one of the most prominent features of a hydro plant, which can412
be calculated by equation (4) using design discharge, net head, and the overall efficiency413
for a given design discharge. If the river flow rate passing through a turbine is equal to414
its design discharge, the production of electricity is proportionate to the installed capacity.415
If the flow rate is higher or lower than the design discharge, there will be more or less416
electricity generated. The gap between the flow rate and the design discharge can be sensibly417
proxied by the variation in the river flow into a hydropower plant. We expect positive signs418
for both explanatory variables in a linear specification (β1, β3 > 0). The linear function419
of the inflow’s impact on hydropower electricity generation is based on the assumption of420
constant overall efficiency. In practice, efficiency is a non-linear function of the deviation421
between the turbine discharge and the optimal value, the outcome of which is subject to the422
type of turbine. Figure 4 presents a stylized version of the efficiency profiles of different423
turbine types and shows that plant efficiency is low when the discharge is far below the424
optimal value, and then increases. This suggests that a quadratic function of discharge with425
a negative coefficient for the squared term (β2 < 0) is a more appropriate functional form to426
model hydropower production.427
[Figure 4 about here]428
22

Besides the key determinants, our baseline model includes two-way fixed effects (λt +429
µi + εit). Dam fixed effects µi are included to account for the unobserved features that are430
unchanged overtime. As our SWAT model has not been calibrated, the parameters in the431
rainfall-runoff model can not be considered optimal. Hence, the relationship between sim-432
ulated and actual inflows into a dam depends in part on the heterogeneous characteristics433
of each sub-basin (for example soil composition, land cover distribution and topographic434
features) and are partially absorbed by dam fixed effects. Dam fixed effects also capture435
variations in turbine efficiency across dams. We include time fixed effects to control for com-436
mon trends over time. For example, the performance of satellite data on which our SWAT437
model relied may varying across the months of a year and across years. Likewise, time438
fixed effects will control for any time-varying fluctuations in the demand for electricity that439
is common across the country. Finally, besides measurement error, the idiosyncratic error440
term (εit) captures any unobserved factors that vary across either time or dams, for example,441
production adjustments due to regional changes in demand, deviations from overall turbine442
efficiency, the storage and releasing of water from dam reservoirs, and any hydropower plant443
interactions.444
Flood control regression A key feature of hydropower plants is they important role they445
play in flood control. In Vietnam, 3 basins have reservoirs with a flood control capability446
namely Hong–Thai Binh River, Ma River and Huong River (MONRE, 2012).16 Even hy-447
dropower plants without a specific flood control function are able to store flood water as a448
means to smooth electricity production across time.449
To quantify the degree to which the flood control function of dams affects production of450
16Lo–Gam–Chay River and Da River are parts of larger Hong–Thai Binh River.
23

hydropower we extend the baseline specification to include proxies for floods. We estimate451
three alternative specifications: (1) a dummy variable Floodit (defined as flows that exceed452
the mean flow at each hydropower plant by at least one standard error), (2) its interaction453
terms with inflows into hydropower plants and (3) both (1) and (2) together. The final454
specification is given by:455
Genit = β0 +β1Flowit +β2Flow2it +β3CAPit +γ0Floodit +γ1Flowit×Floodit +λt +µi +εit (6)
where the assumption is that utilizing a dam’s flood control role is at the expense of a456
reduction in hydropower generation even though this shortfall in power generation may be457
considered socially and economically desirable. We expect the estimated coefficients on our458
flood variables to be negative (γ0, γ1 < 0).459
Dam interactions Finally, a little understood issue is how hydropower plants interact with460
each other. Hydropower generation in many basins requires coordination between plants that461
share a common water resource. Knowledge of how these interactions work could facilitate462
improvements in the allocation of existing water resources.463
There are a number of reasons why an upstream plant may potentially influence the464
power generation of downstream plants that can be related to either their construction or465
operation. For example, the building of a hydropower plant is typically associated with466
a degree of deforestation and hence an increase in river-runoff. As a result, downstream467
discharge and electricity generation may increase.17 Alternatively, some hydropower plants468
17A report from the National Assembly reveals that 160 hydropower projects in 29 cities and provinces
24

construct weirs that diverts water to an ‘off-site’ facility that enables it to create a higher469
head for electricity generation (Hecht and Lacombe, 2014) but at the cost of a reduction in470
river flow into downstream rivers which in turn lowers the production of hydropower plants471
in those down stream locations. In terms of operation, upstream plants with large storage472
facilities and no water diversion normally adjust outflows in a way that favours downstream473
electricity generation. By reducing extreme inflows into downstream plants it means that474
the turbines can operate at higher efficiency levels leading to higher levels of electricity475
production.476
The actual effect of dam interactions is therefore an empirical question. To capture the477
cascade effect our solution is to include a proxy for the operation of upstream dams into our478
baseline specification. As part of our robustness checks we include the combined upstream479
capacity and combined upstream production variables (as described in Subsection 3.4). We480
further decompose the impact of cascades by adding interaction terms between upstream481
operation variables and categorical variables of hydrological conditions (flood, normal and482
drought). Finally, we investigate the heterogeneity in dam interaction across basins. Ac-483
cording to PanNature (2011), basin-based water management was adopted in Vietnam fairly484
early.18 As basins have historically been managed by different organizations, dam interac-485
tion could vary across basin. We explore this heterogeneity by adding the interaction terms486
over the period 2006-2012 converted an area of 19,792ha of forest land into land suitable for the location ofhydropower plants (Le and Tran, 2016).
18Water Resources Law issued in 1998 sketched river basin plan regulation and the role of the River BasinPlanning Management Commissions. The commissions then established the management of water resourcesin Cuu Long (Mekong) River (2001), Dong Nai River (2001), Hong–Thai Binh River (2001), Vu Gia–ThuBon (2005) by MARD. Similarly, River Basin Councils with the participation of local governments and theinvolvement of communities were created to manage the Srepok River (2006) and Ca River. Subsequently,the water resource management function was passed from MARD to the newly set-up MONRE with theestablishment of a number of River Basin Environment Protection Commissions in Cau River (2007), DongNai River (2008), and Nhue-Day River (2009). The ineffectiveness of various basin management organizationsmentioned above was addressed by the Decree 120/2008/ND-CP on River Basin management, which soughtto establish consistent basin-based water resources management and proposed the establishment of the RiverBasin Commissions to coordinate and supervise the activities of ministries, and local governments related towater resources planning and management.
25

between the proxies for upstream operation and dummies for each basin.487
4 Results and discussions488
4.1 Simulated discharge validation489
The validation is made for simulated inflows to 24/40 studied hydropower dams (belonging490
to 11/12 studied basins) that have at least 30 gauged observations for comparison.19 The as-491
sessment results are shown in Table 6. Overall, all simulated flows are positively correlated492
with the gauged flows. The magnitude of the Pearson correlation coefficients (r) ranges from493
0.33 (An Khe - Kanak) to 0.90 (Thac Mo). The mean and median of these coefficients are494
0.70 and 0.72 respectively. Almost every correlation is significant at 1%. The exceptions495
are An Khe - Kanak and Quang Tri, which are significant at 10% and 5% respectively. The496
coefficients of determination (R2) vary between 0.11 and 0.8. Based on the threshold of 0.5497
for the this statistic, our rainfall-runoff model could be labelled as ‘acceptable’ for inflows498
to 13/24 dams. Both the mean and median of these R2 are 0.52 and exceed the threshold.499
[Table 6 about here]500
There are a number of reasons why the simulated data does not perfectly match the501
observed data. Firstly, the model may inherit errors in the data, especially when we need502
to rely on remote-sensing data for our large scale study. For example, the HydroSHEDS503
dataset is known to be exposed to error in coastal areas (Lehner, 2013) due to SRTM satellite504
operation characteristics (Farr et al., 2007). The problem is amplified as Vietnam is a coastal505
19The only basin that has no dam validated is the Huong River Basin.
26

country and stretches along the sea. Our model perform better for basins in the North and the506
South rather than those in the Central part of the country. It is indeed difficult to accurately507
model discharge in small, narrow coastal basins like Huong River, or Thach Han River due508
to the strong influence of the tide. In addition, we simulated the model with assumptions509
of no change in topography, soil profile and land cover. We acknowledge that this is a510
reasonably strong assumption over a long period of time.511
As our time period covers a time when Vietnam experienced rapid economic develop-512
ment, the change in land cover could be considerable (for example deforestation and urban-513
ization). A boom of hydropower in Vietnam and countries upstream may also have a consid-514
erable impact on river flow regimes and sediment patterns. Finally, as our SWAT model was515
not calibrated, the default parameters that we rely on may not be optimal for Vietnam. An516
appropriate adjustment of the parameters ET, lateral flow, surface runoff, return flow and tile517
flow processes (Arnold, Moriasi, et al., 2012) may improve the performance of the model.518
However, we were not able to execute such an approach in this study due to a shortage of519
longer observed flows that would be necessary for calibration.520
Nevertheless, by exploiting information on the variation of discharge data rather than521
its level, the simulated flows appears to be useful given the significant and relatively high522
correlation with gauged flows. The introduction of fixed effects and dam interconnection523
modelling in regressions are expected to help mitigate some of the problems mentioned524
above. The above assessment also indicates that there are substantial similarities in SWAT525
model performance for dams in the same basin. This is a signal of potential spatial corre-526
lation besides possible serial correlation and motivates our decision to adjust the standard527
errors following Driscoll and Kraay (1998). See subsection 3.6 for details.528
27

4.2 Regression results529
4.2.1 Hydropower generation (baseline model)530
First, to arrive at the baseline specification we add each regressor sequentially which en-531
ables us to consider the contribution of each explanatory variable to the operation of hydro-532
plants. The results from Columns (1) to (5) in Table 7 show that all the regressors in the533
baseline specification appear with the expected signs and significance at the conventional534
levels. Column (1) shows that discharge is the main explanatory variable for hydropower535
electricity production with its variation alone explaining 64.4% of the variation in electric-536
ity generation. The non-linear specification in Column (2) provides additional explanatory537
power and adds 1.5% to the goodness-of-fit. A negative and significant quadratic term sug-538
gests that higher discharge increases production but at a decreasing rate before it reaches a539
turning point. Our finding is similar to that for African hydropower production shown in540
(Cole et al., 2014). The reason for the inverted U is due to the variation in efficiency of541
turbines discussed in Subsection 3.6.20 In Column (3) we include installed capacity which is542
found to be positive and significant and increases the adjusted R-squared by a further 19.3-543
percentage points to 0.853 and reduces the coefficients on both discharge and its squared544
term by roughly a half. The inclusion in Columns (4) and (5) of plant and time fixed effects545
respectively only marginally increases the goodness of fit. Our final baseline specification546
in Column (5) explains 87.7% of the variation in hydropower electricity generation.547
[Table 7 about here]548
20The average turning point is estimated to be approximately 9,820 (m3/s), which is out of range of thedischarge sample.
28

4.2.2 Flood control549
Column (6) of Table 7 includes a dummy for a flood and indicates that, on average, a plant550
during those months of flooding produces 795.5 MWh per day less than during normal op-551
eration conditions (which is equivalent to 18.2% of the mean production of the sample). In552
Column (7) we include the interaction term which suggests that a higher reduction in elec-553
tricity production mitigates a more severe flood. On average, a plant reduces its production554
by 1 MWh/day to mitigate 1 (m3/s) increase in flood flow. When we add both a dummy555
for a flood and its interaction term with discharge in Column (8), only the coefficient of the556
latter is statistically different from zero and the estimate of the coefficient is just below -1557
(m3/s). It should be noted that as we do not model dynamics, the sacrifice of electricity558
generation for flood control purposes should be interpreted as a contemporaneous response559
rather than a permanent trade-off.21 Dams can use water stored during periods of flooding560
to generate electricity at a later date. The large and significant coefficients estimated here561
provide evidence of the substantial benefits of large dams to mitigate the adverse impact of562
extreme weather events.563
4.2.3 Hydropower plant cascade interactions564
In Table 8 we present our estimates for the impact of hydropower cascades on hydropower565
production. In addition to our proxy for the operation of upstream dams we also include566
year and dam fixed effects. Our upstream dam proxies in Columns (1) and (3) are the sum567
of hydropower capacity installed upstream and the sum of hydropower generated upstream.568
The results show that upstream plant have a positive and significant impact on hydropower569
21We thank an anonymous referee for raising this point.
29
production although capacity is only significant at the 10 percent level. The interpretation570
of the coefficients is straightforward. Each additional MW of hydropower capacity installed571
upstream increases the daily production of a downstream plant by 1.332 MWh (Column 1).572
This is equivalent to 0.03% the mean production of the sample. Column (3) shows that an573
increase by 1 MWh in the production of upstream plants adds 0.146 MWh to downstream574
production.575
[Table 8 about here]576
In Columns (2) and (4) we include interaction terms to evaluate the synergies under577
different hydrological conditions. Column (2) suggests that for downstream electricity gen-578
eration, on average each extra MW upstream adds 1.28 MWh in normal conditions, 2.721579
MWh under extremely dry conditions and reduces production by 0.167 MWh under ex-580
tremely wet conditions. Column (4) indicates that a 1 MWh increase in upstream production581
induces a rise in downstream production by 0.161 MWh under normal discharge conditions,582
by 0.0634 MWh under flood conditions and 0.341 MWh in a drought. The differences be-583
tween the coefficients under extremely dry conditions and normal conditions is significant584
at the 1% level.585
Our results highlight that hydropower cascades can be successfully used to improve the586
reliability of power supply and as an adaptation measure against future extreme weather587
conditions. During period of drought an upstream plant can roughly double the production588
of downstream plants but has a negligible effect during extreme wet conditions. The logic is589
simple. Upstream plants store water during floods and release water during droughts, which590
in both cases improves the efficiency of downstream plants.591
To investigate the cascade effect further, in Table 9 we include hydropower dam inter-592
30

actions at the basin scale. Since there are no cascades among the plants in the basins of the593
Thach Han River, Kon-Ha Thanh River and Vu Gia–Thu Bon River, the results in Table 9594
estimate the spillover effects for 9 basins only.22 Our results now suggest that the spillover595
effect of upstream plants is not always positive. While synergies are found for the Da River,596
Sesan River, and Srepok River, we find a negative spillover effect for the Dong Nai River,597
Ba River, Ca River, Huong River, and Ma River. Although all of the positive synergies are598
significant, the only negative and significant impact is for the Dong Nai River and the Ca599
River.600
[Table 9 about here]601
An important question is whether these synergies were anticipated before the construc-602
tion of new upstream plants. If this is the case, if well coordinated, the construction of an603
upstream plant can be equivalent to extending downstream storage such that downstream604
plants can store and release stored water to maximize power generation. An example of605
coordinated construction comes from Srepok where the construction of the Buon Tua Srah606
dam (86 MW) was predicted to enhance the generation of the Buon Kuop and Srepok 3607
dams by 77 million kWh and 34.8 million kWh, respectively (VINACONEX, 2017). In the608
Da River basin, the installation of Son La dam (2400 MW), the largest hydropower dam of609
Vietnam (and in Southeast Asia), was expected to increase the annual production of Hoa610
Binh dam by 1.26 billion kWh (Vietnam National Committe on Large Dams and Water611
Resources Development, 2006). Similarly, the operation of Ban Chat dam (220MW), up-612
stream of Son La dam since 2013, was expected to add nearly 0.4 billion kWh per year to613
two downstream dams (Vietnam National Committe on Large Dams and Water Resources614
22The estimates for Ca River, Huong River and Srepok River using interaction terms for upstream damsinstalled capacity were dropped due to the perfect multicollinearity with dam fixed effects.
31

Development, 2015). Finally, in the Sesan river, the most upstream hydropower plant (Plei615
Krong 1 – 100 MW) was supposed to increase the installed capacity of downstream plants616
(Yaly, Sesan 3 and Seasan 4) by 157.3 MW and to increase production by 217.1 million617
kWh/year (Ialy Hydropower Company, 2017)618
The negative spillovers are most likely the result of the deliberate diversion of water by619
upstream dams. Given the multi-purpose nature of dams, this negative impact may be inten-620
tional. The claim is that the Dai Ninh dam and Dong Nai 3 dam in the Dong Nai River were621
constructed to help prevent flooding in downstream districts of Lam Dong province and to622
reduce the flooding pressure on the most downstream hydropower dams in this basin (Tri623
An dam) (Pham, 2014). At other times, droughts caused by hydropower dams is unintended624
and undesirable. One of the most frequently criticised is the case of An Khe–Kanak dam625
(173 MW) which, after starting operation, began to store water from the Ba River but to dis-626
charges water into the Kon River to create a higher head and to improve its own production627
(MONRE, 2012). The result was that a downstream segment of Ba River became dry and628
adversely affected the welfare of nearby residents.629
Although our results are robust to different specifications, it is worth noting that while630
we control for dam heterogeneity and time heterogeneity, there may still be some omitted631
variable bias if there are unobserved factors that vary both spatially and temporally. One632
example might be variations in weather conditions such as temperature and rainfall which633
are correlated with discharge and therefore could simultaneously affect hydropower supply634
through changes in demand for electricity. In this case, hot weather induces higher demand635
for cooling. However, over our time period, power transmission and distribution in Viet-636
nam was centrally managed which should mean that these factors have a uniform impact637
on plants and hence be absorbed by time fixed effects. In addition, as hydropower was the638
32

cheapest form of electricity generation, it is used to cover the base load and hence should639
be less sensitive to demand fluctuations than other energy sources. A second concern is640
that physical processes like land cover changes, soil degradation and sediment transporta-641
tion that were excluded from our SWAT model, could bring about a degree of measurement642
error. For simplicity, we assume that this source of error is exogenous. Finally, Vietnam is643
located downstream of a large number of international rivers, such that upstream changes644
could affect the discharge into Vietnam’s basins. Although our SWAT model already ac-645
counts for variations in weather in upstream sub-basins outside Vietnam, the construction646
and operation of neighbouring countries’ hydropower plants is beyond the scope of this647
study. For example, the construction of new hydropower plants in China has been blamed648
for worsening the drought that hit Southeast Asia (The Diplomat, 2016). Vietnam and Laos649
are also predicted to be the most badly affected from the proliferation of new hydropower650
plants along the Mekong River (The Economist, 2012, 2016).651
5 Conclusions652
In this paper we apply the SWAT river flow model combined with regression analysis to653
explain the operation of hydropower plants on a national scale in a hydro-dependent country654
with a diversity of terrain and climate conditions. Although Vietnam has experienced a655
period of rapidly-growing demand for energy (12-15% per year), it also faces the challenge656
of potentially adverse impacts of climate change.657
As far as we are aware, this is the first study to build a river flow model using SWAT658
for Vietnam as a whole. To take into account the high level of inter-connectivity between659
Vietnam’s rivers and upstream sources beyond its border, the extent of our river flow model660
33

covers a large part outside Vietnam. It includes three inter-boundary basins: Red River,661
Vietnam Coast, and Lower Mekong River, in which Vietnam shares water resources with662
China, Laos, Cambodia, Myanmar and Thailand. The watershed of 977,964 km2 is di-663
vided into 7,887 sub-basins with a mean area of 131.6km2 and 53,024 HRUs. Such a664
detailed analysis is possible thanks to a variety of high-resolution datasets, especially Hy-665
droSHEDS/HydroBASINS, which is finer than Hyro1K and a topographic and hydrographic666
dataset widely used in previous economic studies using river flow models. River-flow was667
simulated for the period from 1995 to mid-2014, coinciding with a period when both power668
supply and power demand of Vietnam increased dramatically. Since it is mainly dependent669
on global datasets derived from satellite data, the method described within this study could670
be easily replicated for other countries and regions.671
Our regression analysis uses panel data fixed effects regression models to explain the672
operation of large hydropower plants across Vietnam. Simulated discharge is shown to be673
a good proxy for inflows into hydropower plants. Our results are similar to those of Cole674
et al. (2014) and show that installed capacity and a quadratic function of discharge are the675
key determinants of hydropower generation. Furthermore, our model shows evidence of a676
flood control benefit of large hydropower plants across Vietnam.677
Finally, we used simulated flows to evaluate the coordination and the spillover effect678
among hydropower plants in Vietnam. Overall, the construction and operation of upstream679
plants improves the generation efficiency of downstream plants. The effect is particularly680
large during periods of drought, with a smaller but still positive effect for floods. However,681
the impact is not the same across all basins. The two basins that are the most important for682
hydropower provide contrasting results with a negative impact found for the Dong Nai River683
(in the South), although this is compensated for by a stronger flood control role to protect684
34

the downstream area, while we find a strong positive synergy for the Da River (in the North).685
In future research it would be interesting to also consider more carefully changes in686
power demand, land cover, soil degradation, and sediment transportation. In addition, more687
detailed calibration could improve the accuracy of the river flow model. However, due to688
current data limitations we leave this for future research. Nevertheless, using simulated689
discharge still manages to explain up to 87.7% of the monthly variation in hydropower690
generation (using the two-way fixed effect regressor including installed capacity, discharge691
and its squared term). This suggests that river flow simulated from a SWAT model, even692
without calibration, serves as a good predictor for hydropower electricity generation. We693
acknowledge that our flood measure is relatively coarse and is not able to capture all aspects694
of floods in a monsoon context (to be able to differentiate the impacts of beneficial vs disaster695
floods) and our static model of flood control benefit is not appropriate to model the long run696
impact. Improvements in either flooding data or dynamic modelling techniques would be697
useful for future research. Finally, our study concentrates on large dams and excludes the698
impact of medium and small plants, which grew dramatically after 2010 and may impact699
the hydropower plant cascade effect. Compared to large hydropower plants, the lack of700
supervision, coordination and regulation with regards to the construction and operation of701
small and medium hydropower in Vietnam is problematic (PanNature, 2010). Hence, one702
should not generalize the results in this paper for hydropower dams of all sizes.703
Our study has a number of policy implications. First, we provide evidence to that an hy-704
dropower operation with large reservoirs and cascades of hydropower plants can strengthen705
the resilience of the national power supply system against the adverse impact of future cli-706
mate change. However, harmonizing the operation of plants that share common water re-707
sources is not simple, as evidenced by the finding of significant and negative spillovers708
35

for some basins. Finally, although we only quantify the impact of hydropower plants on709
downstream electricity generation, it is implicitly made clear that upstream plants can have710
an important impact on downstream flow regime (seasonality, water availability and so on).711
This implies potentially large impacts on downstream ecosystems and other economic activ-712
ity using water resources (i.e. agriculture), as well as the welfare of downstream inhabitants.713
Given the numerous interconnections between Vietnam’s rivers and those of its neighbours,714
our findings also raise concerns about possible hydro-ecological consequences associated715
with the proliferation of large upper dam projects on the Mekong River. The challenges716
associated with inter-basin dam operation management are likely to be even harder when717
cross-border coordination is required.718
A Appendix: Regression estimators719
Our method is based on the linear panel data model:
yit = x′itβ + εit; i = 1, 2, ...,N; t = 1, 2, ...,T
where i and t are respectively indices for dam and time, scalar y is the dependent variable,720
x is a K × 1 vector of independent variables, which may contain an intercept, dummies and721
non linear variable (interaction and/or quadratic terms). β is a K × 1 vector of unknown722
coefficients, which are restricted to be common across time and dam. However, change in723
parameters across dam or time are permitted by the inclusion of appropriate regressors in x724
(for example time dummies or dam dummies).725
36

Our coefficients are estimated using a pooled ordinary least squares (POLS) estimator:726
β =( N∑
i=1
T∑t=1
x′itxit
)−1( N∑i=1
T∑t=1
x′ityit
)(A1)
The estimator is shown to be consistent (Wooldridge, 2010, pg. 192) as long as E(x′tεt) =727
0, for t = 1, 2, ...,T (exogeneity condition) and rank[ T∑
t=1
E(x′txt)]
= K (no perfect collinear-728
ity condition).729
The goodness-of-fit of regressions are computed as:730
R2 =
∑(yit − y)2∑(yit − y)2 (A2)
R2 = 1 −n − 1n − K
(1 − R2) (A3)
where yit and y are respectively the predicted values and the mean of the observed values of731
the dependent variable. n is the number of observations. R2 is bounded by 0 and 1. R2 never732
exceeds R2 and can be negative if a poorly-performing model includes too many redundant733
regressors. In general, a model with higher R2 or R2 fits the observed data better.734
37

Figures
Figure 1: Watershed delineation
Source: Authors compiled from HydroSHEDS/HydroBASINS (Lehner et al., 2008; Lehner and Grill, 2013)and ‘Rivers in South and East Asia’ (FAO, 2014). Note: The resolution of HydroSHEDS void-filled DEM is 3arc-seconds. The resolution of HydroBASINS river network is 15 arc-seconds.
38
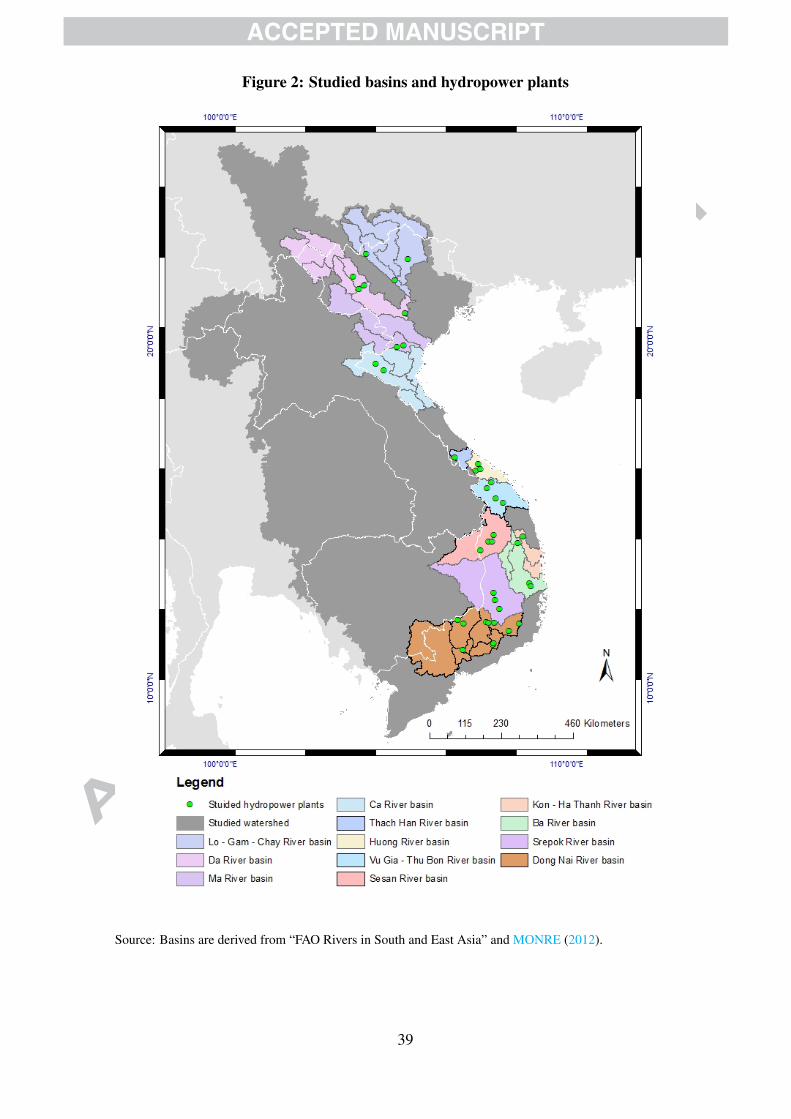
Figure 2: Studied basins and hydropower plants
Source: Basins are derived from “FAO Rivers in South and East Asia” and MONRE (2012).
39
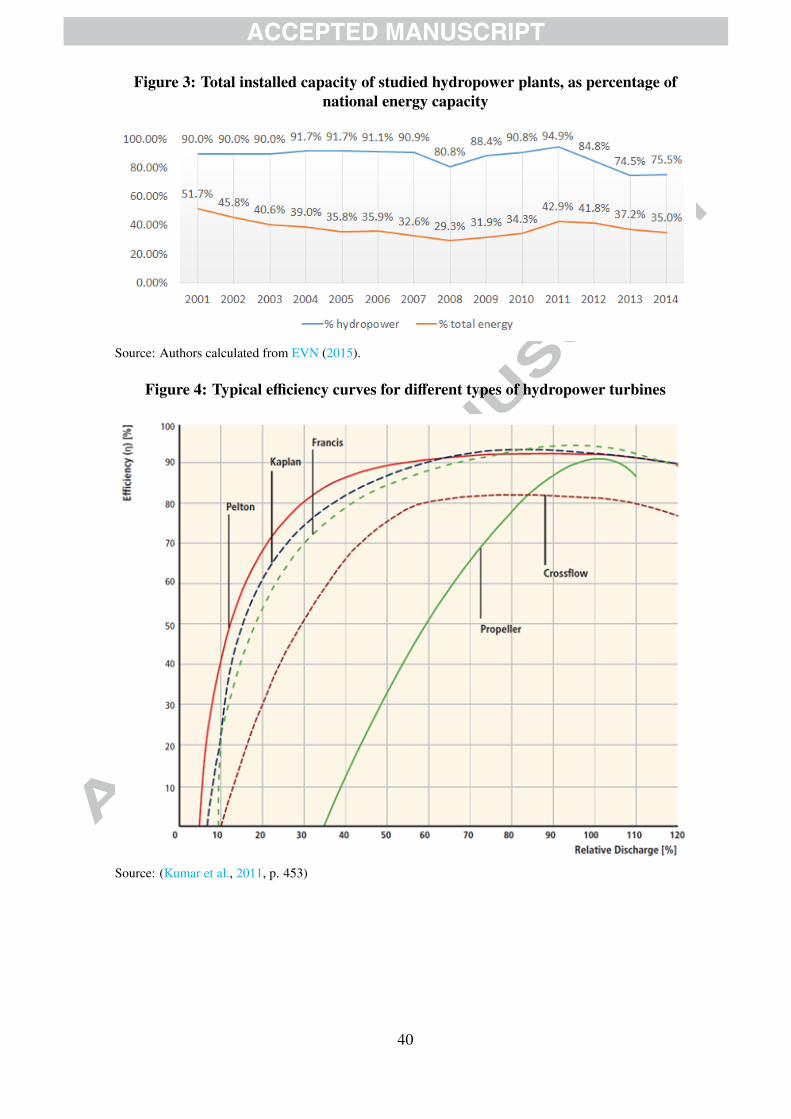
Figure 3: Total installed capacity of studied hydropower plants, as percentage ofnational energy capacity
Source: Authors calculated from EVN (2015).
Figure 4: Typical efficiency curves for different types of hydropower turbines
Source: (Kumar et al., 2011, p. 453)
40

Tables
Table 1: Data description and sources for SWAT simulation
Data types Sources Resolution
Predefined basins HydroBASINShttp://www.hydrosheds.org/page/hydrobasins
15 arc-seconds
and river networks Rivers in South and East Asiahttp: / / ref .data . fao.org /map?entryId=dc2a5121- 0b32-482b-bd9b-64f7a414fa0d
30 arc-seconds
Digital Elevation Model(DEM)
HydroSHEDS void-filled DEMhttp://www.hydrosheds.org/
3 arc-seconds
Soil Digital Soil Map of the World version 3.6http://www.fao.org/geonetwork/srv/en/metadata.show?id=14116
5 arc minutes
Land cover UMD Land Cover classification collectionhttp://glcf.umd.edu/data/landcover/
1km pixels
Weather CFSR-NCEPhttps://globalweather.tamu.edu/
19 arc-seconds
Note: See text for more details
Table 2: Summary statistics of subbasins
(1) (2) (3) (4) (5)
VARIABLES N mean sd min max
All sub-basins within the watershed
Area of the sub-basin 7,887 131.6 56.52 0.2 368.6
Total upstream area 7,887 15,443 77,756 0.4 774,282
Distance to the next downstream sink 7,887 951.4 754.4 0 3,628
Distance to the most downstream sink 7,887 957 751.3 0 3,628
Sub-basins within Vietnam
Area of the sub-basin 2,617 131.9 58.4 0.2 368.6
Total upstream area 2,617 7,812 59,053 0.4 774,282
Distance to the next downstream sink 2,617 341.4 417.2 0 2,506
Distance to the most downstream sink 2,617 343.6 416.4 0 2,506
Source: Authors compiled from HydroBASINS dataset (level 12).
Note: N=Number of observations. sd= standard deviation
41

Table 3: Studied hydropower plants
Basin Dams
Lo - Gam - Chay Thac Ba (120 MW), Tuyen Quang (342 MW), Bac Ha (90MW)
Da Hoa Binh (1920 MW), Son La (2400 MW), Nam Chien(200 MW), Ban Chat (220 MW)
Ma Hua Na (180 MW), Cua Dat (97 MW)
Ca Khe Bo (100 MW), Ban Ve (320 MW)
Thach Han Quang Tri (64 MW)
Huong A Luoi (170 MW), Binh Dien (44 MW), Huong Dien (71MW)
Vu Gia – Thu Bon Song Tranh 2 (190 MW), Dak Mi 4 (190 MW), A Vuong(210 MW), Song Con (63 (MW)
Kon – Ha Thanh Vinh Son (66 MW)
Sesan Sesan 4 (360 MW), Sesan 3 (260 MW), Yaly (720 MW),Plei Krong 1 (100 MW)
Ba Song Hinh (70 MW), Song Ba Ha (220 MW), An Khe-Knak (173 MW)
Srepok Buon Tua Srah (86 MW), Buon Kuop (280 MW), Srepok 3(220 MW)
Dong Nai Tri An (400 MW), Da Mi (175 MW), Ham Thuan (300MW), Dai Ninh (300 MW), Da Nhim (160 MW), Thac Mo(150 MW), Dong Nai 3 (180 MW), Dong Nai 4 (340 MW),Dak R’Tih (144 MW), Can Don (78 MW)
42

Tabl
e4:
The
casc
ades
ofhy
drop
ower
Upd
amB
acH
aB
anC
hat
Nam
Chi
enH
uaN
aB
anVe
AL
uoi
Plei
Kro
ng1
An
Khe
-Kan
akB
uon
Tua
Srah
Tha
cM
oD
aN
him
Dai
Nin
hH
amT
huan
Bas
inLo
-Gam
-Cha
yD
aD
aM
aC
aH
uong
Sesa
nB
aSr
epok
Don
gN
aiD
ong
Nai
Don
gN
aiD
ong
Nai
Dis
tanc
e0
Da
Mi
1 2C
uaD
atH
uong
Die
nC
anD
on3
Khe
Bo
Yal
y4
Son
La
Sesa
n3
Buo
nK
uop
5 6D
ong
Nai
37
Don
gN
ai4
8Se
san
4Sr
epok
3D
ong
Nai
3D
akR
’Tih
9D
ong
Nai
410
Dak
R’T
ih14
Tha
cB
a15
TriA
n16 17 18
Song
Ba
Ha
20H
oaB
inh
21 23Tr
iAn
25H
oaB
inh
TriA
n
The
upst
ream
-dow
nstr
eam
rela
tions
hip
was
dete
rmin
edby
the
Hyd
roSH
ED
SID
syst
emof
Hyd
roB
ASI
NS
data
set.
Dis
tanc
ew
asm
easu
red
byth
enu
mbe
rofs
ub-b
asin
s(a
tlev
el12
ofH
ydro
SHE
DS
data
set)
betw
een
each
upst
ream
and
dow
nstr
eam
dam
s.
43

Table 5: Summary statistics
(1) (2) (3) (4) (5)VARIABLES N mean sd min max
Dam statisticsYear of Operation 40 2005 10.5 1964 2013Total storage capacity (million m3) 40 1,164 2,098 30.4 9,862Full installed capacity (MW) 40 294 455 44 2,400
Production statistics (Jan 1995 – Jul 2014)Average production (MWh/day) 2,984 4,393 6,754 0 46,833Installed capacity (MW) 2,984 376.3 521.4 22 2,400Flow to dam (m3/s); SWAT simulation 2,984 465.5 979.5 0.120 9,105Upstream capacity (MW) 2,984 141.9 360.9 0 2,820Upstream production (MWh/day) 2,984 1,615 4,161 0 45,781
Note: N=Number of observations. sd= standard deviation
44

Table 6: Simulated discharge validation
Dam Basin Capacity (MW) N r R2
Thac Ba Lo - Gam - Chay 120 235 .82*** .67*
Tuyen Quang Lo - Gam - Chay 342 70 .8*** .64*
Hoa Binh Da 1920 235 .88*** .78*
Son La Da 2400 43 .81*** .65*
Cua Dat Ma 97 31 .75*** .56*
Ban Ve Ca 320 31 .68*** .47
Quang Tri Thach Han 64 31 .41** .17
A Vuong Vu Gia - Thu Bon 210 31 .6*** .36
Vinh Son Kon - Ha Thanh 66 209 .7*** .49
Sesan 3 Sesan 260 31 .54*** .29
Yaly Sesan 720 171 .73*** .53*
Plei Krong 1 Sesan 100 31 .82*** .68*
Song Hinh Ba 70 171 .86*** .73*
Song Ba Ha Ba 220 31 .69*** .48
An Khe - Kanak Ba 173 31 .33* .11
Buon Kuop Srepok 280 31 .71*** .5*
Tri An Dong Nai 400 235 .82*** .67*
Da Mi Dong Nai 175 122 .42*** .17
Ham Thuan Dong Nai 300 160 .53*** .28
Dai Ninh Dong Nai 300 70 .68*** .46
Da Nhim Dong Nai 160 235 .65*** .42
Thac Mo Dong Nai 150 223 .9*** .8*
Dong Nai 3 Dong Nai 180 31 .85*** .73*
Can Don Dong Nai 78 31 .86*** .74*
Note: Capacity indicates full installed capacity. N indicates number of observa-tions. Significance level for Pearson correlation coefficient (r): *** p<0.01, **p<0.05, * p<0.1. For the coefficient of determination (R2) to indicate acceptablemodel (Santhi et al., 2001; Van Liew et al., 2007): * (R2 ≥ 0.5).
45

Tabl
e7:
Prod
uctio
nre
gres
sion
usin
gsi
mul
ated
disc
harg
e
(1)
(2)
(3)
(4)
(5)
(6)
(7)
(8)
VAR
IAB
LE
SA
vera
gepr
oduc
tion
(MW
h/da
y)
Inte
rcep
t1,
818*
**1,
382*
**76
.50
1,64
5***
901.
4***
899.
6***
825.
5***
826.
9***
(155
.3)
(121
.4)
(106
.5)
(217
.7)
(229
.7)
(232
.8)
(237
.5)
(236
.1)
Flow
toda
m(m
3 /s)
;SW
AT
sim
ulat
ion
5.53
3***
7.45
9***
3.10
8***
4.19
8***
4.47
8***
4.62
7***
4.64
1***
4.64
7***
(0.3
39)
(0.4
87)
(0.3
70)
(0.4
64)
(0.5
54)
(0.5
74)
(0.5
87)
(0.5
94)
Flow
toda
m(m
3 /s)
;SW
AT
sim
ulat
ion
squa
red
-0.0
0039
2***
-7.3
9e-0
5-0
.000
212*
*-0
.000
228*
*-0
.000
233*
*-0
.000
102
-0.0
0010
5
(0.0
0010
5)(8
.71e
-05)
(8.6
4e-0
5)(9
.24e
-05)
(9.2
5e-0
5)(0
.000
108)
(0.0
0011
8)
Inst
alle
dca
paci
ty(M
W)
7.85
8***
6.31
9***
5.85
6***
5.90
4***
5.99
6***
5.99
6***
(0.3
75)
(1.1
18)
(1.1
86)
(1.1
85)
(1.1
90)
(1.1
90)
Floo
d-7
95.5
***
-48.
06
(266
.1)
(286
.5)
Inflo
w*F
lood
-1.0
01**
-0.9
81**
(0.3
86)
(0.4
54)
Obs
erva
tion
num
ber
2,98
42,
984
2,98
42,
984
2,98
42,
984
2,98
42,
984
R-s
quar
ed0.
644
0.66
00.
854
0.87
50.
889
0.89
00.
892
0.89
2
Adj
uste
dR
-squ
ared
.644
.659
.853
.873
.877
.879
.881
.881
Dam
dum
mie
sY
YY
YY
Tim
edu
mm
ies
YY
YY
Dri
scol
l-K
raay
stan
dard
erro
rsin
pare
nthe
ses.
***
p<0.
01,*
*p<
0.05
,*p<
0.1.
46

Table 8: The synergies of hydropower cascades
(1) (2) (3) (4)VARIABLES Average production (MWh/day)
Variables for dam operation
Installed capacity (MW) 5.876*** 5.880*** 5.859*** 5.834***(1.182) (1.176) (1.190) (1.184)
Flow to dam (m3/s); SWAT simulation 4.476*** 4.984*** 4.359*** 4.865***(0.544) (0.554) (0.559) (0.568)
Flow to dam (m3/s); SWAT simulation squared -0.000225** -0.000275*** -0.000216** -0.000267***(9.19e-05) (9.17e-05) (9.14e-05) (9.11e-05)
Variables for upstream dam operation
Upstream capacity (MW) 1.332* 1.280(0.705) (0.853)
Upstream capacity (MW)*Flood -1.447**(0.689)
Upstream capacity (MW)*Drought 1.441**(0.574)
Upstream production (MWh) 0.146** 0.161**(0.0598) (0.0695)
Upstream production (MWh)*Flood -0.0976*(0.0541)
Upstream production (MWh)*Drought 0.180***(0.0446)
Intercept -429.8 -553.0 -430.3 -523.5(464.2) (456.5) (468.7) (464.6)
Observation number 2,984 2,984 2,984 2,984R2 .891 .893 .892 .895Adjusted R2 .88 .88 .88 .88
*** p<0.01, ** p<0.05, * p<0.1.Dam fixed effects and time fixed effects are included. Driscoll-Kraay standard errors are in parentheses.
47

Table 9: The synergies of hydropower cascades by basin
(1) (2)VARIABLES Average production (MWh/day)
Installed capacity (MW) 5.724*** (1.165) 5.716*** (1.164)Flow to dam (m3/s); SWAT simulation 4.719*** (0.533) 4.625*** (0.545)Flow to dam (m3/s); SWAT simulation squared -0.000247*** (8.69e-05) -0.000246*** (8.54e-05)Interaction: Updams operation*Ba -3.818 (2.699) -0.170 (0.247)Interaction: Updams operation*Ca -0.697* (0.402)Interaction: Updams operation*Da 2.157*** (0.783) 0.220*** (0.0685)Interaction: Updams operation*Dong Nai -2.136*** (0.501) -0.135*** (0.0428)Interaction: Updams operation*Huong -0.618 (0.711)Interaction: Updams operation*Lo - Gam - Chay 1.289 (3.862) -0.307 (0.555)Interaction: Updams operation*Ma -1.495 (2.252) -0.166 (0.222)Interaction: Updams operation*Sesan 2.314 (9.777) 0.215*** (0.0427)Interaction: Updams operation*Srepok 0.577*** (0.0639)
Observation number 2,984 2,984R2 .896 .897Adjusted R2 .885 .886Upstream operation Installed capacity Production
*** p<0.01, ** p<0.05, * p<0.1.Dam fixed effects and time fixed effects are included. Driscoll-Kraay standard errors are in parentheses. Upstreamoperation indicates which variable is used to proxy for operation of upstream dams: (combined upstream) installedcapacity (MW) or (combined upstream) production (MWh/day)
48

References
Abbaspour, K. C., Rouholahnejad, E., Vaghefi, S., Srinivasan, R., Yang, H. and Kløve,B. (2015), ‘A continental-scale hydrology and water quality model for Europe: Calibra-tion and uncertainty of a high-resolution large-scale SWAT model’, Journal of Hydrology524, 733–752.URL: http://www.sciencedirect.com/science/article/pii/S0022169415001985
ADB (2013), Vietnam Environment and Climate Change Assessment, Report, AsianDevelopement Bank.URL: http://www.adb.org/sites/default/files/institutional-document/33916/files/viet-nam-environment-climate-change.pdf
ADB (2015a), Assessment of Power Sector Reforms in Viet Nam - Country Report, Report,Asian Developement Bank.URL: https://www.adb.org/sites/default/files/institutional-document/173769/vie-power-sector-reforms.pdf
ADB (2015b), Energy efficiency developments and potential energy savings in the GreaterMekong Subregion, Report, Asian Development Bank.URL: https://www.adb.org/sites/default/files/publication/161894/energy-efficiency-savings-gms.pdf
Alam, M. (2013), ‘Coping with blackouts: Power outages and firm choices’.
Allcott, H., Collard-Wexler, A. and O’Connell, S. D. (2016), ‘How Do Electricity ShortagesAffect Industry? Evidence from India’, American Economic Review 106(3), 587–624.URL: http://www.aeaweb.org/articles?id=10.1257/aer.20140389
Allen, R. G. (1986), ‘A Penman for All Season’, Irrigation and Drainage 112(4), 348–368.
Allen, R. G., Jensen, M. E., Wright, J. L. and Burman, R. D. (1989), ‘Operational Estimatesof Reference Evapotranspiration’, Agronomy Journal 81(4), 650–662.URL: http://dx.doi.org/10.2134/agronj1989.00021962008100040019x
Arndt, C., Tarp, F. and Thurlow, J. (2015), ‘The Economic Costs of Climate Change: AMulti-Sector Impact Assessment for Vietnam’, Sustainability 7(4), 4131–4145.
Arnold, J. G. and Fohrer, N. (2005), ‘SWAT2000: current capabilities and research oppor-tunities in applied watershed modelling’, Hydrological Processes 19(3), 563–572.URL: http://dx.doi.org/10.1002/hyp.5611
Arnold, J. G., Srinivasan, R., Muttiah, R. S. and Williams, J. R. (1998), ‘Large Area hy-drologic modeling and assessement part 1: Model development’, JAWRA Journal of theAmerican Water Resources Association 34(1), 73–89.URL: http://dx.doi.org/10.1111/j.1752-1688.1998.tb05961.x
Cole, M., Elliott, R. and Strobl, E. (2014), ‘Climate Change, Hydro-Dependency, and theAfrican Dam Boom’, World Development 60, 84.
49
CRED (2015), The human cost of weather related disasters (1995-2015), Report, Centre forResearch on the Epodemiology of Disasters (CERD).URL: https://www.unisdr.org/2015/docs/climatechange/COP21_WeatherDisastersReport_2015_FINAL.pdf
de Faria, F. A. M., Davis, A., Severnini, E. and Jaramillo, P. (2017), ‘The local socio-economic impacts of large hydropower plant development in a developing country’, En-ergy Economics 67(Supplement C), 533–544.URL: http://www.sciencedirect.com/science/article/pii/S014098831730292X
Di Luzio, M., Srinivasan, R. and Arnold, J. G. (2004), ‘A GIS-Coupled Hydrological ModelSystem for the Watershed Assessment of Agricultural Nonpoint and Point Sources ofPollution’, Transactions in GIS 8(1), 113–136.URL: http://dx.doi.org/10.1111/j.1467-9671.2004.00170.x
Driscoll, J. and Kraay, A. (1998), ‘Consistent Covariance Matrix Estimation With SpatiallyDependent Panel Data’, The Review of Economics and Statistics 80(4), 549–560.URL: http://EconPapers.repec.org/RePEc:tpr:restat:v:80:y:1998:i:4:p:549-560
EVN (2015), Report on National Power System Operation 2014, Report, Electricity of Viet-nam.
FAO (2007), ‘Digital Soil Map of the World’.URL: http://www.fao.org/geonetwork/srv/en/metadata.show?id=14116
FAO (2011), Climate change impacts on agriculture in Vietnam, ReportUNJP/VIE/037/UNJ.
FAO (2014), ‘Rivers in South and East Asia (Derived from HydroSHEDS) Map’.URL: http://ref.data.fao.org/map?entryId=dc2a5121-0b32-482b-bd9b-64f7a414fa0d
FAO (2015), ‘GAUL 2015 Data License’.
Farr, T. G., Rosen, P. A., Caro, E., Crippen, R., Duren, R., Hensley, S., Kobrick, M., Paller,M., Rodriguez, E., Roth, L., Seal, D., Shaffer, S., Shimada, J., Umland, J., Werner, M.,Oskin, M., Burbank, D. and Alsdorf, D. (2007), ‘The Shuttle Radar Topography Mission’,Reviews of Geophysics 45(2).URL: http://dx.doi.org/10.1029/2005RG000183
Fisher-Vanden, K., Mansur, E. T. and Wang, Q. (2015), ‘Electricity shortages and firm pro-ductivity: Evidence from China’s industrial firms’, Journal of Development Economics114, 172–188.URL: http://www.sciencedirect.com/science/article/pii/S0304387815000048
Gassman, P. W., Sadeghi, A. M. and Srinivasan, R. (2014), ‘Applications of the SWATModel Special Section: Overview and Insights’, J Environ Qual 43(1), 1–8.URL: http://www.ncbi.nlm.nih.gov/pubmed/25602534
Gebretsadik, Y., Fant, C. and Strzepek, K. (2012), Impact of Climate Change on Irrigation,Crops and Hydropower in Vietnam, Report, UNU-WIDER.
Giang, P. Q., Toshiki, K., Sakata, M., Kunikane, S. and Vinh, T. Q. (2014), ‘Modellingclimate change impacts on the seasonality of water resources in the Upper Ca River
50

Watershed in Southeast Asia’, ScientificWorldJournal 2014, 279135.URL: https://www.ncbi.nlm.nih.gov/pubmed/25243206 https://www.ncbi.nlm.nih.gov/pmc/articles/PMC4150503/pdf/TSWJ2014-279135.pdf
Grogan, L. (2016), ‘Household Electrification, Fertility, and Employment: Evidence fromHydroelectric Dam Construction in Colombia’, Journal of Human Capital 10(1), 109–158.URL: http://www.journals.uchicago.edu/doi/abs/10.1086/684580
Hansen, M., DeFries, R., Townshend, J. and Sohlberg, R. (1998), ‘UMD Global Land CoverClassification, 1 Kilometer’.
Hansen, M., DeFries, R., Townshend, J. and Sohlberg, R. (2000), ‘Global land cover classifi-cation at 1km resolution using a decision tree classifier’, International Journal of RemoteSensing 21, 1331–1365.
Hao, F.-b., Zhang, X.-s. and Yang, Z.-f. (2004), ‘A distributed non-point source pollutionmodel: calibration and validation in the Yellow River Basin’, Journal of EnvironmentalSciences 16(4), 646–650.
Hecht, J. and Lacombe, G. (2014), The effects of hydropower dams on the hydrology ofthe Mekong Basin, Report, CGIAR Research Program on Water, Land and Ecosystems(WLE).URL: https://wle-mekong.cgiar.org/download/state-of-knowledge/hydrology-mekong-basin/Hydrology%20of%20the%20Mekong%20Basin%20_English_web%2016092014.pdf
Ho, Q. B., Nguyen, H. Q. and Vo, L. P. (2013), ‘Impacts of Climage Change on CatchmentFlows and Assessing Its Impacts on Hydropower in Vietnam’s Central Highland Region’,Global Perspectives on Geography 1(1).
Hoechle, D. (2007), ‘Robust standard errors for panel regressions with cross-sectional de-pendence’, Stata Journal 7(3), 281–312.URL: http://www.stata-journal.com/article.html?article=st0128
Huu, T. P. (2015), Dilemmas of hydropower development in Vietnam: between dam-induceddisplacement and sustainable development, Eburon Uitgeverij BV.
Ialy Hydropower Company (2017), ‘Introduction’.URL: http://ialyhpc.vn/?php=about&basic=detail&id=240
IFAD (2010), Vietnam Environmenal and Climate Change Assessment, Report.
IFAD (2014), Comprehensive environment and climate change assessment in Vietnam, Re-port.
IFC (2015), Hydroelectric Power: A Guide for Developers and Investors, Report, Interna-tional Finance Corporation, World Bank Group.URL: http://www.ifc.org/wps/wcm/connect/topics_ext_content/ifc_external_corporate_site/ifc+sustainability/learning+and+adapting/knowledge+products/publications/hydroelectric_power_a_guide_for_developers_and_investors
IMHEN (2010), Impacts of climate change on water resources and adaptation measures,Report, Vietnam Institute of Meteorology, Hydrology and Climate change.URL: http://assela.pathirana.net/images/6/6e/Impact_of_climate_change_on_water_resources_and_adaptation_measures.pdf
51

IPCC (2007), Climate change 2007 : impacts, adaptation and vulnerability : contributionof Working Group II to the Fourth Assessment Report of the Intergovernmental Panel onClimate Change , Report, Intergovernmental Panel on Climate Change.
ISPONRE (2009), Vietnam assessment report on climate change VARCC, Report, Instituteof Strategy and Policy on Natural Resources and Environment (ISPONRE).
Jimmy, R. W. (1969), ‘Flood Routing With Variable Travel Time or Variable Storage Coef-ficients’, 12(1).URL: http://elibrary.asabe.org/abstract.asp?aid=38772&t=3
Khandker, S. R., Barnes, D. F. and Samad, H. A. (2009), Welfare Impacts Of Rural Electri-fication: A Case Study From Bangladesh, Report, The World Bank.URL: https://elibrary.worldbank.org/doi/abs/10.1596/1813-9450-4859
Khoi, D. N. and Suetsugi, T. (2014), ‘The responses of hydrological processes and sedimentyield to land-use and climate change in the Be River Catchment, Vietnam’, HydrologicalProcesses 28(3), 640–652.URL: http://onlinelibrary.wiley.com/store/10.1002/hyp.9620/asset/hyp9620.pdf?v=1&t=ix0o7jx9&s=a1c12d06fc3dfef2bd236637b3d64e121ea3f5e5
Krause, P., Boyle, D. P. and Bäse, F. (2005), ‘Comparison of different efficiency criteria forhydrological model assessment’, Adv. Geosci. 5, 89–97.URL: http://www.adv-geosci.net/5/89/2005/
Kumar, A. T. S., Ahenkorah, A., Rodriguez, R. C., Devernay, J.-M., Freitas, M., Hall, D.,Killingtveit, . and Liur, Z. (2011), IPCC Special Report on Renewable Energy Sourcesand Climate Change. Chapter 5: Hydropower, Report.
Le, T., Al-Juaidi, F. and Sharif, H. (2014), ‘Hydrologic Simulations Driven by Satellite Rain-fall to Study the Hydroelectric Development Impacts on River Flow’, Water 6(12), 3631–3651.
Le, T. B. and Sharif, H. O. (2015), ‘Modeling the projected changes of river flow in CentralVietnam under different climate change scenarios’, Water (Switzerland) 7(7), 3579–3598.
Le, T. C. and Tran, T. T. V. (2016), The impacts of hydropower on forest, runoff and biodi-veristy , The Science and Technology Publisher, Hanoi, Vietnam, pp. 47–58.
Lehner, B. (2013), ‘HydroSHEDS Technical Documentation Version 1.2’.URL: http://www.hydrosheds.org/images/inpages/HydroBASINS_TechDoc_v1c.pdf
Lehner, B. (2014), ‘HydroBASINS Technical Documentation Version 1.c (with and withoutinserted lakes) ’.URL: http://www.hydrosheds.org/images/inpages/HydroBASINS_TechDoc_v1c.pdf
Lehner, B. and Grill, G. (2013), ‘Global river hydrography and network routing: baselinedata and new approaches to study the world’s large river systems’, Hydrological Processes27(15), 2171–2186.URL: http://dx.doi.org/10.1002/hyp.9740
Lehner, B., Verdin, K. and Jarvis, A. (2008), ‘"New Global Hydrography DerivedFrom Spaceborne Elevation Data"’, Eos, Transactions American Geophysical Union89(10), 93–94.URL: http://dx.doi.org/10.1029/2008EO100001
52
MONRE (2003), ‘Vietnam Initial National Communication to the UNFCCC’.
MONRE (2009), Climate change, Sea level rise scenarios for Vietnam, Report, Ministry ofNatural Resources and Environment (MONRE).
MONRE (2010), Vietnam’s second national Communication to UNFCCC, Report, Ministryof Natural Resources and Environment (MONRE).
MONRE (2011), Climate change, sea level rise scenerios for Vietnam, Report, Ministry ofNatural Resources and Environment (MONRE).
MONRE (2012), Report on National Environment 2012, Report, Ministry of Natural Re-sources and Environment.
Monteith, J. L. (1981), ‘Evaporation and surface temperature’, Quarterly Journal of theRoyal Meteorological Society 107(451), 1–27.URL: http://dx.doi.org/10.1002/qj.49710745102
Moriasi, D. N., Arnold, J. G., Van Liew, M. W., Bingner, R. L., Harmel, R. D. and Veith, T. L.(2007), ‘Model evaluation guidelines for systematic quantification of accuracy in water-shed simulations’, American Society of Agricultural and Biological Engineers 50(3), 885–900.
Neitsch, S., Arnold, J., Kiniry, J. and Williams, J. (2009), ‘Soil and Water Assessment ToolTheoretical Documentation Version 2009’.
Ngo, T. S., Nguyen, D. B. and Rajendra, P. S. (2015), ‘Effect of land use change on runoff
and sediment yield in Da River Basin of Hoa Binh province, Northwest Vietnam’, Journalof Mountain Science 12(4), 1051–1064.
Olivera, F., Valenzuela, M., Srinivasan, R., Choi, J., Cho, H., Koka, S. and Agrawal, A.(2006), ‘ARCGIS-SWAT: A GEODATA MODEL AND GIS INTERFACE FOR SWAT1’,JAWRA Journal of the American Water Resources Association 42(2), 295–309.URL: http://dx.doi.org/10.1111/j.1752-1688.2006.tb03839.x
PanNature (2010), ‘Small and Medium Hydropower: Great Impacts on Environment butLess Supervision of Environmental Impact Assessment’.URL: http://www.nature.org.vn/en/2010/07/small-and-medium-hydropower-impacts-on-environment/
PanNature (2011), ‘River basin management in Vietnam: Power and Challenges’.
Pham, C. H. and Pham, C. H. (2014), Project Information Document (Concept Stage)- Vietnam Dam Rehabilitation and Safety Improvement Project - P152309 (English),Report, World Bank Group.URL: http://documents.worldbank.org/curated/en/721261468320653018/Project-Information-Document-Concept-Stage-Vietnam-Dam-Rehabilitation-and-Safety-Improvement-Project-P152309
Pham, V. C. (2014), ‘Sustainable Development of hydropower in Dong Nai River’.URL: http://nangluongvietnam.vn/news/vn/an-ninh-nang-luong-va-moi-truong/phat-trien-ben-vung-thuy-dien-tren-he-thong-song-dong-nai.html
53

Phan, D. B., Wu, C. C. and Hsieh, S. C. (2011), ‘Impact of climate change on streamdischarge and sediment yield in Northern Viet Nam’, Water Resources 38(6), 827–836.URL: http://download.springer.com/static/pdf/76/art%253A10.1134%252FS0097807811060133.pdf?originUrl=http%3A%2F%2Flink.springer.com%2Farticle%2F10.1134%2FS0097807811060133&token2=exp=1482430639˜acl=%2Fstatic%2Fpdf%2F76%2Fart%25253A10.1134%25252FS0097807811060133.pdf%3ForiginUrl%3Dhttp%253A%252F%252Flink.springer.com%252Farticle%252F10.1134%252FS0097807811060133*˜hmac=18f0ecf9de21f66aef835bf6d2727c893e59ad364808352276a45ec8d96c409d
Piman, T., Lennaerts, T. and Southalack, P. (2013), ‘Assessment of hydrological changesin the lower Mekong Basin from Basin-Wide development scenarios’, HydrologicalProcesses 27(15), 2115–2125.URL: http://onlinelibrary.wiley.com/store/10.1002/hyp.9764/asset/hyp9764.pdf?v=1&t=ix0o7x3t&s=01d258b65fa48d60d0c7c53c406b7f0402993545
Prime Minister (2016), ‘Decision No. 428 QD/TTg: Approval of the revised National MasterPlan for Power Development for the 2011-2020 Period with the Vision to 2030’.
Quyen, N. T. N., Liem, N. D. and Loi, N. K. (2014), ‘Effect of land use change on water dis-charge in Srepok watershed, Central Highland, Viet Nam’, International Soil and WaterConservation Research 2(3), 74–86.
Rossi, C. G., Srinivasan, R., Jirayoot, K., Duc, T. L., Souvannabouth, P., Binh, N. andGassman, P. W. (2009), ‘Hydrologic evaluation of the lower Mekong river basin with thesoil and water assessment tool model’, International Agricultural Engineering Journal18(1-2), 1–13.
Saha, S., Moorthi, S., Pan, H.-L., Wu, X., Wang, J., Nadiga, S., Tripp, P., Kistler, R.,Woollen, J., Behringer, D., Liu, H., Stokes, D., Grumbine, R., Gayno, G., Wang, J.,Hou, Y.-T., Chuang, H.-Y., Juang, H.-M. H., Sela, J., Iredell, M., Treadon, R., Kleist,D., Van Delst, P., Keyser, D., Derber, J., Ek, M., Meng, J., Wei, H., Yang, R., Lord, S.,Van Den Dool, H., Kumar, A., Wang, W., Long, C., Chelliah, M., Xue, Y., Huang, B.,Schemm, J.-K., Ebisuzaki, W., Lin, R., Xie, P., Chen, M., Zhou, S., Higgins, W., Zou, C.-Z., Liu, Q., Chen, Y., Han, Y., Cucurull, L., Reynolds, R. W., Rutledge, G. and Goldberg,M. (2010), ‘"The NCEP Climate Forecast System Reanalysis"’, Bulletin of the AmericanMeteorological Society 91(8), 1015–1057.
Saha, S., Moorthi, S., Wu, X., Wang, J., Nadiga, S., Tripp, P., Behringer, D., Hou, Y.-T.,Chuang, H.-y., Iredell, M., Ek, M., Meng, J., Yang, R., Mendez, M. P., van den Dool,H., Zhang, Q., Wang, W., Chen, M. and Becker, E. (2014), ‘The NCEP Climate ForecastSystem Version 2’, Journal of Climate 27(6), 2185–2208.
Santhi, C., Arnold, J. G., Williams, J. R., Dugas, W. A., Srinivasan, R. and Hauck, L. M.(2001), ‘VALIDATION OF THE SWAT MODEL ON A LARGE RWER BASIN WITHPOINT AND NONPOINT SOURCES1’, JAWRA Journal of the American Water Re-sources Association 37(5), 1169–1188.URL: http://dx.doi.org/10.1111/j.1752-1688.2001.tb03630.x
Schuol, J. and Abbaspour, K. C. (2006), ‘Calibration and uncertainty issues of a hydrologicalmodel (SWAT) applied to West Africa’, Advances in Geosciences 9, 137–143.URL: https://hal.archives-ouvertes.fr/hal-00296967
Schuol, J., Abbaspour, K. C., Srinivasan, R. and Yang, H. (2008), ‘Estimation of freshwateravailability in the West African sub-continent using the SWAT hydrologic model’, Journalof Hydrology 352(1–2), 30–49.URL: http://www.sciencedirect.com/science/article/pii/S0022169407007755
54

SCS (1972), SCS National Engineering Handbook, Section 4: Hydrology, United States SoilConservation Service,.URL: https://books.google.co.uk/books?id=sjOEf-5zjXgC
Shrestha, B., Cochrane, T. A., Caruso, B. S., Arias, M. E. and Piman, T. (2016), ‘Uncertaintyin flow and sediment projections due to future climate scenarios for the 3S Rivers in theMekong Basin’, Journal of Hydrology 540, 1088–1104.
Srinivasan, R. and Arnold, J. G. (1994), ‘INTEGRATION OF A BASIN-SCALE WATERQUALITY MODEL WITH GIS1’, JAWRA Journal of the American Water ResourcesAssociation 30(3), 453–462.URL: http://dx.doi.org/10.1111/j.1752-1688.1994.tb03304.x
The Diplomat (2016), ‘China and the Mekong: The Floodgates of Power’.URL: http://thediplomat.com/2016/05/china-and-the-mekong-the-floodgates-of-power/
The Economist (2012), ‘Lies, dams and statistics’.URL: http://www.economist.com/blogs/banyan/2012/07/mekong-river
The Economist (2016), ‘The proliferation of dams along the Mekong river’.URL: http://www.economist.com/blogs/graphicdetail/2016/02/daily-chart-11
T.Piman, Cochrane, T. A., Arias, M. E., A.Green and Dat, N. (2013), ‘Assessent of FlowChanges from Hydropower Developement and Operations in Sekong, Sesan, and SrepokRivers of the Mekong Basin’, Journal of Water Resources Planning and Management139(6), 723–732.
Tram, V. N. Q., Liem, N. D. and Loi, N. K. (2014), ‘Assessing Water Availability in PokoCatchment using SWAT model’, Khon Kaen Agricultural Journal 42(2).
UNIDO and ICSHP (2013), World Small Hydropower Development Report 2013 - Vietnam,Report, United Nations Industrial Development Organization (UNIDO) InternationalCenter on Small Hydro Power (ICSHP).URL: http://www.smallhydroworld.org/fileadmin/user_upload/pdf/Asia_South_Eastern/WSHPDR_2013_Viet_NAM.pdf
USGS (2015), ‘HYDRO1K’.URL: https://lta.cr.usgs.gov/HYDRO1K
Van Liew, M. W., Veith, T. L., Bosch, D. D. and Arnold, J. G. (2007), ‘Suitability of SWATfor the conservation effects assessment project: Comparison on USDA agricultural re-search service watersheds’, Journal of Hydrologic Engineering 12(2), 173–189.
Verdin, K. L. and Verdin, J. P. (1999), ‘A topological system for delineation and codificationof the Earth’s river basins’, Journal of Hydrology 218(1–2), 1–12.URL: http://www.sciencedirect.com/science/article/pii/S0022169499000116
Vietnam National Committe on Large Dams and Water Resources Development (2006),‘Son La Hydropower Plant’.URL: http://www.vncold.vn/Web/Content.aspx?distid=128
Vietnam National Committe on Large Dams and Water Resources Development (2015),‘Ban Chat Hydropower dam’.URL: http://www.vncold.vn/Web/Content.aspx?distid=3754
55
VINACONEX (2017), ‘Buon Tua Srah hydropower plant’.URL: http://www.vinaconex.com.vn/?id=964
Vu, M. T., Raghavan, S. V. and Liong, S. Y. (2012), ‘SWAT use of gridded observations forsimulating runoff – a Vietnam river basin study’, Hydrology and Earth System Sciences16(8), 2801–2811.URL: http://www.hydrol-earth-syst-sci.net/16/2801/2012/hess-16-2801-2012.pdf
Vu, M. T., Raghavan, V. S. and Liong, S. Y. (2015), ‘Ensemble Climate Projection forHydro-Meteorological Drought over a river basin in Central Highland, Vietnam’, KSCEJournal of Civil Engineering 19(2), 427–433.
Walle, D. v. d., Ravallion, M., Mendiratta, V. and Koolwal, G. (2013), Long-Term Impactsof Household Electrification in Rural India, Report.URL: https://elibrary.worldbank.org/doi/abs/10.1596/1813-9450-6527
Wang, J. and Ishidaira, H. (2012), ‘Effects of climate change and human activities on stream-flow and sediment flow into the Hoa Binh reservoir’, Journal of Japan Society of CivilEngineers 68(4).
WB (2010), Economics of Adaptation to Climate Change in Vietnam, Report, World Bank.
WB (2011), Vulnerability, Risk Reduction, and Adaptation to Climate change Vietnam,Report, World Bank (WB).URL: http://countryadaptationprofiles.gfdrr.org
WB (2014), Small hydro resource mapping in Vietnam : inception report, Report, WorldBank Group.URL: http://documents.worldbank.org/curated/en/523501468121154457/Small-hydro-resource-mapping-in-Vietnam-inception-report
WB and MPI (2016), Vietnam 2035 : Toward Prosperity, Creativity, Equity, and Democracy,Report, World Bank (WB) and Vietnam Misnistry of Planning and Investment (MPI).URL: http://documents.worldbank.org/curated/en/996421479825859721/pdf/103435-v2-PUBLIC.pdf
Wild, T. B. and Loucks, D. P. (2014), ‘Managing flow, sediment, and hydropower regimes inthe Sre Pok, Se San, and Se Kong Rivers of the Mekong basin’, Water Resources Research50(6), 5141–5157.
Wooldridge, J. M. (2010), Econometric analysis of cross section and panel data, 2 edn, TheMIT PRess, Cambridge, Massachusetts, London, England.
World Energy Council (2017), ‘Hydropower’.URL: https://www.worldenergy.org/data/resources/resource/hydropower/
56


![Workshop Hydropower and Fish.pptx [Schreibgeschützt] - Workshop Hydropower and Fish... · Workshop Hydropower and Fish Existing hydropower facilities: ... spawning grounds and shelter](https://img.pdfslide.us/doc/110x75/5a8733247f8b9afc5d8da3c5/workshop-hydropower-and-fishpptx-schreibgeschtzt-workshop-hydropower-and-fishworkshop.jpg)