Embed Size (px)
Citation preview
University of Birmingham
Descriptive fault trees for structural pavementfailure mechanismsSchlotjes, Megan; Henning, Theuns; Burrow, Michael; St. George, J.D.
License:None: All rights reserved
Document VersionPeer reviewed version
Citation for published version (Harvard):Schlotjes, M, Henning, T, Burrow, M & St. George, JD 2013, 'Descriptive fault trees for structural pavementfailure mechanisms', Road and Transport Research, vol. 22, no. 4, pp. 3-14.
Link to publication on Research at Birmingham portal
Publisher Rights Statement:(c) ARRB
General rightsUnless a licence is specified above, all rights (including copyright and moral rights) in this document are retained by the authors and/or thecopyright holders. The express permission of the copyright holder must be obtained for any use of this material other than for purposespermitted by law.
•Users may freely distribute the URL that is used to identify this publication.•Users may download and/or print one copy of the publication from the University of Birmingham research portal for the purpose of privatestudy or non-commercial research.•User may use extracts from the document in line with the concept of ‘fair dealing’ under the Copyright, Designs and Patents Act 1988 (?)•Users may not further distribute the material nor use it for the purposes of commercial gain.
Where a licence is displayed above, please note the terms and conditions of the licence govern your use of this document.
When citing, please reference the published version.
Take down policyWhile the University of Birmingham exercises care and attention in making items available there are rare occasions when an item has beenuploaded in error or has been deemed to be commercially or otherwise sensitive.
If you believe that this is the case for this document, please contact [email protected] providing details and we will remove access tothe work immediately and investigate.
Download date: 01. Mar. 2020
brought to you by COREView metadata, citation and similar papers at core.ac.uk
provided by University of Birmingham Research Portal
© Road & Transport Research, ARRB
Descriptive Fault Trees for Structural Pavement Failure 1
Mechanisms 2
Megan R. Schlotjes1, Theunis F.P. Henning
2, Michael P.N. Burrow
3, and John D. St. George
2 3
Abstract: 4
Unplanned structural road pavement failures may increase maintenance expenditure 5
for Road Controlling Authorities from that estimated in budgets. To deal with this effectively, 6
road asset managers who are faced with the complex task of forecasting and planning 7
maintenance with fixed and constrained budgets, or operating road networks with high risk 8
profiles, need to understand the factors affecting road pavement failure. With such knowledge 9
presented graphically in fault trees road asset managers can diagnose pavement failures 10
correctly, recognise symptomatic problems across road networks, and forecast effective 11
maintenance to preserve the network’s structural integrity. 12
This paper develops three fault trees for rutting, load associated fatigue cracking, and 13
shear failure. A methodology is described which can be used by asset managers in 14
conjunction with the fault trees to correctly diagnose the mode(s) of pavement failure and the 15
associated cause(s). A case study using New Zealand road network data demonstrates how 16
engineering knowledge can improve on the predictive power of computational models during 17
the initial stages of model development. 18
1 Pavement Engineer, The World Bank, 14 Martin Place, Sydney 2000, NSW, Australia. Email:
[email protected] 2 Dept. of Civil and Environmental Engineering, The University of Auckland, Private Bag 92019, Auckland
Mail Centre, Auckland, New Zealand. Email: [email protected] 3 School of Civil Engineering, The University of Birmingham, Edgbaston, Birmingham, B15 2TT, United
Kingdom. Email: [email protected]
© Road & Transport Research, ARRB
INTRODUCTION 19
Road asset managers have the important task of making the best possible use of 20
maintenance funds to ensure the road network remains functional for the user and it’s 21
structural integrity is protected. As funding is often insufficient for the needs of the network, 22
it is imperative to prevent early pavement failure using appropriate maintenance strategies, 23
which are preventative rather than reactive in nature. However, without a comprehensive 24
understanding of failure, pavement failures are often misdiagnosed which leads to 25
inappropriate maintenance (Schlotjes et al., 2009). Maintenance strategies can be aided by 26
using pavement performance models that predict the structural deterioration of road 27
pavements. However, the majority of these models focus on singular modes of failure, have a 28
mechanistic design, and do not include diagnostic capabilities (Schlotjes et al., 2011). 29
The formulation of pavement deterioration or performance models also require an in-30
depth understanding of the complexities of pavement failure, and this in turn can assist in 31
selecting appropriate model variables (Isa et al., 2005). Whilst a number of researchers have 32
developed approaches for infrastructure systems which utilise an understanding of failure 33
modes such as fault trees (Xiao et al., 2011; Patev et al., 2005; Pickard et al., 2005), this 34
practice is not widely used in the road sector. 35
A methodology to address this was designed to develop three descriptive fault trees 36
for rutting, fatigue cracking, and shear pavement failure. The fault trees, and therefore this 37
comprehensive understanding of these pavement failure mechanisms, were further used to 38
infer engineering knowledge into computational models to improve the predictive results of 39
modelling techniques (Schlotjes, 2013). This paper demonstrates the importance of 40
incorporating engineering knowledge when modelling pavement performance and focuses 41
on: 42
© Road & Transport Research, ARRB
1. The methodology followed in this research to design descriptive fault trees for 43
structural pavement failure; 44
2. The development of three fault trees (or failure charts, used interchangeably from 45
herein) for rutting, fatigue cracking, and shear failure, depicting a number of causes of 46
each failure mechanisms; 47
3. The use of the developed failure charts in other research applications, such as 48
modelling pavement performance, and 49
4. The benefit this approach has in both project level and network level decision making. 50
A case study is presented to demonstrate the approach using network data. Typical 51
New Zealand roads are the focus of this case study, the majority of which consist of thin 52
flexible, unbound granular, chip-sealed pavements that carry less than 10,000 vehicles per 53
day (Hayward, 2006), and herein are classified as low volume roads. The main structural 54
failure modes prevalent on these pavements are rutting, cracking and shear failure (Henning 55
et al., 2009; Gribble & Patrick, 2008). 56
ROAD PAVEMENT FAILURE MECHANISMS 57
The three failure modes of interest on flexible, unbound granular, chip-seal pavements 58
are: 59
1) Rutting failure which appears on the pavement as depressions in the wheelpath 60
and those on the outside wheelpath are the most severe (Schlotjes et al., 2009). 61
It’s primary cause is associated with the movement of the materials in the 62
lower layers, under traffic loading (Papagiannakis, 2008; Martin, 2008), due to 63
the densification of materials or the shear flow of materials beneath the 64
wheelpaths. Rutting can also be caused by the use of weak materials, 65
inadequate design, or faults in the layers of the pavement as a result of poor 66
construction. Rutting is an indication of the deterioration of the structural 67
© Road & Transport Research, ARRB
integrity of the pavement to adequately dissipate the stresses induced by 68
traffic. In addition, ruts can allow water to pond on the road surfacing posing 69
hazards of black ice formation and vehicle aquaplaning. 70
2) Inter-connected polygonal patterns on the pavement surface are the main 71
indicator of fatigue (structural) cracking failure. Other types of cracking 72
failure exist on flexible pavements, however these failure types are beyond the 73
scope of this paper and will not be discussed further. Load associated fatigue 74
cracking occurs as a result of excessive strain caused by excessive traffic 75
loading or load repetitions, or unbalanced pavement layers (e.g. stiff upper 76
layers with poor pavement support), or brittle surface materials either from 77
aging or inadequate materials (Henning et al., 2006; Martin, 2008). The main 78
concern with cracking is that it permits water to enter the lower layers of the 79
pavement. Additionally, cracking may in time worsen ride quality with an 80
associated increase in road user costs. 81
3) Shear failure, primarily seen as shoving or edge breaks and occasionally as a 82
secondary effect of potholes, is generally attributed to inadequate or weakened 83
material in the road pavement (layers), or insufficient shoulder support, or 84
material shear on the pavement edge. Because this failure mechanism is not 85
necessarily related to traffic loading on low volume roads, although traffic 86
loadings can further exacerbate shear failures, the defects manifest outside of 87
the wheelpaths (Schlotjes et al., 2011). As with cracking, shear related failures 88
allow water to enter the pavement structure and can worsen the ride quality. 89
UNDERSTANDING PAVEMENT FAILURE 90
The interaction of failure factors and associated failure mechanisms makes the task of 91
predicting the occurrence and diagnosing the correct mode of failure challenging and can 92
© Road & Transport Research, ARRB
often result in one or more failure mechanisms being overlooked. Consequently, the selected 93
maintenance treatment may not always address the underlying cause(s) of failure (Schlotjes et 94
al., 2009). Therefore, a comprehensive understanding of failure is required to identify and 95
diagnose the cause(s) of failure so timely and appropriate maintenance can be applied. 96
To address this, a methodology was developed which was based on Failure Mode and 97
Effect Analysis (FMEA) and Fault Tree Analysis (FTA) (Xiao et al., 2011; Pickard et al., 98
2006; Seyed-Hosseini et al., 2006; Patev et al., 2005). The former is an analytical tool for 99
reliability analysis, developed in the 1960’s, which can be used to identify possible failure 100
causes to minimise or eliminate failure in their systems. By using a weighting and ranking 101
system, each event (failure) is assigned a priority (risk) number that assesses the overall 102
impact of the event. FTA on the other hand presents a graphical representation of the causes 103
involved in failure and enables concurrently occurring failure factors to be included in the 104
representation of failure. The graphical format shows a breakdown of the critical paths 105
leading to failure, and from this, the failure paths can be deduced. 106
Both of the above techniques recognise the importance of identifying the causes of 107
failure and generating a graphical representation of the interactions between the possible 108
failure causes. This research expands the fundamentals of these techniques to include a 109
consideration of multiple failure factors and the identification of failure paths. Accordingly 110
engineering knowledge was used to develop three failure charts, or fault trees, which can be 111
used to determine the causes of rutting, cracking and shear failure. The application of these 112
trees can aid in: 113
Identifying and selecting the influential factors which are associated with a particular 114
type of road pavement failure; 115
Assisting the development of road pavement deterioration models to improve the 116
predictive performance of the modelling technique, and 117

© Road & Transport Research, ARRB
Diagnosing the underlying cause(s) of failure, and subsequently the correct failure 118
mode, to assist the road asset manager in selecting appropriate road maintenance. 119
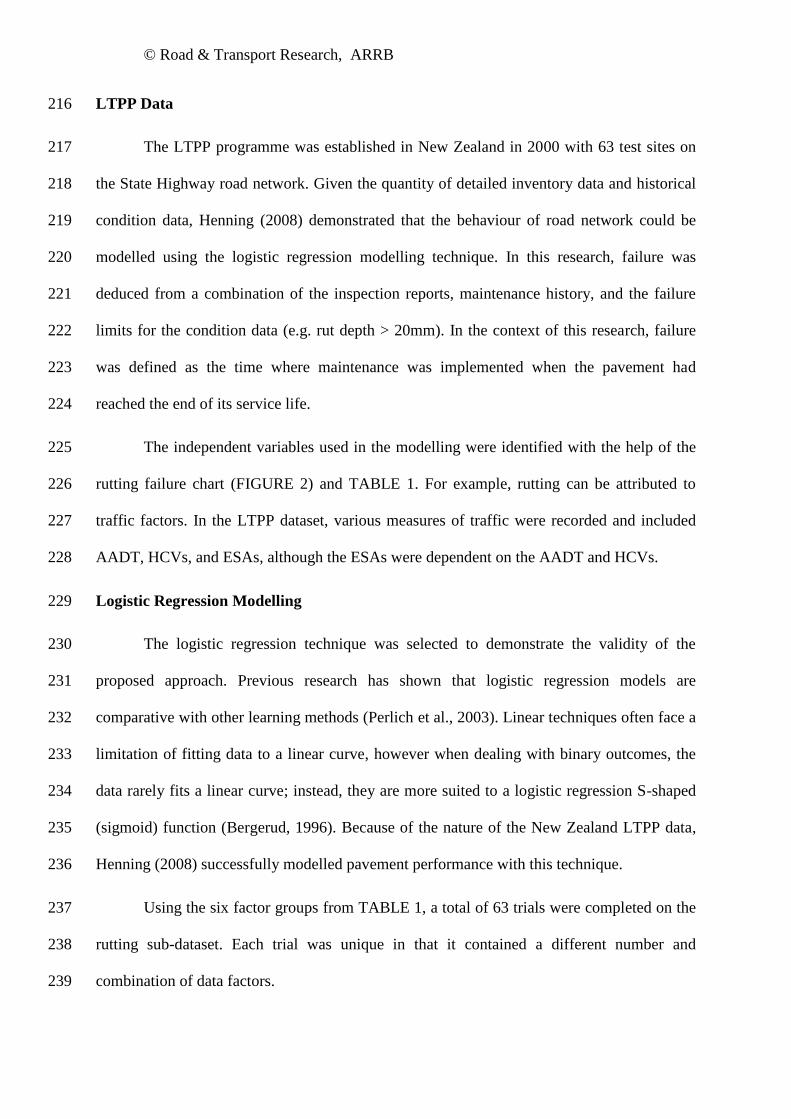
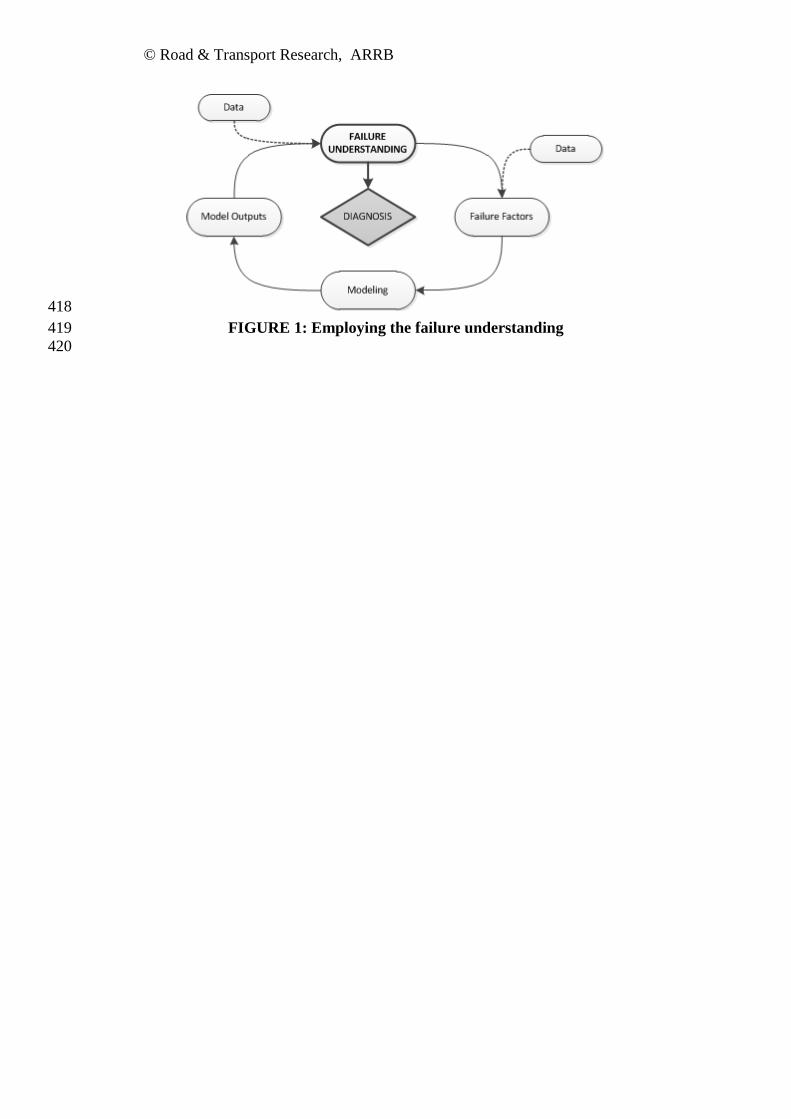
FIGURE 1 outlines the use of the failure charts, and subsequently the understanding 120
of failure, in practice. The methodology consists of several steps. Firstly, the influential 121
failure factors are identified. This step is supported by the input of the respective dataset to 122
ensure the availability of factors within the target network dataset. From the modelling 123
process and model outputs, the failure understanding and dataset can be revisited to 124
determine the factors contributing to failure (the failure path) for individual sites, and 125
subsequently diagnose the cause(s) of failure. 126
Flexible Pavement Failure Paths 127
Individual failure charts were developed for each of the three failure mechanisms for 128
the road pavements in the New Zealand dataset using the following sources of information. 129
i) Literature Review: 130
The literature search focused on the predominant failures of New Zealand’s road 131
network. The review of the literature identified the fundamental factors involved 132
in each of the rutting, cracking and shear failure modes. 133
ii) Data Analysis: 134
Two independent datasets specific to New Zealand were analysed to identify 135
influential failure factors and inter-relationships in the data, as well as confirming 136
well recognised factors from the literature. Understanding such inter-relationships 137
can be crucial in correctly diagnosing pavement failure and specifying the correct 138
maintenance treatments as it is common for multiple factors to be associated with 139
a particular failure mode (Schlotjes et al., 2011). This paper assumed each failure 140
mode to act independently of each other; however, Schlotjes (2013) and Schlotjes 141
et al. (2013) explore in detail the interdependency of these failure mechanisms. 142
© Road & Transport Research, ARRB
iii) Expert Opinion: 143
Knowledge was elicited from those who have managed road networks throughout 144
New Zealand for many years. This provided additional insight into the causes of, 145
and factors influencing, failure. This knowledge proved especially useful in 146
identifying interactions between failure factors and interdependence of each 147
failure type. The latter was considered beyond the scope of this paper; details on 148
the interdependency of the failure mechanisms have been reported in concurrent 149
publications (Schlotjes, 2013; Schlotjes et al., 2013). 150
The information accumulated from the three sources was collated into three failure 151
charts, shown in FIGURE 2 to FIGURE 4, as described below. The presentation of this 152
engineering knowledge of failure, and causative factors, is sequential. 153
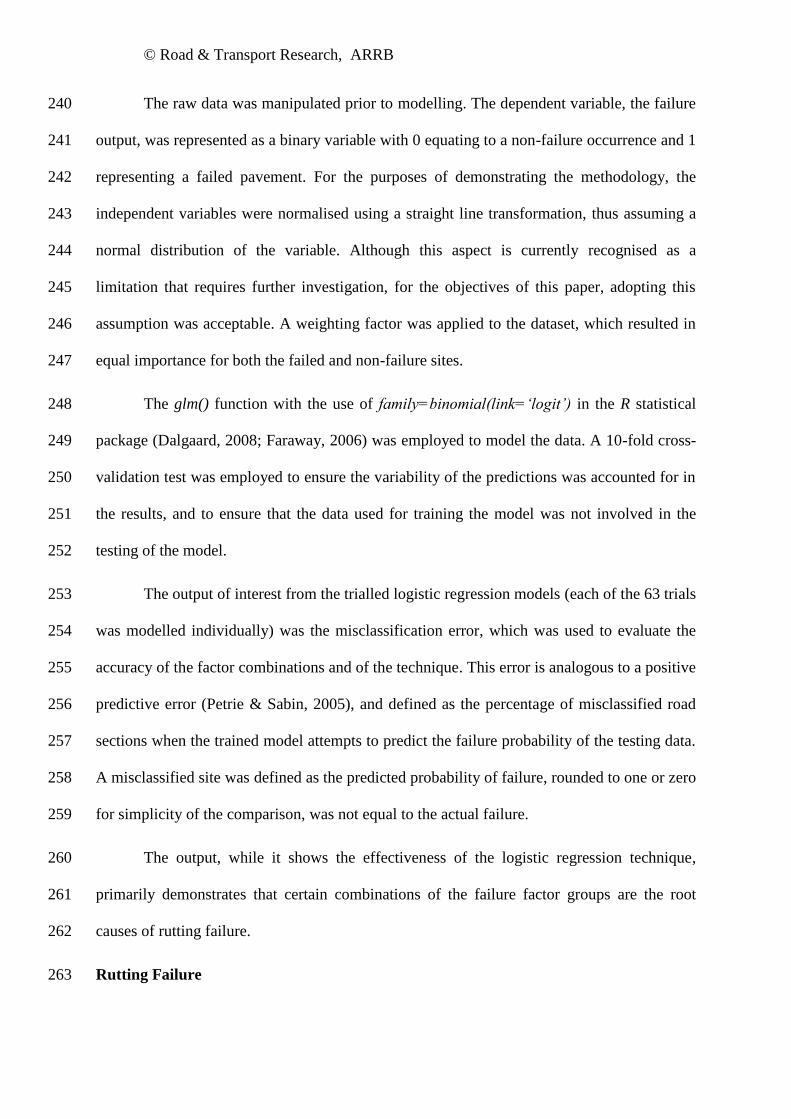
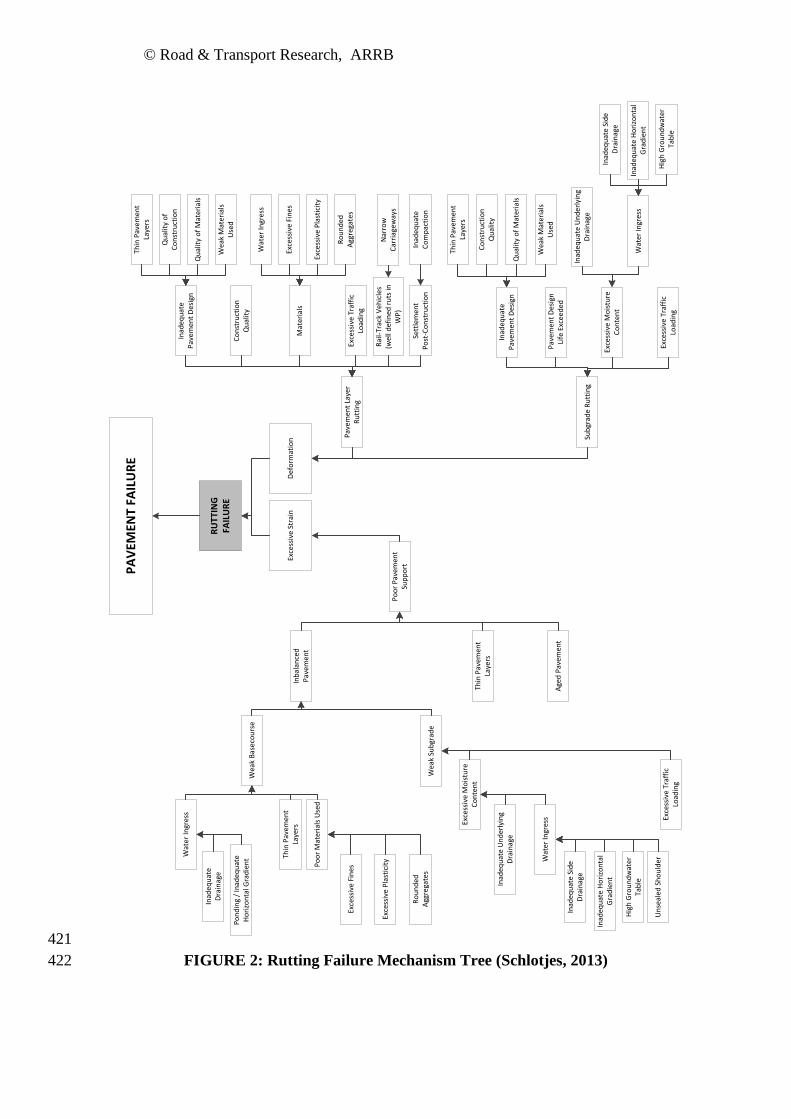
Rutting: 154
Rutting failure occurs as a result of either plastic deformation or excessive strain 155
(FIGURE 2). The factors associated with these issues are pavement composition and traffic 156
respectively. Furthermore, deformation is due to plastic settlement in the underlying layers, 157
which stems from poor materials, water ingress, or inadequate pavement design. Excessive 158
strain is associated with fatigue failure and can result from a combination of poor pavement 159
structure and traffic loading, most often excessive load repetitions where the cumulative 160
number of standard axle loads has exceeded the design. 161
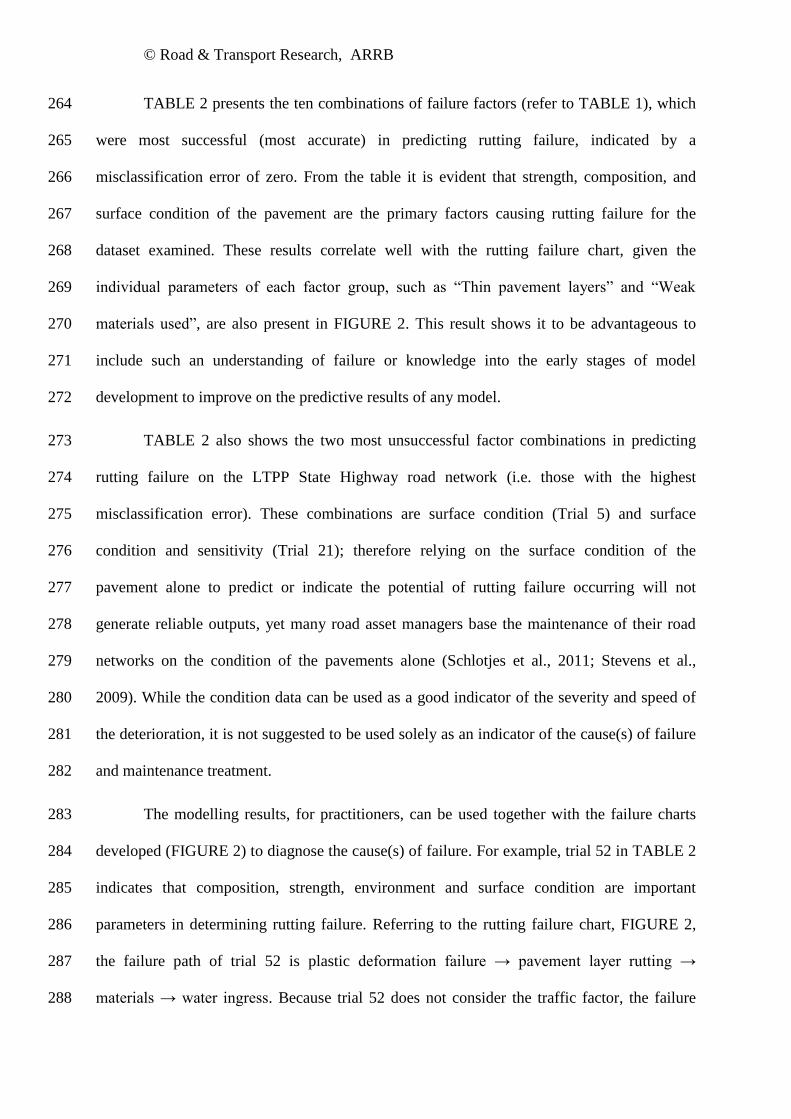
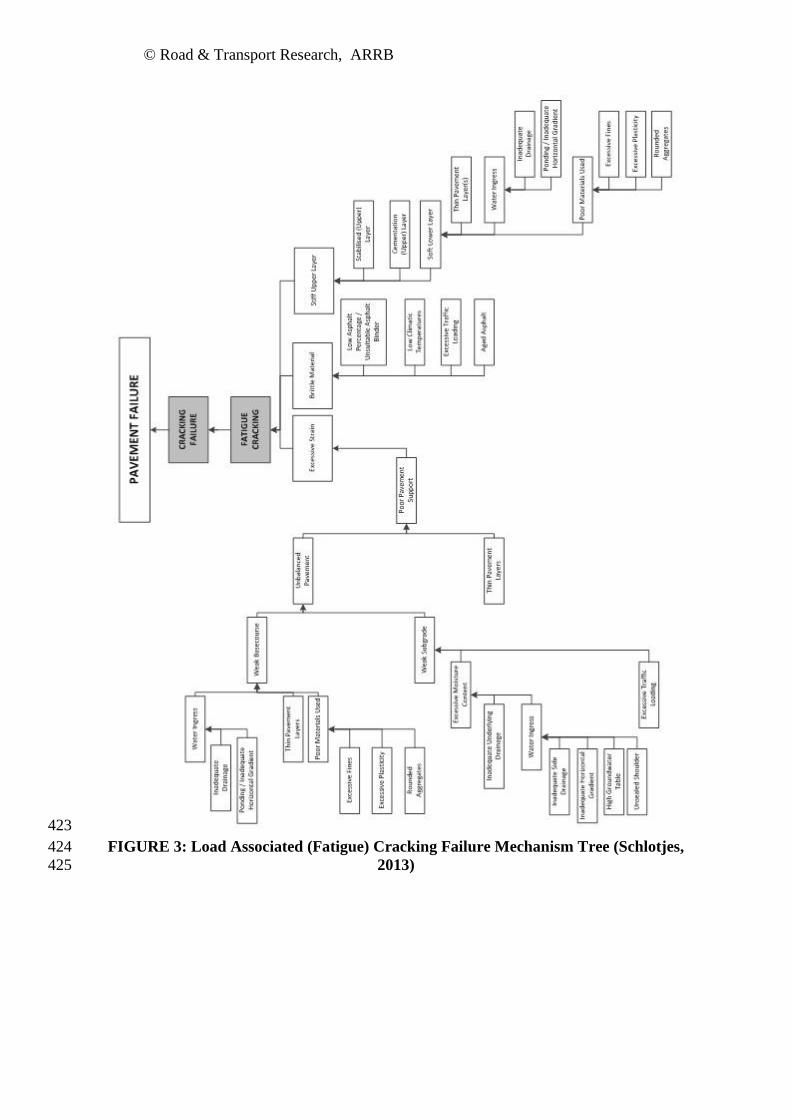
Fatigue Cracking: 162
Fatigue cracking is a result of (i) excessive repetitions of strain causing cracks in the 163
structural layers of the pavement to propagate to the surface of the pavement; (ii) stiff upper 164
layer causing unbalanced layers throughout the pavement; or, (iii) the use of inadequate 165
surface materials, which may also become brittle over time (FIGURE 3). Excessive 166

© Road & Transport Research, ARRB
repetitions of strain occur when the layers in the road pavement are thinner or weaker than 167
designed for (inadequate support for the pavement) and the cumulative repetitions of traffic 168
loading are greater than those designed for. Poor pavement support is due to a weak 169
underlying layer, often the subgrade (subgrade sensitivity). It should be noted that whilst it is 170
recognised that the failure of the surface materials may not directly result in structural failure, 171
it has been included here for completeness. 172
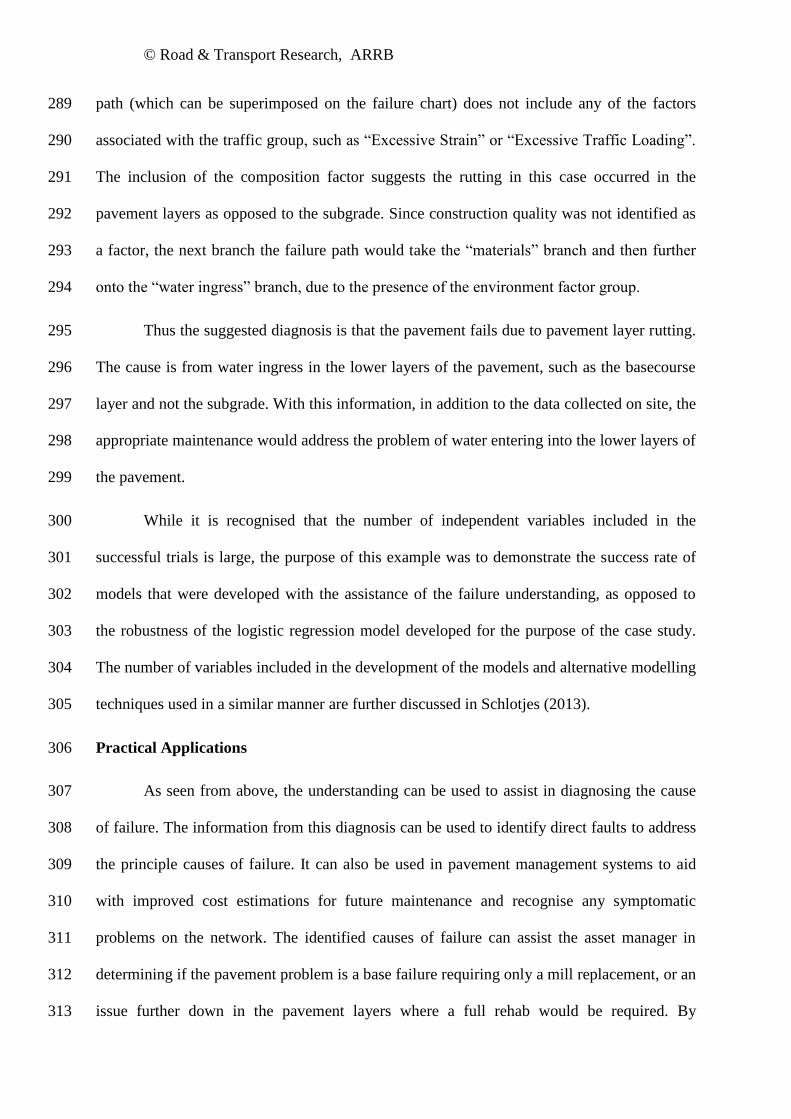
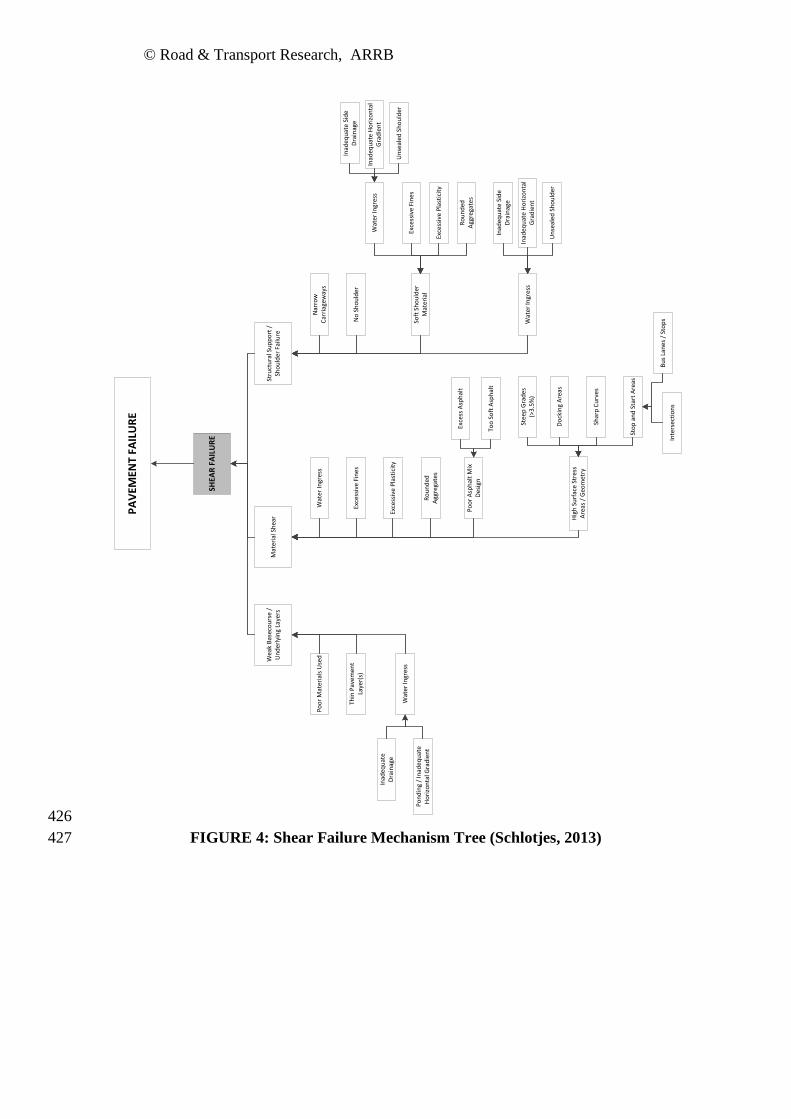
Shear: 173
Shear failure on New Zealand low volume roads is generally associated with material 174
properties often exacerbated under vehicular loads, as opposed to only traffic and / or 175
environmental factors (Transit New Zealand, 2000). The common causes of shear failure 176
(FIGURE 4) include weak materials which were either weak initially or have weakened over 177
their life, material shear or poor material properties, or inadequate structural (shoulder) 178
support. 179
From the above analysis, five main groups of factors (traffic, composition, strength, 180
environment, and subgrade sensitivity) which are most influential in affecting the three 181
failure types studied in this paper, were identified and are summarised in TABLE 1. In 182
addition, surface condition, which although it is a symptom rather than a cause of failure, is 183
also included in TABLE 1 as it is regarded as an important parameter in modelling pavement 184
performance and failure (Henning, 2008). This is recognised as a limitation of the model as 185
not all surface symptoms are related to structural failure yet because of the nature of 186
condition reporting such factor will best inform the model of likely structural failures. 187
TABLE 1 presents a large number of independent variables, which can compromise the 188
robustness of the model; however these variables are listed due to their involvement in 189
failure. 190
Generic Failure Paths 191
© Road & Transport Research, ARRB
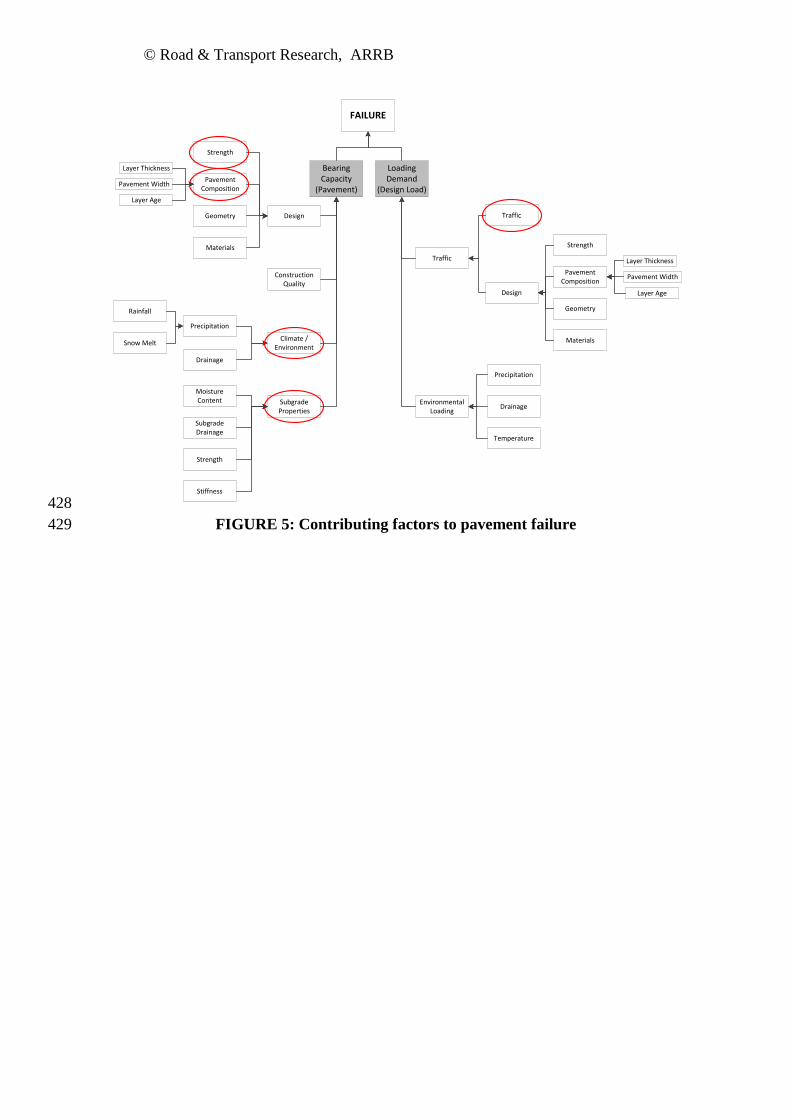
Based on the analysis above, FIGURE 5 presents a generic failure chart which can be 192
used to aid in the development of similar failure charts, and subsequently assist in diagnosing 193
failure, for other pavement types. It includes the five main groups of factors described above 194
and summarised in TABLE 1. The underlying concept considered is that failure can be due to 195
poor support (bearing capacity) or that the loads which the structure is subject to, exceeds the 196
design load (loading demand). 197
Under the bearing capacity failure, failure can be due to insufficient design, poor 198
construction quality, environmental factors, or problems with the subgrade or foundations – 199
factors relating to the pavement structure or its environment, excluding any type of loading. 200
On the other hand, under the loading demand factor, failure can be due to solely excessive 201
traffic or environmental loading, or a combined event involving traffic, such as excessive 202
traffic loading on a poorly designed structure. 203
LONG-TERM PAVEMENT PERFORMANCE MODELLING 204
Knowledge surrounding pavement failure is extensive; presenting this information in 205
fault trees not only focuses computational models on common failure paths for specific 206
pavements and environments, but informs the model with engineering principles. The case 207
study, focusing only on rutting failure, below demonstrates enhanced model results in 208
predicting failure when engineering knowledge is considered in the early stages of the model 209
design. Although the conceptual design of the model treats each failure mechanism as 210
independent, the holistic approach taken recognises the interactions between failure factors. 211
The dataset was obtained from the Long-Term Pavement Performance (LTPP) data, 212
collected from the State Highway network in New Zealand, and was selected because of its 213
completeness and accuracy of the condition data (Henning et al., 2004). The dataset included 214
only flexible chip-seal pavements with a traffic volume of 10,000 vehicles per day or less. 215
© Road & Transport Research, ARRB
LTPP Data 216
The LTPP programme was established in New Zealand in 2000 with 63 test sites on 217
the State Highway road network. Given the quantity of detailed inventory data and historical 218
condition data, Henning (2008) demonstrated that the behaviour of road network could be 219
modelled using the logistic regression modelling technique. In this research, failure was 220
deduced from a combination of the inspection reports, maintenance history, and the failure 221
limits for the condition data (e.g. rut depth > 20mm). In the context of this research, failure 222
was defined as the time where maintenance was implemented when the pavement had 223
reached the end of its service life. 224
The independent variables used in the modelling were identified with the help of the 225
rutting failure chart (FIGURE 2) and TABLE 1. For example, rutting can be attributed to 226
traffic factors. In the LTPP dataset, various measures of traffic were recorded and included 227
AADT, HCVs, and ESAs, although the ESAs were dependent on the AADT and HCVs. 228
Logistic Regression Modelling 229
The logistic regression technique was selected to demonstrate the validity of the 230
proposed approach. Previous research has shown that logistic regression models are 231
comparative with other learning methods (Perlich et al., 2003). Linear techniques often face a 232
limitation of fitting data to a linear curve, however when dealing with binary outcomes, the 233
data rarely fits a linear curve; instead, they are more suited to a logistic regression S-shaped 234
(sigmoid) function (Bergerud, 1996). Because of the nature of the New Zealand LTPP data, 235
Henning (2008) successfully modelled pavement performance with this technique. 236
Using the six factor groups from TABLE 1, a total of 63 trials were completed on the 237
rutting sub-dataset. Each trial was unique in that it contained a different number and 238
combination of data factors. 239
© Road & Transport Research, ARRB
The raw data was manipulated prior to modelling. The dependent variable, the failure 240
output, was represented as a binary variable with 0 equating to a non-failure occurrence and 1 241
representing a failed pavement. For the purposes of demonstrating the methodology, the 242
independent variables were normalised using a straight line transformation, thus assuming a 243
normal distribution of the variable. Although this aspect is currently recognised as a 244
limitation that requires further investigation, for the objectives of this paper, adopting this 245
assumption was acceptable. A weighting factor was applied to the dataset, which resulted in 246
equal importance for both the failed and non-failure sites. 247
The glm() function with the use of family=binomial(link=‘logit’) in the R statistical 248
package (Dalgaard, 2008; Faraway, 2006) was employed to model the data. A 10-fold cross-249
validation test was employed to ensure the variability of the predictions was accounted for in 250
the results, and to ensure that the data used for training the model was not involved in the 251
testing of the model. 252
The output of interest from the trialled logistic regression models (each of the 63 trials 253
was modelled individually) was the misclassification error, which was used to evaluate the 254
accuracy of the factor combinations and of the technique. This error is analogous to a positive 255
predictive error (Petrie & Sabin, 2005), and defined as the percentage of misclassified road 256
sections when the trained model attempts to predict the failure probability of the testing data. 257
A misclassified site was defined as the predicted probability of failure, rounded to one or zero 258
for simplicity of the comparison, was not equal to the actual failure. 259
The output, while it shows the effectiveness of the logistic regression technique, 260
primarily demonstrates that certain combinations of the failure factor groups are the root 261
causes of rutting failure. 262
Rutting Failure 263
© Road & Transport Research, ARRB
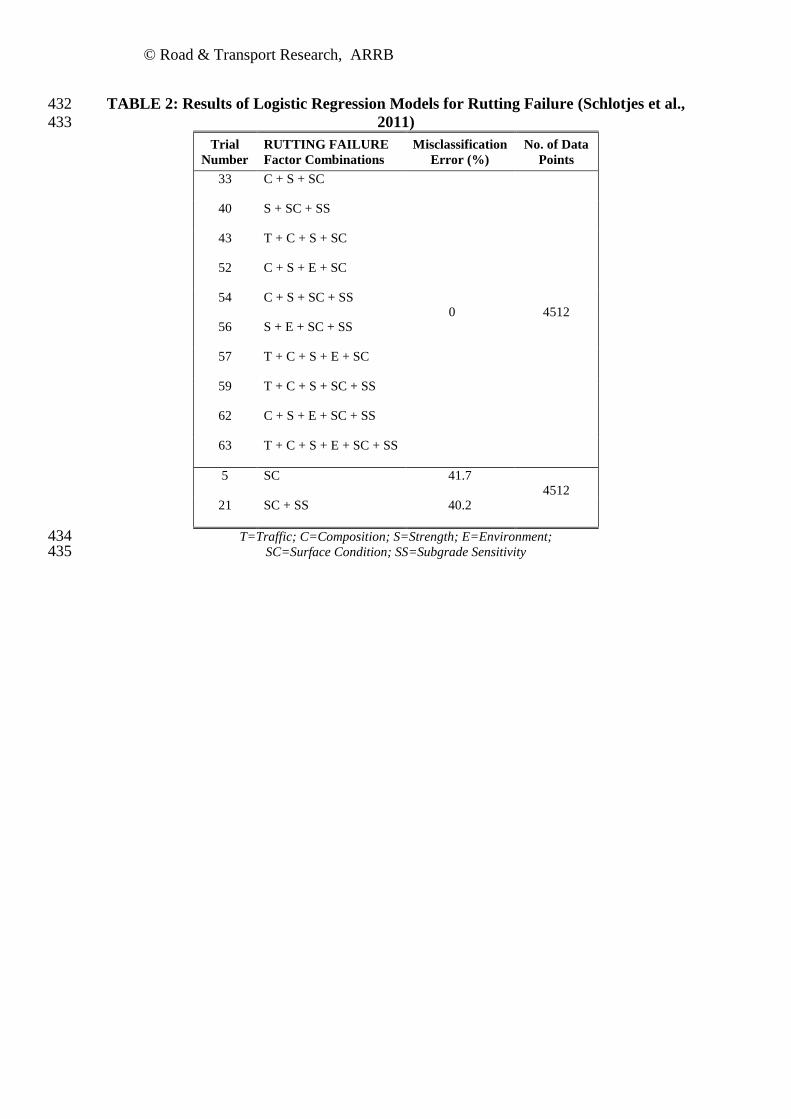
TABLE 2 presents the ten combinations of failure factors (refer to TABLE 1), which 264
were most successful (most accurate) in predicting rutting failure, indicated by a 265
misclassification error of zero. From the table it is evident that strength, composition, and 266
surface condition of the pavement are the primary factors causing rutting failure for the 267
dataset examined. These results correlate well with the rutting failure chart, given the 268
individual parameters of each factor group, such as “Thin pavement layers” and “Weak 269
materials used”, are also present in FIGURE 2. This result shows it to be advantageous to 270
include such an understanding of failure or knowledge into the early stages of model 271
development to improve on the predictive results of any model. 272
TABLE 2 also shows the two most unsuccessful factor combinations in predicting 273
rutting failure on the LTPP State Highway road network (i.e. those with the highest 274
misclassification error). These combinations are surface condition (Trial 5) and surface 275
condition and sensitivity (Trial 21); therefore relying on the surface condition of the 276
pavement alone to predict or indicate the potential of rutting failure occurring will not 277
generate reliable outputs, yet many road asset managers base the maintenance of their road 278
networks on the condition of the pavements alone (Schlotjes et al., 2011; Stevens et al., 279
2009). While the condition data can be used as a good indicator of the severity and speed of 280
the deterioration, it is not suggested to be used solely as an indicator of the cause(s) of failure 281
and maintenance treatment. 282
The modelling results, for practitioners, can be used together with the failure charts 283
developed (FIGURE 2) to diagnose the cause(s) of failure. For example, trial 52 in TABLE 2 284
indicates that composition, strength, environment and surface condition are important 285
parameters in determining rutting failure. Referring to the rutting failure chart, FIGURE 2, 286
the failure path of trial 52 is plastic deformation failure → pavement layer rutting → 287
materials → water ingress. Because trial 52 does not consider the traffic factor, the failure 288
© Road & Transport Research, ARRB
path (which can be superimposed on the failure chart) does not include any of the factors 289
associated with the traffic group, such as “Excessive Strain” or “Excessive Traffic Loading”. 290
The inclusion of the composition factor suggests the rutting in this case occurred in the 291
pavement layers as opposed to the subgrade. Since construction quality was not identified as 292
a factor, the next branch the failure path would take the “materials” branch and then further 293
onto the “water ingress” branch, due to the presence of the environment factor group. 294
Thus the suggested diagnosis is that the pavement fails due to pavement layer rutting. 295
The cause is from water ingress in the lower layers of the pavement, such as the basecourse 296
layer and not the subgrade. With this information, in addition to the data collected on site, the 297
appropriate maintenance would address the problem of water entering into the lower layers of 298
the pavement. 299
While it is recognised that the number of independent variables included in the 300
successful trials is large, the purpose of this example was to demonstrate the success rate of 301
models that were developed with the assistance of the failure understanding, as opposed to 302
the robustness of the logistic regression model developed for the purpose of the case study. 303
The number of variables included in the development of the models and alternative modelling 304
techniques used in a similar manner are further discussed in Schlotjes (2013). 305
Practical Applications 306
As seen from above, the understanding can be used to assist in diagnosing the cause 307
of failure. The information from this diagnosis can be used to identify direct faults to address 308
the principle causes of failure. It can also be used in pavement management systems to aid 309
with improved cost estimations for future maintenance and recognise any symptomatic 310
problems on the network. The identified causes of failure can assist the asset manager in 311
determining if the pavement problem is a base failure requiring only a mill replacement, or an 312
issue further down in the pavement layers where a full rehab would be required. By 313
© Road & Transport Research, ARRB
recognising symptomatic problems on the network, the asset manager can adjust the current 314
practices in respect to the maintenance and construction of the road pavements. 315
CONCLUSIONS 316
This paper presented a methodology to develop a comprehensive understanding of, 317
and subsequently descriptive fault trees for, structural road pavement failure for flexible, 318
unbound granular pavements. The development process involved using information available 319
in the literature, expert knowledge and pavement condition datasets to develop failure charts 320
for rutting, cracking and shear failure mechanisms. Two New Zealand datasets helped to 321
determine the complex interactions of co-existing failure mechanisms and interrelated failure 322
factors; however the former was considered outside the scope of his paper and is reported in 323
detail in Schlotjes (2013). Experts from the industry were used to inform the process. 324
The understanding of pavement failure can be further used to infer engineering 325
knowledge into pavement performance models. The benefits of following such an approach 326
were discussed and include expected improvement on the predictive power and performance 327
of purely mechanistic models. For researchers and practitioners, the fault trees can be used to: 328
Identify the factors influencing failure and the factors that should be included 329
in the modelling process, 330
Recognise the associated failure path, and 331
Assist in diagnosing the cause of failure. 332
A case study using New Zealand LTPP data was presented which demonstrated how 333
the developed failure charts could assist in the selection of appropriate factors to be included 334
in models of pavement failure. For the rutting failure mode examined, the results from the 335
logistic regression models showed that the main contributing factors to rutting failure were 336
strength, composition, and surface condition of the pavement, and these findings correlate 337
© Road & Transport Research, ARRB
well to the knowledge presented on the rutting failure chart. The unsuccessful trials 338
demonstrated that the sole use of condition data is not reliable in predicting rutting failure. 339
Adopting an holistic approach to pavement management will likely improve the 340
development of future pavement deterioration models and shift the focus of current asset 341
management practices to incorporate engineering knowledge with computational techniques, 342
so that the most appropriate forecasted maintenance programmes can be determined more 343
accurately. Furthermore, identifying the cause(s) of failure in the manner described will also 344
improve the selection of the most appropriate treatments for individual sites at the project 345
level, and identifying potential symptomatic problems across entire networks. 346
ACKNOWLEDGMENTS 347
The authors would like to acknowledge the help given by Dr. Fritz Jooste in 348
developing the failure mechanism trees. Dr. Noel Welsh, from the University of Birmingham, 349
is also thanked for his assistance with the logistic regression modelling. 350
REFERENCES 351
Bergerud, W.A. 1996. Introduction to Logistic Regression Models: with worked 352
forestry examples. Biometrics Information Handbook No.7. B.C. Ministry of Forests, 353
Victoria, British Columbia [Working Paper 26/1996]. 354
Dalgaard, P. 2008. Introductory Statistics with R. Second Edition. Springer 355
Science+Business Media, New York. 356
Faraway, J.J. 2006. Extending the Linear Model with R: Generalized Linear, Mixed 357
Effects and Nonparametric Regression Models. Chapman & Hall/CRC Taylor & Francis 358
Group, Boca Raton, Florida. 359
Gribble, M. & Patrick, J. 2008. Adaptation of AUSTROADS pavement design guide 360
for New Zealand conditions. Land Transport New Zealand Research Report 305. 361
© Road & Transport Research, ARRB
Hayward, B.J. 2006. Investigation of road base shear strains using in-situ 362
instrumentation. Christchurch: The University of Canterbury, New Zealand [ME 363
(Transportation) Thesis]. 364
Henning, T.F.P. 2008. The development of pavement deterioration models on the 365
State Highway network of New Zealand. The University of Auckland, New Zealand [PhD 366
Thesis]. 367
Henning, T.F.P., Costello, S.B., Dunn, R.C.M., Parkman, C.C. & Hart, G. 2004. The 368
establishment of a long-term pavement performance study on the New Zealand State 369
Highway Network. Road and Transport Research, 13(2), 17-32. 370
Henning, T.F.P., Costello, S.B., Parkman, C.C., Bennett, C.R. & Dunn, R.C.M. 2006. 371
A Complete Review of the Crack Initiation Models for New Zealand. Proceedings of the 22nd
372
ARRB Conference – Research into Practice, Canberra Australia. 373
Henning, T.F.P., Dunn, R.C.M., Costello, S. & Parkman, C. 2009. A new approach 374
for modelling rutting on the New Zealand State Highways. Australian Road Research, 18(1), 375
3-18. 376
Isa, A.H.M., Ma’soem, D.M. & Hwa, L.T. 2005. Pavement performance model for 377
federal roads. Proceedings of the Eastern Asia Society for Transportation Studies, 5, 428-378
440. 379
Martin, T.C. 2008. Predicting sealed granular pavement deterioration at a road 380
network level. Monash University, Victoria, Australia [PhD Thesis]. 381
Papagiannakis, A.T. & Masad, E.A. 2008. Pavement Design and Materials. John 382
Wiley and Sons, New Jersey. 383
© Road & Transport Research, ARRB
Patev, R.C., Putcha, C. & Foltz, S.D. 2005. Methodology for risk analysis of dam 384
gates and associated operating equipment using fault tree analysis. US Army Corps of 385
Engineers, United States of America. 386
Perlich, C., Provost, F. & Simonoff, J.S. 2003. Tree induction vs. logistic regression: 387
A learning-curve analysis. Journal of Machine Learning Research, 4, 211-255. 388
Petrie, A. & Sabin, C. 2005. Medical Statistics at a Glance. Blackwell, Oxford. 389
Pickard, K., Müller, P. & Bertsche, B. 2005. Multiple failure mode and effects 390
analysis – An approach to risk assessment of multiple failures with FMEA. Reliability and 391
Maintainability Symposium, 2005. Institute of Electrical and Electronics Engineers Inc, 457-392
462. 393
Schlotjes, M.R. 2013. The development of a diagnostic approach to predicting the 394
probability of road pavement failure. The University of Auckland, New Zealand and 395
University of Birmingham, United Kingdom [PhD Thesis]. 396
Schlotjes, M.R., Burrow, M.P.N., Evdorides, H.T. & Henning, T.F.P. 2013. Using 397
SVM to predict the probability of pavement failure. Manuscript accepted for publication in 398
Proceedings of the Institution of Civil Engineers – Transport. 399
Schlotjes, M.R., Henning, T.F.P. & Burrow, M.P.N. 2011. Improved network 400
understanding – a diagnostic approach to the risk of pavement failure. Proceedings of the 8th
401
International Conference on Managing Pavement Assets. Santiago, Chile. 402
Schlotjes, M.R., Henning, T.F.P. & St George, J.D. 2009. The risks associated with 403
pavement failure in New Zealand. Proceedings of the NZIHT & NZTA 10th
Annual 404
Conference. Rotorua, New Zealand. 405
© Road & Transport Research, ARRB
Seyed-Hosseini, S.M., Safaei, N. & Asgharpour, M.J. 2006. Reprioritization of 406
failures in a system failure mode and effects analysis by decision making trial and evaluation 407
laboratory technique. Reliability engineering and system safety, 91, 872-881. 408
Stevens, D., Salt, G., Henning, T.F.P. & Roux, D.C. 2009. Pavement performance 409
prediction: A comprehensive new approach to defining structural capacity (SNP). 410
Proceedings of the NZIHT & NZTA 10th
Annual Conference. Rotorua, New Zealand. 411
Transit New Zealand. 2000. New Zealand Supplement to the Document, Pavement 412
Design – A guide to the Structural Design of Road Pavements (AUSTROADS, 1992). 413
Wellington, New Zealand. 414
Xiao. N., Huang, H.Z., Li, Y., He, L. & Jin, T. 2011. Multiple failure modes analysis 415
and weighted risk priority number evaluation in FMEA. Engineering Failure Analysis, 18, 416
1162-1170. 417
© Road & Transport Research, ARRB
418
FIGURE 1: Employing the failure understanding 419
420
© Road & Transport Research, ARRB
PA
VEM
ENT
FAIL
UR
E
RU
TTIN
G
FAIL
UR
E
Exce
ssiv
e St
rain
Def
orm
atio
n
Pav
emen
t La
yer
Ru
ttin
g
Sub
grad
e R
utt
ing
Exce
ssiv
e Tr
affi
c Lo
adin
g
Exce
ssiv
e M
ois
ture
C
on
ten
t
Inad
equ
ate
Pav
emen
t D
esig
n
Pav
emen
t D
esig
n
Life
Exc
eed
ed
Po
or
Pav
emen
t Su
pp
ort
Inb
alan
ced
P
avem
ent
Age
d P
avem
ent
Thin
Pav
emen
t La
yers
Wea
k Su
bgr
ade
Wea
k B
asec
ou
rse
Po
or
Mat
eria
ls U
sed
Wat
er In
gres
s
Thin
Pav
emen
t La
yers
Po
nd
ing
/ In
adeq
uat
e H
ori
zon
tal G
rad
ien
t
Inad
equ
ate
Dra
inag
e
Ro
un
ded
A
ggre
gate
s
Exce
ssiv
e P
last
icit
y
Exce
ssiv
e Fi
nes
Inad
equ
ate
Un
der
lyin
g D
rain
age
Wat
er In
gres
s
Hig
h G
rou
nd
wat
er
Tab
le
Inad
equ
ate
Ho
rizo
nta
l G
rad
ien
t
Inad
equ
ate
Sid
e D
rain
age
Un
seal
ed S
ho
uld
er
Sett
lem
ent
Po
st-C
on
stru
ctio
n
Co
nst
ruct
ion
Q
ual
ity
Mat
eria
ls
Inad
equ
ate
Pav
emen
t D
esig
n
Rai
l-Tr
ack
Veh
icle
s (w
ell d
efin
ed r
uts
in
WP
)
Exce
ssiv
e Tr
affi
c Lo
adin
g
Inad
equ
ate
Co
mp
acti
on
Wat
er In
gres
s
Ro
un
ded
A
ggre
gate
s
Exce
ssiv
e P
last
icit
y
Exce
ssiv
e Fi
nes
Inad
equ
ate
Un
der
lyin
g D
rain
age
Wat
er In
gres
s
Hig
h G
rou
nd
wat
er
Tab
le
Inad
equ
ate
Ho
rizo
nta
l G
rad
ien
t
Inad
equ
ate
Sid
e D
rain
age
Co
nst
ruct
ion
Q
ual
ity
Thin
Pav
emen
t La
yers
Qu
alit
y o
f M
ater
ials
Wea
k M
ater
ials
U
sed
Thin
Pav
emen
t La
yers
Wea
k M
ater
ials
U
sed
Qu
alit
y o
f M
ater
ials
Qu
alit
y o
f C
on
stru
ctio
n
Exce
ssiv
e Tr
affi
c Lo
adin
g
Exce
ssiv
e M
ois
ture
C
on
ten
t
Nar
row
C
arri
agew
ays
421
FIGURE 2: Rutting Failure Mechanism Tree (Schlotjes, 2013) 422
© Road & Transport Research, ARRB
423
FIGURE 3: Load Associated (Fatigue) Cracking Failure Mechanism Tree (Schlotjes, 424
2013) 425
© Road & Transport Research, ARRB
PA
VEM
ENT
FAIL
UR
E
SHEA
R F
AIL
UR
E
Mat
eria
l Sh
ear
Wea
k B
asec
ou
rse
/ U
nd
erly
ing
Laye
rsSt
ruct
ura
l Su
pp
ort
/
Sho
uld
er F
ailu
re
Nar
row
C
arri
agew
ays
No
Sh
ou
lder
Soft
Sh
ou
lder
M
ater
ial
Wat
er In
gres
s
Wat
er In
gres
s
Ro
un
ded
A
ggre
gate
s
Exce
ssiv
e P
last
icit
y
Exce
ssiv
e Fi
nes
Un
seal
ed S
ho
uld
er
Inad
equ
ate
Ho
rizo
nta
l G
rad
ien
t
Inad
equ
ate
Sid
e D
rain
age
Un
seal
ed S
ho
uld
er
Inad
equ
ate
Ho
rizo
nta
l G
rad
ien
t
Inad
equ
ate
Sid
e D
rain
age
Wat
er In
gres
s
Ro
un
ded
A
ggre
gate
s
Exce
ssiv
e P
last
icit
y
Exce
ssiv
e Fi
nes
Po
or
Asp
hal
t M
ix
Des
ign
Too
So
ft A
sph
alt
Exce
ss A
sph
alt
Po
or
Mat
eria
ls U
sed
Wat
er In
gres
s
Thin
Pav
emen
t La
yer(
s)
Po
nd
ing
/ In
adeq
uat
e H
ori
zon
tal G
rad
ien
t
Inad
equ
ate
Dra
inag
e
Hig
h S
urf
ace
Stre
ss
Are
as /
Geo
met
ry
Shar
p C
urv
es
Do
ckin
g A
reas
Stee
p G
rad
es
(>3
.5%
)
Sto
p a
nd
Sta
rt A
reas
Inte
rsec
tio
ns
Bu
s La
nes
/ S
top
s
426
FIGURE 4: Shear Failure Mechanism Tree (Schlotjes, 2013) 427
© Road & Transport Research, ARRB
FAILURE
Loading Demand
(Design Load)
Bearing Capacity
(Pavement)
Design
Construction Quality
Climate / Environment
Subgrade Properties
Pavement Composition
Geometry
Materials
Precipitation
Drainage
Moisture Content
Subgrade Drainage
Strength
Layer Thickness
Pavement Width
Layer Age
Traffic
Strength
Design
Layer Thickness
Pavement Width
Layer Age
Pavement Composition
Geometry
Materials
Strength
Environmental Loading
Drainage
Temperature
Precipitation
Traffic
Stiffness
Rainfall
Snow Melt
428
FIGURE 5: Contributing factors to pavement failure 429

© Road & Transport Research, ARRB
TABLE 1: Major factors associated with flexible pavement failure 430
FACTOR GROUPS DESCRIPTION
Traffic
The purpose of a road pavement is to transport goods and people, and to achieve
this it is built to withstand traffic loading for a predetermined period of time.
However, overloading can cause early failure. Measures of traffic considered are
the annual average daily traffic (AADT), percentage of heavy commercial vehicles
(HCVs), and cumulative number of equivalent standard axles (ESAs).
Composition
The composition of a road pavement can indicate its expected performance under
a particular loading regime. Information about the composition can also help
identify under-designed pavements, older pavements, and those which may have
exceeded their design life. Factors in this group include pavement age, width, layer
thicknesses, and construction materials.
Strength
The bearing strength of the pavement is an important measure of road pavement
performance. A weak pavement will not be able to perform sufficiently if under-
designed for the given traffic loadings. It also becomes susceptible to early failure.
The strength of the pavement is measured in terms of deflection bowls (FWD) and
structural number (SNP).
Environment
The climate can damage a pavement significantly. Rainfall, weathering, and
temperature can have detrimental effects on the performance of the pavement.
Water entering the pavement compromises its structural integrity. High
temperatures affect the performance of the bituminous layer(s) and low
temperatures can result in freeze-thaw. The change in the temperature gradient
reduces the function of the bituminous layer of providing a water-tight layer.
Annual rainfall and seasonal temperatures are recorded for this group.
Surface Condition
The current condition of the pavement can give an indication on the type of
failure, how advanced the failure is, and the rate of progression of the failure.
However, there are some cases where the condition data is a secondary defect to
the primary cause of failure; for example, severe rutting can also result in
pavement surface cracking, yet the primary cause of failure is the rutting.
Condition data differs per failure mechanism, but some examples include rut
depths, rut progression rates, amount of cracking, type of cracking, pothole depth
and diameter, and number of edge breaks.
Subgrade Sensitivity
The subgrade is the underlying base of the pavement and is protected by the
pavement from excessive damage. The susceptibility of the subgrade to damage is
primarily a function of its strength, stiffness, and moisture content.
431
© Road & Transport Research, ARRB
TABLE 2: Results of Logistic Regression Models for Rutting Failure (Schlotjes et al., 432
2011) 433
Trial
Number
RUTTING FAILURE
Factor Combinations
Misclassification
Error (%)
No. of Data
Points
33 C + S + SC
0 4512
40 S + SC + SS
43 T + C + S + SC
52 C + S + E + SC
54 C + S + SC + SS
56 S + E + SC + SS
57 T + C + S + E + SC
59 T + C + S + SC + SS
62 C + S + E + SC + SS
63 T + C + S + E + SC + SS
5 SC 41.7 4512
21 SC + SS 40.2
T=Traffic; C=Composition; S=Strength; E=Environment; 434 SC=Surface Condition; SS=Subgrade Sensitivity 435