Embed Size (px)
Citation preview
University of Amsterdam AMSTERDAM INSTITUTE FOR ADVANCED LABOUR STUDIES
SAMPLE BIAS, WEIGHTS AND EFFICIENCY OF WEIGHTS
IN A CONTINUOUS WEB VOLUNTARY SURVEY
Pablo de Pedraza, University of Salamanca Kea Tijdens, Amsterdam Institute for Advanced Labour Studies
Rafael Muñoz de Bustillo, University of Salamanca
Working Papers Number 07/60
P. de Pedraza, K. Tijdens and R. Muñoz de Bustillo
Acknowledgement:
This paper is based on research conducted as part of the WOLIWEB (WOrk LIfe WEB) project,
funded by the European Commission under the 6th Frame Work Programme (FP6-2004-506590).
This program was coordinated by the Amsterdam Institute of Advanced Labour Studies (AIAS).
Library information:
P. de Pedraza, K. Tijdens and R. Muñoz de Bustillo (2007) Sample bias, weights and efficiency of
weights in a continuous web voluntary survey, AIAS working paper 2007-60, Amsterdam: University
of Amsterdam.
Bibliographical information:
Pablo de Pedraza is Lecturer of Economics at the University of Salamanca
Kea Tijdens is a Research Coordinator at AIAS and co-ordinated WOLIWEB, an EU-FP6 funded
project examining the socio-economic determinants of citizens’ work life attitudes, using
WageIndicator data.
Rafael Muñoz de Bustillo is Professor of Economics at the University of Salamanca
September 2007
AIAS encourages the widespread use of this publication with proper acknowledgment and citation.
© P. de Pedraza, K. Tijdens and R. Muñoz de Bustillo, Amsterdam, September 2007.
This paper can be downloaded: http://www.uva-aias.net/files/aias/WP60.pdf
AIAS – UvA 2
Sample bias, Weights and Efficiency of Weights in a Continuous Web Voluntary Survey
ABSTRACT
Using micro data from a continuous voluntary web survey, the Wage Indicator, the paper analyses
the type of bias that such a sampling method produces and discusses a methodology to weight the
data in order to correct such bias and make it possible to run analyses to obtain results and
conclusions applicable to the whole population. In order to evaluate the efficiency of the weighting
methodology to solve the potential sample bias of web surveys, the results are confronted with
those obtained from an alternative standard labour survey dealing with the same issues. Since the
Wage Indicator is a survey oriented to labour market issues, we considered that a labour market
case study was most appropriate for the evaluation of the results. The method of evaluation
followed is to calculate mean salaries, inequality indexes and salary regressions before and after
implementing the weights using the Wage Indicator Survey data for Spain. The results are compared
with those reached using the Structure of Earnings Survey, a wage survey run by the Spanish
Statistical Institute.
Keywords: web surveys, data analysis, labour market
JEL Classification: C42, C81, J01
AIAS – UvA 3

P. de Pedraza, K. Tijdens and R. Muñoz de Bustillo
AIAS – UvA 4
Sample bias, Weights and Efficiency of Weights in a Continuous Web Voluntary Survey
TABLE OF CONTENTS
ABSTRACT _____________________________________________________________________ 3
1. INTRODUCTION: CONTINUOUS VOLUNTARY WEB SURVEYS AND THE WAGE INICATOR DATASET PROJECT _____________________________________________________ 7
2. THE WAGE INDICATOR SPANISH SAMPLE: BIAS DESCRIPTION________________________ 13
3. WEIGHTING THE SPANISH DATA SET BY GENDER, AGE, SECTOR OF ACTIVITY AND EDUCATIONAL LEVEL __________________________________________________ 19
4. DOES WEIGHTING WORK? _____________________________________________________ 23
4.1 Mean salaries and Gini indexes _____________________________________________________ 23
5. CONCLUSIONS AND FURTHER RESEARCH_________________________________________ 25
REFERENCES ___________________________________________________________________ 29
AIAS – UvA 5

Sample bias, Weights and Efficiency of Weights in a Continuous Web Voluntary Survey
AIAS – UvA 7
1. INTRODUCTION: CONTINUOUS VOLUNTARY WEB SURVEYS AND THE WAGE INICATOR DATASET PROJECT
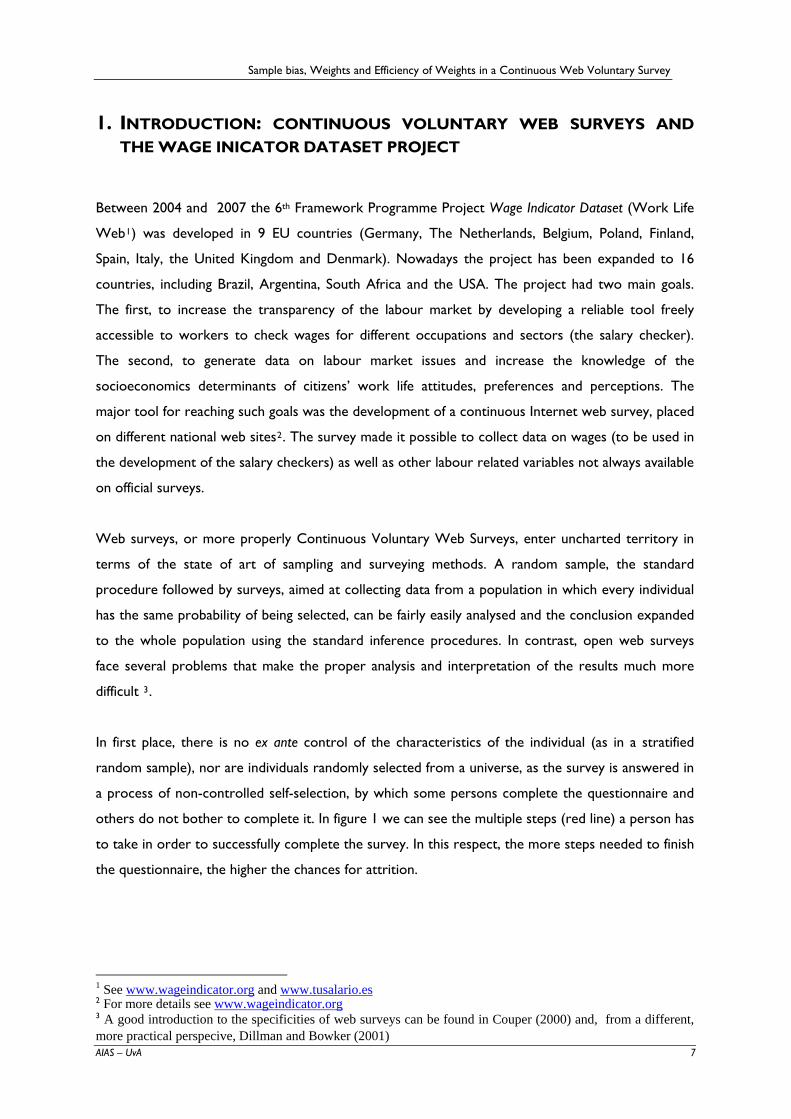
Between 2004 and 2007 the 6th Framework Programme Project Wage Indicator Dataset (Work Life
Web1) was developed in 9 EU countries (Germany, The Netherlands, Belgium, Poland, Finland,
Spain, Italy, the United Kingdom and Denmark). Nowadays the project has been expanded to 16
countries, including Brazil, Argentina, South Africa and the USA. The project had two main goals.
The first, to increase the transparency of the labour market by developing a reliable tool freely
accessible to workers to check wages for different occupations and sectors (the salary checker).
The second, to generate data on labour market issues and increase the knowledge of the
socioeconomics determinants of citizens’ work life attitudes, preferences and perceptions. The
major tool for reaching such goals was the development of a continuous Internet web survey, placed
on different national web sites2. The survey made it possible to collect data on wages (to be used in
the development of the salary checkers) as well as other labour related variables not always available
on official surveys.
Web surveys, or more properly Continuous Voluntary Web Surveys, enter uncharted territory in
terms of the state of art of sampling and surveying methods. A random sample, the standard
procedure followed by surveys, aimed at collecting data from a population in which every individual
has the same probability of being selected, can be fairly easily analysed and the conclusion expanded
to the whole population using the standard inference procedures. In contrast, open web surveys
face several problems that make the proper analysis and interpretation of the results much more
difficult 3.
In first place, there is no ex ante control of the characteristics of the individual (as in a stratified
random sample), nor are individuals randomly selected from a universe, as the survey is answered in
a process of non-controlled self-selection, by which some persons complete the questionnaire and
others do not bother to complete it. In figure 1 we can see the multiple steps (red line) a person has
to take in order to successfully complete the survey. In this respect, the more steps needed to finish
the questionnaire, the higher the chances for attrition.
1 See www.wageindicator.org and www.tusalario.es 2 For more details see www.wageindicator.org 3 A good introduction to the specificities of web surveys can be found in Couper (2000) and, from a different, more practical perspecive, Dillman and Bowker (2001)
P. de Pedraza, K. Tijdens and R. Muñoz de Bustillo
AIAS – UvA 8
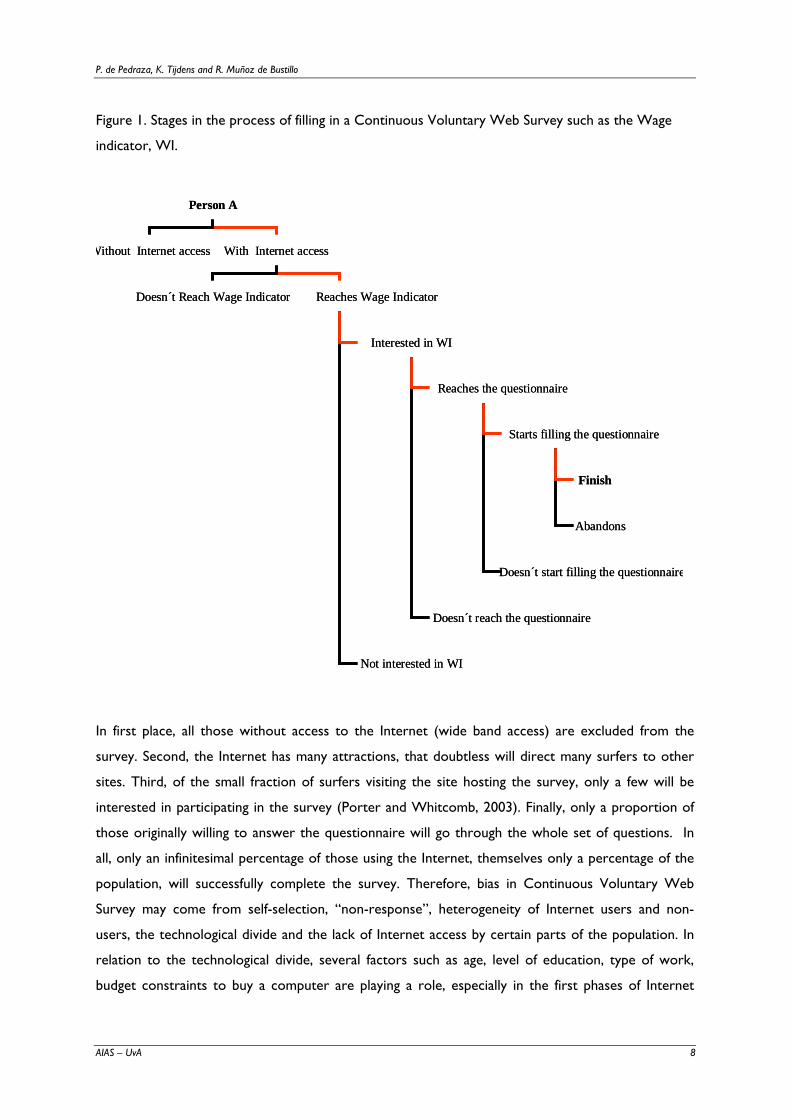
Figure 1. Stages in the process of filling in a Continuous Voluntary Web Survey such as the Wage
indicator, WI.
In first place, all those without access to the Internet (wide band access) are excluded from the
survey. Second, the Internet has many attractions, that doubtless will direct many surfers to other
sites. Third, of the small fraction of surfers visiting the site hosting the survey, only a few will be
interested in participating in the survey (Porter and Whitcomb, 2003). Finally, only a proportion of
those originally willing to answer the questionnaire will go through the whole set of questions. In
all, only an infinitesimal percentage of those using the Internet, themselves only a percentage of the
population, will successfully complete the survey. Therefore, bias in Continuous Voluntary Web
Survey may come from self-selection, “non-response”, heterogeneity of Internet users and non-
users, the technological divide and the lack of Internet access by certain parts of the population. In
relation to the technological divide, several factors such as age, level of education, type of work,
budget constraints to buy a computer are playing a role, especially in the first phases of Internet
Person A
Without Internet access With Internet access
Doesn´t Reach Wage Indicator Reaches Wage Indicator
Interested in WI
Not interested in WI
Reaches the questionnaire
Doesn´t reach the questionnaire
Starts filling the questionnaire
Doesn´t start filling the questionnaire
Finish
Abandons
Person A
Without Internet access With Internet access
Doesn´t Reach Wage Indicator Reaches Wage Indicator
Interested in WI
Not interested in WI
Reaches the questionnaire
Doesn´t reach the questionnaire
Starts filling the questionnaire
Doesn´t start filling the questionnaire
Finish
Abandons
Sample bias, Weights and Efficiency of Weights in a Continuous Web Voluntary Survey
AIAS – UvA 9
penetration in a country and for less IT oriented countries. The same can be said about the profile
of those successfully going through the different steps required for the completion of the survey.
Many of the standard tools for dealing with the problems of under-representation in “standard”
surveys are not directly applicable in the case of web surveys. To give an example, what is the
meaning of the non-response rate when the universe is “universal”? In the terms used by Couper
(2000): “For surveys where the frame cannot be identified, the problem of non-response is hard to
define” (p. 473). Owing to the inherent difficulties in measuring non-response in open web surveys,
many researchers have focused on differences in response rates between mail and e-mail
questionnaires in order to know, by approximation, whether the non-response rate problem is
greater or smaller in web surveys as compared to other types of surveys. In this respect, the studies
summarized by Schaefer and Dillman (1998) and Couper, Blair and Triplett (1999) found lower
response rates for e-mail as compared to mail surveys in all but one of the cases studied. Fricker et
al. (2005) obtained similar results comparing online and telephone surveys. In contrast, Kapowitz,
Hadlock and Levine (2004) found that web applications can achieve a similar response rate to
standard mail surveys when both are preceded by advance mail notification. As interesting as the
differences in response rates is the fact, detected in some of these studies, that the item non-
response rate might be different (lower in online surveys) - Fricker et al. (2005)- or that the method
of survey might affect the type of response. For example, according to Kiesler and Sproull (2001)
closed end responses in an electronic survey on health attitudes were less socially desirable and
more extreme than those on an alternative paper survey. In the same line, Sparrow (2006) argues
that there are sharp differences in the results obtained by online surveys as compared to those
obtained by large scale random surveys
Together with the problems relating to sampling, coverage and non-response, web surveys also face
problems of measurement errors (differences between the “true” answer and the answer
recorded). These measurement errors can be different in web and alternative run surveys with
interviewers who, if properly trained, can explain whatever problems the interviewee might have
with the questions.
Still, Continuous Voluntary Web Surveys are gaining popularity at the expense of phone, mail and
face-to-face surveys. The advantage of Continuous Voluntary Web Surveys is that they give quick
and cheap access to a large and growing number of people. Web surveys also allow for quick access
to data, something increasingly needed in a fast-changing world, both for firms and academic
research.
P. de Pedraza, K. Tijdens and R. Muñoz de Bustillo
AIAS – UvA 10
Some of the bias mentioned can be specifically addressed with the proper resources. Special
campaigns can be developed aiming at specific groups under-represented in terms of web access,
etc. But many of the problems remain, especially because the type of action needed to solve specific
bias will undoubtedly increase the cost of running web surveys, precisely one of their major
attractions.
At the same time, computer technology allows us to easily collect vast amounts of data that can be
used to get a clear profile about the type of persons filling in the questionnaire. This information in
turn can be used to obtain a complete picture of the bias. That is the case with the Wage indicator;
the collected data about personal, professional and family life characteristics of surveyed individuals,
including data of many of those that abandon the questionnaire before completing it, make it
possible to have a quite complete picture of bias in each country.
Very briefly, the Wage Indicator Survey gathers data on labour through the international, continuous
web-based WageIndicator. The web consists of:
• an attractive website with labour market related information for a large public;
• a crowd-pulling Salary Check providing very detailed salary information related to a set of
variables such as education, firm size, supervisory position;
• a WageIndicator questionnaire with 67 – 85 questions providing insight into issues related to
work and wages and generating the data needed to “feed” the Salary Checker;
• nation-wide promotion, publicity, and answering visitors’ emails.
The Wage Indicator Dataset project also has the aim of shedding light on the specific problems
(and potential solutions) of web surveys. This aspect is especially important if web surveys are to
replace, at least partially, telephone, mail and face-to face surveys. As mentioned above, the
principal weaknesses and methodological problems of web surveys are systematic bias, lack of
representativeness, and the strong points, the low cost of reaching a potentially large population
and obtaining a large number of completed questionnaires. The Wage Indicator Dataset project
has been quite successful in gathering large samples; in the case of Spain between 2005 and 2007
more than 14,000 visitors completed the questionnaire. The number of observations goes from
90,000 in The Netherlands, 70,000 in Germany, to 10,000 in Poland. Although in most countries
the number of observations of the Wage Indicator is larger than in national LFS, samples fail to
be representative of the population (see section 2).
In order to try to solve this problem, two types of measures can be implemented. On the one
hand, long term measures targeting large under-represented groups, such as women, unskilled
Sample bias, Weights and Efficiency of Weights in a Continuous Web Voluntary Survey
AIAS – UvA 11
workers, etc., in order to increase the quality of the sample. On the other hand, in the short
term, the data can be weighted according to different variables in order to equilibrate the sample
artificially. This paper aims at sharing the experience acquired in the Wage Indicator Dataset
project regarding the second type of measures, offering a methodology to calculate and
implement weights, and testing to what extent such weighting procedure solves the problems
derived from working with a large but biased sample.
The paper is divided into three parts. The first one describes the Spanish Wage Indicator dataset
sample bias, the second one explains the weighting procedure applied to the Spanish data of the
Wage Indicator dataset and the third one tests for its effectiveness. Apart from the Wage
Indicator data the paper also relies on the Spanish national Labour Force Surveys (LFS) to weight
the data, and on the Spanish Structure of Earnings Survey (SES). The latter is used to test the
efficiency of weights, comparing mean salaries, wage distribution (Gini index) and conventional
salary regressions obtained from the Wage Indicator dataset before and after weighting with those
directly obtained from the Spanish Structure of Earnings Survey.
P. de Pedraza, K. Tijdens and R. Muñoz de Bustillo
AIAS – UvA 12
Sample bias, Weights and Efficiency of Weights in a Continuous Web Voluntary Survey
AIAS – UvA 13
2. THE WAGE INDICATOR SPANISH SAMPLE: BIAS DESCRIPTION
The problem of non-probability samples can be tackled by different and complementary methods. In
the Wage Indicator case, the short run solution is to proceed to weight the data on the basis of
Labour Force data published by the national offices of statistics. However, in the long run the final
goal is to obtain a representative sample of each country’s labour force by marketing the under-
represented groups.
The Wage Indicator is hugely successful in terms of the number of visits and visitors that it draws, as
well as in terms of responses to its questionnaire. Nevertheless, it is clear that important problems
remain to be solved with regard to the representativeness of the sample. It seems likely that access
to and use of the Internet is biased, especially by level of education and income within and between
countries, though one may expect this problem to become progressively less important in the
future. For example, the Dutch survey, pioneer of the now large family of wage indicators, launched
in 2001, is already accessed by gardeners and other workers in low-wage occupations and under-
represented groups have decreased their under-representation over the years. In the meanwhile,
weighting the data might solve the problem. We consciously use the verb might as the next step,
after weighting, should be to measure the effectiveness of the weighting process by comparing the
results obtained with those obtained from alternative standard sources.
In order to analyse the sample bias and select the variables to be used for the calculation of weights,
we will compare the structure of the Wage Indicator sample with the structure of the LFS sample,
assuming that the LFS sample structure is representative of the population.
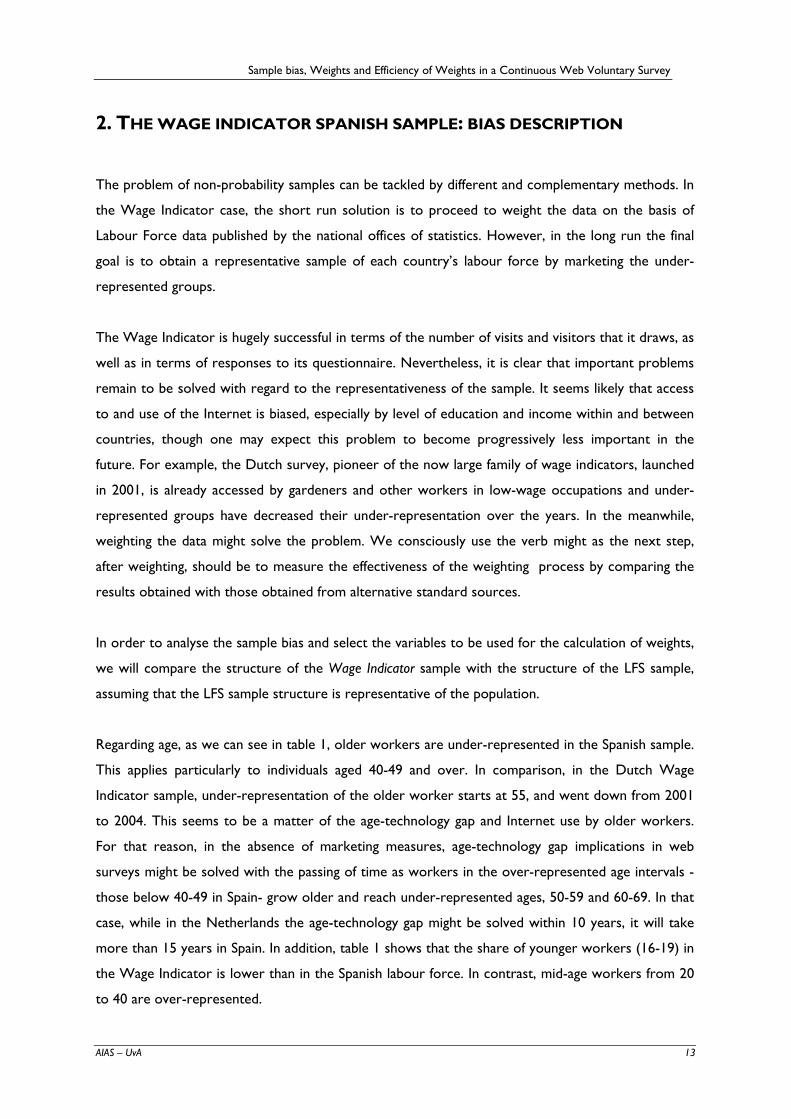
Regarding age, as we can see in table 1, older workers are under-represented in the Spanish sample.
This applies particularly to individuals aged 40-49 and over. In comparison, in the Dutch Wage
Indicator sample, under-representation of the older worker starts at 55, and went down from 2001
to 2004. This seems to be a matter of the age-technology gap and Internet use by older workers.
For that reason, in the absence of marketing measures, age-technology gap implications in web
surveys might be solved with the passing of time as workers in the over-represented age intervals -
those below 40-49 in Spain- grow older and reach under-represented ages, 50-59 and 60-69. In that
case, while in the Netherlands the age-technology gap might be solved within 10 years, it will take
more than 15 years in Spain. In addition, table 1 shows that the share of younger workers (16-19) in
the Wage Indicator is lower than in the Spanish labour force. In contrast, mid-age workers from 20
to 40 are over-represented.
P. de Pedraza, K. Tijdens and R. Muñoz de Bustillo
AIAS – UvA 14
Table1.- Wage Indicator sample and Spanish LFS sample (EPA) by age intervals
comparison of percentages by age
0%5%
10%15%20%25%30%35%40%45%
below16
16-19 20-24 25-29 30-39 40-49 50-59 60-69 morethan70
tusalario EPA
Source: Spanish Labour Force Survey (EPA) and Wage Indicator data
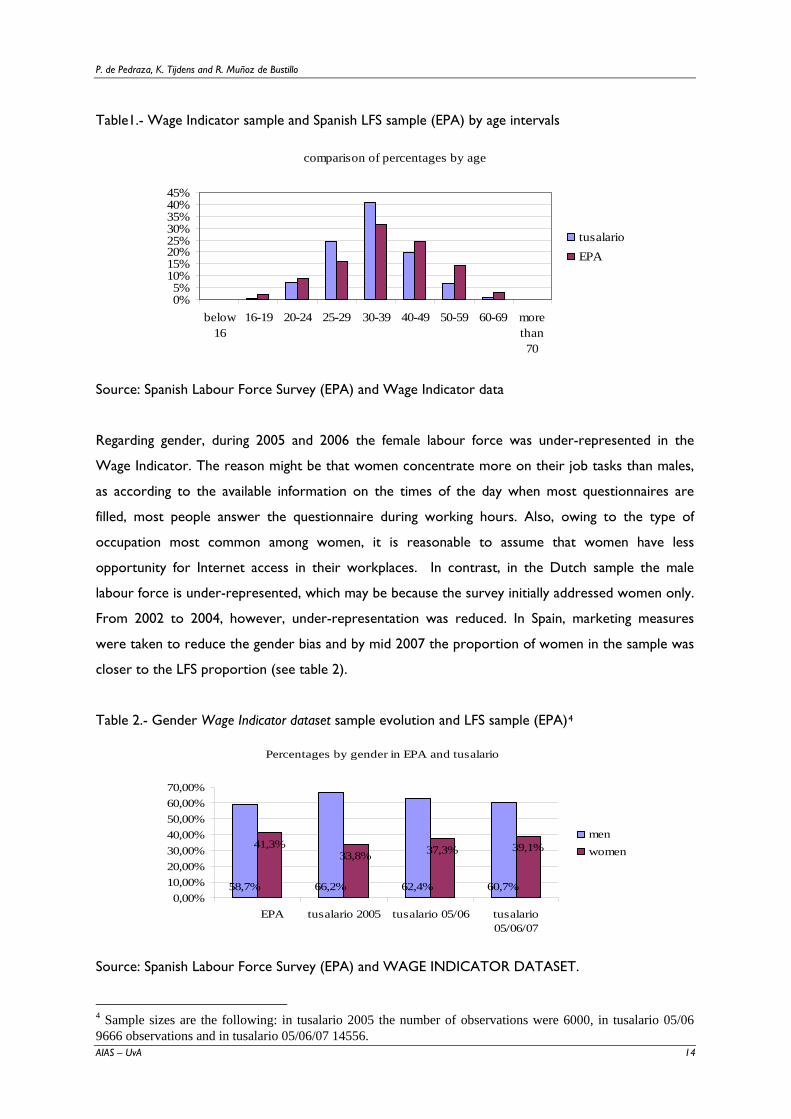
Regarding gender, during 2005 and 2006 the female labour force was under-represented in the
Wage Indicator. The reason might be that women concentrate more on their job tasks than males,
as according to the available information on the times of the day when most questionnaires are
filled, most people answer the questionnaire during working hours. Also, owing to the type of
occupation most common among women, it is reasonable to assume that women have less
opportunity for Internet access in their workplaces. In contrast, in the Dutch sample the male
labour force is under-represented, which may be because the survey initially addressed women only.
From 2002 to 2004, however, under-representation was reduced. In Spain, marketing measures
were taken to reduce the gender bias and by mid 2007 the proportion of women in the sample was
closer to the LFS proportion (see table 2).
Table 2.- Gender Wage Indicator dataset sample evolution and LFS sample (EPA)4
Percentages by gender in EPA and tusalario
58,7% 66,2% 62,4% 60,7%
41,3%33,8% 37,3% 39,1%
0,00%10,00%20,00%30,00%40,00%50,00%60,00%70,00%
EPA tusalario 2005 tusalario 05/06 tusalario05/06/07
menwomen
Source: Spanish Labour Force Survey (EPA) and WAGE INDICATOR DATASET.
4 Sample sizes are the following: in tusalario 2005 the number of observations were 6000, in tusalario 05/06 9666 observations and in tusalario 05/06/07 14556.
Sample bias, Weights and Efficiency of Weights in a Continuous Web Voluntary Survey
AIAS – UvA 15
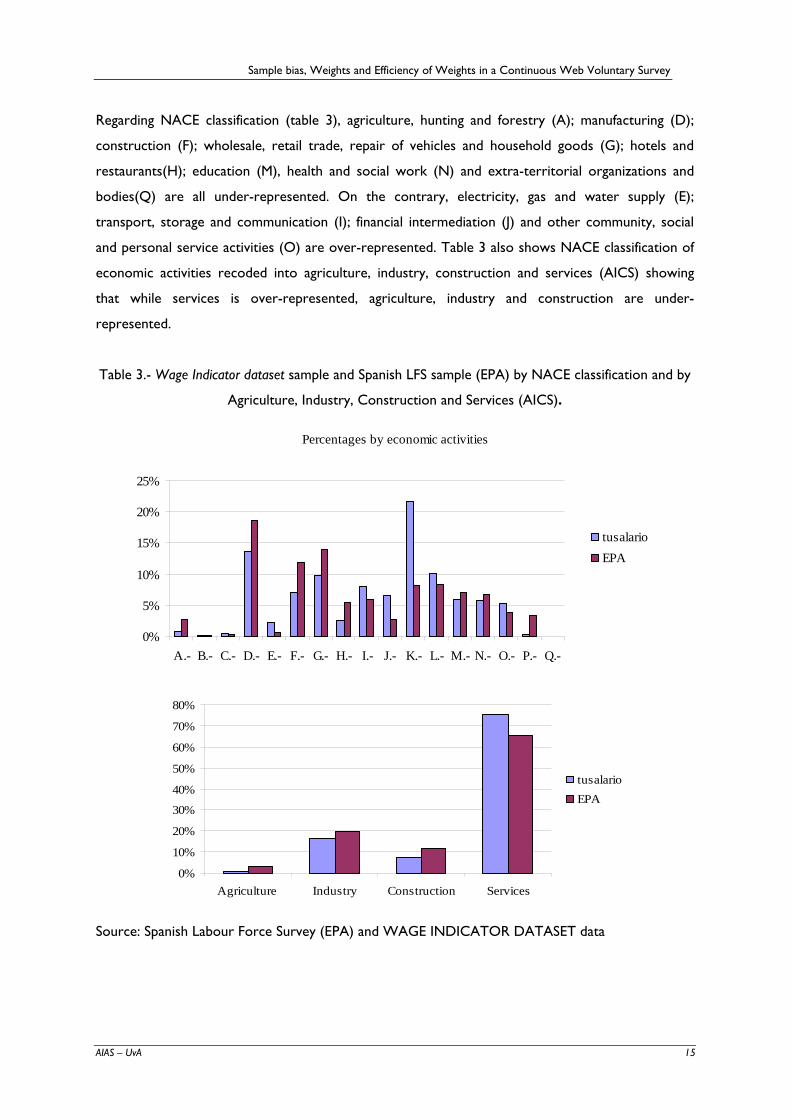
Regarding NACE classification (table 3), agriculture, hunting and forestry (A); manufacturing (D);
construction (F); wholesale, retail trade, repair of vehicles and household goods (G); hotels and
restaurants(H); education (M), health and social work (N) and extra-territorial organizations and
bodies(Q) are all under-represented. On the contrary, electricity, gas and water supply (E);
transport, storage and communication (I); financial intermediation (J) and other community, social
and personal service activities (O) are over-represented. Table 3 also shows NACE classification of
economic activities recoded into agriculture, industry, construction and services (AICS) showing
that while services is over-represented, agriculture, industry and construction are under-
represented.
Table 3.- Wage Indicator dataset sample and Spanish LFS sample (EPA) by NACE classification and by
Agriculture, Industry, Construction and Services (AICS).
Percentages by economic activities
0%
5%
10%
15%
20%
25%
A.- B.- C.- D.- E.- F.- G.- H.- I.- J.- K.- L.- M.- N.- O.- P.- Q.-
tusalarioEPA
0%
10%
20%
30%
40%
50%
60%
70%
80%
Agriculture Industry Construction Services
tusalarioEPA
Source: Spanish Labour Force Survey (EPA) and WAGE INDICATOR DATASET data
P. de Pedraza, K. Tijdens and R. Muñoz de Bustillo
AIAS – UvA 16
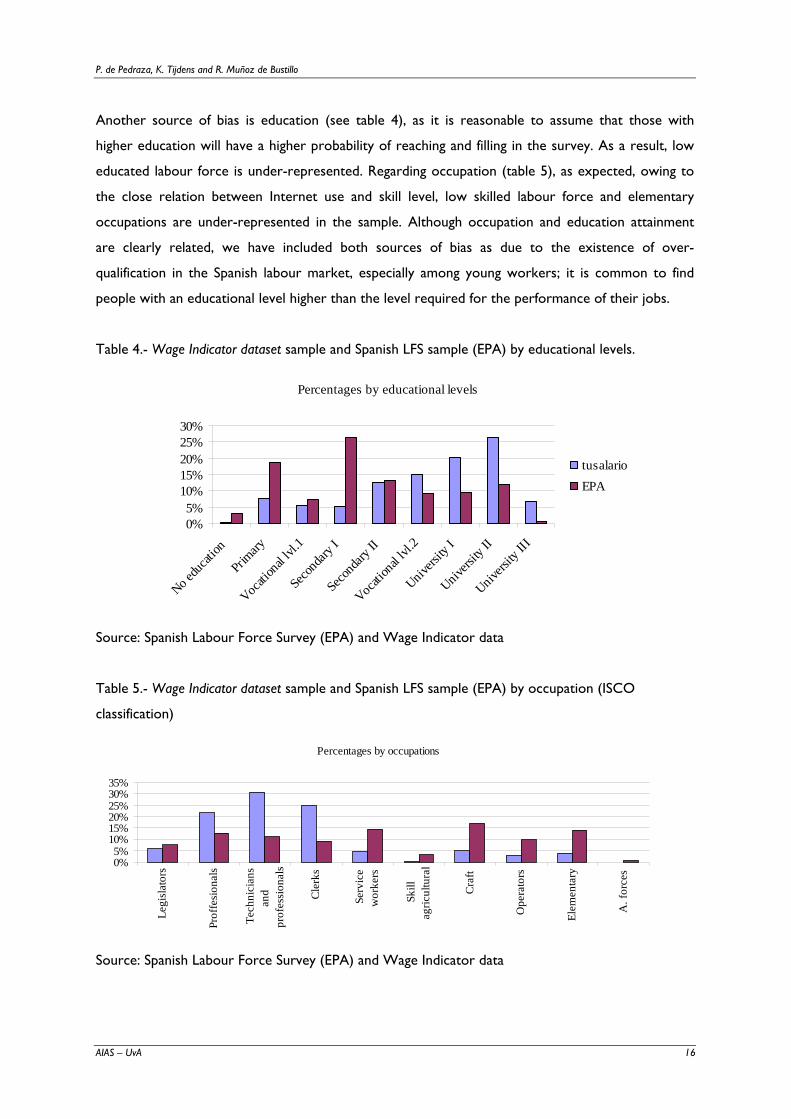
Another source of bias is education (see table 4), as it is reasonable to assume that those with
higher education will have a higher probability of reaching and filling in the survey. As a result, low
educated labour force is under-represented. Regarding occupation (table 5), as expected, owing to
the close relation between Internet use and skill level, low skilled labour force and elementary
occupations are under-represented in the sample. Although occupation and education attainment
are clearly related, we have included both sources of bias as due to the existence of over-
qualification in the Spanish labour market, especially among young workers; it is common to find
people with an educational level higher than the level required for the performance of their jobs.
Table 4.- Wage Indicator dataset sample and Spanish LFS sample (EPA) by educational levels.
Percentages by educational levels
0%5%
10%15%20%25%30%
No edu
cation
Primary
Vocati
onal l
vl.1
Secon
dary I
Secon
dary I
I
Vocati
onal l
vl.2
Univers
ity I
Univers
ity II
Univers
ity II
I
tusalarioEPA
Source: Spanish Labour Force Survey (EPA) and Wage Indicator data
Table 5.- Wage Indicator dataset sample and Spanish LFS sample (EPA) by occupation (ISCO
classification)
Percentages by occupations
0%5%
10%15%20%25%30%35%
Leg
isla
tors
Pro
ffes
iona
ls
Tec
hnic
ians
and
prof
essi
onal
s
Cle
rks
Ser
vice
wor
kers
Ski
llag
ricul
tura
l
Cra
ft
Ope
rato
rs
Ele
men
tary
A. f
orce
s
Source: Spanish Labour Force Survey (EPA) and Wage Indicator data
Sample bias, Weights and Efficiency of Weights in a Continuous Web Voluntary Survey
AIAS – UvA 17
Summing up, according to the above comparisons between EPA and Wage Indicator data, gender,
educational levels and sector of economic activity and occupation are adequate variables for
calculating weights. However, as occupation is closely correlated with education, we decided to
consider education together with sector of activity, gender and age, excluding occupation in the final
analysis. Otherwise, sample divisions would have been too small. We leave for future research the
calculation of weights using more variables such as geographical units, an alternative that could be
interesting in the case of large countries, like Spain or Germany, that are composed of very
heterogeneous regions in terms of economic structure.

P. de Pedraza, K. Tijdens and R. Muñoz de Bustillo
AIAS – UvA 18
Sample bias, Weights and Efficiency of Weights in a Continuous Web Voluntary Survey
AIAS – UvA 19
3. WEIGHTING THE SPANISH DATA SET BY GENDER, AGE, SECTOR OF ACTIVITY AND EDUCATIONAL LEVEL
The following method has been developed to weight, by a number above 1, groups of age, gender,
sector of activity and educational level, whose representation in the Wage Indicator sample is below
their proportion in the population and, to weight by a number below 1, groups of age, gender,
sector of activity and educational level, whose representation in the Wage Indicator dataset SET
sample is above their proportion in the population.
The first step to obtain the weights is to calculate the proportion of each group in the labour force.
We used eleven age intervals (15-19, 20-24, 25-29, 30-34, 35-39, 40-44, 45-49, 50-54, 55-59, 60-64,
and over 65); four categories of economic activities: Agriculture, Construction, Industry and
Services; three educational categories: low, medium and high; and gender. Therefore, we worked
with over three hundred groups. As explaining our methodology in detail using all these categories
would involve a lot of space, table 5 reproduces the simple version used in this paper as an example
of how weights were calculated. To reduce the number of groups we excluded educational levels
from the analysis and took only four age intervals: from 16 to 19, from 20 to 24, from 25 to 54 and
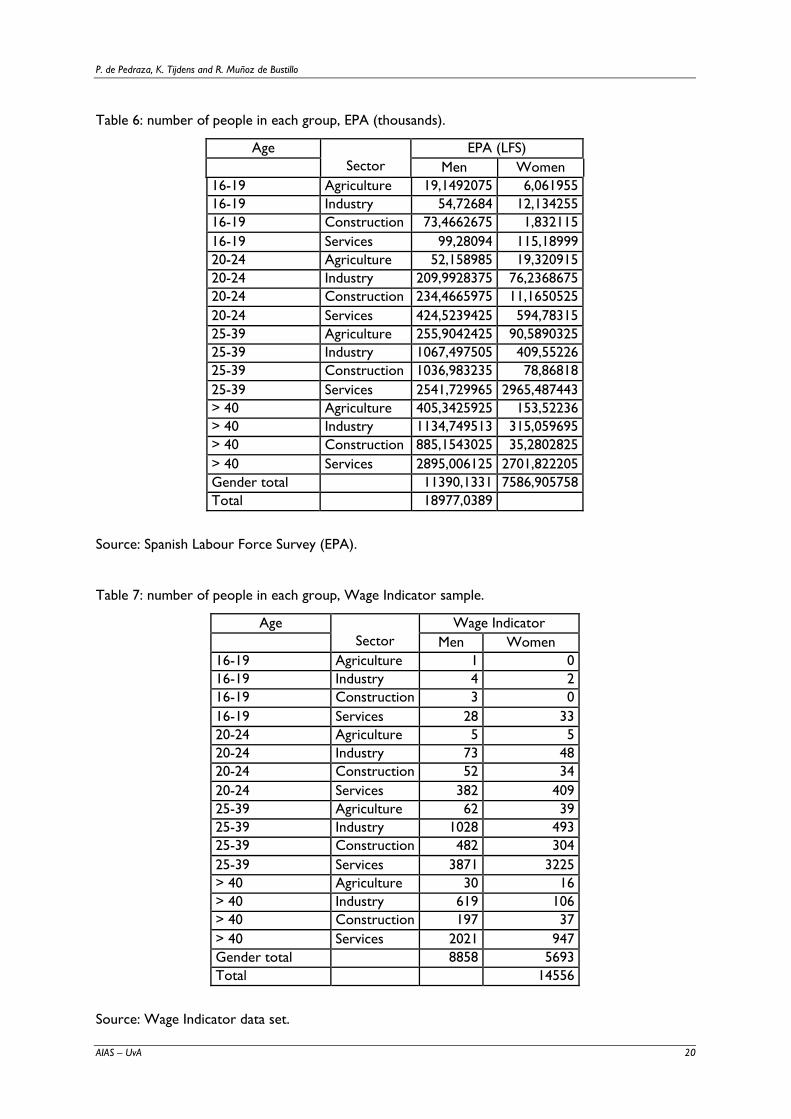
over 55, the aforementioned four categories of economic activities, and gender. Table 6 reproduces
the number of people in each example-group in the Spanish labour force. The analysis was
performed using data from the Spanish Labour Force Survey (EPA) downloadable from the INE web
site (www.ine.es).
The second step was to replicate the process with the Wage Indicator sample. Table 7 shows the
number of people in each of the example-groups in the wage indicator sample. Several groups with
very few cases had to be merged together, forcing us to go back to the EPA in order to merge the
same groups. For example, there is only one man aged between 16 and 19 years old working in
agriculture.
P. de Pedraza, K. Tijdens and R. Muñoz de Bustillo
AIAS – UvA 20
Table 6: number of people in each group, EPA (thousands).
Age EPA (LFS) Sector Men Women 16-19 Agriculture 19,1492075 6,061955 16-19 Industry 54,72684 12,134255 16-19 Construction 73,4662675 1,832115 16-19 Services 99,28094 115,18999 20-24 Agriculture 52,158985 19,320915 20-24 Industry 209,9928375 76,2368675 20-24 Construction 234,4665975 11,1650525 20-24 Services 424,5239425 594,78315 25-39 Agriculture 255,9042425 90,5890325 25-39 Industry 1067,497505 409,55226 25-39 Construction 1036,983235 78,86818 25-39 Services 2541,729965 2965,487443 > 40 Agriculture 405,3425925 153,52236 > 40 Industry 1134,749513 315,059695 > 40 Construction 885,1543025 35,2802825 > 40 Services 2895,006125 2701,822205 Gender total 11390,1331 7586,905758 Total 18977,0389
Source: Spanish Labour Force Survey (EPA).
Table 7: number of people in each group, Wage Indicator sample.
Age Wage Indicator Sector Men Women 16-19 Agriculture 1 0 16-19 Industry 4 2 16-19 Construction 3 0 16-19 Services 28 33 20-24 Agriculture 5 5 20-24 Industry 73 48 20-24 Construction 52 34 20-24 Services 382 409 25-39 Agriculture 62 39 25-39 Industry 1028 493 25-39 Construction 482 304 25-39 Services 3871 3225 > 40 Agriculture 30 16 > 40 Industry 619 106 > 40 Construction 197 37 > 40 Services 2021 947 Gender total 8858 5693 Total 14556
Source: Wage Indicator data set.
Sample bias, Weights and Efficiency of Weights in a Continuous Web Voluntary Survey
AIAS – UvA 21
We followed several merging principles. Firstly, men and women were never merged together.
Secondly, we never merged more than three-four age intervals together, especially when dealing
with age intervals between 25 and 50. Both principles are justified because we are working with data
regarding wages and gender is an important source of wage discrimination, and because wages
increase faster between 25 and 50. Thirdly, although we have not considered educational levels in
the example, with very few exceptions, the three educational levels were never merged together.
For example, we merged people between 16 and 19 regardless of their sector of activity and
educational level because most people entering the labour force at those ages have similar
characteristics such as low educational level. Finally, we merged groups whenever the sample was
below fifteen and we never accepted a weight value above 10.
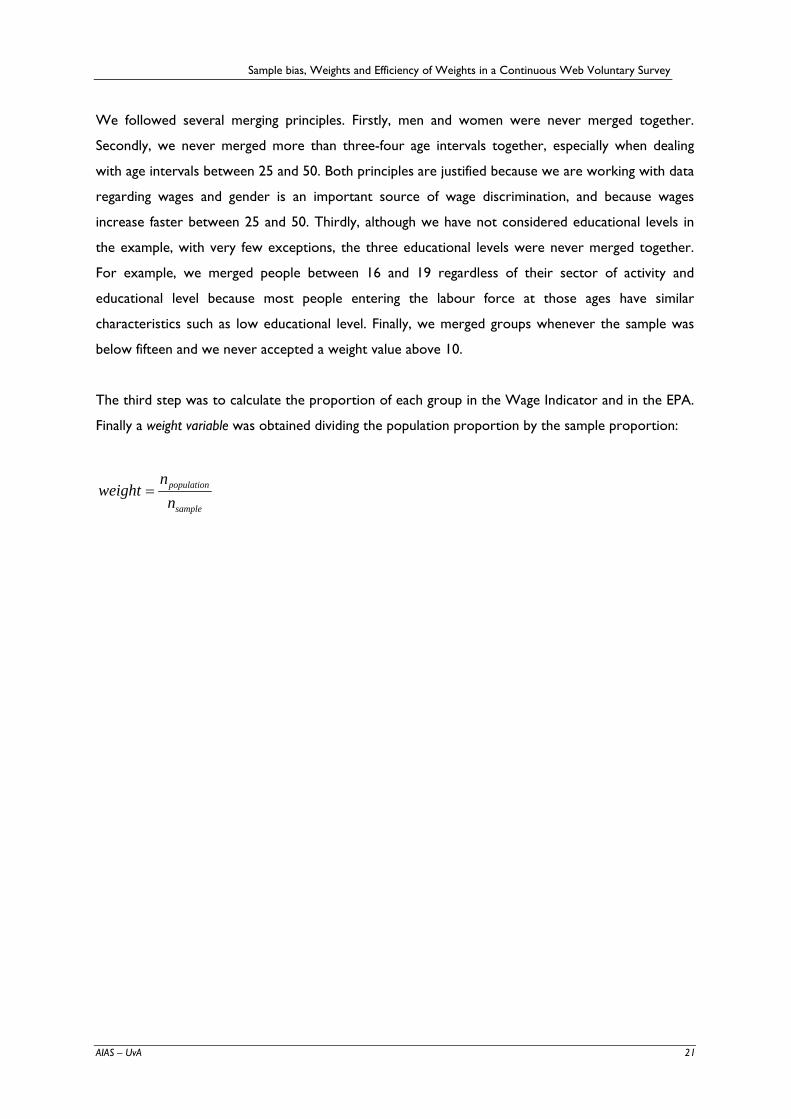
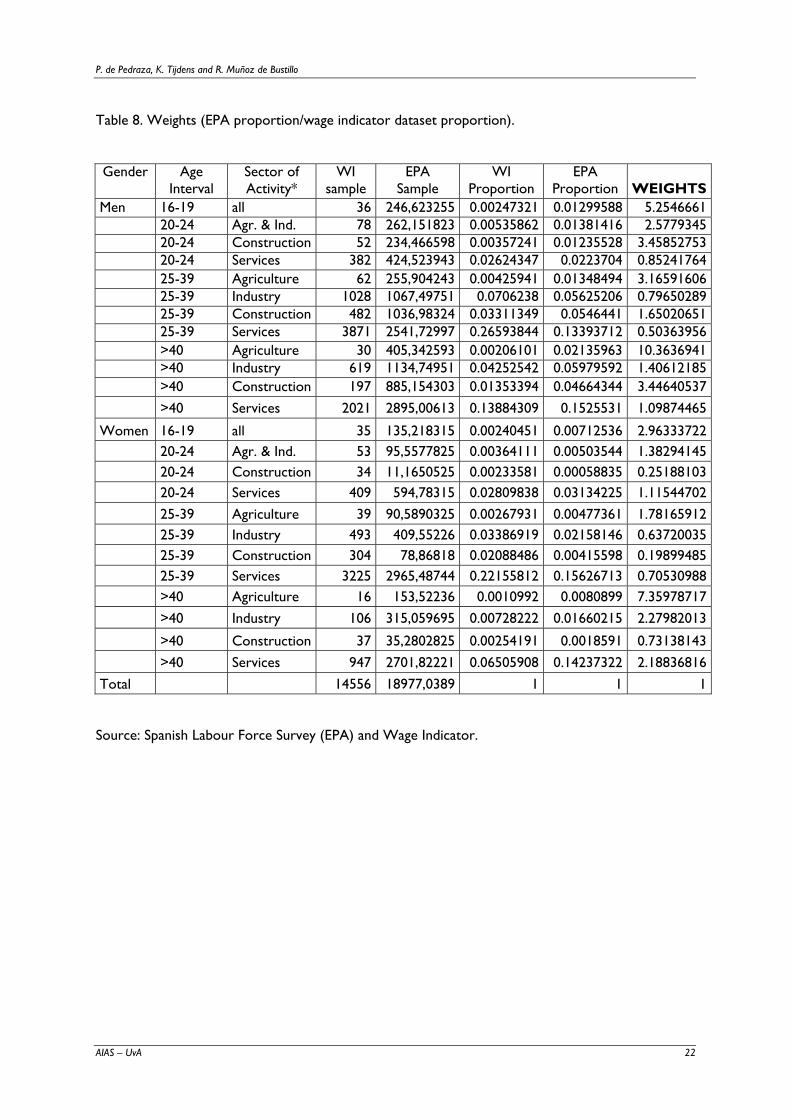
The third step was to calculate the proportion of each group in the Wage Indicator and in the EPA.
Finally a weight variable was obtained dividing the population proportion by the sample proportion:
sample
population
nn
weight =
P. de Pedraza, K. Tijdens and R. Muñoz de Bustillo
AIAS – UvA 22
Table 8. Weights (EPA proportion/wage indicator dataset proportion).
Gender
Age Interval
Sector of Activity*
WI sample
EPA Sample
WI Proportion
EPA Proportion WEIGHTS
Men 16-19 all 36 246,623255 0.00247321 0.01299588 5.2546661 20-24 Agr. & Ind. 78 262,151823 0.00535862 0.01381416 2.5779345 20-24 Construction 52 234,466598 0.00357241 0.01235528 3.45852753 20-24 Services 382 424,523943 0.02624347 0.0223704 0.85241764 25-39 Agriculture 62 255,904243 0.00425941 0.01348494 3.16591606 25-39 Industry 1028 1067,49751 0.0706238 0.05625206 0.79650289 25-39 Construction 482 1036,98324 0.03311349 0.0546441 1.65020651 25-39 Services 3871 2541,72997 0.26593844 0.13393712 0.50363956 >40 Agriculture 30 405,342593 0.00206101 0.02135963 10.3636941 >40 Industry 619 1134,74951 0.04252542 0.05979592 1.40612185 >40 Construction 197 885,154303 0.01353394 0.04664344 3.44640537 >40 Services 2021 2895,00613 0.13884309 0.1525531 1.09874465
Women 16-19 all 35 135,218315 0.00240451 0.00712536 2.96333722 20-24 Agr. & Ind. 53 95,5577825 0.00364111 0.00503544 1.38294145 20-24 Construction 34 11,1650525 0.00233581 0.00058835 0.25188103 20-24 Services 409 594,78315 0.02809838 0.03134225 1.11544702 25-39 Agriculture 39 90,5890325 0.00267931 0.00477361 1.78165912 25-39 Industry 493 409,55226 0.03386919 0.02158146 0.63720035 25-39 Construction 304 78,86818 0.02088486 0.00415598 0.19899485 25-39 Services 3225 2965,48744 0.22155812 0.15626713 0.70530988 >40 Agriculture 16 153,52236 0.0010992 0.0080899 7.35978717 >40 Industry 106 315,059695 0.00728222 0.01660215 2.27982013
>40 Construction 37 35,2802825 0.00254191 0.0018591 0.73138143 >40 Services 947 2701,82221 0.06505908 0.14237322 2.18836816 Total 14556 18977,0389 1 1 1
Source: Spanish Labour Force Survey (EPA) and Wage Indicator.
Sample bias, Weights and Efficiency of Weights in a Continuous Web Voluntary Survey
AIAS – UvA 23
4. DOES WEIGHTING WORK?
As mentioned in the introduction, the methodology proposed for testing the efficiency of the
weighting strategy for overcoming some of the problems derived from the existence of sample bias
is to compare the results obtained in terms of wage, wage distribution and wage determinants using
the Wage Indicator data with and without weighting, with the same indicators as derived from an
alternative standard statistical source, the SES.
4.1 MEAN SALARIES AND GINI INDEXES
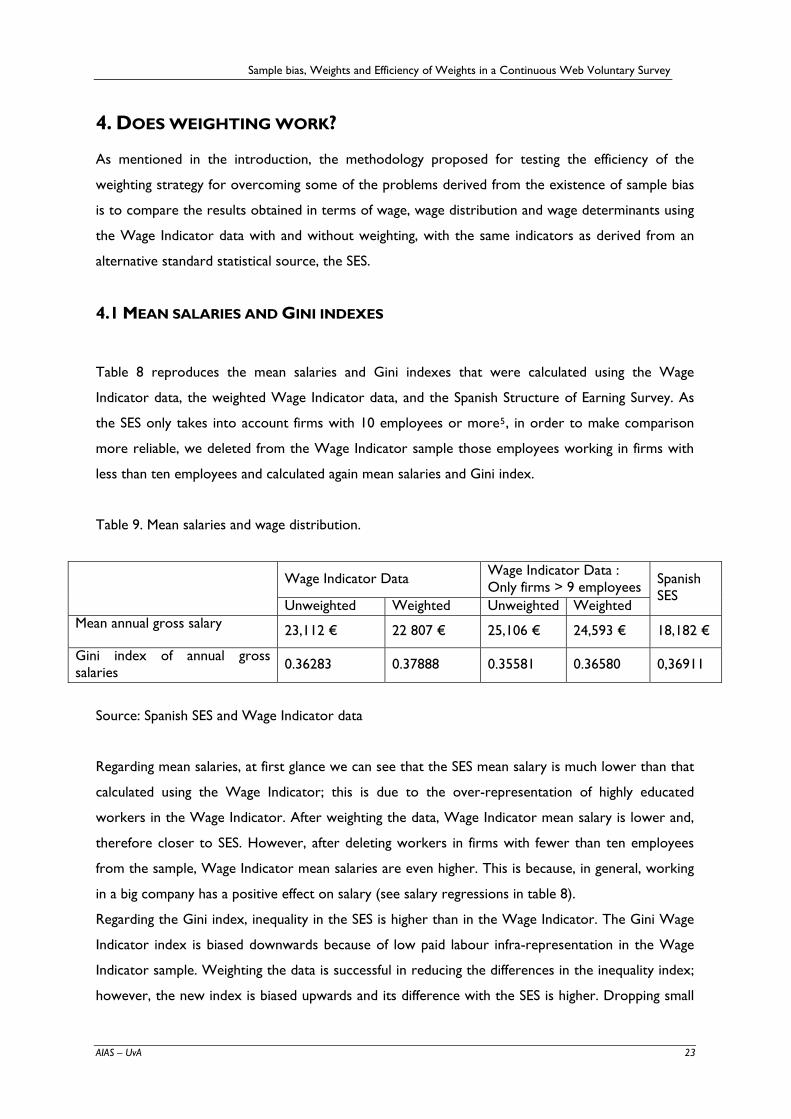
Table 8 reproduces the mean salaries and Gini indexes that were calculated using the Wage
Indicator data, the weighted Wage Indicator data, and the Spanish Structure of Earning Survey. As
the SES only takes into account firms with 10 employees or more5, in order to make comparison
more reliable, we deleted from the Wage Indicator sample those employees working in firms with
less than ten employees and calculated again mean salaries and Gini index.
Table 9. Mean salaries and wage distribution.
Source: Spanish SES and Wage Indicator data
Regarding mean salaries, at first glance we can see that the SES mean salary is much lower than that
calculated using the Wage Indicator; this is due to the over-representation of highly educated
workers in the Wage Indicator. After weighting the data, Wage Indicator mean salary is lower and,
therefore closer to SES. However, after deleting workers in firms with fewer than ten employees
from the sample, Wage Indicator mean salaries are even higher. This is because, in general, working
in a big company has a positive effect on salary (see salary regressions in table 8).
Regarding the Gini index, inequality in the SES is higher than in the Wage Indicator. The Gini Wage
Indicator index is biased downwards because of low paid labour infra-representation in the Wage
Indicator sample. Weighting the data is successful in reducing the differences in the inequality index;
however, the new index is biased upwards and its difference with the SES is higher. Dropping small
Wage Indicator Data Wage Indicator Data : Only firms > 9 employees
Unweighted Weighted Unweighted Weighted
Spanish SES
Mean annual gross salary 23,112 € 22 807 € 25,106 € 24,593 € 18,182 €
Gini index of annual gross salaries 0.36283 0.37888 0.35581 0.36580 0,36911
P. de Pedraza, K. Tijdens and R. Muñoz de Bustillo
AIAS – UvA 24
firms from the sample again reduces the Gini index. Finally, the Gini index is very close to the SES
once weights are implemented to the sample without small firms.
Therefore, our weighting methodology only partly solves the problem: mean salaries are closer to
SES salaries, but only in the full sample and even so the difference is still quite large; the Gini indexes
are quite similar. It is clear that to calculate mean salaries, alternative approaches are needed, mainly
targeting measures.
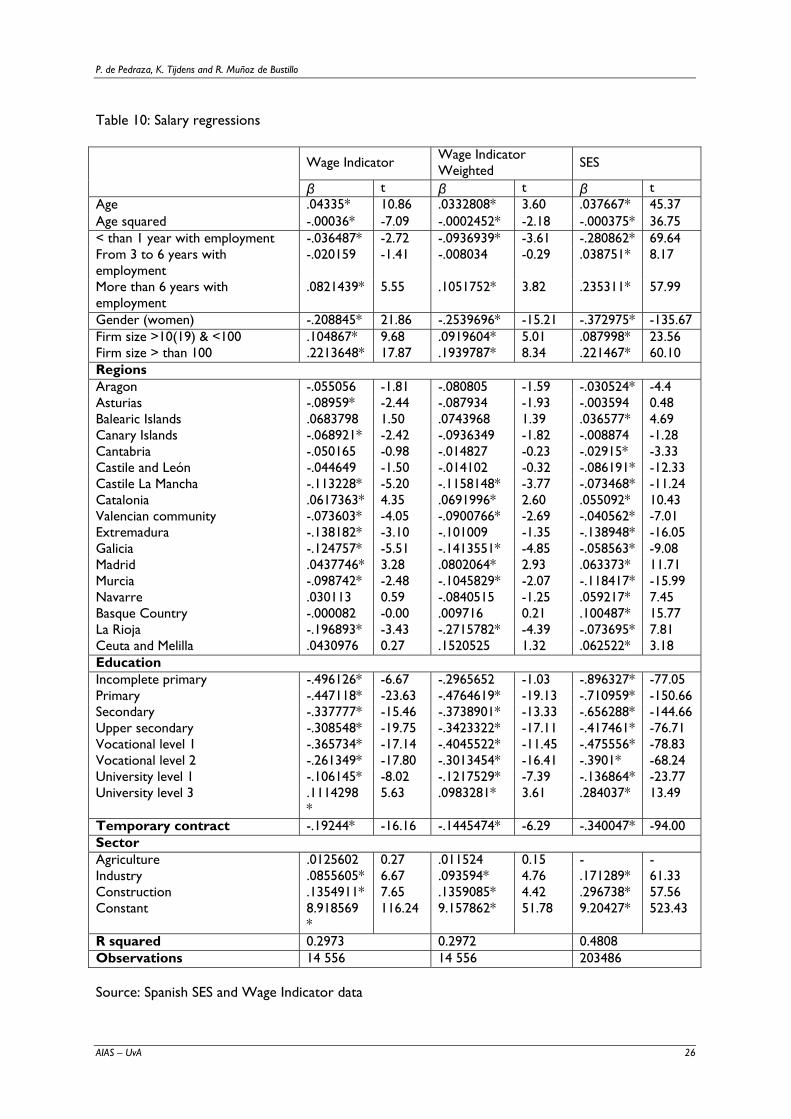
Table 9 reproduces the results of running conventional salary regressions using Wage Indicator data,
unweighted and weighted, and SES data. Regarding variables such as age, gender, firm size, years with
current employer and educational levels the sign of the impact on salary is the same in the three
regressions. Therefore, reliable conclusions can be obtained from the Wage Indicator sample, even
without implementing weights. Very often the impact of living in a specific region is not significant in
both Wage Indicator regressions but it is significant when using SES. R squared and t-values are
always higher when using SES because it is a much larger sample (215,000 employees).
5 The methodology of the SES can be found at http://europa.eu.int/estatref/info/sdds/en/earn/earn_ses_sm.htm
Sample bias, Weights and Efficiency of Weights in a Continuous Web Voluntary Survey
AIAS – UvA 25
5. CONCLUSIONS AND FURTHER RESEARCH
As we have seen, weighting the data has been proven to be a good method to partly overcome
problems coming from a biased sample obtained using a Continuous Voluntary Web Survey. The
weighting was tackled on the basis of the Labour Force Survey (LFS) published by the Spanish
National Statistics Office (Instituto Nacional de Estadística). The Wage Indicator Dataset sample
proportions was compared with LFS proportions for variables that were assumed to be subject to
bias, notably gender, age, sector of activity and educational level (section 2). These variables are
assumed to matter in every country but different types of weights can be calculated depending on
the sample characteristics. In the implementation of this methodology there are country specific
variables that should be included in country specific weights. For example, working hours (part-time
or full-time) is important in the Netherlands but not in Spain, the kind of contract (temporary or
permanent) is relevant in Spain but not in most of the countries. Geographical variables such as east-
west in Germany or Autonomous Regions in Spain could also be included in large countries.
Because of that, before weighting, it is important to make the simple bias description as above,
which compares the sample with the population (LFS) in order to choose the right variables to
weight.
P. de Pedraza, K. Tijdens and R. Muñoz de Bustillo
AIAS – UvA 26
Table 10: Salary regressions
Wage Indicator Wage Indicator Weighted SES
β t β t β t Age .04335* 10.86 .0332808* 3.60 .037667* 45.37 Age squared -.00036* -7.09 -.0002452* -2.18 -.000375* 36.75 < than 1 year with employment -.036487* -2.72 -.0936939* -3.61 -.280862* 69.64 From 3 to 6 years with employment
-.020159 -1.41 -.008034 -0.29 .038751* 8.17
More than 6 years with employment
.0821439* 5.55 .1051752* 3.82 .235311* 57.99
Gender (women) -.208845* 21.86 -.2539696* -15.21 -.372975* -135.67 Firm size >10(19) & <100 .104867* 9.68 .0919604* 5.01 .087998* 23.56 Firm size > than 100 .2213648* 17.87 .1939787* 8.34 .221467* 60.10 Regions Aragon -.055056 -1.81 -.080805 -1.59 -.030524* -4.4 Asturias -.08959* -2.44 -.087934 -1.93 -.003594 0.48 Balearic Islands .0683798 1.50 .0743968 1.39 .036577* 4.69 Canary Islands -.068921* -2.42 -.0936349 -1.82 -.008874 -1.28 Cantabria -.050165 -0.98 -.014827 -0.23 -.02915* -3.33 Castile and León -.044649 -1.50 -.014102 -0.32 -.086191* -12.33 Castile La Mancha -.113228* -5.20 -.1158148* -3.77 -.073468* -11.24 Catalonia .0617363* 4.35 .0691996* 2.60 .055092* 10.43 Valencian community -.073603* -4.05 -.0900766* -2.69 -.040562* -7.01 Extremadura -.138182* -3.10 -.101009 -1.35 -.138948* -16.05 Galicia -.124757* -5.51 -.1413551* -4.85 -.058563* -9.08 Madrid .0437746* 3.28 .0802064* 2.93 .063373* 11.71 Murcia -.098742* -2.48 -.1045829* -2.07 -.118417* -15.99 Navarre .030113 0.59 -.0840515 -1.25 .059217* 7.45 Basque Country -.000082 -0.00 .009716 0.21 .100487* 15.77 La Rioja -.196893* -3.43 -.2715782* -4.39 -.073695* 7.81 Ceuta and Melilla .0430976 0.27 .1520525 1.32 .062522* 3.18 Education Incomplete primary -.496126* -6.67 -.2965652 -1.03 -.896327* -77.05 Primary -.447118* -23.63 -.4764619* -19.13 -.710959* -150.66 Secondary -.337777* -15.46 -.3738901* -13.33 -.656288* -144.66 Upper secondary -.308548* -19.75 -.3423322* -17.11 -.417461* -76.71 Vocational level 1 -.365734* -17.14 -.4045522* -11.45 -.475556* -78.83 Vocational level 2 -.261349* -17.80 -.3013454* -16.41 -.3901* -68.24 University level 1 -.106145* -8.02 -.1217529* -7.39 -.136864* -23.77 University level 3 .1114298
* 5.63 .0983281* 3.61 .284037* 13.49
Temporary contract -.19244* -16.16 -.1445474* -6.29 -.340047* -94.00 Sector Agriculture .0125602 0.27 .011524 0.15 - - Industry .0855605* 6.67 .093594* 4.76 .171289* 61.33 Construction .1354911* 7.65 .1359085* 4.42 .296738* 57.56 Constant 8.918569
* 116.24 9.157862* 51.78 9.20427* 523.43
R squared 0.2973 0.2972 0.4808 Observations 14 556 14 556 203486 Source: Spanish SES and Wage Indicator data
Sample bias, Weights and Efficiency of Weights in a Continuous Web Voluntary Survey
AIAS – UvA 27
After weighting, estimated mean salaries and Gini index moved in the right direction. Therefore, it is
worthwhile to make an in-depth review of this method, the different ways in which it can be
implemented, the different variables that can be used and its application to other Wage indicator
samples. Nevertheless, weighting is far from being a full solution to the problem. Therefore other
correction techniques are needed in order to bring the volunteer sample closer to a probability
sample. One option is the so-called Propensity Score Adjustment (PSA), a statistical approach for
self-selection. There is a large bibliography (see Deaton 1997) dealing with different ways to tackle
the analysis of non-random samples that needs further empirical research to be adapted to
continuous Internet web surveys. We also leave for future research the implementation of a priori
measures aimed at obtaining a more representative sample. As we showed above regarding gender
bias, certain types of bias can be solved using marketing and targeting measures. Wage Indicator
structure is an opportunity to explore new methods addressed to obtaining a representative sample
of the population such as collaboration with trade unions, NGOs and social agents that can give
access to under-represented groups such as the lower educated.
P. de Pedraza, K. Tijdens and R. Muñoz de Bustillo
AIAS – UvA 28
Sample bias, Weights and Efficiency of Weights in a Continuous Web Voluntary Survey
AIAS – UvA 29
REFERENCES
Birnbaum, M.H (2004) “Human Research and Data Collection Via the Internet”, Annu. Rev. Psyvhol, 55, pp. 803-
832.
Couper, M. P. (2000) “ Web surveys: A review of issues and approaches”, Public Opinion Quarterly , 64, 4, pp.
464-495.
Couper, M. P., Blair J., and Triplett T. (1999): “A Comparison of Mail and E-Mail for a Survey of Employees in
Federal Statistical Agencies”, Journal of Official Statistics 15(1), pp. 39-56
Dillman, D. A., Bowker, D. (2001) “The Web Questionnaire Challenge to Survey Methodologists”, in Reips,
U.D., Bosnjak, M. (eds.): Dimensions of Internet Science, Pabst Science Publishers: Lengerich, pp. 159-
178.
Deaton, Angus. (1997). The Analysis of Household Surveys: A Microeconometric Approach to Development
Policy. ISBN 0-8018-5254-4
Fricker S., Galesic M., Tourangeau R., and Yan T. (2005): “An Experimental Comparison of Web and
Telephone Surveys”, Public Opinion Quarterly, 69(3), pp. 370-392,
Kaplowits M., Hadlock T. D., and Levine R. (2004),”A Comparison of Web and Mail Survey Response Rates”,
Public Opinion Quarterly, 69(3), pp. 94-101.
Porter S. R. and Whitcomb M. E. (2003): “The Impact of contact Type on Web Survey Response Rates”, Public
Opinion Quarterly, 67(4), pp. 579-588.

P. de Pedraza, K. Tijdens and R. Muñoz de Bustillo
AIAS – UvA 30
Sample bias, Weights and Efficiency of Weights in a Continuous Web Voluntary Survey
Recent publications of the Amsterdam Institute for Advanced Labour Studies
Working Papers
07-59 “Globalization and working time: Work-Place hours and flexibility in Germany” October 2007 Brian Burgoon and Damian Raess
07-58 “Determinants of subjective job insecurity in 5 European countries” August 2007 Rafael Muñoz de Bustillo and Pablo de Pedraza
07-57 “Does it matter who takes responsibility?” May 2007 Paul de Beer and Trudie Schils
07-56 “Employement protection in dutch collective labour agreements” April 2007 Trudie Schils
07-54 “Temporary agency work in the Netherlands” February 2007 Kea Tijdens, Maarten van Klaveren, Hester Houwing, Marc van der Meer & Marieke van Essen
07-53 “Distribution of responsibility for social security and labour market policy – Country report: Belgium” January 2007 Johan de Deken
07-52 “Distribution of responsibility for social security and labour market policy – Country report: Germany” January 2007 Bernard Ebbinghaus & Werner Eichhorst
07-51 “Distribution of responsibility for social security and labour market policy – Country report: Denmark” January 2007 Per Kongshøj Madsen
07-50 “Distribution of responsibility for social security and labour market policy – Country report: The United Kingdom” January 2007 Jochen Clasen
07-49 “Distribution of responsibility for social security and labour market policy – Country report: The Netherlands” January 2007 Trudie Schils
06-48 “Population ageing in the Netherlands: demographic and financial arguments for a balanced approach” January 2007 Wiemer Salverda
06-47 “The effects of social and political openness on the welfare state in 18 OECD countries, 1970-2000” January 2007 Ferry Koster
06-46 “Low Pay Incidence and Mobility in the Netherlands- Exploring the Role of Personal, Job and Employer Characteristics” October 2006 Maite Blázques Cuesta & Wiemer Salverda
06-45 “Diversity in Work: The Heterogeneity of Women’s Labour Market Participation Patterns” September 2006 Mara Yerkes
AIAS – UvA 31
06-44 “Early retirement patterns in Germany, the Netherlands and the United Kingdom” October 2006 Trudie Schils
P. de Pedraza, K. Tijdens and R. Muñoz de Bustillo
AIAS – UvA 32
06-43 “Women’s working preferences in the Netherlands, Germany and the UK” August 2006 Mara Yerkes
05-42 “Wage Bargaining Institutions in Europe: a happy Marriage or preparing for Divorce?” December 2005 Jelle Visser
05-41 “The Work-Family Balance on the Union’s Agenda” December 2005 Kilian Schreuder
05-40 “Boxing and Dancing: Dutch Trade Union and Works Council Experiences Revisited” November 2005 Maarten van Klaveren & Wim Sprenger
05-39 “Analysing employment practices in Western European Multinationals: coordination, industrial relations and employment flexibility in Poland” October 2005 Marta Kahancova & Marc van der Meer
05-38 “Income distribution in the Netherlands in the 20th century: long-run developments and cyclical properties” September 2005 Emiel Afman
05-37 “Search, Mismatch and Unemployment” July 2005 Maite Blazques & Marcel Jansen
05-36 “Women’s Preferences or Delineated Policies? The development of part-time work in the Netherlands, Germany and the United Kingdom” July 2005 Mara Yerkes & Jelle Visser
05-35 “Vissen in een vreemde vijver: Het werven van verpleegkundigen en verzorgenden in het buitenland” May 2005 Judith Roosblad
05-34 “Female part-time employment in the Netherlands and Spain: an analysis of the reasons for taking a part-time job and of the major sectors in which these jobs are performed” May 2005 Elena Sirvent Garcia del Valle
05-33 “Een Functie met Inhoud 2004 - Een enquête naar de taakinhoud van secretaressen 2004, 2000, 1994” April 2005 Kea Tijdens
04-32 “Tax evasive behavior and gender in a transition country” November 2004 Klarita Gërxhani
04-31 “How many hours do you usually work? An analysis of the working hours questions in 17 large-scale surveys in 7 countries” November 2004 Kea Tijdens
04-30 “Why do people work overtime hours? Paid and unpaid overtime working in the Netherlands” August 2004 Kea Tijdens
04-29 “Overcoming Marginalisation? Gender and Ethnic Segregation in the Dutch Construction, Health, IT and Printing Industries” July 2004 Marc van der Meer
04-28 “The Work-Family Balance in Collective agreements. More Female employees, More Provisions?” July 2004 Killian Schreuder
04-27 “Female Income, the Ego Effect and the Divorce Decision: Evidence from Micro Data” March 2004 Randy Kesselring (Professor of Economics at Arkansas State University , USA) was quest at AIAS in April and May 2003
Sample bias, Weights and Efficiency of Weights in a Continuous Web Voluntary Survey
04-26 “Economische effecten van Immigratie – Ontwikkeling van een Databestand en eerste analyses Januari 2004 Joop Hartog (FEE) & Aslan Zorlu
03-25 ”Wage Indicator” – Dataset Loonwijzer Januari 2004 dr Kea Tijdens
03-24 Codeboek DUCADAM Dataset” December 2003 Drs Kilian Schreuder & dr Kea Tijdens
03-23 “Household Consumption and Savings Around the Time of Births and the Role of Education” December 2003 Adriaan S. Kalwij
03-22 “A panel data analysis of the effects of wages, standard hours and unionisation on paid overtime work in Britain” October 2003 Adriaan S. Kalwij
03-21 “A Two-Step First-Difference Estimator for a Panel Data Tobit Model” December 2003 Adriaan S. Kalwij
03-20 “Individuals’ Unemployment Durations over the Business Cycle” June 2003 dr Adriaan Kalwei
03-19 Een onderzoek naar CAO-afspraken op basis van de FNV cao-databank en de AWVN-database” December 2003 dr Kea Tijdens & Maarten van Klaveren
03-18 “Permanent and Transitory Wage Inequality of British Men, 1975-2001: Year, Age and Cohort Effects” October 2003 dr Adriaan S. Kalwij & Rob Alessie
03-17 “Working Women’s Choices for Domestic Help” October 2003 dr Kea Tijdens, Tanja van der Lippe & Esther de Ruijter
03-16 “De invloed van de Wet arbeid en zorg op verlofregelingen in CAO’s” October 2003 Marieke van Essen
03-15 “Flexibility and Social Protection” August 2003 dr Ton Wilthagen
03-14 “Top Incomes in the Netherlands and The United Kingdom over the Twentieth Century” September 2003
Sir dr A.B.Atkinson and dr. W. Salverda 03-13 “Tax Evasion in Albania: an Institutional Vacuum”
April 2003 dr Klarita Gërxhani
03-12 “Politico-Economic Institutions and the Informal Sector in Albania” May 2003 dr Klarita Gërxhani
03-11 “Tax Evasion and the Source of Income: An experimental study in Albania and the Netherlands” May 2003 dr Klarita Gërxhani
03-10 "Chances and limitations of "benchmarking" in the reform of welfare state structures - the case of pension policy” May 2003 dr Martin Schludi
03-09 "Dealing with the "flexibility-security-nexus: Institutions, strategies, opportunities and barriers” May 2003 prof. Ton Wilthagen en dr. Frank Tros
AIAS – UvA 33
03-08 “Tax Evasion in Transition: Outcome of an Institutional Clash -Testing Feige’s Conjecture" March 2003 dr Klarita Gërxhani
P. de Pedraza, K. Tijdens and R. Muñoz de Bustillo
AIAS – UvA 34
03-07 “Teleworking Policies of Organisations- The Dutch Experiencee” February 2003 dr Kea Tijdens en Maarten van Klaveren
03-06 “Flexible Work- Arrangements and the Quality of Life” February 2003 drs Cees Nierop
01-05 Employer’s and employees’ preferences for working time reduction and working time differentiation – A study of the 36 hours working week in the Dutch banking industry” 2001 dr Kea Tijdens
01-04 “Pattern Persistence in Europan Trade Union Density” October 2001 prof. dr Danielle Checchi, prof. dr Jelle Visser
01-03 “Negotiated flexibility in working time and labour market transitions – The case of the Netherlands” 2001 prof. dr Jelle Visser
01-02 “Substitution or Segregation: Explaining the Gender Composition in Dutch Manufacturing Industry 1899 – 1998” June 2001 Maarten van Klaveren – STZ Advies en Onderzoek , Eindhoven, dr Kea Tijdens
00-01 “The first part-time economy in the world. Does it work?” June 2000 prof. dr Jelle Visser

Sample bias, Weights and Efficiency of Weights in a Continuous Web Voluntary Survey Sample bias, Weights and Efficiency of Weights in a Continuous Web Voluntary Survey
AIAS – UvA 35 AIAS – UvA 35

P. de Pedraza, K. Tijdens and R. Muñoz de Bustillo
AIAS – UvA 36
AIAS
AIAS is a young interdisciplinary institute, established in 1998, aiming to become the leading expert centre in
the Netherlands for research on industrial relations, organisation of work, wage formation and labour market
inequalities.
As a network organisation, AIAS brings together high-level expertise at the University of Amsterdam from five
disciplines:
• Law • Economics • Sociology • Psychology • Health and safety studies
AIAS provides both teaching and research. On the teaching side it offers a Masters in Advanced Labour
Studies/Human Resources and special courses in co-operation with other organizations such as the National
Trade Union Museum and the Netherlands Institute of International Relations 'Clingendael'. The teaching is in
Dutch but AIAS is currently developing a MPhil in Organisation and Management Studies and a European
Scientific Master programme in Labour Studies in co-operation with sister institutes from other countries.
AIAS has an extensive research program (2000-2004) building on the research performed by its member
scholars. Current research themes effectively include:
• The impact of the Euro on wage formation, social policy and industrial relations • Transitional labour markets and the flexibility and security trade-off in social and labour market
regulation • The prospects and policies of 'overcoming marginalisation' in employment • The cycles of policy learning and mimicking in labour market reforms in Europe • Female agency and collective bargaining outcomes • The projects of the LoWER network.
AMSTERDAMS INSTITUUT VOOR ARBEIDSSTUDIES
Universiteit van Amsterdam
Plantage Muidergracht 12 1018 TV Amsterdam
the Netherlands tel +31 20 525 4199 fax +31 20 525 4301 [email protected] www.uva-aias.net

P. de Pedraza, K. Tijdens and R. Muñoz de Bustillo
AIAS – UvA 38
AMSTERDAMS INSTITUUT VOOR ARBEIDSSTUDIES
Universiteit van Amsterdam
Plantage Muidergracht 12
1018 TV Amsterdam
tel +31 20 525 4199 fax +31 20 525 4301 [email protected] www.uva-aias.net www.uva-aias.net