Embed Size (px)
Citation preview
1
UNIVERSITY OF AGRICULTURE, ABEOKUTA.
DEPARTMENT OF PLANT PHYSIOLOGY AND CROP PRODUCTION.
Dr. Olaiya, Dr. Atayese and Prof. Olowe
COURSE NOTES 2011/2012 SESSION
A. TRANSLOCATION OF ASSIMILATES
B. PARTITIONING OF ASSIMILATES
C. PHOTOSYNTHETIC POTENTIAL OF PLANTS
D. TRANSPIRATION
E. PLANT RESPONSES TO WATER STRESS
F. LIGHT UTILIZATION
2
A. TRANSLOCATION
Translocation is the movement of dissolved materials throughout the plant. The rate at
which photosynthetic (Ps) products such as sucrose move from the leaves to the sink
organs controls the rate of photosynthesis.
Plant species that have high Ps rates also have relatively high translocation rates. This is
consistent with the idea that effective removal of Ps products maintains rapid CO2
fixation. Severe infection of leaves by pathogens often so severely inhibits Ps rates that
these leaves become sugar importers instead of sugar exporters. The adjacent healthy
leaves then gradually attain marked increases in Ps rates, suggesting that enhanced
translocation has reduced CO2 fixation.
There are four principal pathways for translocation of materials after uptake by the roots
of leaves of a plant.
a. Movement in the xylem along the transpiration stream. It allows the upward
movement of organic materials in the xylem from the soil solution into foliage.
b. Through the phloem or other cells such as ray parenchyma. This is the major
pathway of movement of materials applied to the leaves. Subsequently, phloem
flow may take solutes up to the stem apex as easily as down to the lower parts of
the plant.
c. Through the cell walls. Aqueous network through the cell walls is described as
apoplast (outside protoplast). It is the principal region of the apparent free space.
d. Through the intercellular spaces. The rapid systemic permeation of gases and
volatiles through the plants indicates a ready movement through the intercellular
spaces.
Most of the metabolic sinks in plants are connected with the source by phloem elements
in vascular strands. Sugars move from source to sink down the concentration gradients.
Translocation occurs in the sieve tubes of the phloem and although other sugars and
derivatives and also nitrogenous compounds may be found in the phloem exudates, the
most important and general constituent is the disaccharide sucrose.
3
The movement of photosynthate or metabolites from the surrounding mesophyll cells of
the leaf into the conducting tissues of the phloem is known as “phloem lading”. The
process of loading is selective, as shown by the failure of certain sugars and organic acids
to be transferred while others moved in readily. Entrance into the sieve tubes is
apparently independent of concentration differences between the mesophyll and sieve
tubes in the case of sucrose, amino acids and organic acids. Both the process of transport
to the sieve tubes and the terminal step of passage into the sieve tubes may require ATP.
The concentration of sugars in leaves where they are produced is usually higher than that
in the sinks. Only a fraction of the products of photosynthesis remain at the site of
production in fully expanded leaves, most of them are translocated to other organs where
they are either used as building blocks for various cell-constituents or deposited as
storage products. A certain part is always lost through respiration during transport and at
the final storage site. Photosynthathes (PS) are distributed within the plant at a definite
distribution pattern. The pattern of movement changes continuously during the growth of
the plant and exerts a profound effect on both the morphological form and the yielding
properties of the plant.
During the development of a single young leaf, it imports PS from other parts of the plant
to build up its own structure; but very soon it becomes self-supporting and in a short time
starts to export PS. As long as the plant is young, this export is mainly directed towards
centres of active growth, such as developing leaves, root tips, or shoot apices; but later on
much of the assimilate transport is diverted to storage organ such as fruits, grains, or
tubers. Another expression of the distribution pattern is the fact that leaves in different
positions on the plant may preferentially supply different growing organs with
assimilates. The PS for the roots are thus mainly produced in the lower leaves and those
for the apical parts in the upper leaves, whereas leaves in an intermediate position deliver
assimilates in both directions. This general pattern is only relative, however, and may be
modified both by differences in the internal organizations of the vascular system.
Different centres of active growth may exhibit various strengths of “demand” for
assimilates and therefore, reproductive organs often (but not always) dominate vegetative
organs; shoot apices dominate root tips.
4
The continues growth of higher green plants well supplied with water and inorganic
nutrients depends primarily on
i. the accomplishment of photosynthesis in the leaves of the plants
ii. the transport of organic compounds from the leaves to heterotrophic cells
which constitute metabolic sinks
Underground parts – roots and a variety of storage organs are obvious examples of
plant parts leading a heterotrophic existence and developing tubers are regarded as the
classical sink for products of photosynthesis. Non-green aerial plant paerts – bilbs,
flowers and fruits and most of the cells in stems and petioles also constitute a drain on
photosynthetic products. Even within leaves there are many cells without chloroplasts
and the autotrophic cells themselves consume PS in their own growth and
respiration..
In a germinating seedling, the sink is the rapidly growing embryo and this is supplied
by mobile organic materials produced during hydrolytic activity in the source storage
organs – cotyledon or endosperm.
In a vegetative plant, the developing green leaves are a sink not only for their own PS
but also for that produced in older leaves with appropriate vascular connections,
which also support apical growth. The oldest leaves near the base of the plant,
provided they receive adequate illumination export sugars to the roots. Developing
buds and meristematic regions in the roots place demands on the available assimilates
and compete successfully as sinks with developing leaves. The onset of flowering and
subsequent fruit development have a marked effect on the redistribution of
assimiliates. Fruits develop at then expense of vegetative growth and at this time the
growth of roots may be restricted.
The principal carbohydrate translocated in the sieve tubes appears to be sucrose, but
in trees and some other plants this molecule may have condensed with it one or more
molecules of galactose, to give rafinose, starchyose or verbascose in order of
decreasing concentrations. Sucrose is also the principal carbohydrate translocated in
herbaceous plants. Amino and organic acids, minerals, viruses, hormones and steroids
are also known to be translocated. As sucrose moves through the sieve tubes it may
5
be withdrawn into surrounding cells and hydrolyzed there so that whole-phloem
analysis may give misleading results.
B. PARTITIONING OF ASSIMILATES
Partitioning describes the distribution of new assimilates to growth of various plant
parts and to respiration. Partitioning is subject to a control system whose flexibility is
indicated by its capacity to respond appropriately to different environmental stimuli.
Thus shading is likely to increase partition (relative to the total dry weight) to the
laminae whereas water or nutrient stress improves partition to the roots. Removal of
plant parts results in temporarily increased partition to other similar parts until
partition relationship of intact control plants is re-established. All the vegetative sinks
are potentially in competition during the vegetative phase, the dominant sink being
sheath and stem. Yield depends on the translocation of assimilates in most species
largely sucrose from the leaves or other photosynthetic tissues to the parts of
economic importance – tubers, seeds, etc. Other parts – roots, stems, young leaves
and fruits also rely on the assimilates produced by the mature leaves. The source and
sinks are linked by a transport pathway of phloem sieve elements. Mature leaves are
the primary sources of assimilates, from the current photosynthesis, but this can be
supplemented by the mobilization of stored reserves/organs such as the stems, which
may be described as secondary sources.
In most dicots, cotyledons initially serve as source of reserves, but are subsequently
raised above ground, when they assume a photosynthetic function which supports
further growth until the first true leaves are photosynthetically competent. Storage
function is taken over by endosperm from which mobilized reserves are absorbed by
the cotyledons and then translocated to the embryonic axis. Sucrose from the
endosperm is accumulated in the phloem cells of the cotyledons largely sustain
growth of the hypocotyls and roots. Elongation of the hypocotyls raises the cotyledon.
Dry matter partitioning between roots, above ground vegetative growth, and
reproductive growth are usually modified by water deficits. The response depends
upon the species, when the stress occurs, its duration, and its severity. The increase in
6
root-shoot ratio of crops under water deficits may reflect an increase in the proportion
of assimilates allocated to the roots, or a change in the rate of death or turn over of
roots relative to the shoot. An increase in root growth may indicate a greater density
or a greater depth of roots. Soil and root resistances to water uptake are reduced when
root length density increases, thereby permitting higher water flow rates through the
plant and delaying the onset of severe plant water deficits. Whilst partitioning of dry
matter to roots may enhance water uptake, it represents a loss to above ground dry
matter production. An exception is root crops, such as cassava, where water deficit
could be beneficial to economic yield, provided that the increased proportion of dry
matter partitioned to the roots goes mainly to the tubers. Since photosynthesis is
inhibited more than translocation during stress, dry matter produced before flowering
may be transferred from the stem and roots to the grain during grain filling – “
Compensatory translocation” The amount of pre-anthesis assimilate partitioned to
the grain is dependent on the timing and severity of water deficits as it affects the
source-sink balance.
C. PHOTOSYNTHETIC POTENTIAL OF PLANTS
There are basically two types of plants C-3 and C-4.
In C-3 plants, the earliest labeled compound is 3-phosphoglycerate (PGA). The 5-
Carbon substance, ribulose diphosphate (RuDP) combines with one molecule of CO2,
presumably forming an unstable 6-carbon substance which immediately splits into
two molecules of PGA, the 3-carbon substance which gives the C-3 cycle its name.
Ribulose diphosphate + CO2 2 X PGA
5C atoms 1 C atom 2 X 3C atoms
The reaction is catalyzed by RuDP carboxylase
C-4 plants, (most tropical grasses and cereals, except rice and a few dicots) have 4-
carbon organic acid, malate or aspartate) as the immediately labeled product which is
formed by the combination of 3-carbon phosphoenol pyruvate (PEP) with CO2
PEP + CO2 PEP carboxylase malate or aspartate
3 C + 1 C 4C
7
A feature of the C-3 is photorespiration which reduces net CO2 assimilation rates in
all C-3 species especially at high leaf temperatures. C-4 plants actually contain the
enzymes for C-3 photosynthesis including RuDP carboxylase but they are confined to
certain cells in the leaf surrounding the smaller veins and called the bundle sheath
cells. In the mesophyll cells, CO2 is fixed to form the C-4 acid which are translocated
to the bundle sheath cells where they dissociate to release CO2 which is re-fixed by
RuDP carboxylase. The other dissociated product, probably pyruvate, is translocated
back to the mesophyll.
The net Ps rates of C-4 plants are higher than in C-3 plants, whereas the rate of water
use is not greatly different from C-3 species, the WUE of C-4 plants may be 50-100%
better than C-3 species.
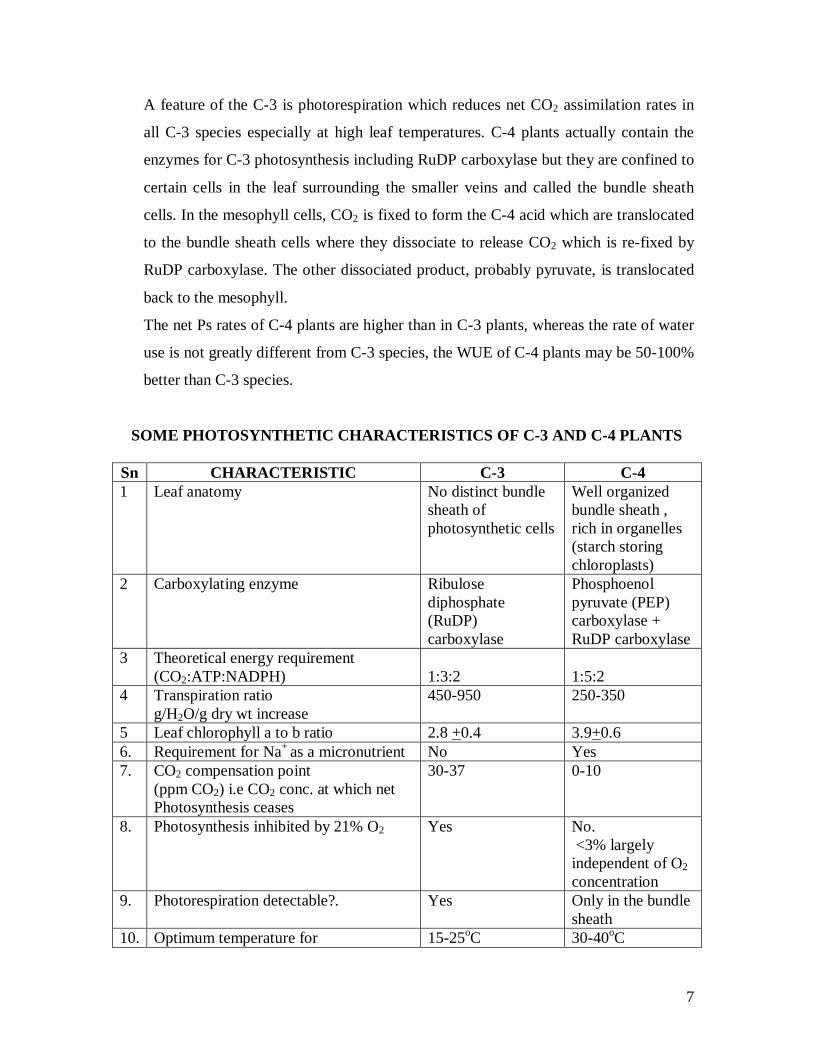
SOME PHOTOSYNTHETIC CHARACTERISTICS OF C-3 AND C-4 PLANTS Sn CHARACTERISTIC C-3 C-4 1 Leaf anatomy No distinct bundle
sheath of photosynthetic cells
Well organized bundle sheath , rich in organelles (starch storing chloroplasts)
2 Carboxylating enzyme Ribulose diphosphate (RuDP) carboxylase
Phosphoenol pyruvate (PEP) carboxylase + RuDP carboxylase
3 Theoretical energy requirement (CO2:ATP:NADPH)
1:3:2
1:5:2
4 Transpiration ratio g/H2O/g dry wt increase
450-950 250-350
5 Leaf chlorophyll a to b ratio 2.8 +0.4 3.9+0.6 6. Requirement for Na+ as a micronutrient No Yes 7. CO2 compensation point
(ppm CO2) i.e CO2 conc. at which net Photosynthesis ceases
30-37 0-10
8. Photosynthesis inhibited by 21% O2 Yes No. <3% largely independent of O2 concentration
9. Photorespiration detectable?. Yes Only in the bundle sheath
10. Optimum temperature for 15-25oC 30-40oC
8
photosynthesis 11. Dry matter production tons/ha/year 22+0.3 39+17
D. TRANSPIRATION
Transpiration is the evaporation of water from the plant through the openings between the
guard cells. The opening and the guard cells are collectively called ‘stomatal
apparatus’. Adjacent to each guard cell are usually one or two other modified epidermal
cells called accessory or subsidiary cells. Water evaporates inside the leaf from the
palisade parenchyma and spongy parenchyma cell walls into the intercellular spaces,
which are continuous with the outside air when the stomates are open. Many of the cell
walls of palisade and spongy parenchyma cells are collectively called mesophyll cells and
are exposed to the internal leaf atmosphere. Stomates often as the guard cells take up
water and swell. The guard cell then curves during opening, partially because it is
attached to each end of its partner.
Environmental Effects on Stomates
- Stomates of most plants open at sunrise and close in darkness, allowing entry
of CO2 needed for photosynthesis during the day time. Light intensity
influences the rate of opening and the final aperture size, bright light causing a
wider aperture.
- Low conc. of CO2 cause stomates to open and removal of CO2 during
photosynthesis by parenchyma and mosophyll cells results in opening of
stomates of most species in the day. High CO2 conc causes the stomates to
close in the light and dark.
- As water potential decreases (water stress increases), the stomates close.
- High temperatures (30-35oC) cause the stomates to close due to water stress or
increase in CO2 conc within the leaf.
- Exposure to gentle breeze can lead to partial closure of stomates because
additional CO2 is brought close to stomates where it can diffuse in faster.
9
Guard Cell Uptake of K+
When the stomates open, relatively large quantities of K+ move from the surrounding
cells into the guard cells. Light causes a building of K+ in guard cells, as does CO2-free
air. When leaves are transferred to the dark, K+ moves out of guard cells into the
surrounding cells and stomates close.
Stomates also close in response to the application of abscisic acid whose application
causes loss of K+ from the guard cells.
Blue light under low light intensity can cause stomatal opening when red light has no
effect by acting directly on guard cells that receive K+ and thereby open up.
Ecologists classify plants according to their response to water as follows:
a. Hydrophytes – plants that grow where water is super abundant.
b. Mesophytes – plants that grow where water availability is intermediate
c. Xerophytes – Plants that grow where water is scarce
Solutes strongly influence water potential, so ecologists further classify plants that are
sensitive to relatively high salt concentrations as GLYCOPHYTES and those that are
able to grow in the presence of high salts as HALOPHYTES
Xerophytes are plants that escape, resist or endure drought. They can be described as
being hardy. Annual plants in the desert escape the drought by existing as dormant seeds
during the dry season. Succulent species resist drought by storing water in their succulent
tissues (cactus). Enough water is stored and its rate of loss is so extremely low (due to an
exceptionally thick cuticle and stomatal closure during the day time.
Non-succulent perennial perennials avoid drought by having extensive shallow root
system capable of absorbing surface moisture after rain storm, reduction in size of leaf
blades (which increases heat transfer by convection, lowers leaf temperature and thus
reduces transpiration, sunken tomates, shedding of leaves during dry periods and such
other factors as heavy pubescence on leaf surfaces.
Transpiration may also refer to sweating and hyperhydrosis.
10
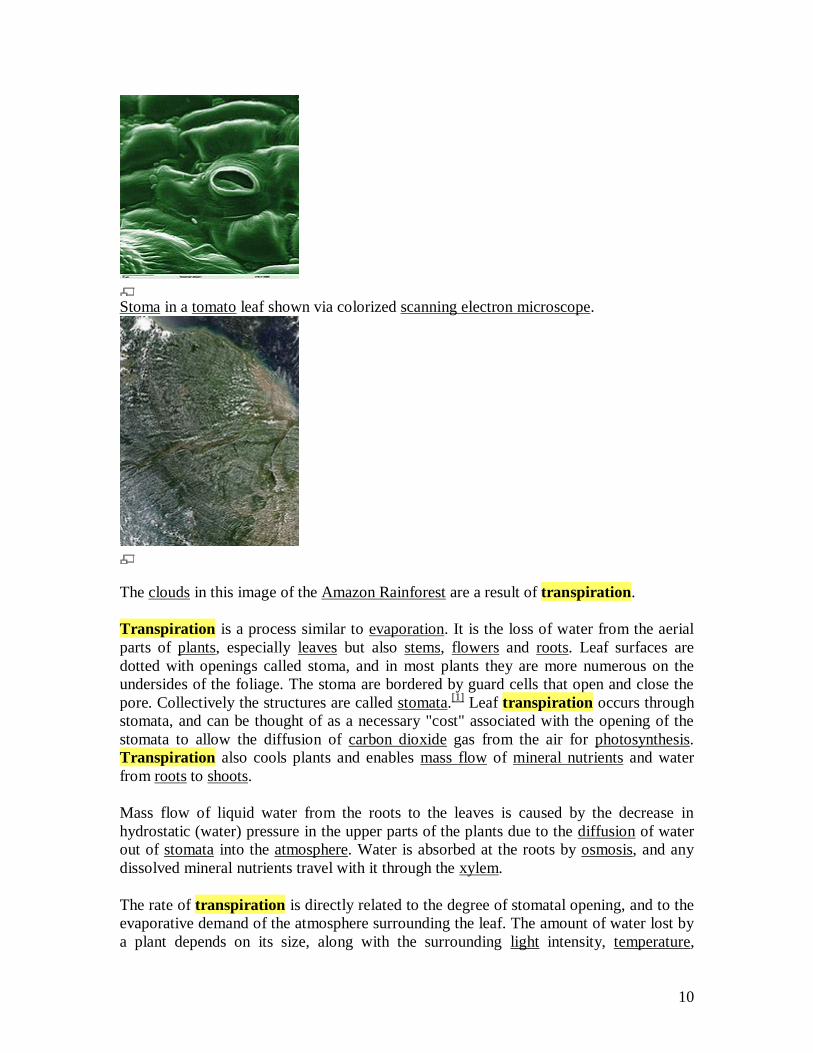
Stoma in a tomato leaf shown via colorized scanning electron microscope.
The clouds in this image of the Amazon Rainforest are a result of transpiration.
Transpiration is a process similar to evaporation. It is the loss of water from the aerial parts of plants, especially leaves but also stems, flowers and roots. Leaf surfaces are dotted with openings called stoma, and in most plants they are more numerous on the undersides of the foliage. The stoma are bordered by guard cells that open and close the pore. Collectively the structures are called stomata.[1] Leaf transpiration occurs through stomata, and can be thought of as a necessary "cost" associated with the opening of the stomata to allow the diffusion of carbon dioxide gas from the air for photosynthesis. Transpiration also cools plants and enables mass flow of mineral nutrients and water from roots to shoots.
Mass flow of liquid water from the roots to the leaves is caused by the decrease in hydrostatic (water) pressure in the upper parts of the plants due to the diffusion of water out of stomata into the atmosphere. Water is absorbed at the roots by osmosis, and any dissolved mineral nutrients travel with it through the xylem.
The rate of transpiration is directly related to the degree of stomatal opening, and to the evaporative demand of the atmosphere surrounding the leaf. The amount of water lost by a plant depends on its size, along with the surrounding light intensity, temperature,
11
humidity, and wind speed (all of which influence evaporative demand). Soil water supply and soil temperature can influence stomatal opening, and thus transpiration rate.
A fully grown tree may lose several hundred gallons (a few cubic meters) of water through its leaves on a hot, dry day. About 90% of the water that enters a plant's roots is used for this process. The transpiration ratio is the ratio of the mass of water transpired to the mass of dry matter produced; the transpiration ratio of crops tends to fall between 200 and 1000 (i.e., crop plants transpire 200 to 1000 kg of water for every kg of dry matter produced).[2]
Transpiration rate of plants can be measured by a number of techniques, including potometers, lysimeters, porometers, and heat balance sap flow gauges.
Desert plants and conifers have specially adapted structures, such as thick cuticles, reduced leaf areas, sunken stomata and hairs to reduce transpiration and conserve water. Many cacti conduct photosynthesis in succulent stems, rather than leaves, so the surface area of the shoot is very low. Many desert plants have a special type of photosynthesis, termed crassulacean acid metabolism or CAM photosynthesis in which the stomata are closed during the day and open at night when transpiration will be lower.
E. PLANT RESPONSES TO WATER STRESS
a. Cellular growth appears to be the most sensitive to water stress. Decreasing the
external water potential by only a bar or less results in a perceptible decrease in
cellular growth. This sensitivity is responsible the common observation that many
plants grow only at night when water stress is lowest.
b. The response of cellular growth to water stress is manifested as a reduction in cell
wall synthesis.
c. Protein synthesis in the cell may be almost equally sensitive to water stress. These
responses are observed only in tissues that are normally growing rapidly
(synthesizing cell wall polysaccharides and proteins). The effects on protein
synthesis are apparently controlled at the translational level, the level of ribosome
activity.
d. At slightly more negative water potentials, protochlorophyll formation is
inhibited.
e. Activities of certain enzymes e.g NO3 – reductase decrease quite sharply as water
stress increases. Whereas, a few enzymes, such as alpha amylase and ribonulease,
show increased activities. It was thought that such hydrolytic enzymes might
12
break down starches and other materials to make the osmotic potential more –ve,
thereby resisting the drought.
f. Nitrogen fixation and reduction also drop with water stress. At levels of stress that
cause observable changes in enzyme activities, cell division is also inhibited.
g. The stomates begin to close leading to a reduction in transpiration and
photosynthesis.
h. At about this level of stress, Abscisic acid (ABA) begins to increase markedly in
leaf tissues. This could be responsible for stomatal closure, since applied ABA
causes stomates to close rapidly. At slightly higher stress levels, the amino acids
praline begins to increase sharply, sometime building up to levels of 1% of the
tissue dry weight. At higher level of stress (Water potential = 10 – 20 bars,) ,
respiration, translocation of assimilates and CO2 assimilation drop to levels near
zero. Hydrolytic enzyme activity increases considerably and ion transport can be
slowed down.
i. Parts of the transpiration stream in the xylem eventually cavitate so the xylem
becomes blocked by vapour space.
j. Since growth is especially sensitive to water stress, yields may be noticeably
decreased even with moderate drought.
k. Cells are smaller and leaves develop less during water stress, resulting in reduced
area for photosynthesis. Furthermore, plants may be especially sesnsitive to
drought during certain stages , such as tassel formation in maize.
Mechanism of plant response to water stress
1. Water activity (its ability to enter into chemical reactions) is a function of water
potential and is thus lowered by water stress.
2. Solutes increase in concentration as water is lost.
3. Water stress might result in special changes in membranes
4. Water stress might upset the hydration of macro-molecules e.g. dehydration of
key enzymes could cause disulfide within proteins to break and reform leading to
enzyme denaturation when molecules are re-hydrated.
5. Water stress can change the turgor pressure within the plant cells.
13
F. LIGHT UTILIZATION
Crops grow and use water because they intercept radiation from the sun, sky and
atmosphere. Diurnal changes of solar radiation dictate the diurnal course of
photosynthesis and transpiration and the vertical gradient of radiation flux in a canopy is
a measure of the absorption of energy by foliage at different heights. The distribution of
radiation within a plant community is the most important single element of microclimate.
Radiation: Features of solar radiation relevant to Crop Ecology.
1. The angle of incidence of the sun’s rays usually specified by the solar elevation ß.
2. The spectral composition of the radiation. The wave band in which radiant energy
is available for PS is usually defined by the limits 0.4 – 0.7 µm corresponding to
the blue and red ends of visible spectrum PAR (Photosynthetically Active
Radiation).
3. The relative intensity of diffuse radiations from the blue sky, haze and clouds, and
of direct radiation from the solar beam.
The ratio of PAR to total radiation changes slightly with the amount of water vapor
and dust in the atmosphere but seems to be relatively insensitive to the presence of
clouds.
Leaves
Most of the radiation intercepted by a field crop is absorbed by leaves, more
specifically, by leaf laminae. Leaf sheaths, stems and inflorescences also absorb
radiation and are capable of PS in some species.
The area of leaf laminae within any horizontal layer of a canopy is specified by a leaf
area index, LAI, the area of leaves per unit area of ground beneath them. The
transmission of radiation by leaves depends strongly on wavelength. In the region of
0.4 to 0.7µm where pigment absorbs most strongly, the leaves of many crop plants
absorb 80-90% of incident radiation. Absorption is much smaller in the infra-red (0.7-
3µm) often falling to 10-20% between 0.7-0.8 µm. The proportions of radiation
transmitted and reflected by crop leaves are usually similar at about 5 – 10% in the
14
visible spectrum and 30 – 40% in the infrared. It will be assumed here that leaves
transmit 7% of PAR and 25% of total solar radiation because leaves absorb visible
radiation preferentially, marked differences of spectral composition are observed in
plant communities.
Light quantity is defined as the wavelength available and active in a particular
biological phenomenon. The quality of light that arrives at the top surface of the
canopy may be changed as it moves through a leaf or is reflected from a leaf.
Light intensity (quantity) – a product of irradiance and duration. The quantity of
radiation increase sharply as day length increases. Species differ in their response to
light intensity. With increasing light, a unit area of corn leaf shows increasing PH
capacity when compared to the same area of soybean leaf. A soybean leaf is only 2/3
as efficient as a corn leaf in fixing carbon at full sunlight. It is common to observe
that species botanically referred to as shade species (e.g. tobacco) are saturated (i.e.
cease to respond to increased light intensity) more rapidly than do sun species.
Tobacco is saturated near ¼ full sunlight. Sunflower and corn continue to respond to
light intensity changes in the range near full sunlight.
One flat layer of leaves over a unit area would reflect 10% of the incoming radiation,
absorb 80% and transmit only 10% to the next leaf area. The optimum leaf area index
range for most crops is between 2.5 to 5.0 based on these facts.
1. the LAI during growth should be sufficient to intercept as much of the
incoming radiation as possible
2. the LAI should be of a magnitude which prevents parasitism: i.e. a
condition of lower leaves using carbohydrates at a greater rate than they
photosynthesize.
3. the LAI must suit the condition and purposes of which the crop is grown.
Max LAI does not always equal max grain yield, nor does it always yield maximum dry
matter production.
15
Leaf Area Duration (LAD) is used to describe the length of time the leaf area is
functional e.g. a field corn might have LAI of 4.5 at the time of pollination, but it could
be useful also to know how long this LAI is maintained. It has been established that the
grain yield of cereals is related to LAI after the ears emerge but not before.
Optimum vs Critical Leaf Area
Optimum Leaf Area is the leaf area at which the rate of dry matter production is max at
a particular LAI and less at LAI below or above.
Critical Leaf Area is when the rate of dry matter production is constant after the
maximum rate was reached. It is the LAI required to give 95% interception at noon.
Low Light Intensity
When light intensity limits full expression of a plant’s photosynthetic potential,
morphological adaptation can maximize interception of incident radiation. Leaves and
leaflets of Leguminosae show coordinated movements which place leaflets perpendicular
to incident light at low insolation. Such a ‘day-sleep’ phenomenon improves light
utilization within a legume canopy by modifying community structure according to
available light. The great majority of plants show some leaf movement in response to
solar direction and intensity. Final position depends upon prevailing light and plant
response.
In shade plants, leaves are generally in one layer and at right angles to incident light. In
deep shade, leaf mosaics develop which maximize light interception but minimize mutual
shading. Formation of larger thinner leaves confers additional ecological advantage in
deep shade.
Plant morphology and community architecture govern the interception of solar radiation,
and physiological processes in the leaf govern its utilization. Leaves on shade plants,
have an impressive array of adaptive responses at low light intensity. Mesophyll cell size
is reduced and laminar surface enlarges. Chloroplasts become rearranged in
photosynthetic tissues, and they line upper surfaces of cells under low light but align
along vertical walls when sunlight is strong.
16
Most cultivated annuals and biennials bear typical sun leaves. Their photo-synthetic
apparatus is light saturated at ¼ to 1/5 of full sunlight, with an absolute capacity well in
excess of that for shade leaves. Shade leaves are much thinner and have lower rates of
dark respiration and a lower value for light compensation. Respiratory losses in
particular can be a primary factor in shade adaptation. Shade tolerant plants show only
moderate response to high temperature even at 350C.
High Light Intensity
Under high light intensity, leaves on a plant adopt a vertical orientation in a north south
plane so that noon-time exposure is at an absolute minimum, maximum exposure
occurring in early morning and late afternoon. Vertical orientation of foliage is thus a
means of minimizing head load under strong irradiance but at the same time providing
sufficient illumination to saturate the leafs photosynthetic apparatus for much of the day.
Flat leaves, on the other hand, can reduce their energy absorption with epidermal hairs or
other surface coverings (waxes) which increase reflectivity especially at high angles of
incidence.
Under high light intensity, chloroplasts of most plants are saturated at intensities around
1/20 of full sun, because their light-harvesting capacity is well in excess of their ability to
convert this absorbed energy into a chemically useable form.
Sustained bright light inhibits photosynthesis in shade-adapted plants whereas
fluctuations in light intensity provide some opportunity for repair as well as favouring
higher photosynthetic yield (CO2 fixed per quantum of absorbed energy). Short intervals
of light and darks of one second or less, can enhance energy conversions because dark
reactions concerned with CO2 assimilation can run to completion and thereby restore the
photosynthetic apparatus to its full efficiency at the start of each new light phase.
Photosynthetically active radiation
Photosynthetically active radiation, often abbreviated PAR, designates the spectral range (wave band) of solar radiation from 400 to 700 nanometers that photosynthetic organisms are able to use in the process of photosynthesis. This spectral region corresponds more or less with the range of light visible to the human eye. Photons at
17
shorter wavelengths tend to be so energetic that they can be damaging to cells and tissues, but are mostly filtered out by the ozone layer in the stratosphere. Photons at longer wavelengths do not carry enough energy to allow photosynthesis to take place.
Other living organisms, such as green bacteria, purple bacteria and Heliobacteria, can exploit solar light in slightly extended spectral regions, such as the near-infrared. These bacteria live in environments such as the bottom of stagnant ponds, sediment and ocean depths. Because of their pigments, they form colorful mats of green, red and purple. These organisms must make use of the leftovers discarded by the plant kingdom.
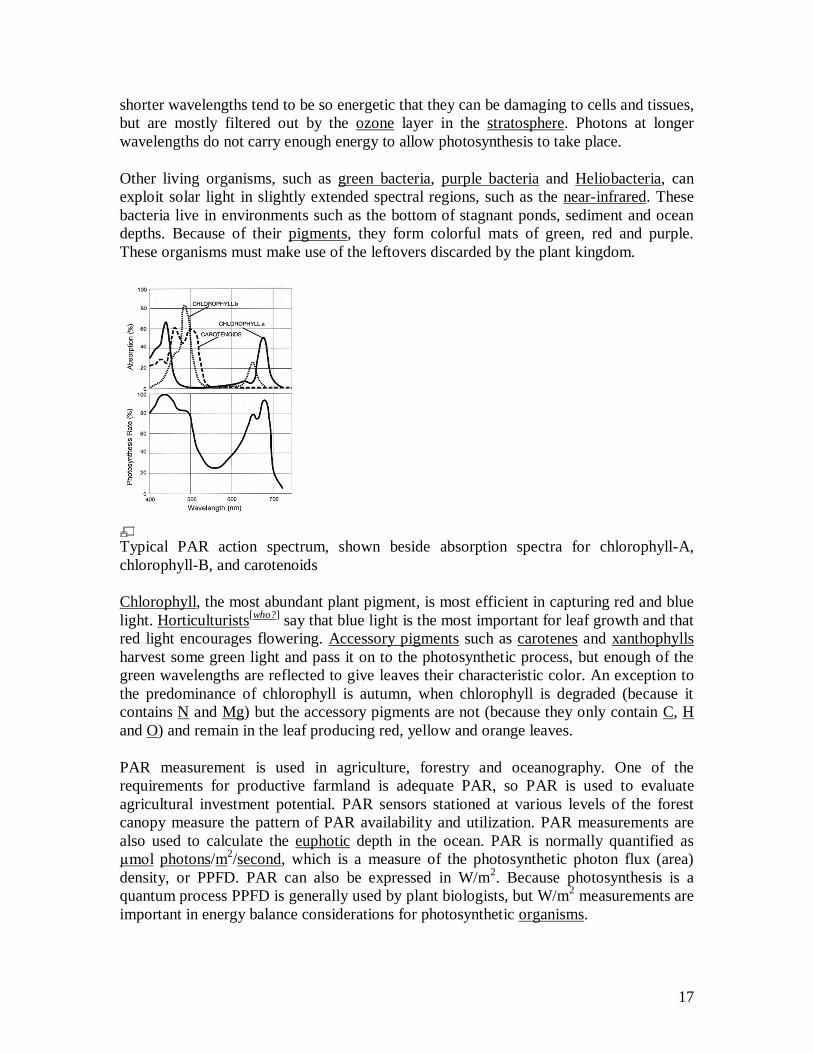
Typical PAR action spectrum, shown beside absorption spectra for chlorophyll-A, chlorophyll-B, and carotenoids
Chlorophyll, the most abundant plant pigment, is most efficient in capturing red and blue light. Horticulturists[who?] say that blue light is the most important for leaf growth and that red light encourages flowering. Accessory pigments such as carotenes and xanthophylls harvest some green light and pass it on to the photosynthetic process, but enough of the green wavelengths are reflected to give leaves their characteristic color. An exception to the predominance of chlorophyll is autumn, when chlorophyll is degraded (because it contains N and Mg) but the accessory pigments are not (because they only contain C, H and O) and remain in the leaf producing red, yellow and orange leaves.
PAR measurement is used in agriculture, forestry and oceanography. One of the requirements for productive farmland is adequate PAR, so PAR is used to evaluate agricultural investment potential. PAR sensors stationed at various levels of the forest canopy measure the pattern of PAR availability and utilization. PAR measurements are also used to calculate the euphotic depth in the ocean. PAR is normally quantified as µmol photons/m2/second, which is a measure of the photosynthetic photon flux (area) density, or PPFD. PAR can also be expressed in W/m2. Because photosynthesis is a quantum process PPFD is generally used by plant biologists, but W/m2 measurements are important in energy balance considerations for photosynthetic organisms.
18
Growth and Development of Crops PCP 504 Prerequisites: Students are expected to have a basic understanding of Plant Physiology PCP 101, PCP 191, biochemistry, Botany, Principles of Crop Production and Basic Principles of System dynamics LECTURE 1: Growth Analysis and parameters Learning Objectives:
1. The interrelationship between Growth, Development and Yield
2. Defining the concept of growth, development and yield
3. Different dimensions of yield
4. Approaches to growth analysis; classical and functional, comparative analysis
5. Growth parameters and analysis
6. Merits and demerits of growth analysis
7. Environmental factors affecting yield, most especially limiting abiotic stressors (Irradiation, water and nutrients)
The concept of yield in crop plant is varied, depending on the perspective upon which the author draws his definition. Functionally there are yield potential and potential yield. Yield potential refers to the yield of cultivars grown in an environment in which it is adapted, when water and nutrient are non- limiting and other biotic and abiotic growth factors are controlled. The environment here is both spatial and temporal. Potential yield refers to the maximum yield of a crop in a particular environment. The first definition is mostly employed by the breeders, assuming that there are genes controlling yield only, while the second one is agronomic presupposing that there are genes responsible for the control of stress factors. Yield potential is used for comparing cultivars, while potential yield is for comparing different crops in different locations at different times. Potential yield are varied, such as experimental station, on-farm trial, average or actual and record or wining yield. The assumption behind this conceptual approach is flawed, since genes control traits but they are modulated by the environment, nevertheless, such definitions are encountered in the literature.
19
Physiologically, it is the ultimate system output of a biological system, the mass of a product or the accumulation of a dry matter at final harvest. Conceptually, it could be divided into biological and economic yield. The economic yield of the crop plant is constrained by environmental and genetic factors. The environmental factors are abiotic and biotic in nature. The importance of abiotic factor is highlighted from the pre-eminence the crop plant gives in his adaptive response to abiotic factor first before biotic. The abiotic factors that determines yields are; the amount of intercepted radiation, water, nutrient and physiological constraints to crop performance. In case irradiance is the limiting factor to yield, crop performance could be expressed as a spatio-temporal integration of biological process, which is the product of the total amount of radiant energy (Q, MJ m-2), the absorptance of incident solar radiation by the crop canopy (IA, %), radiation use efficiency or the efficiency of the conversion of the incident radiation into dry matter (ϵ, g of dry matter MJ-1), partitioning efficiency (ρ) and the time duration dt YE = ʃtpth Q x IA x ϵ x ρdt Or YE = ʃtpth PAR x IA x ϵ x ρdt Since only the visible spectrum of light is the only one of physiological value in dry matter accumulation. Where: tp: Time of planting th: Time of harvesting Q: Incident Solar radiation IA: Absorbed radiation, as a proportion of the incident solar radiation ϵ: Radiation Use efficiency ρ: Partitioning efficiency dt: Phenology or the crop life cycle PAR: Photosynthetic Active Radiation The spatial aspect of the process connotes the duration of the plant life cycle. Alternatively the economic yield could be defined as: YE = YB x HI Where: YB = Biological yield HI = Harvest Index Biological yield is the total amount of the dry matter accumulated during the life cycle of the plant. It is mainly the above dry matter accumulated per day, the exception to these are crops whose economically important part are below the ground like Sweet Potato, Yam, Sugar Beet, etc. YB = Σ [Q(t) x IA(t) x ϵ(t)] The first part of the equation refers to the solar radiation. The ultimate source of light to plant and all living system is from the sun. Solar radiation affects the plant in the following ways:
1. Photosynthesis
2. Photomorphogenesis
20
3. Rate of metabolic reaction
4. Energy exchange process like in transpiration
5. Assimilate partitioning
6. Morphological adaptation
7. Plant-to- plant competition
8. Rate of development
With respect to dry matter accumulation, we shall be limiting ourselves to those aspects of the solar radiation that affects photosynthesis. Solar radiation behaves like an energy and wave. The energy of solar radiation is referred to as photons. Solar radiation energy is related to wave length and speed of light from the following relationship: E = AhƲ/ λ Where: A: Avogadro’s constant H: Planks constant Λ: wavelength Solar radiation that is affects photosynthesis is in the visible spectrum referred to as light or Photosynthetic Active Radiation (PAR). This spectrum is mostly absorbed by chlorophyll a and b and carotene. The PAR is within the wavelength of 300 - 700µm. PAR, UV and Infra-Red (IR) all belong to the short wave length within 300 - 3000µm, while from 3000 – 10,000µm is long wave length of spectral distribution. The interception of solar irradiance is a function of the Leaf Area Index, the arrangement of the leaf of the stem (phyllotaxy), leaf angle, optical property of the leaf and the spectral distribution of the solar radiation. The intercepted light is subject to absorption, transmission or reflection. Absorption of solar irradiance is by certain biological pigments; chlorophyll a and b and carotenoid. Chlorophyll absorb in the red and orange, violet and blue spectrum of PAR, while carotenoid absorbs in the violet and blue spectrum of light. Absorption of photon by pigment leads to the excitation of the pigment molecules resulting in the loss of excitation energy, thus the molecule returning to the ground state. The energy is lost as heat, heat and fluorescence or through inductive resonance, which is the transfer of energy to the adjacent molecule, which is consequently transferred to the light harvesting complex. Canopy architecture altered thought agro technique like spacing leads to changes in spectral distribution of solar irradiance. At close spacing, there is a preponderance of infra-red radiation compared to PAR. Even within the PAR there is more of far red than red, leading to differential absorptance and reflectance of solar radiation. This alters the morphology and biomass distribution, with the canopy displaying longer and narrower leaf, taller and thinner stem and a reduced leaf to stem ratio. The total absorbed solar radiation is reflected in the following equation: IA = IO x (1-ρc)(1 – e-kLAI) Where: IA = Absorbed radiation
21
IO = Incident radiation ρc = coefficient of reflectance e = natural logarithm k = coefficient extinction LAI = Leaf Area Index Physiologically with increased valued for coefficient of extinction shows a parallel orientation of the leaf relative to the ground, which is a planophile, while a reduced value reflects an erectophile orientation. The more the value of k, the less will be the fraction of solar irradiance reflected and transmitted per unit area and time, that is the leaf is optically black, which is an unrealistic assumption. In that case, the absorbed solar radiation is 100%, with the above equation modified as IA = (1 – e-kLAI) The physiological implication of this is that for an optically black leaf, increase in incident radiation, which is totally absorbed, i.e. with increasing photosynthetic photon flux density there is a proportional increase in gross photosynthetic rate of leaf per unit of time, photosynthetic response curve to radiation is asymptotic, increasing with increasing PPFD. For an angled leaf, under constant LAI is a reduction in gross photosynthetic rate. In a canopy, reduction in leaf angle leads to increase in canopy carbon assimilation through increase in sunlit leaf area. Canopy architecture that affects the carbon assimilation rate or dry matter accumulation are summarised as:
1. Leaf area index
2. Leaf angle
3. Leaf arrangement (phyllotaxy)
4. Leaf size (Area)
5. Canopy height (vertical separation)
6. Optical property of the leaf
An increased leaf size with reduced vertical separation could create flux pattern of dense and sunlight plant. In the case of sunlit canopy there is an increase in gross photosynthetic rate, while shading will reduce gross photosynthesis. Smaller leaf size with taller canopy or more pronounced vertical separation will engender diffuse pattern of radiation flux, thus increasing gross photosynthetic rate. Radiation Use Efficiency The efficiency of conversion of absorbed solar radiation into plant dry matter is related to the mean leaf net photosynthetic rates across the crop canopy. In growth analysis the mean leaf net photosynthetic rate is called Net Assimilatory Rate (NAR), which is estimated from the rate of dry matter accumulation and mean LAR. Rather than using mean leaf net photosynthesis, which is not very meaningful when part of the canopy is sunlit and part is shaded, we can use the increase in crop dry matter (CGR). Radiation use efficiency (RUE) is estimated empirically fro the crop growth rate during the period of 2
22
weeks or more and the amount of photosynthetically active radiation intercepted by the crop canopy (RARi) during the period crop growth rate is determined. RUE = CGR/PARi If the crop yield is expressed as a function of underlying physiological like carbon assimilation and irradiance, then the yield equation conceptually becomes: AG = AN – R Changing the subject of the equation, AN then becomes: AN = AG – R If R is further broken down into components part R = RD + RP Then: AN = AG – (RD+RP) Where: AG = Gross assimilation of carbon AN = Net Assimilation of carbon R = Respiration RD = Dark Respiration Rp = Photo Respiration A mathematical expression of the yield equation showing AN is: AN = PPFD.Φ. Amax - RD PPFD.Φ+Amax Where: PPFD: Photosynthetic Photon Flux Density Φ: Quantum Yield Amax: Net Photosynthesis net of RD The Photosynthetic response curve to Irradiance is hyperbolic in nature, with different phases. With an initial increase in PPFD there is an exponential raise in carbon assimilation until it reaches a plateau and level off when carbon concentration in the cell becomes limiting, not PPFD. The gross photosynthetic rate for the canopy is: AG (canopy) = AG(leaf) x LAIS eq.1 AG = PPFD.Φ. Amax eq.2 PPFD.Φ+Amax PPFDi = PPFDo x k eq.3 PPFDa = 1-e-KLAI eq.4 LAIs= PPFDa/K eq.5 K = cosine (θ) eq.6 Where: PPFDi = PPFD normal to sunlit leaf PPFD0 = PPFD normal to the ground Agronomically, the yield of field crops is computed from the so called yield component per unit area. Where water is the limiting factor, crop performance is expressed as: YE = W x WTransp x WUE x HI Where: W: Amount of available water
23
WTRANSP: Water Transpired WUE: Water use efficiency HI: Harvest Index WUE: (Pa – Pi)/ 1.6 (VPi – VPa) Where: Pa: Partial Pressure Air Pi: Partial Pressure Inside VPi: Vapour Pressure Inside VPa: Vapour Pressure Air Total amount of water consists of the available and unavailable water in the soil. The available water in the soil is a function of the texture/structure and the volumetric water content. With soil water potential less than root water potential, the water content in the soil reaches the wilting point at which the water becomes unavailable to the plant. Conversely, with increasing wetting of the soil water, soil water potential increases, becoming more available to the plant. The volumetric water content increases up to a point at which drainage of water against gravity cannot be avoided, the field capacity. The colloidal contents of the soil predispose the water to be adhered to it, thus making water available to plants. Interrelationship between soil, plant and the atmosphere is expressed conceptually via Soil-Plant-Atmosphere Continuum. Physiologically, water use efficiency is the ratio between assimilation of carbon and transpiration. Factors responsible for increasing water use efficiency could be deduced from the equation above; decreasing partial pressure of carbon dioxide inside the cell will increase the partial pressure gradient between the leaf plant and the atmosphere, increasing carbon assimilation, assuming carbon assimilatory capacity is non-limiting in the plant. Another option is to increase the vapour pressure in the atmosphere, by increasing ambient temperature. This will minimize transpiration flux from the plant since in most cases the vapour pressure in the plant is more than that of the ambient atmosphere. Increasing stomatal conductance linearly increases transpiration but response of carbon assimilation is curvilinear. Initially, carbon assimilation responds linearly, when carbon concentration is no more limiting the curve reaches a plateau. Transpiration is constrained physically and physiologically. The physical forces at play in evaporation is expressed in the Ficks equation E = Δc .D Δx Where: Δc: Changes in concentration Δx: Changes in distance D: Diffusion coefficient Concentration of gases is better expressed as partial pressure, while the between gases is quite difficult to express, the whole equation is better expressed as changed in partial pressure of gases, while the distance and diffusion coefficient is both expressed as diffusion coefficient (g). Physiologically, evaporation is regulated by stomatal aperture, which is equally dependent on certain environmental factors. Light affects photosynthesis, which leads to reduction in partial pressure of carbon dioxide inside the cell, leading to negative feedback loop for the opening of the stomata. Increase temperature affects rate of photosynthesis, displaying the aforementioned reaction.
24
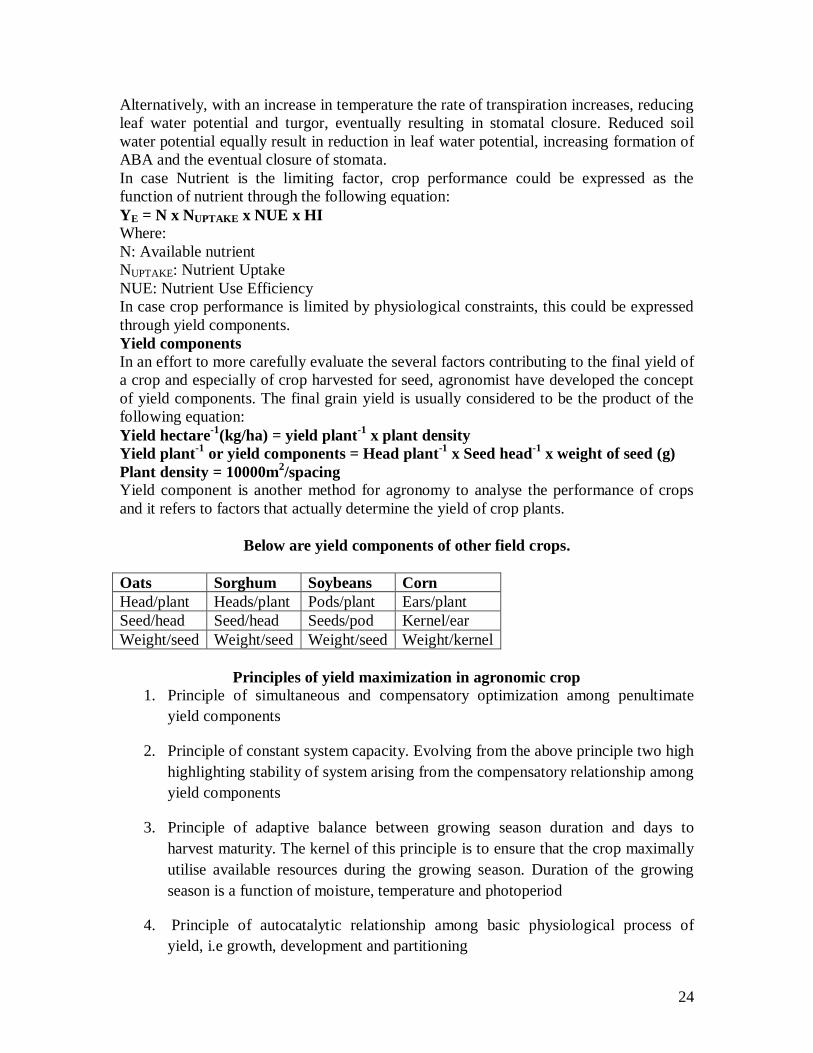
Alternatively, with an increase in temperature the rate of transpiration increases, reducing leaf water potential and turgor, eventually resulting in stomatal closure. Reduced soil water potential equally result in reduction in leaf water potential, increasing formation of ABA and the eventual closure of stomata. In case Nutrient is the limiting factor, crop performance could be expressed as the function of nutrient through the following equation: YE = N x NUPTAKE x NUE x HI Where: N: Available nutrient NUPTAKE: Nutrient Uptake NUE: Nutrient Use Efficiency In case crop performance is limited by physiological constraints, this could be expressed through yield components. Yield components In an effort to more carefully evaluate the several factors contributing to the final yield of a crop and especially of crop harvested for seed, agronomist have developed the concept of yield components. The final grain yield is usually considered to be the product of the following equation: Yield hectare-1(kg/ha) = yield plant-1 x plant density Yield plant-1 or yield components = Head plant-1 x Seed head-1 x weight of seed (g) Plant density = 10000m2/spacing Yield component is another method for agronomy to analyse the performance of crops and it refers to factors that actually determine the yield of crop plants.
Below are yield components of other field crops.
Oats Sorghum Soybeans Corn Head/plant Heads/plant Pods/plant Ears/plant Seed/head Seed/head Seeds/pod Kernel/ear Weight/seed Weight/seed Weight/seed Weight/kernel
Principles of yield maximization in agronomic crop 1. Principle of simultaneous and compensatory optimization among penultimate
yield components
2. Principle of constant system capacity. Evolving from the above principle two high highlighting stability of system arising from the compensatory relationship among yield components
3. Principle of adaptive balance between growing season duration and days to harvest maturity. The kernel of this principle is to ensure that the crop maximally utilise available resources during the growing season. Duration of the growing season is a function of moisture, temperature and photoperiod
4. Principle of autocatalytic relationship among basic physiological process of yield, i.e growth, development and partitioning
25
5. Principle of genotype directed and environmentally modulated establishment of autocatalytic growth of basic physiological process
6. Principle of variability of correlation between penultimate system output and yield components for different growing season
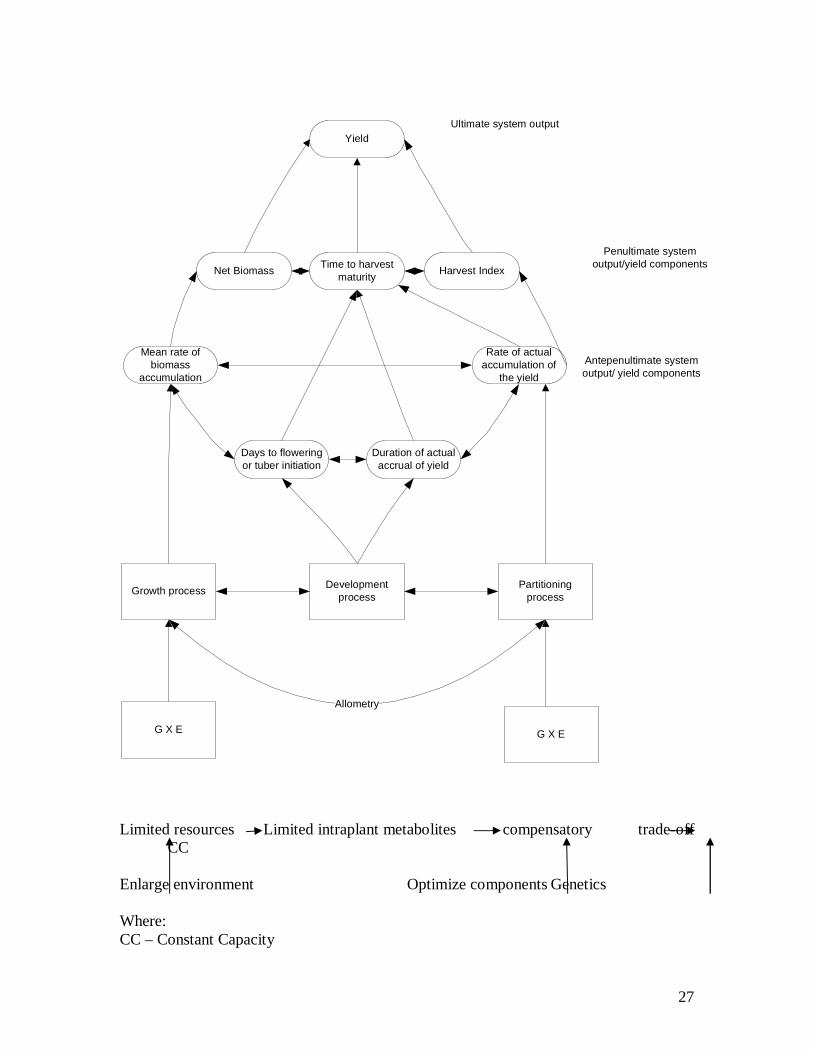
System approach to Yield Analysis The conceptual framework for yield analysis is premised on systems perspective. Underlying yield as the ultimate system output are other components that are interrelated and interconnected. The components of the system are:
1. Penultimate components
a. Biomass accumulation
b. Days to Harvest Maturity
c. Harvest Index
2. Antepenultimate components
a. Net Rate of Biomass accumulation
b. Days to flowering
c. Duration of actual accrual of yield
d. Rate of partitioning
i. Yield day-1 to maturity
ii. Yield day-1 of seed fill
Please find below interrelationships and interconnections among the yield components. A look at the pictorial representation of yield system reveals the following
1. Interrelationships and interconnectedness
2. Underlying the yield components are physiological; growth, development and partitioning
3. The effect of environmental and genetic factors on the yield components
4. Presence of trade-off among the yield components via reciprocal relationships
Basic assumptions: 1. The presence of limited environmental resources available to plants for their basic
functions.
26
2. Presence of simultaneous and competitive sharing system’s capacity
3. System capacity = Intraplant metabolite and time of gene expression
The inference from the above assumption is that in the presence of limited environmental resources modulated by genetic factors, there is
1. Constancy of system’s capacity in the form of intraplant metabolite and time if gene expression.
2. Simultaneous and competitive sharing of system capacity for adaptation, yield and maturity, resulting in compensatory trade-off among systems components towards maintaining functional equilibrium.
3. Correlation among quantitatively variable traits is dependent on all other traits and the environment
4. Multiple gene modulation of physiological process
5. Interrelationship among biochemical pathway
6. Relationship between the yield and other components is curvilinear
7. Other system components are
a. Maturity: Days to harvest maturity, days to flowering, duration of actual accumulation of yield
b. Adaptation: Resistance to pest and diseases, competitive capability
c. Yield: Yield components and yield quality
27
Yield
Net Biomass Time to harvest maturity Harvest Index
Mean rate of biomass
accumulation
Days to flowering or tuber initiation
Duration of actual accrual of yield
Rate of actual accumulation of
the yield
Growth process Development process
Partitioning process
G X E G X E
Allometry
Ultimate system output
Penultimate system output/yield components
Antepenultimate system output/ yield components
Limited resources Limited intraplant metabolites compensatory trade-off CC Enlarge environment Optimize components Genetics Where: CC – Constant Capacity
28
Underlying physiological processes are growth, development and Partitioning. Crop yield per Area = Yield per plant and Crop density Yield per plant = Yield components Yield components = heads per plant x seeds per head Crop density per hectare = 10,000m2/ spacing Growth: Is a quantitative change in living systems. Growth has a cellular basis, involving cell division, elongation and differentiation.
Flow chart of cell division process
Start
Types of cellular division
Meiotic Mitotic
Formation of gametes
Formation of sporophytes
Gametes fusion
Zygotes formation
Growth Via
Comparative analysis of cellular division
Cellular division types
Parameters for comparison Chromosome numbers
Division type Effect on heredity
Parental type
Meiotic Haploid Reductive Genetic Bi-parental
29
variation Mitotic Diploid Multiplicative Conservation of
heredity Mono-parental
Cellular elongation Kinematics Expansin + protein extrusion acidification of cell membrane loosing of cell well (Stress relaxation) water uptake formation of turgor pressure irreversible stretching of cell wall (yielding) increase in cell volume via increase in volume of vacuole cell elongation Rate of water uptake (RWU) = A + Lp (Δφw) Where
A = Surface Area of the cell Lp = Permeability of plasma membrane Δφw = Water potential differential Growth Rate = m (Y) Where: m = coefficient of extensibility Y = yield threshold Cell elongation is when RWU = GR Merits and Demerits of growth measurements Techniques Growth is the increment in dry mass, volume, length, form or area that results from the division, expansion and differentiation of cells. Growth measures the response of the crop to the environmental inputs and these measurements indicates if the growth is optimal or sub-optimal; and also what remedies or interventions are needed for optimum growth development and yield. Mathematically it could be expressed as: Growth: dx/dt Where: X = Weight, volume or height T = time Size The size of the plant is measured by taking the height of the plant, the diameter of the canopy, circumference/girth of stem, number of branches or numbers of leaves per plant. Merits
1. Reliability and ease of measurement
2. Simplicity, speed and non-destructiveness of measurement. Organised used can be reused on continuous basis
Demerits 1. Not all increase in size connotes growth, as examined when a crop is etiolated in
case growth under low light intensity.
30
2. Impracticability of this method for tall and matured tree crops
3. This method does not take into account growth in girth, degree of branching and lateral spread
Weight It measures the total amount of dry matter in the plant and therefore the actual amount of photosynthesis or net photosynthesis. Net photosynthesis is gross photosynthesis less respiration. Weight could either be in fresh or dry. Both are easy to measure except that it must involve destructive sampling. The implication is that the plot size must be increased proportionately so as to be able to accommodate the number of destructive sampling, which involves cutting of the plant at the ground level. Fresh weight is a very good measure of plant growth and as a rule all plant samples must be neatly harvested at ground level. Merit of measuring the fresh weight:
1. The ease of measurement on the field
2. It could be carried out without harming the plant
It must be noted that the larger the time interval between harvest, the more the average values of the growth parameters will differ from the instantaneous values if the plant are not growing exponentially. Demerits of measuring the fresh weight:
1. Delayed measurement of sample could lead to non uniform moisture loss, thereby leading to some variability in fresh weight
2. The plant must be harvested or subjected to destructive sampling, thus subsequent samples has to be carefully selected to avoid compensatory growth due to absence of previously harvested stand
3. Poor sampling can introduce variability in weight measurement, hence, it is subject to errors arriving from variability in the amount of water in a tissue
4. It is not a constant and reliable index of growth
5. It could be bulky for large sample
Dry weight is a better measure for weight than fresh weight in that variability of fresh weight due to delays in weighing does not apply in measuring dry weight. This is measure of dry matter, mostly representing materials which have been accumulated during growth. This involves drying the sample to a constant weight at the temperature of 70 – 150 0 C for 72 hours in the oven. Merits:
1. It provides the actual amount of dry matter in the plants
31
2. It is a constant and reliable index of plant growth. Since plants have a high composition of water and the level of water in a plant will depend on the amount of water in its environment (which is very difficult to control), using dry weight as a measure of plant growth tends to be more reliable
3. It indicated the actual amount of photosynthesis or net photosynthesis
Demerits:
1. This can only capture data once as a final measure mostly at the conclusion an experiment
2. Interpretation may not be straight forward due to decreasing dry weight of germinating seed or etiolated plant
3. It is a destructive sampling technique since it involves drying in an oven to a constant weight
4. There could be variability in measurement due to variability in moisture content if sample is not properly dried or ash could be measured
5. The act of removing plant from its growing medium could cause trauma and affect the on going growth rate and thus the experiment under consideration
Note that increment in dry mass may not however coincide with changes in each of the components of growth. Plant Volume It is a measure performed by water displacement. Merits:
1. It is appropriate for fruits and similar organs
2. It can easily be done for small plots
3. It can be used to measure the area of the canopy of a plant
4. It is useful in simulating the degree of inter-specific shading in an intercropping system
5. It provides good information on the relative competitive abilities of different crops in an intercropping system
Demerits:
32
1. The volume measured may include a lot of intercellular spaces which are not truly part of the organism
2. It is not easy to measure for bulky materials since the most accurate measure of volume is through displacement of water.
Growth analysis techniques, merits and demerits Growth analysis is a specific mathematical technique for analysing plant growth over period of weeks across areas of 0.1 to 10m2. This technique was pioneered by F.H. Blackman and extended by Briggs, Kidd and West and also by D.J. Watson. The following ecophysiological variables are employed in the calculation of growth analysis; Relative Growth Rate (RGR), Absolute Growth Rate (AGR), Leaf Area Ratio, (LAR), Leaf Area Index (LAI), Net Assimilatory Rate (NAR), Crop Growth Rate (CGR), Leaf Mass Fraction (LMF), Stem Mass Fraction (SMF), Root Mass Fraction (RMF), Allometric relationship between different plant organs; shoot to root ration, Leaf Area Duration (LAD), Specific Leaf Area (SLA) etc. Different growth analysis can be carried out, depending on what is considered a key factor for growth. In growth analysis two basic measurements are made, dry weight and leaf area and a large numbers of parameters are derived from these measurements. Some of the important parameters have been listed below: Parameter Symbol Unit Crop growth Rate CGR g (crop)m-2 d-2 Leaf Area Index LAI m2 (leaf) m-2 Specific Leaf Area SLA m2(leaf) g-1(leaf) Relative Growth Rate RGR g (crop) g-1(crop) d-1 Net Assimilatory Rate NAR g (crop) m-2 (leaf) d-1 Plant growth analysis is an explanatory, holistic and integrative approach to interpreting plant form and function. There are different approaches to growth analysis; classical and functional. In classical approach, the samples are harvested infrequently, but in large samples, with higher numbers of replicates, without curve fitting. While in functional approach, the course of event in harvest is frequent, with small harvest size and lesser amount of replicates, with curve fitting.
Parameters of Growth Analysis Plant/crop performance = Productive Efficiency X Leafiness The crop performance is this case could be expressed as dry matter accumulation indicated as Relative Growth Rate or Crop Growth Rate. Two types of measurements are needed for growth analysis:
1) The plant weight; this is usually the oven dry weight (kg)
2) Leaf Area
33
Relative Growth Rate: It measures the plant capacity to add to its dry matter. An assumption necessary for appropriate application of the relative growth rate procedure is that plant growth follows the compound interest law. The analogy with financial investment was first developed by Blackman (1919). One definition of the compound interest law is: the amount of growth made in a unit of time is a constant percentage of the size of the plant at the beginning of the period and the constant percentage does not change with size (e.g. it is size independent). RGR = Ln W2 – LnW1/t2 – t1 Where: W1: Dry Weight of sample at time t1 W2: Dry Weight of sample at time t2 t1: Harvest time t1 t2: Harvest at time t2 Ln: natural log Note that the weights of the samples are In-transformed before averaging. This gives a better estimation of the relative growth rate (William A. And Hendrik Poorter 2002) Merits
1. The calculation is only really useful for short harvest interval where growth is assumed to be linear and for comparisons under similar environmental conditions, i.e. between treatments in a trial
2. The main reason for the usage of the RGR is to eliminate growth differences that arise from initial size differences
RGR could be factorised into three components: RGR = LAR X NAR LAR = SLA X LMF X ULR Then: RGR = SLA X LMF X ULR Where: RGR: Relative Growth Rate LAR: Leaf Area Ratio, this expresses the ratio of photosynthesis to respiring material within the plant SLA: Specific Leaf Area (m-2 kg-1), measure of leaf density SLA = Leaf area per plant (cm2 g-1) Leaf weight per plant (g) LMF: Leaf Mass Fraction (g g-1). Fraction of total biomass allocated to the leaves ULR: Unit Leaf Rate (g m-2 d-1) is the same as NAR Demerits:
1. Plant species characteristic of favourable environments often have inherently higher maximum relative growth rates (RGRmax) than do species fro less favourable environments.
34
2. It tends to decline as plant age and care is needed in interpreting comparisons of RGR as plant reaches maturity
3. RGR are compared at just one time interval. In this regard, hunt (1990) concluded that the efficiency index is perhaps best reserved for use in the case of population of unicellular organism that are reproducing in an unconstrained environment (i.e. where the interest rate is constant)
4. There is the disadvantage of ontogenetic drift, occurring in most tree seedlings. Most tree seedlings grow according to the variable interest law.
Crop Growth Rate Physiologically, this growth parameter means the rate of dry matter accumulation per unit land area per unit of time in crop stand. CGR = LAI X NAR eq.1 CGR = W2 – W1/ (t2 – t1) X land area eq.2 Merits
1. Growth rates can be compared at different times in the season and for different treatments
2. It can help to quantify the effect of changes in environmental factors
Demerits 1. It is dependent on the area of leaf surface and its efficiency as a producer of dry
matter (NAR)
2. Yield may be proportional to the efficiency of the leaf surface, NAR and its duration
Leafiness could be expressed in different forms: Parameter Physiological meaning
LAI LAR
Leafiness/crop stand Leafiness/plant Ratio of photosynthesis/Respiration
SLA Leaf density or relative thickness of leaf, leafiness expressed on area basis LWF Leafiness in weight basis LAD Leafiness of crop growing duration
Leaf Area Index (LAI) This expresses the ratio of leaf area (one side only) to the ground area occupied by the crop, or the leaf area per unit area of land. By convention only one side of the leaf lamina (blade) is measured. The rate of increase of the leaf area determines the rate of increase in photosynthetic capacity of the plant. A LAI of 4 – 7 is considered ideal for maximum dry
35
matter production of most cultivated crops, as a higher level is desirable where total biomass, not complete economic yield is the objective, e.g. forage grasses. Leaf Area Index is calculated as: LAI = Total Leaf Area Land Area Leaf area could be determined manually or automatically using leaf area meter. Manually leaf area could be determined from this relationship Leaf Area: L X W X A Where: L: leaf length W: leaf maximum width A: Constant (0.75), in case of maize For some crops that do not have regular geometrical shape, such as sweet potato, cork-borer method could be adopted. Protocol:
1. Measure leaf area of 30 leaf with cork borer with a diameter of 1.5cm
2. Oven dry 30 leaf discs and the rest of the leaves at 900C for 72 hours
3. Calculate the leaf area using the following formula
Leaf Area = (Area of 30 leaf discs) X (dry mass of 30 discs) + (dry mass of the rest of the leaves) Dry mass of 30 leaf discs (g) Merits:
1. It indicates crops efficiency use of light energy throughout the season
2. It is used as a means of elucidating the causes of variation in the yield
Demerits:
1. The measurement of green leaf area to produce a value of LAI is subject to varied deficiency such as nutritional stressors
2. It is often difficult to get accurate estimate of leaf area in practice
3. The assumption that all leaves are capable of making equal contribution to growth is not accurate, it has been established that leaves decline in their efficiency of light conversion as they age. Also the arrangement (phyllotaxy) and position of the leaves in the canopy also affects their efficiency
4. Crop growth rate is not directly related to it for the whole life of the crop and this limits its usefulness as a tool for explaining variation in crop yield
36
5. The efficiency of the leaf area as a producer of dry matter is inversely related to LAI for much of the life of the crop
Leaf Area Ratio (LAR) It expresses the ratio between the total leaf area or photosynthesizing tissue to the total respiring plant tissues or total plant biomass. LAR = Total Leaf Area/Total Plant Weight Merits:
1. It reflects the leafiness of a plant
2. It measures the efficiency of the leaf surface in producing dry matter
Demerits: 1. Its value declines as the crop increases in dry weight when leaf area remains
relatively constant
2. It decreases with age of the plant because of the reduction in leaf area
Net Assimilatory Rate (NAR) Net rate of dry matter accumulation per unit leaf area of crop community per unit of time, is usually expressed in g m-2 day-1 NAR physiologically means the carbon assimilatory capacity or productive efficiency of the crop or plant within a time frame. It expresses the difference between carbon gain and loss from the plant or crop stand. If one is to examine the plant performance from this relationship; Where the productive efficiency = Carbon gain – Carbon Loss NAR is computed from the following relationships: NAR = W2 –W1/ t2 –t1 X 1/leaf area eq. 1 NAR = means of W2 – means of W1 (Ln means of A2 –Ln meansA1)/(A2 – A1) (t2 –t1) eq. 2 NAR = Aa – LRa – SR X SMF/LAR – RR – RMF/LAR / [C] eq.3 Where:
Aa - Rate of Co2 assimilation per unit leaf area per unit of time LRa – Rate of leaf respiration per unit leaf area (or mass) SR – Rate of stem respiration per unit mass per unit of time SMF – Stem mass fraction LAR – Leaf Area Ratio RR – Rate of root respiration per unit mass per unit of time RMF Root Mass Fraction [C] – Carbon concentration per unit mass Merits
1. It is used to analyse the response of plant growth to environmental conditions, e.g. fertiliser response in sole and intercropping
37
2. It measures plant efficiency in producing dry matter
3. It measures the capacity of the plant to add dry weight in relation to the area of the assimilatory surface, in other words it is a measure of photosynthetic efficiency
Demerits: 1. It varies with time for a number of agricultural crops and if the season trends is
smoothed, has a low values in the dry season and increases in the rainy season to reach maximum values in June and July
2. It is important to have adequate leaf surface to benefit from the higher potential rates of evapotranspiration
3. It is affected by temperature, light intensity, water and nutrient supply
4. It values differ between and within crop species and decline with increasing plant maturity
5. Calculating NAR after vegetative growth in meaningless since most of the dry matter produced will be exported as food reserve
6. Although NAR is relatively easy to estimate from harvest data, it is not really an appropriate parameter to gain insight into the relation between physiology and growth. It shifts concentration from the underlying processes: photosynthesis, respiration and assimilate allocation
Leaf Area Duration (LAD) It expresses the magnitude and persistence of leafiness during the period of crop growth. LAD = (A2 –A1)(t2 – t1)/(ln A2 – Ln A1) Where: LAD – Leaf Area Duration A – Leaf Area There are other growth parameters measured such as:
1. Shoot/root
2. Fresh weight
3. Dry weight
4. Dry matter content = Dry weight/Fresh weight
5. Allometric relationship
With respect to the trajectory of the dry matter accumulation, growth parameters most appropriate during the following ontological drift:
Appropriate growth parameters during plant ontological drift
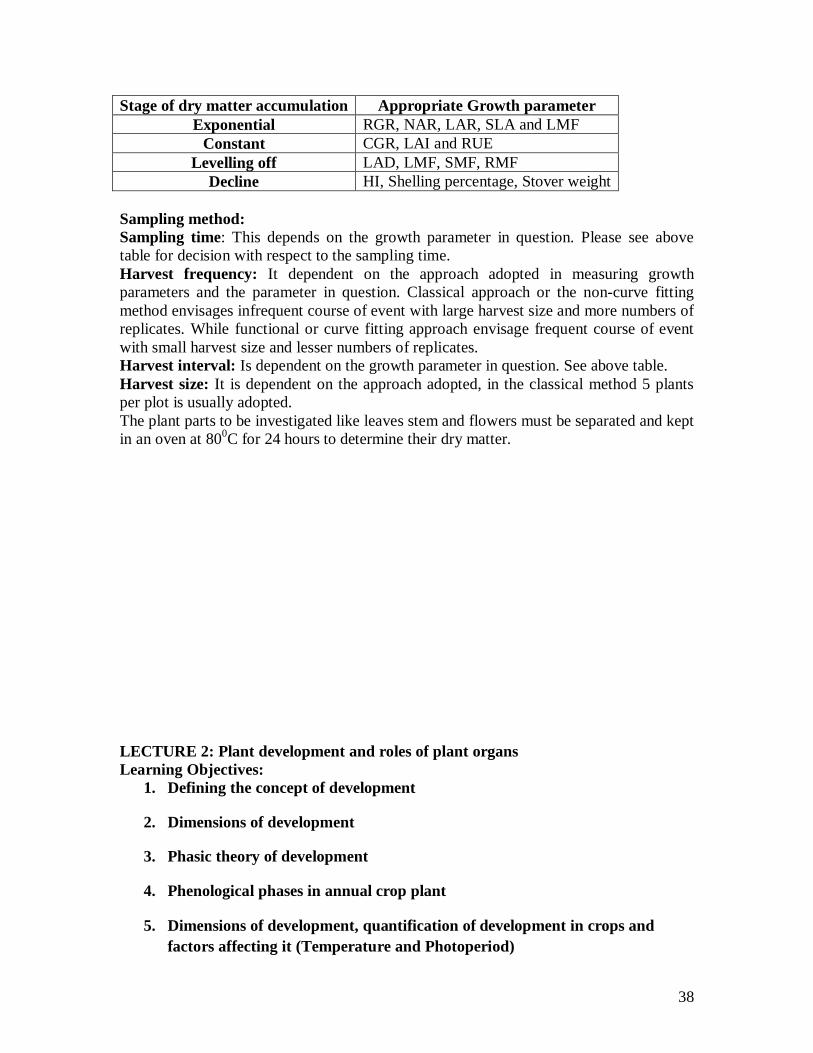
38
Stage of dry matter accumulation Appropriate Growth parameter Exponential RGR, NAR, LAR, SLA and LMF
Constant CGR, LAI and RUE Levelling off LAD, LMF, SMF, RMF
Decline HI, Shelling percentage, Stover weight Sampling method: Sampling time: This depends on the growth parameter in question. Please see above table for decision with respect to the sampling time. Harvest frequency: It dependent on the approach adopted in measuring growth parameters and the parameter in question. Classical approach or the non-curve fitting method envisages infrequent course of event with large harvest size and more numbers of replicates. While functional or curve fitting approach envisage frequent course of event with small harvest size and lesser numbers of replicates. Harvest interval: Is dependent on the growth parameter in question. See above table. Harvest size: It is dependent on the approach adopted, in the classical method 5 plants per plot is usually adopted. The plant parts to be investigated like leaves stem and flowers must be separated and kept in an oven at 800C for 24 hours to determine their dry matter. LECTURE 2: Plant development and roles of plant organs Learning Objectives:
1. Defining the concept of development
2. Dimensions of development
3. Phasic theory of development
4. Phenological phases in annual crop plant
5. Dimensions of development, quantification of development in crops and factors affecting it (Temperature and Photoperiod)
39
6. Roles of plant organs
a. List and describe the major plant organs their structure and function
Development Morphogenesis as a transformational biological process; qualitative and quantitative is divided into growth and development (differentiation). Development is a qualitative change in plant over time. The qualitative aspect of development involves morphological changes and different stages of development over time-phenology. The stages of development are classified as:
1. Vegetative/ Reproductive
2. Exponential, stable and decline, based on the trajectory of dry matter accumulation
3. Functional classification that takes into cognizance the stages of leaf formation, seed/grain set and seed/grain fill
Quantitatively, development is measured as duration; Days-to-harvest-maturity, days-to-flowering, days-to-actual-accrual-of-yield. The inverse to duration of development is the rate of development. The rate of development is controlled by genetic factors but modulated by environmental influences. The predominant environmental influence is temperature and photoperiod. The rate of development to these environmental factors at the sub-optimal level is first linear, reaching a plateau at the optimal level, eventually declining at supra-optimal level. The predominant model proposed concerning development in plant is phasic theory of development. The basic assumptions underlying this process are:
a. Development is phasic in nature, i.e. progression from one physiological system state of the meristerm to another
b. Identified are two phases; vegetative and reproductive phases
c. Plant system possesses the capability of development to progress autonomously
d. The identifies phases of development are irreversible
e. Development process is controlled by various environmental and genetic factors, mainly; temperature and photoperiod (G X PX T)
f. Photoperiod gene and vernalisation genes possesses delaying impact on the process of development
g. Temperature effect is through Q10 effect on the activities of the enzymes and ultimately on the biochemical reaction
Developmental process is controlled by genetic factors and modulated by the environment. The predominant environmental factor is temperature and photoperiod.
40
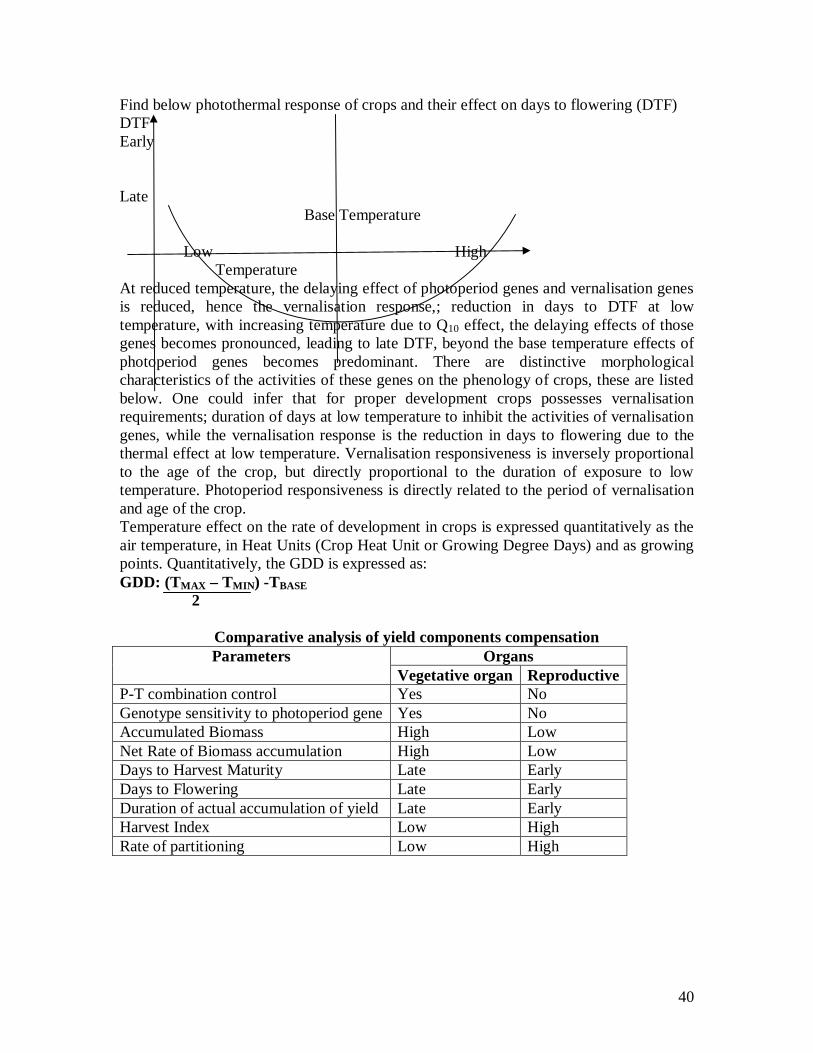
Find below photothermal response of crops and their effect on days to flowering (DTF) DTF Early Late Base Temperature Low High Temperature At reduced temperature, the delaying effect of photoperiod genes and vernalisation genes is reduced, hence the vernalisation response,; reduction in days to DTF at low temperature, with increasing temperature due to Q10 effect, the delaying effects of those genes becomes pronounced, leading to late DTF, beyond the base temperature effects of photoperiod genes becomes predominant. There are distinctive morphological characteristics of the activities of these genes on the phenology of crops, these are listed below. One could infer that for proper development crops possesses vernalisation requirements; duration of days at low temperature to inhibit the activities of vernalisation genes, while the vernalisation response is the reduction in days to flowering due to the thermal effect at low temperature. Vernalisation responsiveness is inversely proportional to the age of the crop, but directly proportional to the duration of exposure to low temperature. Photoperiod responsiveness is directly related to the period of vernalisation and age of the crop. Temperature effect on the rate of development in crops is expressed quantitatively as the air temperature, in Heat Units (Crop Heat Unit or Growing Degree Days) and as growing points. Quantitatively, the GDD is expressed as: GDD: (TMAX – TMIN) -TBASE 2
Comparative analysis of yield components compensation Parameters Organs
Vegetative organ Reproductive P-T combination control Yes No Genotype sensitivity to photoperiod gene Yes No Accumulated Biomass High Low Net Rate of Biomass accumulation High Low Days to Harvest Maturity Late Early Days to Flowering Late Early Duration of actual accumulation of yield Late Early Harvest Index Low High Rate of partitioning Low High
41
Flowering plants possess three kinds of vegetative (non-reproductive) organs:
1. Roots
2. Stems
3. Leaves.
Shoots consist of stems and leaves. The shoot system of a plant consists of the stems and the leaves, as well as flowers. Leaves are the main sites of photosynthesis in plants.
Stems hold and display the leaves to the sun and provide connections for the transport of materials between roots and leaves. It may also serves as an area of storage.
A node is the point where a leaf attaches to a stem.
Regions of stem between nodes are the internodes.
The functions of these organs are 1. Photosynthesis,
2. Support
3. Transport
The functions of the root are: 1. Anchor and absorb water and minerals
2. Provides nutrients for the shoot and
3. Acts as organ of storage
The flower is the reproductive organ of the Angiosperms. Flowers are modified leaves structure which support the microsporangia and megasporangia gametophyte generations and are involved in plant sexual reproduction. Flowers are usually located apically or a the end of a stem. See below a pictorial representation of plant organ parts
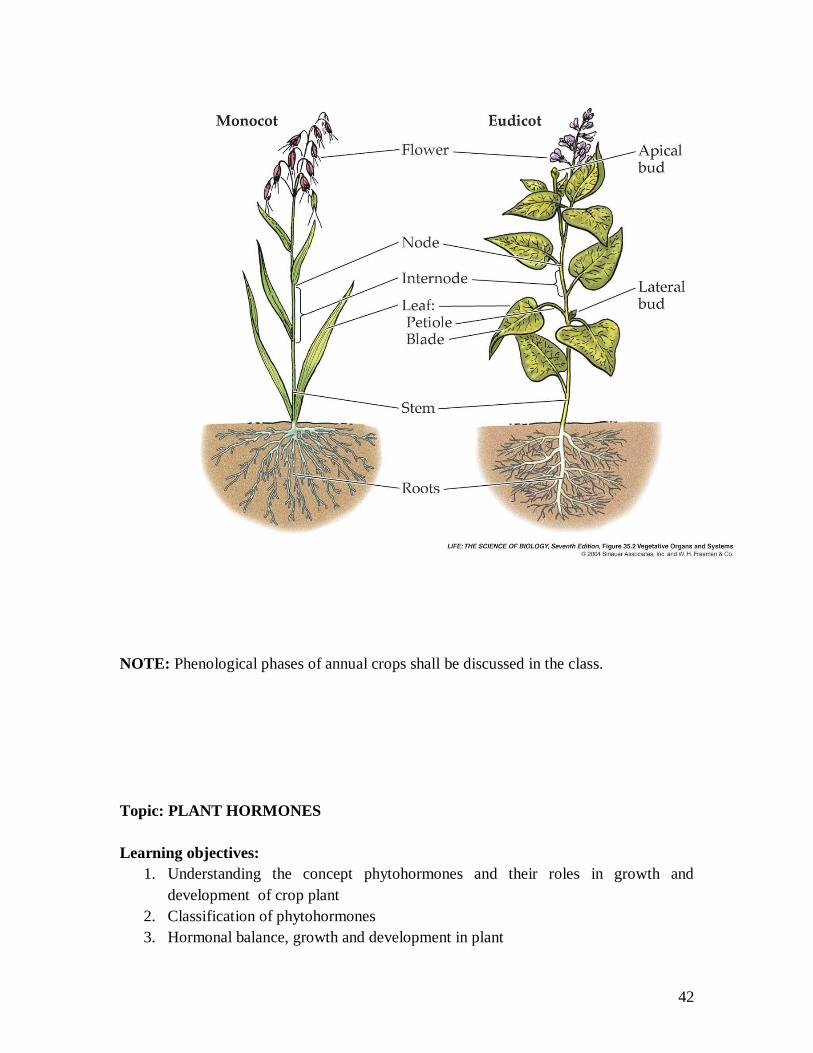
42
NOTE: Phenological phases of annual crops shall be discussed in the class. Topic: PLANT HORMONES Learning objectives:
1. Understanding the concept phytohormones and their roles in growth and development of crop plant
2. Classification of phytohormones 3. Hormonal balance, growth and development in plant
43
Theoretical background: Phytohormones are physiologically active substances that affect plant growth and development. They act as chemical messengers or plays signalling role in plant; hence they are functionally integrators and regulators of physiological processes in living organisms. Unlike the animal hormones, plant hormones are fewer in number, they affect most cells in the plant, the response of plants to them is diverse (pleiotropic effect) and they are modulated by environmental, developmental and other hormones through cross-regulation of their actions that could be antagonistic or synergistic in nature. They are required in small quantity, transported from the site of synthesis to mediate physiological response in other parts of the plant. Recognised over the years are classical phytohormones; Auxin, Gibberellin, Cytokinin, Abscissic Acid and Ethylene and newer ones; Jasmonic Acid, Salicylic Acid, Brassinosteroid and Strigolactones. Apart from the aforementioned substances there are other substances in plant that play signalling role , though they cannot be classified as hormones, such as polyamines, Reactive Oxygen Species (ROS), Signalling Peptides and Nitric Oxide. Among the classical hormones are growth promoters (Auxin, Gibberellin and Cytokinin) and growth inhibitors (Abscissic Acid and Ethylene). The mechanism of hormonal action is quite complex and attempts had been made to elucidate its action. After synthesis and accumulation of hormones it is transported to the site of action through the phloem or xylem stream or via diffusion. It it sometimes transported by regulated transport proteins. Perception of environmental perturbation is mediated through binding of hormones to transmembrane or intracellular receptors. Signal transduction or amplification is mediated by the activation of kinase activities through the process of phosphorylation where ATP molecules bind to protein through protein kinase eventually leading to signal amplification. The reverse process of inactivation is through the action of phosphatise. Other elements of signal transduction include the allosteric changes of protein, phophorelay system and regulated protease. The downstream effect involves:
1. Alternation of gene expression pattern via transcription proteins 2. Non-genomic function
In crop production, most cultivated crops are subjected to actions of various stressors; biotic and abiotic. In the case the crop plant is subjected to both stressors, priority is given to amelioration of the actions of abiotic stressors at the expense of biotic stressors. In all instances of abiotic stressors, there is increased synthesis of ABA, production of induced proteins and other osmoprotective and regulatory substances like Heat Shock Proteins, Proline, Glycine Betaine etc. Biotic stressors, depending on the nature of the biotic stressors leads to production of salicyclic acid if biotrophic or Jasmonic acid or Ethylene if necrotrophic. The production of these hormones interferes with GA/Auxin induced growth pathways. The non-genomic function leads to the production of antiherbivory function, anti microbial function i.e.
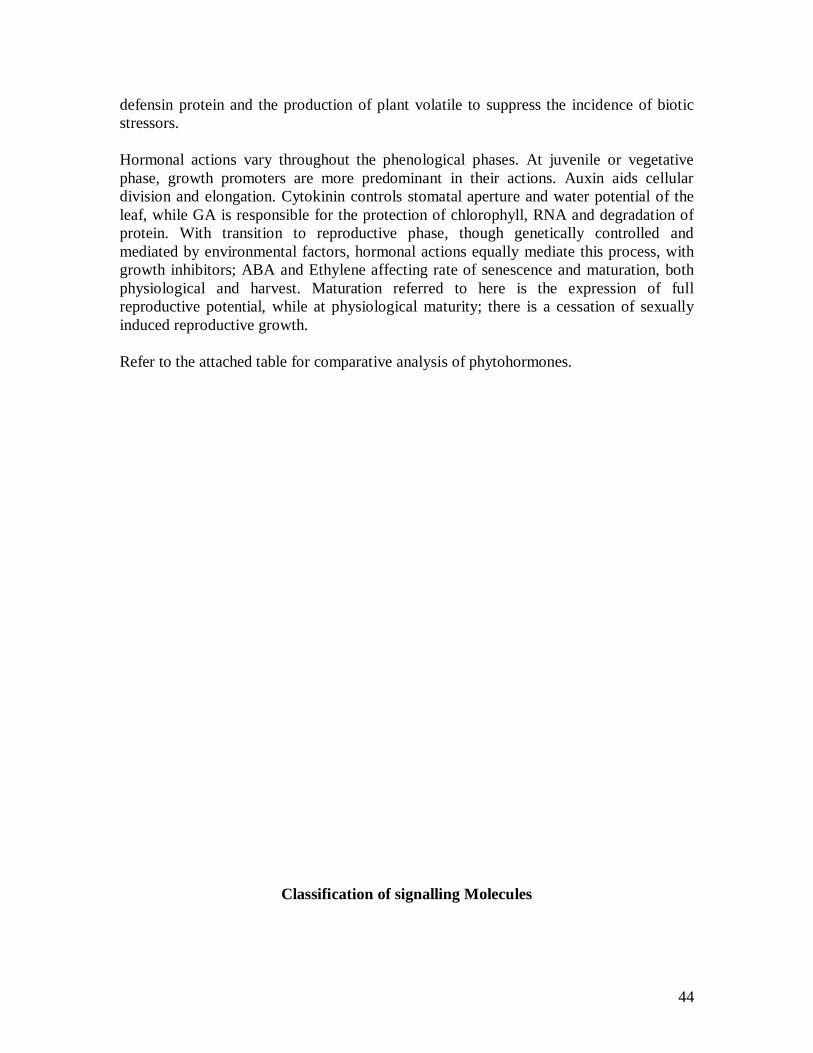
44
defensin protein and the production of plant volatile to suppress the incidence of biotic stressors. Hormonal actions vary throughout the phenological phases. At juvenile or vegetative phase, growth promoters are more predominant in their actions. Auxin aids cellular division and elongation. Cytokinin controls stomatal aperture and water potential of the leaf, while GA is responsible for the protection of chlorophyll, RNA and degradation of protein. With transition to reproductive phase, though genetically controlled and mediated by environmental factors, hormonal actions equally mediate this process, with growth inhibitors; ABA and Ethylene affecting rate of senescence and maturation, both physiological and harvest. Maturation referred to here is the expression of full reproductive potential, while at physiological maturity; there is a cessation of sexually induced reproductive growth. Refer to the attached table for comparative analysis of phytohormones.
Classification of signalling Molecules
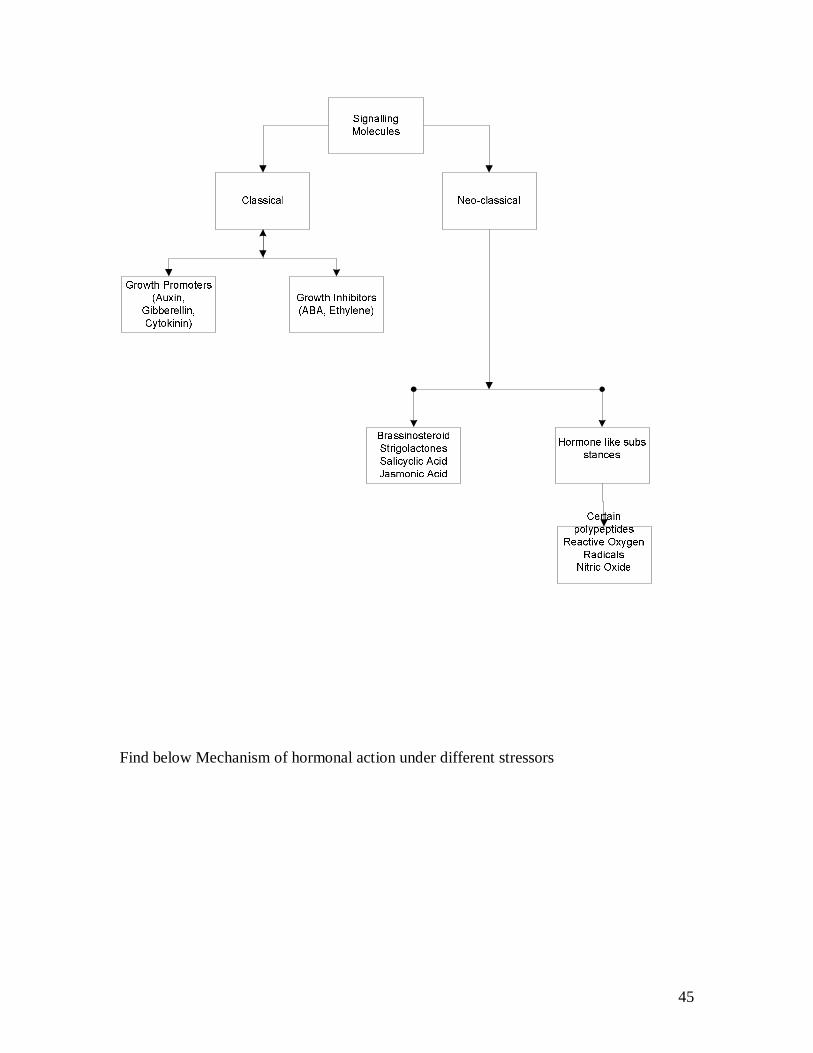
45
Find below Mechanism of hormonal action under different stressors
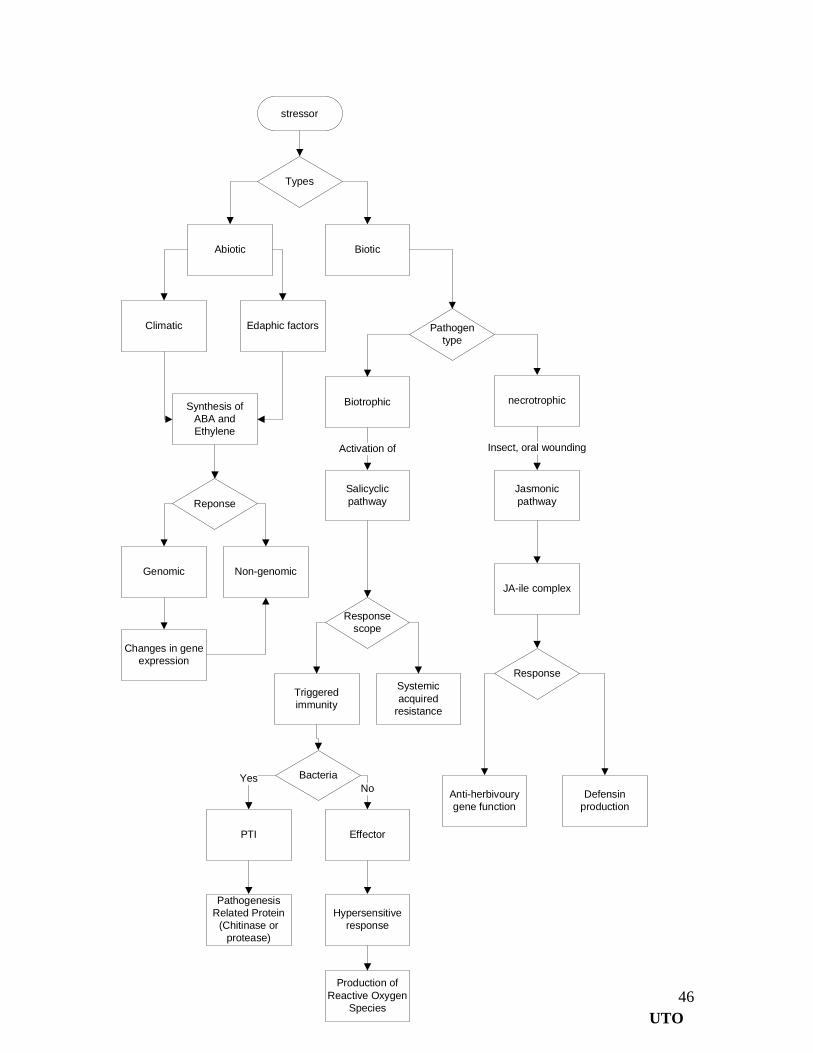
46
stressor
Types
BioticAbiotic
Climatic Edaphic factors
Synthesis of ABA and Ethylene
Reponse
Genomic Non-genomic
Changes in gene expression
Pathogen type
Biotrophic necrotrophic
Salicyclic pathway
Response scope
Triggered immunity
Systemic acquired
resistance
Bacteria
PTI Effector
Pathogenesis Related Protein
(Chitinase or protease)
Hypersensitive response
Production of Reactive Oxygen
Species
Jasmonic pathway
Response
JA-ile complex
Anti-herbivoury gene function
Defensin production
Activation of
NoYes
Insect, oral wounding
UTO

47
LECTURERS
DR A.O.OLAIYA –COORDINATOR
PROF V.I.O.OLOWE
DR M. O. ATAYESE