Embed Size (px)
Citation preview

University Link Extension Planning
Background Information Report
King County Metro Transit
1/22/2015
In partnership with

King County Metro Transit – University Link Extension Planning – Background Information Report i Table of Contents
Table of Contents
Section 1: Executive Summary ............................................................................................................................................... 1
Section 2: Introduction ........................................................................................................................................................... 4
Project background ............................................................................................................................................................. 4
Transit integration report: .............................................................................................................................................. 4
Service reductions: .......................................................................................................................................................... 4
Proposition 1 (Seattle Transportation Benefit District): ................................................................................................. 5
Project objectives ................................................................................................................................................................ 5
Seattle’s Transit Master Plan .............................................................................................................................................. 6
Section 3: Existing Conditions – Facilities .............................................................................................................................. 7
Background ......................................................................................................................................................................... 7
Most relevant projects and issues .................................................................................................................................. 7
Other relevant projects and issues ................................................................................................................................. 8
Map of projects and issues that interact with the University Link Extension project .................................................. 10
Project area and construction updates from Sound Transit ............................................................................................. 11
Montlake Triangle Project ............................................................................................................................................ 11
University of Washington Station ................................................................................................................................. 11
Renderings of the University of Washington Station ................................................................................................... 12
Service around the University of Washington Station .................................................................................................. 13
Capitol Hill Station ........................................................................................................................................................ 15
Renderings of the Capitol Hill Station ........................................................................................................................... 16
Services around the Capitol Hill Station ....................................................................................................................... 17
Section 4: Existing Conditions – Service .............................................................................................................................. 18
Background ....................................................................................................................................................................... 18
Existing riders and productivity ........................................................................................................................................ 18
Daily rides and hours by tier of service ......................................................................................................................... 18
Routes by tier ................................................................................................................................................................ 18
Productivity ................................................................................................................................................................... 19
Rides per trip ................................................................................................................................................................. 19
Use of data .................................................................................................................................................................... 20
Map of tiered service .................................................................................................................................................... 21
Route ridership history ..................................................................................................................................................... 22
Headway adherence ......................................................................................................................................................... 23
Headway standard ........................................................................................................................................................ 23
Likelihood of bus bunching ........................................................................................................................................... 23
Headway ratio and extreme headways ........................................................................................................................ 24

King County Metro Transit – University Link Extension Planning – Background Information Report ii Table of Contents
Excessive wait times ..................................................................................................................................................... 25
Travel time analysis ........................................................................................................................................................... 27
Travel times to/from downtown Seattle ...................................................................................................................... 27
Travel times to/from the University District ................................................................................................................. 32
Travel times to/from Capitol Hill .................................................................................................................................. 34
Travel times to/from South Lake Union ....................................................................................................................... 36
Service guidelines analysis ................................................................................................................................................ 38
Service that’s easy to understand and appropriate...................................................................................................... 38
Route spacing and duplication ...................................................................................................................................... 39
Bus stop spacing ............................................................................................................................................................ 39
Operating paths and appropriate vehicles ................................................................................................................... 41
Route terminals............................................................................................................................................................. 41
Section 5: Existing Conditions – Rideshare and Access Transportation ............................................................................. 42
Rideshare .......................................................................................................................................................................... 42
Access Transportation ....................................................................................................................................................... 42
Map: conditionally eligible Access pickups in Link station areas .................................................................................. 43
Section 6: Demographics and Market Information ............................................................................................................. 45
Draw areas ........................................................................................................................................................................ 45
Map: where University District employees live ............................................................................................................ 46
Map: where Capitol Hill employees live ....................................................................................................................... 47
Map: where First Hill employees live ............................................................................................................................ 48
Map: where South Lake Union employees live ............................................................................................................ 49
Demographic information ................................................................................................................................................. 50
Market analysis ................................................................................................................................................................. 54
University of Washington ............................................................................................................................................. 56
South Lake Union .......................................................................................................................................................... 56
Uptown (Lower Queen Anne) ....................................................................................................................................... 56
First Hill ......................................................................................................................................................................... 56
Capitol Hill ..................................................................................................................................................................... 57

King County Metro Transit – University Link Extension Planning – Background Information Report 1
Section 1: Executive Summary
Sound Transit is scheduled to begin Link light rail service to Capitol Hill and the University of Washington in March 2016, with testing to begin in December 2015. The University Link Extension will add two stations—one on Capitol Hill at Broadway and E John Street and one at the University of Washington’s Husky Stadium. Consistent with the restructure triggers in Metro’s service guidelines, we began a process to identify and evaluate opportunities to integrate bus and rail services at the two new stations and develop proposals for service revisions after the new Link service begins.
It will be important for those engaged in this project to have a common base of information about existing conditions in the University Link corridor and surrounding areas. This will help decision makers, project planners, and the general public share a similar understanding of existing conditions, potential problem areas, and opportunities to change the network. This report provides the background information compiled by Metro planners, including the following key findings:
Finding 1: There is an impetus to change and restructure service in the areas around the two new stations, based on the following:
Current issues with service in these areas, including poor headway adherence, bus bunching, inadequate capacity, and excessive wait times. These issues are particularly evident in routes 71, 72, 73, and 74.
Metro’s service guidelines identify the following triggers for a service restructure. All apply to the University Link Extension corridor and surrounding areas. Sound Transit or Metro service investments Corridors above or below All-Day and Peak Network frequency Services competing for the same riders Mismatch between service and ridership Major changes to the transportation network Major development or land-use changes
Metro’s service guidelines suggest that service design in the project areas could be improved in the following ways: Service that is easier to understand More-appropriate route spacing and reduced duplication Better spacing between stops More-appropriate route length Better operating paths and appropriate vehicles Better route terminals
Benefits of Link, including better reliability and predictability, as well as vastly improved travel times to and from northeast Seattle and Capitol Hill. Improvements to travel times could also be achieved in other areas, depending on the breadth of proposed restructures.
The Transit Integration Report’s findings to better integrate the Sound Transit and Metro transit systems.

King County Metro Transit – University Link Extension Planning – Background Information Report 2 Section 1 – Executive Summary
Finding 2: Many existing and future projects will interact with the University Link Extension during the planning phase and beyond. The most relevant projects are listed below.
University of Washington planning: Potential changes to the campus landscape, including a potential cycle track on Stevens Way, could impact transit operations in the future.
Montlake Triangle project: This project will construct a new bay for trolley bus layovers on Pacific Place (candidate routes are 49 or 70). A northbound to westbound turn storage track will need to be installed on 15th Avenue NE at NE Campus Parkway so service can be reoriented to the Montlake Triangle.
Southbound Montlake HOV Lane: A southbound HOV lane would be implemented on Montlake Boulevard NE. Funding for this project has yet to be identified.
State Route 520 projects and studies: These include construction of the west approach bridge north, the west-side project, and the Montlake speed and reliability study. The west approach bridge will add a third west-bound lane to the bridge and is expected to be finished in 2017. The other projects remain unfunded.
First Hill streetcar access improvements and needs: A pedestrian underpass and associated stop relocation could affect transit operations on First Hill.
Trolley infrastructure improvements and needs: The Broadway streetcar extension, Montlake Triangle project, 23rd Avenue corridor improvements and trolley overhead wire extension, and off-wire trolley bus capabilities could all affect transit operations in the future.
Downtown Seattle Transit Tunnel capacity: Changes to the tunnel will be made as early as September 2015, before the start of revenue service on the University Link Extension, when Link headways will be reduced to six minutes.
First Hill Streetcar, Center City Connector, and Broadway Extension: The Seattle streetcar system may expand, possibly to include a northward extension on Broadway. Planning has started for a Center City Connector that would link the First Hill and South Lake Union streetcars through downtown Seattle.
High-capacity transit corridors: Seattle’s Transit Master Plan identifies two high-capacity transit corridors that within the project area. Corridor 6, or the Madison Street Corridor Bus Rapid Transit project, would improve connections between Colman Dock on the Seattle waterfront, downtown Seattle, First Hill, and the Central Area. Corridor 8 would improve the connection between downtown Seattle, South Lake Union, and the Roosevelt district. High-capacity transit corridors may be served by rapid streetcars, bus rapid transit, or enhanced bus transit in the future.

King County Metro Transit – University Link Extension Planning – Background Information Report 3 Section 1 – Executive Summary
Other issues: Metro planners will continue to monitor the following issues:
Other projects in the area, not identified in the list above.
Layover needs.
Stop spacing.
Draw areas for employers, and opportunities to better connect people with their workplaces.
Social equity concerns, including public participation in areas with more low income and minority residents and the locations of social service agencies.
Transit markets and expected changes in the near term.
Affects on Metro’s Access (paratransit) and Rideshare services.

Section 2: Introduction
This section describes the project background for the University Link process and long range planning work completed prior to the start of this project.
Project background
Sound Transit is scheduled to begin Link light rail service to Capitol Hill and the University of Washington in March 2016, with testing to begin in December 2015. The University Link Extension will add two stations—one on Capitol Hill at Broadway and E John Street and one at the University of Washington’s Husky Stadium. Consistent with the restructure triggers in Metro’s service guidelines, we began a process to identify and evaluate opportunities to integrate bus and rail services at the two new stations and develop proposals for service revisions after the new Link service begins.
Other recent developments have also influenced project planning, as described below.
Transit integration report: In September 2014, as directed by Executive Constantine (in his roles as both King County Executive and Sound Transit Board Chair), Metro and Sound Transit produced a transit integration report calling for the two agencies to better integrate transit projects and services. This report has a section on the University Link Extension that says, in part:
Metro and Sound Transit will work closely with the City of Seattle and the UW to maximize this large capital investment. Sound Transit and Metro will develop an integrated rail-bus service network that enhances rider mobility while making the best use of resources in this corridor including:
Providing convenient transfers to and from Link at the UW and Capitol Hill Stations;
Improving transit connections to Link and high-frequency bus service for neighborhoods north and northeast of the university;
Improving transit connections to Link, First Hill Streetcar and high frequency bus services for neighborhoods adjacent to Capitol Hill;
Providing more reliable, expanded opportunities for transit travel to and from the UW, Capitol Hill, downtown Seattle and throughout the region; and
Reducing transit and general purpose delay by reducing the number of buses traveling into and through downtown Seattle in the U Link corridor.
As next steps, Metro, Sound Transit and the City of Seattle will work jointly to develop a restructured bus network that creates efficient, effective connections to U Link rail service at the Capitol Hill and UW Stations.
Given this directive, Metro has begun discussions with Sound Transit, the City of Seattle, and other important stakeholders about integrating services around the new Capitol Hill and Husky Stadium stations.
Service reductions: On September 27, 2014, Metro eliminated 28 routes and reduced service on 13 routes throughout King County. These reductions did not significantly impact the University and Capitol Hill Link project areas, and no further service reductions are scheduled in 2015 or 2016.

King County Metro Transit – University Link Extension Planning – Background Information Report 5 Section 2 – Introduction
Proposition 1 (Seattle Transportation Benefit District): On November 4, 2014, a ballot measure passed enabling the Seattle Transportation Benefit District to raise revenue to enhance King County Metro Transit service. The City of Seattle is planning investments in the following routes in the project area: 8, 9X, 10, 11, 12, 16, 25, 26, 28, 30, 31, 32, 43, 44, 48, 49, 60, 64X, 66, 67, 68, 70, 71, 72, 73, 74, and 76. Final decisions about service to be funded by the Seattle Transportation Benefit District are expected in early 2015.
Project objectives
The following proposed objectives are guiding the process of analysis and proposal development for service integration. As we move through this process, we will continually check in with these objectives to make sure we are doing what we can to meet them, while acknowledging that some of these objectives may at times conflict with others.
Preserve and grow ridership, maximizing overall transit ridership in the system.
Address existing service quality issues.
Analyze changes in ridership, fare revenue, federal funding, and other financial sustainability issues.
Develop complete, consistent, and data-driven analyses to shape and evaluate service concepts and proposals.
Improve system efficiency and reduce duplication.
Maintain and improve system convenience for current and future riders.
Proactively engage the public in helping shape the final proposal.
Design concepts that can be communicated to the public easily.
Identify any adverse fiscal impacts to Metro and mitigate these where possible.
Develop alternative concepts and proposals with scalability in mind, with the ability to be phased in if necessary.
Be transparent, both internally and externally.
Work effectively with the many partners and stakeholders who have an interest in this process.
Address the Transit Integration Report’s early actions regarding the integration of Sound Transit and Metro systems.
Address mismatches between service and ridership.
Provide equitable opportunities for people to access the public transportation system, including low income, minority and limited English speaking communities, as well as people with physical disabilities or limited access to private transportation options.
Provide a usable network.
Develop a proposal of which all staff members can take ownership.
Present a complete and consistent analysis that drives the proposal.

King County Metro Transit – University Link Extension Planning – Background Information Report 6 Section 2 – Introduction
Seattle’s Transit Master Plan
The Final Summary Report of the Seattle Department of Transportation’s Transit Master Plan was adopted by the Seattle City Council in April 2012. This long-range planning document identifies four priorities for capital facilities and service investments that relate to University Link Extension planning:
High capacity transit corridors: There are two high capacity transit corridors identified within our project area. Corridor 6, commonly referred to as the Madison BRT project, would improve the connections between Colman Dock, downtown Seattle, First Hill, and the Central Area. Corridor 8 would improve the connections between downtown Seattle, South Lake Union, and the Roosevelt district. Both of the corridor studies are currently underway, and construction is expected to begin as early as 2019.
Priority bus corridors: Seven priority bus corridors intersect with the University Link Extension project area—Corridors 3, 4, 5, 7, 12, 13 and 14. Some improvements have already been made as part of the City’s Bridging the Gap transit priority corridor improvement projects. These include Beacon Avenue (Corridor 3), Rainier Avenue (corridors 4 and 5), and NW Market Street/45th Avenue (Corridor 13). A study is also underway for Corridor 7 between Uptown, South Lake Union, and Capitol Hill.
Transfer and intermodal facilities: A number of intermodal facilities are identified in the project area, primarily in conjunction with Link station locations and priority access nodes for the high-capacity transit corridors identified in the plan.
Trolley bus infrastructure improvements: The plan identifies a range of trolley bus infrastructure improvements, from short wire additions that would allow existing routes to be restructured to full electrification of existing diesel routes. Notable proposed improvements in the project area include 12th Avenue wire installation (Corridor 3), electrification of Route 48 between the University District and Mount Baker (Corridor 5), and Yesler Way wire installation (Center City Corridor).

Section 3: Existing Conditions – Facilities
Background
The following past planning efforts interact with the Link Capitol Hill and University stations.
2001 Downtown Seattle Transit Tunnel Joint Operations Study – Sound Transit and Metro
2005 – North Link Interagency Work Team
April 2006 – Final Supplemental Environmental Impact Statement for the North Link light rail project
High Capacity Transit Plan (Montlake Multimodal Center Concepts)
October 2010 – ESSB 6392: Design Refinements and Transit Connections Work Group Recommendation (bus stop locations)
January 2011 – Addendum for U-Link Pedestrian Connection project
February 2012 – Five-party Memorandum of Understanding (Montlake Triangle transit facilities)
Campus Landscape Framework – UW
The following current planning efforts interact with the University Link Extension project, with the most relevant listed first. They are also mapped on page 11.
Most relevant projects and issues
1. University Link Extension: Extend existing light rail to the north and provide two new stations, on Capitol Hill and at the University of Washington’s Husky Stadium.
2. Stevens Way cycle track: Convert one lane of Stevens Way to a cycle track, which would preclude bi-directional bus service on Stevens Way. This potential project was identified as part of the University of Washington’s campus landscape framework planning. It has not yet been incorporated into the University’s campus master plan.
3. University Greenways: A volunteer coalition is working with the University District community to identify a network of neighborhood greenway candidates. The group identified a preliminary greenway concept along 12th Avenue NE between Ravenna Boulevard and the Burke-Gilman Trail.
4. Southbound Montlake HOV lane: A southbound HOV lane would be created on Montlake Boulevard NE. (No funding identified yet)
5. State Route 520 west approach north project: Part of the SR-520 bridge replacement and HOV program, this project will add a third westbound lane to the SR-520 bridge. (Expected completion date: 2017)
6. Westside project: This unfunded project would create a HOV lid with direct access between Montlake Boulevard and SR-520. The project is not expected to improve travel times across Montlake Bridge, but may insulate transit service from SR-520 traffic.
7. Montlake speed and reliability study: This study will recommend improvements on the 24th Avenue E/Montlake Boulevard corridor, including extending the existing Pacific Street transit lane and creating a new transit lane on northbound 24th Avenue E approaching SR-520. These improvements would improve travel times from Capitol Hill to the SR-520 interchange.

King County Metro Transit – University Link Extension Planning – Background Information Report 8 Section 3: Existing Conditions – Facilities
8. Montlake Triangle project: Construct a new bay for trolley bus layovers on Pacific Place (candidate routes 49 or 70). A northbound to westbound turn storage track will need to be added on 15th Avenue NE at NE Campus Parkway so service can be reoriented to the Montlake Triangle.
9. 23rd Avenue trolley overhead: Extend trolley wire on 23rd Avenue. The project is still in a conceptual phase.
10. Capitol Hill Station area planning: The westbound stop on Olive Way at west of Broadway could be moved to westbound John Street on the other side of Broadway to eliminate one street crossing for bus/rail transfers.
11. Capitol Hill pedestrian underpass: Sound Transit is building an underpass between the streetcar (and associated southbound bus stop) platform on southbound Broadway at the Capitol Hill Link Station, which will improve transfers between Link, buses, and the streetcar.
12. First Hill Streetcar: The First Hill Streetcar is expected to begin operation between Pioneer Square and E Denny Way on Capitol Hill in early 2015.
13. 23rd Avenue Improvements, Phase I: This project will include repaving and will also address safety and accessibility for other modes of transportation. The first phase, expected to begin in early 2015, will improve East John Street to South Jackson Street.
14. Broadway streetcar extension: The First Hill Streetcar could be extended to E Aloha Street in the future.
15. Roosevelt to downtown Seattle high-capacity transit corridor: The Seattle Department of Transportation study of this potential high-capacity corridor, identified in Seattle’s Transit Master Plan, is expected to be complete around September 2019. The study may call for rapid streetcar, bus rapid transit, or enhanced bus transit in the corridor.
16. Downtown Seattle Transit Tunnel capacity: Changes may be made to bus service in the transit tunnel before or at the same time as the beginning of revenue service on the University Link Extension in 2016. Six-minute Link headways are planned to start in the fall of 2015. A capacity simulation was completed in August 2014.
Other relevant projects and issues
17. Northgate Link Extension: Extend light rail further north and provide three new stations—the University District Station (on Brooklyn Avenue NE between NE 43rd and NE 45th streets), Roosevelt Station, and Northgate Station. (Expected completion date: 2021)
18. Lynnwood Link, East Link, and South Link: Extend light rail further north, south, and east of the 2021 stations.
19. Center City connector: Connect the First Hill and South Lake Union streetcar lines through downtown Seattle. The Broadway extension could be added later on. A locally preferred alternative for the Center City connector was approved by the Seattle City Council in July 2014.
20. Madison Street bus rapid transit: One of the potential high-capacity corridors in Seattle’s Transit Master Plan. Plans for this corridor project are still being discussed. The Seattle Department of Transportation is expected to complete its study in June 2015.
21. Route 8 study: A Denny corridor study is currently underway to identify potential speed and reliability improvements.
22. Convention Place Station layover and tunnel access: Metro may sell Convention Place Station for redevelopment. This sale would have potential impacts on bus layovers, bus access to the Downtown Seattle Transit Tunnel, bus access to I-5, a trolley substation, and passenger facilities.

King County Metro Transit – University Link Extension Planning – Background Information Report 9 Section 3: Existing Conditions – Facilities
23. Alaskan Way Viaduct replacement: Construction on the State Route 99 deep-bore tunnel is underway but has been delayed. The tunnel machine is now expected to resume digging in April 2015.
24. Yesler Way trolley bus overhead wire: Extend trolley wire between Third Avenue and Jefferson Street via Yesler Way, Eighth Avenue, and Ninth Avenue as one potential way to improve route performance and efficiency to and along the downtown Seattle transit spine.
25. D-2 project and potential turnback track: The D-2 roadway, which connects the Rainier Freeway Station with Fifth Avenue S and the Downtown Seattle Transit Tunnel, will be changing when Link extends to the Eastside. It will be closed to buses in 2019, and the project will be completed in 2023.
26. Rainier Beach transit center – Route 7 loop: Improve multimodal connections to the Link Rainier Beach Station. A study has been funded to explore a new turnaround loop to connect Route 7 with the Link station.
27. EastLink pre-revenue testing: Four-minute headways for Link trains in the Downtown Seattle Transit Tunnel will require us to reduce the number of buses traveling through the tunnel.
28. Seattle Children’s Hospital Livable Streets: An initiative to enhance the livability of NE Seattle as the hospital grows. Children’s will spend $4 million on pedestrian, bicycle, and other transportation projects as part of its 20-year plan.
29. 23rd Avenue improvements, phase II: Improve S Jackson Street to Rainier Avenue S. This phase could begin in 2017, pending funding.
30. 23rd Avenue improvements, phase III: Improve E Roanoke Street to E John Street. This phase could begin in 2017, pending funding.
31. Yesler Bridge Rehabilitation Project: Improve safety and reliability while preserving the bridge’s historical elements. The project is in the design phase. Construction is expected to begin late 2015 and last for approximately one year.
32. Route 70 terminal: Existing siding wire is too short to allow multiple buses to lay over without blocking a driveway. Shifting the terminal to the Montlake Triangle may require a trolley wire modification on 15th Avenue NE to allow buses travelling northbound on that street to pass buses waiting to turn left onto Campus Parkway. (Funding has yet to be identified)

King County Metro Transit – University Link Extension Planning – Background Information Report 10 Section 3: Existing Conditions – Facilities
Map of projects and issues that interact with the University Link Extension project

King County Metro Transit – University Link Extension Planning – Background Information Report 11 Section 3: Existing Conditions – Facilities
Project area and construction updates from Sound Transit
Montlake Triangle Project
The area where the new pedestrian bridge will touch down onto campus – the Montlake Triangle – is getting a major
facelift by the UW. A portion of NE Pacific Place and the Burke-Gilman Trail will be lowered, a land bridge will be
built over the top of the roadway and trail, and the entire area will be re-landscaped.
That work, combined with the new pedestrian bridge over Montlake Boulevard, will provide a direct connection
between the station and upper campus and minimize conflicts between automobiles, pedestrians, and bicyclists.
The image below shows what the area will look like once the project is complete.
Source: Sound Transit
University of Washington Station
This station will be right next to Husky Stadium, and will provide easy regional access to the UW campus, the UW
Medical Center, other Husky athletic sites, and surrounding neighborhoods. A new pedestrian bridge will allow
walkers and bikers to avoid traffic. It will alleviate congestion by directly connecting the station to upper campus and
the Burke-Gilman Trail. Riders will board trains underground and ride to downtown Seattle in eight minutes or to
Sea-Tac Airport in about 42 minutes.
The station will have a ground-level entrance just southwest of Husky Stadium and an entrance via the pedestrian
bridge across Montlake Boulevard. The pedestrian bridge will also provide a direct connection to the upper UW
campus and the Burke-Gilman Trail, while minimizing conflicts between automobiles, pedestrians, and bicyclists.

King County Metro Transit – University Link Extension Planning – Background Information Report 12 Section 3: Existing Conditions – Facilities
Renderings of the University of Washington Station

King County Metro Transit – University Link Extension Planning – Background Information Report 13 Section 3: Existing Conditions – Facilities
Service around the University of Washington Station

King County Metro Transit – University Link Extension Planning – Background Information Report 14 Section 3: Existing Conditions – Facilities The image below shows the Montlake Triangle stops and the University of Washington Station. The majority of
routes that would connect to the station will serve stops located one-third to one-half mile away on Stevens Way or
one-fifth mile away on NE Pacific Street in front of the University of Washington Medical Center. There is a stop
directly across the street from the station, but it may only be served by a small number of routes. With stops in
these locations, the majority of people transferring between bus and rail will have to walk to NE Pacific Street or
Stevens Way to make those connections.

King County Metro Transit – University Link Extension Planning – Background Information Report 15 Section 3: Existing Conditions – Facilities
Capitol Hill Station
This station will be just east of Broadway
and south of E John Street, beneath Nagle
Place and adjoining properties. It will
serve the densely populated
neighborhood and business district as
well as Seattle Central Community
College, Group Health Medical Center,
and other nearby employers. Riders will
board underground and be able to travel
to downtown Seattle in just a couple of
minutes or to the airport in about 40
minutes.
The station will feature transit-oriented
development, urban design features,
pedestrian and bicycle
amenities, a plaza, and
a festival street. The
image to the right
shows the station site
development plan.

King County Metro Transit – University Link Extension Planning – Background Information Report 16 Section 3: Existing Conditions – Facilities
Renderings of the Capitol Hill Station

King County Metro Transit – University Link Extension Planning – Background Information Report 17 Section 3: Existing Conditions – Facilities
Services around the Capitol Hill Station

Section 4: Existing Conditions – Service
Background
The table below provides an overview of existing transit service conditions for integration with the University Link Extension.
University Link Integration
Stations Capitol Hill and UW at Husky Stadium
Link Operations Two or three-car trains at six-minute headways Estimated trip time to/from Seattle CBD:
Capitol Hill—four minutes UW at Husky Stadium—eight minutes
Routes that may integrate with Link service
8, 9X, 10, 11, 12, 16, 25, 26/28, 30, 31, 32, 44, 43, 48, 49, 60, 64X, 65, 66, 67, 68, 70, 71, 71X, 72, 72X, 73, 73X, 74X, 75, 76, 77, 167, 197, 242, 252, 255, 257, 271, 277, 311, 316, 372, 373, 512, 540, 542, 545, 555, 556, 586, First Hill Streetcar
Hours 1,226,800 annual hours (based on the routes listed above)
Bus network Estimated walking time for bus-to-Link transfer (assuming current bus stop locations) Capitol Hill Station—1-3 minutes UW at Husky Stadium—4-7 minutes
Existing riders and productivity
Daily rides and hours by tier of service
Service planners have divided routes in the project area into four tiers based on their function in relation to the
University Link extension. Tier 1 routes are those most directly affected by the extension of Link to the University
District, as they run in parallel with the new Link service. Tiers 2 and 3 are feeder services that may be affected by
changes to Tier 1 routes, or may otherwise be changed to better integrate the network. Tier 4 routes run during
peak periods; serve the University District, northeast Seattle, and Montlake; and may be affected by changes to the
transit network.
Routes by tier
Tier 1 (directly in corridor): 43, 49, 71, 71X, 72, 72X, 73, 73X, 74X
Tier 2 (feeder services to Tier 1 routes in the University District): 16, 25, 26/28, 30, 31, 32, 44, 48, 65, 66, 67, 68, 70, 75, 255, 271, 372, 373, 512, 540, 542, 545
Tier 3 (feeder services to Tier 1 routes on Capitol Hill/First Hill): 8, 9X, 10, 11, 12, 60, First Hill Streetcar
Tier 4 (peak service to the University District, northeast Seattle, and Montlake): 64X, 76, 77, 167, 197, 242, 252, 257, 277, 311, 316, 555, 556, 586

King County Metro Transit – University Link Extension Planning - Background Information Report 19 Section 4: Existing Conditions – Service
The table below lists the total combined daily rides and annual hours of the routes in each tier. Note that Tier 1 includes routes that serve over 33,000 weekday rides and cost over 191,000 annual hours to operate.
Daily Rides Annual Hours
Tier Weekday Saturday Sunday Weekday Saturday Sunday Total
1 33,308 21,175 17,138 147,538 22,866 20,994 191,398
2 90,794 37,805 26,078 625,096 66,232 55,412 746,739
3 29,921 13,832 8,916 162,624 20,791 16,016 199,431
4 9,841 0 0 89,261 0 0 89,261
Total 163,864 72,812 52,132 1,024,519 109,889 92,422 1,226,829
Productivity
The most productive routes in the project area are in Tier 1. They provide the primary connections between the area’s largest transit markets—downtown Seattle, Capitol Hill, and the University District—so they carry the most people. Tier 4 routes are all one-way, peak-period-only routes, and have the lowest rides per platform hour of any tier, but they perform well on passenger miles per platform mile.
Rides per platform hour Passenger miles per platform mile* Tier Weekday Saturday Sunday Weekday Saturday Sunday
1 55.57 48.15 47.35 18.44 15.48 14.30
2 37.04 29.68 27.30 12.30 9.56 8.74
3 46.92 34.59 32.29 10.55 7.50 7.08
4 28.11 N/A N/A 16.03 N/A N/A
*Sound Transit routes not included
Rides per trip
Rides per trip is another way to evaluate ridership. Longer trips tend perform better on this measure than shorter trips. Tier 1 service has the highest rides per trip; Tier 4, which includes many short routes, has the lowest.

King County Metro Transit – University Link Extension Planning - Background Information Report 20 Section 4: Existing Conditions – Service
Rides per trip
Tier Weekday Saturday Sunday
1 56.65 44.02 39.76
2 42.45 30.79 27.63
3 42.38 28.58 27.18
4 46.64 N/A N/A
Use of data
Service planners are preparing data on ridership, service hours, productivity, ridership, and loads for each route, in addition to information about route and corridor performance based on Metro’s service guidelines. We will use this information, together with stakeholder and public input, to develop network concepts.

King County Metro Transit – University Link Extension Planning - Background Information Report 21 Section 4: Existing Conditions – Service
Map of tiered service

King County Metro Transit – University Link Extension Planning - Background Information Report 22 Section 4: Existing Conditions – Service
Route ridership history
A review of route ridership history found the following trends with the routes in the set of routes under consideration.
Year Annual Platform
Hours Annual Rides
Rides Per
Platform Hour
Rides % of
County Notes
2014 1,065,925 44,814,190 42 February 2013, E Line
2013 1,065,800 44,573,100 42 38% September 2012, C and D Lines; RFA ends
2012 1,072,000 42,170,300 39 37% September 2011, B Line, routes 255, 271
2011 1,055,800 40,231,400 38 36% June 2011, Route 540 reduced; UPA adds
2010 1,037,600 37,949,000 37 35% February 2010, Initial Link segment, Route 8 lengthened
2009 1,010,300 37,258,500 37 33% July 2009, initial Link began; Recession
2008 994,300 38,144,100 38 32% February 2008, Route 545 improved; Route 540 truncated
2007 988,700 36,007,000 36 33% Transit Now service improvements began
2006 978,700 34,082,300 35 33%
2005 959,100 32,054,200 33 33% June 2005, Route 7 split; Route 49 implemented
Routes included in early years that have been deleted: 45, 46, 79, 205, 243, 250, 260, 261, 265, 266, and 272
Routes 512 and 586 are in the U Link route family, but are operated by CT and PT, respectively; their data is not included.
2013 3,601,705 117,868,440 33
2012 3,592,651 114,659,418 32
2011 3,530,310 112,051,864 32
2010 3,531,378 109,062,722 31
2009 3,557,088 111,265,949 31
2008 3,511,157 118,411,542 34
2007 3,517,750 110,600,190 31
2006 3,461,885 103,242,414 30
2005 3,338,867 98,582,889 30
U Link Area Change 2014 from 2005 Percent Change
11%
40%
26%
Weekday Project Route Group
Countywide Weekday as Control
Weekday productivity
Weekday rides
Weekday platform hours

King County Metro Transit – University Link Extension Planning - Background Information Report 23 Section 4: Existing Conditions – Service
Headway adherence
The following section summarizes Metro’s analysis of headway adherence, or the extent to which the actual duration between trips on a route corresponds with the scheduled time between trips. Poor headway adherence is problematic because it results in prolonged waiting for customers and imbalanced passenger loads between consecutive trips. The analyses described below are intended to supplement the schedule reliability evaluation methodology described in Metro’s Service Guidelines.
Headway standard
Metro’s headway standard for RapidRide service measures how many headways fall above a certain threshold:
The actual headway should be less than 2.5 minutes greater than scheduled when the scheduled headway is less than 7.5 minutes OR less than 3.5 minutes greater than scheduled when the scheduled headway is 7.5 minutes or greater.
The table below shows the percentage of headways that fail this standard. During the afternoon peak period, almost all routes fail this standard on more than 20 percent of their headways and routes 71, 72, and 73 fail on a third of their headways in the southbound direction.
Likelihood of bus bunching
One of the shortcomings of the headway standard is that it does not fully capture bus bunching. To better show the likelihood of bunched buses, we calculated the percentage of headways that are two minutes or less. Bus bunching is rare for all-day service—on average, three percent or less of buses on the routes
Route-Location All-Day AM Peak PM Peak
43-Northbound-John-Broadway 13% 12% 14%
43-Southbound-Montlake 16% 11% 20%
44-Westbound-45thUWay 15% 18% 14%
44-Eastbound-45thStone 18% 18% 21%
48-Northbound-Montlake 18% 17% 22%
48-Southbound-15th65th 18% 21% 18%
49-Northbound-BroadwayPine 18% 12% 24%
49-Southbound-BroadwayRoy 19% 12% 22%
66 or 67-Northbound-11th-45th 20% 5% 28%
66 or 67-Southbound-Roosevelt-75th 18% 17% 19%
71 or 72 or 73 or 74-Northbound-UnivStStation 14% 14% 25%
71 or 72 or 73 or 74-Southbound-45thUWay 24% 16% 33%
8-Northbound-MountBakerTC 22% 21% 25%
8-Southbound-John-Broadway 20% 19% 29%
31 or 32-Eastbound-Fremont 19% 16% 22%
31 or 32-Westbound-UWHub 22% 22% 23%
20-30% of headways failing
More than 30% headways failing

King County Metro Transit – University Link Extension Planning - Background Information Report 24 Section 4: Existing Conditions – Service
surveyed arrive less than two minutes after the previous bus. Bus bunching is more likely during peak periods, with rates doubling on most routes. For routes 71, 72, 73, and 74, however, bus bunching is a significant problem, especially during the afternoon peak period, when 10-15 percent of their headways are two minutes or less.
Headway ratio and extreme headways
Instead of looking at the absolute number of minutes between trips, we can consider a ratio that compares the actual versus scheduled headways. For example, if the scheduled headway is 10 minutes and the actual headway is seven minutes, we would divide the actual headway (7) by the scheduled headway (10) for a headway ratio of 0.70. If the actual headway is 15 minutes, the headway ratio would be 1.50. Ideally, headway ratios would be close to 1.0.
In the following chart, we’ve calculated the percentage of headways that are “extreme”—either less than half or more than one-and-a-half times the scheduled headway (ratios less than 0.5 or greater than 1.5, respectively). Most services have such extreme headways less than 15 percent of the time over the course of the day. However, during the afternoon peak period, the percentage of extreme headways grows, until most routes have between 10 and 25 percent of their headways in this category. Routes 71, 72, 73, and 74 are the worst, with 40-45 percent of their afternoon peak period headways in the extreme category.
Route-Location All-Day AM Peak PM Peak
43-Northbound-John-Broadway 0% 0% 1%
43-Southbound-Montlake 1% 0% 3%
44-Westbound-45thUWay 1% 2% 1%
44-Eastbound-45thStone 2% 1% 5%
48-Northbound-Montlake 3% 5% 6%
48-Southbound-15th65th 3% 9% 4%
49-Northbound-BroadwayPine 0% 0% 1%
49-Southbound-BroadwayRoy 1% 1% 2%
66 or 67-Northbound-11th-45th 3% 0% 9%
66 or 67-Southbound-Roosevelt-75th 3% 12% 1%
71 or 72 or 73 or 74-Northbound-UnivStStation 6% 4% 15%
71 or 72 or 73 or 74-Southbound-45thUWay 7% 6% 11%
8-Northbound-MountBakerTC 2% 3% 2%
8-Southbound-John-Broadway 1% 0% 2%
31 or 32-Eastbound-Fremont 2% 1% 5%
31 or 32-Westbound-UWHub 2% 0% 4%
5-10% of headways 2 min or less
More than 10% headways 2 min or less

King County Metro Transit – University Link Extension Planning - Background Information Report 25 Section 4: Existing Conditions – Service
Excessive wait times
When actual headways are longer than scheduled headways, customers have to wait longer. To capture that impact, we calculated the expected and actual wait times that lead to an excessive wait time ratio (how much longer riders are waiting than expected). We did this only for services with scheduled headways of 15 minutes or less, since on-time performance matters more for less-frequent service.
Here’s an example to illustrate the calculation: For a route with two consecutive 10-minute headways, assuming arrivals at the waiting area of one customer per minute, the wait times for the 20 customers would be 9.5 minutes, 8.5 minutes, etc. for each group of 10 customers in each headway period. The cumulative total wait time would be 100 minutes. If the actual headways are 13 and seven minutes, then the wait for the first 13 customers would be 12.5 minutes, 11.5 minutes, 10.5 minutes, etc. and the wait for the remaining seven customers would be 6.5 minutes, 5.5 minutes, etc.—adding up to 109 minutes of wait time, 9 percent longer than if the actual headway had matched the schedule.
On average, riders wait less than 25 percent longer than expected for most services. Once again, routes 71, 72, 73, and 74 during the afternoon peak period are worse than the rest of the routes we analyzed, with riders waiting on average about 60 percent longer than expected.
Route-Location All-Day AM Peak PM Peak
43-Northbound-John-Broadway 7% 7% 12%
43-Southbound-Montlake 10% 6% 17%
44-Westbound-45thUWay 10% 14% 11%
44-Eastbound-45thStone 15% 14% 26%
48-Northbound-Montlake 14% 18% 25%
48-Southbound-15th65th 16% 30% 19%
49-Northbound-BroadwayPine 10% 7% 14%
49-Southbound-BroadwayRoy 10% 5% 17%
66 or 67-Northbound-11th-45th 16% 1% 33%
66 or 67-Southbound-Roosevelt-75th 12% 22% 11%
71 or 72 or 73 or 74-Northbound-UnivStStation 20% 16% 40%
71 or 72 or 73 or 74-Southbound-45thUWay 31% 21% 45%
8-Northbound-MountBakerTC 13% 13% 20%
8-Southbound-John-Broadway 11% 6% 24%
31 or 32-Eastbound-Fremont 13% 16% 21%
31 or 32-Westbound-UWHub 14% 5% 21%
More than 25% extreme headways
Percent of Extreme Headways of either 50% or less than scheduled or 150% or more than
scheduled
15-25% of extreme headways

King County Metro Transit – University Link Extension Planning - Background Information Report 26 Section 4: Existing Conditions – Service
Route-Location All-Day AM Peak PM Peak
43-Northbound-John-Broadway 19% 28% 15%
43-Southbound-Montlake 28% 14% 26%
44-Westbound-45thUWay 19% 34% 22%
44-Eastbound-45thStone 26% 42% 28%
48-Northbound-Montlake 13% 34% 21%
48-Southbound-15th65th 14% 27% 11%
49-Northbound-BroadwayPine 23% 20% 29%
49-Southbound-BroadwayRoy 28% 22% 46%
66 or 67-Northbound-11th-45th 24% 6% 22%
66 or 67-Southbound-Roosevelt-75th 18% 19% 20%
71 or 72 or 73 or 74-Northbound-UnivStStation 28% 22% 62%
71 or 72 or 73 or 74-Southbound-45thUWay 34% 23% 59%
8-Northbound-MountBakerTC 17% 17% 24%
8-Southbound-John-Broadway 21% 25% 30%
31 or 32-Eastbound-Fremont 17% 24% 25%
31 or 32-Westbound-UWHub 22% 16% 23%
Excessive Wait Time Ratio (only for headways of 15-min or less). How much longer is the
average customer waiting than expected?
25-50% longer than expected
More than 50% longer than expected

King County Metro Transit – University Link Extension Planning - Background Information Report 27 Section 4: Existing Conditions – Service
Travel time analysis
Link’s attractiveness is highly dependent on whether it saves people time. Using on-board system travel time data from April 2014, we’ve calculated the current median and 90th-percentile travel times between a number of locations in the project area and four different markets (the Seattle central business district, Capitol Hill, South Lake Union, and the University District).
To get a sense for how likely it is that customers will switch to using Link, we’ve used existing running times and planned Link travel times and frequencies to calculate the travel times between destination pairs if customers were to ride Link. Note that we did not assume any changes to the route structure or service levels as a result of restructuring. To the extent that frequencies may improve as a result of redeployment of service hours, the actual travel times using Link may be better than indicated in the analysis below. Similarly, changes to the route structure would also affect travel times.
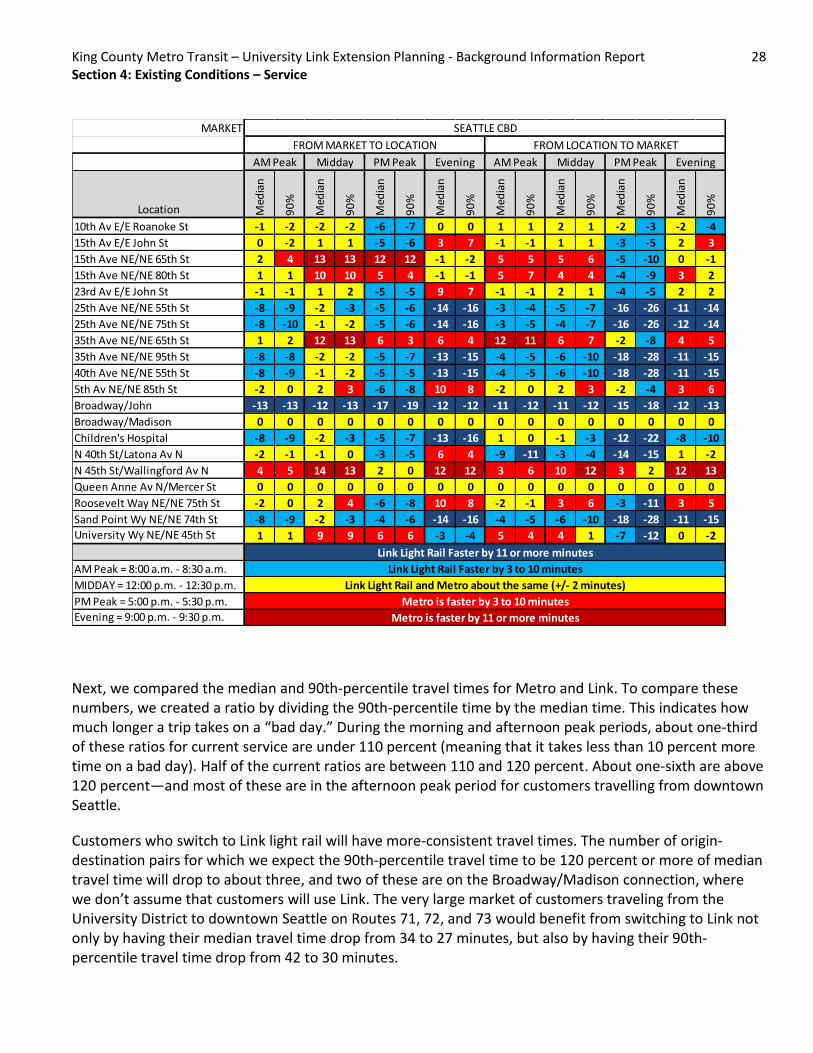
Travel times to/from downtown Seattle
We evaluated the difference between current Metro and Link median and 90th percentile travel times to and from downtown Seattle. During the afternoon peak period, almost every connection will benefit by taking the fast and reliable Link light rail. At other times of day, customers who live in northeast Seattle will benefit the most from using Link light rail. These are customers who already must transfer (to/from routes 71, 72, or 73) to reach downtown Seattle and use routes (65, 68, 75, 372) that already travel near the Husky Stadium Link Station.
King County Metro Transit – University Link Extension Planning - Background Information Report 28 Section 4: Existing Conditions – Service
Next, we compared the median and 90th-percentile travel times for Metro and Link. To compare these numbers, we created a ratio by dividing the 90th-percentile time by the median time. This indicates how much longer a trip takes on a “bad day.” During the morning and afternoon peak periods, about one-third of these ratios for current service are under 110 percent (meaning that it takes less than 10 percent more time on a bad day). Half of the current ratios are between 110 and 120 percent. About one-sixth are above 120 percent—and most of these are in the afternoon peak period for customers travelling from downtown Seattle.
Customers who switch to Link light rail will have more-consistent travel times. The number of origin-destination pairs for which we expect the 90th-percentile travel time to be 120 percent or more of median travel time will drop to about three, and two of these are on the Broadway/Madison connection, where we don’t assume that customers will use Link. The very large market of customers traveling from the University District to downtown Seattle on Routes 71, 72, and 73 would benefit from switching to Link not only by having their median travel time drop from 34 to 27 minutes, but also by having their 90th-percentile travel time drop from 42 to 30 minutes.
MARKET
Location Med
ian
90
%
Med
ian
90
%
Med
ian
90
%
Med
ian
90
%
Med
ian
90
%
Med
ian
90
%
Med
ian
90
%
Med
ian
90
%
10th Av E/E Roanoke St -1 -2 -2 -2 -6 -7 0 0 1 1 2 1 -2 -3 -2 -4
15th Av E/E John St 0 -2 1 1 -5 -6 3 7 -1 -1 1 1 -3 -5 2 3
15th Ave NE/NE 65th St 2 4 13 13 12 12 -1 -2 5 5 5 6 -5 -10 0 -1
15th Ave NE/NE 80th St 1 1 10 10 5 4 -1 -1 5 7 4 4 -4 -9 3 2
23rd Av E/E John St -1 -1 1 2 -5 -5 9 7 -1 -1 2 1 -4 -5 2 2
25th Ave NE/NE 55th St -8 -9 -2 -3 -5 -6 -14 -16 -3 -4 -5 -7 -16 -26 -11 -14
25th Ave NE/NE 75th St -8 -10 -1 -2 -5 -6 -14 -16 -3 -5 -4 -7 -16 -26 -12 -14
35th Ave NE/NE 65th St 1 2 12 13 6 3 6 4 12 11 6 7 -2 -8 4 5
35th Ave NE/NE 95th St -8 -8 -2 -2 -5 -7 -13 -15 -4 -5 -6 -10 -18 -28 -11 -15
40th Ave NE/NE 55th St -8 -9 -1 -2 -5 -5 -13 -15 -4 -5 -6 -10 -18 -28 -11 -15
5th Av NE/NE 85th St -2 0 2 3 -6 -8 10 8 -2 0 2 3 -2 -4 3 6
Broadway/John -13 -13 -12 -13 -17 -19 -12 -12 -11 -12 -11 -12 -15 -18 -12 -13
Broadway/Madison 0 0 0 0 0 0 0 0 0 0 0 0 0 0 0 0
Children's Hospital -8 -9 -2 -3 -5 -7 -13 -16 1 0 -1 -3 -12 -22 -8 -10
N 40th St/Latona Av N -2 -1 -1 0 -3 -5 6 4 -9 -11 -3 -4 -14 -15 1 -2
N 45th St/Wallingford Av N 4 5 14 13 2 0 12 12 3 6 10 12 3 2 12 13
Queen Anne Av N/Mercer St 0 0 0 0 0 0 0 0 0 0 0 0 0 0 0 0
Roosevelt Way NE/NE 75th St -2 0 2 4 -6 -8 10 8 -2 -1 3 6 -3 -11 3 5
Sand Point Wy NE/NE 74th St -8 -9 -2 -3 -4 -6 -14 -16 -4 -5 -6 -10 -18 -28 -11 -15
University Wy NE/NE 45th St 1 1 9 9 6 6 -3 -4 5 4 4 1 -7 -12 0 -2
AM Peak = 8:00 a.m. - 8:30 a.m.
MIDDAY = 12:00 p.m. - 12:30 p.m.
PM Peak = 5:00 p.m. - 5:30 p.m.
Evening = 9:00 p.m. - 9:30 p.m.
Link Light Rail and Metro about the same (+/- 2 minutes)
Metro is faster by 3 to 10 minutes
Metro is faster by 11 or more minutes
FROM MARKET TO LOCATION FROM LOCATION TO MARKET
SEATTLE CBD
Link Light Rail Faster by 11 or more minutes
Link Light Rail Faster by 3 to 10 minutes
AM Peak Midday PM Peak Evening AM Peak Midday PM Peak Evening

King County Metro Transit – University Link Extension Planning - Background Information Report 29 Section 4: Existing Conditions – Service
(Chart continues on next page)
MARKET
Location Med
ian
90
%
Rat
io
Med
ian
90
%
Rat
io
Med
ian
90
%
Rat
io
Med
ian
90
%
Rat
io
Med
ian
90
%
Rat
io
Med
ian
90
%
Rat
io
Med
ian
90
%
Rat
io
Med
ian
90
%
Rat
io
10th Av E/E Roanoke St 27 29 107% 31 35 113% 28 31 111% 35 39 111% 28 30 107% 29 32 110% 27 29 107% 29 32 110%
15th Av E/E John St 22 24 109% 21 25 119% 21 24 114% 23 26 113% 21 23 110% 18 20 111% 21 22 105% 18 20 111%
15th Ave NE/NE 65th St 27 30 111% 39 47 121% 30 32 107% 26 31 119% 32 35 109% 34 37 109% 32 36 113% 38 43 113%
15th Ave NE/NE 80th St 34 37 109% 46 55 120% 35 38 109% 36 40 111% 39 44 113% 42 46 110% 36 39 108% 41 44 107%
23rd Av E/E John St 26 28 108% 26 29 112% 25 28 112% 28 30 107% 25 27 108% 22 24 109% 24 27 113% 23 25 109%
25th Ave NE/NE 55th St 31 35 113% 45 57 127% 36 39 108% 36 40 111% 28 31 111% 29 31 107% 28 30 107% 31 34 110%
25th Ave NE/NE 75th St 34 39 115% 50 62 124% 40 44 110% 40 44 110% 31 34 110% 34 36 106% 32 34 106% 35 38 109%
35th Ave NE/NE 65th St 33 38 115% 48 60 125% 37 40 108% 37 43 116% 45 49 109% 46 52 113% 38 42 111% 43 46 107%
35th Ave NE/NE 95th St 49 54 110% 64 80 125% 51 55 108% 55 60 109% 45 49 109% 46 52 113% 43 47 109% 50 53 106%
40th Ave NE/NE 55th St 39 43 110% 55 69 125% 42 46 110% 43 46 107% 35 38 109% 37 41 111% 34 37 109% 38 41 108%
5th Av NE/NE 85th St 45 48 107% 48 63 131% 47 49 104% 55 63 115% 43 48 112% 46 59 128% 45 49 109% 49 55 112%
Broadway/John 18 20 111% 22 26 118% 20 21 105% 24 27 113% 7 8 114% 7 8 114% 7 8 114% 7 8 114%
Broadway/Madison 14 15 107% 16 22 138% 16 18 113% 18 22 122% 14 15 107% 16 22 138% 16 18 113% 18 22 122%
Children's Hospital 38 42 111% 51 65 127% 40 44 110% 41 45 110% 39 42 108% 39 43 110% 34 37 109% 36 38 106%
N 40th St/Latona Av N 40 44 110% 43 48 112% 35 37 106% 37 44 119% 31 33 106% 29 33 114% 33 36 109% 34 39 115%
N 45th St/Wallingford Av N 33 35 106% 33 39 118% 30 32 107% 38 44 116% 36 41 114% 36 41 114% 34 37 109% 40 44 110%
Queen Anne Av N/Mercer St 17 19 112% 19 21 111% 18 20 111% 20 22 110% 17 19 112% 19 21 111% 18 20 111% 20 22 110%
Roosevelt Way NE/NE 75th St 41 44 107% 44 60 136% 43 45 105% 51 58 114% 39 43 110% 41 49 120% 41 45 110% 45 50 111%
Sand Point Wy NE/NE 74th St 45 50 111% 61 77 126% 47 50 106% 49 54 110% 41 45 110% 43 49 114% 39 41 105% 45 48 107%
University Wy NE/NE 45th St 20 24 120% 34 42 124% 24 26 108% 22 24 109% 25 28 112% 27 30 111% 25 27 108% 28 30 107%
PM Peak AM Peak PM Peak
FROM MARKET TO LOCATIONTO MARKET FROM LOCATION
SEATTLE CBD (CURRENT) SEATTLE CBD (USING LINK)
TO MARKET FROM LOCATION FROM MARKET TO LOCATION
AM Peak PM Peak AM Peak PM Peak AM Peak
Route-Location All-Day AM Peak PM Peak
43-Northbound-John-Broadway 19% 28% 15%
43-Southbound-Montlake 28% 14% 26%
44-Westbound-45thUWay 19% 34% 22%
44-Eastbound-45thStone 26% 42% 28%
48-Northbound-Montlake 13% 34% 21%
48-Southbound-15th65th 14% 27% 11%
49-Northbound-BroadwayPine 23% 20% 29%
49-Southbound-BroadwayRoy 28% 22% 46%
66 or 67-Northbound-11th-45th 24% 6% 22%
66 or 67-Southbound-Roosevelt-75th 18% 19% 20%
71 or 72 or 73 or 74-Northbound-UnivStStation 28% 22% 62%
71 or 72 or 73 or 74-Southbound-45thUWay 34% 23% 59%
8-Northbound-MountBakerTC 17% 17% 24%
8-Southbound-John-Broadway 21% 25% 30%
31 or 32-Eastbound-Fremont 17% 24% 25%
31 or 32-Westbound-UWHub 22% 16% 23%
Excessive Wait Time Ratio (only for headways of 15-min or less). How much longer is the
average customer waiting than expected?
25-50% longer than expected
More than 50% longer than expected

King County Metro Transit – University Link Extension Planning - Background Information Report 30 Section 4: Existing Conditions – Service
MARKET
Location Med
ian
90
%
Rat
io
Med
ian
90
%
Rat
io
Med
ian
90
%
Rat
io
Med
ian
90
%
Rat
io
Med
ian
90
%
Rat
io
Med
ian
90
%
Rat
io
Med
ian
90
%
Rat
io
Med
ian
90
%
Rat
io
10th Av E/E Roanoke St 27 29 107% 31 35 113% 28 31 111% 35 39 111% 28 30 107% 29 32 110% 27 29 107% 29 32 110%
15th Av E/E John St 22 24 109% 21 25 119% 21 24 114% 23 26 113% 21 23 110% 18 20 111% 21 22 105% 18 20 111%
15th Ave NE/NE 65th St 27 30 111% 39 47 121% 30 32 107% 26 31 119% 32 35 109% 34 37 109% 32 36 113% 38 43 113%
15th Ave NE/NE 80th St 34 37 109% 46 55 120% 35 38 109% 36 40 111% 39 44 113% 42 46 110% 36 39 108% 41 44 107%
23rd Av E/E John St 26 28 108% 26 29 112% 25 28 112% 28 30 107% 25 27 108% 22 24 109% 24 27 113% 23 25 109%
25th Ave NE/NE 55th St 31 35 113% 45 57 127% 36 39 108% 36 40 111% 28 31 111% 29 31 107% 28 30 107% 31 34 110%
25th Ave NE/NE 75th St 34 39 115% 50 62 124% 40 44 110% 40 44 110% 31 34 110% 34 36 106% 32 34 106% 35 38 109%
35th Ave NE/NE 65th St 33 38 115% 48 60 125% 37 40 108% 37 43 116% 45 49 109% 46 52 113% 38 42 111% 43 46 107%
35th Ave NE/NE 95th St 49 54 110% 64 80 125% 51 55 108% 55 60 109% 45 49 109% 46 52 113% 43 47 109% 50 53 106%
40th Ave NE/NE 55th St 39 43 110% 55 69 125% 42 46 110% 43 46 107% 35 38 109% 37 41 111% 34 37 109% 38 41 108%
5th Av NE/NE 85th St 45 48 107% 48 63 131% 47 49 104% 55 63 115% 43 48 112% 46 59 128% 45 49 109% 49 55 112%
Broadway/John 18 20 111% 22 26 118% 20 21 105% 24 27 113% 7 8 114% 7 8 114% 7 8 114% 7 8 114%
Broadway/Madison 14 15 107% 16 22 138% 16 18 113% 18 22 122% 14 15 107% 16 22 138% 16 18 113% 18 22 122%
Children's Hospital 38 42 111% 51 65 127% 40 44 110% 41 45 110% 39 42 108% 39 43 110% 34 37 109% 36 38 106%
N 40th St/Latona Av N 40 44 110% 43 48 112% 35 37 106% 37 44 119% 31 33 106% 29 33 114% 33 36 109% 34 39 115%
N 45th St/Wallingford Av N 33 35 106% 33 39 118% 30 32 107% 38 44 116% 36 41 114% 36 41 114% 34 37 109% 40 44 110%
Queen Anne Av N/Mercer St 17 19 112% 19 21 111% 18 20 111% 20 22 110% 17 19 112% 19 21 111% 18 20 111% 20 22 110%
Roosevelt Way NE/NE 75th St 41 44 107% 44 60 136% 43 45 105% 51 58 114% 39 43 110% 41 49 120% 41 45 110% 45 50 111%
Sand Point Wy NE/NE 74th St 45 50 111% 61 77 126% 47 50 106% 49 54 110% 41 45 110% 43 49 114% 39 41 105% 45 48 107%
University Wy NE/NE 45th St 20 24 120% 34 42 124% 24 26 108% 22 24 109% 25 28 112% 27 30 111% 25 27 108% 28 30 107%
PM Peak AM Peak PM Peak
FROM MARKET TO LOCATIONTO MARKET FROM LOCATION
SEATTLE CBD (CURRENT) SEATTLE CBD (USING LINK)
TO MARKET FROM LOCATION FROM MARKET TO LOCATION
AM Peak PM Peak AM Peak PM Peak AM Peak
Route-Location All-Day AM Peak PM Peak
43-Northbound-John-Broadway 19% 28% 15%
43-Southbound-Montlake 28% 14% 26%
44-Westbound-45thUWay 19% 34% 22%
44-Eastbound-45thStone 26% 42% 28%
48-Northbound-Montlake 13% 34% 21%
48-Southbound-15th65th 14% 27% 11%
49-Northbound-BroadwayPine 23% 20% 29%
49-Southbound-BroadwayRoy 28% 22% 46%
66 or 67-Northbound-11th-45th 24% 6% 22%
66 or 67-Southbound-Roosevelt-75th 18% 19% 20%
71 or 72 or 73 or 74-Northbound-UnivStStation 28% 22% 62%
71 or 72 or 73 or 74-Southbound-45thUWay 34% 23% 59%
8-Northbound-MountBakerTC 17% 17% 24%
8-Southbound-John-Broadway 21% 25% 30%
31 or 32-Eastbound-Fremont 17% 24% 25%
31 or 32-Westbound-UWHub 22% 16% 23%
Excessive Wait Time Ratio (only for headways of 15-min or less). How much longer is the
average customer waiting than expected?
25-50% longer than expected
More than 50% longer than expected

King County Metro Transit – University Link Extension Planning - Background Information Report 31 Section 4: Existing Conditions – Service

King County Metro Transit – University Link Extension Planning - Background Information Report 32 Section 4: Existing Conditions – Service
Travel times to/from the University District
Travel times between the University District and other project area locations are not expected to change significantly until 2021, when Link is extended further north. For the Capitol Hill areas we analyzed, Link will be significantly faster than existing Metro bus service from Broadway Avenue E/E John Street and Broadway Avenue E/E Madison Street at all times of the day. Due to congestion around the Montlake Bridge during the afternoon peak period, it will be faster and more reliable for customers at 15th Avenue E/E John Street to use Link than to use Route 43. Customers in Uptown are not likely to start using Route 8 and Link, as that combination will not be as fast or reliable as existing Route 32.
MARKET
Location Med
ian
90%
Med
ian
90%
Med
ian
90%
Med
ian
90%
Med
ian
90%
Med
ian
90%
Med
ian
90%
Med
ian
90%
10th Av E/E Roanoke St 0 0 0 0 0 0 0 0 0 0 0 0 0 0 0 0
15th Av E/E John St -2 -4 -1 -1 -7 -10 8 7 1 0 5 5 -4 -13 5 6
15th Ave NE/NE 65th St 0 0 0 0 0 0 0 0 0 0 0 0 0 0 0 0
15th Ave NE/NE 80th St 0 0 0 0 0 0 0 0 0 0 0 0 0 0 0 0
23rd Av E/E John St 0 0 0 0 0 0 0 0 0 0 0 0 0 0 0 0
25th Ave NE/NE 55th St 0 0 0 0 0 0 0 0 0 0 0 0 0 0 0 0
25th Ave NE/NE 75th St 0 0 0 0 0 0 0 0 0 0 0 0 0 0 0 0
35th Ave NE/NE 65th St 0 0 0 0 0 0 0 0 0 0 0 0 0 0 0 0
35th Ave NE/NE 95th St 0 0 0 0 0 0 0 0 0 0 0 0 0 0 0 0
40th Ave NE/NE 55th St 0 0 0 0 0 0 0 0 0 0 0 0 0 0 0 0
5th Av NE/NE 85th St 0 0 0 0 0 0 0 0 0 0 0 0 0 0 0 0
Broadway/John -13 -15 -11 -12 -17 -19 -10 -10 -18 -19 -15 -16 -21 -22 -15 -16
Broadway/Madison -11 -13 -9 -10 -15 -17 -8 -8 -11 -12 -8 -9 -14 -15 -8 -9
Children's Hospital 0 0 0 0 0 0 0 0 0 0 0 0 0 0 0 0
N 40th St/Latona Av N 0 0 0 0 0 0 0 0 0 0 0 0 0 0 0 0
N 45th St/Wallingford Av N 0 0 0 0 0 0 0 0 0 0 0 0 0 0 0 0
Queen Anne Av N/Mercer St 6 8 6 3 4 6 14 14 7 11 3 2 12 32 9 9
Roosevelt Way NE/NE 75th St 0 0 0 0 0 0 0 0 0 0 0 0 0 0 0 0
Sand Point Wy NE/NE 74th St 0 0 0 0 0 0 0 0 0 0 0 0 0 0 0 0
University Wy NE/NE 45th St 0 0 0 0 0 0 0 0 0 0 0 0 0 0 0 0
AM Peak = 8:00 a.m. - 8:30 a.m.
MIDDAY = 12:00 p.m. - 12:30 p.m.
PM Peak = 5:00 p.m. - 5:30 p.m.
Evening = 9:00 p.m. - 9:30 p.m.
Evening
Link Light Rail Faster by 11 or more minutes
Link Light Rail Faster by 3 to 10 minutes
Link Light Rail and Metro about the same (+/- 2 minutes)
Metro is faster by 3 to 10 minutes
Metro is faster by 11 or more minutes
UNIVERSITY DISTRICT
FROM MARKET TO LOCATION FROM LOCATION TO MARKET
AM Peak Midday PM Peak Evening AM Peak Midday PM Peak

King County Metro Transit – University Link Extension Planning - Background Information Report 33 Section 4: Existing Conditions – Service
King County Metro Transit – University Link Extension Planning - Background Information Report 34 Section 4: Existing Conditions – Service
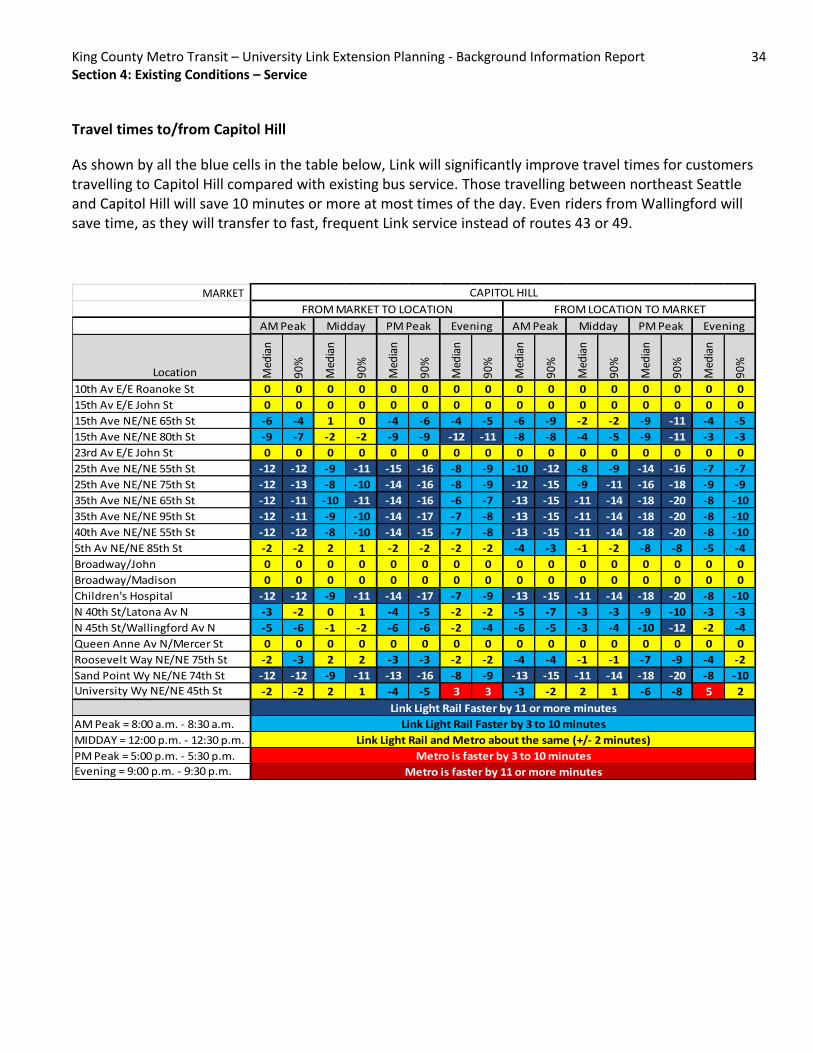
Travel times to/from Capitol Hill
As shown by all the blue cells in the table below, Link will significantly improve travel times for customers travelling to Capitol Hill compared with existing bus service. Those travelling between northeast Seattle and Capitol Hill will save 10 minutes or more at most times of the day. Even riders from Wallingford will save time, as they will transfer to fast, frequent Link service instead of routes 43 or 49.
MARKET
Location Med
ian
90%
Med
ian
90%
Med
ian
90%
Med
ian
90%
Med
ian
90%
Med
ian
90%
Med
ian
90%
Med
ian
90%
10th Av E/E Roanoke St 0 0 0 0 0 0 0 0 0 0 0 0 0 0 0 0
15th Av E/E John St 0 0 0 0 0 0 0 0 0 0 0 0 0 0 0 0
15th Ave NE/NE 65th St -6 -4 1 0 -4 -6 -4 -5 -6 -9 -2 -2 -9 -11 -4 -5
15th Ave NE/NE 80th St -9 -7 -2 -2 -9 -9 -12 -11 -8 -8 -4 -5 -9 -11 -3 -3
23rd Av E/E John St 0 0 0 0 0 0 0 0 0 0 0 0 0 0 0 0
25th Ave NE/NE 55th St -12 -12 -9 -11 -15 -16 -8 -9 -10 -12 -8 -9 -14 -16 -7 -7
25th Ave NE/NE 75th St -12 -13 -8 -10 -14 -16 -8 -9 -12 -15 -9 -11 -16 -18 -9 -9
35th Ave NE/NE 65th St -12 -11 -10 -11 -14 -16 -6 -7 -13 -15 -11 -14 -18 -20 -8 -10
35th Ave NE/NE 95th St -12 -11 -9 -10 -14 -17 -7 -8 -13 -15 -11 -14 -18 -20 -8 -10
40th Ave NE/NE 55th St -12 -12 -8 -10 -14 -15 -7 -8 -13 -15 -11 -14 -18 -20 -8 -10
5th Av NE/NE 85th St -2 -2 2 1 -2 -2 -2 -2 -4 -3 -1 -2 -8 -8 -5 -4
Broadway/John 0 0 0 0 0 0 0 0 0 0 0 0 0 0 0 0
Broadway/Madison 0 0 0 0 0 0 0 0 0 0 0 0 0 0 0 0
Children's Hospital -12 -12 -9 -11 -14 -17 -7 -9 -13 -15 -11 -14 -18 -20 -8 -10
N 40th St/Latona Av N -3 -2 0 1 -4 -5 -2 -2 -5 -7 -3 -3 -9 -10 -3 -3
N 45th St/Wallingford Av N -5 -6 -1 -2 -6 -6 -2 -4 -6 -5 -3 -4 -10 -12 -2 -4
Queen Anne Av N/Mercer St 0 0 0 0 0 0 0 0 0 0 0 0 0 0 0 0
Roosevelt Way NE/NE 75th St -2 -3 2 2 -3 -3 -2 -2 -4 -4 -1 -1 -7 -9 -4 -2
Sand Point Wy NE/NE 74th St -12 -12 -9 -11 -13 -16 -8 -9 -13 -15 -11 -14 -18 -20 -8 -10
University Wy NE/NE 45th St -2 -2 2 1 -4 -5 3 3 -3 -2 2 1 -6 -8 5 2
AM Peak = 8:00 a.m. - 8:30 a.m.
MIDDAY = 12:00 p.m. - 12:30 p.m.
PM Peak = 5:00 p.m. - 5:30 p.m.
Evening = 9:00 p.m. - 9:30 p.m.
Evening
Link Light Rail Faster by 11 or more minutes
Link Light Rail Faster by 3 to 10 minutes
Link Light Rail and Metro about the same (+/- 2 minutes)
Metro is faster by 3 to 10 minutes
Metro is faster by 11 or more minutes
CAPITOL HILL
FROM MARKET TO LOCATION FROM LOCATION TO MARKET
AM Peak Midday PM Peak Evening AM Peak Midday PM Peak
MARKET

King County Metro Transit – University Link Extension Planning - Background Information Report 35 Section 4: Existing Conditions – Service

King County Metro Transit – University Link Extension Planning - Background Information Report 36 Section 4: Existing Conditions – Service
Travel times to/from South Lake Union
Unlike the Capitol Hill market, South Lake Union will not see faster trips using Link compared to existing bus service. This is mainly due to the transfer to/from Route 8 between Capitol Hill and South Lake Union. Metro already provides two direct routes (66 and 70) between South Lake Union and the University District. Eastlake Avenue E can be congested at times, but it’s still much better than Denny Way, where Route 8 operates, so customers are likely to continue using routes 66 and 70 instead of switching to Route 8 and Link. The best way to provide faster service from northeast Seattle to South Lake Union during commute periods would be to offer service that avoids the University District.
MARKET
Location Med
ian
90
%
Med
ian
90
%
Med
ian
90
%
Med
ian
90
%
Med
ian
90
%
Med
ian
90
%
Med
ian
90
%
Med
ian
90
%
10th Av E/E Roanoke St 0 0 0 0 0 0 0 0 0 0 0 0 0 0 0 0
15th Av E/E John St 0 0 0 0 0 0 0 0 0 0 0 0 0 0 0 0
15th Ave NE/NE 65th St 11 12 17 18 17 17 16 16 12 11 18 19 12 7 24 23
15th Ave NE/NE 80th St 8 9 14 16 12 14 8 10 10 12 16 16 12 7 25 25
23rd Av E/E John St 0 0 0 0 0 0 0 0 0 0 0 0 0 0 0 0
25th Ave NE/NE 55th St 5 4 7 7 6 7 12 12 8 8 12 11 7 2 21 21
25th Ave NE/NE 75th St 4 3 8 8 7 7 12 12 8 8 12 11 7 2 21 21
35th Ave NE/NE 65th St 4 5 6 7 7 7 14 14 5 5 9 7 3 -2 20 18
35th Ave NE/NE 95th St 4 5 7 8 7 6 13 13 5 5 9 6 3 -2 20 18
40th Ave NE/NE 55th St 4 4 8 8 7 8 13 13 5 5 9 7 3 -2 20 18
5th Av NE/NE 85th St 27 30 31 31 29 32 37 38 26 30 29 30 29 33 33 37
Broadway/John 0 0 0 0 0 0 0 0 0 0 0 0 0 0 0 0
Broadway/Madison 0 0 0 0 0 0 0 0 0 0 0 0 0 0 0 0
Children's Hospital 4 4 7 7 7 6 13 12 5 5 9 6 3 -2 20 18
N 40th St/Latona Av N 13 14 16 19 17 18 18 19 19 19 26 27 19 25 34 34
N 45th St/Wallingford Av N 10 11 15 15 15 15 17 16 29 35 37 41 34 37 43 46
Queen Anne Av N/Mercer St 0 0 0 0 0 0 0 0 0 0 0 0 0 0 0 0
Roosevelt Way NE/NE 75th St 28 29 31 32 30 31 37 39 26 29 30 35 29 31 33 38
Sand Point Wy NE/NE 74th St 4 4 7 7 8 8 12 12 5 5 9 7 3 -2 20 18
University Wy NE/NE 45th St 12 12 17 17 16 15 22 22 17 18 22 21 14 10 31 30
AM Peak = 8:00 a.m. - 8:30 a.m.
MIDDAY = 12:00 p.m. - 12:30 p.m.
PM Peak = 5:00 p.m. - 5:30 p.m.
Evening = 9:00 p.m. - 9:30 p.m.
Evening
Link Light Rail Faster by 11 or more minutes
Link Light Rail Faster by 3 to 10 minutes
Link Light Rail and Metro about the same (+/- 2 minutes)
Metro is faster by 3 to 10 minutes
Metro is faster by 11 or more minutes
SOUTH LAKE UNION
FROM MARKET TO LOCATION FROM LOCATION TO MARKET
AM Peak Midday PM Peak Evening AM Peak Midday PM Peak

King County Metro Transit – University Link Extension Planning - Background Information Report 37 Section 4: Existing Conditions – Service

King County Metro Transit – University Link Extension Planning - Background Information Report 38 Section 4: Existing Conditions – Service
Service guidelines analysis
Metro’s service guidelines identify key reasons that will trigger a service restructure (see list below). All of these reasons are applicable to the University Link Extension corridor.
Sound Transit or Metro service investments
Corridors above or below all-day and peak network frequency
Services compete for the same riders
Mismatch between service and ridership
Major transportation network changes
Major development or land use changes
An analysis of Metro’s existing service design in light of our service design guidelines further suggests that service design could be improved in the project area. Our review of the existing service design is summarized below.
Service that’s easy to understand and appropriate
As it says in our service guidelines, a simple transit network is easier for riders to understand and use than a complex network. Our existing network includes many complexities, including multiple routes that connect the same centers, multiple route terminals on a given route, inconsistent through-route pairings, and service provided by different routes on different parts of a single corridor (see details below).
Multiple routes connecting centers
Six routes (66, 70, 71, 72, 73, and 74) connect the University District and downtown Seattle in the I-5/Eastlake corridor, and the routes change by time of day.
Three routes (66, 67, and 68) connect Northgate and the University District.
Four routes (2, 3, 4, and 12) connect First Hill and downtown Seattle.
Four routes (10, 11, 43, and 49) connect Capitol Hill and downtown Seattle.
Three routes (9, 60, and the Seattle Streetcar) connect Capitol Hill and First Hill.
Multiple route terminals
The University District express routes have four “tails” north of the district. This leads to reliability issues and bus bunching if an incident occurs on one tail.
Routes 3 and 4 have trips that turn back on Cherry Hill and in downtown Seattle.
Route 271 has four different terminals in east King County.
Route 255 has three different terminals in east King County.
Inconsistent through-route pairings
Routes 31, 32, 65, and 75 are through-routed in the University District. Through-route pairings vary by trip throughout the day.
Routes 26, 28, 131, and 132 are through-routed in downtown Seattle. Through-route pairings vary by trip throughout the day.
Routes 3 and 4 are through-routed in downtown Seattle. Through-route pairings vary by trip throughout the day.

King County Metro Transit – University Link Extension Planning - Background Information Report 39 Section 4: Existing Conditions – Service
Routes 43 and 44 are through-routed in the University District at night and on Sundays.
Routes 7 and 49 are through-routed in the Downtown Seattle at night and on Sundays.
Different parts of a corridor served by different routes
The 15th Avenue NE corridor is served by eight different routes (48, 71, 72, 73, 77, 347, 348, and 373) between the University District and the King/Snohomish county line. Each route operates in a different part of the corridor.
The Eastlake Avenue E corridor is served by routes 66 and 70 during daytime Monday through Saturday, and by Routes 66, 71, 72, and 73 in the evenings and on Sundays. Routes 70 and 71, 72, and 73 serve different stops in downtown Seattle and the University District.
Route spacing and duplication
We identified 14 instances of route duplication in the project area (see table below).
Bus stop spacing
The table below shows the average stop spacing by route for the routes in the project area. Individual route maps that show the spacing are available in the Route Information companion piece to this report.
University Link Integration
Service Design Guideline Analysis
Route Spacing and Duplication
Routes Corridor Between
Parallell route less
than 1/2 mile apart
for at least one mile
Rider can choose
between multiple
routes connecting
same origin and
destination
Routes heading to
common destination
are not scheduled to
complement one
another
66/67-68-73 Maple Leaf NE Northgate Way and NE 75th St Yes Yes Yes
68-372 25th Ave NE NE 75th St and Pend Oreille Yes Yes
72-372 Lake City Way NE 130th St and NE 80th St Yes Yes Yes
73-373 15th Ave NE NE 145th St and NE Campus Pkwy Yes Yes
242-542 SR-520 Green Lake P&R and Overlake Yes
255-540 108th Ave NE Kirkland TC and S Kirkland P&R Yes
26-31-32 Wallingford Fremont Latona Ave NE and Fremont Ave N Yes Yes Yes
10-12-43-48 Capitol Hill Madison St and E Galer Street Yes Yes Yes
31-32-44 Wallingford-U. District Stone Way and 15th Ave NE Yes Yes
43-48 23rd Ave NE East John St and NE Pacific St Yes Yes Yes
2-12 First Hill 3rd Ave and 19th Ave Yes Yes Yes
48-66-67-71-72-73-373 U. District NE 65th St and NE Campus Parkway Yes Yes
3-4-14-27 Central Area 3rd Ave and 31st Ave Yes Yes Yes
4-8-48 Central Area E Jefferson St and Mt Baker TC Yes
10-11 Pike-Pine 3rd Ave and 15th Ave Yes Yes Yes
9EX-60-Streetcar Broadway Yesler Way and Denny Way Yes Yes
66EX-70 Eastlake Ave Campus Parkway and Fairview Ave Yes Yes Yes
7/9EX Rainier Ave S S Henderson St to S Jackson St Yes
16/26 Wallingford N 45th Street and Woodlawn Ave NE Yes
30-74-75 Sand Point Way NE 74th Street and Princeton Ave NE Yes Yes Yes
8-43 E John St 23rd Avenue E and Summit Ave E Yes
Duplication because

King County Metro Transit – University Link Extension Planning - Background Information Report 40 Section 4: Existing Conditions – Service
TIER ROUTE AVG DISTANCE IN FT TIER ROUTE AVG DISTANCE IN FT
43 893 8 1083
49 1018 9 1602
71 840 10 894
72 1122 11 823
73 1284 12 686
71x 699 60 1104
72x 1061 64 1712
73x 1054 76 821
16 1245 77 785
25 900 167 1459
26 903 197 1174
28 1271 242 1191
30 854 252 1009
31 829 257 1043
32 1219 277 1143
44 991 311 1446
48 951 316 999
65 847
67 902
68 1125
70 1129
75 1116
255 1215
271 1832
3
1
2
4

King County Metro Transit – University Link Extension Planning - Background Information Report 41 Section 4: Existing Conditions – Service
Operating paths and appropriate vehicles
Metro currently uses articulated coaches in some residential neighborhoods, and operates through heavily congested areas that might be avoided though improved service design.
Routes 71, 72, and 73 serve the high-ridership connection between the University District and Downtown Seattle, and operate in the Downtown Seattle Transit Tunnel, so they are operated with articulated buses. In the neighborhoods, however, these articulated buses operate on some non-arterials, leading to conflict with residents.
Route 16 crosses Interstate 5 at NE Northgate Way, an I-5 interchange with heavy traffic congestion.
Routes 66 Express and 67 operate in the Roosevelt Way NE corridor, which is congested during the afternoon peak period due to cars avoiding southbound I-5.
Route terminals
A number of route terminals have been identified as problematic.
The existing terminal of Route 73 is in a residential area that is not appropriate for a route terminal.
Route 255 terminates at the Brickyard Park-and-Ride, which has limited ridership demand, especially during off-peak periods.
There is no viable terminal in the Sand Point area when the National Oceanic and Atmospheric Administration’s Western Regional Center is closed on evenings and weekends.
Route 72 currently lays over in the bus lane on Lake City Way, blocking other buses travelling through the corridor.

Section 5: Existing Conditions – Rideshare and Access Transportation
This section includes information about existing conditions on Metro’s Rideshare and Access Transportation
(paratransit) services in the project area.
Rideshare
The following usage currently occurs in the areas around the new stations:
Capitol Hill Station: Four vans have destinations within a half-mile of the station. Two VanShares connect from Sounder Commuter Rail, one VanShare connects from the Washington State Ferries, and one vanpool travels from Lynnwood. In addition, five vans originate within a half-mile of the station. Two of these travel to Issaquah, two to Redmond, and one to Bothell.
University District/Sand Point: There are 77 Metro commuter vans with destinations in these areas. Four of these could access Link Light Rail from the Tukwila International Boulevard Station and one could reach it from the Othello Station. The remaining vanpools originate outside of Seattle. In addition, there are 31 vanpools that originate within a half-mile of the future Roosevelt Station. All of these vanpools go to destinations outside of Seattle.
In all, there are 845 active Rideshare participants in these areas. Totals by zip code are shown in the list below, with the number of new users since June 2014 broken out in parentheses following the total.
Zip codes , total active users, and new users
98102 Capitol Hill West – 110 ( 54)
98112 Capitol Hill East – 117 (46)
98105 University – 484 (255)
98115 Maple Leaf/Ravenna – 111 (63)
98125 Northgate to Jackson Park – 23 (14)
Access Transportation
As shown on the map below, Metro’s Access Transportation (paratransit) service has 277 boardings by conditionally eligible riders (defined on page 44) within three-quarters of a mile of the future University station and 2,021 boardings by such riders within three-quarters of a mile of the future Capitol Hill station. Service planners will work closely with Access planners to analyze the effects on Access of any proposed changes to fixed-route service.

King County Metro Transit – University Link Extension Planning - Background Information Report 43 Section 5: Existing Conditions – Rideshare and Access
Map: conditionally eligible Access pickups in Link station areas
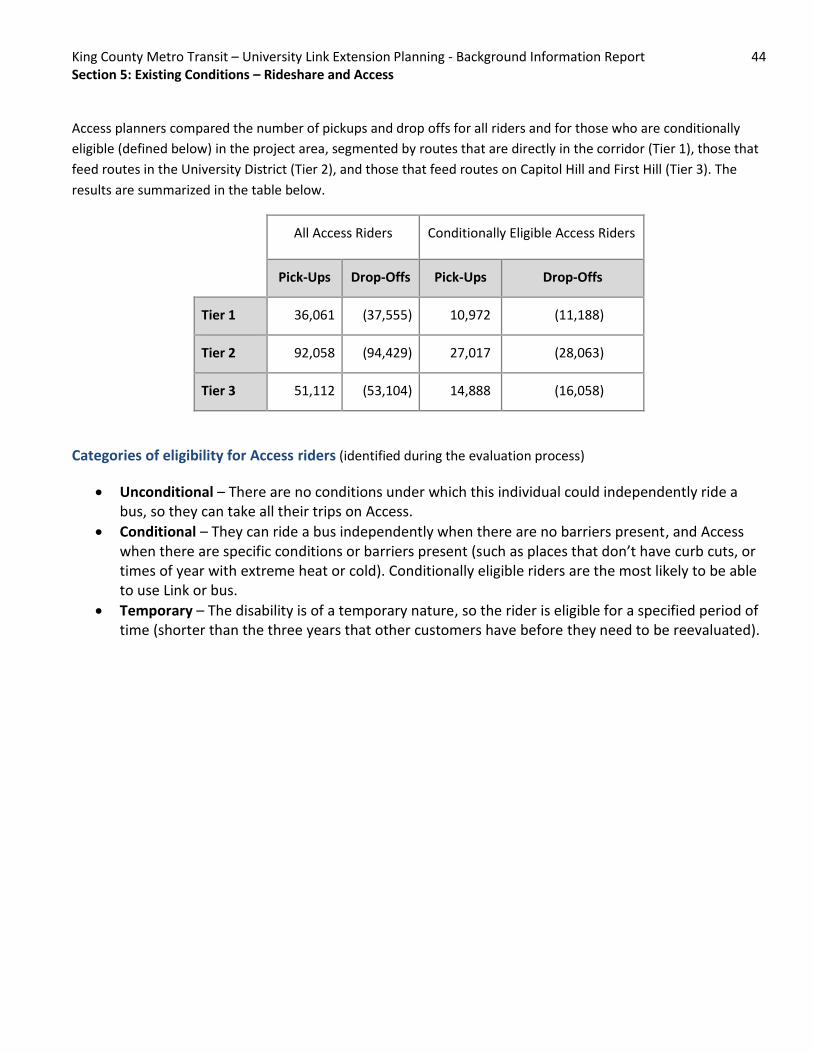
King County Metro Transit – University Link Extension Planning - Background Information Report 44 Section 5: Existing Conditions – Rideshare and Access Access planners compared the number of pickups and drop offs for all riders and for those who are conditionally
eligible (defined below) in the project area, segmented by routes that are directly in the corridor (Tier 1), those that
feed routes in the University District (Tier 2), and those that feed routes on Capitol Hill and First Hill (Tier 3). The
results are summarized in the table below.
All Access Riders Conditionally Eligible Access Riders
Pick-Ups Drop-Offs Pick-Ups Drop-Offs
Tier 1 36,061 (37,555) 10,972 (11,188)
Tier 2 92,058 (94,429) 27,017 (28,063)
Tier 3 51,112 (53,104) 14,888 (16,058)
Categories of eligibility for Access riders (identified during the evaluation process)
Unconditional – There are no conditions under which this individual could independently ride a bus, so they can take all their trips on Access.
Conditional – They can ride a bus independently when there are no barriers present, and Access when there are specific conditions or barriers present (such as places that don’t have curb cuts, or times of year with extreme heat or cold). Conditionally eligible riders are the most likely to be able to use Link or bus.
Temporary – The disability is of a temporary nature, so the rider is eligible for a specified period of time (shorter than the three years that other customers have before they need to be reevaluated).

Section 6: Demographics and Market Information
Draw areas
Service planners evaluated the current draw areas for employers in the University District, Capitol Hill, and First Hill for where the majority of people live. The results of this analysis are shown in the next four maps. From this preliminary analysis, we were able to see the following:
University District employers: The majority of people who work in the University District live in Seattle, Mercer Island, Northshore, and Eastside communities (see the first map below). The highest concentrations of people live in northeast Seattle, Fremont, and Wallingford.
Capitol Hill employers: The majority of people who work on Capitol Hill live in the Seattle area (see the second map below). The area’s highest concentrations of employees live on Capitol Hill or First Hill or in southeast Seattle or Ballard.
First Hill employers: The majority of people who work in First Hill are scattered throughout the Seattle and Renton area (see the third map below). The area’s highest concentrations of employees live in southeast Seattle, Renton, the south part of West Seattle, Ballard, Northgate, or Laurelhurst.
South Lake Union/Denny Triangle employers: The majority of people who work in South Lake Union and the Denny Triangle live in the Seattle area (see fourth map below). The highest concentrations of employees live in Fremont, Ballard, Queen Anne, Capitol Hill, West Seattle, South Lake Union, and the Denny Triangle.

King County Metro Transit – University Link Extension Planning - Background Information Report 46 Section 6: Demographics and Market Information
Map: where University District employees live

King County Metro Transit – University Link Extension Planning - Background Information Report 47 Section 6: Demographics and Market Information
Map: where Capitol Hill employees live

King County Metro Transit – University Link Extension Planning - Background Information Report 48 Section 6: Demographics and Market Information
Map: where First Hill employees live

King County Metro Transit – University Link Extension Planning - Background Information Report 49 Section 6: Demographics and Market Information
Map: where South Lake Union employees live

King County Metro Transit – University Link Extension Planning - Background Information Report 50 Section 6: Demographics and Market Information
Demographic information
The following maps show information about key demographics in the project area.

King County Metro Transit – University Link Extension Planning - Background Information Report 51 Section 6: Demographics and Market Information

King County Metro Transit – University Link Extension Planning - Background Information Report 52 Section 6: Demographics and Market Information

King County Metro Transit – University Link Extension Planning - Background Information Report 53 Section 6: Demographics and Market Information

King County Metro Transit – University Link Extension Planning - Background Information Report 54 Section 6: Demographics and Market Information
Market analysis
Starting in March 2016, Link light rail will, along with a revised bus service network, two new regional growth centers in Seattle: First Hill/Capitol Hill, and the University Community. Riders may also travel to the Uptown and South Lake Union centers, which are adjacent to downtown Seattle.
Once Link reaches Northgate in 2021, it will provide fast, frequent, and reliable service between these urban centers. It will be completely grade-separated between the Mount Baker and Northgate stations via downtown Seattle.
Currently, the University District, Capitol Hill, and First Hill have transit service that is much slower and less reliable than Link will be. Service between the University District and downtown Seattle is relatively fast and reliable in the peak direction because it uses the reversible lanes on I-5. It is much less reliable in the reverse-peak direction. The general-purpose lanes of I-5 and arterials with freeway interchanges are often congested, causing transit service to be slow and unreliable, and current service connections may provide inadequate capacity. We expect that transit mode share to increase significantly with the improved transit network.
Service planners have looked at population and employment forecasts for areas that will be affected by the University Link Extension. These forecasts come from the Puget Sound Regional Council’s Transportation Analysis Zones (TAZ) and may be updated with new numbers once the City of Seattle completes its comprehensive plan.
In 2010, a broad section of TAZ encompassing the eastern half of Seattle had 492,000 residents and 396,000 jobs. Employment is expected to grow most in downtown Seattle, the Denny Regrade, and South Lake Union. Employment is already focused in downtown Seattle, First Hill, the Denny Regrade area, South Lake Union, and the University of Washington. The table below summarizes expected trends in the University Link Extension service area.
Population forecasts in University Link Extension area*
Area/Measure
Census Forecast change from 2010
2010 2020 2030 2040
Population
Seattle project area 492,399 549,036 575,439 602,218
12% 17% 22%
Notable TAZ
First Hill / Broadway 32,399 36% 48% 54%
East Capitol Hill / Central Area 33,366 10% 13% 15%
North Capitol Hill / Madison Park 20,812 16% 19% 22%
Lake Union / Seattle Center 16,192 24% 40% 86%
University of Washington 5,706 9% 23% 39%
Ravenna / University District 29,177 4% 8% 11%
*Source: Puget Sound Regional Council
Employment forecasts in University Link Extension area*

King County Metro Transit – University Link Extension Planning - Background Information Report 55 Section 6: Demographics and Market Information
Area/Measure
Census Forecast change from 2010
2010 2020 2030 2040
Employment
Seattle project area 395,873 491,042 542,025 598,542
24% 37% 51%
Notable TAZ
First Hill / Broadway 40,613 2% 4% 11%
East Capitol Hill / Central Area 13,994 46% 53% 74%
North Capitol Hill / Madison Park 7,321 35% 34% 48%
Lake Union / Seattle Center 39,287 37% 57% 74%
University Of Washington 26,162 14% 15% 25%
Ravenna / University District 10,264 51% 72% 101%
*Source: Puget Sound Regional Council
The table below shows the different regional growth centers in the project area and shows the major employers and transit services (source: Puget Sound Regional Council). This table also includes estimated percentage changes for 2020.
Urban centers and employers
Urban center Employers Link Routes 2010 Forecast, 2020
University of Washington
UW UWMC
UW Stadium Station
Many 5,700 +14%
South Lake Union Vulcan Amazon Fred Hutch Cancer Care Alliance Zymo Genetics Gates Foundation UW Biotech
Westlake 8, 26-28,40,70, Streetcar (South Lake Union Line)
16,200 +37%
First Hill Harborview Swedish, main Swedish, Cherry Hill Seattle University Virginia Mason Yesler Terrace project
Capitol Hill Westlake University Pioneer Square
2, 3, 4, 8, 9X, 11, 12, 27, 60, Streetcar (First Hill Line)
32,400 +2%
Capitol Hill Seattle Central College Group Health
Capitol Hill 8, 9X, 10, 11, 12, 43, 49
14,000 +46%

King County Metro Transit – University Link Extension Planning - Background Information Report 56 Section 6: Demographics and Market Information
The following section summarizes current conditions and expected near-term changes in the five regional growth centers that will be affected by the University Link Extension project.
University of Washington
The University of Washington is a major research institution with 35,000 students and 6,000 staff members. The new Link station at Husky Stadium is in the southeast corner of the main campus, across Montlake Boulevard NE from the University of Washington Medical Center. The UW Bothell/Cascadia Community College campus is connected with the main Seattle campus via Metro’s Route 372 Express. The UW has several maintenance capital projects underway. Together, the UW and King County help manage Harborview Medical Center on First Hill, which is served by routes 3, 4, and 60. Harborview was expanded several years ago.
South Lake Union
The City of Seattle recently increased the zoning capacity in South Lake Union and also made major capital investments through Seattle City Light and the Seattle Department of Transportation (e.g., Mercer East, Mercer West, and the South Lake Union Streetcar). Vulcan is an active real estate development enterprise that has built several buildings in the area and has several more in the pipeline. Amazon is rapidly expanding its office space in the South Lake Union and Denny Regrade areas. There are several large residential projects under construction in these areas as well. South Lake Union is served by routes 8, 26-28, 40, and 70.
Uptown (Lower Queen Anne)
Uptown has west and east sides, which are divided by the Seattle Center.
The west side has significant residential and office density and is served by the D Line and Metro routes 1, 2, 8, and 13.
The east side has newer development, including the Gates Foundation offices. The north portal for the State Route 99 deep-bore tunnel will be at Harrison Street. After the tunnel opens, John, Thomas, and Harrison streets will be reconnected across Aurora Avenue N. This area is served by the E Line and routes 3, 4, and 8. Routes 5, 16, 26 Express, and 28 Express also serve Aurora Avenue N.
First Hill
The First Hill urban center has several major institutions and more than 32,000 jobs. Seattle University, Swedish Medical Center, Virginia Mason Hospital and Medical Center, and the King County Juvenile Justice Center are expanding. In addition, the Seattle Housing Authority is redeveloping Yesler Terrace and is seeking partners to build new housing and office complexes. The street grid, open spaces, and pedestrian infrastructure will be improved. Vulcan has purchased several acres in the east half of Yesler Terrace and will redevelop them, and the housing authority is marketing the west half. Yesler Terrace and Harborview are served by routes 3, 4, 9 Express, 27, and 60, and will also be served by Seattle’s First Hill Streetcar.

King County Metro Transit – University Link Extension Planning - Background Information Report 57 Section 6: Demographics and Market Information
Capitol Hill
Capitol Hill is the most densely populated neighborhood in Seattle. Much of it will be within a one-half mile walk of the new Link station. Seattle Central College enrolls 16,800 students (7,400 FTE). The campus is next to the Link station and is served by routes 8, 9 Express, 10, 11, 43, 49, and 60. The main Group Health Cooperative campus is at John Street and 15th Avenue East, and is served by routes 8, 10, and 43.

King County Metro Transit – University Link Extension Planning - Background Information Report 58 Section 6: Demographics and Market Information