Embed Size (px)
Citation preview
University Extension/Department of Economics
2011 Crop Market Outlook
Iowa Bankers Association Ag Bankers ConferenceAmes, Iowa
Mar. 21, 2011
Chad HartAssistant Professor/Grain Markets Specialist

University Extension/Department of Economics
U.S. Corn Supply and Use
Source: USDA
2007 2008 2009 2010
Area Planted (mil. acres) 93.5 86.0 86.4 88.2
Yield (bu./acre) 150.7 153.9 164.7 152.8
Production (mil. bu.) 13,038 12,092 13,092 12,447
Beg. Stocks (mil. bu.) 1,304 1,624 1,673 1,708
Imports (mil. bu.) 20 14 8 20
Total Supply (mil. bu.) 14,362 13,729 14,774 14,175
Feed & Residual (mil. bu.) 5,913 5,182 5,140 5,200
Ethanol (mil. bu.) 3,049 3,709 4,568 4,950
Food, Seed, & Other (mil. bu.) 1,338 1,316 1,371 1,400
Exports (mil. bu.) 2,437 1,849 1,987 1,950
Total Use (mil. bu.) 12,737 12,056 13,066 13,500
Ending Stocks (mil. bu.) 1,624 1,673 1,708 675
Season-Average Price ($/bu.) 4.20 4.06 3.55 5.40

University Extension/Department of Economics
U.S. Soybean Supply and Use2007 2008 2009 2010
Area Planted (mil. acres) 64.7 75.7 77.5 77.4
Yield (bu./acre) 41.7 39.7 44.0 43.5
Production (mil. bu.) 2,677 2,967 3,359 3,329
Beg. Stocks (mil. bu.) 574 205 138 151
Imports (mil. bu.) 10 13 15 15
Total Supply (mil. bu.) 3,261 3,185 3,512 3,495
Crush (mil. bu.) 1,803 1,662 1,752 1,655
Seed & Residual (mil. bu.) 93 106 108 110
Exports (mil. bu.) 1,159 1,279 1,501 1,590
Total Use (mil. bu.) 3,056 3,047 3,361 3,355
Ending Stocks (mil. bu.) 205 138 151 140
Season-Average Price ($/bu.) 10.10 9.97 9.59 11.60
Source: USDA

University Extension/Department of Economics
World Corn Production
Source: USDA

University Extension/Department of Economics
World Soybean Production
Source: USDA

University Extension/Department of Economics
La Niña Winter
Source: NOAA
El Niño
Neutral
La Niña

University Extension/Department of Economics
Corn Export Sales
Source: USDA, FAS
0
500
1,000
1,500
2,000
2,500
Week
Mill
ion
bu
she
ls
2008 2009 2010

University Extension/Department of Economics
2010 U.S. Corn Exports
Source: USDA, FAS
Other22%
Unknown7%
China1%
Taiwan6%
SouthKorea
7%
Egypt7% Mexico
17%
Japan29%

University Extension/Department of Economics
Corn Export Shifts
Source: USDA, FAS
Japan
Mexico Taiwan
Egypt Unknown
Other
South Korea
Total
China
-60
-40
-20
0
20
40
60
80
100
120
Mill
ion b
ush
els
13.1%
-3.9%
-21.3%
-13.3%
81.4%71.0%
4.4%
7.3%

University Extension/Department of Economics

University Extension/Department of Economics
Corn Advance Export Sales
Source: USDA, FAS
0
100
200
300
400
500
600
700
12
/30
1/1
3
1/2
7
2/1
0
2/2
4
3/1
0
3/2
4
4/7
4/2
1
5/5
5/1
9
6/2
6/1
6
6/3
0
7/1
4
7/2
8
8/1
1
8/2
5
Mill
ion
bu
shels
2011 Crop 2010 Crop

University Extension/Department of Economics
Soybean Export Sales
Source: USDA, FAS
0
400
800
1,200
1,600
Week
Mill
ion
bu
she
ls
2008 2009 2010

University Extension/Department of Economics
2010 U.S. Soybean Exports
Source: USDA, FAS
Other11%Unknown
4%Indonesia3%
Mexico6%
Japan5%
Taiwan3%
EU7%
China61%

University Extension/Department of Economics
Soy Export Shifts
Source: USDA, FAS
China
EU JapanMexico
Taiwan
Total
Other
Indonesia
Unknown
-40
-20
0
20
40
60
80
100
120
140
160
Mill
ion b
ush
els
15.2%
0.3% 0.2%
7.1%
-8.3%
178.0%
-10.0%
11.2%
3.7%

University Extension/Department of Economics
Soy Advance Export Sales
Source: USDA, FAS
0
100
200
300
400
500
600
700
12
/30
1/1
3
1/2
7
2/1
0
2/2
4
3/1
0
3/2
4
4/7
4/2
1
5/5
5/1
9
6/2
6/1
6
6/3
0
7/1
4
7/2
8
8/1
1
8/2
5
Mill
ion
bu
shels
2011 Crop 2010 Crop
University Extension/Department of Economics
0
2
4
6
8
10
12
14
16
2010 2011 2012
Bill
ion
ga
llon
s
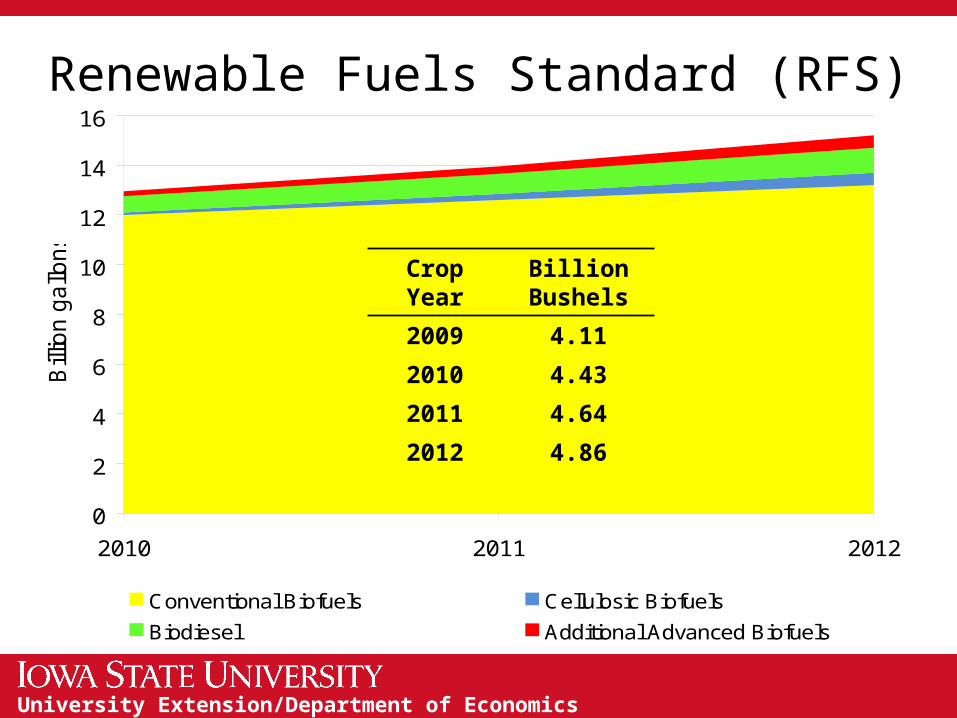
Conventional Biofuels Cellulosic Biofuels
Biodiesel Additional Advanced Biofuels
Renewable Fuels Standard (RFS)
CropYear
Billion Bushels
2009 4.11
2010 4.43
2011 4.64
2012 4.86

University Extension/Department of Economics
Ethanol Margins
Source: ISU, CARD

University Extension/Department of Economics
-0.04
-0.02
0.00
0.02
0.04
0.06
0.08
0.10
0.12
0.14
0.16
1/3
/20
07
4/3
/20
07
7/3
/20
07
10
/3/2
007
1/3
/20
08
4/3
/20
08
7/3
/20
08
10
/3/2
008
1/3
/20
09
4/3
/20
09
7/3
/20
09
10
/3/2
009
1/3
/20
10
4/3
/20
10
7/3
/20
10
10
/3/2
010
1/3
/20
11
$ p
er
ga
llon
Ethanol Blending Advantage

University Extension/Department of Economics
Projected 2010 Season-Average Corn Price
3.00
3.50
4.00
4.50
5.00
5.50
6.00
6/8
/20
09
8/8
/20
09
10
/8/2
009
12
/8/2
009
2/8
/20
10
4/8
/20
10
6/8
/20
10
8/8
/20
10
10
/8/2
010
12
/8/2
010
2/8
/20
11
$ p
er
bu
she
l
Futures USDA

University Extension/Department of Economics
Projected 2010 Season-Average Soy Price
8.00
8.50
9.00
9.50
10.00
10.50
11.00
11.50
12.00
12.50
6/8
/20
09
8/8
/20
09
10
/8/2
009
12
/8/2
009
2/8
/20
10
4/8
/20
10
6/8
/20
10
8/8
/20
10
10
/8/2
010
12
/8/2
010
2/8
/20
11
$ p
er
bu
she
l
Futures USDA

University Extension/Department of Economics
Projected 2011 Season-Average Corn Price
3.50
3.75
4.00
4.25
4.50
4.75
5.00
5.25
5.50
5.75
6.00
6.25
12
/14
/200
9
1/1
4/2
010
2/1
4/2
010
3/1
4/2
010
4/1
4/2
010
5/1
4/2
010
6/1
4/2
010
7/1
4/2
010
8/1
4/2
010
9/1
4/2
010
10
/14
/201
0
11
/14
/201
0
12
/14
/201
0
1/1
4/2
011
2/1
4/2
011
3/1
4/2
011
$ p
er
bu
she
l
Futures USDA

University Extension/Department of Economics
Projected 2011 Season-Average Soy Price
8.50
9.00
9.50
10.00
10.50
11.00
11.50
12.00
12.50
13.00
13.50
12
/14
/200
9
1/1
4/2
010
2/1
4/2
010
3/1
4/2
010
4/1
4/2
010
5/1
4/2
010
6/1
4/2
010
7/1
4/2
010
8/1
4/2
010
9/1
4/2
010
10
/14
/201
0
11
/14
/201
0
12
/14
/201
0
1/1
4/2
011
2/1
4/2
011
3/1
4/2
011
$ p
er
bu
she
l
Futures USDA

University Extension/Department of Economics
Iowa Corn Prices vs. Costs
1.00
1.50
2.00
2.50
3.00
3.50
4.00
4.50
5.00
5.50
6.00
$ p
er
Bu
she
l
Season-average Price Cost per Bushel

University Extension/Department of Economics
Iowa Soybean Prices vs. Costs
2.00
3.00
4.00
5.00
6.00
7.00
8.00
9.00
10.00
11.00
12.00
13.00
14.00
$ p
er
Bu
she
l
Season-average Price Cost per Bushel

University Extension/Department of Economics
Principal Crop Area
Source: USDA-NASS
315
317
319
321
323
325
327
329
331
333
335M
illio
n a
cres

University Extension/Department of Economics
States with Room to GrowState Million acres Competing Crops
North Dakota 2.249 Wheat, corn, soy
South Dakota 1.400 Wheat, corn, soy
Missouri 0.930 Rice, cotton, soy
Arkansas 0.715 Rice, cotton, soy
Illinois 0.535 Wheat, corn, soy
Texas 0.466 Cotton, corn, soy
Georgia 0.395 Cotton, corn, soy
Mississippi 0.284 Cotton, rice, soy
North Carolina 0.284 Cotton, corn, soy
Louisiana 0.283 Rice, cotton, soy

University Extension/Department of Economics
New Crop Futures Price Movements
Wheat Corn Soybeans Cotton
MGE Sept. CME Dec. CME Nov. ICE Dec.
($/bu.) ($/bu.) ($/bu.) ($/lb.)
June 1 5.81 4.04 9.22 0.75
Mar. 18 8.82 5.99 13.34 1.24
Change 52% 48% 45% 64%

University Extension/Department of Economics
Projected Crop Margins
120
140
160
180
200
220
240
260
280
300
320
1/3
/20
11
1/1
0/2
011
1/1
7/2
011
1/2
4/2
011
1/3
1/2
011
2/7
/20
11
2/1
4/2
011
2/2
1/2
011
2/2
8/2
011
3/7
/20
11
3/1
4/2
011
$ p
er
acr
e
Corn Margin Per Acre Soy Margin Per Acre
University Extension/Department of Economics
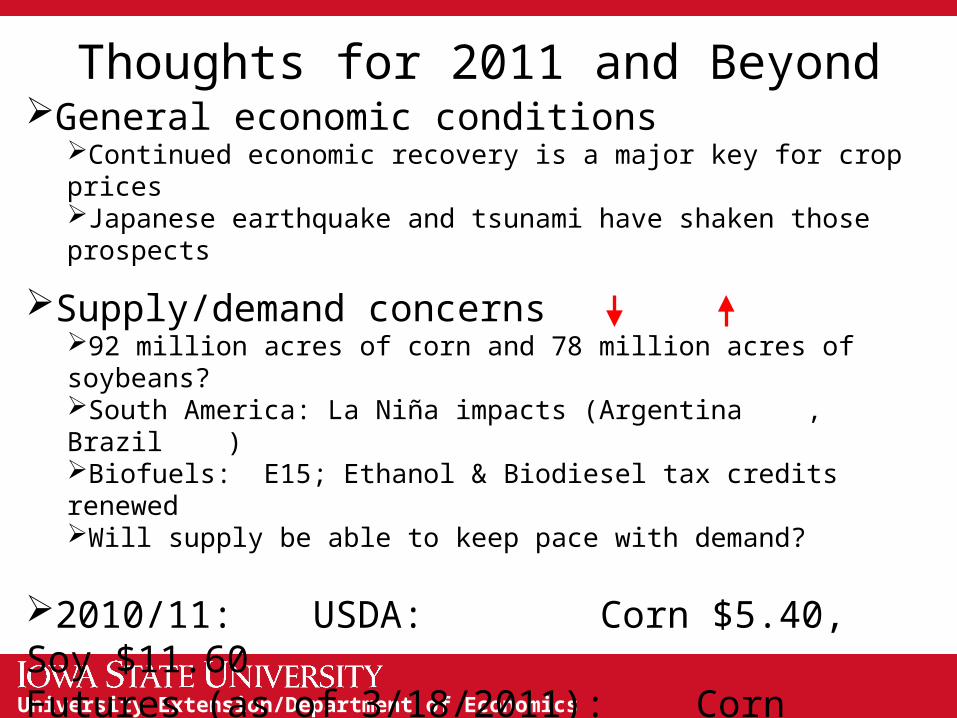
Thoughts for 2011 and BeyondGeneral economic conditions
Continued economic recovery is a major key for crop pricesJapanese earthquake and tsunami have shaken those prospects
Supply/demand concerns92 million acres of corn and 78 million acres of soybeans?South America: La Niña impacts (Argentina , Brazil )Biofuels: E15; Ethanol & Biodiesel tax credits renewedWill supply be able to keep pace with demand?
2010/11: USDA: Corn $5.40, Soy $11.60Futures (as of 3/18/2011): Corn $5.36, Soy $11.67
2011/12:Futures (as of 3/18/2011): Corn $5.83, Soy $12.83
University Extension/Department of Economics
Thank you for your time!
Any questions?
My web site:http://www.econ.iastate.edu/~chart/
Iowa Farm Outlook:http://www.econ.iastate.edu/ifo/
Ag Decision Maker:http://www.extension.iastate.edu/agdm/