Embed Size (px)
Citation preview

University College London
Office Space Utilisation � Part 1
April 2007
id28826234 pdfMachine by Broadgun Software - a great PDF writer! - a great PDF creator! - http://www.pdfmachine.com http://www.broadgun.com
U N I V E R S I T Y C O L L E G E L O N D O N O F F I C E S P A C E U T I L I S A T I O N
University College London
Office Space Utilisation
Executive Summary 1
1. Introduction 2
2. Literature Review 3
3. UCL Space 5
Total Space 6 Office Space 7 Departmental Analysis 9
Finance 9
Law 10
History 11
Epidemiology 12
Psychology 13
Archaeology 14
Conclusions 15
4. Space Charging 17
5. Case Studies 20
Newcastle University 20 Bradford University 21 Stanford University, California 22
6. Other Sector Experience 24
Sector Averages 24 Flexible Working 26
7. Conclusion & Recommendations 28
8. References 31
U N I V E R S I T Y C O L L E G E L O N D O N O F F I C E S P A C E U T I L I S A T I O N
A P R I L 2 0 0 7 1
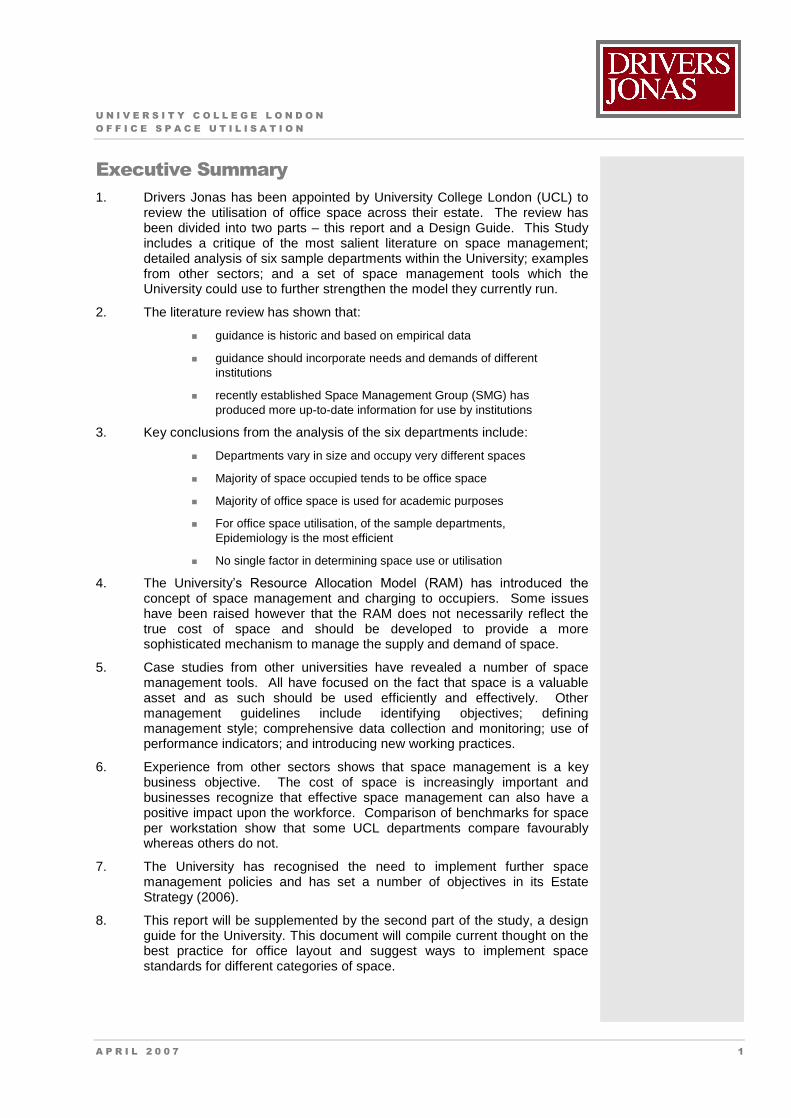
Executive Summary 1. Drivers Jonas has been appointed by University College London (UCL) to
review the utilisation of office space across their estate. The review has been divided into two parts � this report and a Design Guide. This Study includes a critique of the most salient literature on space management; detailed analysis of six sample departments within the University; examples from other sectors; and a set of space management tools which the University could use to further strengthen the model they currently run.
2. The literature review has shown that:
guidance is historic and based on empirical data
guidance should incorporate needs and demands of different institutions
recently established Space Management Group (SMG) has produced more up-to-date information for use by institutions
3. Key conclusions from the analysis of the six departments include:
Departments vary in size and occupy very different spaces
Majority of space occupied tends to be office space
Majority of office space is used for academic purposes
For office space utilisation, of the sample departments, Epidemiology is the most efficient
No single factor in determining space use or utilisation
4. The University�s Resource Allocation Model (RAM) has introduced the
concept of space management and charging to occupiers. Some issues have been raised however that the RAM does not necessarily reflect the true cost of space and should be developed to provide a more sophisticated mechanism to manage the supply and demand of space.
5. Case studies from other universities have revealed a number of space management tools. All have focused on the fact that space is a valuable asset and as such should be used efficiently and effectively. Other management guidelines include identifying objectives; defining management style; comprehensive data collection and monitoring; use of performance indicators; and introducing new working practices.
6. Experience from other sectors shows that space management is a key business objective. The cost of space is increasingly important and businesses recognize that effective space management can also have a positive impact upon the workforce. Comparison of benchmarks for space per workstation show that some UCL departments compare favourably whereas others do not.
7. The University has recognised the need to implement further space management policies and has set a number of objectives in its Estate Strategy (2006).
8. This report will be supplemented by the second part of the study, a design guide for the University. This document will compile current thought on the best practice for office layout and suggest ways to implement space standards for different categories of space.
U N I V E R S I T Y C O L L E G E L O N D O N O F F I C E S P A C E U T I L I S A T I O N
A P R I L 2 0 0 7 2
1. Introduction 1.1 Drivers Jonas has been appointed by University College London (UCL) to
review the utilisation of office space across their estate. This review has been divided into two parts.
1.2 The first is this report, which begins with a critique of the most salient literature on the subject of space management and charging. The study then goes on to explore the way in which the University currently uses space.
1.3 For this initial exercise, a sample of six Departments in the University were selected for analysis:
Finance
Law
History
Epidemiology
Psychology
Archaeology
1.4 These Departments were selected as they are a representative sample of the different disciplines at the University, the type of space occupied, the approach to space management, and were largely �office-based� departments.
1.5 Data collection took the form of interviews between Drivers Jonas and the members of each department responsible for space management. The interviewees answered a number of questions that had been provided before the meeting (to provide interviewees time to discuss the questions with colleagues beforehand if they so wished).
1.6 The questions asked of departmental members focussed on the way space was allocated within the department, whether they felt they had enough control and input into the way they used, and were charged for, space.
1.7 The report moves on to discuss examples of industry best practice and other sector experience, leading onto a set of space management tools which the University could use to further strengthen the model they currently run.
1.8 This report will be supplemented by the second part of the study, a design guide for the University. This document will compile current thought on the best practice for office layout, and suggest ways to implement uniformity and branding through the use of colour and furniture, as well as space standards for different categories of space.
U N I V E R S I T Y C O L L E G E L O N D O N O F F I C E S P A C E U T I L I S A T I O N
A P R I L 2 0 0 7 3
2. Literature Review
2.1 There are several publications on the utilisation and management of space in Higher Education. However, much of the work is fairly historic having been developed in the 1980�s and 90�s in response to growth in the HE
sector.
2.2 In 1987 the University Grants Commission (UGC) produced Notes on Control and Guidance for University Building Projects, which originated in the 1970s for space design and allocation. This provided rules for calculating floor areas based on student numbers in different academic disciplines. Further �norms� were produced in the 1980s by the Polytechnics and Colleges Funding Council (PCFC). The Space Weightings Report was produced in 1995 which examined the space use at a sample of 35 HE Institutions (HEIs). A set of �space relativities� or weightings for both teaching and research was produced, based on �cognate groupings� related
to academic subject categories. These were criticised by Revel (1997) as a tool for improving space efficiency since they were based on national averages rather than a judgement of the adequacy of space.
2.3 In a response to the different space �standards� and �norms� publications,
many HEIs have adopted their own version to apply in space planning and management. None of the �norms� have been updated since 1990, and the
space standards underpinning them date from before that. Weightings only provide relativities in terms of space needs and not the actual area required for an activity.
2.4 More recently, the UK Higher Education Space Management Group (SMG) has been set up to assist higher education institutions to identify and implement best practice in the management of space. Members of the group consist of various representatives from Universities, Funding Councils and commercial practices. SMG has produced some useful up-to-date documents that provide guidance in delivering effective space management.
2.5 The SMG Review of Practice Report (2005) provides an overview of how UK HEIs currently manage their space. The report concludes that there are five key factors to successful management of space:
Leadership
Objectives
Information
Communication
Practical tools
2.6 The SMG Promoting Space Efficiency in Building Design (2006) report goes further and sets out a number of steps that can be implemented to achieve space efficiency:
Guidance is historic and based on empirical data
Guidance should incorporate needs and demands of different institutions
Recently established Space Management Group (SMG) has produced more up-to-date information for use by institutions
U N I V E R S I T Y C O L L E G E L O N D O N O F F I C E S P A C E U T I L I S A T I O N
A P R I L 2 0 0 7 4
(1) Appoint a �champion� for space and cost-in-use
(2) Systematically collect and update space information
(3) Agree space targets, monitor their attainment and report to senior management
(4) Collect standardised utilisation data, including office space utilisation
(5) Collect and apply detailed cost information
(6) Incorporate space efficiency concepts into the estate strategy
(7) Incorporate requirements for space efficiency into project briefs, feasibility studies, option appraisals and design review
(8) Develop and maintain a clear decision and communication structure for building projects, including user groups
(9) Promote the benefits of versatile spaces, with the right furniture
(10) Include space efficiency information in post-occupancy evaluations.
2.7 In summary, there has been some guidance in the Higher Education sector on space management and planning. However, this is fairly historic and based on empirical data. There is a need for guidance information but this needs to be at a level of sophistication that incorporates the very different needs and demands of different institutions. The recently established SMG has recognised this challenge and provides a series of documents that institutions may use for information and to develop their own space management strategies.
U N I V E R S I T Y C O L L E G E L O N D O N O F F I C E S P A C E U T I L I S A T I O N
A P R I L 2 0 0 7 5
3. UCL Space
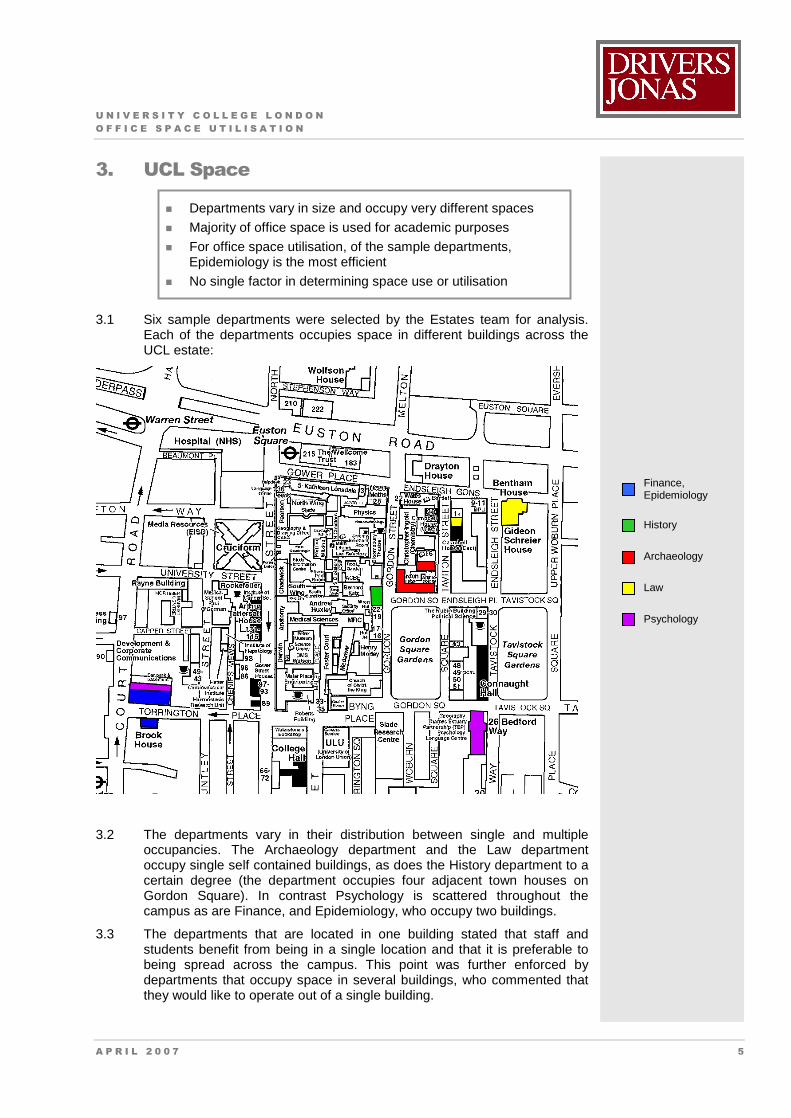
3.1 Six sample departments were selected by the Estates team for analysis. Each of the departments occupies space in different buildings across the UCL estate:
3.2 The departments vary in their distribution between single and multiple occupancies. The Archaeology department and the Law department occupy single self contained buildings, as does the History department to a certain degree (the department occupies four adjacent town houses on Gordon Square). In contrast Psychology is scattered throughout the campus as are Finance, and Epidemiology, who occupy two buildings.
3.3 The departments that are located in one building stated that staff and students benefit from being in a single location and that it is preferable to being spread across the campus. This point was further enforced by departments that occupy space in several buildings, who commented that they would like to operate out of a single building.
Departments vary in size and occupy very different spaces
Majority of office space is used for academic purposes
For office space utilisation, of the sample departments, Epidemiology is the most efficient
No single factor in determining space use or utilisation
Finance, Epidemiology
History
Archaeology
Law
Psychology
U N I V E R S I T Y C O L L E G E L O N D O N O F F I C E S P A C E U T I L I S A T I O N
A P R I L 2 0 0 7 6
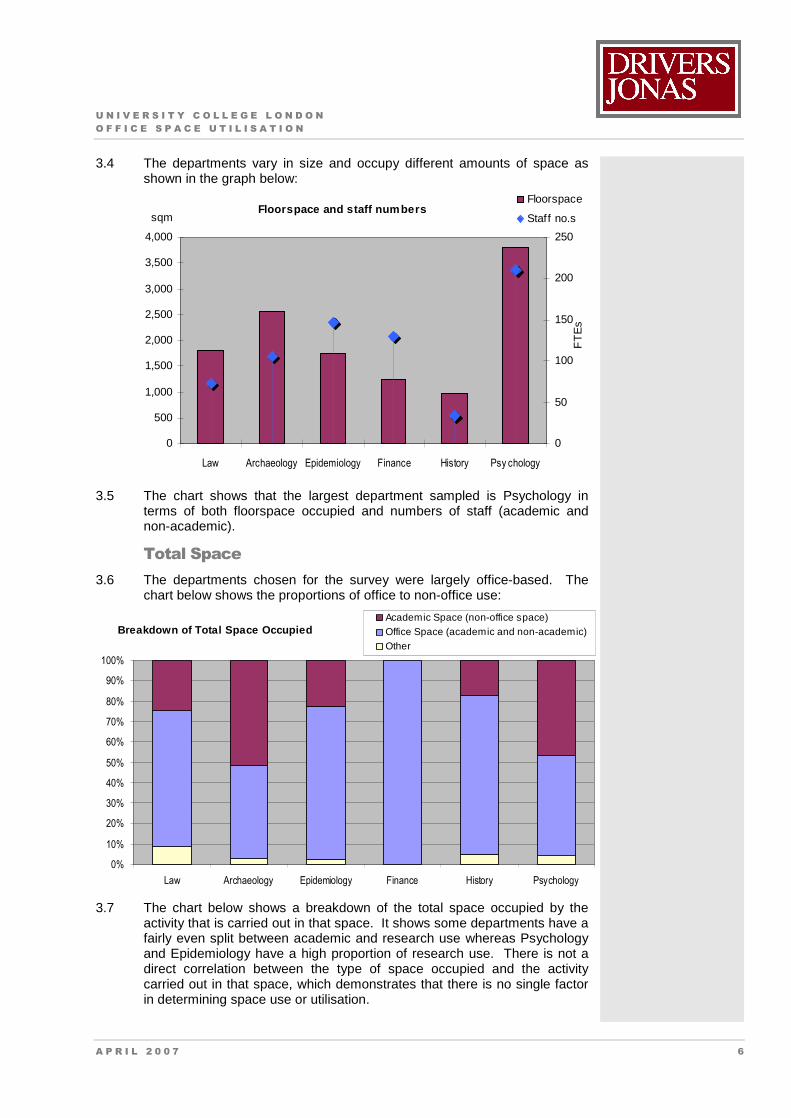
3.4 The departments vary in size and occupy different amounts of space as shown in the graph below:
Floorspace and staff numbers
0
500
1,000
1,500
2,000
2,500
3,000
3,500
4,000
Law Archaeology Epidemiology Finance History Psy chology
0
50
100
150
200
250
Floorspace
Staff no.ssqm
FT
Es
3.5 The chart shows that the largest department sampled is Psychology in terms of both floorspace occupied and numbers of staff (academic and non-academic).
Total Space 3.6 The departments chosen for the survey were largely office-based. The
chart below shows the proportions of office to non-office use:
Breakdown of Total Space Occupied
0%
10%
20%
30%
40%
50%
60%
70%
80%
90%
100%
Law Archaeology Epidemiology Finance History Psychology
Academic Space (non-office space)Office Space (academic and non-academic)Other
3.7 The chart below shows a breakdown of the total space occupied by the activity that is carried out in that space. It shows some departments have a fairly even split between academic and research use whereas Psychology and Epidemiology have a high proportion of research use. There is not a direct correlation between the type of space occupied and the activity carried out in that space, which demonstrates that there is no single factor in determining space use or utilisation.
U N I V E R S I T Y C O L L E G E L O N D O N O F F I C E S P A C E U T I L I S A T I O N
A P R I L 2 0 0 7 7
Breakdown of Total Space Occupied by Type
0%
10%
20%
30%
40%
50%
60%
70%
80%
90%
100%
Law Archaeology Epidemiology Finance History Psychology
Other Research Teaching
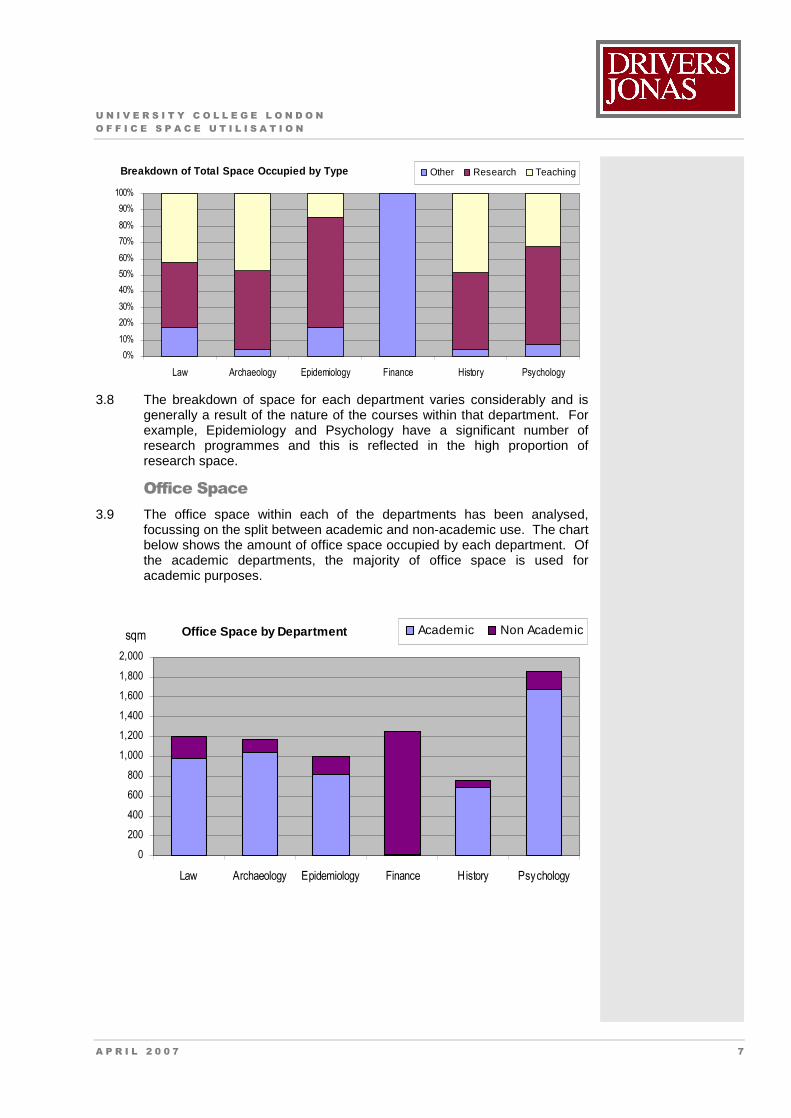
3.8 The breakdown of space for each department varies considerably and is generally a result of the nature of the courses within that department. For example, Epidemiology and Psychology have a significant number of research programmes and this is reflected in the high proportion of research space.
Office Space 3.9 The office space within each of the departments has been analysed,
focussing on the split between academic and non-academic use. The chart below shows the amount of office space occupied by each department. Of the academic departments, the majority of office space is used for academic purposes.
Office Space by Department
0
200
400
600
800
1,000
1,200
1,400
1,600
1,800
2,000
Law Archaeology Epidemiology Finance History Psychology
Academic Non Academicsqm
U N I V E R S I T Y C O L L E G E L O N D O N O F F I C E S P A C E U T I L I S A T I O N
A P R I L 2 0 0 7 8
Office Space as % of Total Space
0%
20%
40%
60%
80%
100%
Law Archaeology Epidemiology Finance History Psychology
Non-Academic
Academic
49%
78%
100%
75%
46%
67%
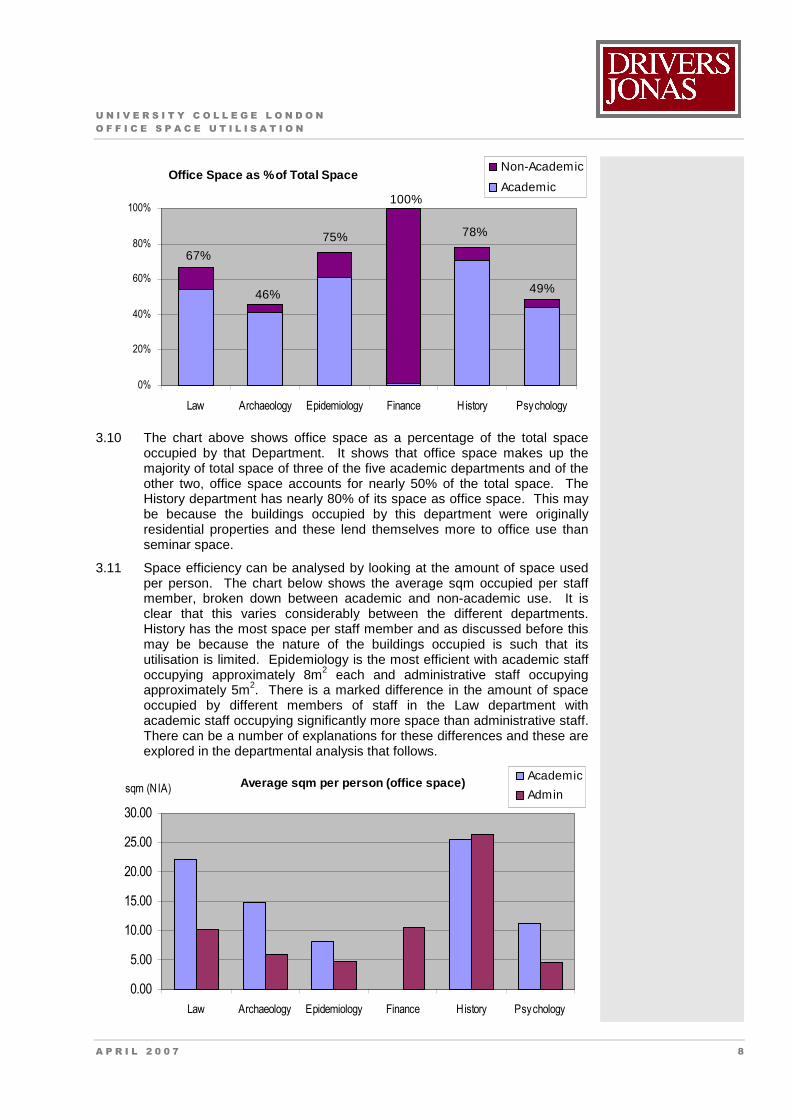
3.10 The chart above shows office space as a percentage of the total space occupied by that Department. It shows that office space makes up the majority of total space of three of the five academic departments and of the other two, office space accounts for nearly 50% of the total space. The History department has nearly 80% of its space as office space. This may be because the buildings occupied by this department were originally residential properties and these lend themselves more to office use than seminar space.
3.11 Space efficiency can be analysed by looking at the amount of space used per person. The chart below shows the average sqm occupied per staff member, broken down between academic and non-academic use. It is clear that this varies considerably between the different departments. History has the most space per staff member and as discussed before this may be because the nature of the buildings occupied is such that its utilisation is limited. Epidemiology is the most efficient with academic staff occupying approximately 8m2 each and administrative staff occupying approximately 5m2. There is a marked difference in the amount of space occupied by different members of staff in the Law department with academic staff occupying significantly more space than administrative staff. There can be a number of explanations for these differences and these are explored in the departmental analysis that follows.
Average sqm per person (office space)
0.00
5.00
10.00
15.00
20.00
25.00
30.00
Law Archaeology Epidemiology Finance History Psychology
Academic
Adminsqm (NIA)
U N I V E R S I T Y C O L L E G E L O N D O N O F F I C E S P A C E U T I L I S A T I O N
A P R I L 2 0 0 7 9
Departmental Analysis
Finance
3.12 Key statistics:
Total space occupied: 1,254 m2
Office space occupied: 1,254 m2 (100%)
Breakdown of space: Teaching: 0%
Research: 0%
Other: 100%
Office space per person:
Academic 0
Administrative 10.51 m2
3.13 There are currently 125 full-time staff and 5 part-time members of the department. The department is broken into 4 teams:
Financial Accounting
Financial Systems
Planning & Management
Research Services
3.14 These teams occupy approximately 1,300 sq m of space in 1-19 Torrington Place (on the Basement, Ground, 5th & 6th floors), and Brook House, Torrington Place (1st & 2nd floors). The space in these buildings is used entirely for support purposes, no teaching or research is carried out in this department.
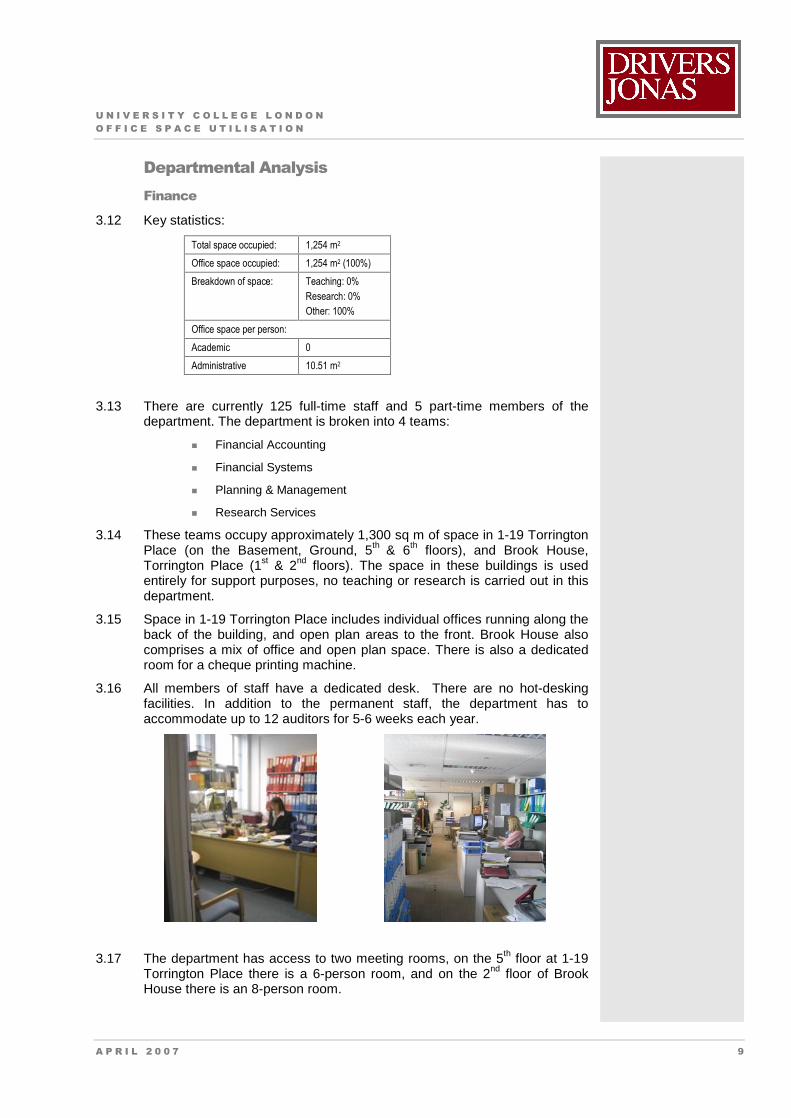
3.15 Space in 1-19 Torrington Place includes individual offices running along the back of the building, and open plan areas to the front. Brook House also comprises a mix of office and open plan space. There is also a dedicated room for a cheque printing machine.
3.16 All members of staff have a dedicated desk. There are no hot-desking facilities. In addition to the permanent staff, the department has to accommodate up to 12 auditors for 5-6 weeks each year.
3.17 The department has access to two meeting rooms, on the 5th floor at 1-19 Torrington Place there is a 6-person room, and on the 2nd floor of Brook House there is an 8-person room.
U N I V E R S I T Y C O L L E G E L O N D O N O F F I C E S P A C E U T I L I S A T I O N
A P R I L 2 0 0 7 1 0
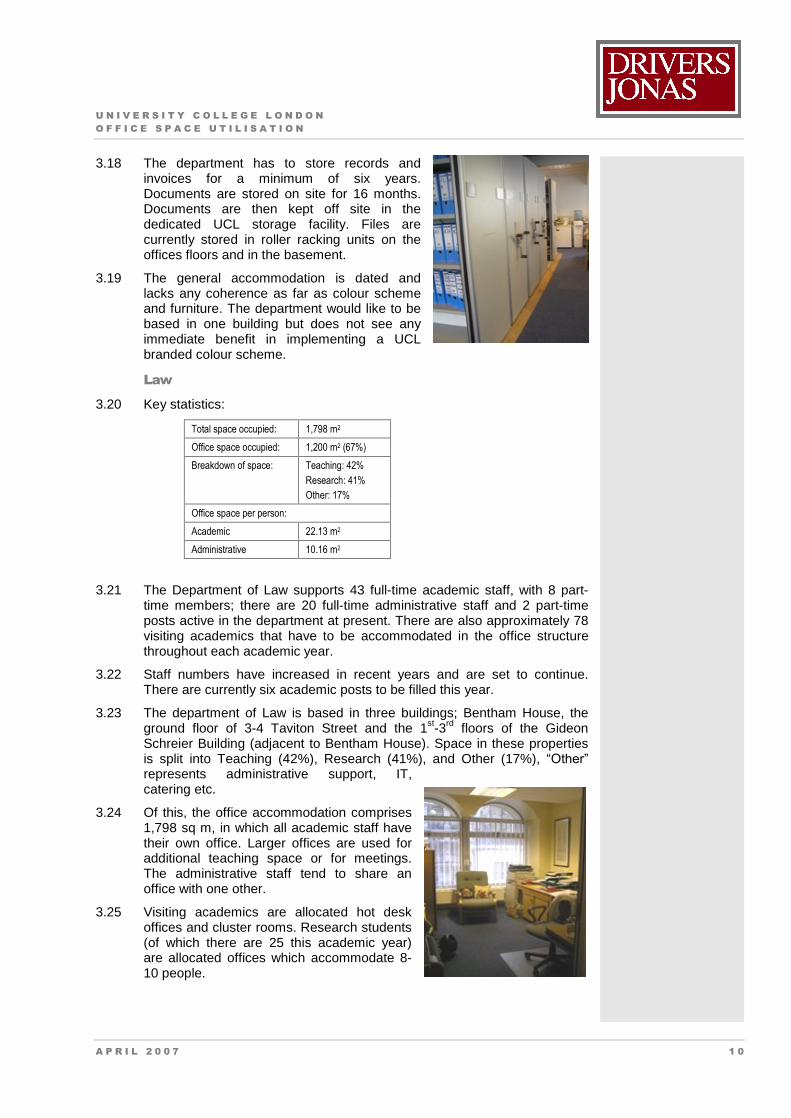
3.18 The department has to store records and invoices for a minimum of six years. Documents are stored on site for 16 months. Documents are then kept off site in the dedicated UCL storage facility. Files are currently stored in roller racking units on the offices floors and in the basement.
3.19 The general accommodation is dated and lacks any coherence as far as colour scheme and furniture. The department would like to be based in one building but does not see any immediate benefit in implementing a UCL branded colour scheme.
Law
3.20 Key statistics:
Total space occupied: 1,798 m2
Office space occupied: 1,200 m2 (67%)
Breakdown of space: Teaching: 42%
Research: 41%
Other: 17%
Office space per person:
Academic 22.13 m2
Administrative 10.16 m2
3.21 The Department of Law supports 43 full-time academic staff, with 8 part-time members; there are 20 full-time administrative staff and 2 part-time posts active in the department at present. There are also approximately 78 visiting academics that have to be accommodated in the office structure throughout each academic year.
3.22 Staff numbers have increased in recent years and are set to continue. There are currently six academic posts to be filled this year.
3.23 The department of Law is based in three buildings; Bentham House, the ground floor of 3-4 Taviton Street and the 1st-3rd floors of the Gideon Schreier Building (adjacent to Bentham House). Space in these properties is split into Teaching (42%), Research (41%), and Other (17%), �Other�
represents administrative support, IT, catering etc.
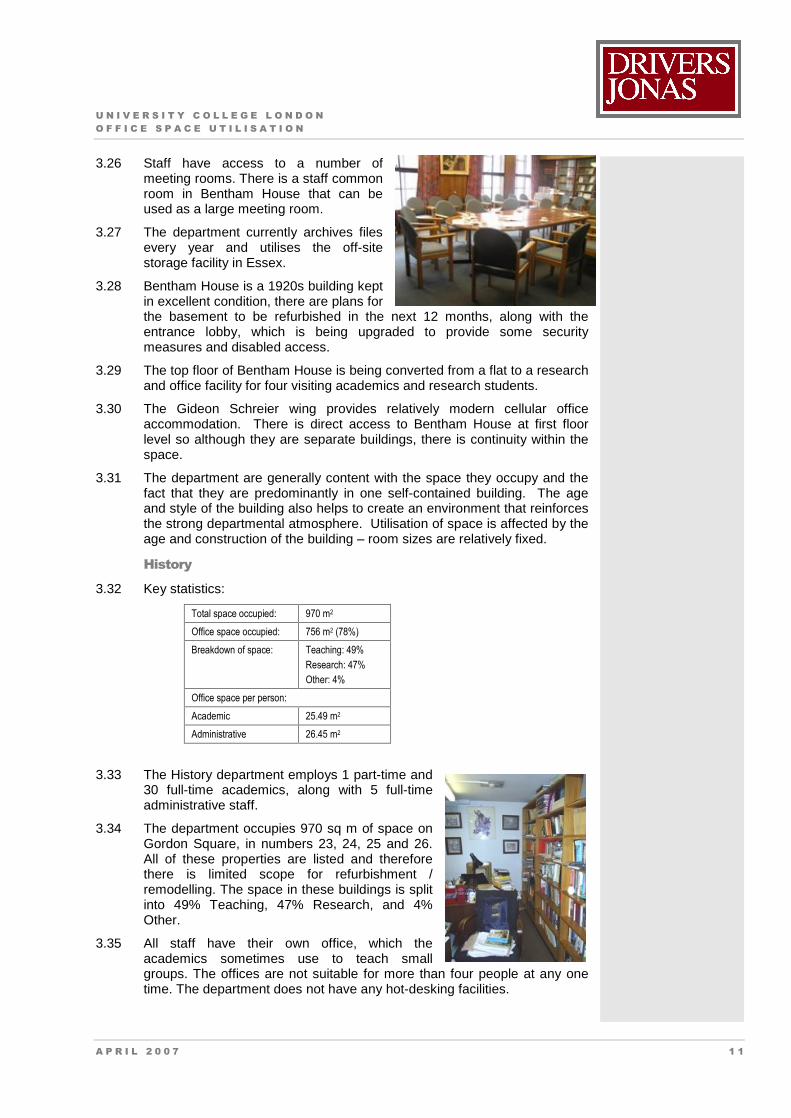
3.24 Of this, the office accommodation comprises 1,798 sq m, in which all academic staff have their own office. Larger offices are used for additional teaching space or for meetings. The administrative staff tend to share an office with one other.
3.25 Visiting academics are allocated hot desk offices and cluster rooms. Research students (of which there are 25 this academic year) are allocated offices which accommodate 8-10 people.
U N I V E R S I T Y C O L L E G E L O N D O N O F F I C E S P A C E U T I L I S A T I O N
A P R I L 2 0 0 7 1 1
3.26 Staff have access to a number of meeting rooms. There is a staff common room in Bentham House that can be used as a large meeting room.
3.27 The department currently archives files every year and utilises the off-site storage facility in Essex.
3.28 Bentham House is a 1920s building kept in excellent condition, there are plans for the basement to be refurbished in the next 12 months, along with the entrance lobby, which is being upgraded to provide some security measures and disabled access.
3.29 The top floor of Bentham House is being converted from a flat to a research and office facility for four visiting academics and research students.
3.30 The Gideon Schreier wing provides relatively modern cellular office accommodation. There is direct access to Bentham House at first floor level so although they are separate buildings, there is continuity within the space.
3.31 The department are generally content with the space they occupy and the fact that they are predominantly in one self-contained building. The age and style of the building also helps to create an environment that reinforces the strong departmental atmosphere. Utilisation of space is affected by the age and construction of the building � room sizes are relatively fixed.
History
3.32 Key statistics:
Total space occupied: 970 m2
Office space occupied: 756 m2 (78%)
Breakdown of space: Teaching: 49%
Research: 47%
Other: 4%
Office space per person:
Academic 25.49 m2
Administrative 26.45 m2
3.33 The History department employs 1 part-time and 30 full-time academics, along with 5 full-time administrative staff.
3.34 The department occupies 970 sq m of space on Gordon Square, in numbers 23, 24, 25 and 26. All of these properties are listed and therefore there is limited scope for refurbishment / remodelling. The space in these buildings is split into 49% Teaching, 47% Research, and 4% Other.
3.35 All staff have their own office, which the academics sometimes use to teach small groups. The offices are not suitable for more than four people at any one time. The department does not have any hot-desking facilities.
U N I V E R S I T Y C O L L E G E L O N D O N O F F I C E S P A C E U T I L I S A T I O N
A P R I L 2 0 0 7 1 2
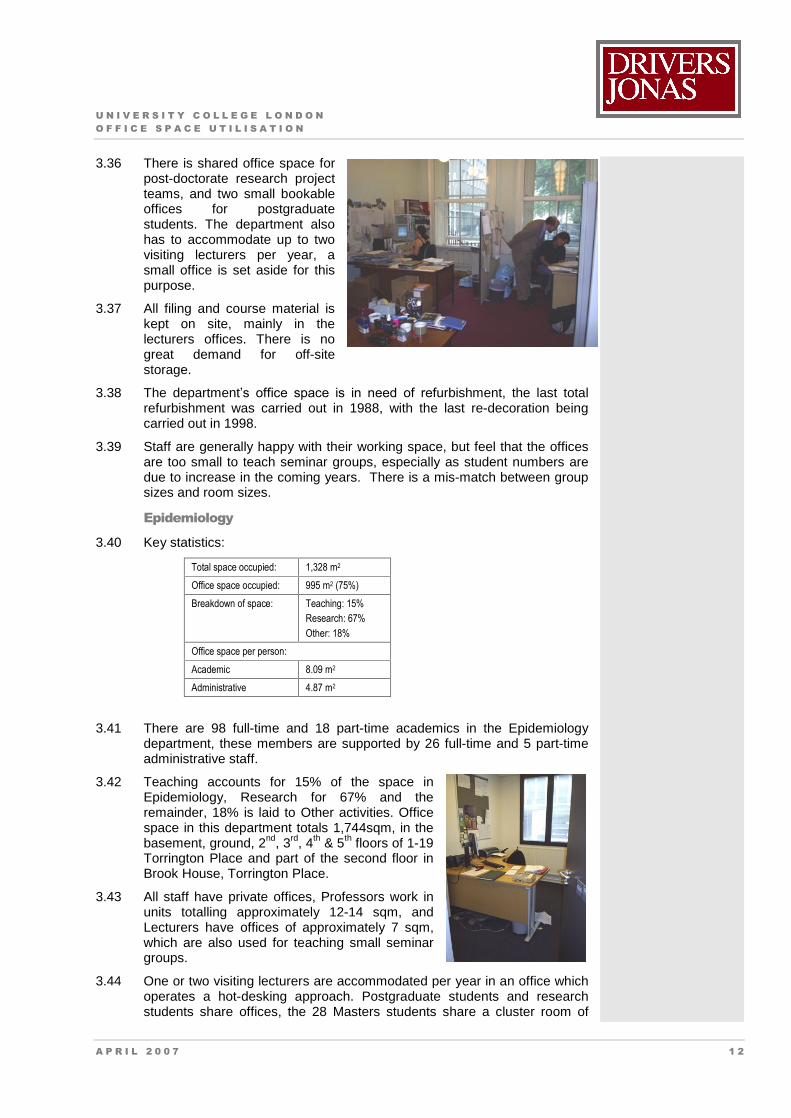
3.36 There is shared office space for post-doctorate research project teams, and two small bookable offices for postgraduate students. The department also has to accommodate up to two visiting lecturers per year, a small office is set aside for this purpose.
3.37 All filing and course material is kept on site, mainly in the lecturers offices. There is no great demand for off-site storage.
3.38 The department�s office space is in need of refurbishment, the last total refurbishment was carried out in 1988, with the last re-decoration being carried out in 1998.
3.39 Staff are generally happy with their working space, but feel that the offices are too small to teach seminar groups, especially as student numbers are due to increase in the coming years. There is a mis-match between group sizes and room sizes.
Epidemiology
3.40 Key statistics:
Total space occupied: 1,328 m2
Office space occupied: 995 m2 (75%)
Breakdown of space: Teaching: 15%
Research: 67%
Other: 18%
Office space per person:
Academic 8.09 m2
Administrative 4.87 m2
3.41 There are 98 full-time and 18 part-time academics in the Epidemiology department, these members are supported by 26 full-time and 5 part-time administrative staff.
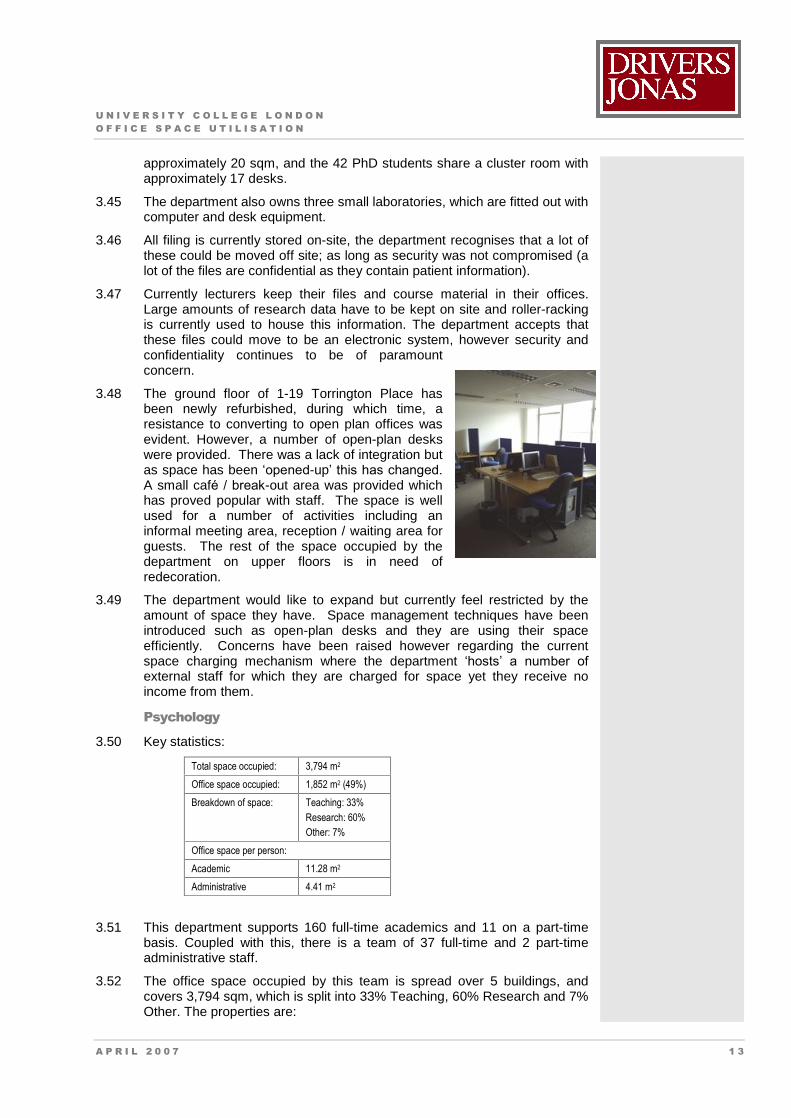
3.42 Teaching accounts for 15% of the space in Epidemiology, Research for 67% and the remainder, 18% is laid to Other activities. Office space in this department totals 1,744sqm, in the basement, ground, 2nd, 3rd, 4th & 5th floors of 1-19 Torrington Place and part of the second floor in Brook House, Torrington Place.
3.43 All staff have private offices, Professors work in units totalling approximately 12-14 sqm, and Lecturers have offices of approximately 7 sqm, which are also used for teaching small seminar groups.
3.44 One or two visiting lecturers are accommodated per year in an office which operates a hot-desking approach. Postgraduate students and research students share offices, the 28 Masters students share a cluster room of
U N I V E R S I T Y C O L L E G E L O N D O N O F F I C E S P A C E U T I L I S A T I O N
A P R I L 2 0 0 7 1 3
approximately 20 sqm, and the 42 PhD students share a cluster room with approximately 17 desks.
3.45 The department also owns three small laboratories, which are fitted out with computer and desk equipment.
3.46 All filing is currently stored on-site, the department recognises that a lot of these could be moved off site; as long as security was not compromised (a lot of the files are confidential as they contain patient information).
3.47 Currently lecturers keep their files and course material in their offices. Large amounts of research data have to be kept on site and roller-racking is currently used to house this information. The department accepts that these files could move to be an electronic system, however security and confidentiality continues to be of paramount concern.
3.48 The ground floor of 1-19 Torrington Place has been newly refurbished, during which time, a resistance to converting to open plan offices was evident. However, a number of open-plan desks were provided. There was a lack of integration but as space has been �opened-up� this has changed.
A small café / break-out area was provided which has proved popular with staff. The space is well used for a number of activities including an informal meeting area, reception / waiting area for guests. The rest of the space occupied by the department on upper floors is in need of redecoration.
3.49 The department would like to expand but currently feel restricted by the amount of space they have. Space management techniques have been introduced such as open-plan desks and they are using their space efficiently. Concerns have been raised however regarding the current space charging mechanism where the department �hosts� a number of
external staff for which they are charged for space yet they receive no income from them.
Psychology
3.50 Key statistics:
Total space occupied: 3,794 m2
Office space occupied: 1,852 m2 (49%)
Breakdown of space: Teaching: 33%
Research: 60%
Other: 7%
Office space per person:
Academic 11.28 m2
Administrative 4.41 m2
3.51 This department supports 160 full-time academics and 11 on a part-time basis. Coupled with this, there is a team of 37 full-time and 2 part-time administrative staff.
3.52 The office space occupied by this team is spread over 5 buildings, and covers 3,794 sqm, which is split into 33% Teaching, 60% Research and 7% Other. The properties are:
U N I V E R S I T Y C O L L E G E L O N D O N O F F I C E S P A C E U T I L I S A T I O N
A P R I L 2 0 0 7 1 4
1-19 Torrington Place � 3rd, 4th, & 5th floors.
8 Hunter Street � 2nd floor.
Remax House � Accommodation for 15 staff, this is rented space, which expires in 2/3 years. At this point, space is then to be taken up in the new engineering building.
Alexandra House � Accommodates 100 people.
26 Bedford Way
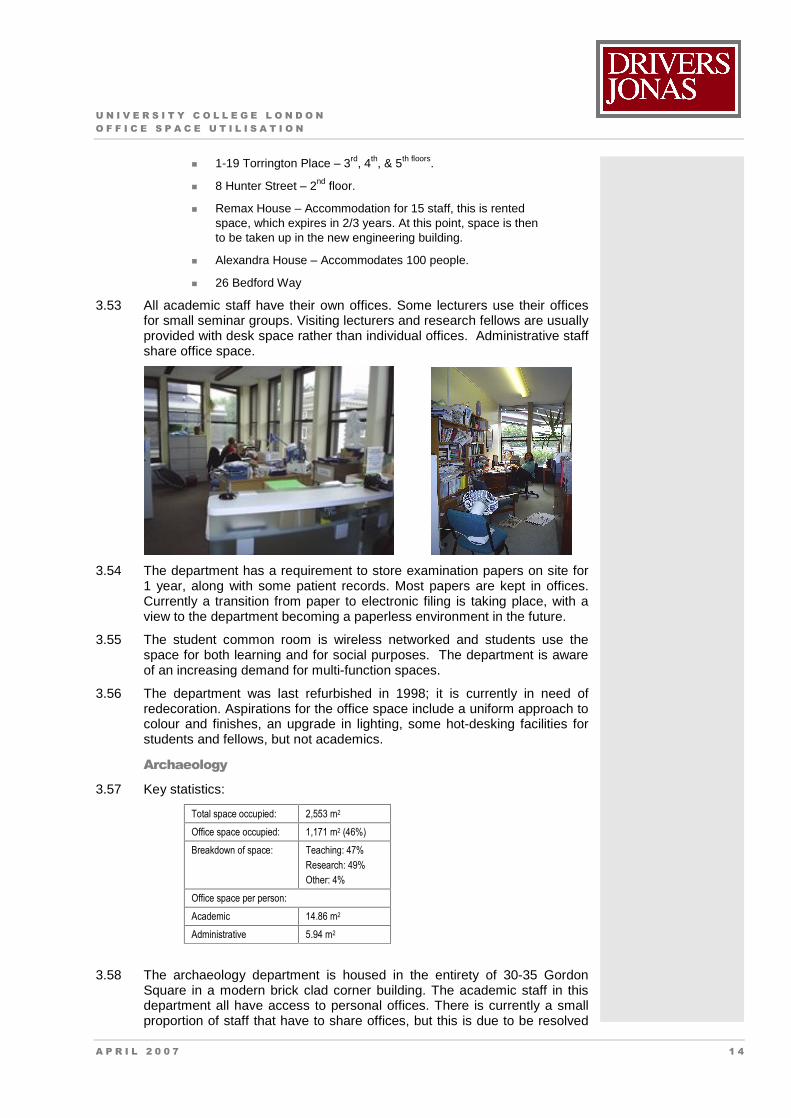
3.53 All academic staff have their own offices. Some lecturers use their offices for small seminar groups. Visiting lecturers and research fellows are usually provided with desk space rather than individual offices. Administrative staff share office space.
3.54 The department has a requirement to store examination papers on site for 1 year, along with some patient records. Most papers are kept in offices. Currently a transition from paper to electronic filing is taking place, with a view to the department becoming a paperless environment in the future.
3.55 The student common room is wireless networked and students use the space for both learning and for social purposes. The department is aware of an increasing demand for multi-function spaces.
3.56 The department was last refurbished in 1998; it is currently in need of redecoration. Aspirations for the office space include a uniform approach to colour and finishes, an upgrade in lighting, some hot-desking facilities for students and fellows, but not academics.
Archaeology
3.57 Key statistics:
Total space occupied: 2,553 m2
Office space occupied: 1,171 m2 (46%)
Breakdown of space: Teaching: 47%
Research: 49%
Other: 4%
Office space per person:
Academic 14.86 m2
Administrative 5.94 m2
3.58 The archaeology department is housed in the entirety of 30-35 Gordon Square in a modern brick clad corner building. The academic staff in this department all have access to personal offices. There is currently a small proportion of staff that have to share offices, but this is due to be resolved
U N I V E R S I T Y C O L L E G E L O N D O N O F F I C E S P A C E U T I L I S A T I O N
A P R I L 2 0 0 7 1 5
by the end of the academic year. 47% of space in this department is used for Teaching, 49% for Research and 4% for Other activities.
3.59 Sharing office space and the concept of hot-desking are very unpopular practices within the department; as a result, there are no hot-desking facilities. Office space for administrative staff is shared between 2/3 members.
3.60 Research fellows, post doctorate students and Masters students are provided with shared offices or cluster rooms. Part-time staff are encouraged to share office space.
3.61 Offices are used to stage meetings, as are teaching rooms and the staff common room.
3.62 Due to the nature of the teaching and research within the archaeology department, lack of storage space is an issue. Most academics store files and items in their offices, and there is an artefact storage facility in the basement of the building. There are currently no environment-controlled stores in the building and the department would benefit from these. The department also uses the archiving facilities at the UCL warehouse in Essex, but they still feel overwhelmed by the amount of data and collections that need to be stored on site.
3.63 Wireless access to the Internet has been installed in the student common areas. This has led to a reduction of pressure on student cluster rooms, and could lead to more e-learning (and reduce pressure on using offices as teaching rooms), although the department expresses some concerns about the benefits of such a teaching tool.
Conclusions 3.64 The utilisation of office space across the sample departments varies
considerably. Most academic departments provide single offices for full-time academic members of staff and shared offices for part-time staff or research students. The building type and age has a significant impact upon the utilisation of space and the ability to change. For example, the History department occupies a number of period properties that were originally residential properties. The room sizes and shapes are such that it is difficult to accommodate more than one member of staff yet the space is generous. In addition, the buildings are listed which means the ability to remodel space within the buildings is limited. Where more modern accommodation is occupied the utilisation tends to be higher.
3.65 The type of space occupied by the majority of departments is split fairly evenly between teaching and research. However, some departments, such as Epidemiology, occupy more space for research purposes.
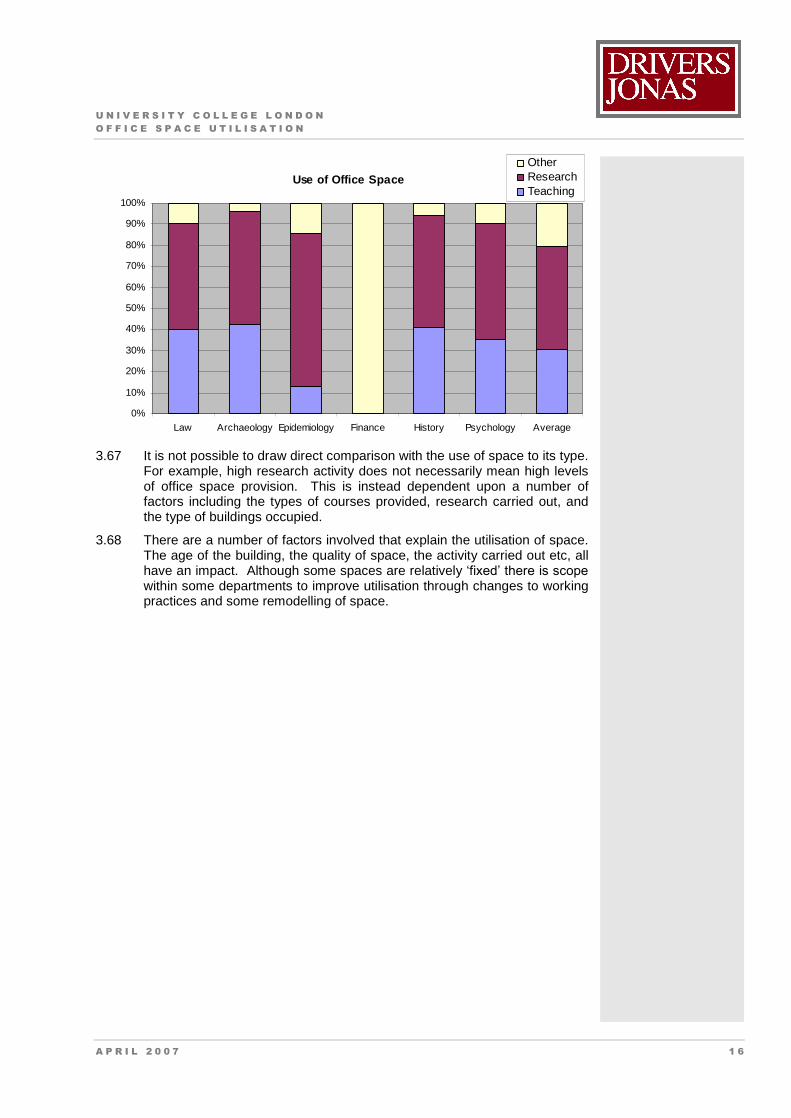
3.66 As the graph below shows, offices tend to be used for a mix of teaching and research purposes. On average however, offices are used predominantly for research activity.
U N I V E R S I T Y C O L L E G E L O N D O N O F F I C E S P A C E U T I L I S A T I O N
A P R I L 2 0 0 7 1 6
Use of Office Space
0%
10%
20%
30%
40%
50%
60%
70%
80%
90%
100%
Law Archaeology Epidemiology Finance History Psychology Average
OtherResearchTeaching
3.67 It is not possible to draw direct comparison with the use of space to its type. For example, high research activity does not necessarily mean high levels of office space provision. This is instead dependent upon a number of factors including the types of courses provided, research carried out, and the type of buildings occupied.
3.68 There are a number of factors involved that explain the utilisation of space. The age of the building, the quality of space, the activity carried out etc, all have an impact. Although some spaces are relatively �fixed� there is scope
within some departments to improve utilisation through changes to working practices and some remodelling of space.
U N I V E R S I T Y C O L L E G E L O N D O N O F F I C E S P A C E U T I L I S A T I O N
A P R I L 2 0 0 7 1 7
4. Space Charging
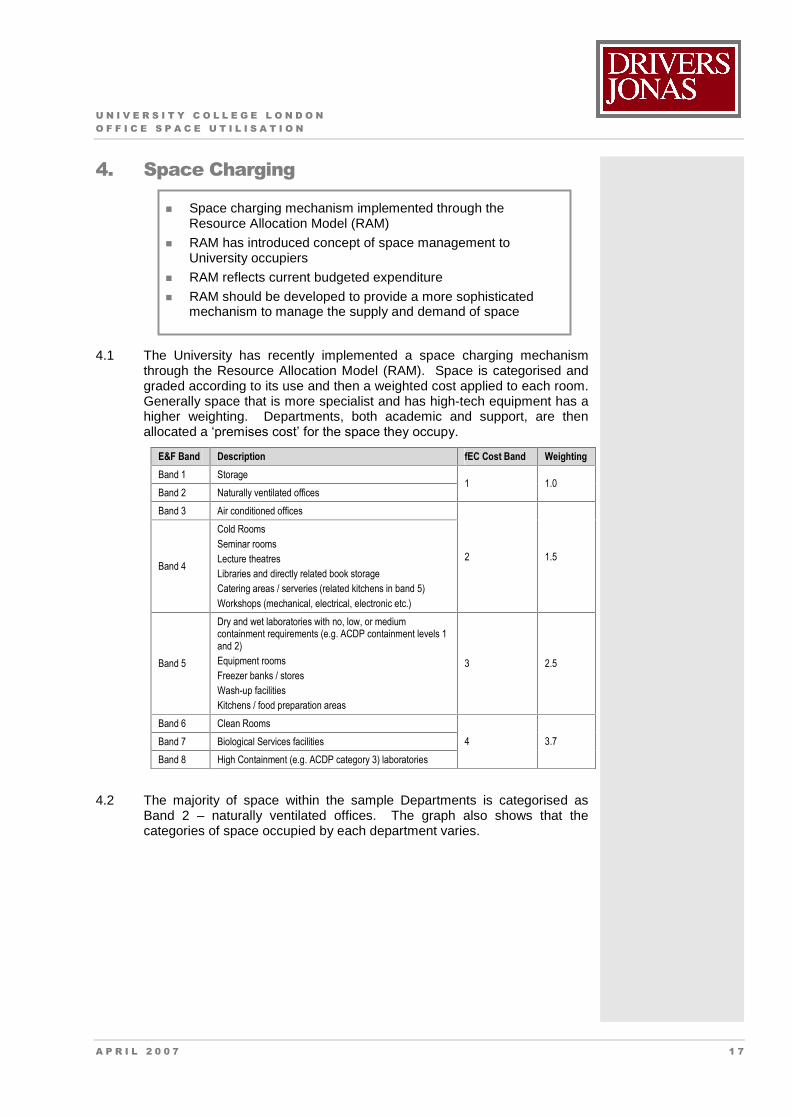
4.1 The University has recently implemented a space charging mechanism through the Resource Allocation Model (RAM). Space is categorised and graded according to its use and then a weighted cost applied to each room. Generally space that is more specialist and has high-tech equipment has a higher weighting. Departments, both academic and support, are then allocated a �premises cost� for the space they occupy.
E&F Band Description fEC Cost Band Weighting
Band 1 Storage
Band 2 Naturally ventilated offices 1 1.0
Band 3 Air conditioned offices
Band 4
Cold Rooms
Seminar rooms
Lecture theatres
Libraries and directly related book storage
Catering areas / serveries (related kitchens in band 5)
Workshops (mechanical, electrical, electronic etc.)
2 1.5
Band 5
Dry and wet laboratories with no, low, or medium
containment requirements (e.g. ACDP containment levels 1
and 2)
Equipment rooms
Freezer banks / stores
Wash-up facilities
Kitchens / food preparation areas
3 2.5
Band 6 Clean Rooms
Band 7 Biological Services facilities
Band 8 High Containment (e.g. ACDP category 3) laboratories
4 3.7
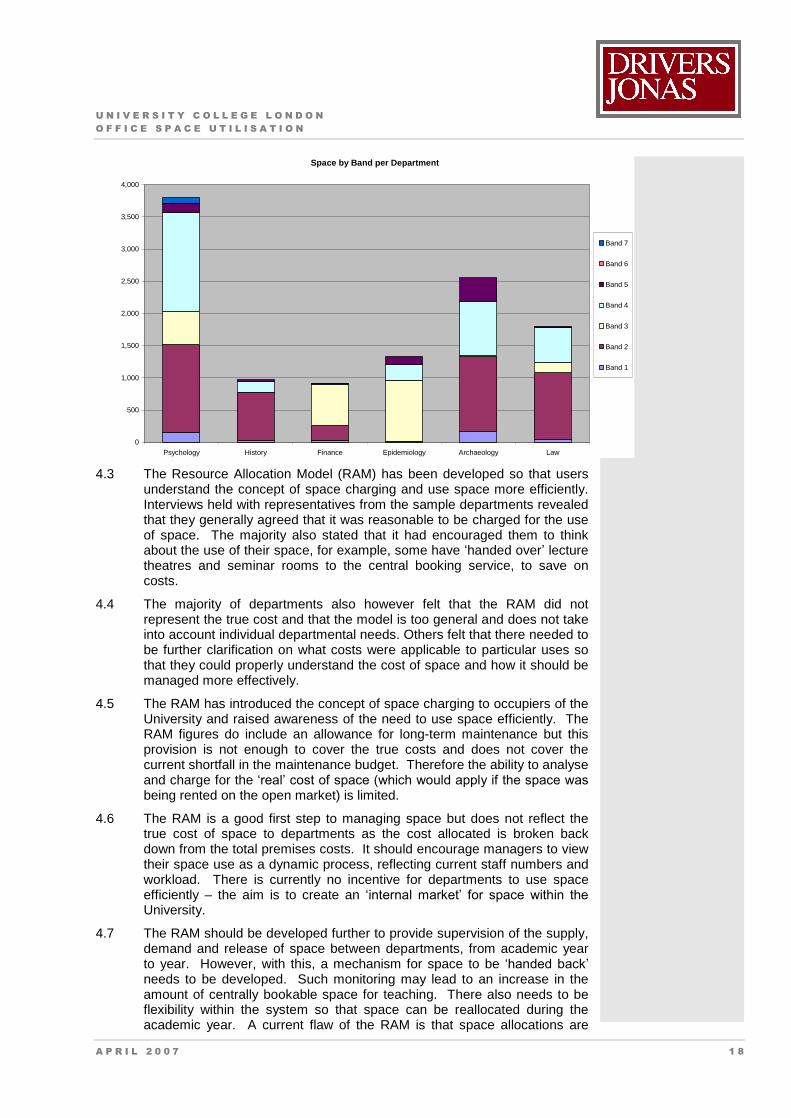
4.2 The majority of space within the sample Departments is categorised as Band 2 � naturally ventilated offices. The graph also shows that the categories of space occupied by each department varies.
Space charging mechanism implemented through the Resource Allocation Model (RAM)
RAM has introduced concept of space management to University occupiers
RAM reflects current budgeted expenditure
RAM should be developed to provide a more sophisticated mechanism to manage the supply and demand of space
U N I V E R S I T Y C O L L E G E L O N D O N O F F I C E S P A C E U T I L I S A T I O N
A P R I L 2 0 0 7 1 8
Space by Band per Department
0
500
1,000
1,500
2,000
2,500
3,000
3,500
4,000
Psychology History Finance Epidemiology Archaeology Law
Band 7
Band 6
Band 5
Band 4
Band 3
Band 2
Band 1
4.3 The Resource Allocation Model (RAM) has been developed so that users understand the concept of space charging and use space more efficiently. Interviews held with representatives from the sample departments revealed that they generally agreed that it was reasonable to be charged for the use of space. The majority also stated that it had encouraged them to think about the use of their space, for example, some have �handed over� lecture theatres and seminar rooms to the central booking service, to save on costs.
4.4 The majority of departments also however felt that the RAM did not represent the true cost and that the model is too general and does not take into account individual departmental needs. Others felt that there needed to be further clarification on what costs were applicable to particular uses so that they could properly understand the cost of space and how it should be managed more effectively.
4.5 The RAM has introduced the concept of space charging to occupiers of the University and raised awareness of the need to use space efficiently. The RAM figures do include an allowance for long-term maintenance but this provision is not enough to cover the true costs and does not cover the current shortfall in the maintenance budget. Therefore the ability to analyse and charge for the �real� cost of space (which would apply if the space was
being rented on the open market) is limited.
4.6 The RAM is a good first step to managing space but does not reflect the true cost of space to departments as the cost allocated is broken back down from the total premises costs. It should encourage managers to view their space use as a dynamic process, reflecting current staff numbers and workload. There is currently no incentive for departments to use space efficiently � the aim is to create an �internal market� for space within the
University.
4.7 The RAM should be developed further to provide supervision of the supply, demand and release of space between departments, from academic year to year. However, with this, a mechanism for space to be �handed back�
needs to be developed. Such monitoring may lead to an increase in the amount of centrally bookable space for teaching. There also needs to be flexibility within the system so that space can be reallocated during the academic year. A current flaw of the RAM is that space allocations are
U N I V E R S I T Y C O L L E G E L O N D O N O F F I C E S P A C E U T I L I S A T I O N
A P R I L 2 0 0 7 1 9
made in June whereas student numbers, and therefore demand for space, are not determined until September. In addition, student numbers are subject to further change during the first few months of the academic year.
4.8 The RAM has raised awareness of the importance of space management but its impact may not be evident immediately � it needs time to �settle�. It is suggested however that further work is carried out by UCL Finance and Estates teams, with Drivers Jonas support as appropriate, to review the RAM in more detail and to devise a mechanism to effectively charge for space at the University. The following objectives should be considered:
to include the real cost of space
provision for long-term maintenance
flexibility in the allocation of space
incentivise users to use space efficiently
categorisation of space according to use and suitability (to take into account age and style of building etc.)
costs weighted according to type of space, quality and suitability
determine appropriate cost centres
determine appropriate �share� of centrally pooled space
system to be calibrated to achieve the target estate size
appropriate use of benchmarking to determine space �need�
potential of charge to include three cost elements � annual estate operating costs; maintenance; depreciation
annual review
clear management structure and guidelines for users
clear rules for relinquishing space
measures in place to deal with relinquished space that may be difficult to redeploy
clear procedures to decide what management action should ensue if departments are in deficit
mechanism for accumulating funds for estate rationalisation / relocation / improvement works, once sufficient �returned
space� has been accumulated
U N I V E R S I T Y C O L L E G E L O N D O N O F F I C E S P A C E U T I L I S A T I O N
A P R I L 2 0 0 7 2 0
5. Case Studies 5.1 This section looks at best practice models developed and utilised by other
HE institutions. The case studies of Newcastle University and a number of American Institutions represent some of the most successful space management mechanisms in the industry. This section also includes high level analysis of the way different management styles within institutions impact upon the success of these types of models.
Newcastle University 5.2 Newcastle University undertook research into the most efficient ways to use
space and the most efficient way to create a space management policy. The subsequent report states that the prerequisites for increased efficiency are:
High level data analysis
A high level space management champion within the organisation, who is willing to progress change over a protracted period of time.
5.3 In order to appoint a �space management champion�, it is important to
identify and/or model the management style of the institution, so that effective tools/protocol can be set up. There are four main roles managers can take.
Tight Ship: Manager as operational director
Portfolio: Manager as investor
Tradition: Manager as primus inter pares (�first among his/her equals�)
Federation: Manager as steering core
5.4 Tight ship management includes a top-down approach to performance monitoring and financial control, but represents a lack of connectivity between departments and schools. Portfolio management structures base themselves on a high level of control on finances and performance monitoring, but a higher level of cohesion and information sharing between departments.
5.5 The traditional manager loosely controls finance and monitors performance, and departments experience a low level of connectivity with other areas within the institution. If an institution is run as a federation, there is a low level of financial control and performance scrutinisation, but the departments experience a high level of unity.
5.6 The report states that as well as defining a managerial style, useful guidelines include transparency of space use data, central timetabling, space allocation per person (depending on position) and taking into account who the user is and what sort of space they need.
5.7 Newcastle University also worked with HEFCE on a Good Management Practice Project which produced a set of guidelines that could be used as a basis for policy in other institutions and organisations. The guidelines are set out below:
Identify objectives and constraints of the Institution.
Define/construct management style.
Carry out comprehensive data collection and analysis of the entire estate.
Centrally timetable as many teaching rooms as possible
U N I V E R S I T Y C O L L E G E L O N D O N O F F I C E S P A C E U T I L I S A T I O N
A P R I L 2 0 0 7 2 1
Carry out utilisation survey�s to establish and monitor space efficiency.
Space norms and standards should be tailored to the mission of the institution, reflecting its management style and projecting its chosen image.
Space charging should display the cost of the facility to the user, and demonstrate how to use space efficiently.
Performance indicators should present efficiency between departments, based on space/students, space/staff and cost/space ratios.
New ways of using space should be considered in light of any new working practices that take place (hot desking, open plan working environments, advancements in IT etc).
Change management if necessary. The purpose of space management is to make staff aware of the costs of the space they occupy. If this message is not being conveyed, the space management model should be revised to create greater staff involvement at all levels.
Bradford University 5.8 The University is committed to a programme of space rationalisation and
improvements to space utilisation to reduce space per FTE towards sector norms. In addition, the Estates & Facilities department will implement the University�s Estates Vision including major refurbishments of the estate to
ensure they continue to provide a flexible high quality space fit for a modern teaching, learning and research institution.
5.9 The University maintains an annual plan of targets covering space rationalisation, utilisation, reallocation, remodelling and development, focussing on achieving an efficient estate. A space management system is being developed to include the following:
Space Guidelines
o Reference to national norms.
o Legislative compliance through strategic planning.
o Support school branding the context of Institutional guidelines on décor,
materials etc.
o Encourage modern methods of working for staff and students.
o Give firm guidance on appropriate allocation of space.
o Take opportunities to develop social and communal space.
Space database
Space Costing
o Make transparent the costs of academic schools.
o Enable space allocation and use decisions to take into account what is feasible and affordable for the institution.
o Improve corporate planning through more informed costs.
o Enable academic schools to make informed decisions about space management.
GTA
o Match provision to changing need.
U N I V E R S I T Y C O L L E G E L O N D O N O F F I C E S P A C E U T I L I S A T I O N
A P R I L 2 0 0 7 2 2
o Establish reward mechanisms to encourage fair use of provision.
Centralised timetabling
o Encourage the use of technology based solutions.
o Move towards an appropriate, comprehensive and all encompassing timetabling model that includes departmentally held general and specialist teaching areas.
Room Bookings
Forecasting Space Needs
o Annually review, in consultation with Dean�s, of each academic schools
space requirement for incorporation within the Estates Strategy and Capital Development Plan.
o Space utilisation survey to identify space surplus and shortfalls.
o Space balance sheets.
Space Management Review
o Conduct an annual review of space management and formulate recommendations and updated space management targets and actions for University discussion.
5.10 Each academic school is responsible for providing the Estates & Facilities department with accurate and consistent occupancy data. In addition, they must inform the department of changing space needs.
5.11 The University of Bradford has progressed its thinking on space management to develop a sustainability programme which aims to deliver:
Sustainable education
Healthy environment
Thriving economy
Social well-being
5.12 The University aims to achieve these aims through ensuring all new buildings are representative of best practice in environmentally friendly design, are costed on a �whole life� basis and achieve an �excellent�
BREEAM rating. The University has also committed funds for the refurbishment of several 1960�s buildings, paying particular attention to
insulation and emissions reduction.
5.13 Through creating a thriving economy, the University seeks to �create
affordable accommodation and an attractive environment to improve our recruitment and retention of students and staff�.
Stanford University, California 5.14 Stanford University suggests that space planning should be based on the
following goals:
Ensure space is built, renovated and allocated in an equitable fashion across the campus.
Practice consistent allocations renovations and building.
Utilise and plan space efficiently.
Ensure the space plan has built in flexibility to deal with, and anticipate, changes in the future.
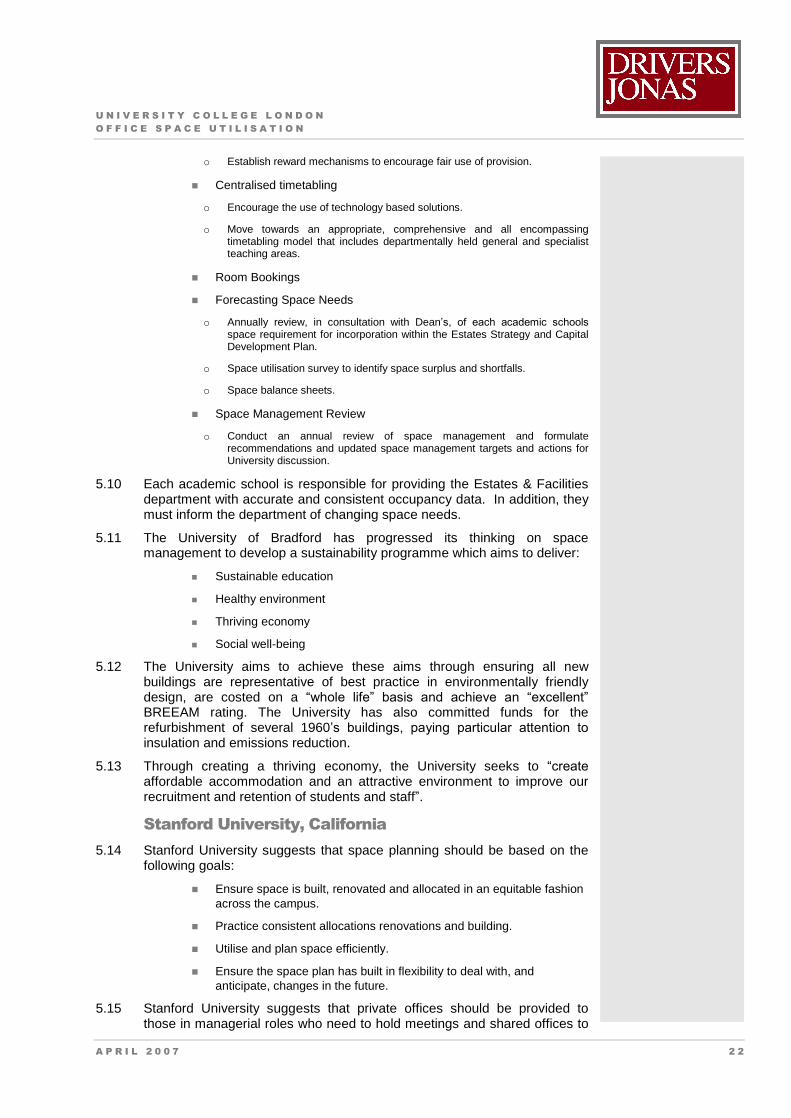
5.15 Stanford University suggests that private offices should be provided to those in managerial roles who need to hold meetings and shared offices to
U N I V E R S I T Y C O L L E G E L O N D O N O F F I C E S P A C E U T I L I S A T I O N
A P R I L 2 0 0 7 2 3
be given to staff that require quiet surroundings to read or write, or those working in teams. Stanford suggests the following space allocations:
Role Uses Suggested sq.ft.
Deans and Vice Presidents Should have private individual offices, with a
desk, filing, book shelves and a seating area for
5-6 people
22 m2 net
(240 sq ft net)
Full-time academics Should have private offices with a desk, filing
and a meeting area for 2-3 people.
It is suggested that management allows offices
to be larger or smaller in special circumstances,
such as accessibility, unusual layout or
configuration, and a varying need for meeting
space.
15 m2 net
(160 sq ft net)
Visiting academics, emeritus
staff and researchers
Private offices or alternatively an open plan
office
15 m2 � 7.5 m2 net
(160 sq ft net for 2 occupants or 80 sq ft
net for each user)
Administrative staff Open plan offices with individual cubicle units 7.5 m2, reduced to 4 m2 net
(averaging 80 sq ft net per person �
can be reduced to 45 sq ft per person if
the particular department is short on
space, or if the user has reduced space
needs)
Students Should be allocated in cubicles or shared
offices/cluster rooms.
3 m2 � 6 m2 net
(30-64 sq ft net each)
5.16 Many of the practices described are echoed by mechanisms in place in GeorgeTown University and Middle Tennessee State University.
5.17 At Middle Tennessee State University, the management recognises that office space is a rare and valued commodity within the Institution. It has set out the following hierarchical principles in order to meet the University�s
goals:
Full-time academic staff should receive an individual office.
Temporary full-time academic staff should receive an individual office after all needs of the full-time academic staff across the campus have been met.
Post-retirement, part-time academic staff, such as adjuncts, graduate assistants, etc., should only be provided an individual office after the office needs of all full-time staff across campus have been met. The University encourages these faculty and assistants to share offices.
5.18 It should be borne in mind that the American corporate office model is generally more inclined to individual or shared offices than in the UK, when open-plan is becoming the norm, even for top management. In the UK, managers increasingly do not have individual offices and this is complemented by the increase in the use of break-out areas, bookable and non-bookable meeting rooms and semi-social meeting areas, such as coffee shops. This is echoed in the public sector where recent design guidance for the Police promotes open plan layouts and even top ranking officers share space with everyone else.
U N I V E R S I T Y C O L L E G E L O N D O N O F F I C E S P A C E U T I L I S A T I O N
A P R I L 2 0 0 7 2 4
6. Other Sector Experience 6.1 Space management and workplace environment is an important business
objective across many other sectors. The government has recognised that the work environment is no longer viewed as a passive overhead but as a powerful and integral aspect of government business, which, given the right attention and investment, can significantly enhance the effectiveness of public service delivery.
6.2 By effecting change to the workplace and working practices, a number of benefits are apparent:
Better space utilisation
Reduced paper storage
Reduced demand for desk and office space
Staff can achieve a better work / life balance
Attract, motivate and retain the best people for the job
Improved trust and empowerment of people
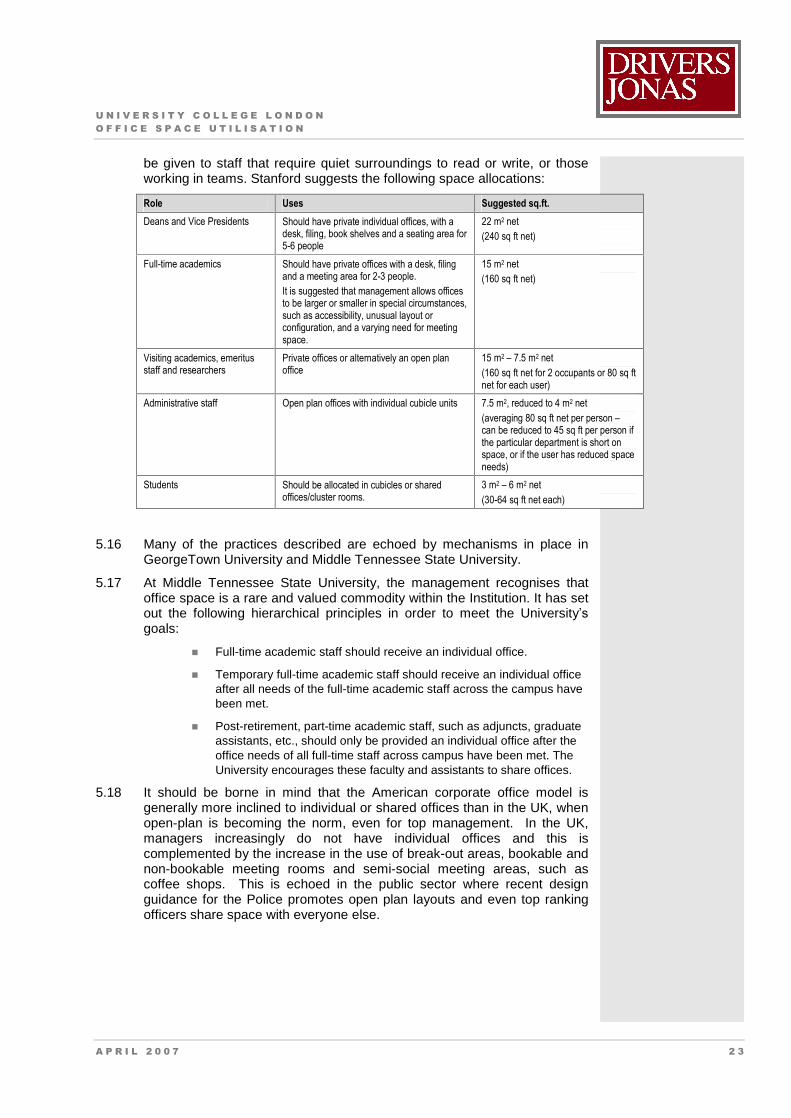
6.3 There is a recognised need for space efficiency and adopting space management techniques. In the space planning for a new Government Commission, workspace Types have been determined. These provide different spatial allowances to be allocated according to a member of staff�s
function rather than grade. In determining space need, these different work-style Types are applied to staff numbers and a further allowance for additional facilities such as meeting rooms and reception areas are provided.
Sector Averages 6.4 In a report by Gerald Eve commissioned by RICS on the use of offices by
UK businesses, benchmarking was identified as a key tool in effective asset management. It can serve as a reference point to establish an organisation�s relative performance and to help set strategies for office
occupation practices. A survey was carried out in 2001 that showed that the average amount of office space per employee was 16.3m2.
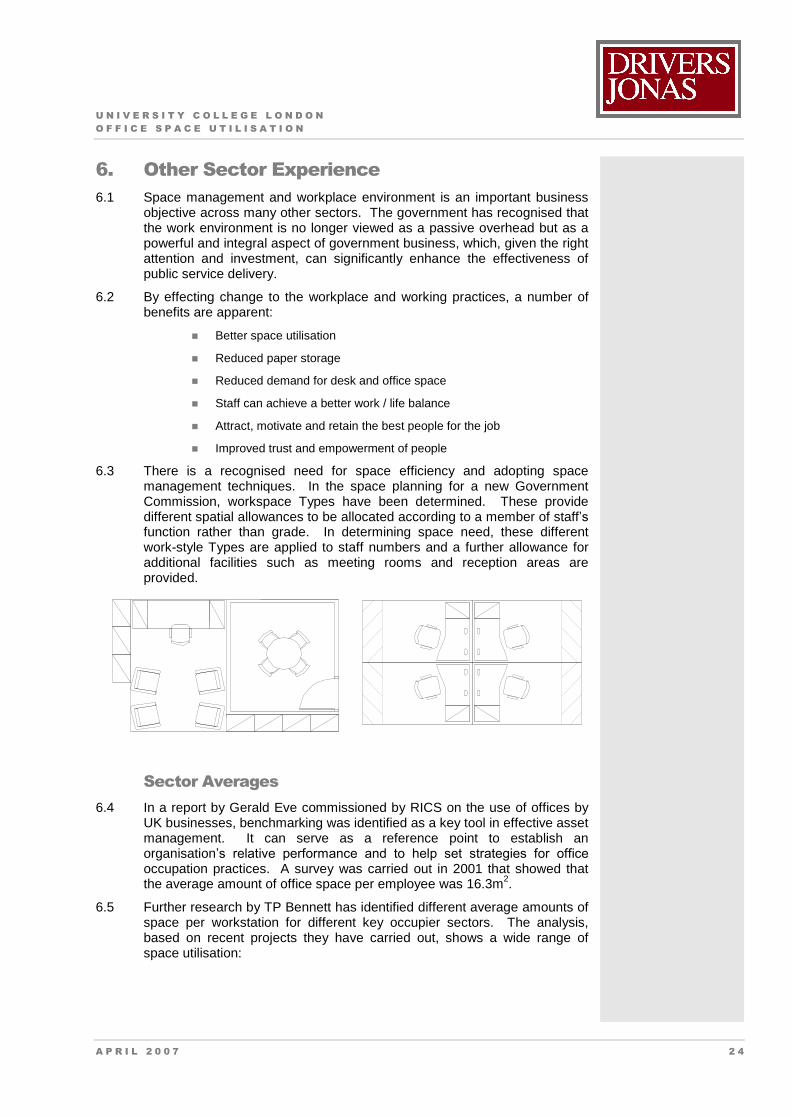
6.5 Further research by TP Bennett has identified different average amounts of space per workstation for different key occupier sectors. The analysis, based on recent projects they have carried out, shows a wide range of space utilisation:
20 Sqm
U N I V E R S I T Y C O L L E G E L O N D O N O F F I C E S P A C E U T I L I S A T I O N
A P R I L 2 0 0 7 2 5
Sector Space per Workstation
(sqm NIA)
Description of Space
Accountancy 9.0 Canary Wharf location, all open plan, relatively
compact sized workspace with some on floor storage.
Low support and restaurant facilities.
Charity 11.0 New office accommodation located in business park.
Majority open plan using efficient workplace standards
with department heads in cellular workspaces
IT / telecoms 12.0 Majority open plan, standard number of conference
and meeting facilities, low reception and support area
Banking and Finance 12.3 Relocation to Canary Wharf, high workplace
standards, relatively low client and shared facilities
Government 16.9 Central government authority, relocating from civil
service standards to all open plan, high number of
meeting rooms to allow this transition
Legal 20.6 Central London law firm, high number of conference
and client meeting rooms, restaurant and support
areas. Majority of occupants, fee earners in shared
offices, storage in offices and distributed open plan
Pharmaceuticals 21.9 Business park location, high proportion of cellular
workspace 35% for researched based work. High
number of meeting rooms and restaurant facilities
Note: These space allowances include an area which equates to a share of secondary circulation route (between workstations)
6.6 This research shows that the use of office space varies across different business sectors. Although it is difficult to apply a direct comparison with the education sector, similarities are apparent and these benchmarks should be considered accordingly.
Average space per Workstation
0.00
5.00
10.00
15.00
20.00
25.00
30.00
Law
Archa
eolog
y
Epidem
iolog
y
Financ
e
Histor
y
Psych
ology
Accou
ntan
cy
Charit
y IT
Financ
e
Gover
nmen
t
Lega
l
Pharm
aceu
ticals
average
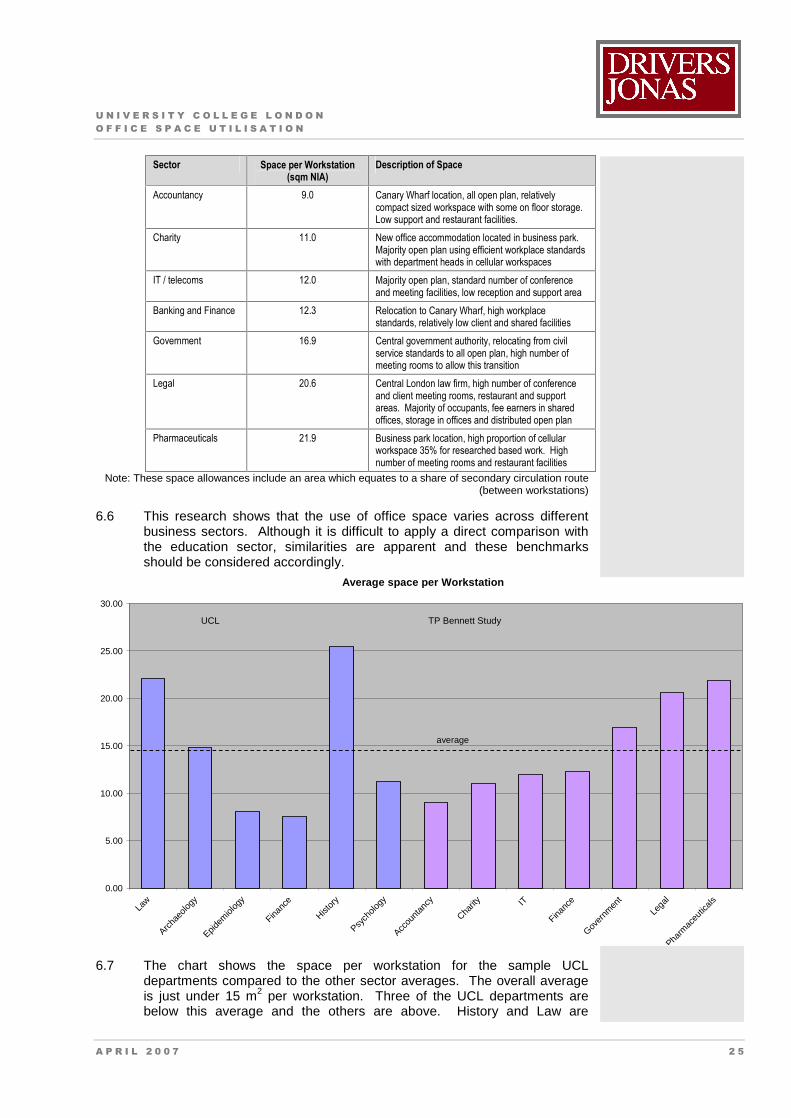
6.7 The chart shows the space per workstation for the sample UCL departments compared to the other sector averages. The overall average is just under 15 m2 per workstation. Three of the UCL departments are below this average and the others are above. History and Law are
UCL TP Bennett Study
U N I V E R S I T Y C O L L E G E L O N D O N O F F I C E S P A C E U T I L I S A T I O N
A P R I L 2 0 0 7 2 6
significantly above the average but this can in part be explained by the nature of the buildings they occupy � older buildings with fixed room sizes.
Flexible Working 6.8 The concept of flexible working is increasingly being adopted in the
commercial sector to help drive down occupancy costs, increase motivation, enhance retention and increase productivity. It involves a combined use of IT, real estate and soft factor resources to create more flexible, cost effective and efficient ways of working. Flexible working not only embodies new ways of working within the office but incorporates the ideas of providing staff with the necessary support to work from remote locations. The ultimate advantage of flexible working is that the organisation no longer has the expense of providing a workstation for each member of staff but may only need to provide say 4 workstations (or fewer) for every 5 staff.
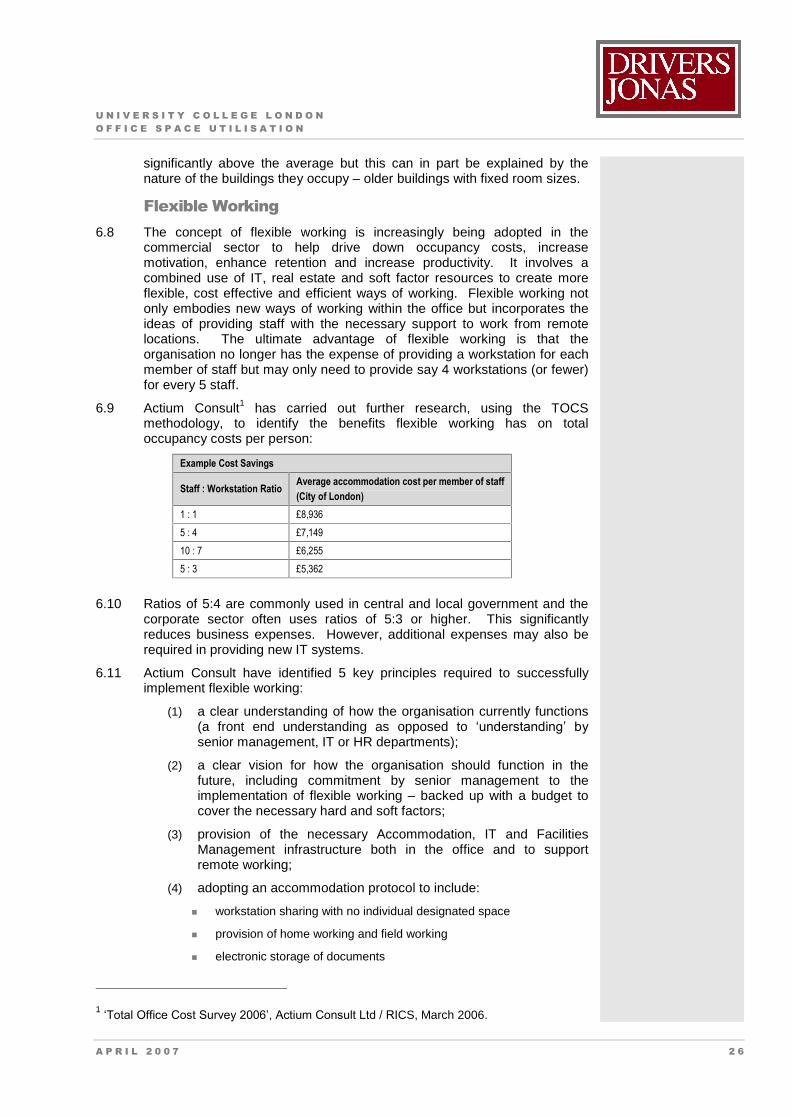
6.9 Actium Consult1 has carried out further research, using the TOCS methodology, to identify the benefits flexible working has on total occupancy costs per person:
Example Cost Savings
Staff : Workstation Ratio Average accommodation cost per member of staff
(City of London)
1 : 1 £8,936
5 : 4 £7,149
10 : 7 £6,255
5 : 3 £5,362
6.10 Ratios of 5:4 are commonly used in central and local government and the corporate sector often uses ratios of 5:3 or higher. This significantly reduces business expenses. However, additional expenses may also be required in providing new IT systems.
6.11 Actium Consult have identified 5 key principles required to successfully implement flexible working:
(1) a clear understanding of how the organisation currently functions (a front end understanding as opposed to �understanding� by
senior management, IT or HR departments);
(2) a clear vision for how the organisation should function in the future, including commitment by senior management to the implementation of flexible working � backed up with a budget to cover the necessary hard and soft factors;
(3) provision of the necessary Accommodation, IT and Facilities Management infrastructure both in the office and to support remote working;
(4) adopting an accommodation protocol to include:
workstation sharing with no individual designated space
provision of home working and field working
electronic storage of documents
1 �Total Office Cost Survey 2006�, Actium Consult Ltd / RICS, March 2006.
U N I V E R S I T Y C O L L E G E L O N D O N O F F I C E S P A C E U T I L I S A T I O N
A P R I L 2 0 0 7 2 7
provision of facilities to support touch-down working
(5) a carefully planned and managed process of change including:
an effective communication programme
involvement of staff at all levels
a training programme for staff and managers to cover new office practices, new management practices, and managing and working in dispersed teams; and
the change process being led and facilitated by a specialist in this field.
6.12 Experience from other sectors shows that space management is a key business objective. The cost of space is becoming increasingly important and therefore the need to use space efficiently. Businesses also recognise that space management and changing working practices can also have a positive impact upon the workforce � a good quality working environment can increase productivity and staff satisfaction.
U N I V E R S I T Y C O L L E G E L O N D O N O F F I C E S P A C E U T I L I S A T I O N
A P R I L 2 0 0 7 2 8
7. Conclusion & Recommendations 7.1 UCL controls its space management through the Estates Department,
which acts as a central body providing a blanket service to the faculties and departments. Requirements for new space currently have to be submitted to an Estates Committee. This procedure ensures that the requesting department has submitted reasons for the requirement and also satisfied the committee that they will be able to financially support the increase in space.
7.2 At present, most departments manage their own office space internally; however, it is possible that the same central booking mechanism could be used for office space, thus creating �hotel style� offices. This would further reduce the space used solely by one department, thus reducing space costs.
7.3 The University is currently encouraging departments to give up teaching space to a central booking service. This process removes (often large and expensive) facilities from the exclusive use of individual departments and places them in a central pool from which the whole campus can benefit.
7.4 The space management model appears to make departments consider the cost of their space, and some have given up teaching space to the central system. However, there seems to be a strong affront to giving up individual offices. This is an issue within the higher education sector as a whole with academia often being very traditional. Lecturers expect a single office and to be able to store their own books and papers in their office. However, modern working practices and the pressure of the cost of space, especially in central London, dictate a need for change. It is perhaps here that the RAM could be expanded to offer incentives which might encourage this behaviour.
7.5 Departments increasingly recognise the importance of using space efficiently but there is limited understanding of the RAM mechanism. In addition, as the RAM does not charge for the actual cost of space the incentive for departments to reduce the amount of space they occupy is also limited.
7.6 A more sophisticated approach to space management is needed that can handle the changing requirements of departments. Demand for space is difficult to predict. Student numbers change over the first few months of the academic year. In addition, staff numbers change with different research contracts. There is therefore need for flexibility in any space management / charging policy that may be adopted.
7.7 It is apparent that there are a number of different tools available for the management of space and improving space utilisation. Space utilisation can be increased by improving the efficiency of use of that space through encouraging flexible working practices. These could include measures such as:
Hot-desking / desk sharing
Flexible working patterns
Mobile technology
Home working
Open-plan offices
7.8 The University�s ICT infrastructure will be an integral part of any change in
working practices.
U N I V E R S I T Y C O L L E G E L O N D O N O F F I C E S P A C E U T I L I S A T I O N
A P R I L 2 0 0 7 2 9
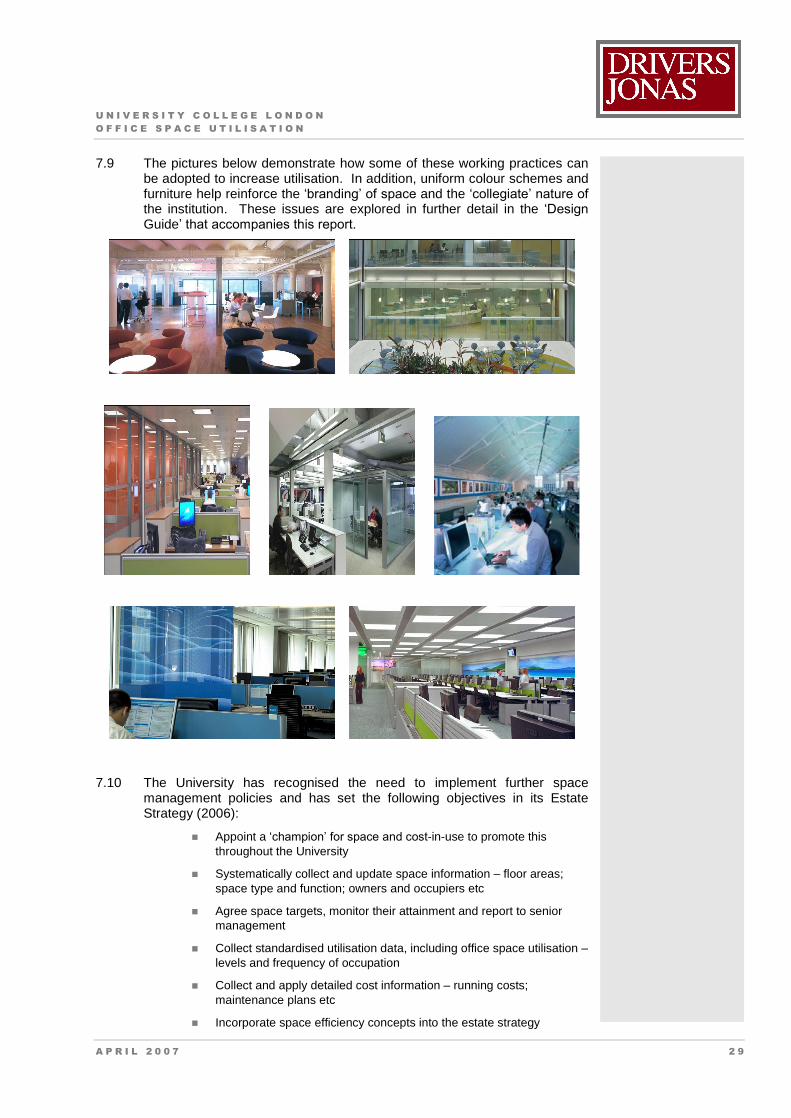
7.9 The pictures below demonstrate how some of these working practices can be adopted to increase utilisation. In addition, uniform colour schemes and furniture help reinforce the �branding� of space and the �collegiate� nature of
the institution. These issues are explored in further detail in the �Design
Guide� that accompanies this report.
7.10 The University has recognised the need to implement further space management policies and has set the following objectives in its Estate Strategy (2006):
Appoint a �champion� for space and cost-in-use to promote this throughout the University
Systematically collect and update space information � floor areas; space type and function; owners and occupiers etc
Agree space targets, monitor their attainment and report to senior management
Collect standardised utilisation data, including office space utilisation � levels and frequency of occupation
Collect and apply detailed cost information � running costs; maintenance plans etc
Incorporate space efficiency concepts into the estate strategy
U N I V E R S I T Y C O L L E G E L O N D O N O F F I C E S P A C E U T I L I S A T I O N
A P R I L 2 0 0 7 3 0
Incorporate requirements for space efficiency into project briefs, feasibility studies, option appraisals and design reviews
Develop and maintain a clear decision and communication structure for building projects, including user groups � adopting a framework for determining need and defining space
Promote the benefits of versatile spaces, with appropriate furniture, fit out and design � consistent across the estate as far as possible
Include space efficiency information in post-occupancy evaluations.
U N I V E R S I T Y C O L L E G E L O N D O N O F F I C E S P A C E U T I L I S A T I O N
A P R I L 2 0 0 7 3 1
8. References
Working without walls An Insight into the Transforming Government Workplace, Allen, Bell, Graham, Hardy and Swaffer (2004)
Design with Distinction The value of Good Building Design in Higher Education, CABE (March 2005)
Stanford University Space Planning Guidelines, Standford University (March 2003)
Space Charging Report, HEFCE / Bristol University
Review of Practice Report (2005/25), UK Higher Education Space Management Group (2005)
The Cost of Space Report (2005/26), UK Higher Education Space Management Group (2005)
Drivers of the Size of the HE Estate (2005/27), UK Higher Education Space Management Group (2005)
Promoting Space Efficiency in Building Design (2006/09), UK Higher Education Space Management Group (March 2006)
Space Planning Guidelines (Edition 2), Australasian Association of Higher Education Facilities Officers
Impact on Space of Future Changes in Higher Education (2006/10), UK Higher Education Space Management (March 2006)
Space Management in Higher Education Report of the findings of the Newcastle University Space Management Project, HEFCE / Newcastle University (2002)
Overcrowded, Under-utilised or Just Right? Office Space: How much is enough?, Gerald Eve (June 2001)
Total Office Cost Survey 2006, Actium Consult Ltd / RICS, (March 2006)
University College London
Office Space Utilisation � Part 3
August 2007
id51488250 pdfMachine by Broadgun Software - a great PDF writer! - a great PDF creator! - http://www.pdfmachine.com http://www.broadgun.com
U N I V E R S I T Y C O L L E G E L O N D O N O F F I C E S P A C E U T I L I S A T I O N
University College London
Office Space Utilisation
1. Introduction 1
2. UCL Space 2
Total Space 3 Office Space 4
3. Departmental Analysis 8
Statistical Sciences 8 Chemistry 9 History of Art 10 Electronic & Electrical Engineering 11 Information Systems 12 Physiology 13
4. Conclusion 15
U N I V E R S I T Y C O L L E G E L O N D O N O F F I C E S P A C E U T I L I S A T I O N - S T A G E 3
A U G U S T 2 0 0 7 1
1. Introduction 1.1 Drivers Jonas has been appointed by University College London
(UCL) to review the utilisation of office space across their estate.
1.2 Following the previous study finalised in April 2007, a sample of a further six Departments in the University were selected for analysis:
History of Art
Physiology
Statistical Sciences
Chemistry
Information Systems
Electronic & Electrical Engineering
1.3 These Departments were selected to broaden the base of the original study (April 2007) and to expand on the representative sample of the different disciplines at the University; the type of space occupied and the approach to space management. In contrast to the previous sample, the chosen departments are not largely �office-based� departments.
1.4 Data collection took the form of interviews between Drivers Jonas and the members of each department responsible for space management. The interviewees answered a number of questions that had been provided before the meeting (to provide interviewees time to discuss the questions with colleagues beforehand if they so wished).
1.5 The questions asked of departmental members focussed on the way space was allocated within the department, how space was used, and how it was managed.
U N I V E R S I T Y C O L L E G E L O N D O N O F F I C E S P A C E U T I L I S A T I O N - S T A G E 3
A U G U S T 2 0 0 7 2
2. UCL Space
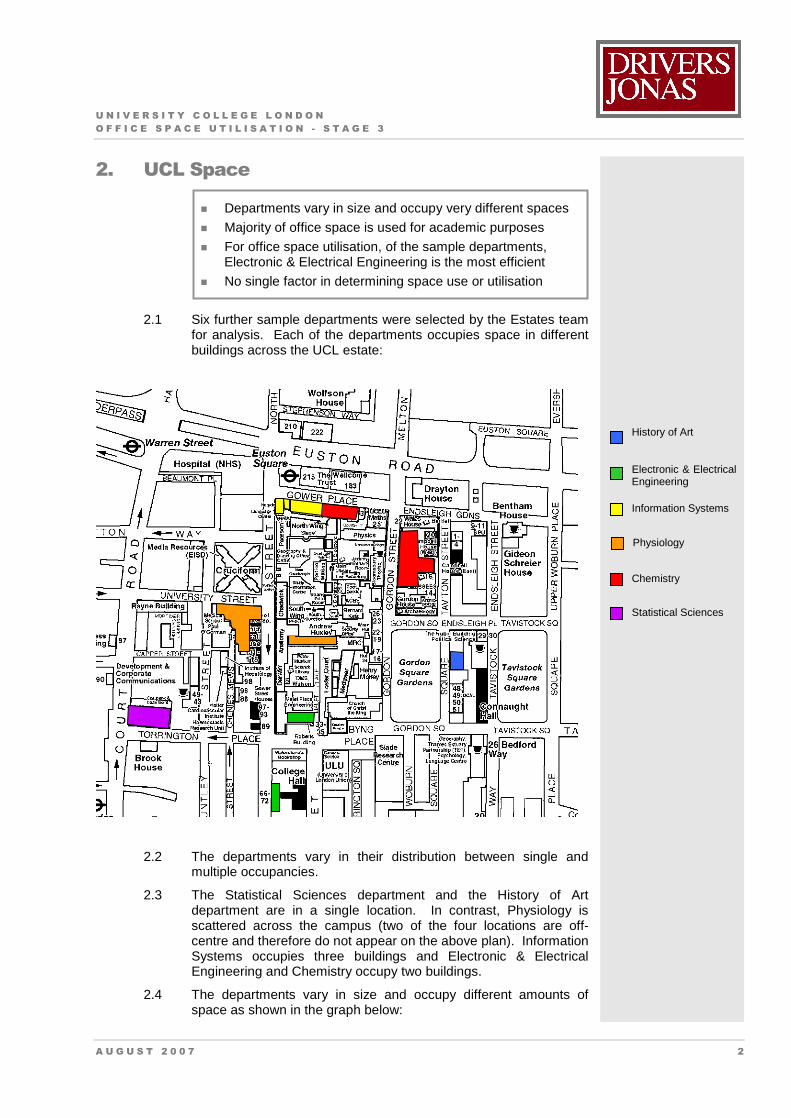
2.1 Six further sample departments were selected by the Estates team for analysis. Each of the departments occupies space in different buildings across the UCL estate:
2.2 The departments vary in their distribution between single and multiple occupancies.
2.3 The Statistical Sciences department and the History of Art department are in a single location. In contrast, Physiology is scattered across the campus (two of the four locations are off-centre and therefore do not appear on the above plan). Information Systems occupies three buildings and Electronic & Electrical Engineering and Chemistry occupy two buildings.
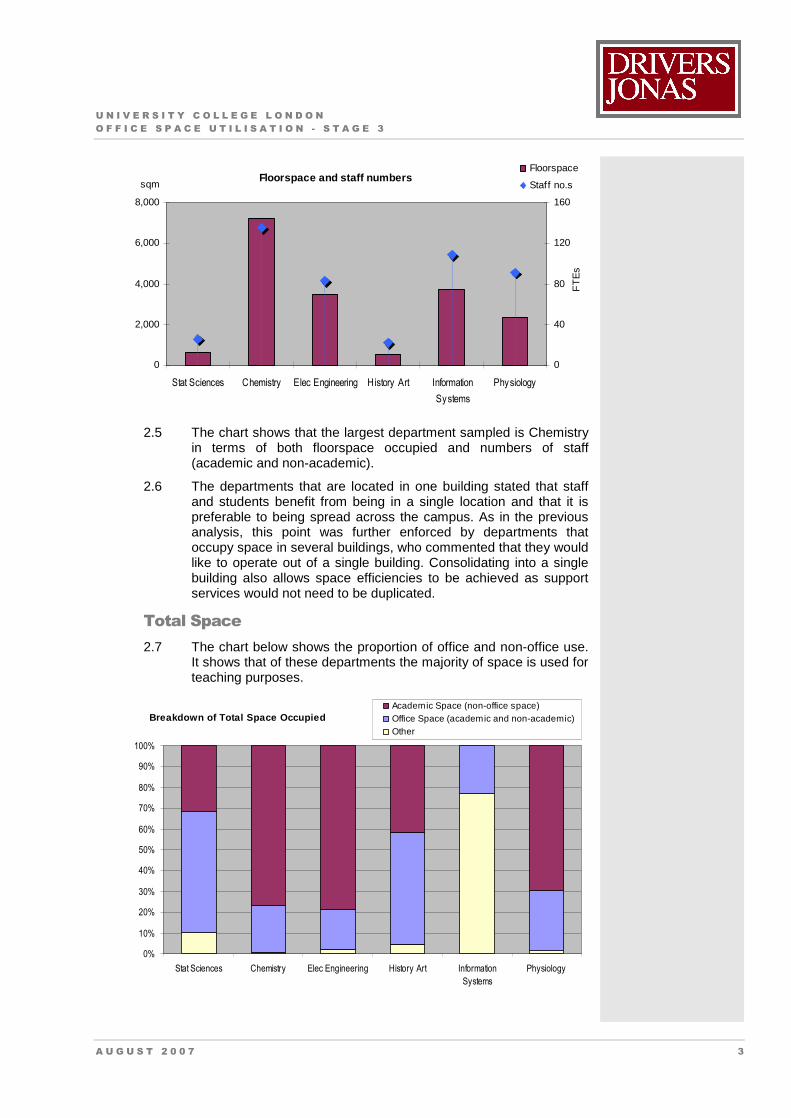
2.4 The departments vary in size and occupy different amounts of space as shown in the graph below:
Departments vary in size and occupy very different spaces
Majority of office space is used for academic purposes
For office space utilisation, of the sample departments, Electronic & Electrical Engineering is the most efficient
No single factor in determining space use or utilisation
History of Art
Electronic & Electrical Engineering
Information Systems
Statistical Sciences
Physiology
Chemistry
U N I V E R S I T Y C O L L E G E L O N D O N O F F I C E S P A C E U T I L I S A T I O N - S T A G E 3
A U G U S T 2 0 0 7 3
Floorspace and staff numbers
0
2,000
4,000
6,000
8,000
Stat Sciences Chemistry Elec Engineering History Art Information
Systems
Physiology
0
40
80
120
160
Floorspace
Staff no.ssqm
FT
Es
2.5 The chart shows that the largest department sampled is Chemistry in terms of both floorspace occupied and numbers of staff (academic and non-academic).
2.6 The departments that are located in one building stated that staff and students benefit from being in a single location and that it is preferable to being spread across the campus. As in the previous analysis, this point was further enforced by departments that occupy space in several buildings, who commented that they would like to operate out of a single building. Consolidating into a single building also allows space efficiencies to be achieved as support services would not need to be duplicated.
Total Space 2.7 The chart below shows the proportion of office and non-office use.
It shows that of these departments the majority of space is used for teaching purposes.
Breakdown of Total Space Occupied
0%
10%
20%
30%
40%
50%
60%
70%
80%
90%
100%
Stat Sciences Chemistry Elec Engineering History Art Information
Systems
Physiology
Academic Space (non-office space)Office Space (academic and non-academic)Other
U N I V E R S I T Y C O L L E G E L O N D O N O F F I C E S P A C E U T I L I S A T I O N - S T A G E 3
A U G U S T 2 0 0 7 4
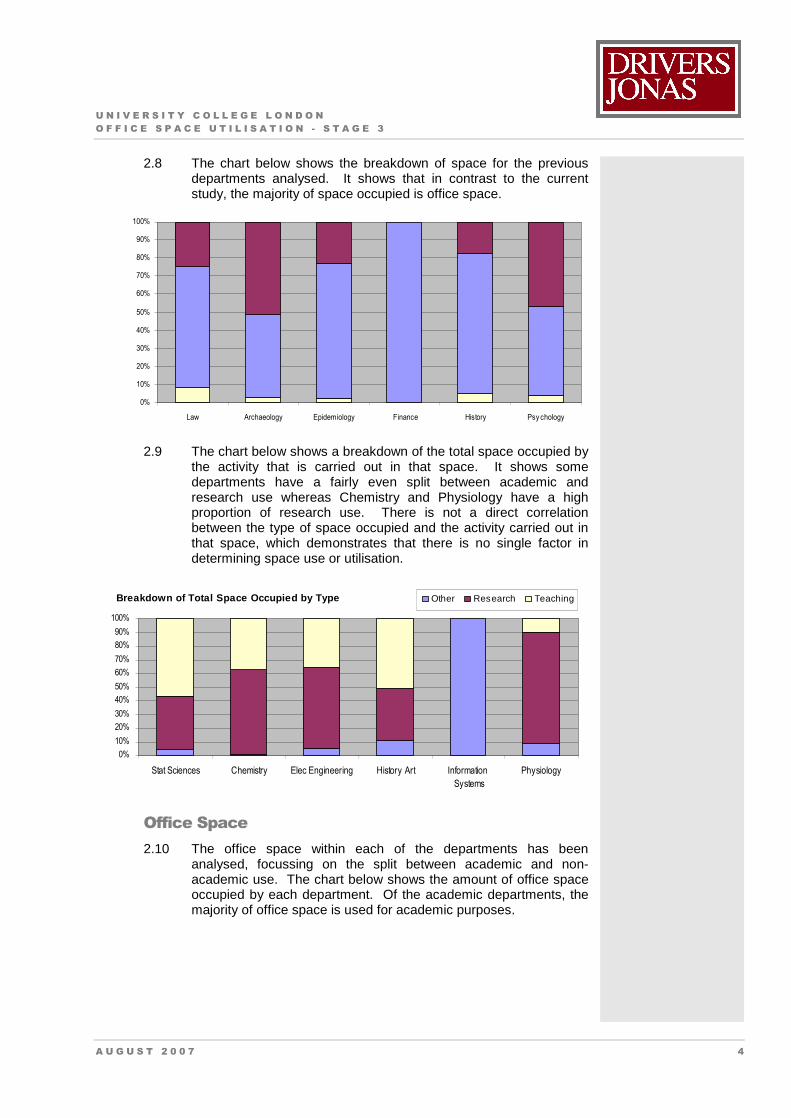
2.8 The chart below shows the breakdown of space for the previous departments analysed. It shows that in contrast to the current study, the majority of space occupied is office space.
0%
10%
20%
30%
40%
50%
60%
70%
80%
90%
100%
Law Archaeology Epidemiology Finance History Psy chology
2.9 The chart below shows a breakdown of the total space occupied by the activity that is carried out in that space. It shows some departments have a fairly even split between academic and research use whereas Chemistry and Physiology have a high proportion of research use. There is not a direct correlation between the type of space occupied and the activity carried out in that space, which demonstrates that there is no single factor in determining space use or utilisation.
Breakdown of Total Space Occupied by Type
0%
10%
20%
30%
40%
50%
60%
70%
80%
90%
100%
Stat Sciences Chemistry Elec Engineering History Art Information
Systems
Physiology
Other Research Teaching
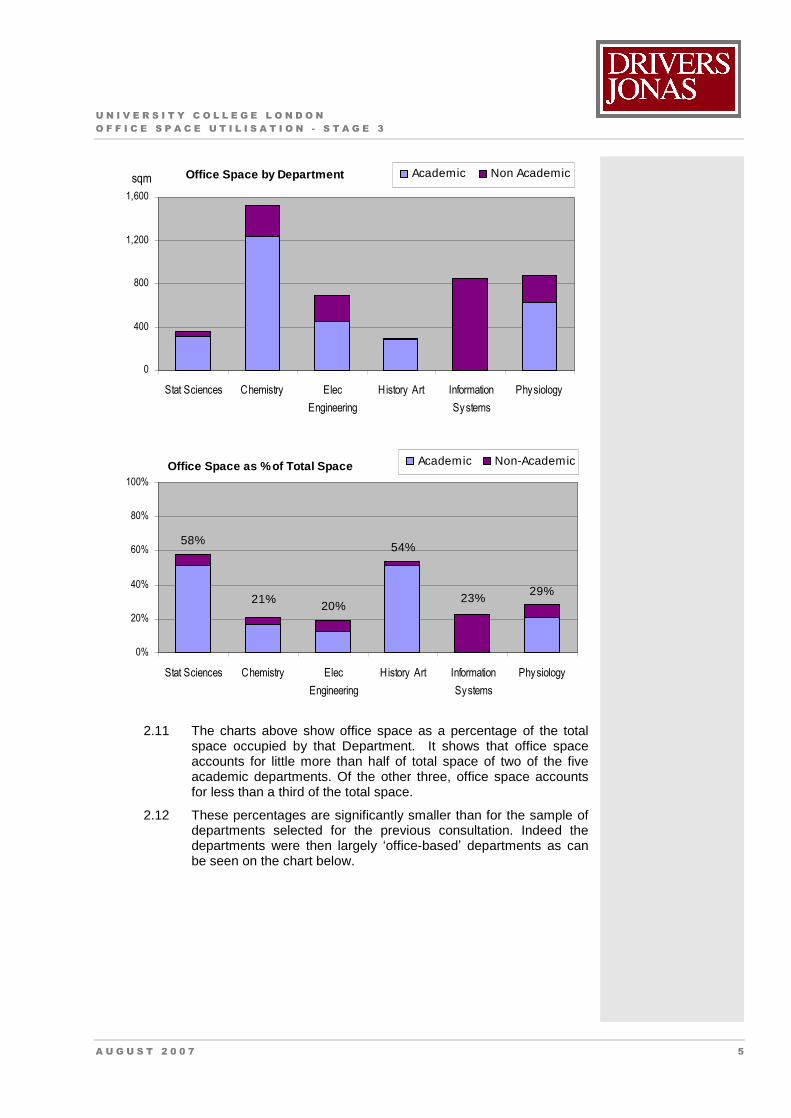
Office Space 2.10 The office space within each of the departments has been
analysed, focussing on the split between academic and non-academic use. The chart below shows the amount of office space occupied by each department. Of the academic departments, the majority of office space is used for academic purposes.
U N I V E R S I T Y C O L L E G E L O N D O N O F F I C E S P A C E U T I L I S A T I O N - S T A G E 3
A U G U S T 2 0 0 7 5
Office Space by Department
0
400
800
1,200
1,600
Stat Sciences Chemistry Elec
Engineering
History Art Information
Systems
Physiology
Academic Non Academicsqm
Office Space as % of Total Space
0%
20%
40%
60%
80%
100%
Stat Sciences Chemistry Elec
Engineering
History Art Information
Systems
Physiology
Academic Non-Academic
29%23%
54%
20%21%
58%
2.11 The charts above show office space as a percentage of the total space occupied by that Department. It shows that office space accounts for little more than half of total space of two of the five academic departments. Of the other three, office space accounts for less than a third of the total space.
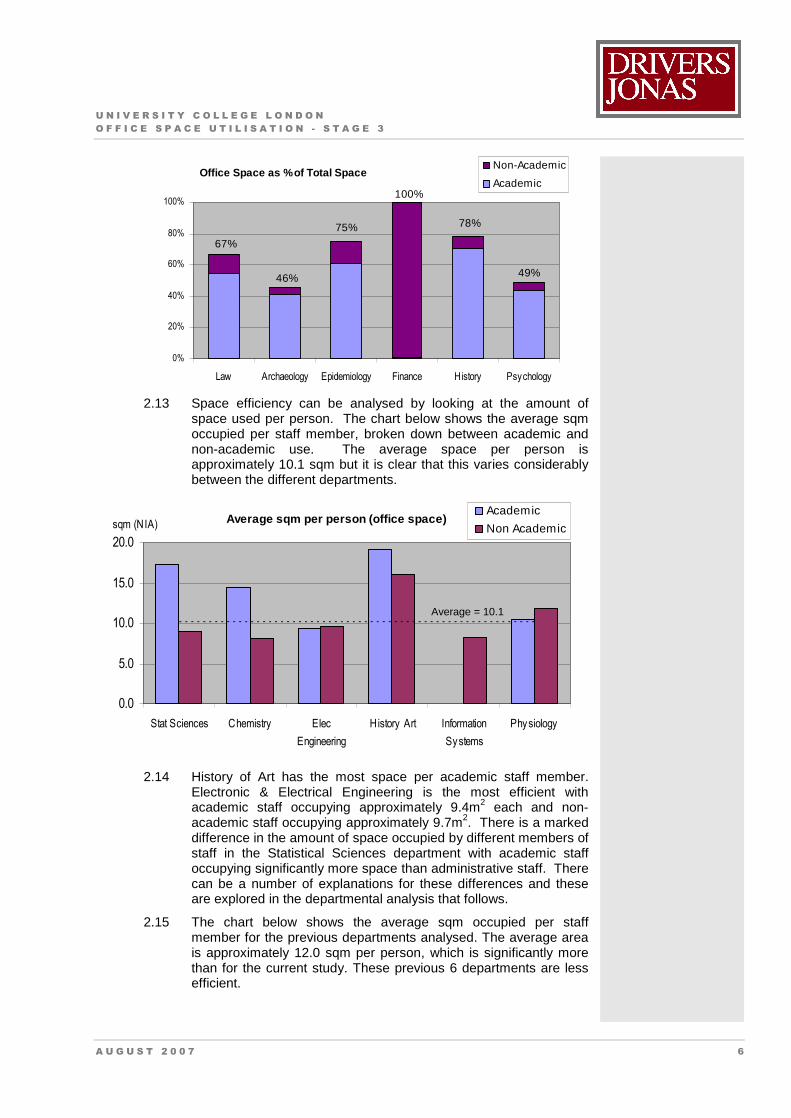
2.12 These percentages are significantly smaller than for the sample of departments selected for the previous consultation. Indeed the departments were then largely �office-based� departments as can be seen on the chart below.
U N I V E R S I T Y C O L L E G E L O N D O N O F F I C E S P A C E U T I L I S A T I O N - S T A G E 3
A U G U S T 2 0 0 7 6
Office Space as % of Total Space
0%
20%
40%
60%
80%
100%
Law Archaeology Epidemiology Finance History Psychology
Non-Academic
Academic
49%
78%
100%
75%
46%
67%
2.13 Space efficiency can be analysed by looking at the amount of space used per person. The chart below shows the average sqm occupied per staff member, broken down between academic and non-academic use. The average space per person is approximately 10.1 sqm but it is clear that this varies considerably between the different departments.
Average sqm per person (office space)
0.0
5.0
10.0
15.0
20.0
Stat Sciences Chemistry Elec
Engineering
History Art Information
Systems
Physiology
Academic
Non Academicsqm (NIA)
2.14 History of Art has the most space per academic staff member. Electronic & Electrical Engineering is the most efficient with academic staff occupying approximately 9.4m2 each and non-academic staff occupying approximately 9.7m2. There is a marked difference in the amount of space occupied by different members of staff in the Statistical Sciences department with academic staff occupying significantly more space than administrative staff. There can be a number of explanations for these differences and these are explored in the departmental analysis that follows.
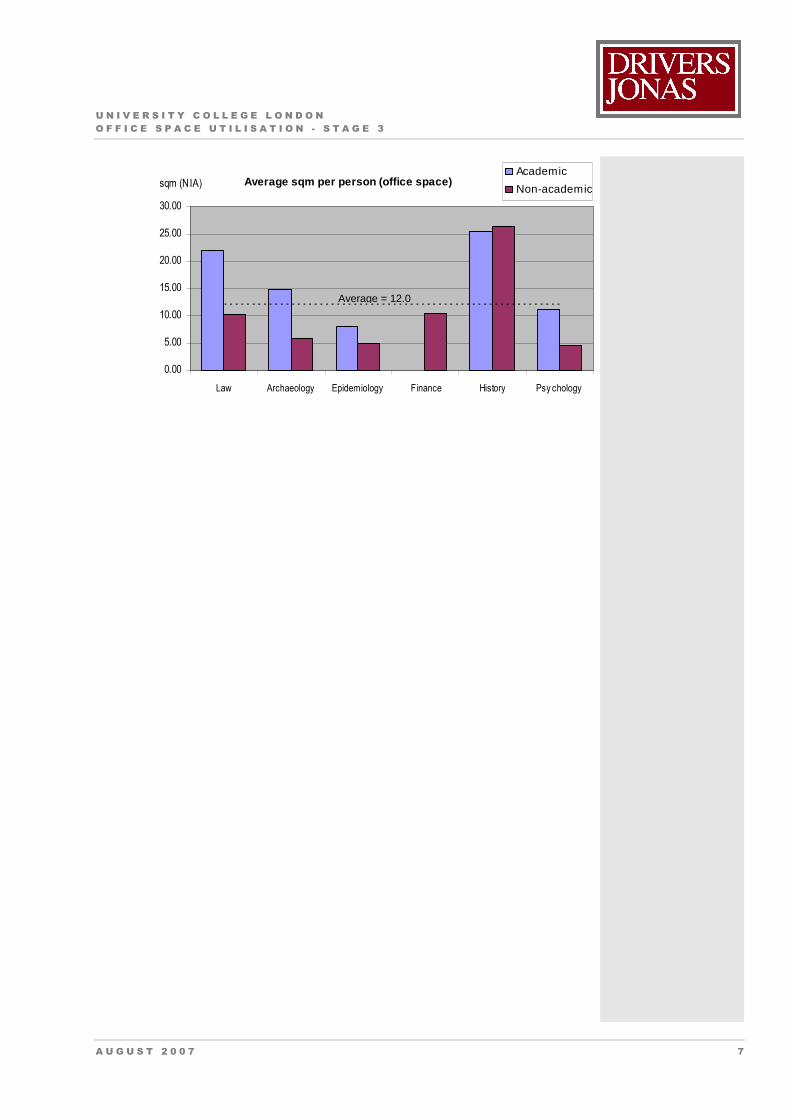
2.15 The chart below shows the average sqm occupied per staff member for the previous departments analysed. The average area is approximately 12.0 sqm per person, which is significantly more than for the current study. These previous 6 departments are less efficient.
Average = 10.1
U N I V E R S I T Y C O L L E G E L O N D O N O F F I C E S P A C E U T I L I S A T I O N - S T A G E 3
A U G U S T 2 0 0 7 7
Average sqm per person (office space)
0.00
5.00
10.00
15.00
20.00
25.00
30.00
Law Archaeology Epidemiology Finance History Psy chology
Academic
Non-academicsqm (NIA)
Average = 12.0
U N I V E R S I T Y C O L L E G E L O N D O N O F F I C E S P A C E U T I L I S A T I O N - S T A G E 3
A U G U S T 2 0 0 7 8
3. Departmental Analysis
Statistical Sciences 3.1 Key statistics:
Total space occupied: 612 m2
Office space occupied: 354 m2 (58%)
Breakdown of space: Teaching: 56%
Research: 40%
Other: 4%
Office space per person:
Academic 17.3 m2
Administrative 9.1 m2
3.2 The department of Statistical Sciences supports 16 full-time academic staff, with 5 part-time members; there are 4 full-time administrative staff and 1 part-time post active in the department at present.
3.3 The Department occupies approximately 600 sq m of space in 1-19 Torrington Place, on the 1st floor. This accommodation houses both teaching and office space.
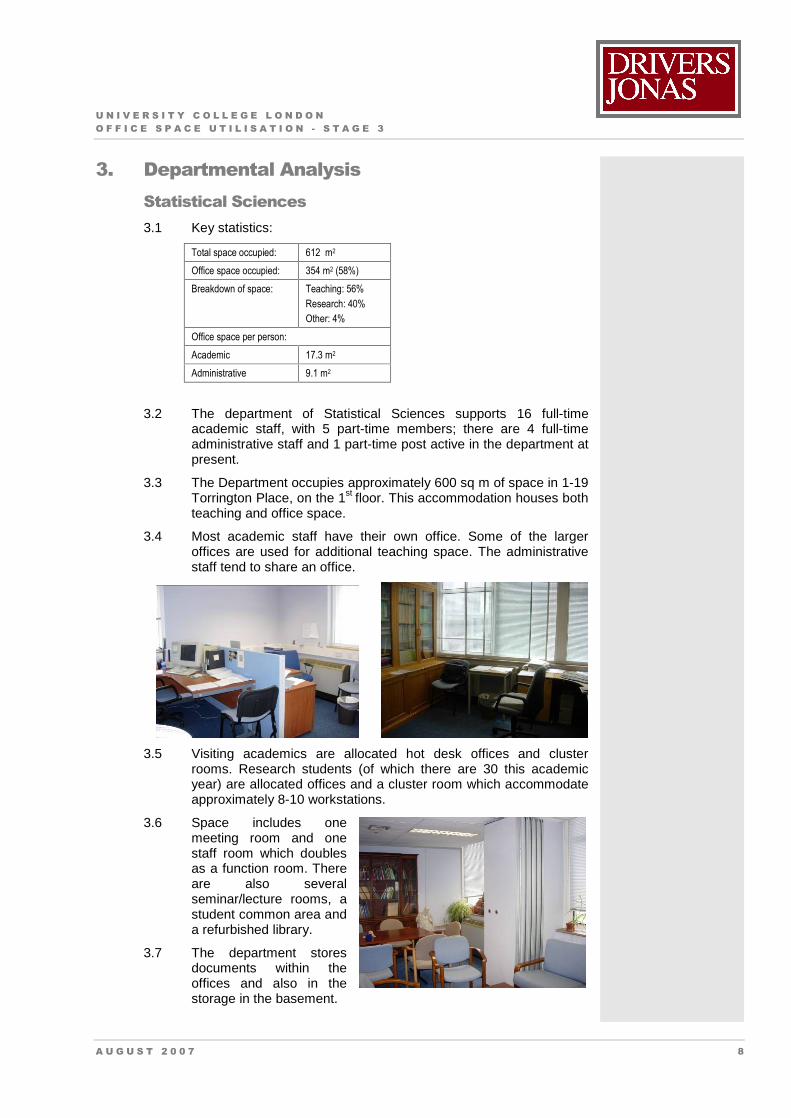
3.4 Most academic staff have their own office. Some of the larger offices are used for additional teaching space. The administrative staff tend to share an office.
3.5 Visiting academics are allocated hot desk offices and cluster rooms. Research students (of which there are 30 this academic year) are allocated offices and a cluster room which accommodate approximately 8-10 workstations.
3.6 Space includes one meeting room and one staff room which doubles as a function room. There are also several seminar/lecture rooms, a student common area and a refurbished library.
3.7 The department stores documents within the offices and also in the storage in the basement.
U N I V E R S I T Y C O L L E G E L O N D O N O F F I C E S P A C E U T I L I S A T I O N - S T A G E 3
A U G U S T 2 0 0 7 9
3.8 The department feel they need more space as they have difficulties in finding place for tutorials as they are often too big to take place in the offices.
3.9 The current layout of space has been determined by the construction of the building � room sizes are relatively fixed (2 or 3 windows per office). There is potential however to reconfigure space to provide a more open-plan environment.
Chemistry 3.10 Key statistics:
Total space occupied: 7,182 m2
Office space occupied: 1,624 m2 (23%)
Breakdown of space: Teaching: 37%
Research: 62%
Other: 1%
Office space per person:
Academic 14.4 m2
Administrative 11.3 m2
3.11 The Department of Chemistry supports 95 full-time academic staff, with 3 part-time members; there are 7 full-time and 5 part-time administrative staff and also 20 full-time and 5 part-time technical staff at present.
3.12 The department of Chemistry is based in two buildings, Christopher Ingold Building (self contained) and part of the second floor of the Kathleen Lonsdale Building (new laboratories and offices are being built). The majority of space occupied is in the Christopher Ingold Building.
3.13 Of this, the office accommodation comprises 1,624 sq m, in which most academic staff have their own office. The remainder share offices in the absence of more space.
3.14 The administrative staff share an office except the Departmental Administrator who has her own office. Staff have access to two meeting rooms.
3.15 Visiting lecturers usually share an office with postgraduates students.
3.16 The department suffers a lack of storage although files are archived and use made of the off-site storage facility.
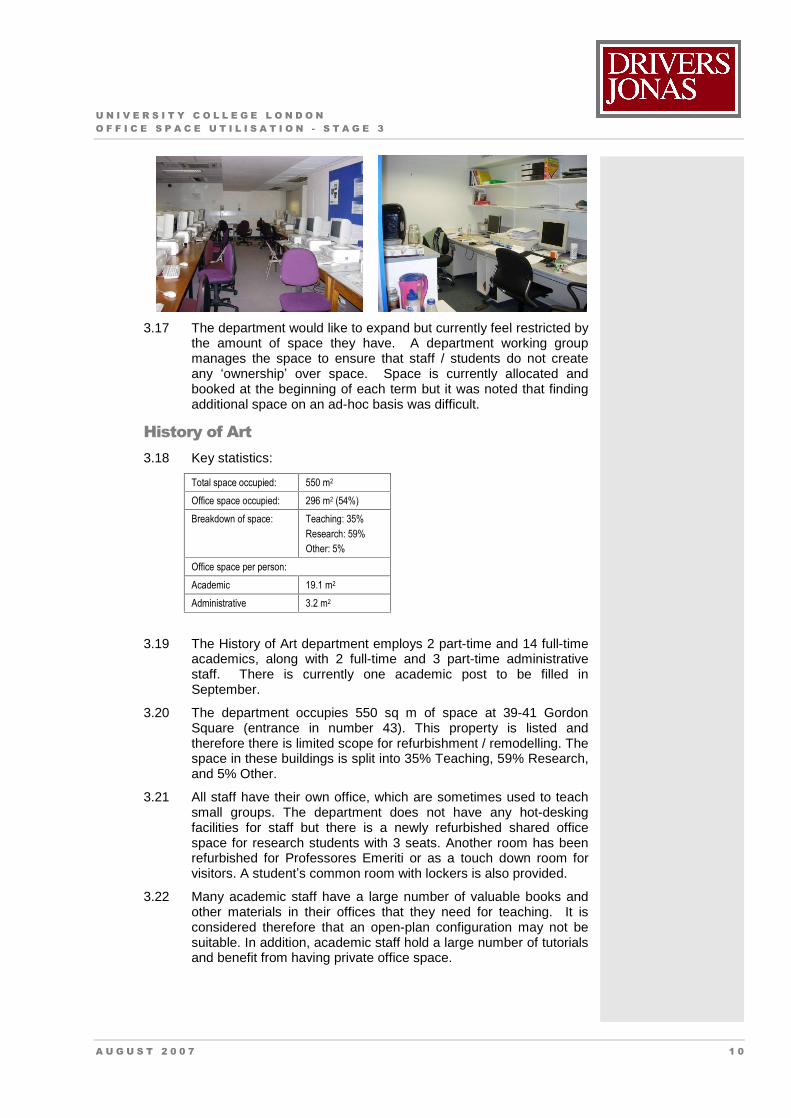
U N I V E R S I T Y C O L L E G E L O N D O N O F F I C E S P A C E U T I L I S A T I O N - S T A G E 3
A U G U S T 2 0 0 7 1 0
3.17 The department would like to expand but currently feel restricted by the amount of space they have. A department working group manages the space to ensure that staff / students do not create any �ownership� over space. Space is currently allocated and booked at the beginning of each term but it was noted that finding additional space on an ad-hoc basis was difficult.
History of Art 3.18 Key statistics:
Total space occupied: 550 m2
Office space occupied: 296 m2 (54%)
Breakdown of space: Teaching: 35%
Research: 59%
Other: 5%
Office space per person:
Academic 19.1 m2
Administrative 3.2 m2
3.19 The History of Art department employs 2 part-time and 14 full-time academics, along with 2 full-time and 3 part-time administrative staff. There is currently one academic post to be filled in September.
3.20 The department occupies 550 sq m of space at 39-41 Gordon Square (entrance in number 43). This property is listed and therefore there is limited scope for refurbishment / remodelling. The space in these buildings is split into 35% Teaching, 59% Research, and 5% Other.
3.21 All staff have their own office, which are sometimes used to teach small groups. The department does not have any hot-desking facilities for staff but there is a newly refurbished shared office space for research students with 3 seats. Another room has been refurbished for Professores Emeriti or as a touch down room for visitors. A student�s common room with lockers is also provided.
3.22 Many academic staff have a large number of valuable books and other materials in their offices that they need for teaching. It is considered therefore that an open-plan configuration may not be suitable. In addition, academic staff hold a large number of tutorials and benefit from having private office space.
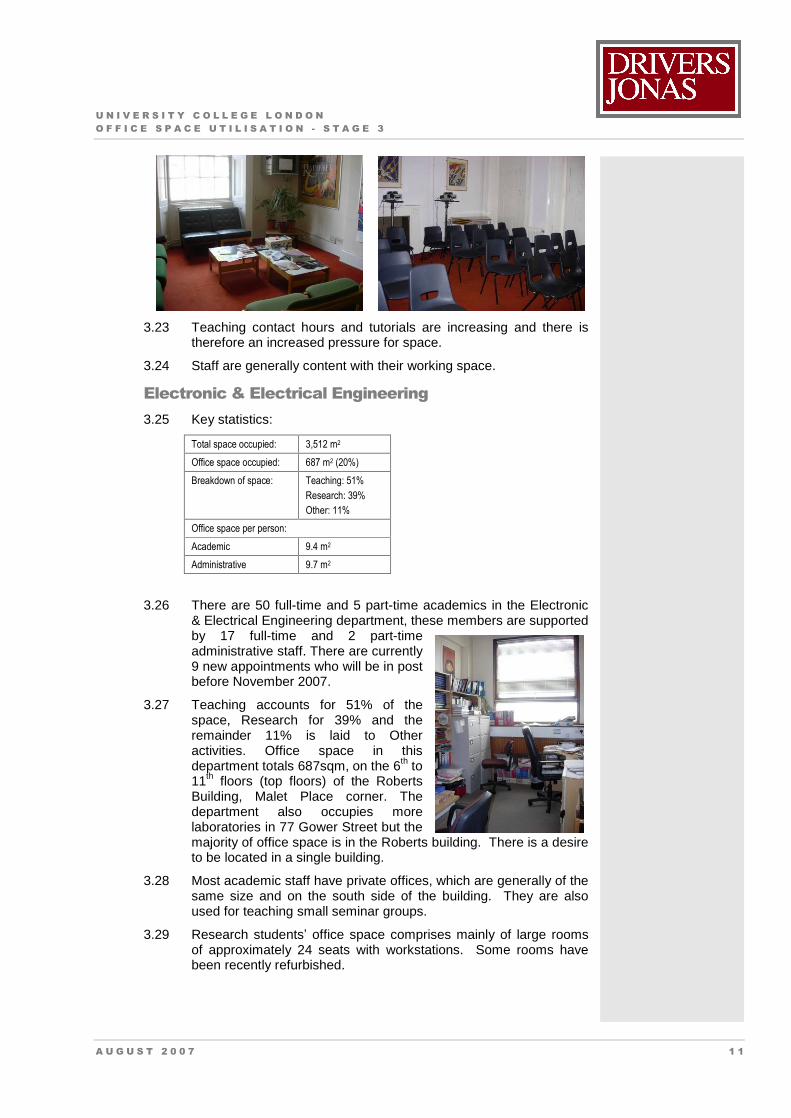
U N I V E R S I T Y C O L L E G E L O N D O N O F F I C E S P A C E U T I L I S A T I O N - S T A G E 3
A U G U S T 2 0 0 7 1 1
3.23 Teaching contact hours and tutorials are increasing and there is therefore an increased pressure for space.
3.24 Staff are generally content with their working space.
Electronic & Electrical Engineering 3.25 Key statistics:
Total space occupied: 3,512 m2
Office space occupied: 687 m2 (20%)
Breakdown of space: Teaching: 51%
Research: 39%
Other: 11%
Office space per person:
Academic 9.4 m2
Administrative 9.7 m2
3.26 There are 50 full-time and 5 part-time academics in the Electronic & Electrical Engineering department, these members are supported by 17 full-time and 2 part-time administrative staff. There are currently 9 new appointments who will be in post before November 2007.
3.27 Teaching accounts for 51% of the space, Research for 39% and the remainder 11% is laid to Other activities. Office space in this department totals 687sqm, on the 6th to 11th floors (top floors) of the Roberts Building, Malet Place corner. The department also occupies more laboratories in 77 Gower Street but the majority of office space is in the Roberts building. There is a desire to be located in a single building.
3.28 Most academic staff have private offices, which are generally of the same size and on the south side of the building. They are also used for teaching small seminar groups.
3.29 Research students� office space comprises mainly of large rooms of approximately 24 seats with workstations. Some rooms have been recently refurbished.
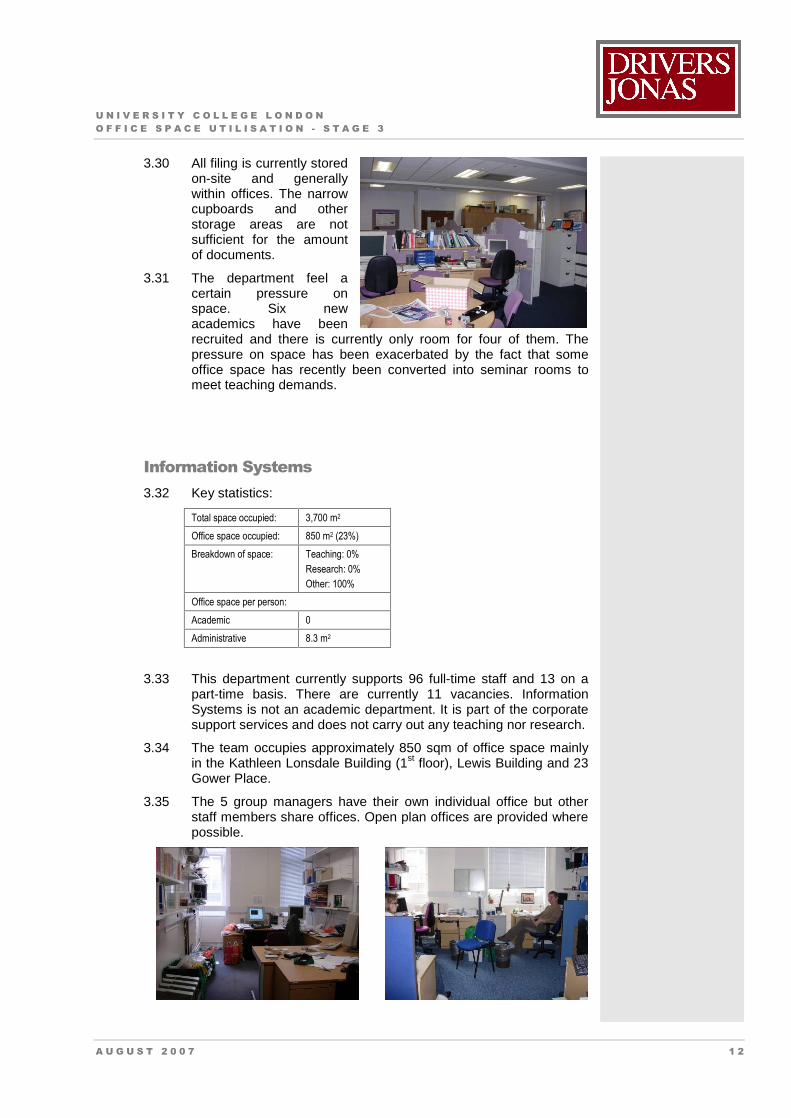
U N I V E R S I T Y C O L L E G E L O N D O N O F F I C E S P A C E U T I L I S A T I O N - S T A G E 3
A U G U S T 2 0 0 7 1 2
3.30 All filing is currently stored on-site and generally within offices. The narrow cupboards and other storage areas are not sufficient for the amount of documents.
3.31 The department feel a certain pressure on space. Six new academics have been recruited and there is currently only room for four of them. The pressure on space has been exacerbated by the fact that some office space has recently been converted into seminar rooms to meet teaching demands.
Information Systems 3.32 Key statistics:
Total space occupied: 3,700 m2
Office space occupied: 850 m2 (23%)
Breakdown of space: Teaching: 0%
Research: 0%
Other: 100%
Office space per person:
Academic 0
Administrative 8.3 m2
3.33 This department currently supports 96 full-time staff and 13 on a part-time basis. There are currently 11 vacancies. Information Systems is not an academic department. It is part of the corporate support services and does not carry out any teaching nor research.
3.34 The team occupies approximately 850 sqm of office space mainly in the Kathleen Lonsdale Building (1st floor), Lewis Building and 23 Gower Place.
3.35 The 5 group managers have their own individual office but other staff members share offices. Open plan offices are provided where possible.
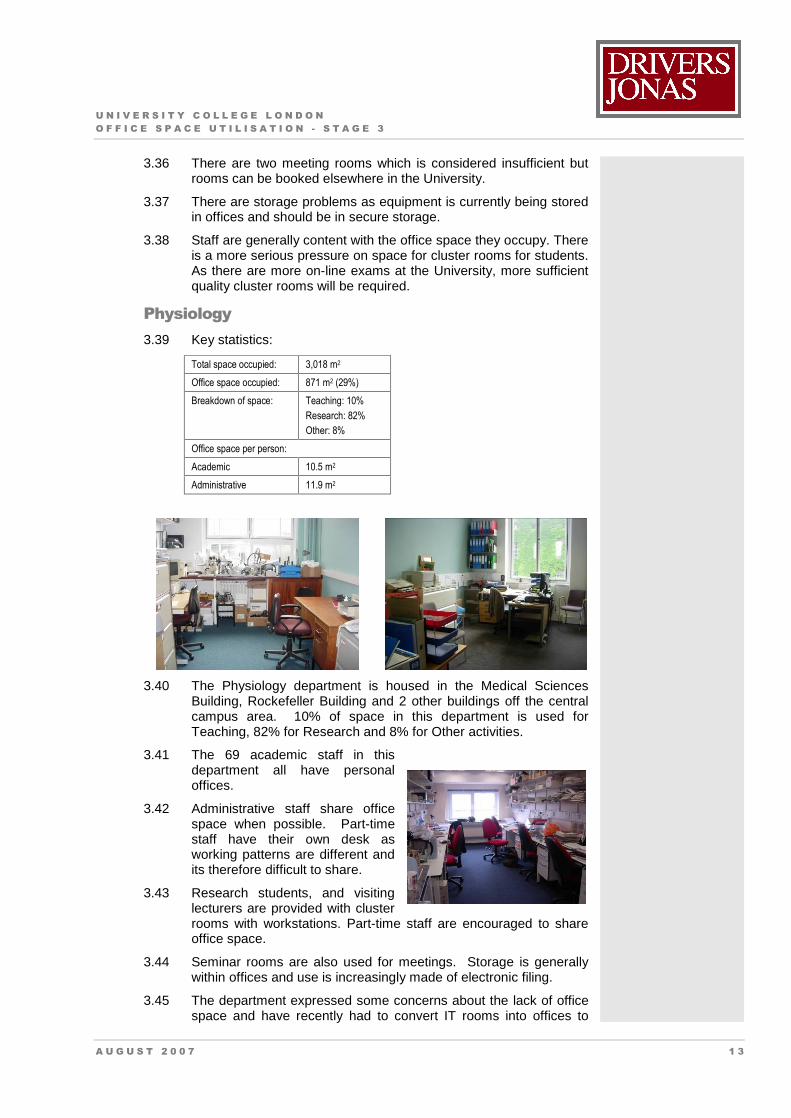
U N I V E R S I T Y C O L L E G E L O N D O N O F F I C E S P A C E U T I L I S A T I O N - S T A G E 3
A U G U S T 2 0 0 7 1 3
3.36 There are two meeting rooms which is considered insufficient but rooms can be booked elsewhere in the University.
3.37 There are storage problems as equipment is currently being stored in offices and should be in secure storage.
3.38 Staff are generally content with the office space they occupy. There is a more serious pressure on space for cluster rooms for students. As there are more on-line exams at the University, more sufficient quality cluster rooms will be required.
Physiology 3.39 Key statistics:
Total space occupied: 3,018 m2
Office space occupied: 871 m2 (29%)
Breakdown of space: Teaching: 10%
Research: 82%
Other: 8%
Office space per person:
Academic 10.5 m2
Administrative 11.9 m2
3.40 The Physiology department is housed in the Medical Sciences Building, Rockefeller Building and 2 other buildings off the central campus area. 10% of space in this department is used for Teaching, 82% for Research and 8% for Other activities.
3.41 The 69 academic staff in this department all have personal offices.
3.42 Administrative staff share office space when possible. Part-time staff have their own desk as working patterns are different and its therefore difficult to share.
3.43 Research students, and visiting lecturers are provided with cluster rooms with workstations. Part-time staff are encouraged to share office space.
3.44 Seminar rooms are also used for meetings. Storage is generally within offices and use is increasingly made of electronic filing.
3.45 The department expressed some concerns about the lack of office space and have recently had to convert IT rooms into offices to
U N I V E R S I T Y C O L L E G E L O N D O N O F F I C E S P A C E U T I L I S A T I O N - S T A G E 3
A U G U S T 2 0 0 7 1 4
meet demand. Space has also been created by constructing mezzanine floors in some of the laboratories. These provide useful office / write-up space in close proximity to the laboratory space. The department has experienced some security issues.
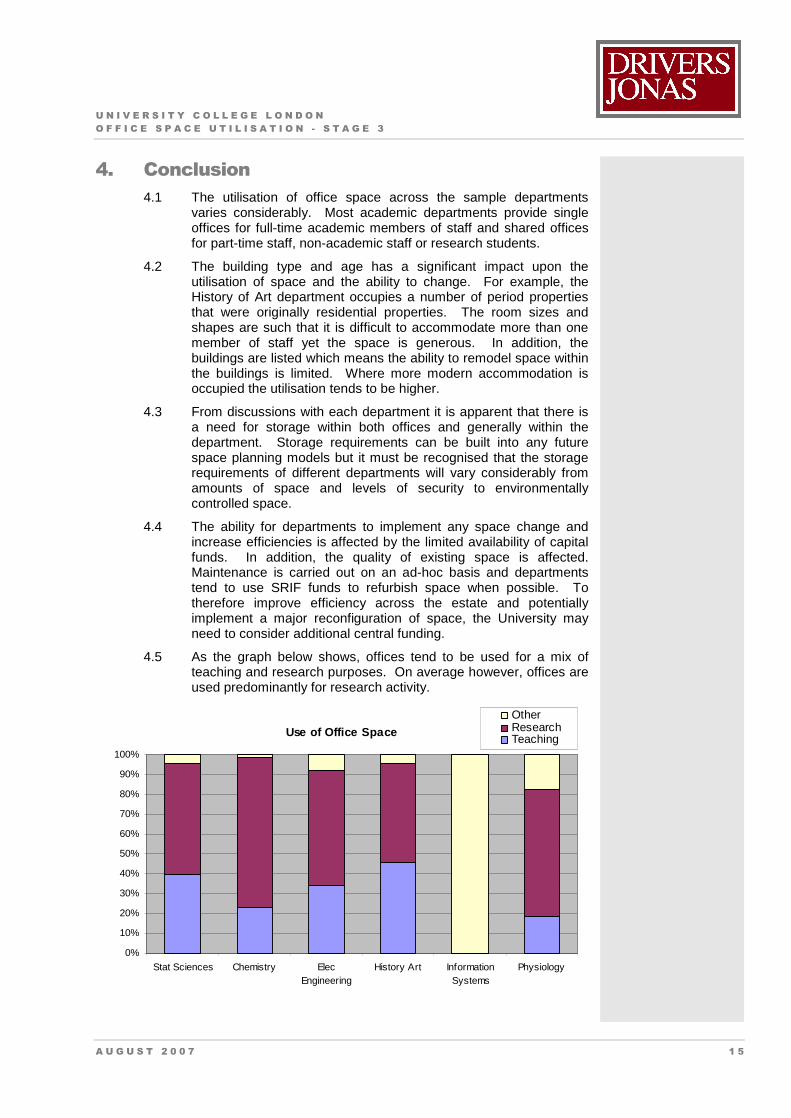
U N I V E R S I T Y C O L L E G E L O N D O N O F F I C E S P A C E U T I L I S A T I O N - S T A G E 3
A U G U S T 2 0 0 7 1 5
4. Conclusion 4.1 The utilisation of office space across the sample departments
varies considerably. Most academic departments provide single offices for full-time academic members of staff and shared offices for part-time staff, non-academic staff or research students.
4.2 The building type and age has a significant impact upon the utilisation of space and the ability to change. For example, the History of Art department occupies a number of period properties that were originally residential properties. The room sizes and shapes are such that it is difficult to accommodate more than one member of staff yet the space is generous. In addition, the buildings are listed which means the ability to remodel space within the buildings is limited. Where more modern accommodation is occupied the utilisation tends to be higher.
4.3 From discussions with each department it is apparent that there is a need for storage within both offices and generally within the department. Storage requirements can be built into any future space planning models but it must be recognised that the storage requirements of different departments will vary considerably from amounts of space and levels of security to environmentally controlled space.
4.4 The ability for departments to implement any space change and increase efficiencies is affected by the limited availability of capital funds. In addition, the quality of existing space is affected. Maintenance is carried out on an ad-hoc basis and departments tend to use SRIF funds to refurbish space when possible. To therefore improve efficiency across the estate and potentially implement a major reconfiguration of space, the University may need to consider additional central funding.
4.5 As the graph below shows, offices tend to be used for a mix of teaching and research purposes. On average however, offices are used predominantly for research activity.
Use of Office Space
0%
10%
20%
30%
40%
50%
60%
70%
80%
90%
100%
Stat Sciences Chemistry ElecEngineering
History Art InformationSystems
Physiology
OtherResearchTeaching
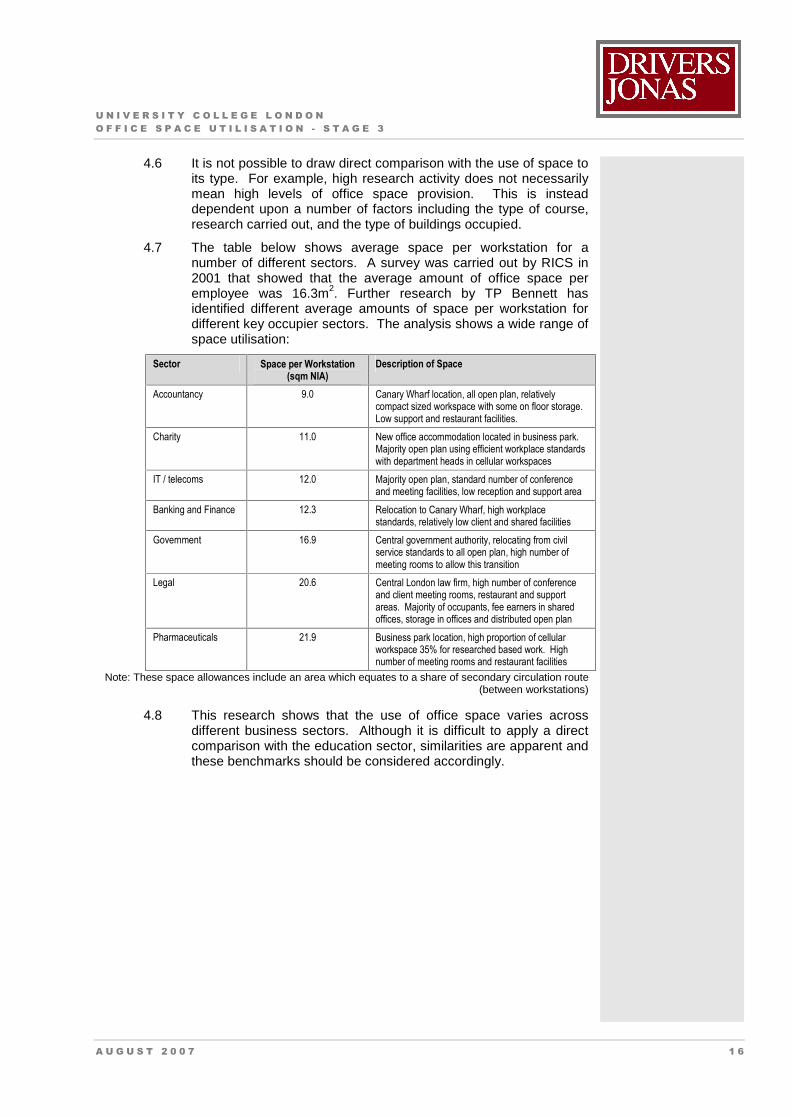
U N I V E R S I T Y C O L L E G E L O N D O N O F F I C E S P A C E U T I L I S A T I O N - S T A G E 3
A U G U S T 2 0 0 7 1 6
4.6 It is not possible to draw direct comparison with the use of space to its type. For example, high research activity does not necessarily mean high levels of office space provision. This is instead dependent upon a number of factors including the type of course, research carried out, and the type of buildings occupied.
4.7 The table below shows average space per workstation for a number of different sectors. A survey was carried out by RICS in 2001 that showed that the average amount of office space per employee was 16.3m2. Further research by TP Bennett has identified different average amounts of space per workstation for different key occupier sectors. The analysis shows a wide range of space utilisation:
Sector Space per Workstation
(sqm NIA)
Description of Space
Accountancy 9.0 Canary Wharf location, all open plan, relatively
compact sized workspace with some on floor storage.
Low support and restaurant facilities.
Charity 11.0 New office accommodation located in business park.
Majority open plan using efficient workplace standards
with department heads in cellular workspaces
IT / telecoms 12.0 Majority open plan, standard number of conference
and meeting facilities, low reception and support area
Banking and Finance 12.3 Relocation to Canary Wharf, high workplace
standards, relatively low client and shared facilities
Government 16.9 Central government authority, relocating from civil
service standards to all open plan, high number of
meeting rooms to allow this transition
Legal 20.6 Central London law firm, high number of conference
and client meeting rooms, restaurant and support
areas. Majority of occupants, fee earners in shared
offices, storage in offices and distributed open plan
Pharmaceuticals 21.9 Business park location, high proportion of cellular
workspace 35% for researched based work. High
number of meeting rooms and restaurant facilities
Note: These space allowances include an area which equates to a share of secondary circulation route (between workstations)
4.8 This research shows that the use of office space varies across different business sectors. Although it is difficult to apply a direct comparison with the education sector, similarities are apparent and these benchmarks should be considered accordingly.
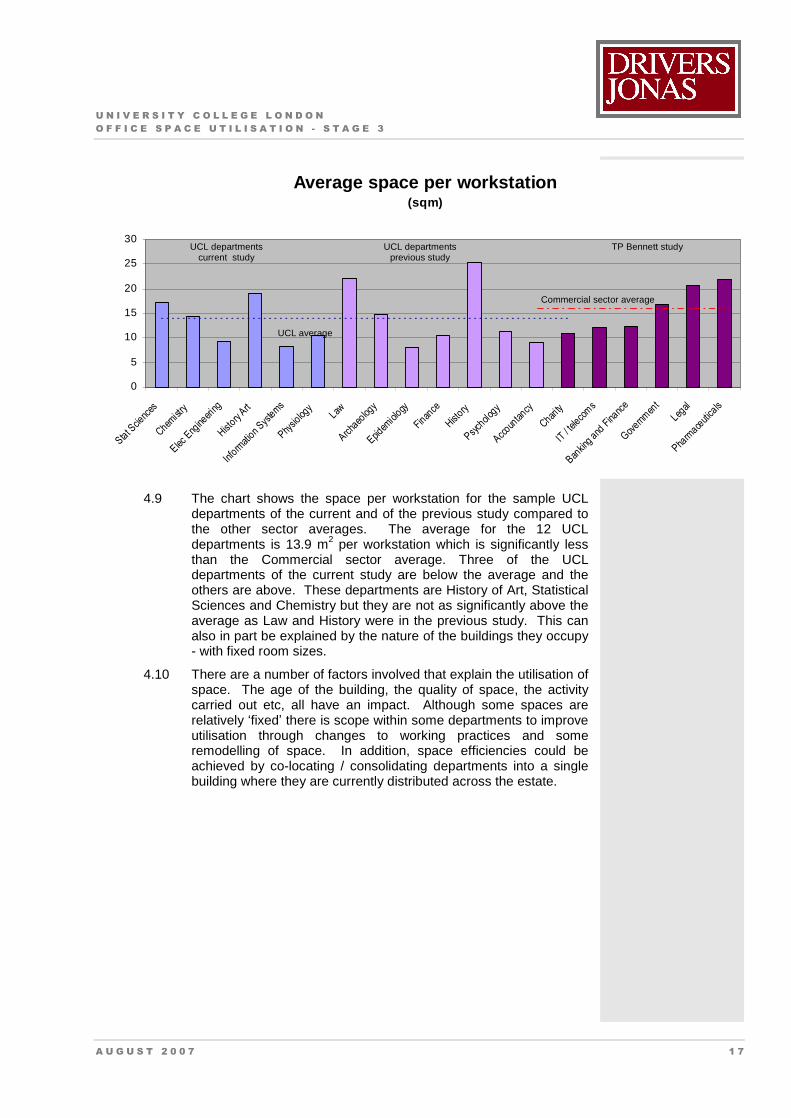
U N I V E R S I T Y C O L L E G E L O N D O N O F F I C E S P A C E U T I L I S A T I O N - S T A G E 3
A U G U S T 2 0 0 7 1 7
Average space per workstation(sqm)
0
5
10
15
20
25
30
Stat S
cienc
es
Chemist
ry
Elec E
ngine
erin
g
History
Art
Info
rmat
ion
Syste
ms
Physio
logy
Law
Archa
eolog
y
Epidem
iolo
gy
Finan
ce
History
Psych
olog
y
Accoun
tancy
Charity
IT /
tele
com
s
Bankin
g and
Fina
nce
Gov
ernm
ent
Legal
Pharm
aceut
icals
4.9 The chart shows the space per workstation for the sample UCL departments of the current and of the previous study compared to the other sector averages. The average for the 12 UCL departments is 13.9 m2 per workstation which is significantly less than the Commercial sector average. Three of the UCL departments of the current study are below the average and the others are above. These departments are History of Art, Statistical Sciences and Chemistry but they are not as significantly above the average as Law and History were in the previous study. This can also in part be explained by the nature of the buildings they occupy - with fixed room sizes.
4.10 There are a number of factors involved that explain the utilisation of space. The age of the building, the quality of space, the activity carried out etc, all have an impact. Although some spaces are relatively �fixed� there is scope within some departments to improve utilisation through changes to working practices and some remodelling of space. In addition, space efficiencies could be achieved by co-locating / consolidating departments into a single building where they are currently distributed across the estate.
UCL departments current study
UCL departments previous study
TP Bennett study
UCL average
Commercial sector average