Embed Size (px)
Citation preview

I
UNIVERSITI TUNKU ABDUL RAHMAN
REPORT STATUS DECLARATION FORM
Title: Smart Information Centre for Wearable Device (Health-care)
Academic Session: January 2016
I, YAP CHUN YEN, declare that I allow this Final Year Project Report to be kept in Universiti
Tunku Abdul Rahman Library subject to the regulations as follows:
1. The dissertation is a property of the Library.
2. The Library is allowed to make copies of this dissertation for academic purposes.
Verified by,
___________________________ __________________________
(Author’s signature) (Supervisor’s signature)

I
Address:
17A, Jln Lagenda 16,
Taman Lagenda Mas, Bt9 ,Cheras, Supervisor’s name,
43200, Selangor. Mr Ooi Joo On
Date : 17 August 2015 Date : 17 August 2015

II
SMART INFORMATION CENTRE FOR WEARABLE DEVICE (HEALTH-CARE)
BY
YAP CHUN YEN
A REPORT
SUBMITTED TO
Universiti Tunku Abdul Rahman
in partial fulfilment of the requirements
for the degree of
BACHELOR OF COMMUNICATIONS AND NETWORKING (HONS)
Faculty of Information and Communication Technology
(Perak Campus) MAY 2016

III
DECLARATION OF ORIGINALITY
I declare that this report entitled “SMART INFORMATION CENTRE FOR WEARABLE
DEVICE (HEALTH-CARE)” is my own work except as cited in the references. The report has
not been accepted for any degree and is not being submitted concurrently in candidature for any
degree or other award.
Signature : _________________________
Name : _________________________
Date : _________________________

IV
ACKNOWLEDGEMENT
I would like to express my sincere thanks and appreciation to my supervisor, Mr Ooi Joo On who
has given me the opportunity to engage in this project and constantly providing valuable advice
and idea to me. Thank you.
Finally, I must say thanks to my parents and my family for their love, support, and continuous
encouragement throughout the course.

V
ABSTRACT
This project is an application project for wearable device. This project developed to provide
better display structure and good presentation of dashboard in health care field of wearable
device. This application will provide user’s daily activity for their health monitoring as well as
previous history of their health status record to consistently monitor their health condition by
providing a good dashboard to user. The application itself would have a local database which
will store some data locally in a text form and those data would be retrieved for generating
graphical presentation to user. The application was developed in Java for its widespread
compatibility with a multitude of wearable devices.

VI
TABLE OF CONTENTS
COVER I
TITLE II
DECLARATION OF ORIGINALITY III
ACKNOWLEDGEMENT IV
ABSTRACT V
TABLE OF CONTENTS VI
LIST OF FIGURES IX
LIST OF TABLES XII
CHAPTER 1 INTRODUCTION 1
1.1 Motivation and Problem Statement 1
1.2 Project Objectives 4
1.3 Project Scope 4
1.4 Expected Contribution from the Project 5
1.5 Organization of the report 6
CHAPTER 2 LITERATURE REVIEW 7
2.1 Review of the Technologies 7
2.1.1 Hardware Platform 7
2.1.2 Operating System 8
2.1.3 Programming Language 8
2.1.4 Summary of the Technologies Review 9
2.2 Review of Existing Applications 10
2.2.1 Apple watch OS2 app (Strava) 10
2.2.2 LG Watch R app (V08 watch face) 12
2.2.3 Asus ZenWatch app (F04 watch face) 13
2.2.4 Moto 360 app (A48 watch face) 15
2.2.5 Huawei Watch app (activity monitoring) 16
2.2.6 Sony SmartWatch3 app (Endomondo) 17
2.2.7 Comparison of different wearable app display
structure 18
VII
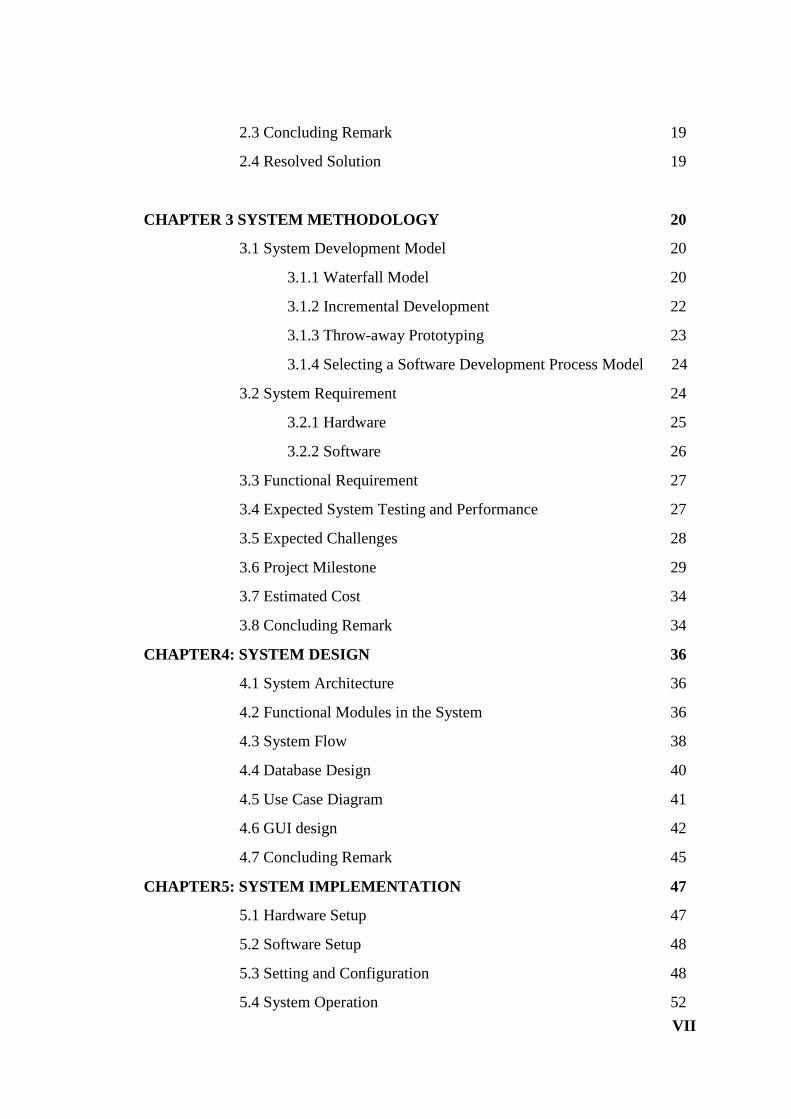
2.3 Concluding Remark 19
2.4 Resolved Solution 19
CHAPTER 3 SYSTEM METHODOLOGY 20
3.1 System Development Model 20
3.1.1 Waterfall Model 20
3.1.2 Incremental Development 22
3.1.3 Throw-away Prototyping 23
3.1.4 Selecting a Software Development Process Model 24
3.2 System Requirement 24
3.2.1 Hardware 25
3.2.2 Software 26
3.3 Functional Requirement 27
3.4 Expected System Testing and Performance 27
3.5 Expected Challenges 28
3.6 Project Milestone 29
3.7 Estimated Cost 34
3.8 Concluding Remark 34
CHAPTER4: SYSTEM DESIGN 36
4.1 System Architecture 36
4.2 Functional Modules in the System 36
4.3 System Flow 38
4.4 Database Design 40
4.5 Use Case Diagram 41
4.6 GUI design 42
4.7 Concluding Remark 45
CHAPTER5: SYSTEM IMPLEMENTATION 47
5.1 Hardware Setup 47
5.2 Software Setup 48
5.3 Setting and Configuration 48
5.4 System Operation 52

VIII
CHAPTER6: SYSTEM EVALUATION AND DISCUSSION 63
6.1 System Testing 63
6.2 Project Challenges 64
6.3 SWOT Analysis 65
6.4 Objectives Evaluation 67
6.5 Concluding Remark 68
CHAPTER7: CONCLUSION AND RECOMMENDATION 69
7.1 Conclusion 69
7.2 Recommendation 69
BIBLIOGRAPHY/REFERENCE 70

IX
LIST OF FIGURES
Figure Number Title Page
Figure 2.2.1 Strava app running on Apple Watch OS 2 10
Figure 2.2.2 V08 watch face app on LG Watch R 12
Figure 2.2.3 F04 watch face app on Asus ZenWatch 13
Figure 2.2.4 A48 watch face app on Moto 360 15
Figure 2.2.5 Activity monitoring app for Huawei Watch 16
Figure 2.2.6 Endomondo app on Sony SmartWatch3 17
Figure 3.1.1 Waterfall Model 21
Figure 3.1.2 Incremental Development 22
Figure 3.1.3 Throw-away Prototyping 23
Figure 3.2.1 Newton Development Kit 26
Figure 3.6.1 Gantt-chart for Project I 32
Figure 3.6.2 Gantt-chart for Project II 33
Figure 4.1 System Architecture Design 36
Figure 4.3 System Flow Design 38
Figure 4.5.1 Use Case Diagram Design 41

X
Figure 4.6.1 Sketch of basic GUI design 42
Figure 4.6.2 Splash screen design 43
Figure 4.6,3 Main menu page design 43
Figure 4.6.4 FloatButtonMenu design(1) 43
Figure 4.6.5 FloatButtonMenu design(2) 43
Figure 4.6.6 Step tracker progressbar design 44
Figure 4.6.7 Sleep monitoring progressbar 44
Figure 4.6.8 Bar chart design 44
Figure 4.6.9 Line chart design 44
Figure 5.1 Hardware Setup 47
Figure 5.3.1 API installation on Android SDK Manager 49
Figure 5.3.2 Android Virtual Device Manager 50
Figure 5.3.3 Android virtual device selection and setup 50
Figure 5.3.4 Download add-ons of SQLite Manager on Mozilla Firefox 51
Figure 5.3.5 Pulling database file on Android Device Monitor 52
Figure 5.4.1 Input from user on Step Tracker function 53
Figure 5.4.2 Circular progress bar showing step taken of user 54
Figure 5.4.3 Progress bar showing user achieved their goal 55

XI
Figure 5.4.4 Progress bar with blinking effect 55
Figure 5.4.5 Bar chart of step tracker function 56
Figure 5.4.6 Line chart of calories burned checking function 57
Figure 5.4.7 BMI value under category Normal 58
Figure 5.4.8 BMI value under category Obese 58
Figure 5.4.9 Combined two parameters in one graph 59
Figure 5.4.10 Progress bar in sleep monitoring function 60
Figure 5.4.11 Health advisory function 61
Figure 5.4.12 Health profile in text form 61
Figure 5.4.13 Health profile in graphical presentation 62

CHAPTER 1 INTRODUCTION
BCN (HONS) Communications and Networking
Faculty of Information and Communication Technology (Perak Campus), UTAR XII
LIST OF TABLES
Table Number Title Pages
Table 2.1.4 Review of wearable development platform 9
Table 2.2.7 Comparison of different wearable app display
structure
18
Table 3.6.1 List of activities and milestone of Project I 29
Table 3.6.2 List of activities and milestone of Project I 30
Table 3.7 Estimated cost 32
Table 4.4.1 User table 40
Table 6.1.1 Step tracker function testing 63
Table 6.1.2 Calculate BMI function testing 64

CHAPTER 1 INTRODUCTION
BCN (HONS) Communications and Networking
Faculty of Information and Communication Technology (Perak Campus), UTAR 1
CHAPTER 1: INTRODUCTION
1.1 Motivation and Problem Statement
Recently, major electronic makers are focusing efforts in developing products
featuring functions that are innovative than mobile computing. This is so-called wearable
product made a big change in terms of the distance between the electronic device and
human body which has become closer. The new frontier for displays are wearable.
The wearable displays tend to be smaller than handheld mobile devices, however,
wearable products require display according to the purpose and its main function which
user satisfy with the products. In order to fully utilize the wearable functions, the displays
structure on the wearable must be good and clear so that user can be understand the
content shown on wearable. Besides, the wearable product’s display market is expected
to develop into flexible, proper as well as stretchable display. Few of motivations in this
project is listed below.
Need of effective and good information display structure in health monitoring
In this modern life, there is a need of Infographic for a better understanding of
information shown to user. Infographic is one efficient way of combining design, writing
and analysis that are ideal for an age of big data to represent complex data. Infographic
are easy to digest and extremely engaging because human would be suffer from
information overload in the form of words. For an instance, a student who asked to read
one summarize poster will easily captured the big picture of it while another student who
asked to read a book will less likely to know the whole concept at a limited time given.

CHAPTER 1 INTRODUCTION
BCN (HONS) Communications and Networking
Faculty of Information and Communication Technology (Perak Campus), UTAR 2
Need of information interpretation at a glance in small interface
There is a need of good and proper information display on wearable for people to grab
information quickly. The method for efficiently utilizing display space providing time
and other function is very useful for a user to knowing all kinds of information on the
small interface of wearable in a quick glance. Therefore, the purpose of this project is to
help people grab as much information as possible by glancing through the small interface
of wearable.
Need of using some smart feature to convey information in health monitoring
Smart feature in an applications nowadays is getting more popular. For example,
Waze ,which is an application that can show route for driver to reach their destination
using GPS technology. The smart feature within the Waze is showing the best route to
reach destination based on the condition of the road and this is a form of self-advisory to
advise the driver to follow the best path to destination. In health monitoring field, the
self-monitoring and self-advisory are important features to let user to monitor their body
status and provide some good advice to maintain their healthy status. Therefore, the smart
feature on wearable device for health monitoring is necessary.
Need of high mobility of information to be carried around
Information is always important to any people and the information is needed around a
people so that people can retrieve information around the user. For example, a soldier
who wearing a wearable device during a war. Some information regarding enemy’s
position is shown through their wearable device and those information has to be carried
around the soldier which means that the soldier does not have to keep contact with their

CHAPTER 1 INTRODUCTION
BCN (HONS) Communications and Networking
Faculty of Information and Communication Technology (Perak Campus), UTAR 3
base station during the war. In this case, we can clearly see that high mobility of
information centre is needed.
We have discussed about how the displays of wearable would benefits to us. However,
there are some problems encountered on the display of wearable device.
Lack of proper display structure
Some wearable device do not organize their display structure well before showing the
information to user and sometimes the text message and information is being displayed in
a complicated way. This can causes a particular user is confusing and difficult to
understand with the display on their wearable. In this era, a proper display structure is
needed to convey certain information to users for better acquisition and interpretation of
those information.
Lack of good interpretation method
People are unable to interpret information displayed in wearable in a quick and fast way
if the method of display is not suitable. For instance, some information shown on
wearable in such a way that text message are close and gathered together. Instead of
showing up the text message at one time, wearable can convey some information in form
of symbol. Symbols are important because they can facilitate communication and
identification of ideas and can have literal as well as figurative meanings.
Lack of effective display structure for health monitoring data
People who have awareness of important of body health is having difficulties in viewing
their body status information on wearable since some of wearable do not plan on how to

CHAPTER 1 INTRODUCTION
BCN (HONS) Communications and Networking
Faculty of Information and Communication Technology (Perak Campus), UTAR 4
organize to show the data as an information towards users. A good display structure can
let user quickly knowing their overall health status at a glance. For example, a graphical
display of information and deploying colour for showing status of health can be easily
understood and interpreted by people who care about their own body health.
1.2 Project Objectives
Nowadays the wearable are becoming a new trend and are very convenient to user, these
wearable targeting most of the field including health care field. Therefore, this project
will carry out to overcome the problem of display structure of wearable
The main objective of this project are:
To construct easily understandable and effective information display structure by
using different form like symbol, colour, and graphical presentation.
To create innovative information display structure for quick information
interpretation on wearable.
To develop an effective information display for health monitoring by
implementing some smart feature inside the applications.
1.3 Project Scope
This project aims to develop an android application which running on wearable
device. The focus of this project is to provide and create a proper display interface for
user to view important and relevant information. The display on wearable interface

CHAPTER 1 INTRODUCTION
BCN (HONS) Communications and Networking
Faculty of Information and Communication Technology (Perak Campus), UTAR 5
should be easily understand and interpret by the user. This project should also display
user’s body health status to let user to know their body health condition by glancing
through the interface. This will be a useful application for user who needs to know their
body conditions info quickly through their wearable device. Therefore, in this project, an
information centre dashboard or graphical presentation will be utilize smart features, and
display critical and useful info to user. Besides, this project also provide some self-
healthcare advisory to user. In short, the project scope is listed as below:-
Aims to develop effective info structure which implement on wearable device.
Create a good presentation of content for user to view info.
Provide status of body health information to user in an effective way.
Create symbolic information display structure.
Self-health care advisory.
1.4 Expected Contribution from the Project
Wearable such as smartwatch will become available in the market sooner or later,
which the interface will have a smaller size. The expected contribution of this project is
to provide user with good display structure of info in wearable devices since in this
modern society, there is a necessary that the users can view the information display on
the face of wearable quickly which means the display should present the most important
information to users.

CHAPTER 1 INTRODUCTION
BCN (HONS) Communications and Networking
Faculty of Information and Communication Technology (Perak Campus), UTAR 6
This project will create a proper displays on wearable provides a quick glance of the most
important and relevant information from the application interface. This is why a new way
is required that will make changes to interaction between user and wearable which allow
user to have quick glance by using picture or symbol. Imagine how people feel when look
at a wearable device close to their face, they probably feel that the text on interface is too
small to read. Therefore, a wearable’s success will largely depend on how effectively
make use of glances and can provide convenient way for user to grab information.
1.5 Organization of the report
Chapter 1 describe the motivation and problem statement, expected contribution from
the project, objectives and scope of the project. In chapter 2, we will review the
technologies of the project and review other related or similar applications. In chapter 3,
we will discuss few methodologies and select suitable methodology to develop this
project, system requirement, functional requirement, expected system testing, expected
challenges, project milestone and estimated cost. In chapter 4, we will discuss the system
design in this project. How does the project’s system flow, functional modules of the
project, and GUI design. In last chapter, there is a conclusion to summarize the whole
project

CHAPTER 2: LITERATURE REVIEW
BCN (HONS) Communications and Networking
Faculty of Information and Communication Technology (Perak Campus), UTAR 7
CHAPTER 2: LITERATURE REVIEW
2.1 Review of the Technologies
Wearable computer or body-borne computer, are small, portable and interactive
computer that can wear on our body. . This class of wearable technology has been
produced or developed for specific purpose. Wearable computer are particularly helpful
for applications that need more complex computational support for example,
accelerometer or gyrators. An example of modern wearable computer, Fitbit system,
allow users to monitoring his/her distance walked, calories burned in a wristband. For
another instances is Google Glass which can interact through some gesture movement of
user. A common features of wearable computer is there is a constant interaction between
wearable and a particular user, so this not require a user to open or close wearable device
constantly.
In most of the applications, user’s body will actively engaged as the device’s
interfaces, which include your hands, eyes, skin and your body motion. This technology
is largely applied in the field of health care monitoring system.
2.1.1 Hardware Platform
Wearable computing is an evolution of the computing hardware. The first
invention of computer is Mainframe computer, then come with desktop computer or
personal computer. After that come with a portable computer allow people to work
anywhere. Then, a small computing technology that enable user to carry in proximity
with their body and stick everywhere with user.

CHAPTER 2: LITERATURE REVIEW
BCN (HONS) Communications and Networking
Faculty of Information and Communication Technology (Perak Campus), UTAR 8
The internal hardware of wearable devices is various. For example, many of them
have a rechargeable battery, graphical display as well as touch screen. The hardware
platform used by wearable device, Apple Watch, is 32-bit ARM architecture (ARMv7-A).
One of the big concern of wearable hardware is energy. A good power
management in wearable device allow the wearable computer to function with a longer
period. Peripheral devices may have accelerometer, barometer, thermometer, GPS and
speaker. These feature or embedded sensors can collect some information from external
or internal environment. The hardware may support wireless technologies like GPS, Wifi,
and Bluetooth.
2.1.2 Operating System
Different wearable devices runs different operating system. For example, Apple
Watch runs Watch OS, which is based on iOS operating system and has many features
similar to features in iOS. The Apple Watch is running watchOS and the API called
WatchKit. Another famous OS for wearable devices is Android Wear. Android Wear
support both Wi-Fi and Bluetooth connectivity. Pebble OS is used for pebble watch and
Samsung Gear runs Tizen as their OS.
2.1.3 Programming Language
There a few programming language that can be used to develop apps for wearable
devices. Objective- C or Swift is the programming language used by Apple watch. For
Android Wear commonly used Java. Pebble watch can be developed using C language
and Samsung gear watch uses HTML5 or C to develop their apps.

CHAPTER 2: LITERATURE REVIEW
BCN (HONS) Communications and Networking
Faculty of Information and Communication Technology (Perak Campus), UTAR 9
2.1.4 Summary of the Technologies Review
Wearable computing technologies is a new trend in this modern society. Since the
demand of this kind of technology is increasing, many company that come out with this
wearable product keep finding ways to improve the features or hardware component of
wearable, for example reducing the battery consumption of wearable to have a long
lasting period. Besides, software developer also striving to create applications in those
wearable devices to bring enormous advantages to mankind. Table below shows some
review of technologies used by few wearable devices in the current wearable devices’
market.
Development
platform
Operating
System
Programming
language
SDK IDE
Apple Watch Watch OS Objective-C /
Swift
WatchKit Xcode
Android Wear Android
Wear
Java Android Wear Eclipse or
Android Studio
Pebble Pebble OS C Pebble CloudPebble
Samsung Gear Tizen HTML5 / C Samsung -
Table 2.1.4 Review of wearable development platform

CHAPTER 2: LITERATURE REVIEW
BCN (HONS) Communications and Networking
Faculty of Information and Communication Technology (Perak Campus), UTAR 10
2.2 Review of Existing Applications
In this section of literature review, we explore the notion of display of different wearable
device more broadly to understand possible alternative user interface design. In this
section will be examine the different capabilities of existing wearable display structure,
several product concepts and research to show how different wearable device use
different user interface design to create their “smart” way to show info to user.
2.2.1 Apple watch OS2 app (Strava)
Figure 2.2.1 Strava app running on Apple Watch OS 2
Strava is a great all round fitness app that will track your runs, rides and cross training. It
gives you stats on your speed, distance, elevation, calories burned and more. This app

CHAPTER 2: LITERATURE REVIEW
BCN (HONS) Communications and Networking
Faculty of Information and Communication Technology (Perak Campus), UTAR 11
showing info of distance traveled by users for each week in a column bar. Besides,
different color is used to let user have a clearer view on the dashboard.
Strength: Strava display its information in a combination of circular structure and the use
of color wisely to let users get to know their desirable info in a quick and “smart” way in
their wearable device.
Weakness: Strava app do not show much info in a single user interface and user have to
move to next page to view more info on wearable.

CHAPTER 2: LITERATURE REVIEW
BCN (HONS) Communications and Networking
Faculty of Information and Communication Technology (Perak Campus), UTAR 12
2.2.2 LG Watch R app (V08 watch face)
Figure 2.2.2 V08 watch face app on LG Watch R
The V08 can display many helpful information to users. One of the features is that it can
show local time and UTC time at top of the watch face using circular display structure. It
also show information about weather such as temperature (oF or oC), wind speed, show
wind direction in circular display structure, humidity (0%-100%) and atmospheric
pressure. Some symbol and abbreviation is being used in V08 to save the display space in
order to show more information to user. Besides, it can also show sunrise and sunset
event.

CHAPTER 2: LITERATURE REVIEW
BCN (HONS) Communications and Networking
Faculty of Information and Communication Technology (Perak Campus), UTAR 13
Strength: V08 watch face’s display structure for time, weather, sunrise or sunset event
all are separate by rectangular border shape whereby the information will not mix up with
each other and info are group together on each section based on category.
Weakness: V08 watch face did not show any information related to health monitoring.
User also require to takes some time to digest all info shown on single interface.
2.2.3 Asus ZenWatch app (F04 Watch face)
Figure 2.2.3 F04 watch face app on Asus ZenWatch
F04 watch face show an easily understood display to users mainly about the weather. F04
separate the display structure by using five section where each section show different
category of information. One of the section shows weather forecast information from

CHAPTER 2: LITERATURE REVIEW
BCN (HONS) Communications and Networking
Faculty of Information and Communication Technology (Perak Campus), UTAR 14
now to future three hours and weather of tomorrow in separated column. Besides, the
moon phase and sunset/sunrise event is shown in a circular graphic manner. F04 also
shows weather condition which consist of temperature, wind speed, wind direction,
humidity and atmospheric pressure at below rectangular section. Some abbreviation is
used to simplify the words in F04, some symbol is also used to represent the weather.
Strength: F04 watch face is can show almost all info related to weather of different
category on different section.
Weakness: Its weakness is that not much color is used to show the info to user.

CHAPTER 2: LITERATURE REVIEW
BCN (HONS) Communications and Networking
Faculty of Information and Communication Technology (Perak Campus), UTAR 15
2.2.4 Moto 360 app (A48 watch face)
Figure 2.2.4 A48 watch face app on Moto 360
There are many features can be found on A48 watch face on Moto 360. There is a good
designer’s full function watch face for user. It shows pedometer of today and yesterday,
step counts of the day and total elapsed walking or running time of the day. Besides, it
show real-time heart Rate in beats per minute unit in a circular structure. For A48, it
show weather forecast in a column form which can shows weather today with different
time interval and weather of tomorrow to user. Furthermore, A48 has feature to monitor

CHAPTER 2: LITERATURE REVIEW
BCN (HONS) Communications and Networking
Faculty of Information and Communication Technology (Perak Campus), UTAR 16
sunrise and sunset event, it shows the time and countdown for sunrise and sunset in a
semicircular display structure.
Strength: A48 watch face for Moto 360 can let user to choose their favorite color from 7
LED Color.
Weakness: The display of info is not separated by shape border or section which will
cause info to mix up together.
2.2.5 Huawei Watch app (activity monitoring)
Figure 2.2.5 Activity monitoring app for Huawei Watch
Great in using symbol with color to shows different important info to user. The display
structure is good since Huawei Watch is utilized circular with some info shown inside the
circle. The use of abbreviation is appropriate and different color is used to differentiate
among information. The different font size in this activity monitoring’s app is used so
that users can view important info with larger font size.

CHAPTER 2: LITERATURE REVIEW
BCN (HONS) Communications and Networking
Faculty of Information and Communication Technology (Perak Campus), UTAR 17
Strength: The Huawei Watch activity monitoring app use a good way to deliver info in
form of symbol, color and its display structure.
Weakness: Lack of animation in the app.
2.2.6 Sony SmartWatch 3 app (Endomondo)
Figure 2.2.6 Endomondo app on Sony SmartWatch 3
Endomondo apps can be installed in Sony SmartWatch 3, this app is hugely popular
fitness platform for android wearable. The use of abbreviation is very frequent in
SonySmart watch 3. Endomondo make use of different font size to let user view most
important info at a glance.
Strength: Simple and straight forward user interface made user easy to react with the
wearable display.
Weakness: Less info can be shown to user with the display of screen on wearable and
there is less animation and graphical presentation to let user have a glance to know every
important info.

CHAPTER 2: LITERATURE REVIEW
BCN (HONS) Communications and Networking
Faculty of Information and Communication Technology (Perak Campus), UTAR 18
2.2.7 Summary of Existing wearable applications’ display structure
Apple
Watch OS 2
( Strava )
Sony
SmartWatch
3
(Endomondo)
Moto 360
(A48 watch
face)
Huawei
Watch
(activity
monitor-
ing app )
Asus Zen
Watch
(F04
watch
face)
LG G Watch
R
(V08 watch
face)
Symbol Yes Yes Yes Yes Yes Yes
Colour
(pixel)
Yes, 326ppi Yes,
224ppi
Yes,
205ppi
Yes,
286ppi
Yes,
278ppi
Yes,
247ppi
Animation Excellent Moderate Good Good Moderate Moderate
Abbreviation Frequent Frequent Frequent Less Less Less
Display
structure
Excellent Good Excellent Good Moderate Moderate
Strength Utilize
combination
of circular
display
structure
and color
wisely
Simple UI
made user
easy to react
with wearable
display
Let user
choose their
favorite
color from 7
LED color
Good
display in
the form
of display
structure,
color and
symbol
Show
info of
different
category
on
different
section
Can separate
all info by
using border
to group info
of same
category on
one section
Weakness Do not show
much info
on single
app page.
Display less
info, less
animation,
less graphical
presentation
Display of
info do not
separate by
shape
border, info
mix together
Lack of
animation
Lack of
color
used
Takes times
for user to
digest all info
shown in
single
interface.
Table 2.2.7 Comparison of different wearable app display structure

CHAPTER 2: LITERATURE REVIEW
BCN (HONS) Communications and Networking
Faculty of Information and Communication Technology (Perak Campus), UTAR 19
2.3 Concluding Remark
Only few of the existing apps’ display in wearable having a good method of information
display. Most of the existing apps do not have a proper and organized way of info display
although the interfaces is presenting many info for reader. Too many info inside one
small interfaces of wearable may made reader takes time to find particular info that the
user need to know. Furthermore, few of existing applications do not utilize the use of
symbol, colour, and symbol together to make their info display easier to read by user.
2.4 Resolved Solution
Result of the study uncovered the following requirements of this project in order to
overcome issue of lack of proper display structure on wearable interface.
Wearable design specification:
Glances and not stares. A quick glance on the display of wearable is required in
this modern lifestyle. This can be achieved only by using a good and proper
display structure on wearable. Spend a long time to read information from a
device is waste of time and spending longer time erodes any advantage over a
smartphone.
Interact once, display many times. A smart wearable should primarily provide
displays of information in animation to show abundant info to user. A user need
only provide less input to the wearable as a command then some animation would
automatically show to user. Thus, this is consider a “smart” to convey information
to user.

CHAPTER 3: SYSTEM METHODOLOGY
BCN (HONS) Communications and Networking
Faculty of Information and Communication Technology (Perak Campus), UTAR 20
CHAPTER 3: SYSTEM METHODOLOGY
3.1 System Development Models
In this section, an analysis of three software development process models will be carry
out and discussed. The three software process models are Waterfall Model, Agile Model,
and Throw-away prototyping. By comparing those model, the most suitable process
model will be selected for this project.
3.1.1 Waterfall Model
The Waterfall Mode is a traditional software development process that consist of 5
phases which is Analysis, Requirements specification, Design, Implementation, Testing
and Integration and Operation and Maintenance.

CHAPTER 3: SYSTEM METHODOLOGY
BCN (HONS) Communications and Networking
Faculty of Information and Communication Technology (Perak Campus), UTAR 21
Figure 3.1.1 Waterfall Model
For Analysis and Requirements Specification phases, the developer will do some
researches and collect the requirement from the user. This is to determine the software or
system features. In Design phase, software developer will determine that which method is
being used to develop the system. For the Implementation phase means that the software
will be start coded and produce the outcome based on the previous phase. In Testing and
Integration phase, the software will be integrated and tested before delivered to the
customer. The last phase, which is Operation and Maintenance means that software will
keep maintenance time by time to ensure that it is perform well.

CHAPTER 3: SYSTEM METHODOLOGY
BCN (HONS) Communications and Networking
Faculty of Information and Communication Technology (Perak Campus), UTAR 22
The advantages of Waterfall Model is all the requirement will be collected in Analysis
and requirement specification phase. When proceed to Design and Implementation phase,
the requirement will cannot be change. So, we can focus on implementing and design the
software.
3.1.2 Incremental Development
Figure 3.1.2 Incremental Development
Incremental development is one of the common software process models. The idea of
incremental development is divide the system into few small sub-systems and develop it
one by one. Each of the sub-systems had its own life cycle (waterfall model) when
developing it. Once the sub-system is done and release, it will be ready to integrate with

CHAPTER 3: SYSTEM METHODOLOGY
BCN (HONS) Communications and Networking
Faculty of Information and Communication Technology (Perak Campus), UTAR 23
other sub-system which is done using the same method. The development time for each
sub-system will be short. This is to allow the developer to get the feedback from the user
so that the system can be enhanced. Once all the sub-system are done and no more
change request from the customer, the system can combined into a full complete system
can ready to deliver to customer.
The advantages of this model are the risk and the complexity can be reduced since we
will keep on gaining feedback from the customer. The disadvantages of this model is the
needed of time and recourse will be more because we need keep on changing the system
based on the feedback of customer.
3.1.3 Throw-away Prototyping
Figure 3.1.3 Throw-away Prototyping

CHAPTER 3: SYSTEM METHODOLOGY
BCN (HONS) Communications and Networking
Faculty of Information and Communication Technology (Perak Campus), UTAR 24
The throw-away prototyping is one of the modern software process models. It is one of
the Rapid Application Development (RAD) methodologies and it is similar with
prototyping method. In Throw-away prototyping, the system will develop part by part.
When the small part of the system is complete, the system will give to the customer to try
and evaluate. The prototype will be thrown away once it is delivered for experiment. The
throw-away prototype cannot consider as final system, the purpose of it is to make the
requirement become clearer after the evaluation of customer.
The advantages of Throw-away prototyping is the delivered system will be more quality
and the problems and errors can be identify early since there are keep evaluate by the
customer. The disadvantages of it are the development time will be longer and the
developer may use too much time focus on one part on the system that will cause the
delivered time delayed.
3.1.4 Selecting a Software Development Process Model
After evaluate and analysis the three software process model. The throw-away
prototyping will be chosen as a software development life cycle throughout the whole
project lifetime. The reason of choosing this model is because the system can be dividing
into several task based on the objectives. By this the complexity will be reduced and the
success rate of the project will be higher. In addition, this project is developing
application with GUI, so it is important to produce the prototype for user to experiment
and evaluate it time by time.

CHAPTER 3: SYSTEM METHODOLOGY
BCN (HONS) Communications and Networking
Faculty of Information and Communication Technology (Perak Campus), UTAR 25
3.2 System Requirement
This project requires hardware listed below and some software tools to develop the
mobile application.
3.2.1 Hardware
The technologies and tools involved in this project are as below:
i) Newton board
ii) 2 Universal Serial Bus (USB) Cables
iii) Hardware (disk capacity at least 128 GB and RAM size at least 4GB).
iv) Software (Korulab SDK is recommended)
Newton platform come from a company called Ingenic, the strength features of this
platform is high performance with low power consumption. Ingenic is a moderately low
profile organization that is focus around semiconductors and gadgets and was established
in Beijing, China in 2005. Diagram below shows the development Kit of Newton.

CHAPTER 3: SYSTEM METHODOLOGY
BCN (HONS) Communications and Networking
Faculty of Information and Communication Technology (Perak Campus), UTAR 26
Figure 3.2.1 Newton Development Kit
3.2.2 Software
This project development require some of the software tools:
i. Java Eclipse and Android Studio.
ii. Java programming language.
Java Eclipse or Android Studio both are integrated development environment for
developing Android platform. Currently, Android Studio is being used to develop this

CHAPTER 3: SYSTEM METHODOLOGY
BCN (HONS) Communications and Networking
Faculty of Information and Communication Technology (Perak Campus), UTAR 27
project. Android Studio is an official IDE for android development. This project
development need this software to compile codes and runs the application in an emulator
of Android Studio. Some additional software is also installed into Android Studio which
is SDK packages and system image for wearable devices.
3.3 Functional Requirement
The functional requirements of prototype of project 1 include:
Develop health monitoring applications on wearable that will prompt user to input their
goal in the applications.
In the prototype, there will be a progress bar that can show user’s progress. The progress
bar can show their progress according to the goal that the user set previously.
The health monitoring application must contain some “smart” feature or ways to notify
user regarding to their progress or status.
3.4 Expected System Testing and Performance
During the development of this project, many testing is carried out to ensure the system
will run in an expected result. In this health monitoring applications, the angle of progress
bar that shows user’s progress is expected to be shown accordingly based on the goal set
by user. After each user reach his or her goal, the apps is expected to have some visual
effect to notify user that he or she already reach their goal.

CHAPTER 3: SYSTEM METHODOLOGY
BCN (HONS) Communications and Networking
Faculty of Information and Communication Technology (Perak Campus), UTAR 28
3.5 Expected Challenges
For many wearable device, the display is the key and major new challenge because the
information need to be show in very small interface on the wearable device (Soneira,
2014).
During the development of this project, some challenges can be expected. First of all,
graphical dashboard design is major obstacles for apps developer to create and organize
since the graphical presentation are easier to view in larger device, unlike the small
interfaces of wearable. The way of using animation, symbol, and color must use
appropriately to generate a good presentation content. Besides, the display must be
simple and easily to understand by user because interfaces that too complicated will made
user feel annoying when finding their desired info in small interfaces of wearable devices.
Therefore, a good display structure must be created to enable user to have a glance on
their wearable device to know the information. Furthermore, the system must have some
smart feature to display information in a smart way to inform user which is also another
challenge in this project.

CHAPTER 3: SYSTEM METHODOLOGY
BCN (HONS) Communications and Networking
Faculty of Information and Communication Technology (Perak Campus), UTAR 29
3.6 Project Milestone
Activity Start
Date
End Date Activity Details
Project
Start
18/1/2016 25/1/2016 Research and Data Collection
Milestone
1
26/1/2016 1/2/2016 Define the software involved (eg, Android studio,
Eclipse)
Milestone
2
2/2/2016 8/2/2016 Familiarize with Java emulation tools
Milestone
3
9/2/2016 15/2/2016 Specify system requirement and start develop the
function
Milestone
4
16/2/2016 29/2/2016 Continue with the function development
Milestone
5
1/3/2016 5/3/2016 Testing
Milestone
6
6/3/2016 6/3/2016 List out and complete with the project timeline
Milestone
7
7/3/2016 7/3/2016 Correct and finalize report
Project
End
8/3/2016 8/3/2016 Submission of final report
Table 3.6.1 List of the activities and milestone of Project I

CHAPTER 3: SYSTEM METHODOLOGY
BCN (HONS) Communications and Networking
Faculty of Information and Communication Technology (Perak Campus), UTAR 30
Activity Start
Date
End Date Activity Details
Project
Start
1/6/2016 3/6/2016 Research and Data Collection
Milestone
1
4/6/2016 8/6/2016 Understand and define the system flow of the
application
Milestone
2
9/6/2016 9/7/2016 Setup database and testing
Milestone
3
10/7/2016 30/7/2016 Coding
Milestone
4
1/8/2016 10/8/2016 Implementation and UI design
Milestone
5
10/8/2016 20/8/2016 Fixing bug or logic error in the system
Milestone
6
20/8/2016 24/8/2016 Final Testing of application
Milestone
7
24/8/2016 26/8/2016 Correct and finalize report
Project
End
26/8/2016 26/8/2016 Submission of final report
Table 3.6.2 List of the activities and milestone of Project II
In this project, due date is being set at 15/3/2016. Since the date and time is limited, a
project timeline and milestone is created to ensure that this project can be completed
before the due date.

CHAPTER 3: SYSTEM METHODOLOGY
BCN (HONS) Communications and Networking
Faculty of Information and Communication Technology (Perak Campus), UTAR 31
Therefore, during the execution of the project, the milestones is being review every time.
Milestone can add significant value to project management and scheduling. It can mark at
specific points in a particular project. In this project, a few milestone have been set. After
a small milestone is completed, then the next milestone is targeted to make sure the
progress project is keep on going smoothly, until the project is finish. The milestone
allow us to manage a project more efficiently and to determine whether the project is on
schedule and on the right track.
Besides, a list of activities that required to complete this project has been identified.
Those activity are categorized into a work breakdown structure. Critical path method is
used for identify the highest priority in the project and duration needed to complete each
sub-task of the project. The activities wad planned carefully so that dependencies of each
sub-task is known, for example, task B cannot be done if task A is not completed. The
purpose of using this critical path method is to ensure that whole project is not delay by
achieving each sub-task on the right sequence and on time. After the list of activities is
listed out. Then, each milestone was targeted in order to accomplish the project.
The first milestone is to do some research and data collection on wearable devices and
some user interface of few wearable (UI) and also review the user experience (UX) on
each wearable device. The second activity is to define and determine software required to
complete. In this step, Eclipse, which is an integrated development environment (IDE) is
chosen as the tools that used to accomplish the project. Then, the third milestone is to
familiarize with Java language as well as android wear emulator tools. Android SDK
tools has been downloaded to be used as a tool to emulate the android wear. Then, system
and function requirement is specified and start develop the function using Java. Then,

CHAPTER 3: SYSTEM METHODOLOGY
BCN (HONS) Communications and Networking
Faculty of Information and Communication Technology (Perak Campus), UTAR 32
next milestone is to test the function several time to make sure there is no bug or error
during execution of the function. After the testing phase is finish, the report is written
based on the function developed. Before 3/8/2016 (Monday), the report is finalized and
submitted on time.
Figure 3.6.1 Gantt-chart for Project I

CHAPTER 3: SYSTEM METHODOLOGY
BCN (HONS) Communications and Networking
Faculty of Information and Communication Technology (Perak Campus), UTAR 33
Figure 3.6.2 Gantt-chart for Project II

CHAPTER 3: SYSTEM METHODOLOGY
BCN (HONS) Communications and Networking
Faculty of Information and Communication Technology (Perak Campus), UTAR 34
3.7 Estimated Cost
Items For Final Year Project
Development
For Commercialisation
Usage
Android Studio(software) Free Free
Device for running apps Emulator (Free) Wearable device ( running
Android 4.4 and above)
At least 700 MYR
Total 0 MYR At least 700 MYR
Table 3.7 Estimated cost
3.8 Concluding Remark
The final year project 1 uses throw-away prototyping development mode. The throw-
away prototyping will be chosen as a software development life cycle throughout the
whole project lifetime since it is important to re-produce the prototype for user to
experience and evaluate it time by time.
To develop the application in wearable device, there are several hardware and software
which can support developing Android application such as an Android operating system,
a laptop or pc for android studio software and etc.
The functional requirements in this project include progress or status bar to show user’s
progress, show some smart feature to inform user regarding the info.

CHAPTER 3: SYSTEM METHODOLOGY
BCN (HONS) Communications and Networking
Faculty of Information and Communication Technology (Perak Campus), UTAR 35
The expected challenges included required a good graphical presentation in small
interface of wearable device and the proper display structure of applications. Besides,
symbol and color must use appropriately to produce simplified and understandable info to
user.
The project milestone used to track the project management in this project. This project
had reached the entire milestone and all the tasks in the project are on track. The
Estimated costs for final year project development are free, because the software tools
used is an open source which is free, and the hardware are using own hardware such as
laptop to run an emulator. For commercialization usage user need to own a wearable
device which running Android OS which is approximately 700 MYR at least.

CHAPTER 4: SYSTEM DESIGN
BCN (HONS) Communications and Networking
Faculty of Information and Communication Technology (Perak Campus), UTAR 36
CHAPTER 4: SYSTEM DESIGN
4.1 System Architecture
Figure 4.1 System Architecture Design
4.2 Functional Modules in the System
There are seven function modules in this project, profile function, Step Tracker function,
Sleep Monitoring Function, Calories Burned Record function, and Body Mass Index
(BMI) function.
Advisory function, users can view the recommended health-care advice from this
function. The system will get the latest health value of the users from SQLite database
within the wearable device and generate some useful advice for the users to improve the
health condition of particular user.

CHAPTER 4: SYSTEM DESIGN
BCN (HONS) Communications and Networking
Faculty of Information and Communication Technology (Perak Campus), UTAR 37
User health profile, this function allow users to quickly view their overall health profile.
The system will get the latest health data of user from database and present user’s latest
health condition in a simple text form.
Historical chart function, user can view their profile details of various kind of progress
and their own history record. Therefore a user can quickly know all their records in this
profile function. The historical graph is being shown to user in an automated way without
much input from user.
Step tracker function, user may set their target goal for number of steps taken in each day.
A progress bar status is being shown accordingly to user which depends on the goal that
user have been set for it. Some smart features in the progress bar will be shown to user if
a particular user have achieved their target goal.
Calories Burned checking function, a line graph will be generated for showing the history
of calories burn by that user in a daily manner (Monday, Tuesday, Wednesday, etc).
Sleep Monitoring function, showing information regarding total hours of sleep by
yesterday and further dividing total hours of sleep and categorizing them into deep sleep,
light sleep, and hours of awake in the midnight.
Body Mass Index (BMI) function, prompt input of height and weight of the user and
calculate their BMI value, showing their status and giving some advice to user. The BMI
value is divided into five categories which are underweight, normal, marginally
overweight, overweight and obesity.

CHAPTER 4: SYSTEM DESIGN
BCN (HONS) Communications and Networking
Faculty of Information and Communication Technology (Perak Campus), UTAR 38
4.3 System Flow
Figure 4.3 System Flow Design

CHAPTER 4: SYSTEM DESIGN
BCN (HONS) Communications and Networking
Faculty of Information and Communication Technology (Perak Campus), UTAR 39
The flowchart shows the results outcome based on the user input. The system will launch
a splash screen when the application is started, then user will redirect to main menu page
which consists of three function followed by a float button menu with other few functions.
User can view their latest health profile and track their history health data in the main
page, besides, user can also view the health advisory by clicking the historical chart
buttons shown in the main page.
In the selection in the float button menu, there are five available function which are step
tracker function, sleep monitoring function, BMI function, calories burned checking
function and exit function.
Furthermore, all of the function in the application will get some data from the local
database and display those data in a graphical presentation to users.

CHAPTER 4: SYSTEM DESIGN
BCN (HONS) Communications and Networking
Faculty of Information and Communication Technology (Perak Campus), UTAR 40
4.4 Database Design
The database named “Userprofile” is being created locally by using SQLite. Inside this
database, there is a user table.
Database Tables
Name Type Not Null Default Value Primary Key
TIMESTAMP DATETIME 0 Null 1
STATUS TEXT 0 Null 0
STEP INTEGER 0 Null 0
SLEEP INTEGER 0 Null 0
BMI DOUBLE 0 Null 0
CALORIES INTEGER 0 Null 0
Table 4.4.1 User table

CHAPTER 4: SYSTEM DESIGN
BCN (HONS) Communications and Networking
Faculty of Information and Communication Technology (Perak Campus), UTAR 41
4.5 Use Case Diagram
Figure 4.5.1 Use Case Diagram Design

CHAPTER 4: SYSTEM DESIGN
BCN (HONS) Communications and Networking
Faculty of Information and Communication Technology (Perak Campus), UTAR 42
4.6 GUI Design
Figure 4.6.1 Sketch of basic GUI design
As in the sketch of prototype GUI design, the interfaces contain basically have one edit
text to prompt some input from user, a progress bar that will show their health monitoring
result, and a button that can view next record or return into the main page.
After a user select one of the function in the main menu, a progress bar will show to user
to indicate that the percentage of their activity compare to the goal ,which the user have
been set their target goal earlier.
Besides, a dashboard regarding their history of the activity will be shown at below
position of the progress bar to let user have an overview on their activities history.

CHAPTER 4: SYSTEM DESIGN
BCN (HONS) Communications and Networking
Faculty of Information and Communication Technology (Perak Campus), UTAR 43
Figure 4.6.2 Splash screen design Figure 4.6.3 Main menu page design
Figure 4.6.4 FloatButtonMenu design(1) Figure 4.6.5 FloatButtonMenu design(2)

CHAPTER 4: SYSTEM DESIGN
BCN (HONS) Communications and Networking
Faculty of Information and Communication Technology (Perak Campus), UTAR 44
Figure 4.6.6 Step tracker progressbar design Figure 4.6.7 Sleep monitoring progressbar
Figure 4.6.8 Bar chart design Figure 4.6.9 Line chart design

CHAPTER 4: SYSTEM DESIGN
BCN (HONS) Communications and Networking
Faculty of Information and Communication Technology (Perak Campus), UTAR 45
In above GUI design, the main menu page consist of buttons and a float button menu.
Each of the button would redirect user to another new activity or functions. Some
function would using the color progress bar to show the user’s progress towards their
goals. The color of the progress bar will change accordingly to show user about how
much effort left to achieve their own goal. For example, for the step tracker function, red
colour inside the progress bar shows that user’s left many steps to achieve their goal,
while green colour means user have to walk few more steps to achieve their goal or
already achieve their goal.
4.7 Concluding Remark
This chapter is about the system design of the project. There will be seven functional
modules in this project; it included advisory function, user health profile function, Step
Tracker function, Sleep Monitoring Function, Calories Burned checking function, and
Body Mass Index (BMI) function. The system architecture is shown in figure 4.1 and the
applications will be deploy at small wearable devices. Figure 4.6.1 shows the sketch of
GUI design at the early stage planning of this project. A table is created in the SQLite
database which containing six column field which representing the timestamp of the
health data insert (attribute field name: TIMESTAMP), current status of user whether
they achieved their goal or not (attribute field name: STATUS), number of hours sleep
(attribute field name: SLEEP), number of step taken by user (attribute field name: STEP),
current Body Mass Index, BMI value of user (attribute field name: BMI), amount of
calories burned by user (attribute field name: CALORIES). The table design and table
details are shown in Table 4.4.1 including the attribute name and type of the attribute.
The system flow diagram is shown in Figure 4.3.1 to show how the flow of the

CHAPTER 4: SYSTEM DESIGN
BCN (HONS) Communications and Networking
Faculty of Information and Communication Technology (Perak Campus), UTAR 46
application is. As in the GUI design shown above, Figure 4.6.3, 4.6.4, 4.6.5 shows some
symbol to user to save user time to read the description text beside since appropriate
symbols is being used to describe each of the function inside the application. However,
the description text is shown to user too incase some user did not understand the symbol
used at the first time they deal with this new application. In the figure 4.6.8, the bar chart
design used different color to represent each data in x-axis instead of using the same
color in the bar chart. Therefore, this can avoid some confusion or misread their health
profile while user trying to interpret the graph

CHAPTER 5: SYSTEM IMPLEMENTATION
BCN (HONS) Communications and Networking
Faculty of Information and Communication Technology (Perak Campus), UTAR 47
CHAPTER 5: SYSTEM IMPLEMENTATION
5.1 Hardware Setup
Figure 5.1 Hardware Setup
In hardware setup, the android wear device need to be connected to development kit.
Then the development kit is connected into personal computer or laptop via USB for
application debugging and apk installation.

CHAPTER 5: SYSTEM IMPLEMENTATION
BCN (HONS) Communications and Networking
Faculty of Information and Communication Technology (Perak Campus), UTAR 48
5.2 Software Setup
In the software setup, we need to install several software to develop the application.
a) We need to install Android Studio IDE into laptop or personal computer to
develop the mobile application.
b) We need a virtual device for debugging and testing purpose, a virtual device need
to be opened in Android Studio.
c) We also need a SQLite Manager Tools to monitor the database that created
locally in the wearable device.
5.3 Setting and Configuration
Installing Android Studio and setup environment
Step 1 : Download and launch the Android Studio installer on your PC from
the Android Studio home page.
Step 2 : Follow instruction on setup wizard in order to install Android Studio.
Step 3: We need to set an environment variable to direct installer to proper location.
Click Start Start menu > Computer > System Properties > Advanced
System Properties. Then, open the “Advanced” tab and
Click onto “Environment Variables.” From here, add a new system variable
called JAVA_HOME that points to your JDK folder.
Installing SDK needed to develop application
Step 1 : Open Android Studio.
Step 2 : On tab above, click Tools > Android > SDK Manager.
Step 3 : Select and install any version of API needed and Intel x86
Emulator Accelerator (HAXM).

CHAPTER 5: SYSTEM IMPLEMENTATION
BCN (HONS) Communications and Networking
Faculty of Information and Communication Technology (Perak Campus), UTAR 49
Figure 5.3.1 API installation on Android SDK Manager
Creating android wear (virtual device) on Android Studio
Step 1 : Open Android Studio, click Tools > Android > AVD Manager.
Step 2 : An AVD Manager page will pop out. Click create virtual device, to create the
virtual device.
Step 3 : Choose the type of virtual device needed to create your own desire device.
Then click Finish.

CHAPTER 5: SYSTEM IMPLEMENTATION
BCN (HONS) Communications and Networking
Faculty of Information and Communication Technology (Perak Campus), UTAR 50
5.3.2 Android Virtual Device Manager
5.3.3 Android Virtual Device selection and setup

CHAPTER 5: SYSTEM IMPLEMENTATION
BCN (HONS) Communications and Networking
Faculty of Information and Communication Technology (Perak Campus), UTAR 51
Installing SQLite Manager
Step 1 : First, download latest version of Mozilla Firefox installer. After finish
download, click Mozilla Firefox.exe to open the browser.
Step 2 : Click more list at top right side of firefox browser. Click “Add-ons”.
Step 3 : Then click the “Plugins” on the left pane and search for SQLite Manager and
download it.
Figure 5.3.4 Download add-ons of SQLite Manager on Mozilla Firefox
Extracting local database file on virtual device
Step 1 : Open Android Studio. Click Tools > Android > Android Device Monitor.
Step 2 : From the Android device monitor box, select File Explorer > Select Running
Virtual Device > data > data > [name of your application] > databases >
[select databases file with extension .db] > pull a file from a device
Step 3 : Now, you can open SQLite manager to view and monitor your database file
create on the virtual device.

CHAPTER 5: SYSTEM IMPLEMENTATION
BCN (HONS) Communications and Networking
Faculty of Information and Communication Technology (Perak Campus), UTAR 52
Figure 5.3.5 Pulling database file on Android Device Monitor
5.4 System Operation
In this section, some functions will be demonstrated and the flow of the function is being
described.

CHAPTER 5: SYSTEM IMPLEMENTATION
BCN (HONS) Communications and Networking
Faculty of Information and Communication Technology (Perak Campus), UTAR 53
Figure 5.4.1 Input from user on Step Tracker function
In the step tracker function, we demonstrate an innovative way of display structure to
user regarding their steps taken based on their target goal. Let say user have walked for
3500 steps for that days and the target goal of user is 6000. The number of steps taken by
user and target number of steps need to walk by user each day is being displayed in a
form of progress bar. Besides, the “status of achievement” of user is recorded in local
database, the status can be “Goal Achieved” or “Goal Not Yet Achieve”.

CHAPTER 5: SYSTEM IMPLEMENTATION
BCN (HONS) Communications and Networking
Faculty of Information and Communication Technology (Perak Campus), UTAR 54
Figure 5.4.2 Circular progress bar showing step taken of user
From the figure above, after user input number of steps taken (eg,3500) and goal (eg,
6000). The degree of color progress bar will set based on step taken by user and their
target goal. The target goal of user is being set to maximum value or degree, which is
360 o. The number of degree of the color progress bar is 210o since the full degree of
progress bar is 360 o .
The degree can be calculated as in the formula:
[(step taken)/(target goal) x 360] = [(3500)/(6000) x 360 o]
= 0.5833333 x 360 o
= 210 o

CHAPTER 5: SYSTEM IMPLEMENTATION
BCN (HONS) Communications and Networking
Faculty of Information and Communication Technology (Perak Campus), UTAR 55
If the number of step taken is less than the target goal of user, the application will record
the attribute field “status” of user as “Goal Not Yet Achieve” in the local database of the
device. On the other hand, If the number of steps taken by a user is more than or equal to
their target goal steps, the color will be fully filled in the progress bar and the attribute
field “status” of the user will be recorded as “Goal Achieved” in the database.
Figure 5.4.3 Progress bar showing user Figure 5.4.4 Progress bar with
achieved their goal blinking effect
From the figure above, a full color filled in the progress bar or the color surrounded by
the progress bar in 360o shows that particular user had achieved their own steps goal.
Besides, a blinking effect will be occur on the color progress bar which indicate that the
user already accomplish their goal or achievement. Therefore, with this blinking effect,
user do not really need to watch the degree of color filled in the progress bar to get know
how much more step is needed to achieve their goal, instead user can consider they

CHAPTER 5: SYSTEM IMPLEMENTATION
BCN (HONS) Communications and Networking
Faculty of Information and Communication Technology (Perak Campus), UTAR 56
achieved their target goal with blinking effect shown on the progress bar. This display
method is one of the smart way of informing useful information to user which is meeting
one of our objective in this project.
Furthermore, after the step information is inserted into database, a graph will be
generated instantly to show the history steps record as well as the latest step taken by user
to let user track his step taken record. The information in Figure 5.4.5 is being shown in
a graphical way rather than of text form. This will provide a good interpretation way for
user to understand the data in a quick and understandable way.
Figure 5.4.5 Bar chart of step tracker function
Other than bar chart in step tracker function, a line chart also is being used in calories
burned checking function. The line chart is also consider as another good interpretation
method of displaying data.

CHAPTER 5: SYSTEM IMPLEMENTATION
BCN (HONS) Communications and Networking
Faculty of Information and Communication Technology (Perak Campus), UTAR 57
Figure 5.4.6 Line chart of calories burned checking function
Inside the calculate BMI function, user can input his/her height and weight to calculate
their Body Mass Index (BMI). BMI is a value derived from weight and height of a person.
BMI determined using a table which display BMI for different categories which are
underweight, normal weight, overweight and obese. The formula of BMI can be
calculated as below: -
Bmi = (weight)/(height x height)

CHAPTER 5: SYSTEM IMPLEMENTATION
BCN (HONS) Communications and Networking
Faculty of Information and Communication Technology (Perak Campus), UTAR 58
Figure 5.4.7 BMI value under Figure 5.4.8 BMI value
category Normal under category Obese
Figure 5.4.7 showing the text in green color which represent user’s BMI value is safe and
under normal category, however in Figure 5.4.8 showing the text in red color which
meaning giving a warning to the user since red color are easier to capture attention from a
user. Therefore, an appropriate color need to be used since different color can represent
different understanding to user. For example, to human eye, orange is seen as a very
hot color, so it gives the sensation of heat; Green can be related to nature or, as opposed
to red, meaning safety.

CHAPTER 5: SYSTEM IMPLEMENTATION
BCN (HONS) Communications and Networking
Faculty of Information and Communication Technology (Perak Campus), UTAR 59
Figure 5.4.9 Combined two parameters in one graph
In the calculate BMI function, it access into database and retrieve BMI value as well as
the total number of calories burn and then those two value is being shown in one
graphical view. Since BMI of user and calories burn by user can be closely related to
each other, so user can try to compare and observe how their calories burn affects their
body mass index (BMI).

CHAPTER 5: SYSTEM IMPLEMENTATION
BCN (HONS) Communications and Networking
Faculty of Information and Communication Technology (Perak Campus), UTAR 60
Figure 5.4.10 Progress bar in sleep monitoring function
In the sleep monitoring function, after user clicking the button “show”, the application
will access the database and retrieve the latest sleep hours of user and show it in the
progress bar as in Figure 5.4.10. In this progress bar, the target sleep hours is eight hours
since the sleep scientist recommended us to sleep eight hours per day.
Besides, in this application would recommend user with some advice based on the
number of step taken per day and number of hours sleep each day.

CHAPTER 5: SYSTEM IMPLEMENTATION
BCN (HONS) Communications and Networking
Faculty of Information and Communication Technology (Perak Campus), UTAR 61
Figure 5.4.11 Health advisory function
Figure 5.4.12 Health profile in text form
From Figure 5.4.12, the latest health profile is being shown to user in t text form, this let
user to know their body health information in a text form since some user prefer text.

CHAPTER 5: SYSTEM IMPLEMENTATION
BCN (HONS) Communications and Networking
Faculty of Information and Communication Technology (Perak Campus), UTAR 62
Furthermore, there is a function which is history chart which will show all user’s health
data in graphical presentation. In this function, all the graph will be shown in an
automated way because the next graph will be display automatically to user after a few
seconds. Total of four graph is shown automatically without user input. Therefore, user
can view all their health information with a glance at their wearable device without much
input from user.
Figure 5.4.13 Health profile in graphical presentation

CHAPTER 6: SYSTEM EVALUATION AND DISCUSSION
BCN (HONS) Communications and Networking
Faculty of Information and Communication Technology (Perak Campus), UTAR 63
CHAPTER 6: SYSTEM EVALUATION AND DISCUSSION
6.1 System Testing
Step tracker function
Feature Action Input Output Expected
Output
Abnormal
(Yes/No)
Enter step
taken and
goal
Fill in input
field
Enter all
fields
Data
inserted and
show
progress bar
Data
inserted and
show
progress bar
No
Enter step
taken and
goal
Fill in input
field
Empty all
fields
Program
stopped
Program
stopped
No
Enter step
taken and
goal
Fill in input
field
Empty some
fields
Program
stopped
Program
stopped
No
Enter step
taken and
goal
Fill in input
field
Enter
negative
value
Data
inserted and
show
progress bar
Program
stopped
Yes
Table 6.1.1 Step tracker function testing

CHAPTER 6: SYSTEM EVALUATION AND DISCUSSION
BCN (HONS) Communications and Networking
Faculty of Information and Communication Technology (Perak Campus), UTAR 64
Calculate BMI function
Feature Action Input Output Expected
Output
Abnormal
(Yes/No)
Enter height
and weight
Fill in input
field
Enter all
fields
show BMI
value
show BMI
value
No
Enter height
and weight
Fill in input
field
Empty all
fields
Program
stopped
Program
stopped
No
Enter height
and weight
Fill in input
field
Empty some
fields
Program
stopped
Program
stopped
No
Enter height
and weight
Fill in input
field
Enter
negative
value
show wrong
BMI value
Show wrong
BMI value
Yes
Table 6.1.2 Calculate BMI function testing
6.2 Project Challenge
There are few challenges faced during accomplishing this project. Firstly, the wearable
device is too small to put the keyboard layout to let user provide some inputs in the same
way just like our smartphone. Therefore, during testing the application, virtual device is
always needed to provide some input to test the function in the application. Besides, user
login function would not be suitable in wearable device since the interface is too small to
provide accurate input. Therefore, user may lose their health data if user decided to
change their wearable device since there is no user profile data uploaded to the cloud.

CHAPTER 6: SYSTEM EVALUATION AND DISCUSSION
BCN (HONS) Communications and Networking
Faculty of Information and Communication Technology (Perak Campus), UTAR 65
Besides, the wearable device aims at quick grab of data from the small wearable device,
and therefore storing data at cloud or server would be not efficient since accessing to
remote server/cloud and process of retrieving data would be would be much more slower.
As the consequences, it is better for wearable device to have local database which is
faster compared to retrieve data from cloud.
Another challenge faced in this project is that creating a suitable symbol for each function
is a big challenge for this project. The symbol used in the application must meet some
requirements such as user must able to quickly understand the symbol used in this
application. The symbol used can be consider as not suitable or not efficient if a user
require to take some time to understand what does the symbol represent. Besides, provide
a good interpretation of information to user is another challenging task.
6.3 SWOT
Strengths
The strength of the project is that it can show proper display structure of information in
the field of health care. The application can retrieve a lot of data and show all of it to the
user within seconds which will save user’s time to interpret and understand those data.
Showing only the critical some critical health information within the limited time is the
biggest strength in this project. Besides, user not require interact much with the wearable
device while tracking their own history record since some function in the application will
display all information in an automated way, meaning that user does not require to
provide many input into wearable device before checking their health data.

CHAPTER 6: SYSTEM EVALUATION AND DISCUSSION
BCN (HONS) Communications and Networking
Faculty of Information and Communication Technology (Perak Campus), UTAR 66
Weakness
The weakness of the project is lacking of the accuracy in showing the real health
monitoring data. In this stage, this application would not able to detect the real step taken
by user, actual number of sleep hours of the users, as well as the calories burned by the
user.
Opportunities
In this hectic pace of society life, people are rushing doing their work, student busying
prepare for examination, assignments. Some of them would just forgot to have their meal
or failed to maintain a good quality lifestyle. Therefore, a wearable device that having a
health monitoring and advisory app would be helpful for them since the wearable device
is always in proximity with user and user can always monitor their own body health by
just looking at the wearable device. The strength of this project is to display critical user
health data in a quick way, and therefore it is very suitable for people who are always
have a sense of time urgency in their life. User nowadays prefer to know everything
within a short time rather than spending long time to interpret data. Besides, the wearable
device is always convenient and portable, meaning that huge amount of useful of
information is carried by user around, so people may willing to spend money on buy
wearable device. Furthermore, wearing a smartwatch is slowly becoming a new trend,
thus, the market of this health care monitoring and advisory apps would increase time by
time.

CHAPTER 6: SYSTEM EVALUATION AND DISCUSSION
BCN (HONS) Communications and Networking
Faculty of Information and Communication Technology (Perak Campus), UTAR 67
Threat
This application require a lot of approval from hospital or health care authority. By
providing some health care advisory is something crucial and this might ruin the health of
a patient if a wrong health care advisory is provided. Some people might doubt the
realibility of those advice by health care app. Besides, the owner or partnership of this
application can be get sue by society if there is a patient ‘s disease becoming worsen after
apply the health care advisory of this application since there is no approval from hospital
or health care industry.
6.4 Objectives Evaluation
The first objective for this project is fully achieved, the application are able to provide
some meaningful symbol and color to increase user friendliness. For example, user do not
spend much time in knowing the function of the certain button, they only have to glance
at the symbol provided and they will roughly know the feature of each function.
The project is able to display good information display structure by using graphical
presentation instead of display info in text form. Graphical presentation allow user to
quickly interpret all information contain on small interface of wearable device. Besides,
user are able to view those graphs in a more automated way since the next consecutive
graph about their health info will automatically display to user after few seconds.
The last objective is to create an effective information display for health monitoring by
implementing some smart feature. The circular progress bar in this application is an
innovative display structure for showing user’s progress toward their goal in the field of

CHAPTER 6: SYSTEM EVALUATION AND DISCUSSION
BCN (HONS) Communications and Networking
Faculty of Information and Communication Technology (Perak Campus), UTAR 68
health care. The degree that filled with color in circular progress bar indicates their
performance or progress on their personal goal. Furthermore, a blinking effect will occur
on the circular progres bar when user had achieve their own goal on the field of health
care. The blinking effect on circular progress bar is consider as a smart feature since the
blinking effect will happens when the application detects that the user had achieved their
goal. Therefore, the third objective for this project is achieve.
6.5 Concluding Remark
In this chapter, we talked about the system evaluation and discussion of the project.The
application is being tested with few possile input and the output is being recorded as
shown in Table 6.1.1 and Table 6.1.2. The challenge faced in this project is the interface
of wearable device is too small to display a bunch health monitoring data , besides,
creating an effective way of displaying information is another challenge too. In this
section, we also discussed the strength, weakness, opportunity and threat of the project.
Evaluation of project objectives are being reviewed and all of those objectives is
achieved in the application

CHAPTER 7: CONCLUSION AND RECOMMENDATION
BCN (HONS) Communications and Networking
Faculty of Information and Communication Technology (Perak Campus), UTAR 69
CHAPTER 7: CONCLUSION AND RECOMMENDATION
7.1 Conclusion
In a nutshell, the purpose of this project is provide a proper and good display structure to
user for their health monitoring in wearable device. Information have to be clear and
contain some “smart” way to present it for user in a small interfaces of wearable. The
challenge part of this project is to find a smart way to convey many information in small
interfaces. Therefore, appropriate use of color, symbol, animation, or abbreviation is
necessary to convey the information of health record instead of using a lot of text in
wearable device. In order to improve and save the battery consumption, a good
presentation of information in small interface of wearable device is always needed in
which user just have to take a glance on their wearable device and know all the record
and information as quickly as possible.
7.2 Recommendation
For the future development, the application should support more automated animation for
user to grab health monitoring information more easily provided that those animation
should convey information in a quick and understandable way. Besides, the application
can be enhanced if the application itself can collects the accurate health monitoring data
from the wearable device. This is because accurate health monitoring data are needed in
order to provide reliable health care advisory. Besides, those health advisory must get
approval from the health industry or authority to increase the reliability and trustworthy
of this application.

BCN (HONS) Communications and Networking
Faculty of Information and Communication Technology (Perak Campus), UTAR 70
Bibliography/Reference
Anon., 2015. Electronics, s.l.: s.n.
Anon., n.d. Noteworthy Tips to Design UI for smartwatch. [Online]
Available at: http://www.igeeksblog.com/tips-to-design-smartwatch-ui/
[Accessed 14 September 2015].
Chanrasekhar Narayanaswami, M. T., 2003. Efficient use of display real estate in a wrist
watch display. United States , Patent No. US6525997 B1.
E.Howard, C., 2007. Military&Aerospace. [Online]
Available at:
https://flexdisplay.asu.edu/sites/default/files/News_Items/MilitaryAerospaceElectronics-
Flexibleandwearabledisp.pdf
[Accessed 9 September 2015].
Lyons, K., 2015. [Online]
Available at: http://kentlyons.net/pubs/shimmering-tei15.pdf
[Accessed 13 Septmber 2015].
Mortensen, P., 2014. business. [Online]
Available at: http://www.wired.com/2014/05/this-is-how-to-build-an-interface-for-the-
ultimate-smartwatch/
[Accessed 14 September 2015].
Rainmaker, D., 2013. [Online]
Available at: http://www.dcrainmaker.com/2013/01/do-you-use-an-app-with-live-
tracking-in-it-tell-me-about-it.html
[Accessed 20 8 2015].
Soneira, D. R., 2014. Displaymate. [Online]
Available at: http://www.displaymate.com/Display_Technology_2014.htm
[Accessed 9 September 2015].

BCN (HONS) Communications and Networking
Faculty of Information and Communication Technology (Perak Campus), UTAR 71