Embed Size (px)
Citation preview
ASSESSMENT OF WATER QUALITY CHARACTERISTICS DURING
BASE AND STORM FLOW EVENTS ON SUNGAI LANGAT BASIN
LIZA BINTI SHAH ALI CHARLIE
UNIVERSITI TEKNOLOGI MALAYSIA
ASSESSMENT OF WATER QUALITY CHARACTERISTICS DURING BASE AND STORM FLOW EVENTS ON SUNGAI LANGAT BASIN
LIZA BINTI SHAH ALI CHARLIE
A project report submitted in partial fulfillment of the
requirements for the award of the degree of
Master of Engineering (Civil-Hydraulics and Hydrology)
Faculty of Civil Engineering
Universiti Teknologi Malaysia
DECEMBER 2010
iv
DEDICATION
As this journey begun
Passing through a long distance and difficult path
A shine of guidance given to lead this dark trail
To Dr. Noor Baharim Hashim as my supervisor to lead me patiently
Daddy and Mommy
You are my supports that always embrace me
You always have been there for me
Through your prayers and love
Both of you have been my eyes to lead this hopeful journey
To both of you Charlie and Zaiton
My Siblings
Companions where I can share my happiness and sadness
As all of you always bringing me laughter and joy
Presents of you all simply ease my journey
To Kamal, Yunus and Jasmin
As this journey nearly end
Where all my efforts, time, hard work gathered
Finally, to You I lay my burden
Hoping for the Best
v
ACKNOWLEDGEMENT
In writing this dissertation, there are so many persons involved to assist me to
complete this project. Hence, I take this opportunity to thanks each and every one of
them and to let them know I really do appreciate it all.
My first thanks goes to my beloved Supervisors, Dr. Noor Baharim Hashim,
who really been patient and calm to lead me to do the best. Besides that, an important
thanks to Maznah Ismail and Siti Nurhazwani, to guide me throughout this project.
Thanks also to Anie Raflikha who helped me a lot in completing this study.
To my best friends who always has been there for me, Umadevi Ragoonathar
and Samira Samsudin Sah, my thanks to you all. Finally, my family, thanks for your
support and love. Thank you for everything.
vi
ABTRACT
Rapid urbanization along the Sungai Langat plays an important role in the increase of point source (PS) and non-point source (NPS) pollutions. The water quality statistical analysis during the base and storm flow events outputs enables to identify the PS and NPS pollution impairing the river. Sungai Langat basin is deteriorated due to NPS pollution of BOD, COD, TSS, NH3-N, NO3 and E.Coli from year 2004-2008. The utmost and less most water constituents polluting Sungai Langat basin were ranked using the violation analysis during base and storm flow events. The overall rank from the most to less impacting pollutants impairing Sungai Langat basin are E.Coli (NPS)> E.Coli(PS)> TSS(NPS)> COD(NPS)> NH3-N(NPS)> BOD(NPS)> COD(PS)> TSS(PS)> NH3-N(PS)> BOD(PS). The longitudinal profile analysis (year 2008), show the BOD, COD, TSS, NH3-N, NO3 and E.Coli have similarity where the all of the studied water quality concentrations have increased at DOE station of 1L07 to 1L05 segment of river due to sewage. It also founded that the presence of E.Coli in Sungai Langat is at concerning level as the concentration of E.Coli can reach 44 times higher than limiting standard of 2000cfu/100mL. The presence of E.Coli in Sungai Langat is proved by the longitudinal concentration profiles illustrating the decreasing level of DO and pH at segment of IL07 to IL05. The strong concentrations of BOD and COD at the same segment of the Sungai Langat are related to anthropogenic pollution sources and are from sewage (PS) such as sewage treatment plants and industrial effluents. The GIS maps confirmed that there are numerous numbers of private and public sewage treatment plant, compare to other segments of the river. Another possibility is, the PS also suspected coming from the industry effluents which is responsible to the elevation of E.Coli in Sungai Langat basin. The failure of sewage treatment systems (overflow due to storm water) also may be the reason why the E.Coli level still high during storm flow events. Other sources (NPS) may be from municipal wastes, or animal husbandry of the segment of river.
vii
ABSTRAK
Peningkatan permodonenan di sepanjang Sungai Langat memainkan peranan penting dalam meningkatkan punca tetap pencemaran (PS) dan punca tidak tetap (NPS) pencemaran. Kualiti air statistik analisis semasa kejadian aliran dasar dan ribut digunakan untuk mengenalpasti punca pencemaran tidak tetap dan punca pencemaran tetap yang mencemarkan sungai. Didapati, lembangan Sungai Langat semakin tercemar akibat punca pencemaran tidak tetap oleh BOD, COD, TSS, NH3-N, NO3 dan E. Coli dari tahun 2004-2008. Penyusunan bahan pecemar mengikut turutan dari paling cemar ke kurang cemar lembangan Sungai Langat dianalisis mengunakan analisis violasi semasa aliran dasar dan ribut. Kedudukan secara keseluruhan dari yang paling cemar ke kurang cemar lembangan Sungai Langat adalah E. Coli (NPS)> E. Coli (PS)> TSS (NPS)> COD (NPS)> NH3-N (NPS)> BOD (NPS) > COD (PS)> TSS (PS)> NH3-N (PS)> BOD (PS). Analisis Profil longitudinal (tahun 2008), menunjukkan BOD, COD, TSS, NH3-N, NO3 dan E. Coli mempunyai persamaan dimana semua konsentrasi kualiti air telah meningkat di stesen DOE dari segmen sungai 1L05 dan 1L07 kerana untuk kumbahan. Ia didapati bahawa kehadiran E. Coli di Sungai Langat berada pada tahap tinggi kerana konsentrasi E. Coli boleh mencapai 44 kali lebih tinggi daripada standard, 2000cfu/100mL. Kewujudan E. Coli di Sungai Langat dibuktikan oleh profil konsentrasi longitudinal dimana tahap penurunan DO dan pH pada segmen IL07 dan IL05. Konsentrasi yang kuat BOD dan COD pada segmen Sungai Langat yang sama adalah berkaitan dengan sumber-sumber pencemaran antropogen dan berasal dari kumbahan (PS) seperti kilang rawatan kumbahan dan sisa industri. Peta GIS menegaskan bahawa terdapat banyak kilang rawatan kumbahan awam dan swasta, berbanding dengan segmen sungai lain. Kemungkinan lain adalah, PS juga dipercayai berasal dari efluent industri yang menjadi penyumbang kepada elevasi E. Coli dalam Sungai Langat. Kegagalan sistem pemprosesan kumbahan (limpahan kerana air hujan) juga boleh menjadi sebab tahap E. Coli masih tinggi semasa aliran ribut. Sumber-sumber lain (NPS) mungkin dari sisa kota, atau sisa dari ladang tanaman atau penternakan mengalir masuk ke segmen sungai tersebut.
viii
TABLE OF CONTENT
CHAPTER TITLE PAGE
DECLARATION iii
DEDICATION iv
ACKNOWLEDGEMENT v
ABSTRACT vi
ABSTRAK vii
TABLE OF CONTENTS viii
LIST OF TABLES xii
LIST OF FIGURES xiii
LIST OF SYMBOLS xv
1 INTRODUCTION
1.1 Introduction 1
1.2 Problem Statement 2
1.3 Study Objectives 9
1.4 Scope of Study and data limitation 10
1.5 Significance of Study 12
2 LITERATURE REVIEW
2.1 Surface Waters 13
ix
2.2 River Characterization 15
2.3 River Water Pollution 17
2.3.1 Point Source Water Pollution 19
2.3.2 Non Point Source Water Pollution 19
2.4 Sewage 21
2.5 Type of Sewage 22
2.5.1 Municipal Wastewaters 22
2.5.2 Sullages 24
2.5.3 Agricultural Effluents and Runoff 24
2.5.4 Stormwater and Urban Surface Runoff 24
2.5.5 Others 25
2.6 Sources of Pollutant corresponding to Land based activities 27
2.6.1 Residential 27
2.6.2 Industry 32
2.6.3 Agricultural 32
2.6.4 Urban 36
2.6.5 Mining 37
2.7 Sewage Management in Malaysia 39
2.8 River Water Quality 41
2.8.1 Category of River Water Quality 41
2.8.2 River Water Quality Classification in Malaysia 42
2.9 Water Pollution to River Quality 44
2.10 Water Pollution to Drinking Water Supplies 45
2.11 Water Quality and Human Health 47
2.11.1 Waterborne Disease 48
2.11.2 Water-washed Disease 48
2.11.3 Water –based Disease 48
2.11.4 Water related insect vectors 49
2.12 River Water Quality Status in Peninsular Malaysia 49
2.13 Geographical Information System (GIS) 56
2.13.1 GIS Data Type 56
2.13.2 Spatial Data Analysis: Thematic Layer Overlay 58
2.13.3 GIS Softwares 59
2.13.4 Application of GIS 61
x
3 METHODOLOGY
3.1 Data Collection 61
3.1.1 Hydrological and Water Quality Data 61
3.1.2 Historical Data 62
3.1.3 Published Data 63
3.1.4 Other Data 64
3.2 Data Limitation 65
3.2.1 Hydrological and Water Quality Data 65
3.2.2 Historical Data 66
3.2.3 Published Data 66
3.2.4 Other Data 67
3.3 Trend Analyses 67
3.3.1 WQI Computation 67
3.3.2 Public Sewage Loading Computation 68
3.4 Trend Analysis Data Limitation 70
3.4.1 WQI Trend 70
3.4.2 Land Use Trend 71
3.5 Statistical Analysis 71
3.5.1 Box Whisker 71
3.5.2 Box Whisker Data Preparation 72
3.5.3 Step to plot Box Whisker 73
3.5.4 Statistical data limitation 79
3.6 Violation Analysis 79
3.7 Longitudinal Water Quality Profile Analysis 81
4 RESULTS AND ANALYSIS
4.0 Site Description 82
4.1 GIS Data Collections 84
4.2 Water Quality Trend Analysis 89
4.2.1 Population Trend Analysis 90
4.2.2 Land Use Change and Water Quality of Sungai
Langat Basin 91
xi
4.3 Water Quality Statistical Analysis 93
4.3.1 Biochemical Oxygen Demand (BOD) 94
4.3.2 Chemical Oxygen Demand (COD) 94
4.3.3 Total Suspended Solid (TSS) 94
4.3.4 Nitrate (NO3) 95
4.3.5 E.Coli 95
4.4 Water Quality Violation Analysis 97
4.5 Longitudinal Profile Analysis 98
4.5.1 E.coli 99
4.5.2 TSS 100
4.5.3 COD 101
4.5.4 NH3-N 102
4.5.5 BOD 103
4.5.6 NO3 104
4.6 Discussion 105
5 CONCLUSION AND RECOMENDATION
5.1 Conclusion 110
5.2 Recommendation 111
REFERENCES
xii
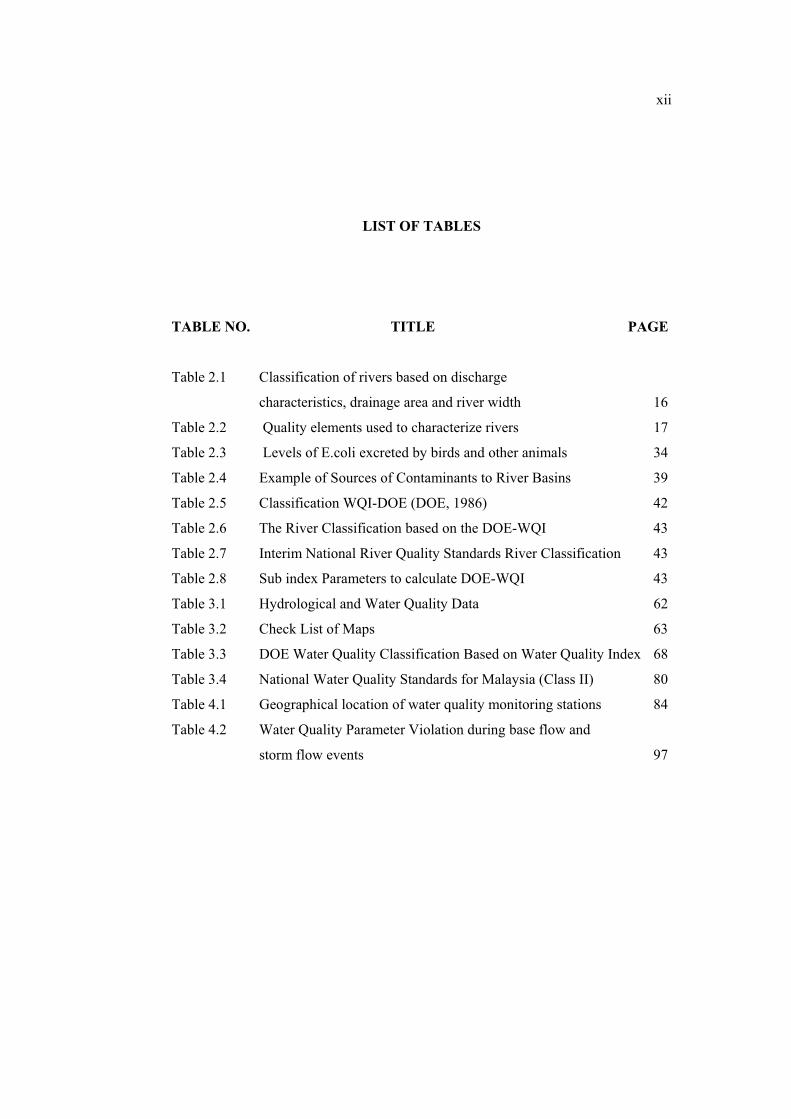
LIST OF TABLES
TABLE NO. TITLE PAGE
Table 2.1 Classification of rivers based on discharge
characteristics, drainage area and river width 16
Table 2.2 Quality elements used to characterize rivers 17
Table 2.3 Levels of E.coli excreted by birds and other animals 34
Table 2.4 Example of Sources of Contaminants to River Basins 39
Table 2.5 Classification WQI-DOE (DOE, 1986) 42
Table 2.6 The River Classification based on the DOE-WQI 43
Table 2.7 Interim National River Quality Standards River Classification 43
Table 2.8 Sub index Parameters to calculate DOE-WQI 43
Table 3.1 Hydrological and Water Quality Data 62
Table 3.2 Check List of Maps 63
Table 3.3 DOE Water Quality Classification Based on Water Quality Index 68
Table 3.4 National Water Quality Standards for Malaysia (Class II) 80
Table 4.1 Geographical location of water quality monitoring stations 84
Table 4.2 Water Quality Parameter Violation during base flow and
storm flow events 97
xiii
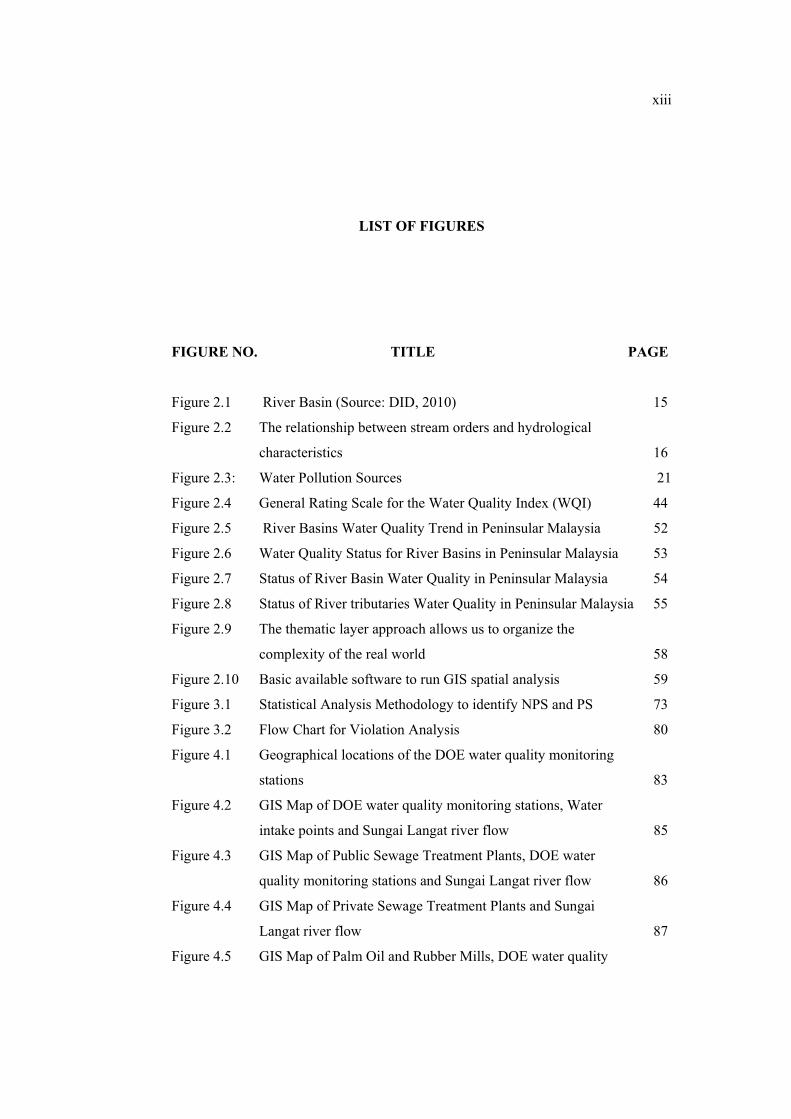
LIST OF FIGURES
FIGURE NO. TITLE PAGE
Figure 2.1 River Basin (Source: DID, 2010) 15
Figure 2.2 The relationship between stream orders and hydrological
characteristics 16
Figure 2.3: Water Pollution Sources 21
Figure 2.4 General Rating Scale for the Water Quality Index (WQI) 44
Figure 2.5 River Basins Water Quality Trend in Peninsular Malaysia 52
Figure 2.6 Water Quality Status for River Basins in Peninsular Malaysia 53
Figure 2.7 Status of River Basin Water Quality in Peninsular Malaysia 54
Figure 2.8 Status of River tributaries Water Quality in Peninsular Malaysia 55
Figure 2.9 The thematic layer approach allows us to organize the
complexity of the real world 58
Figure 2.10 Basic available software to run GIS spatial analysis 59
Figure 3.1 Statistical Analysis Methodology to identify NPS and PS 73
Figure 3.2 Flow Chart for Violation Analysis 80
Figure 4.1 Geographical locations of the DOE water quality monitoring
stations 83
Figure 4.2 GIS Map of DOE water quality monitoring stations, Water
intake points and Sungai Langat river flow 85
Figure 4.3 GIS Map of Public Sewage Treatment Plants, DOE water
quality monitoring stations and Sungai Langat river flow 86
Figure 4.4 GIS Map of Private Sewage Treatment Plants and Sungai
Langat river flow 87
Figure 4.5 GIS Map of Palm Oil and Rubber Mills, DOE water quality
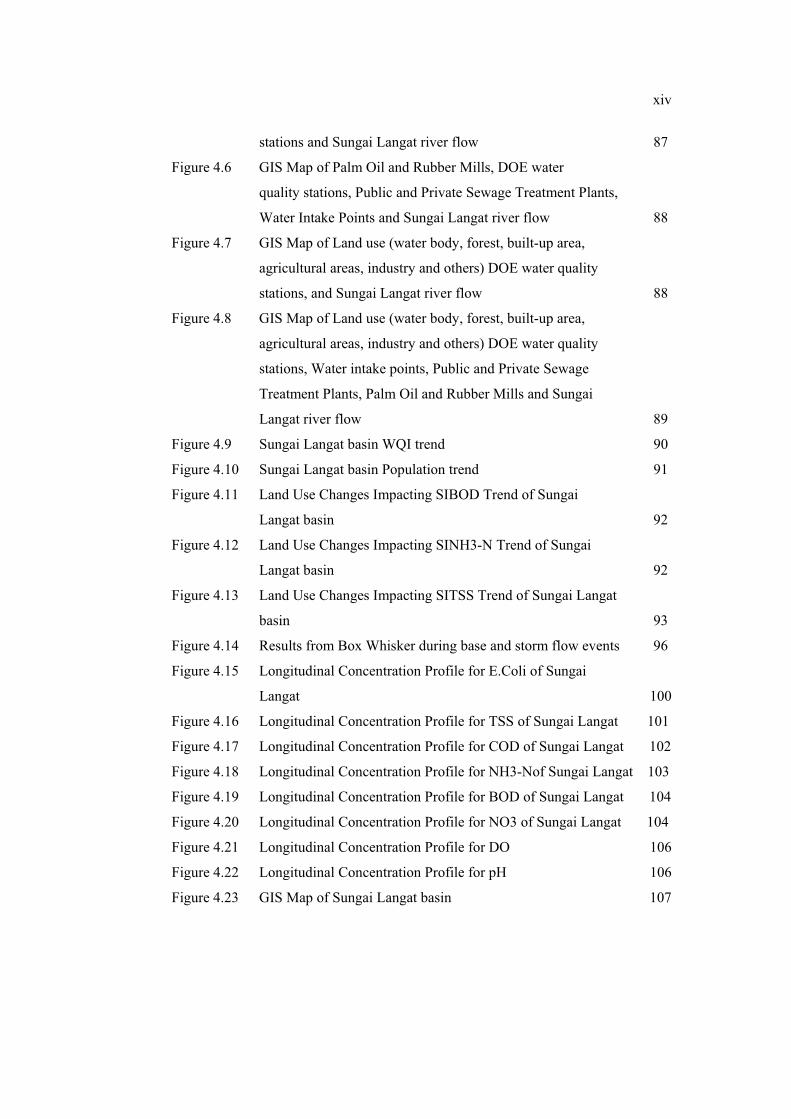
xiv
stations and Sungai Langat river flow 87
Figure 4.6 GIS Map of Palm Oil and Rubber Mills, DOE water
quality stations, Public and Private Sewage Treatment Plants,
Water Intake Points and Sungai Langat river flow 88
Figure 4.7 GIS Map of Land use (water body, forest, built-up area,
agricultural areas, industry and others) DOE water quality
stations, and Sungai Langat river flow 88
Figure 4.8 GIS Map of Land use (water body, forest, built-up area,
agricultural areas, industry and others) DOE water quality
stations, Water intake points, Public and Private Sewage
Treatment Plants, Palm Oil and Rubber Mills and Sungai
Langat river flow 89
Figure 4.9 Sungai Langat basin WQI trend 90
Figure 4.10 Sungai Langat basin Population trend 91
Figure 4.11 Land Use Changes Impacting SIBOD Trend of Sungai
Langat basin 92
Figure 4.12 Land Use Changes Impacting SINH3-N Trend of Sungai
Langat basin 92
Figure 4.13 Land Use Changes Impacting SITSS Trend of Sungai Langat
basin 93
Figure 4.14 Results from Box Whisker during base and storm flow events 96
Figure 4.15 Longitudinal Concentration Profile for E.Coli of Sungai
Langat 100
Figure 4.16 Longitudinal Concentration Profile for TSS of Sungai Langat 101
Figure 4.17 Longitudinal Concentration Profile for COD of Sungai Langat 102
Figure 4.18 Longitudinal Concentration Profile for NH3-Nof Sungai Langat 103
Figure 4.19 Longitudinal Concentration Profile for BOD of Sungai Langat 104
Figure 4.20 Longitudinal Concentration Profile for NO3 of Sungai Langat 104
Figure 4.21 Longitudinal Concentration Profile for DO 106
Figure 4.22 Longitudinal Concentration Profile for pH 106
Figure 4.23 GIS Map of Sungai Langat basin 107
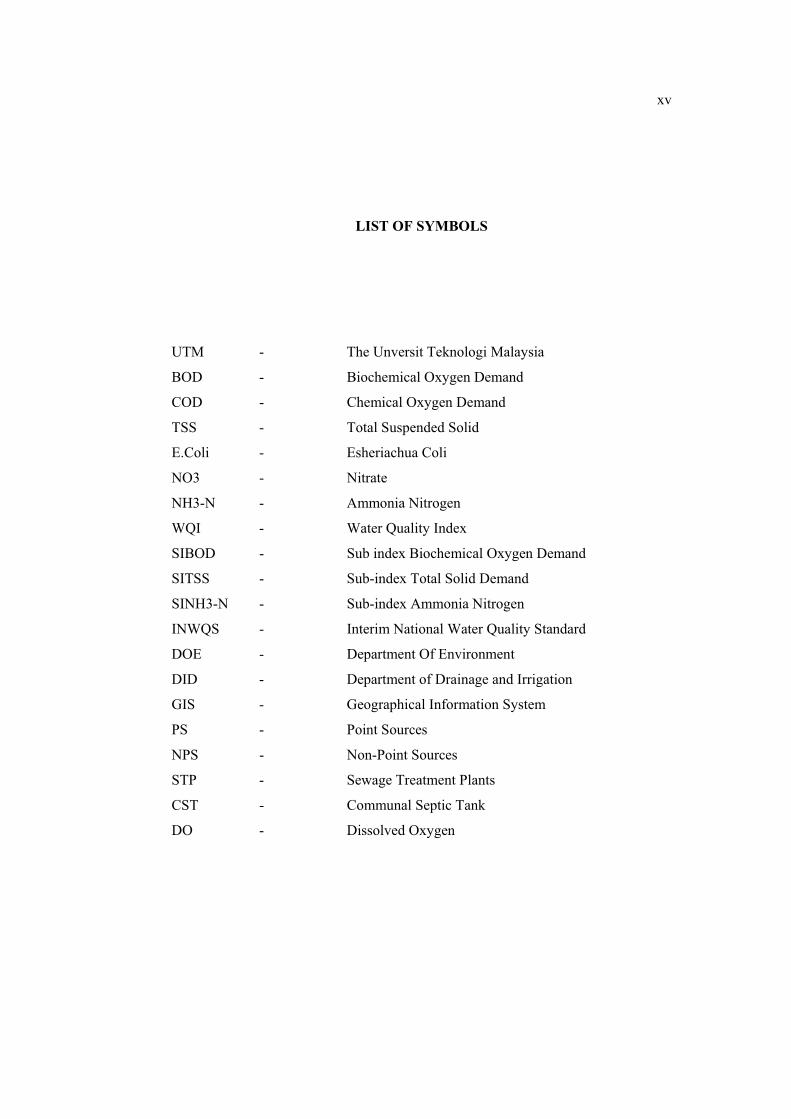
xv
LIST OF SYMBOLS
UTM - The Unversit Teknologi Malaysia
BOD - Biochemical Oxygen Demand
COD - Chemical Oxygen Demand
TSS - Total Suspended Solid
E.Coli - Esheriachua Coli
NO3 - Nitrate
NH3-N - Ammonia Nitrogen
WQI - Water Quality Index
SIBOD - Sub index Biochemical Oxygen Demand
SITSS - Sub-index Total Solid Demand
SINH3-N - Sub-index Ammonia Nitrogen
INWQS - Interim National Water Quality Standard
DOE - Department Of Environment
DID - Department of Drainage and Irrigation
GIS - Geographical Information System
PS - Point Sources
NPS - Non-Point Sources
STP - Sewage Treatment Plants
CST - Communal Septic Tank
DO - Dissolved Oxygen
CHAPTER 1
INTRODUCTION
1.1 Introduction
The primary need for human survival is water can be listed after air as
important necessity in human’s daily life. The world history can prove us the
importance of water whereby great civilization such as Nil civilization, Harappa and
Mohenjo-Daro civilization or Cheng Ho civilization were born because of the great
rivers as ultimate water resources which provide the community to civilized. The
land near to river particularly river bank had been utilized by the community with
varies activities such as bartering, agriculture, trading, farming taken place in order
to them to survive. As the population increased by number, such activities were
spread far out from the river bank simultaneously civilized the community, not only
nationwide but worldwide.
Therefore, the early age of the simple and basic surviving activities has
became complicated and complex industry, which developing country such as
Malaysia, the wealth of the country depends based on the productivity of vast
industry. In order the country to generate constant income, other activities such as
modern farming and agricultural are encouraged by the Government, not only to
2
cover the needs of the citizens, but it became an international trading, to satisfy the
demands from other country. The Government of Malaysia is very systematic in
optimizing the available land, so that it fully utilized and benefits the government
and also the citizens. Proper housing and residential area were located and being
developed in order to give comfortable home to every citizen as the urbanization
come along. Urbanization has always been main focus of the Government as act like
mirror to reflect the development and the prosperity of a country.
Malaysia is very blissful as the country receives rainfall nearly 3000
millimeter per year which the natural renewing process of the environment especially
the earth’s natural resources such as water is essential in order to maintain a stable
ecosystem on earth as well as to ensure a sustainable development of the nation. But,
it need to clearly understood that, although 70% of the Earth’s surface is covered by
water, only 1% is accessible for direct human uses which are fresh water resources
(Connell, 1974).
In such case, Malaysia is considered very luck because the country is very
rich with fresh water resources such as lakes, rivers and groundwater. The rest of it is
frozen in icecaps and the sea water which is too salty for human consumption, even
though, there are technologies to convert the sea water to brackish water, yet it still
new and expensive for general operation (Connell, 1974; Da Cunha, 1985; Klein,
1957). The demand for clean and fresh water is already rose and exceeding the
supply in many parts of the world which is due to many factors including
environmental factors such as pollution and climate change (Da Cunha, 1985).
As development and urbanization around the world is soaring high,
developing country such as Malaysia should be aware of the consequent that it going
to face due to development and urbanization of the country which is significant
degrading of the level of the pollution. Urbanization has long been recognized as a
principal contributory factor to many environmental problems, including flooding,
biodiversity loss, deterioration of aquatic ecosystems and many others. These
3
impacts usually come with modification of the natural hydrologic condition, increase
in runoff pollutant loadings and wastewater discharge or sewage, and decrease in
river base flow during dry weather, as a result of land cover change and intensified
human activity due to urbanization (Butler and Davies, 2004; Olivera and DeFee,
2007).
Rivers play a major role in assimilation or carrying off the municipal and
industrial wastewater, run-off from agricultural land and other pollutant discharge.
The municipal and industrial wastewater discharge constitutes the constant polluting
source or sewage, whereas, the surface run-off is a seasonal phenomenon, largely
affected by climate in the basin. Seasonal variations in precipitation, surface run-off,
interflow, groundwater flow and pumped in and outflows have a strong effect on
river discharge and subsequently on the concentration of pollutants in river water
(Vega et al., 1998).
Water quality of river basin particularly in concern as the nature of the rivers
in Malaysia is very long and the land use activities of the upper stream of the river
will definitely affect the water quality of down stream of the river by pollutants
discharge. The situation of river water quality in Malaysia is not getting any better. It
began from the brooks and now the whole river basins are facing impairment of
quality including the Sungai Langat basin located at the State of Selangor which is
very vital river basin for Selangor citizen’s health, economy and the environment.
As mentioned above, the ancient civilizations all begun based on the presence
of the great rivers such as Nil, Mekong, Cheng Ho, and many more, however, in this
era, many countries face river water pollution, mainly due to improper planning of
land use activities along the civilization. Such as Selangor State which was lacked of
proper land development planning in the 19th century despite of the civilization
which took place way before, definitely gives adverse impact to quality of Sungai
Langat basin particularly.
4
1.2 Problem Statement
Water is one of the primary needs of the human kind that need to be
protected, well maintained the quality water and making sure it sustained for future
concern. Fresh water resources such as rivers are now limited to be use due to the
deterioration of the quality which making it unable to consume. The Sungai Langat
basin, for example, provides water for its population for domestic as well as
industrial and agricultural uses through its dams. There are two main dams built in
Sungai Langat basin which are Langat and Semenyih Dam. Also, Sungai Langat
feeds eight water treatment plants, most of which are located in serene village
settings of Hulu Langat (The Star, 2006).
This proper treatments require to taking care of the quality of the drinking
water which eventually will cost the price of clean water becomes higher, and the
more pollute is the water resources, the more advance treatments are required and the
more expensive is the clean water will become (Boopathy, 2000; Srinivasan and
Murthy, 1999). Despites of population growth, rapid industrialization, urbanization
and infrastructure development, will increases the usage of the water simultaneously
increases the demand of water supply in domestic, agricultural and industrial areas is
now in critical since the clean fresh water supply is depleting from natural sources
due to pollution. Therefore, the sources of fresh water supply especially rivers like
Sungai Langat need to make sure its clean for water supply and also well sustained
from declining from the natural sources.
The river basin in Malaysia predominantly Sungai Langat basin need special
attention as it is a major river basin adjacent to the Klang Valley, an urban
conurbation that includes the capital city of Kuala Lumpur and other urban centers.
Several large Federal Government projects, such as the Kuala Lumpur International
Airport (KLIA) in Sepang, the new Federal Government administrative capital at
Putrajaya and Malaysia’s Cyber-City, Cyber City, are located within the basin. These
development projects have spurred an influx of commerce and industry development
5
basin typifies, in general, the pattern of urban and industrial development in other
parts of Malaysia and Southeast Asia. When new infrastructures, the most important
being roads, highways and bridges, are put in place urban sprawl spreads from
existing urban centers, in the case Kuala Lumpur, Petaling Jaya, Shah Alam and
Puchong to the north of the basin, into areas that are less developed.
This leads to the conversion of agricultural land, and in some instances forest
and other natural areas, into housing and industrial estates as well as business and
commercial centers. Such urbanization leads to the establishment of new townships,
which the coalesce with new growth, cause increased surface run-off caring wastes
called sewages entering river basin. This may caused an undesirable change in the
water condition that decreases the river water quality occurred, it is described as river
water pollution. Once the river assimilative capacity increases and violated the
guidelines, it would classified as polluted river. The use of polluted water in human
activities can affect human health and flora and fauna especially pollution in water
intake such as rivers, lakes which is current scenario in Malaysia (Hallock, 2002).
There are also small riverside park, built by the Drainage and Irrigation
Department (DID) has long been neglected and been turned to illegal dumping area
which could contribute leachete, enters the river body and cause river pollution. A
total of 30 industries estates, with more than 330 factories having 22 categories of
industrial production, ranging from manufacture of agriculture end products to high
tech products such as consumer electronics, are located in the basin. Most of the
industries are medium scale. Electrical and electronic industries predominate,
followed by manufacturing, industrial and engineering products, furniture, textile and
fabrics, building materials and chemicals. Yet, the number of workshops, car wash
centers and other business premises increased over the years is the most concerned as
these shed-like shops that have contributed to the river’s pollution, not the few
planned industrial, housing and commercial areas with proper drainage and sewerage
systems and treatment plants.
6
In 2006, the Department of Environment (DOE) Malaysia has announced the
Sungai Langat basin as polluted river. This is due to industrialization taking place
rapidly in area along the Sungai Langat basin that leaded to river pollution. There are
houses and shops along a 20 km stretch from Cheras KM14.4 to the Sungai Langat
dam. Further down at KM17.6, there are workshops and light industrial factories
along the main road. According to The Star (2006), the drains from these premises
lead to a larger drain and empties out into Sungai Langat. Moreover, the sewage
from these premises is not channeled into any sewage treatment plant before the
wastewater being released to Sungai Langat. The villagers claimed that, the Sungai
Langat at few kilometers downstream from the Sungai Langat dam was looks murky
and putted the blame on the factories, warehouses and homes that been built along
the river.
In 2007, nearly one million citizens in State of Selangor suffered as it the
main rivers Sungai Langat and Sungai Selisik which are main water supply intake
points were polluted by ammonia due to industry activities along these two rivers.
Pollution on these two rivers caused three of water treatment plants in Sungai Selisik,
Batu 11 Cheras and Bukit Tampoi were forced to shut down temporarily due to high
ammonia concentration containing in these rivers. The source of ammonia pollutant
was from the pollutants which entered the river water body. The pollutants might be
from the industry activities including quarry, cement factories, and wood treating
industry along the river bank (Utusan, 2007). There was also illegal dumping along
the river bank which also has the possibility of discharging leachate to the river water
body.
Again in 2009, the mass media spread the news of the declaration of the
Department of Environment, Malaysia announcing that Sungai Labu and Langat
were pollution by ammonia and diesel oil which enforced the Pucak Niaga (M) Sdn
Bhd to stop the operation of water treatment plant in Salak Tinggi temporarily. The
ammonia concentration was twice of the allowed found in both rivers. At the same
time, Sungai Labu which tributary of Sungai Langat basin was polluted by the diesel
spillage which makes the river has diesel odor and turned in black in color causing
7
the fishes to die. It was believe that the sources of these pollutants were from the
effluents of factories in Nilai Town, Negeri Sembilan. The Salak Tinggi water
treatment plant was forced to shut down temporarily thirteen times since 2005 due to
pollution of Sungai Labu (Berita Harian, 2009).
Recently in September 2010, the water treatment plant in Sungai Semenyih
which is main tributary of Sungai Langat basin was closed. The raw water supply
from Sungai Kembong, was polluted with the solid waste dumping in the nearby
landfill area (Bernama, 2010). The solid wastes from dumping area generated
leachate which flows to the main river and cause the ammonia level in the water
supply elevated exceeding the standard stipulated by the Health Ministry. Shutting
down the treatment plants temporarily has caused the water supply to 1.2 million
citizens in Petaling, Hulu Langat, and Kuala Langat been cut for few weeks. In
Berita Harian (2006), it been identified that there are fourteen cases that causing the
impairment of Sungai Langat. The landfill nearby the Sungai Kembong was the
major source of river water pollution which has the highest cases of six. There were
three cases involved in polluting the river with discharging diesel, another pollutant
sources was from Negeri Sembilan. There were two cases from cats and dog
breeding centers that might discharge animal wastes to the rivers. The other two
cases were from unknown sources.
According to Prabhakar (2000), the pollutant pollution also can result from
natural runoff, dissolved chemicals in water that percolates thorough the soil and
through land use activities, such as agricultural, mining, construction, industry,
residential and businesses area. The time frame for the movement of some pollutants
entering the water body is unpredictable depending on the features of particular
pollutant. The land use activities carried out along the river basin is vitally essential
to pinned the pollutant sources which could trigger pollutants that deteriorating the
quality of the river basin. For example, excessive land application of manure can
impair water quality by introducing pollutants including sediment and nutrients
(USEPA, 2000). Since State of Selangor has undergoing rapid development, the
population, also rising the human activities in utilizing the land along the river bank
8
gives a great adverse impact on the river basin. Truthfully, unfortunately, the Sungai
Langat basin particularly Langat, Semenyih and Labu Rivers have been classified as
slightly polluted/polluted river by the Government itself (DOE, 2007).
Therefore, it is very important to identify the pollutant sources through point
source pollution based on the land use activities that took place around the Sungai
Langat basin. Importantly, the non-point source pollutions is more concern than the
point source solution due to difficulties to identify the sources specifically whereby
the pollutants is hard to isolate and to control of impurities entering the surface-water
body. Meanwhile the point sources where the pollution source comes from identified
and specific source that goes into water-body which are easy to control and monitor
compared to non-point source (Whipple and Hunter,1977; McCaull and Crossland,
1974). Thus, in order to make sure the river basin is clean of pollutants, the sources
of pollutant discharge from the land use activities along the Sungai Langat basin
must be identified and controlled.
The hydrology cycle and hydrological characteristics of Sungai Langat basin
also affect the water quality of the river. The land use activities near the river bank
definitely will disturb and change the hydrological characteristics of the rivers. The
change of hydrological characteristics such as water level, width of the river, slope of
the river bed will absolutely deteriorate the river water quality and also affect the
living aquatic organisms. The hydrology cycle also had great influence of the water
quality of river, mainly the rainfall, which highly depends on wet and dry season
specifically in Malaysia. The dry and wet season influence also the affect the
hydrological characteristics of a river such as flow rate, velocity, volume of a river,
whereby, in dry season the flow rate, velocity also the volume of the river is very
low, and flushing the accumulating pollutants will be impossible making the river
become so dirty, and contradictory for the wet season. The tidal also affect the
changes in river water quality (Nor Azman Kasan, 2006).
9
Definitely, the disturbances which make the changes in hydrology and
hydrological characteristics is essential issue not to be ignored, the land use activities
which mainly contribute the typical sources of pollutants such as agricultural,
industry, residential, farming and others. It is also important to study the pollutant
source integrating hydrology and hydrological of the river basin associating with the
river water quality parameters in order to control the pollutant sources. Such study
can be possible through implementation of computer database tools which has been a
reliable enough in understanding, planning and management of water resources such
as GIS (Yunus et al, 2004). Where, all spatial and temporal data such as river
distribution maps, land use maps, pollutants sources coordination, can be developed
to identify the source of pollutants which change of water quality characteristics of
Sungai Langat basin in variable time frame.
1.3 Study Objectives
The aim of the study is predominately to investigate the significances of
pollutant to the river water quality of Sungai Langat basin. Therefore, the objectives
of this study are:
(i) To collect water quality, hydrological data, historical data, land use
maps of and other required information of Sungai Langat basin from
various government or private agencies, universities, journals, etc. and
compile all spatial and temporal datasets using Geographical
Information System (GIS).
(ii) To perform comprehensive trend analyses; WQI trend, population
trend and land use trend from 70’s, 80’s, 90’s and 2000’s to
understand the past/present of Sg Langat basin scenario
(iii) To carry out water quality statistical analysis during base and storm
flow events to indicate the PS and NPS deteriorating Sg Langat basin
10
(iv) To rank the PS and NPS from most and less pollutants impacting the
Sg Langat basin through violation analysis during base and storm
flow events
(v) To execute longitudinal water quality concentration profile analysis in
order to identify the precise sources of PS and NPS pollution along Sg
Langat
1.4 Scope of Study and Data Limitation
The study is carried out within the Sungai Langat Basin which is drained by
three major tributaries; Sungai Langat, Sungai Semenyih, and Sungai Labu. The
main tributary, Sungai Langat, flows about 182 km from the main range (Banjaran
Titiwangsa) at the Northeast of Hulu Langat District in south-southwest direction,
and draining into the Straits of Malacca. Both Sungai Langat and Sungai Semenyih
originate from the hilly and forested areas in the western slope of Banjaran
Titiwangsa, northeast of Hulu Langat. The main reach of Sungai Semenyih can be
considered to start from the Semenyih Dam flowing south southwest direction
through the town of Semenyih, Bangi Lama and finally merges with Sungai Langat
at about 4 km to the east of Bangi Lama town Sungai Semenyih is also supplemented
by Sungai Beranang and Sungai Pajam.
The trend analysis of water quality index, population, land use and are
covered from 1970’s until 2008 expect for the public sewage treatment loading trend
analysis is from 1994 to 2008 since the establishment of public sewage treatment
plants begun in 1994 in Malaysia. However, its all depends on the availability of the
data.
This study limits the water quality parameters to three parameters which
consists of Biochemical Oxygen Demand (BOD), Ammonia Nitrogen (NH3-N) and
11
Total Suspend Solid (TSS) which have been used as input data for all DOE’s stations
in the Sungai Langat basin.
Meanwhile the hydrological data type that been considered are rainfall, river
stage, discharge and suspended sediment for all DID’s stations in Sungai Langat
basin. Anyhow, the water quality and hydrological data has its limitation whereby
government agency such as DID and DOE have constraints in providing data of
water quality and hydrological data for all stations covering the whole Sungai Langat
basin especially in early year of 1980’s, 1990’s. Therefore, the indexes published in
DOE’s reports will be utilized for this study.
Meanwhile, the historical data which are significantly important in order to
analysis the source of PS and NPS entering Sungai Langat basin. Therefore, the
historical data consists of land use maps, Geographical Information System (GIS)
data, topographic maps covering the State of Selangor has been gathered. The
hardcopy of land use maps for 1970s and 2000s, were simply purchased at the
government agency of Town and Country Planning. Some of the maps which in
hardcopy form were been transformed to softcopy form by digitizing process using
available software.
It also been understood, that the importance of identification of point source
(PS) and non-point source (NPS) for river basin is a must as it will determine the
origin of the pollutant that give impact the Sungai Langat basin. Therefore, potential
PS data such as longitude and latitude coordinates of Palm and Rubber Mills, Water
Intake Points and Public Sewage Plant were obtained from DOE and IWK Sdn. Bhd
respectively. Unfortunately, the obtained coordinates are available for year 2000’s.
The communal septic tank (CST) and septic treatment plants (STP) discharge
concentrations of BOD, NH3-N and TSS also been obtained form IWK Sdn. Bhd.
12
1.5 Significance of Study
This study will be beneficial not only to the Government of Selangor as well
as the citizens of Selangor as this study helps the government to make decision on
watershed management after identifying the sources of the problem that degrading
the major rivers in the Sungai Langat basin. Further actions can be taken to cut the
sources of pollution to already polluted rivers, and to prevent the river that been
forecasted that will faced degrading of water quality. Beside that, the study will
benefit the government to clean the critically polluted rivers which will result clean
rivers that will definitely benefits the people’s health, economy and the country. The
study also has developed a digitalized database consist spatial and temporal data sets
from 1970 until 2008 will certainly benefit others to further study the trends of land
use-water quality of Sungai Langat basin.