Embed Size (px)
Citation preview
UNIVERSITI PUTRA MALAYSIA
THE PERFORMANCE OF PRIVATE UNIT TRUSTS IN MALAYSIA
PANG LOOI FAI
FEP 1998 13
brought to you by COREView metadata, citation and similar papers at core.ac.uk
provided by Universiti Putra Malaysia Institutional Repository

THE PERFORMANCE OF PRIVATE UNIT TRUSTS IN MALAYSIA
by
PANG LOOI FAI
Thesis Submitted in Fulfillment of the Requirements for the Degree of Master of Science in Faculty of Economics and Management
Universiti Putra Malaysia
September 1 998

TO MY DEAREST WIFE, PHEOBE AND SON, LUKE
i i

ACKNOWLEDGEMENTS
I wish to express my sincere appreciation to the persons who
have guided and helped me in preparing this d issertation. This
d issertation has been demand ing and without their assistance I would
not have been able to complete it.
First and foremost, I would l ike to thank the Chairman of my
Dissertation Committee, Associate Professor, Annuar Bin Md Nassir,
Head of the Department of Accounting and Finance, Faculty of
Economics and Management, Universiti Putra Malaysia, for suggesting
the topic and subsequently pursuing the matter until the end.
I also wish to express my sincere appreciation and gratitude to
Associate Professor Dr. Shams her Mohamed Ramadhi l i , Department
of Accounting and Finance, Faculty of Economics and Management,
Universiti Putra Malaysia for his invaluable gu idance, suggestions and
constructive comments throughout the preparation of this thesis.
iii

I would l ike to thank Mr. Loo Sin Chun of the Department of
Accounting and Finance, Faculty of Economics and Management,
Universiti Putra Malaysia, for his advice and assistance.
I am also grateful to the Fund Managers who provided me with
the data required to complete this d issertation .
Last but most, I am grateful to my wife and son for their
understand ing and patience throughout my stud ies
iv
TABLE OF CONTENTS
Page ACKNOWLEDGEMENTS................................................... iii LI ST OF TABLES ............................................................... ix LI ST OF FI GURES ............................................................. xi LI ST OF ABBREViATI ONS ................................................ xii ABSTRACT......................................................................... xiv ABSTRAK........................................................................... xvii
CHAPTER
BACKGROUND OF UNI T TRUSTS .................... ....... 1
I ntroduction .... ........ ............................... ................. 1 History of Unit Trusts/Mutual F unds................... . . . . 2 Advantages of investing in unit trust ...................... 3 How Unit Trusts can be valued at their NAV.......... 5
Unit Prices ..................................................... 5 F ees and Charges.................................................. 6
I nitial Service Charge..................................... 7 Repurchase Fee............................................ 7 Ongoing Fees and Expenses ........................ 7
Returns ................................................................ 9 Taxation of Returns................................................ 1 0 Risk ................................. . .............................. 1 1 Statement of Problem ............................................ 1 2 The Objective of the Study..................................... 1 2
I I OVERVI EW OF THE MALAYSI AN UNI T TRUST I NDUSTRY ................................................................ 1 5
Growth of the Malaysian Unit Trust I ndustry .... . . . . . . 1 5 Sectorial Demarcation of the Malaysian Unit Trusts I ndustry ................................................................ 1 7
I I I THE ORGANI SATI ON OF UNI T TRUSTS ..... . ........... 23
I ntroduction ............................................................ 23 The Structure of a Unit Trust.................................. 24 Types of Unit Trusts............................................... 27
Closed End (listed) Unit Trusts...................... 27
v
Open End Unit Trusts.................................... 28 Classification......... . . . . . . . . . . . . . . . . . . . . . . . . . . . . . . . . . . . . . . . . . . . . . . . . . 28 Specialised Unit Trusts ................................... ....... 29
Bond Unit Trusts............................................ 29 Property Trust Unit Trusts.............................. 29 Islamic Unit Trusts ......................................... 30
IV REGULATORY ASPECTS OF UNIT TRUSTS .......... 31
Introduction ............................................................ 31 Bodies Regulating Malaysian Unit Trusts............... 32 Regulations............................................................ 35 New Regulations - 1 997 . . . . . . . . . . . . . . . . . . . . . . . . . . . . . . . . . . . . . . . . 37
V CURRENT DEVELOPMENT IN THE UNIT TRUST INDUSTRY ....... ......................................................... 38
Recent Major Developments.................................. 38 Dangers revealed and the responses .................... 39 Recent Efforts to promote the Unit Trust Industry.. 41 Current Challenges facing the Unit Trust Industry . 43
VI LITERATURE REViEW.............................................. 45
Performance Measures.......................................... 45
VII DATA AND METHODOLOGy.................................... 54
Data Collection....................................................... 54 Estimating Returns................................................. 56 The Return on the Market Index ............................ 58 The Market Index as a Benchmark ........................ 5 8 Risk - Return Relationship..................................... 59 Standard Deviation................................................. 60 Beta ................................................................ 61 Unit Trust Objectives .............................................. 62 Risk Adjusted Performance Measures................... 64
Return Per Unit of Risk Measures ................. 64 Sharpe's Index............................................... 65 Treynor's Index ............................. ..... ............ 66 Differential Return Measures......................... 68 Jensen's Performance Measure.................... 68
Diversification .... .. . . . . . . . . . . . . . . . . . . . . . . . . . . . . . . . . . . . . . . . . . . . . . . . . . . . 71
vi

Selectivity and Timing . . . . . . . . . . . . . . . . . . . . . . . . . . . . . . . . . . . . . . . . . . . . 7 2 Returns . . . . . . . . . . . . . . . . . . . . . . . . . . . . . . . . . . . . . . . . . . . . . . . . . . . . . . . . . . . . . . . . 72 Returns due to Risk. . . . . . . . . . . . . . . . . . . . . . . . . . . . . . . . . . . . . . . . . . . . . . . . 75 Returns due to Selectivity . . . . . . . . . . . . . . . . . . . . . . . . . . . . . . . . . . . . . . 75 U nderd iversification . . . . . . . . . . . . . . . . . . . . . . . . . . . . . . . . . . . . . . . . . . . . . . . . 76 Net Selectivity . . .. . . . . . . . . . . . . . . . . . . . . . . . . . . . . . . . . . . . . . . . . . . . . . . . . . . . . 76 Returns from Timing Strategy . . . . . . . . . . . . . . . . . . . . . . . . . . . . . . . . 77 Timing Model . . . . . . . . . . . . . . . . . . . . . . . . . . . . . . . . . . . . . . . . . . . . . . . . . . . . . . . . . . 78 T - Statistics . . . . . . . . . . . . . . . . . . . . . . . . . . . . . . . . . . . . . . . . . . . . . . . . . . . . . . . . . . 8 1
VI I RESULTS . . . . . . . . . . . . . . . . . . . . . . . . . . . . . . . . . . . . . . . . . . . . . . . . . . . . . . . . . . . . . . . . 8 2
I ntroduction . . . . . . . . . . . . . . . . . . . . . . . . . . . . . . . . . . . . . . . . . . . . . . . . . . . . . . . . . . . . 8 2 Comparison of Fund Returns . . . . . . . . . . . . . . . . . . . . . . . . . . . . . . . . . 84 Risk Adjusted Performance Measures . . . . . . . . . . . . . . . . . . . 86 Diversification . . . . . . . . . . . . . . . . . . . . . . . . . . . . . . . . . . . . . . . . . . . . . . . . . . . . . . . . . 89 Selectivity Abi l ity of Fund Managers . . . . . . . . . . . . . . . . . . . . . . 90 Timing Abi l ity of Fund Managers . . . . . . . . . . . . . . . . . . . . . . . . . . . . 94
IX DiSCUSSiON . . . . . . . . . . . . . . . . . . . . . . . . . . . . . . . . . . . . . . . . . . . . . . . . . . . . . . . . . . . . . 96
X SUMMARY AN D CONCLUSiON . . . . . . . . . . . . . . . . . . . . . . . . . . . . . . . . 1 05
Summary and Conclusion . . . . . . . . . . . . . . . . . . . . . . . . . . . . . . . . . . . . . . 1 05 Impl ications of Study . . . . . . . . . . . . . .. . . . . . . . . . . . . . . . . . . . . . . . . . . . . . . . 1 07 Suggestions for Further Research . . . . . . . . . . . . . . . . . . . . . . . . . 1 08
B IBLIOGRAPHY . . . . . . . . . . . . . . . . . . . . . . . . . . . . . . . . . . . . . . . . . . . . . . . . . . . . . . . . . . . . . . . . 1 1 0
APPEN DIX A B
C
Gu idelines on Unit Trust ( 1 997/1 996) . . . . . . . . . . . List of Publ ications issued by Securities Commission . . . . . . . . . . . . . . . . . . . . . . . . . . . . . . . . . . Profi le of Un it Trusts
Table 1 0 Malaysian Un it Trusts . . . . . . . . . . . . . . . Table 1 1 Funds under Study . . . . . . . . . . . . . . . . . . . Table 1 2 Details of Funds under Study . . .
vi i
1 1 4
1 1 9
1 20 1 23 1 24
D Result Tables Table 1 3 Risk Return Relationship . . . . . . . . . .
Table 1 4 Risk Adjusted Performance ( 1 990-1 997) . . . . . . . . . . . . . . . . . . . . . . .. . . . . . . . . . . . . . . . . . . . . .
Table 1 5 Risk Adjusted Performance ( 1 990-1 996) . . . . . . . . . . . . . . . . . . . . . . . . . . . . . . . . . . . . . . . . . . . . .
Table 1 6 Risk Adjusted Performance ( 1 997) . . . . . . . . . . . . . . . . . . . . . . . . . . . . . . . . . . . . . . . . . . . . . . . . . . . . . .
Table 1 7 Components of Un it Trust Selectivity Performance ( 1 990-1 997) . . . . . .
Table 1 8 Components of Un it Trust Selectivity Performance ( 1 990-1 996) . . . . . .
Table 1 9 Components of Un it Trust Selectivity Performance ( 1 997) . . . . . . . . . . . . . . .
Table 20 Timing Abil ity . . . . . . . . . . . . . . . . . . . . . . . . . . . .
VITA
vii i
1 26
1 27
1 28
1 29
1 30
1 31
1 32 1 33
1 34
LIST OF TABLES
Table Page
1 . Value of Un it Trust Industries . . . . . . . . . . . . . . . . . . . . . . . . . . . . . . . .. 3
2. Un it Trust Fees and Charges . . . . . . . . . . . . . . . . . . . . . . . . . . . . . . . . . 8
3 . Growth of Unit Trust I ndustry 1 992-1 996 .. . . . . . . . . . .... 1 6
4 . Malaysian Unit Trust Industry as at 3 1 March 1 99820
5.
6 .
Risk-Return Relationship of Unit Trusts . . . . . . . . . . . . . . . . .
Unit Trust rate of Return ( 1 990-1 997 } . . . . . . . . . . . . .. . ... ..
7 . Comparison of Risk Adjusted Performance Measures
63
84
With the KLSE CI . . . . . . . .. . .... . . .. . . . . . . . . . . . .. . . . . . . . . . . . . . .... .. 86
8.
9.
1 0 .
1 1 .
1 2.
13
Components of Performance . . . . . . . . . . . . . . . . . . . . . . . . . . . ... ..
Timing Abil ity . . . . . . . . . . . . . . . . . . . . . . . . . . . . . . . . . . . . . . . . .. . . . . . . . . . . . . . . . .
Malaysian Unit Trusts as at 1 2 June 1 998 . . . . . . . . . ... .
Funds under Study . . . . . . . . .. . . . . . . . . . . . . . . ..... . . . . . . . . . . . . . . . . . . . .
Details of Funds under Study . . . . . . . . . . . . . . . . . . . . . . . . . . . . . . . . .
Risk Return Relationship . . . . . . . . . . . . . . . . . . . . . . . . . . . . . . . . . . . . . . .
1 4 Risk Adjusted Performance
90
94
1 20
1 23
1 24
1 26
( 1 990-1 997) . . . . . . . . . . . . . . . . . . . . . . . . . . . . . . . . . . . . . . . . . . . . . . . . . . . . . . . . . . . 1 27
1 5 Risk Adjusted Performance
( 1 990-1 996) . . . . . . . . . . . . . . . . . . . . . . . . . . . . . . . . . . . . . . . . . . . . . . . . . . . . . . . . . . . 1 28
ix
1 6 Risk Adjusted Performance
( 1 997)
1 7 Components of Unit Trust
Selectivity Performance (1 990-1 997) . . . . . . . . . . . . . . . . . . . . .
1 8 Components of Un it Trust
Selectivity Performance ( 1 990-1 996) . .. . . .. . . . . . . . . ... . . .
1 9 Components of Unit Trust
Selectivity Performance ( 1 997) . . . . . . . . . .. . . . . . . . . . . . . . . . .. . .
20 Timing Abil ity . . . . . . . . . . . . . . . . . . . . . . . . . . . . . . . . . . . . . . . . . . . . . . . . . . . . . . . . . .
x
1 29
1 30
1 31
1 32
1 33
LIST OF FIGURES
Figure Page
1 . Structure of an Unit Trust . . . . . . . . . . . . . . . . . . . . . . . . . . . . . . . . . . . . . . . 26
2 . Decomposition of Performance . . . . . . . . . . . . . . . . . . . . . . . . . . . . . . 74
3 . Non Successful Market Timing . . . . . . . . . . . . . . . . . . . . . . . . . . . . . . 79
4. Successful Market Timing . . . . . . . . . . . . . . . . . . . . . . . . . . . . . . . . . . . . . . 80
xi
AHTP
ASB
ASN
ASNB
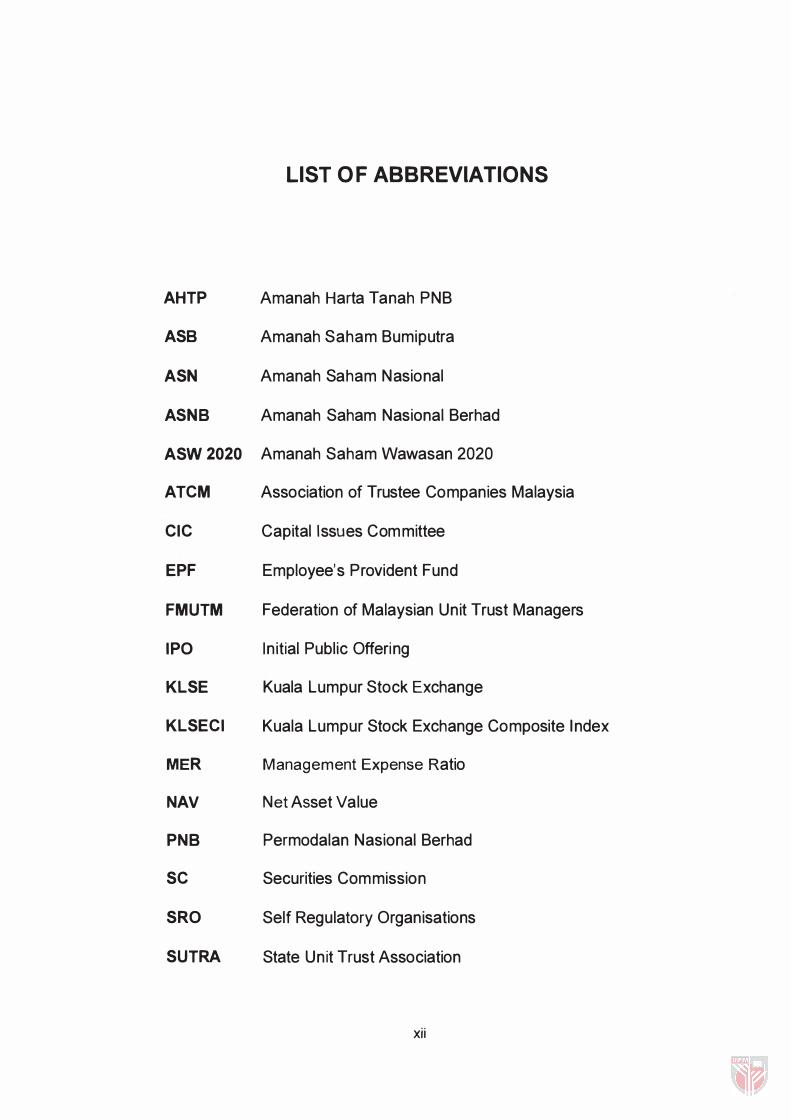
LIST OF ABBREVIATIONS
Amanah Harta Tanah PNB
Amanah Saham Bumiputra
Amanah Sa ham Nasional
Amanah Saham Nasional Berhad
ASW 2020 Amanah Saham Wawasan 2020
ATCM
CIC
EPF
FMUTM
IPO
KLSE
KLSECI
MER
NAV
PNB
SC
SRO
SUTRA
Association of Trustee Companies Malaysia
Capital Issues Committee
Employee's Provident Fund
Federation of Malaysian Unit Trust Managers
In itial Public Offering
Kuala Lumpur Stock Exchange
Kuala Lumpur Stock Exchange Composite I ndex
Management Expense Ratio
Net Asset Value
Permodalan Nasional Berhad
Securities Commission
Self Regulatory Organisations
State Un it Trust Association
xii

YPB Yayasan Pelaburan Bumiputra
xiii

Abstract of thesis presented to the Senate of Universiti Putra Malaysia in partial fulfi l lment of the requirements for the degree of Master of
Science.
THE PERFORMANCE OF PRIVATE UNIT TRUSTS IN MALAYSIA
by
PANG LOOI FAI September 1 998
Chairman: Associate Professor Annuar Bin Md Nassir, Ph.D.
Faculty: Economics and Management
As investments in the Malaysian capital market become
institutionalised, unit trusts are increasingly becoming the main vehicle
for a retail investor to participate in the capital market. Un it Trusts are
originally promoted to generate stable income with reasonable risks for
medium to long term investors.
This study examines the performance of 27 unit trusts in
Malaysia. Month ly data were collected over a 8 year period from 1 990
to 1 997. Performance is measured by the returns earned by the Unit
Trust. However these returns must commensurate with the level of risk
and therefore risk-adjusted performance measures are used .
Performance evaluation is further refined by investigating the abil ity of
xiv

the Unit Trust manager to select correct investments at the right time
i .e . h is/her timing and selection performance.
The general findings of this study ind icate that most Malaysian
Unit Trusts general ly underperform the market, are poorly d iversified
and generate low levels of returns. Of the 27 funds studied only 33%
outperformed the market. However after adjusting for different risk
levels , none of the funds were able to outperform the market. The
average R2 was 0 .5 16 indicating most funds were not fully d iversified .
Specifically most funds analysed attained half the level of
d iversification compared to the market portfolio which is used as the
benchmark portfol io
The findings ind icate that funds general ly perform better during
a bear market as compared to a bul l market. Though the returns for
unit trusts in a downtrending period was negative, the losses were less
than the market portfol io, whereas in an uptrend period the returns of
unit trusts were less than the market return .
The findings also ind icate that the timing and selection abil ity of
Unit Trust managers were poor with all funds having negative net
xv

selection . Timing abil ity was only marginally positive for income growth
funds.
This implies that in terms of the performance measured on the
basis of returns per unit of risk and the level of diversification achieved
by these funds, it would have been better for investors to invest on
their own .
xvi

Abstrak tesis yang dikemukakan kepada Senat Universiti Putra Malaysia sebagai memenuhi sebahagian keperluan untuk Ijazah
Master Sains
PENILAIAN PENCAPAIAN AMANAH SAHAM SWASTA 01 MALAYSIA
Oleh
PANG LOOI FAI September 1 998
Pengerusi: Profesor Madya Annuar Bin Md Nassir, Ph.D
Fakulti: Ekonomi dan Pengurusan
Pasaran modal di Malaysia kin i lebih di dominasi oleh pelabur
pelabur institusi dan Amanah Saham menjad i jentera utama bagi para
pelabur runcit untuk membabitkan diri dalam pasaran modal . Amanah
Saham d ijangka meraih pulangan yang tinggi dengan risiko yang
berpatutan untuk jangkamasa sederhana dan panjang.
Kajian in i mengkaj i pencapaian 27 buah Amanah Saham di
Malaysia. Data bulanan bagi jangkamasa 8 tahun dari 1 990 - 1 997
dianalisa dan prestasi ini d in i lai berdasarkan pu langan yang diperolehi
oleh setiap Amanah Saham . Bagaimana pun pulangan tersebut adalah
berdasarkan paras risiko yang ditanggung. Oleh itu prestasi d iukur
xvii

berbanding dengan risiko d itanggung . Penilaian pencapaian
seterusnya d iperinci kepada keupayaan pengurus Amanah Saham
untuk memilik pelaburan yang sesuai pad a masa yang sesuai iaitu
meni lai prestasi pemil ihan dan pemasaan pengurus.
Hasil kajian ini menunjukkan, pencapaian kebanyakkan Amanah
Saham di Malaysia mempunyai prestasi di bawah paras pencapaian
yang dijangka, kurang tahap pempelbagaian dan ada juga pulangan
yang tidak setara dengan pulangan portfolio pasaran. Hanya 33%
daripada 27 Amanah Saham yang di kaji mencapai tahap pulangan
yang melebihi portfolio pasaran. Selepas menjalankan penyesuaian
bagi paras risiko yang berlainan , tiada amanah saham yang
berkeupayaan mencapai tahap pulangan yang melebihi pulangan
portfolio pasaran. Purata R2 sebanyak 0.5 1 6 menunjukkan
kebanyakkan dana tidak mencapai tahap pempelbagaian penuh yang
dijangkakan .
Hasil kaj ian ini juga menujukkan bahawa dana pad a umumnya
mencapai pretasi yang lebih memuaskan dalam pasaran saham yang
menurun berbandingkan dengan pasaran saham yang meningkat.
Walaupun pu langan daripada Amanah Saham adalah negatif, dalam
jangkamasa penurunan pasaran saham , tahap kerugiannya adalah
xviii

kurang daripada portfolio pasaran. Manakala dalam jangkamasa
peningkatan pasaran saham, tahap pulangan Amanah Saham adalah
kurang daripada portfolio pasaran.
Kajian in i juga menujukkan prestasi pemasaan dan pemil ihan
pengurus amanah sa ham yang kurang memuaskan dengan semua
dana mempunyai nilai pemil ihan bersih yang negatif. Prestasi
pemasaan yang positif hanya d icapai oleh dana yang berobjektif
penumbuhan pendapatan .
Pada keseluruhannya penemuan menunjukan pengurus
Amanah yang dikaj i tidak mempunyai kemahiran pemil ihan dan
pemasaan yang cekap. Penemuan ini memberi implikasi bahawa dari
segi prestasi yang di ukur dari segi pulangan setiap unit risiko dan
tahap pempelbagaian pelabur mungkin mendapat meraih keuntungan
yang lebih baik j ika melabur duit secara individu .
xix
CHAPTER I
BACKGROUND OF UNIT TRUSTS
Introduction
Unit Trusts are a form of col lective investment scheme, where
capital of investors with similar financial objectives are pooled and funds
subsequently managed by an appointed party. This al lows investors to
participate in investments that as individual investors they m ight not be
able to make due to their low level of funds or expertise. In some
countries these col lective investment schemes are termed as mutual
funds rather than unit trusts. The difference l ies in their legal structure,
namely mutual funds are investment companies that issue redeemable
shares whereas unit trusts , are not companies and issue units instead
of shares . I n Malaysia, collective investment schemes are in the form of
unit trusts, however these schemes are commonly cal led funds, and this
term wou ld be used synonymously with unit trust in this study.
1

2
History of Unit Trusts/Mutual Funds
Collective investment schemes started in Europe 1 76 years ago
when King Will iam I of Belgium established a closed-end fund called
Societi General de Belgique in 1 822. However the Foreign and Colonial
Government Trust established in London in the late 1 9th century formed
the basis of today's unit trusts.
I n the United States, collective investment schemes are
structured as mutual funds with the first established in 1 924 cal led the
Massachusetts Investors Trust. Mutual funds in America became
popular in 1 940 and subsequently had a market capital isation of one
bil l ion dollars by 1 945 and a tri l l ion dollars in 1 99 1 . As at end of 1 996,
the aggregate size of the industry stood at US$3.03 tril l ion .
In Asia the unit trust industry is relatively new. However by 1 996
it had a value of more than US$700 bi l l ion . At that time the Malaysian
Unit Trust industry had a value of US$30 bil l ion which is 4% of the
Asian value.

Table 1 Value of unit trust industries
Countryl Area United States Asia Malaysia
Value US$ (Qjllion) 3 ,030
700 30
Source: Securities Commission Homepage
3
The value of unit trust industries in the Un ited States, Asia and
Malaysia are compared in the table above. The table shows Malaysia's
unit trust industry having a value of US$30 bi l l ion (and this accounts for
less than 1 0% of the market capitalisation of the KLSE) as compared to
the United States of US$3,030 bi l l ion. The information in the table
shows that Malaysia's unit trust industry is at its infancy compared to
the United States. This implies that collective investments of this nature
in Malaysia are not yet a significant part of the capital market.
Advantages of Investing in Unit Trusts
The main reasons for selecting unit trusts as a vehicle for
investments are expert management, service, d iversification,
opportunities and l iquidity.
4
Fund managers trained in security analysis, devoting their full
time to carrying out the fund investment objectives as specified in the
prospectus manage funds. They constantly monitor the performance of
the fund , adjusting its composition to earn maximum returns.
In add ition to the above-mentioned expert management, a fund
is able to minimise and spread its risk. A fund's risk is equated with the
variabil ity of its return , meaning that the higher the variabil ity of a fund's
expected return the higher the risk. Risk can also be equated with
hold ing similar securities. Therefore risk can be spread and minimised
by holding d issimilar securities, through diversification . The large size of
funds avai lable would enable risk to be reduced through d iversification.
This involves spread ing the risk over a broad portfol io of securities and
bonds in different companies, sectors, countries or regions. A fund
would also have an advantage of a broader range of securities than an
individual investing on his own . Though funds wou ld seek to minimise
their risk, each fund would have its own risk preference level and
degree of diversification depending on its stated objectives. For
example, some funds invest in riskier securities in the hope of h igher
returns in the short term and others in less risky securities for lower but
stable returns.
5
Liquidity means that investors can easily sel l some or all of their
units back to the management company. This abi l ity al lows him to
convert the units to cash without much sacrifice of time.
How Unit Trusts can be Valued at their NAV (Net Asset Value)
Unit trusts obtain money by sel ling units to investors. This money
is pooled and then used to purchase investments in the form of
securities, property and etc. The investments are referred to as the
fund's assets and the fund's value changes accord ing to changes in the
investment's market values. The value of each unit is d irectly l inked to
the fund's assets as the value of the fund is d ivided into units of equal
value. This net asset value (NAV) of the fund is the value of the
underlying investments less fees and expenses.
Unit Prices
Using the NAV figure, fund managers determine the buy and sell
prices , namely amount the investor obtains when he/she wishes to
l iquidate or sell back the units to the fund and the price they sell the
units to the investor. These are arrived at when the fund's investments
are revalued everyday to reflect their current market prices. Thus the