Embed Size (px)
Citation preview
UNIVERSITI PUTRA MALAYSIA
IMPACT OF INVESTMENT INFLOWS ON REGIONAL DISPARITY IN INDONESIA
MUHAMMAD FIRDAUS
FEP 2006 3
IMPACT OF INVESTMENT INFLOWS ON REGIONAL DISPARITY IN INDONESIA
By
MUHAMMAD FIRDAUS
Thesis Submitted to the School of Graduate Studies, Universiti Putra Malaysia, in Fulfillment of the Requirement for the Degree of Doctor of Philosophy
August 2006
Abstract of thesis presented to the Senate of Universiti Putra Malaysia in fulfilment of the requirement for the degree of Doctor of Philosophy
IMPACT OF INVESTMENT INFLOWS ON REGIONAL DISPARITY IN INDONESIA
By
MUHAMMAD FIRDAUS
AUGUST 2006
Chairman: Associate Professor Zulkornain Yusop, PhD
Faculty Economics and Management
Some tactical policies related to regional development, whether they were intended or
not, were implemented since in the early 1970s. Moreover some policies have been
formulated in 1990s to reduce regional disparities. However, they are more in nonnative
level than implementation. An increasing level of regional income inequality, which
accompanied the rapid economic growth, shows the failure of some those policies. The
large differences in economic indicators among provinces in Indonesia are no doubt due
to the very significant inequality of investment inflows. The problem of economic
disparity across Indonesia will still exist. This study aims to analyze the disparity of
regional economy by testing the income convergence; to identifY the relationship
between regional income and investment inflows and to find the detenninants of foreign
investment inflows into provinces.
i

The shortcomings of the cross-sectional approach have advocated the time-series
estimation. However the time-series estimates may be subject to problems of
identification and estimation induced by simultaneity bias or endogeneity of variables
observed. Based on such disadvantages, both static and dynamic panel data methods are
employed to satisfy the objectives of this study.
This study shows that static and dynamic panel data approach give the different results
of convergence examination. Consistent with the theory, the OLS and fixed-effects
estimators provide the upper and lower bounds. The first-differences generalized method
of moments (FD-GMM) provides invalid estimators which are lower than the coefficient
from the fixed effects estimators due to the weak instruments problem. The system
GMM (SYS-GMM) estimators are found to be unbiased, consistent and valid. They
show that convergence process prevails among provinces in Indonesia for the period
1983 - 2003. However the speed of convergence is .29 percent, which is relatively very
slow compared to other studies in developing countries. The model suggests that
regional income and investment inflows show the positive and significant relationship.
The SYS-GMM are also the most preferred model for fmding the determinants of
foreign investment inflows. The results of this study show that factors which are
statistically significant to attract the foreign investors to come to a province are market
size (regional GDP), level of economic development (agriculture's share), infrastructure
(electric supply) and education level attainment.
11
Abstrak tesis ini dikemukakan kepada Senat Universiti Putra Malaysia scbagai mcmcnuhi keperluan untuk Ijazah Doktor Falsafah
KESAN KEMASUKAN PELABURAN ASING PADA KEIDAKSEIMBANGAN KA WASAN DI INDONESIA
Oleh
MUHAMMAD FIRDAUS
OGOS2006
Pengerusi : Professor Madya Zulkornain Yusop, PhD
Fakulti : Pengurusan dan Ekonomi
Beberapa polisi taktikal berkaitan pembangunan rantau, samada secara langsung atau
tidak, telah mula dilaksanakan bennula awal 1970-an. Bagaimanapun, beberapa polisi
yang lain telah difonnulasikan pada 1990-an untuk mengurangkan ketidakseimbangan di
rantau ini. Namun, fonnulasi tersebut adalah melebihi tahap normal untuk tujuan implementasi. Kenaikan paras pendapatan yang tidak seimbang di rantau ini adalah
sejajar dengan pembangunan pesat, hanya menunjukkan kegagalan sebahagian polisi ini.
Perbezaan besar dalam penanda ekonomi antara daerah di Indonesia menurUukkan ketidakseimbangan aliran masuk modal. Masalah ketidakseimbangan ekonomi di
Indonesia masih wujud. Objektif kajian ini adalah untuk mengkaji taburan pendapatan
antara daerah dengan pemeriksaan hipotesis convergence, mengkaji pertalian antara
pendapatan daerah dengan kemasukan pelaburan dan menganalisa faktor kemasukan
pelaburan asing ke dalam daerah di Indonesia.
III

Kekurangan pendekatan cross-sectional telah menyokong model jangkaan siri-masa.
Bagaimanapun jangkaan siri masa boleh menjadi suatu permasalahan di dalam
pengenalpastian dan jangkaan yang diaruhkan oleh parameter dalaman yang dikaji.
Berdasarkan kepada kekurangannya, kedua-dua metode panel statik dan dinamik
digunakan untuk tujuan mencapai objektif kajian ini.
Hasil kajian ini mendapati bahawa pendekatan data panel secara statik dan dinamik telah
memberikan keputusan pemeriksaan convergence. Sej�iar dengan teori, jangkaan kesan
OLS dan tetap menyediakan sempadan atas dan bawah. Perbezaan pertama untuk
metode dan kaedah moment pembezaan pertama (FD-GMM) telah menyediakan
jangkaan yang tidak relevan dan lebih rendah berbanding koefisien daripada jangkaan
kesan tetap disebabkan masalah instrumentasi yang lemah. Jangkaan daripada system
GMM (SYS-GMM) didapati tidak bias, konsisten dan memberikan keputusan yang
relevan. Ia telah menunjukkan bahawa proses convergence berlaku di antara daerah di
Indonesia untuk tempoh 1983-2003. Bagaimanapun, halaju pengumpulan adalah
setinggi 0.29% yang mana adalah perlahan di bandingkan dengan kajian di negara
membangun yang lain. Kajian ini mendapati pertalian yang positif antara pendapatan daerah dengan kemasukan pelaburan. SYS-GMM adalah merupakan model yang paling
sesuai di dalam menentukan faktor-faktor kemasukan pelaburan asing. Keputusan kajian
ini menunjukkan faktor yang signifikan dari aspek statistik untuk menarik pelabur asing
ke daerah yang mempunyai saiz pasaran (GDP serantau), paras pembangunan ekonomi
(perkongsian agrikultur), infrastruktur (bekalan elektrik) dan tahap pelajaran penduduk.
IV

ACKNOWLEDGEMENTS
I would like to express my deepest gratitude to invaluable advice and support from my
Supervisors: Zulkomain Yusop, Muzafar Shah Habibullah and Zakariah Abdul Rashid. I
also would like to thank to all lectures in Department of Economics for giving me some
fundamentals of this study.
I would like to thank to Prof. Bunasor Sanim, Ph.D., Prof. Ahmad Zainuddin Abdullah,
Ph.D., Law Siong Hook, Ph.D. and Hermanto Siregar, Ph.D. for comments and critics to
enrich this thesis.
I would like to express gratitude to SEARCA for providing financial support during
some periods of my study. I wish to express my thanks to Bogor Agricultural University
for permitting me to pursue the doctoml program in Universiti Putra Malaysia, and all
my seniors and partners which consistent encourage me to finish this study.
I am grateful to all staffs in Faculty of Economics and Management, Graduate School
Office and International Affairs for giving me nice stuffs in fInishing this study.
Sincerely I would like to express my heartfelt appreciation to my parents, my brothers,
sisters, Bu Yayah, my lovely wife and my beautiful daughter for their consistent prayers,
understanding, encouragement ·and moml support.
v

I certify that an Examination Conunittee has met on 18 August 2006 to conduct the final examination of Muhammad Firdaus on his Doctor of Philosophy thesis entitled "Impact of Investment Inflows on Regional Disparity in Indonesia" in accordance with Universiti Pertanian Malaysia (Higher Degree) Act 1980 and Universiti Pertanian Malaysia (Higher Degree) Regulations 1981. The Committee recommends that the candidate be awarded the relevant degree. Members of Examination Committee are as
follows:
Ahmad Zubaidi Baharumshah, PhD Professor Faculty of Economics and Management Universiti Putra Malaysia (Chairman)
Ahmad Zainuddin Abdullah, PhD Lecturer Faculty of Economics and Management Universiti Putra Malaysia (Internal Examiner)
Law Siong Hook, PhD Lecturer Faculty of Economics and Management Universiti Putra Malaysia (Internal Examiner)
Bunasor Sanim, PhD Professor Faculty of Economics and Management Institut Pertanian Bogor (External Examiner)
HASANA U'D�"''''. GHAZALI, PhD Professor/ ut ean School of Graduate Studies Universiti Putra Malaysia
Date: 2 2 NOV 2006

This thesis submitted to the Senate of Universiti Putra Malaysia and has been accepted as fulfillment of the requirements for the degree of Doctor Philosophy. 1be members of the Supervisory Committee are as follows:
Zulkornain Yusop, PhD Associate Professor Faculty of Economics and Management Universiti Putra Malaysia (Chainnan)
Muzafar Shah Habibullah, PhD Professor Faculty of Economics and Management Universiti Putra Malaysia (Member)
Zakariah Abdul Rashid, PhD Professor Faculty of Economics and Management Universiti Putra Malaysia (Member)
AINI IDERIS, PhD Professor I Dean School of Graduate Studies Universiti Putra Malaysia
Date: 1 4 DEC Z006
Vll

DECLARATION
I hereby declare that the thesis is based on my original work except for quotations and citations which have been duly acknowledged. I also declared that it has not been previously and currently submitted to any other degree at Universiti Putra Malaysia or other institutions.
Mv ..... .r1J. ............. .,n.A-'
Date:
Vlll
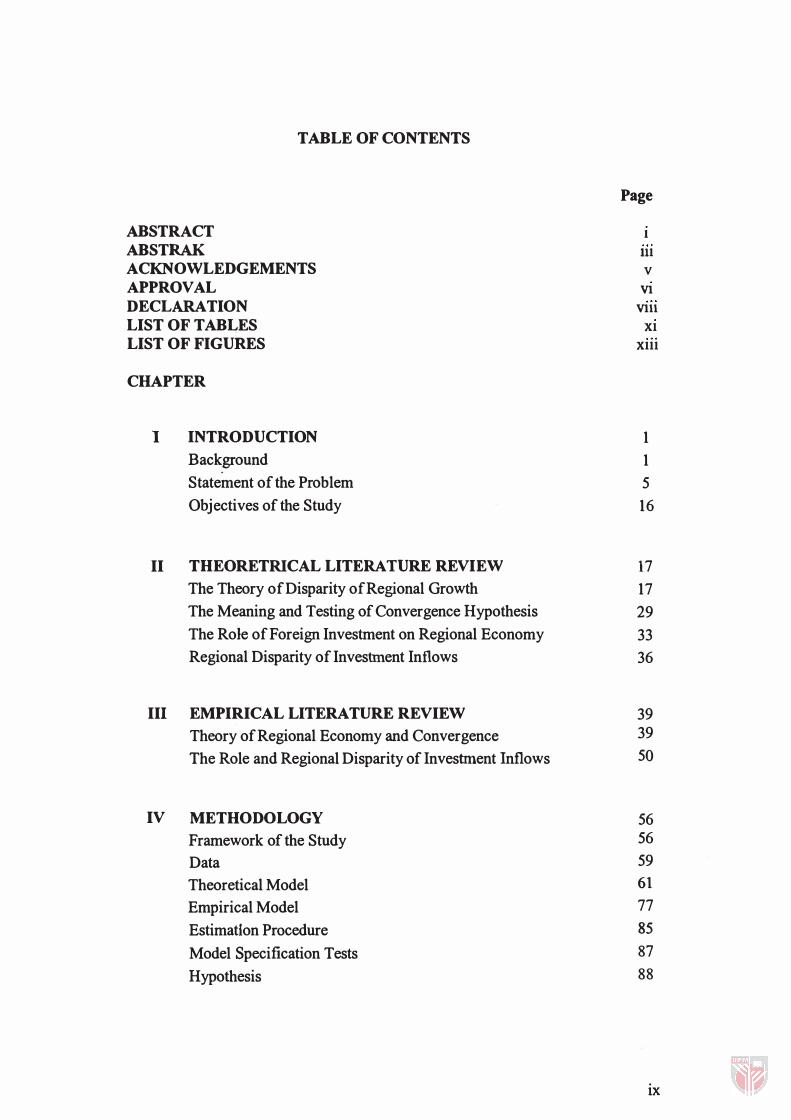
TABLE OF CONTENTS
ABSTRACT ABSTRAK ACKNOWLEDGEMENTS APPROVAL DECLARATION LIST OF TABLES LIST OF FIGURES
CHAPTER
I INTRODUCTION
Background
Statement of the Problem
Objectives of the Study
II THEORETRICAL LITERATURE REVIEW
The Theory of Disparity of Regional Growth
The Meaning and Testing of Convergence Hypothesis
The Role of Foreign Investment on Regional Economy
Regional Disparity of Investment Inflows
III EMPIRICAL LITERATURE REVIEW
Theory of Regional Economy and Convergence
The Role and Regional Disparity of Investment Inflows
IV METHODOLOGY
Framework of the Study
Data
Theoretical Model
Empirical Model
Estimation Procedure
Model Specification Tests
Hypothesis
Page
I 11l V
VI VIll
Xl Xlll
1
1
5
16
17
17
29
33
36
39 39
50
56 56
59
61
77
85
87
88
ix
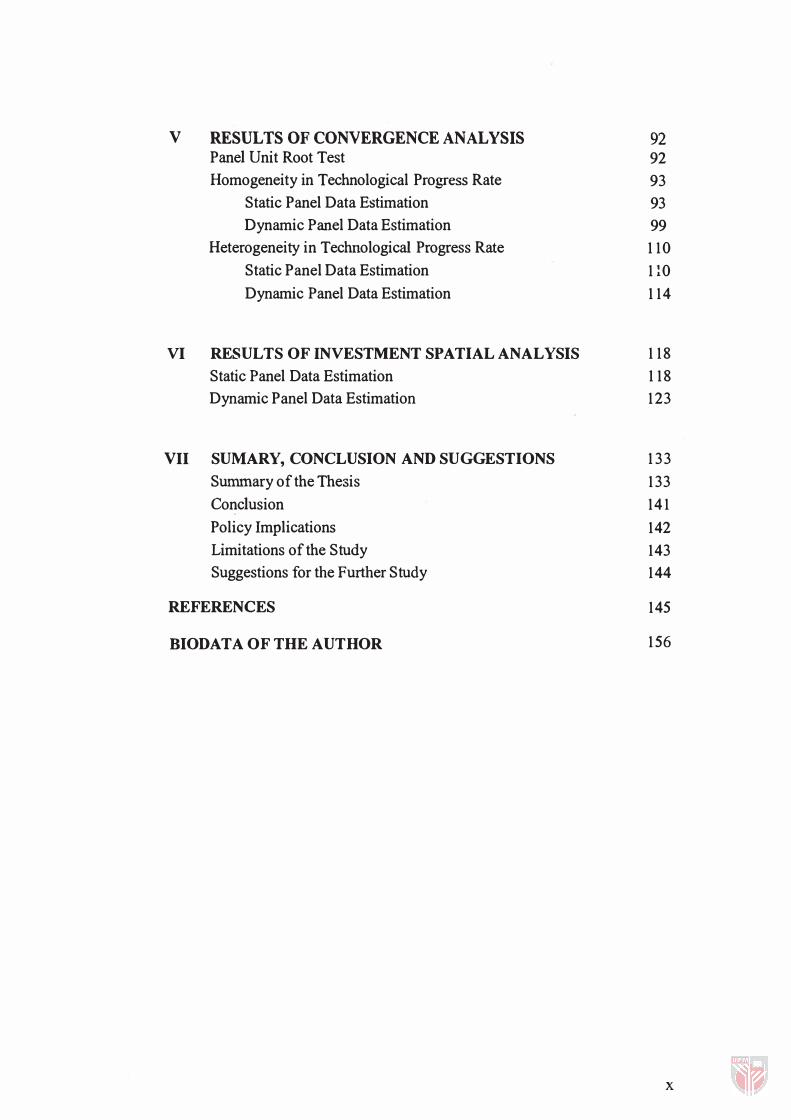
V RESULTS OF CONVERGENCE ANALYSIS 92 Panel Unit Root Test 92 Homogeneity in Technological Progress Rate 93
Static Panel Data Estimation 93 Dynamic Panel Data Estimation 99
Heterogeneity in Technological Progress Rate 110 Static Panel Data Estimation 110 Dynamic Panel Data Estimation 114
VI RESULTS OF INVESTMENT SPATIAL ANALYSIS 118 Static Panel Data Estimation
Dynamic Panel Data Estimation
VII SUMARY, CONCLUSION AND SUGGESTIONS
Summary of the Thesis
Conclusion
Policy Implications
Limitations of the Study
Suggestions for the Further Study
REFERENCES
BIODATA OF THE AUTHOR
118 123
133
133
141
142
143 144
145
156
x
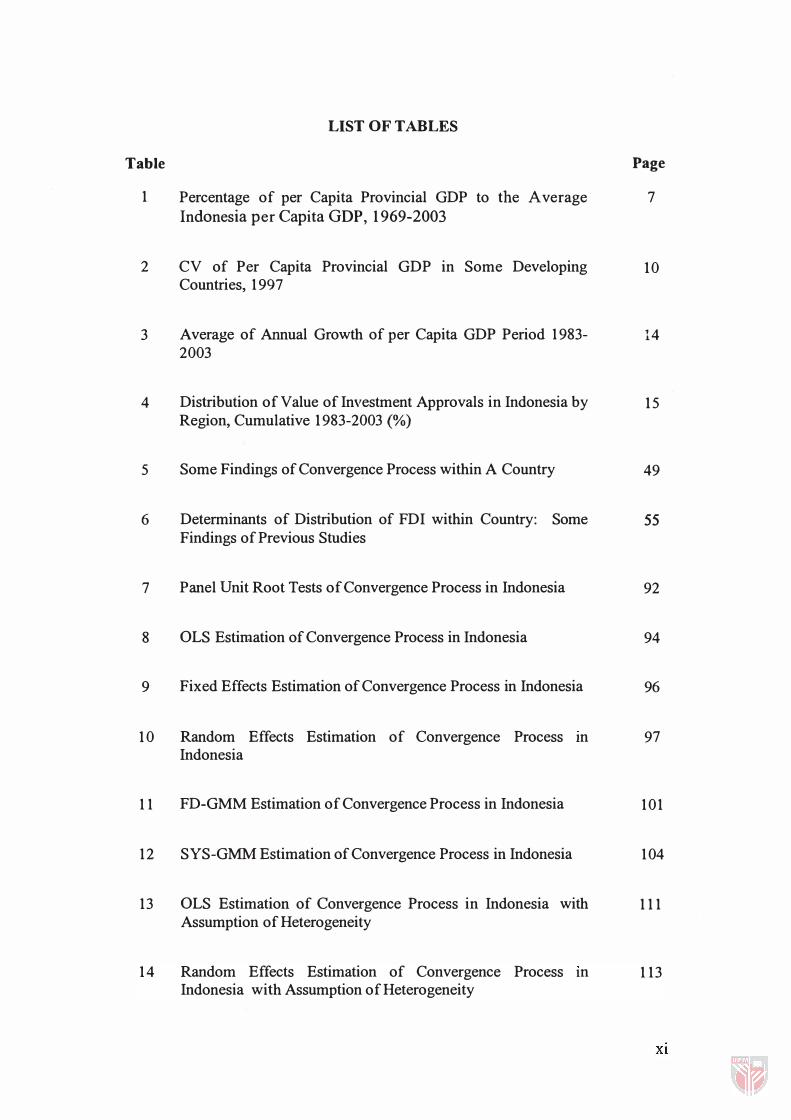
LIST OF TABLES
Table Page
1 Percentage of per Capita Provincial GDP to the Average 7
Indonesia per Capita GDP, 1969-2003
2 CV of Per Capita Provincial GDP in Some Developing 10 Countries, 1997
3 Average of Annual Growth of per Capita GDP Period 1983- 14 2003
4 Distribution of Value of Investment Approvals in Indonesia by 15 Region, Cumulative 1983-2003 (%)
5 Some Findings of Convergence Process within A Country 49
6 Determinants of Distribution of FDI within Country: Some 55 Findings of Previous Studies
7 Panel Unit Root Tests of Convergence Process in Indonesia 92
8 OLS Estimation of Convergence Process in Indonesia 94
9 Fixed Effects Estimation of Convergence Process in Indonesia 96
10 Random Effects Estimation of Convergence Process In 97 Indonesia
11 FD-GMM Estimation of Convergence Process in Indonesia 101
12 SYS-GMM Estimation of Convergence Process in Indonesia 104
13 OLS Estimation of Convergence Process in Indonesia with 111 Assumption of Heterogeneity
14 Random Effects Estimation of Convergence Process In 113 Indonesia with Assumption of Heterogeneity
Xl

15
16
17
18
19
20
21
22
FD-GMM. Estimation of Convergence Process III Indonesia with Assumption of Heterogeneity
SYS-GMM Estimation of Convergence Process in Indonesia with Assumption of Heterogeneity
Reiationship between Regional Income and Investment Inflows
OLS Estimation of Determinants of Investment Inflows
Fixed Effects Estimation of Determinants of Investmeni Inflows
Random Effects Estimation of Determinants of Investment Inflows
FD-GMM Estimation of Determinants of Investment Inflows
SYS-GMM Estimation of Determinants of Investment Inflows
115
116
117
119
121
123
126
127
XlI
LIST OF FIGURES
Figure Page
1 The Map of Indonesia 3
2 Coefficient of Variation of per Capita Provincial GDP in 6 Indonesia, 1969-2001
3 Trends of Regional GDP of KBI and KTI 1983-2003 12
4 Trends of Regional GDP of KBI and KTI 1983-2003 13
5 Output in the Neoclassical Model 19
6 Kaldor's Cumulative Causation Model 23
7 Internal and External Increasing Returns 26
8 Framework of the Study 56
9 Growth in Regional Income and Capital Stock of Indonesia, 105 1983-2003
10 Standard Deviation of Foreign Investment Approvals 106 among Provinces in Indonesia, 1983-2003
11 Average Agriculture's Share on among Provinces 107 in Indonesja GDP In and Out of Java Island, 1983-2003
Xlll
CHAPTER I
INTRODUCTION
Background
Indonesia is one of the largest countries in Asia. It had a population of over than
230 million citizens in 2003, which is the fourth most populated country in the
world after China, India and the USA. The Indonesian archipelago comprises of
13,677 islands, which cover nearly 2 million square kilometers from Aceh, (the
far-western province), to Papua or Irian Jaya (the far-eastern province).
Total population of Indonesia in the latest census year 2000 was about 206.3
million. At the end of 2005 the population is estimated to reach 242 million. In
2003, total household was about 56.6 million. Around 90.5 percent of 100.3
million labor force has been working in 2003 (Central Agency for Statistics,
2005). About 10 percent of labor force was still looking for jobs. The majority
(76.8 %) of workers was low educated or under senior high school. From about 90
millions people who have been working, more than 46 percent of them worked at
agricultural sector. The government of Republic of Indonesia continuously
increases the quality of human resources. In 2003, the illiteracy rate was quite
high. The percentage of illiterate people aged 10 years and over was about 12
percent in rural area and 5 percent in urban area. Indonesian economy was quite
stable during 2002 up to 2005. Based on GDP at 1993 constant prices, economic
growth in year 20�3 was about 4.1 percent. This number increased to about 5
percent in 2005. Per capita national income is Rp 7.1 million in 2003 or US $ 800.
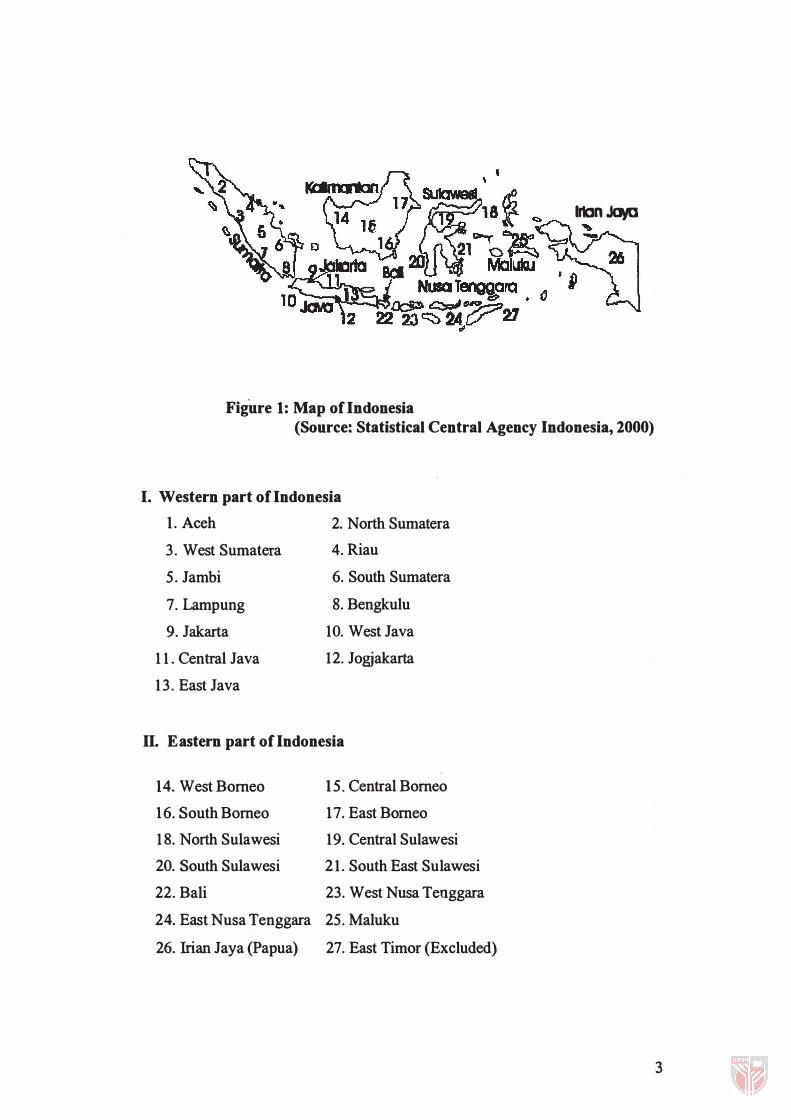
Geographically Indonesia is divided into two regions: western part and eastern
part of Indonesia (Figure 1). In many studies, western part of Indonesia (KBI)
consists of some provinces which are located in Sumatra and Java islands while
provinces in Borneo, Sulawesi and other islands are grouped as eastern part of
Indonesia (KTI). The provinces in KBI are relatively more developed than
provinces in KTI. However some provinces in KTI, e.g. South Sulawesi and Bali
are also developed as they become the center of trade and tourism since a long
time ago. These provinces and regions are highly diverse states jn terms of ethnic,
religious, cultural and economic makeup.
After the country proclaimed independence on August 17, 1945, the central
government was politically and economically dominated by Java, while the outer
islands tended to be neglected. Early in the industrialization period in 1950s,
spatial dispersion of manufacturing industries was highly skewed with the
excessive predominance of Java as opposed to the other islands. West Java
accommodated 30 percent of all large and medium-size firms in manufacturing
such as footwear, tobacco, textiles and food products; whereas Central Java and
East Java accommodated 25 percent each. Outside Java, only North Sumatra
housed a significant number of manufacturing establishments. The pro-Java
policy distressed the outer islands and induced regional separation movements in
the late 1950s. Some of these revolts known as vertical conflict still exist in some
rich resources provinces such as Aceh Merdeka, Riau Merdeka and Papua
J.-ferdeka.
2
Irian .ICfID
Figure 1: Map of Indonesia (Source: Statistical Central Agency Indonesia, 2000)
I. Western part of Indonesia
1. Aceh 2. North Sumatera
3. West Sumatera
5. Jambi
7. Lampung
9. Jakarta
11. Central Java
13. East Java
4. Riau
6. South Sumatera
8. Bengkulu
10. West Java
12. Jogjakarta
II. Eastern part of Indonesia
14. West Borneo
16. South Borneo
18. North Sulawesi
20. South Sulawesi
15. Central Borneo
17. East Borneo
19. Central Sulawesi
21. South East Sulawesi
22. Bali 23. West Nusa Teuggara
24. East Nusa Tenggara 25. Maluku
26. Irian Jaya (Papua) 27. East Timor (Excluded)
3
Suharto's new order regime that took over from Sukamo' s regime in 1968
started to implement planned development based on five-year period
(PELITA). One of the crucial issues was regional equalization policy. This
was aimed to subsidize regional governments in reducing regional
economic inequalities. This concern �as rooted in the widening of income
gaps that started early in the first PELITA (1968-1973).
The problem of economic disparity across Indonesia will still exist. An economic
underlay of unequal natural endoWinent between the regions continually
challenges economic progress achieved. The unequal distribution of natural
resources, especially oil and natural gas, and the uneven development of trade and
industrial centers that are concentrated in a few regions, have created growth
enclaves. It is important to analyze the results achieved by regional policies
intended to reduce the disparity, mainly through empirical observation on regional
economies. This can be achieved by testing the convergence of income among
provinces or regions. However, convergence hypothesis test still receives a little
attention of the regional economy analysis in less developed countries such as
Indonesia. Thus this study by employing panel data approaches attempts to test
the convergence hypothesis.
As hypothesized in this study, the important element that widens the disparities
among regions is investment inflows, as an engine of growth. In today's
Indonesian economy, regions are increasingly varying with each other for greater
amount of investment inflows. Some provinces or regions absorbed much more
4
than other. Investigation on relationship between investment inflow and regional
economy performance has significant role in economic development. This means
that regional economic growth can be treated as a catalyst in attracting investment
inflow; also investment inflow stimulates economic growth (Borensztein, 1998).
Assessing empirically why there is such an unequal pattern is almost non-existent;
either from analysts or policy makers. This study attempts to shed light on this
issue to identify some factors that influence foreign investors to come to a
province or a region. Some hypotheses center on economic dimensions and
infrastructure development are tested to answer what the determinants of the
spatial distribution of investment inflows are.
All above works show that the study of regional income disparity is significant
and will receive a great deal of public attention. This study is also important due
to anticipate serious threats of regional disparities. Where the inability of
Indonesia to deal with such inequities creates potential for disunity, and in
extreme case for disintegration, as happened to the province of East Timor. Thus,
some suggestions are required to achieve more balanced regional development.
Statement of the Problem
Since the late 1960s, provincial GDP data have consistently indicated significant
differences in GDP between the provinces that are well endowed with natural
resources and those that are densely populated and/or sparsely endowed with
natural resources. The gross domestic product of Province Jakarta (without oil and
gas) in 2003 was 14.8% of the total Indonesian GDP, which represents slightly
5
over 0.03% of Indonesia's land area. While the third widest province, Central
Borneo, that represents about 4.68% of Indonesia's land, accounted for a mere
0.94% of total Indonesian GDP (Statistical central agency Indonesia, 2004).
Table 1 shows Indonesia's distribution of per capita GDP without oil and gas
among 26 provinces from 1969 to 2003. The interesting observation is that per
capita GDP of three provinces: North Sumatra, Jakarta and East Borneo remained
above the average Indonesia per capita GDP. On the other hand the poorest region
(East Nusa Tenggara) earned only about one fourteenth of the richest province
(Jakarta), which remained below 50% of average Indonesia per capita GDP.
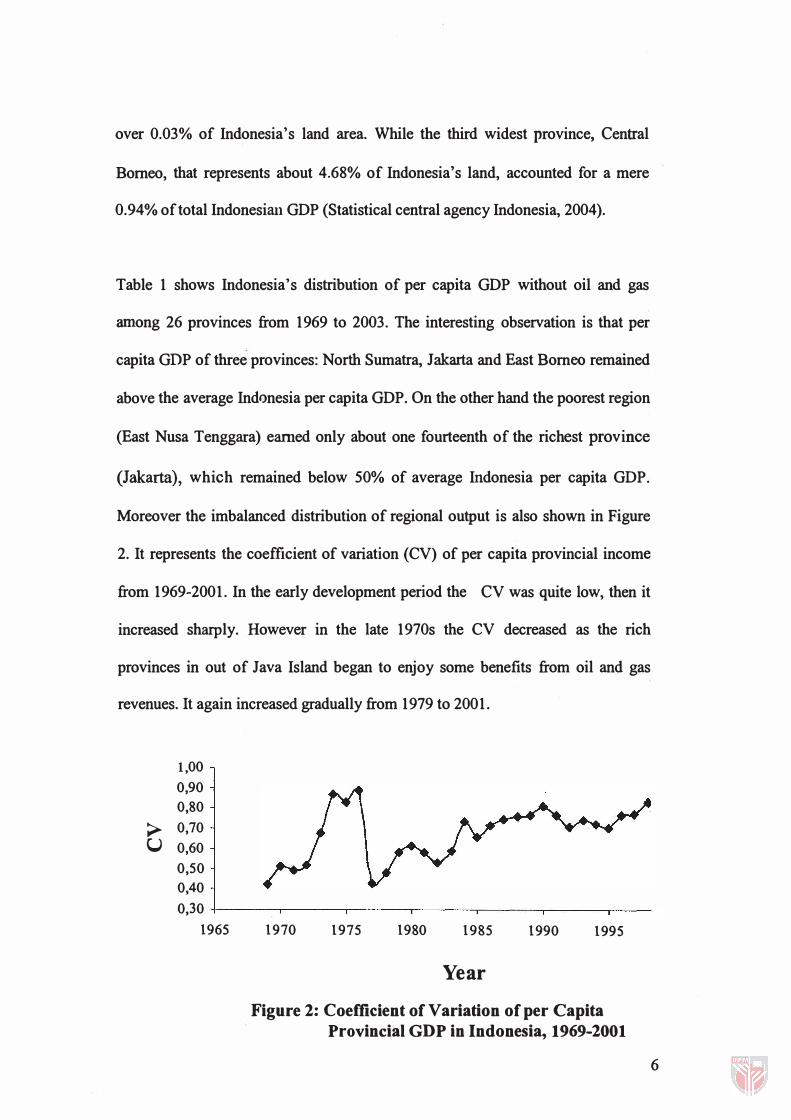
Moreover the imbalanced distribution of regional output is also shown in Figure
2. It represents the coefficient of variation (CV) of per capita provincial income
from 1969-2001. In the early development period the CV was quite low, then it
increased sharply. However in the late 1970s the CV decreased as the rich
provinces in out of Java Island began to enjoy some benefits from oil and gas
revenues. It again increased gradually from 1979 to 2001.
1,00 0,90 0,80
> 0,70 U 0,60
0,50 0,40 0,30
1965 1970 1975 1980 1985 1990 1995
Year Figure 2: Coefficient of Variation of per Capita
Provincial GDP in Indonesia, 1969-2001
6
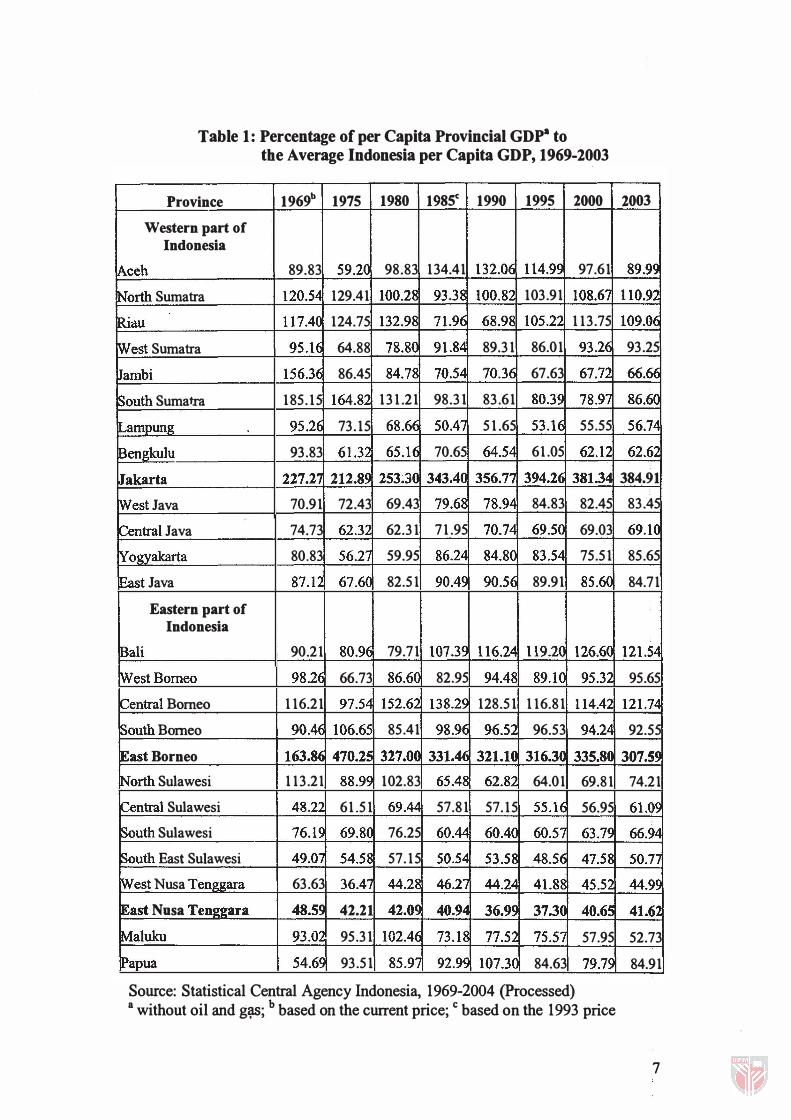
Table 1: Percentage of per Capita Provincial GDp· to the Average Indonesia per Capita GDP, 1969-2003
Province 1969b 1975 1980 1985c 1990 1995 2000 2003 Western part of
Indonesia
IAceh 89.83 59.20 98.83 134.41 132.0� 114.99 97.61 89.99
!North Sumatra 120.54 129.41 100.2� 93.3� 100.82 103.91 108.67 110.92
lRiau 117.4C 124.75 132.9� 71.9� 68.9� 105.22 113.75 109.0�
West Sumatra 95.H 64.88 78.8C 91.84 89.31 86.01 93.2<i 93.25
Jambi 156.3� 86.45 84.78 70.54 70.36 67.63 67.72 66.6�
South Sumatra 185.15 164.82 131.21 98.31 83.61 80.39 78.97 86.6C
�mpung 95.2� 73.15 68.6<i 50.4� 51.65 53.1<i 55.55 56.74
lBengkulu 93.83 61.32 65.1<i 70.65 64.54 61.05 62.12 62.62
�akarta 227.27 212.8� 253�3(] 343.4(] 356.77 394.26 381.34 384.91 !West Java 70.91 72.43 69.43 79.68 78.94 84.83 82.45 83.45
[central Java 74.73 62.32 62.31 71.95 70.74 69.50 69.03 69.10
IY ogyakarta 80.83 56.27 59.95 86.24 84.80 83.54 75.51 85.65
East Java 87.12 67.60 82.51 90.49 90.5� 89.91 85.60 84.71
Eastern part of Indonesia
�ali 90.21 80.9� 79.71 107.39 116.24 119.2C 126.6C 121.5,j
lWestBomeo 98.2� 66.73 86.6C 82.95 94.4� 89.1C 95.32 95.65
lCentral Borneo 116.21 97.5" 152.62 138.29 128.51 116.81 114.42 121.74
�outh Borneo 90.4� 106.6' 85.41 98.9� 96.52 96.53 94.24 92.55
lEast Borneo 163.8� 470.25 327.0� 331.4� 321.U 316.3� 335.8( 307.S� !North Sulawesi 113.21 88.99 102.83 65.4� 62.82 64.01 69.81 74.21
[central Sulawesi 48.22 61.51 69.4" 57.81 57.15 55.H 56.95 61.09
�outh Sulawesi 76.19 69.8C 76.25 60.44 60.40 60.5i 63.79 66.94
�outh East Sulawesi 49.01 54.5S 57.15 50.54 53.58 48.5� 47.58 50.Ti
lWest Nusa Tenggara 63.63 36.4i 44.28 46.r 44.24 41.8� 45.52 44.99
lEast Nusa Tenggara 48.S� 42.21 42.09 40.94 36.99 37.3(] 40.65 41.62 Maluku 93.02 95.31 102.46 73.H 77.52 75.57 57.95 52.73
lPapua 54.6� 93.51 85.97 92.9( 107.30 84.63 79.79 84.91
Source: Statistical Central Agency Indonesia, 1969-2004 (processed) a without oil and g�; b based on the current price; C based on the 1993 price
7
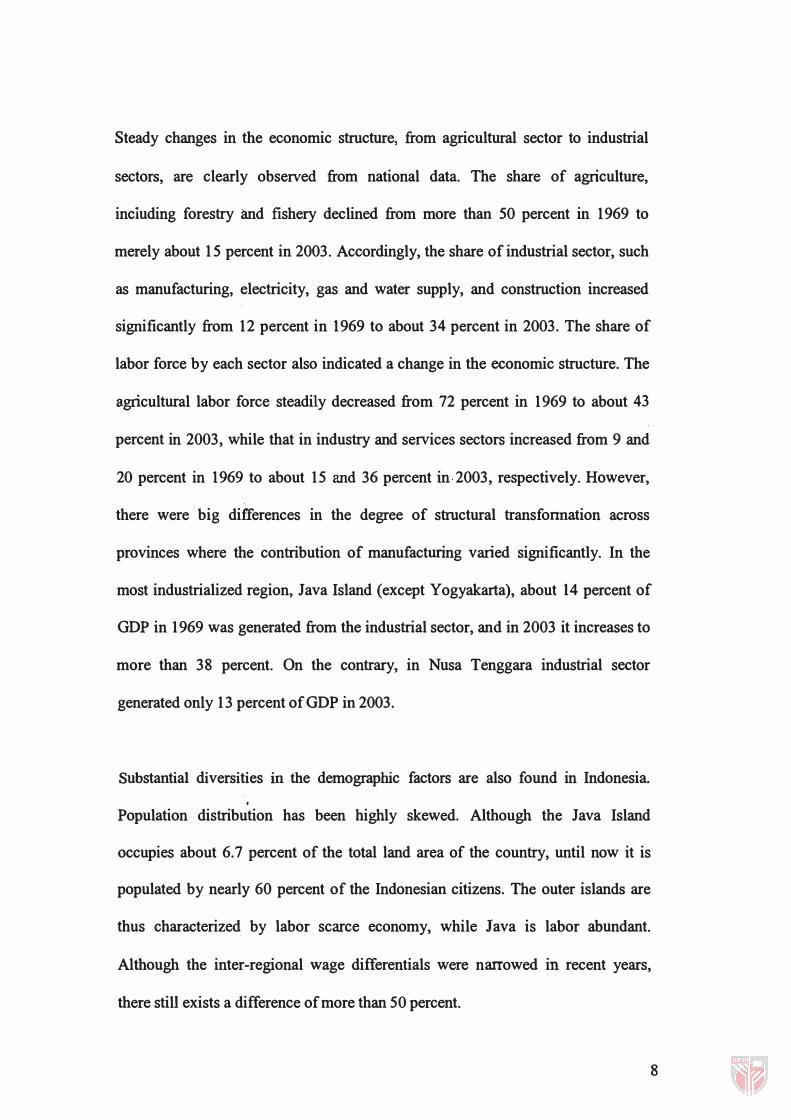
Steady changes in the economic structure, from agricultural sector to industrial
sectors, are clearly observed from national data. The share of agriculture,
inciuding forestry and fishery declined from more than 50 percent in 1969 to
merely about 15 percent in 2003. Accordingly, the share of industrial sector, such
as manufacturing, electricity, gas and water supply, and construction increased
significantly from 12 percent in 1969 to about 34 percent in 2003. The share of
labor force by each sector also indicated a change in the economic structure. The
agricultural labor force steadily decreased from 72 percent in 1969 to about 43
percent in 2003, while that in industry and services sectors increased from 9 and
20 percent in 1969 to about 15 and 36 percent in 2003, respectively. However,
there were big differences in the degree of structural transfonnation across
provinces where the contribution of manufacturing varied significantly. In the
most industrialized region, Java Island (except Yogyakarta), about 14 percent of
GDP in 1969 was generated from the industrial sector, and in 2003 it increases to
more than 38 percent. On the contrary, in Nusa Tenggara industrial sector
generated only 13 percent of GDP in 2003.
Substantial diversities in the demographic factors are also found in Indonesia . .
Population distribution has been highly skewed. Although the Java Island
occupies about 6.7 percent of the total land area of the country, until now it is
populated by nearly 60 percent of the Indonesian citizens. The outer islands are
thus characterized by labor scarce economy, while Java is labor abundant.
Although the inter-regional wage differentials were narrowed in recent years,
there still exists a difference of more than 50 percent.
8
Some tactical policies related to regional development, whether they were
intended or not, were implemented since the early 1970s. They were aimed to
promote a more balanced regional development. From the fiscal perspective,
expanded fiscal revenue during the oil boom in 1970s enabled the transfer of
massive resources to islands. that were heavily relied on suffering non-oil export
sectors. Massive resources were transferred through a government-based channel,
which contributed to developing regional infrastructure, such as roads, schools
and health facilities. They were represented in government expenditure from
budget allocation of central government into provinces. Some remarkable social
progresses were made in this period. Some tactical programs were intended also
to achieve more equitable regional development, such as Inpres (instruction of
President) program for under developed villages. It was a part of fiscal
decentralization policy that allows regional government to have greater autonomy
in reducing poverty in their respective areas.
By the mid-1980s, as the oil prices dropped, some policy reforms are taken to
improve efficiency and reduce dependency on oil revenues. Substantial reforms
were made in the areas of financial markets and banking, as well as agriculture,
education, and health services. Then in the late 1980s Indonesia entered a more
advanced phase of development. The economic policies were directed to improve
employment and income opportunities by opening up the economy and increasing
the means for all citizens to participate in, and benefit from economic growth.
These situations at the national level influenced the development of regional
economies. Furthermore some policies have been formulated in 1990s to reduce
9
regional disparities in Indonesia (Takeda and Nakata, 1998). However, they are
more in nonnative level than implementation such as:
1. develop infrastructure in less developed regions and stimulate private sector
investment to build the regional characteristic industries;
2. provide fiscal transfer to local governments in due consideration of disparities
and characteristics, and
3. enhance the administrative capabilities of regional government by
strengthening the human resource development.
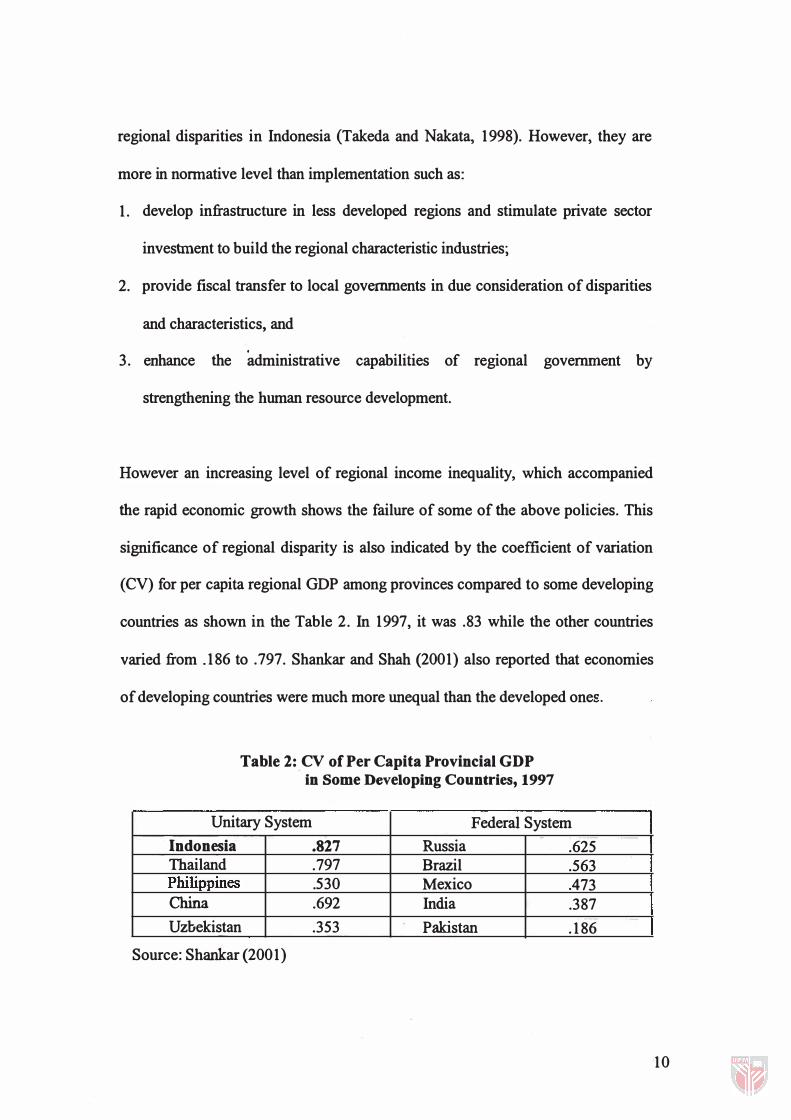
However an increasing level of regional income inequality, which accompanied
the rapid economic growth shows the failure of some of the above policies. This
significance of regional disparity is also indicated by the coefficient of variation
(CV) for per capita regional GDP among provinces compared to some developing
countries as shown in the Table 2. In 1997, it was .83 while the other countries
varied from .186 to .797. Shankar and Shah (2001) also reported that economies
of developing countries were much more unequal than the developed ones.
Table 2: CV of Per Capita Provincial GDP in Some Developing Countries, 1997
Unitary System Federal System Indonesia .827 Russia .625 Thailand .797 Brazil .563 Philippines .530 Mexico .473 China .692 India .387 Uzbekistan .353 Pakistan .186
Source: Shankar (2001)
10