Embed Size (px)
Citation preview

UNIVERSITI PUTRA MALAYSIA
GENETIC DIFFERENTIATION OF MALAYSIAN OAKS BY MICROSATELLITE MARKERS
PUNG CHAI CHIN
FSAS 2001 24

GENETIC DIFFERENTIATION OF MALAYSIAN OAKS BY MICROSATELLITE MARKERS
BY
PUNG CRAI CHIN
Thesis Submitted in Fulfilment of the Requirement for the Degree of Master Science in the Faculty of Science and Environmental Studies
Universiti Putra Malaysia
January 2001

Abstract of thesis presented to the Senate ofUniveristi Putra Malaysia in fulfilment of the requirement for the degree, Master of Science.
GENETIC DIFFERENTIATION OF MALAYSIAN OAKS BY MICRO SATELLITE MARKERS
PUNG CHAI CHIN January 2001
Chairman Professor Dr. Tan Soon Guan
Faculty Science and Environmental Studies
A combination of nuclear and chloroplast micro satellite DNA have been used to
investigate the levels and pattern of variability in Malaysian oaks. This study focussed
on Quercus sp., which is the largest and the most widely distributed genus in the family
Fagaceae. In the nuclear microsatellite study, four sets of microsatellite primers
developed for Quercus sp. (Dow et al., 1995; Steinke lIner et at., 1 997a; Isagi and
Suhandono, 1 997; Kampfer et a/., 1998) were tested. Based on the analysis, more than
35% of the 61 primers tested resulted in interpretable amplification products. Twenty
microsatellite primers were used to estimate the genetic diversity among distributions of
Quercus sp. These selected primers were also used in three other genera from the same
family namely, Lithocarpus, Castano psis and Triganoba/anus.
The results showed that these microsatellite loci are conserved across different
genera. F our primers, QpZAG9, QrZAG20, QrZAG3 1 and QrZAG 108 gave
interpretable peR products for all the samples studied from the four genera. None of the
micro satellite loci is monomorphic in all the species studied. The number of alleles per
microsatellite locus varied from 2 to 20. On the average, 11.85 alleles per locus were
ii

observed. The mean value of gene diversity ranged from 0.0141 at locus QM50-3M to
0.6494 at locus QpZAGl15 with a mean of 0.3162. The highest mean g�ne diversity
( &) for all loci was 0.4290, which was observed in Q. lineata whereas the lowest flo
was found in Castano psis sp. The genetic differentiation among the species was
estimated as Fst = 0.6705. Three dendrograms based on Nei's genetic relationship
(1978) clustered by the UPGMA method were constructed. The first dendrogram
containing four different genera showed that Lithocarpus and Castano pSis are clustered
in one group while Triganoba/anus is clustered away from Quercus, Lithocarpus and
Castanopsis. The second dendrogram showed that the main cluster is subdivided into
two major subclusters. The Peninsula species was in one group whereas the Sarawak:
species formed another subcluster except for Q. subsericea from Banjaran Lumut. On
the other hand, the third dendrogram which clustered individuals of all the species
studied showed that all individuals from the same species is clustered together in the
same group except for Q. gemelliflora. One unknown individual collected from the
Kelabit Highlands is clustered together with Q. sumatrana. The estimates of genetic
similarities based on microsatellite markers ranged from 0.0844 to 0.8590 among the
different species.
iii

Abstrak tesis yang dikemukakan kepada Senat Universiti Putra Malaysia sebagai memenuhi keperluan ijazah Master Sains.
PERBEZAAN GENETIK DALAM OAK MALAYSIA DIUJI DENGAN PENANDA MIKROSATELIT.
Pengerusi
Fakulti
PUNG CRAI CHIN January 2001
Professor Dr. Tan Soon Guan
Sains and Pengajian Alam Sekitar
Satu gabungan kajian mikrosatelit nukleus dan kloroplas DNA digunakan untuk
mengkaji paras dan corak variabiliti bagi oak Malaysia. Kajian ini memokus kepada
Quercus sp. di mana ia merupakan genera yang terbesar dan terluas dalam famili
Fagaceae. Dalam kajian mikrosatelit nukleus, sebanyak empat set primer yang direka
untuk Quercus sp. (Dow et aI., 1995; ; Isagi and Suhandono, 1997; Steinke lIner et aI.,
1997a dan Kampfer et aZ., 1998) diuji. Daripada analisis, lebih daripada 35% dari 61
primer yang diuji memberi produk amplifikasi yang boleh diinterpretasikan. Dua puluh .
primer digunakan bagi menjangka diversiti genetik untuk Quercus sp. Primer yang
dipilih ini juga diuji dalam tiga genera dari famili yang sama iaitu Lithocarpus,
Castanopsis dan Triganobalanus.
Keputusan menunjukkan lokus mikrosatelit adalah terpelihara antara genera
yang berlainan. Empat primer iaitu QpZAG9, QrZAG20, QrZAG31 dan QrZAG 108
memberi produk peR yang boleh diintepretasikan bagi semua sampel yang diuji berasal
dari empat genera. Tiada lokus mikrosatelit yang monomorfik dalam semua sarnpel
yang diuji. Nombor aIel per penanda mikrosatelit adalah berlainan dan. 2 hingga 20.
iv

Secara puratanya, 11.85 aIel diperhatikan. Purata diversiti gen pula berjulat dari 0.0141
pada lokus QM50-3M kepada 0.6494 pada lokus QpZAGl/5 dengan purata 0.3162.
Purata diversiti gen yang tertinggi (Ho) dalam semua lokus ialah 0.4290, iaitu
diperhatikan dalam Q. Imeata manakala 110 yang terendah diperhatikan pada
Castanopsls sp. Perbezaan genetik antara spesis dijangka dengan FYI = 0.6705. Tiga
dendrogram berdasarkan perkaitan genetik Nei's (1978) dikelompok berdasar cara
UPGMA dikendalikan. Dendrogram yang pertama yang berdasarkan empat genera yang
berlainan menunjukkan bahawa Llthocarpus dan Castanopsls dikelompokkan dalam
satu kumpulan manakala Triganobalanus dikelompokkan jauh daripada Quercus,
Llthocarpus dan Castano pSIS. Dendrogram kedua menunjukkan kelompok utama di
bahagikan kepada dua kelompok utama. Spes is Semenanjung dalarn satu kumpulan
rnanakala spesis Sarawak dalam satu kumpulan yang lain kecuali Q. subsencea dari
Banjaran Lumut. Dalarn pada itu, dendrogram yang ketiga yang mengelompokkan
sernua individu sam pel dari sernua spesis rnenunjukkan semua individu yang berasal
dari spesis yang sarna berada dalarn satu kumpulan yang sarna kecuali Q. gemelliflora.
Satu individu yang tidak dikenali yang telah dik"llIl1pul dari Kelabit Highland adalah
dikelornpokkan bersarna Q. sumatrana. Similariti genetik yang dijangka berdasarkan
penanda mikrosatelit pada puratanya beIjulat dari 0.0844 ke 0.8590 antara spesis yang
berlainan.
v
AKNO\VLEDGEMENTS
First and foremost, I would like to express my sincere appreciation and gratitude
to my main supervisor Prof Dr. Tan Soon Guan for his guidance, helpful comments,
patience and suggestions. Without his help and supervision, this project would not have
been possible.
Credit is also given to my supervisor Dr. Rusea Go. I learned many things from
her especially in sample collections on several field trips and species identifications of
my samples in this study. Without these, the project would also not have been possible.
I am also grateful to my supervisor, Associate Professor Datin Dr. Khatijah
Mohd. Yusoff for giving me invaluable advice, in editing my thesis and also providing
the facilities for the gel documentation and analysis in the virology laboratory.
A very special thank also goes to Prof. Dr. Soepadmo from FRIM, Kepong who
helped me to identify my 'Quercus' and also provided valuable comments for my
project. Credit also goes to Dr. Lefort from the University of Crete who provided
valuable comments in DNA isolation via emailing and Dr. Isagi who provided the
primer sequences of the Japanese Quercus.
VI
Besides, I would like to express my heartfelt thanks to Soon Choy and Chee
Chin for their help in collecting the samples, organising the collected samples and also
assisting me in laboratory work throughout the duration of this project.
I thank Mr Badrol from the Hebarium, Universiti Kebangsaan Malaysia for his
technical assistance during my fieldwork. I also thank Julaihi, Jegung, Ah Tak, Michael
and Lee from the Forestry Department of Sarawak for assisting me during the sample
collection in Banjaran Lumut, Sarawak.
Special thanks also to Jacky Ho from UKM for sharing his valuable knowledge
and providing me with valuable information on plant genetic research. Deepest
gratitude also goes to my lab-mate Vijay who helped me a lot in data analysis. Permit
me also to ·acknowledge the support, the helping, sharing and encouragement from all
my lab-mates: Sahar, Boon Peng, Latif, Pau San, Bee Eng, Wan Ching, Lee Chien and
Poh Kam. Our time of having lunch together is unforgettable.
Finally, I'm grateful beyond measure to my family and Siong for theirs
unfailing love and support, I would also liked to thank everyone who had contributed
throughout the duration of this study.
PUNG CHAI CHIN
2000/ Biology Department, Univeristi Putra Malaysia.
Vll

I certify that an Examination Committee met on 31st January 2001 to conduct the final examination of Pung Chai Chin on her Master of Science thesis entitled " Genetic Differentiation of Malaysian Oaks by Microsatellite Markers" in accordance with Universiti Pertanian Malaysia (Higher Degree) Act 1980 and Universiti Pertanian Malaysia (Higher Degree) Regulations 1981. The Committee recommends that candidate be awarded the relevant degree. Members of Examination Committee are as follows:
Umi Kalsom, Assoc. Prof Lecturer, Department of Biology Faculty of Science and Environmental Studies Universiti Putra Malaysia (Chairman)
Tan Soon Guan, Prof, J.S.M. Lecturer, Department of Biology Faculty of Science and Environmental Studies Universiti Putra Malaysia (Member)
Rusea Go, Ph.D. Lecturer, Department of Biology Faculty of Science and Environmental Studies Universiti Putra Malaysia (Member)
Datin Khatijah Mohd. Yusoff, Assoc. Prof Head, Department of Biochemistry and Microbiology Faculty of Science and Environmental Studies Universiti Putra Malaysia (Member)
AINI IDERIS, Ph.D. Professor Dean of Graduate School, Universiti Putra Malaysia
Date: 2 <1 MAY 2001
vllt

This thesis submitted to the Senate of Universiti Putra Malaysia has been accepted fulfilment of the requirement for the degree of Master Science.
AINI IDERlS, Ph.D. Professor Dean of Graduate School, Universiti Putra Malaysia
Date: 1 4 JUN 2�fl1
ix

DE CLARA nON
I hereby declare that the thesis is based on my originai work except for quotations and citations which, have been duly acknowledged. I declare that it has not been previously or concurrently submitted for any other degree at UPM or other institutions.
(Pung Chai Chin)
Date: J. '3 / �! :f-rro /
x

TABLE OF CONTENTS
ABSTRACT ABSTAK ACKNOWLEDGEMENTS APPRO V AL SHEETS DECLARATION FORM LIST OF TABLES LIST OF FIGURES LIST OF PLATES LIST OF ABBREVIA TrONS
CHAPTER
INTRODUCTION
2 LITERATURE REVIEW 2.1 Quercus Linn. 2.2 Lithocarpus Blume. 2.3 Castanopsis (D. Don) Spach. 2.4 Triganobalanus Fonnan. 2.5 Genetic Studies on Oaks 2.6 Microsatellite DNA 2.7 Isolation of Micro satellite loci 2.8 Applications of Microsatellites 2.9 Chloroplast Microsatellite DNA 2.10 Hardy-Weinberg Equilibrium 2.11 Genetic Diversity 2.12 Polymerase Chain Reaction (PCR)
3 MATERIALS AND METHODS 3.1 Sample Collection 3.2 DNA Isolation 3.3 Primer Pairs 3.4 PCR Amplification 3.5 Characterisation of Micro satellite Loci 3.6 Electrophoresis ofPCR Products 3.7 Voltage Applied 3.8 Data Anal ysis
3.8.1 Allele Frequencies 3.8.2 Testing for Hardy-Weinberg Equilibrium 3.8.3 Degree of Heterozygosity, H 3.8.4 Gene Diversity Index
Xl
PAGE
11 IV VI
Vlll X
XIV xv
XVlll xx
1.1
2.1 2.1
2.13 2.17 2.21 2.24 2.30 2.34 2.36 2.39 2.40 2.41 2.42
3.1 3.1 3.1 3.4 3.4 3.5 3.5 3.6 3.6 3.7 3.7 3.8 3.9

4
5
3.8.5 Genetic Distances 3.8.5.1 F-statistics and Gene Flow 3.8.5.2 Nei's Genetic Distances (1978)
3.8.6 Test of Robustness
RESULTS 4.1 Sample Collection 4.2 Species Identification 4.3 DNA Isolation 4.4 Primer Screening and PCR optimisation
4.4.1 Primer Selection 4.4.2 Primer Banding Pattern
4.5 Allele Frequency 4.5.1 Single Species Description 4.5.2 Multiple Species Description
4.6 Hardy-Weinberg Equilibrium (HWE) 4.7 Degree of Heterozygosity, H
4.7.1 Single Species Description 4.7.2 Multiple Species Description
4.8 F-statistics, F 4.9 Gene Flow, Nm 4.10 Cluster Analysis
4.10.1 Genetic Distance and Dendrogram of Genera Level Clustering.
4.10.2 Genetic Distance and Dendrogram of Species Level Clustering.
4.10.3 Individual Clustering 4.11 Test of Robustness 4.12 Chloroplast Microsatellite Analysis
4.12.1 Primer Screening and PCR optimization 4.12.2 Gene Diversity Index 4.12.3 Genetic Differentiation
DISCUSSION 5.1 DNA Isolation 5.2 PCR Optimization 5.3 Trouble Shooting
5.3. I peR Amplification 5.3.2 Banding Scoring
5.4 Testing for Hardy-Weinberg Equilibrium 5.5 Heterozygosity, H
xii
PAGE
3.10 3.10 3.11 3.12
4.1 4.1 4.5
4.16 4.17 4.17 4.20 4.25 4.25 4.28 4.40 4.42 4.42 4.43 4.46 4.47 4.52 4.52
4.54
4.55 4.60 4.62 4.62 4.69 4.69
5.1 5.4 5.6
5.10 5.10 5.13 5.15 5.16

5.6 F-statistics, F and Gene Flow, Nm
6
5.7 Genetic Distances 5.8 Test of Robustness 5.9 Chloroplast Microsatellite
CONCLUSION
REFERENCES APPENDIX A APPENDIX B APPENDIXC BIODATA OF AUTHOR
xiii
PAGE
5.17 5.18 5.20 5.21
6.1
R. 1 A.I B.1 C.1 D.l
TABLE
2.1
3.1
4.1
4.2
4.3
4.4
4.5
4.6
4.7
4.8
4.9
4.10
4.11
4.12
5.1
5.2
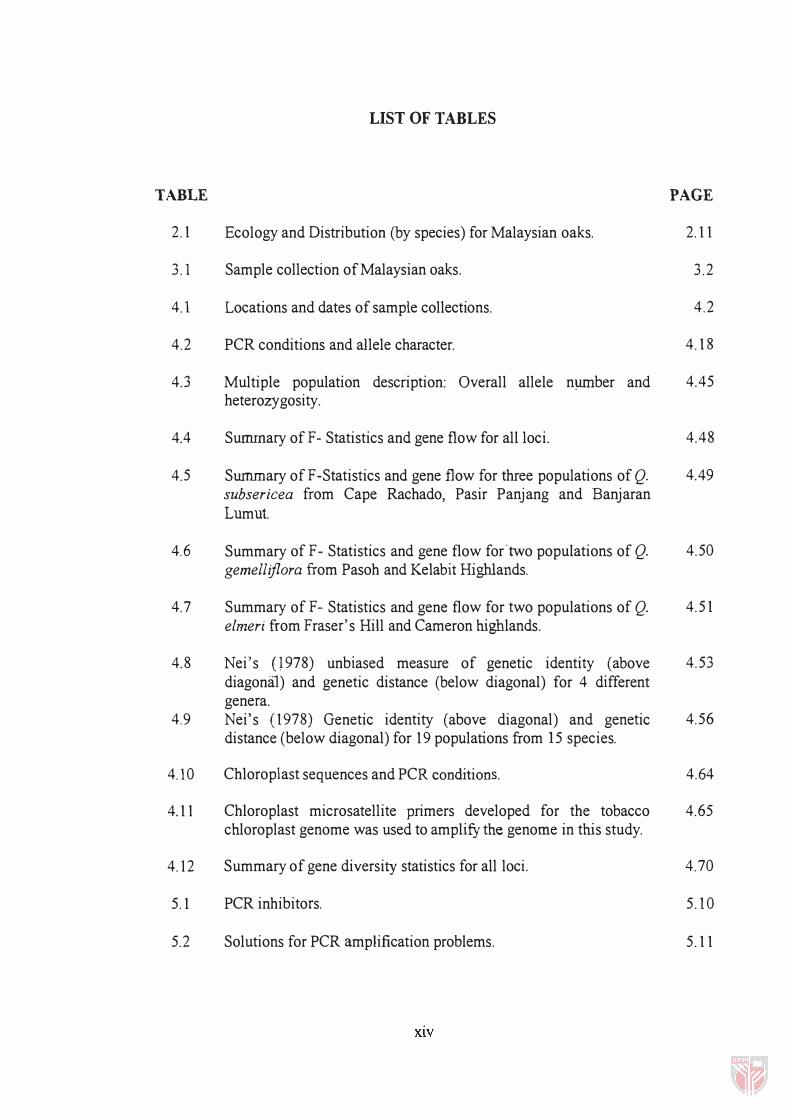
LIST OF TABLES
Ecology and Distribution (by species) for Malaysian oaks.
Sample collection of Malaysian oaks.
Locations and dates of sample collections.
PCR conditions and allele character.
Multiple population description: Overall allele n�ber and heterozygosity.
Summary ofF- Statistics and gene flow for all loci.
Summary of F -Statistics and gene flow for three populations of Q. subsericea from Cape Rachado, Pasir Panjang and Banjaran Lumut.
Summary of F- Statistics and gene flow for'two populations of Q. gemellifiora from Pasoh and Kelabit Highlands.
Summary of F- Statistics and gene flow for two populations of Q. elmeri from Fraser's Hill and Cameron highlands.
Nei's (978) unbiased measure of genetic identity (above diagonal) and genetic distance (below diagonal) for 4 different genera. Nei's (1978) Genetic identity (above diagonal) and genetic distance (below diagonal) for 19 popUlations from 15 species.
Chloroplast sequences and PCR conditions.
Chloroplast microsatellite primers developed for the tobacco chloroplast genome was used to amplify the genome in this study.
Summary of gene diversity statistics for all loci.
PCR inhibitors.
Solutions for PCR amplification problems.
XlV
PAGE
2.11
3.2
4.2
4.18
4.45
4.48
4.49
4.50
4.51
4.53
4.56
4.64
4.65
4.70
5.10
5.11

FIGURE
2.1
2.2
2.3
2.4
2.5
2.6
3.1
4.1
4.2a
4.2b
4.2c
4.2d
4.2e
4.2f
4.2g
4.2h
4.2i
LIST OF FIGURES
Distribution of Quercus throughout the world.
Distribution of Lithocarpus throughout the world.
Distribution of Castano pSis sp. throughout the world.
Microsatellite DNA detected by amplification using PCR.
Strand-slippage Replication.
Schematic of the steps required to clone microsatellite loci in newly studied species
DNeasy Plant Mini Procedure (DNeasy plant handbook, 1999).
Location of sample collections in this study which included samples from Peninsula Malaysia and Sarawak.
Leaf morpbology of 3 species of Quercus.
Leaf morphology of the Castanopsis sp. and T. verticillata.
Q. elmeri from the population of Fraser's Hill and Q. chrysotrica from Cameron Highlands.
Q. elmeri from the popUlation of Cameron Highlands.
Q. gemelliflora from population of Kelabit Highlands, Sarawak and Q. I ineata from Cameron Highlands.
Three different species namely Q. kerangasensis, Q. gaharuensis and Q. valdinervosa found in Kelabit Highlands.
Two different species of Lithocarpus from Cameron Highlands.
Three species of Quercus.
Three populations of Q. subsericea from three different place namely Cape Rachado (Port Dickson), Pasir Panjang (Port Dickson) and Banjaran Lumut (Sarawak).
xv
PAGE
2.4
2.1 4
2.1 8
2.31
2.33
2.35
3.3
4.3
4.7
4.8
4.9
4.10
4 .11
4.12
4.13
4.14
4.15

FIGURE PAGE
4.3 Observed and effective numbers of alleles for each locus for all 4.29 samples.
4.4 Overall allelic frequencies at locus QM58TGT. 4.30
4.5 Overall allelic frequencies at locus QM69-2Ml. 4.30
4.6 Overall allelic frequencies at locus QM67-3Ml. 4.31
4.7 Overall allelic frequencies at locus QM50-3M 4.31
4.8 Overall allelic frequencies at locus MSQ 13. 4.32
4.9 Overall allelic frequencies at locus QpZAGI/5. 4.32
4.10 Overall allelic frequencies at locus QpZAG 16. 4. 33
4.11 Overall allelic frequencies at locus QpZAG9. 4.3 3
4.12 Overall allelic frequencies at locus QpZAGI5. 4.34
4.13 Overall allelic frequencies at locus QpZAG36. 4.34
4.14 Overall allelic frequencies at locus QpZAG 110. 4.3 5
4.15 Overall allelic frequencies at locus QrZAGII. 4.3 5
4.16 Overall allelic frequencies at locus QrZAG 15. 4.36
4.17 Overall allelic frequencies at locus QrZAG20. 4.36
4.18 Overall allelic frequencies at locus QrZAG25. 4.37
4 .19 Overall allelic frequencies at locus QrZAG30. 4.37
4.20 Overall allelic frequencies at locus QrZAG31. 4.3 8
4.21 Overall allelic frequencies at locus QrZAG65. 4 . 3 8
4.22 Overall allelic frequencies at locus QrZAGJ08. 4.39
4.23 Overall allelic frequencies at locus QrZAG 112. 4.39
XVI

FIGURE
4.24
4.25
4.26
4.27
4.28
Genetic relationships of four different genera namely Quercus, Lithocarpus, Castanopsis and Triganobalanus based on Nei's (1978) genetic distance clustered by UPGMA.
Genetic relationships for 12 species of Quercus, a single group of Lithocarpus sp., Castanopsis sp. and Triganobalanus vertic illata based on Nei's (1978) genetic distance clustered by UPGMA.
Individual clustering of all (152) individuals studied based on Nei's (1978) genetic distance clustered by UPGMA using PopGene.
Majority-rule consensus tree produced after 1000 bootstrapping.
Diversity Indices at seven loci for 4 species namely Q. lineata, Q. subsericea (pasoh), Lithocarpus sp. and Castanopsis sp.
xvii
PAGE
4.53
4.58
4.59
4.61
4.71

PLATE
2.1
2.2
2.3
2.4
4.1a
4.lb
4.1c
4.1d
4.2
4.3
4.4
4.5
4.6
4.7
4.8
4.9
LIST OF PLATES
Acorns of Quercus I ineata.
Acorn of Lithocarpus sp. found in Cameron Highlands.
Castanopsis sp found in Cameron Highlands.
Nuts of Castano psis sp. are edible.
A wild Quercus lineata found beside the road to Blue Valley, Cameron Highlands.
Lithocarpus sp. found beside the road, Cameron highlands.
A single Querucs elmeri found on Fraser's Hill.
Q. gemelliflora from Pasoh 50 ha Plot forest reserve.
PCR products of QrZAG30 showing monomorphism m Q. argentata with a molecular weight of 162bp.
PCR products of locus QrZAG30 showing triple bands m Q. subsericea from Port Dickson population.
PCR products of locus QpZAG9 for three species namely Lithocarpus sp. (1), Castanopsis sp. (2-9) and T. vertic illata (10-14).
PCR products of locus QrZAG20 in Q. argentata.
peR products of locus QrZAG31 in three species namely Q. elmeri from Cameron Highlands population (1-3), Q. subsericea from Banjaran Lumut population (4-15) and Lithocarpus sp. (16).
PCR products of Q. elmeri from Fraser's Hill population.
Monomorphic locus, QrZAG65, found in Q. lineata with a molecular weight of 218bp.
PCR products of locus QrZAG1l2 of Q. elmeri from the Fraser's Hill population.
xviii
PAGE
2.5
2.15
2.20
2.20
4.4
4.4
4.4
4.4
4.2 1
4.21
4.22
4.22
4.23
4.23
4.24
4.28

PLATE
4.10
4.11
4.12
4.13
4.14
4.15
5.1
5.2
peR products amplified by ccmp3, only one sample was a variant.
PCR products of ccmp5 in Lllhocarpus sp.
PCR products of ccmp4 in Q. subsencea from Banjaran Lumut (1) and Lithocarpus sp. (2-14)
peR products of ccmp6 in Llthocarpus sp.
peR products of ccrnp2.
peR products of ccmp4.
Non-specific bands resulting from substrate excess conditions.
Weak peR products
XIX
PAGE
4.66
4.66
4.67
4.67
4.68
4.68
5.9
5.12

lX
A
bp
C
cpSSR
D
DNA
dNTP
EDTA
G
nSSR
PCR
PHYLIP
RFLP
Sp
SSR
T
TBE
uv
VNTR
One time
Adenosine
Base pair
Cytosine
LIST OF ABBREVIATIONS
Chloroplast Simple Sequence Repeat
Genetic Distances
Deoxyribonucleic acid
Deoxynucleotide
Etbylenediamjnetracetic acid
Guanine
Nuclear Simple Sequence Repeat
Polymerase Chain Reaction
Phylogeny Inference Package
Restriction Fragment Length Polymorphism
Species
Simple Sequence Repeat
Thymine
T ris borate EDT A
Ultra violet
Variable Number of Tandem Repeat
xx

CHAPTER!
INTRODUCTION
The occurrence of oak tree in Malaysia is often surprising to most people. It
is widely distributed throughout Peninsular Malaysia, Sabah and Sarawak. In tenus
of classification and taxonomy, Malaysian oaks were well documented by
Soepadmo ( 1966, 1968 and 1 972), Keng ( 1 969), Corner ( 1972), Ridley ( 1 967) and
Soepadmo et a!. (2000) for Sabah and Sarawak Quercus.
Oak is a common name for trees of the genus Quercus in the European and
Asian region. Oak also refers to the genus Lithocarpus in the Malesia region. It had
been reported that locally Quercus sp. and Lithocarpus sp. were known as
Castano psis, another genus from the Fagaceae family. On the other hand, some
Quercus sp. was earlier identified as Lithocarpus sp. (Corner, 1972). In fact,
according to Soepadmo, identification based on morphological evidences suggest
they are actually two different genera.
Oak wood is less famous for timber products and is only used in medium to
heavy construction. However, the beautiful wood ray of the species is well known
as a source of timber for the furniture and flooring industries. Some of the species
have been tried for use in the cultivation of mushroom in Borneo. It has proven
useful for controlling erosion when planted on steep slopes in mountainous regions
(Sunarno et a!., 1995).
1 . 1
Studies of oaks in Malaysia were limited to taxonomy. Earlier
investigations of relationships among Malaysian oak accessions were based on
morphological characters. Quercus sp. and Lithocarpus sp. which occurred
throughout Malaysia are normally distinguished using leaf and acorn morphology
characters either for species or genus level identification, but there is no truly
diagnostic character that can assign an individual tree or population to one or the
other species with certainty.
Furthermore, morphological evidence should be avoided since they may not
be reliable measure of genetic difference because of the influence of the
environment on gene expression. However, the analysis of plant DNA allows the
direct assessment of variation in the genotype. Direct diagnostic markers allow the
immediate detection of alterations without uncovering the effects of the alteration.
At present, development of molecular markers provides additional
information on plants. DNA data also provide superior information, and with the
advent of the peR method, it may eventually become the predominant class of
data. Recently, microsatellite DNA has been proven to be very useful for the
purpose of studying genetic diversity in forest tree species (Lefort et. al. 1999a,
Ujino et. al. 1998, Dow and Ashley 1998). Microsatellites are stretches of DNA
consisting of di-, tri-, or tetra-nucleotide repeats such as (AT)n or (GT)n that
frequently extend up to 100 times. Polymorphisms in micro satellites result from
differences in the number of these repeat units. They are highly variable and co
dominantly inherited and can be used in genetic diversity, ecological and
evolutionary studies.
1.2

Microsatellite primers are usually confined to a single taxon from which the
primers were developed. However, some examples have been described in which
microsatellite loci are conserved in other closely related species (Ujino et aI., 1998,
Echt et a!., 1999 & Lefort et aI., 1999), which have allowed the analysis of genetic
diversity to be carried out in these related species. Steinkellner et al. (1997a) have
described the conservation of micro satellite loci between Quercus species. Their
results showed that rnicrosatellites isolated from Quercus petraea are conserved in
other Quercus species and even in other species within Fagaceae.
With the establishment of these nuclear microsatellite primers (Steinkellner
et a!., 1997a; Isagi and Suhandono, 1997; Kampfer et aI., 1998 and Dow et aI.,
1995) for Quercus sp., this study was focused on diversity and genetic
differentiation within the Quercus sp. that occurred throughout Malaysia. The
selected primers were also tested in other three genera namely Lithocarpus sp.,
Castano psis sp. and Triganobalanus sp. which are from the same family, Fagaceae.
Microsatellites are not limited to the nuclear genome. They are also found
in the chloroplast genome. The developers of chloroplast microsatellite (cpSSR)
primers in dicotyledonous angiosperms (Wei sing and Gardner, 1999) suggested
that these universal primers may serve as general tools to study chloroplast
variation in angiosperms. Thus, this study also tested the capability of cpSSR
primers for amplifying the Malaysian oak: genome. The extend of cross-species
amplification appears to be correlated with taxonomic distance. Therefore,
micro satellites are able be used for phylogenetic studies through the construction of
informative dendrograms based on the alleleic frequencies of microsatellite loci.
1.3
The objectives of this study were:
1. To develop microsatellite markers that could distinguish diagnostically between
species Malaysian oaks.
2. To develop methodologies for typing microsatellites as genetic markers In
Malaysian oaks.
3. To examine whether primer pairs designed to amplify microsatellite loci in
other oak species could be used to amplify marker loci in Malaysian oaks.
4. To examine whether primer pairs designed to amplify chloroplast microsatellite
loci in angiosperms could be used to amplify marker loci in Malaysian oaks.
5. To determine genetic relationships among Quercus sp. , Lithocarpus sp.,
Castano psis sp. and Triganoba/anus by constructing a dendrogram.
6. To clarify the exact identity of the taxa of Malaysian oaks by determining their
genetic distances and through constructing a dendrogram.
7. To investigate the population structure of each species by estimating the genetic
diversity at the microsatellite loci.
8. To examine whether microsatellite markers are suitable for taxonomic studies
by determining the relationships between the species studied.
1.4