Embed Size (px)
Citation preview
UNIVERSITI PUTRA MALAYSIA
FACTORS AFFECTING GLUTEN PRODUCTION AND ITS RHEOLOGICAL CHARACTERIZATIONS
DAYANG NORULFAIRUZ BINTI ABANG ZAIDEL
FK 2007 61
FACTORS AFFECTING GLUTEN PRODUCTION AND
ITS RHEOLOGICAL CHARACTERIZATIONS
By
DAYANG NORULFAIRUZ BINTI ABANG ZAIDEL
MASTER OF SCIENCE
UNIVERSITI PUTRA MALAYSIA
2007
FACTORS AFFECTING GLUTEN PRODUCTION AND
ITS RHEOLOGICAL CHARACTERIZATIONS
By
DAYANG NORULFAIRUZ BINTI ABANG ZAIDEL
Thesis Submitted to the School of Graduate Studies, Universiti Putra Malaysia,
in Fulfilment of the Requirements for the degree of Master of Science
December 2007

ii
TTTTo o o o my mothermy mothermy mothermy mother and and and and father father father father…………
Thank you fThank you fThank you fThank you for or or or your loveyour loveyour loveyour love and support. and support. and support. and support.
iii
Abstract of thesis presented to the Senate of Universiti Putra Malaysia in fulfilment
of the requirement for the degree of Master of Science
FACTORS AFFECTING GLUTEN PRODUCTION AND
ITS RHEOLOGICAL CHARACTERIZATIONS
By
DAYANG NORULFAIRUZ BINTI ABANG ZAIDEL
December 2007
Chairman : Chin Nyuk Ling, PhD
Faculty : Engineering
In this thesis, focus was given upon three factors affecting gluten production and
development during dough mixing namely mixing time, salt levels and water levels.
Gluten production was examined in terms of quantity and quality of gluten.
Quantity of gluten was measured in terms of wet and dry gluten content. Wet gluten
content was determined by weighing the gluten obtained from the dough washed
under running tap water. The wet gluten was dried using air oven drying method to
obtain dry gluten content. The quality of gluten was determined from the analysis of
volume expansion, extensibility and rheological characterization. The volume
expansion analysis was performed by frying the wet gluten in hot oil at 170oC in
deep fryer for 15 minutes. The volume of fried gluten was measured using mustard
seed displacement method and the difference between the volume of fried gluten and
the volume of wet gluten is measured as volume expansion of gluten.
iv
The main problem encountered in performing gluten and dough extensibility test is
to hold the sample so that it does not break at the jaws that hold the sample. Thus it
is one of the objectives in this study to build a simple set-up of tensile test to
determine gluten extensibility, which is one of the most common measurements
employed in determining the quality of gluten. A simple set-up of tensile test which
is attached to Instron 5566 has been build to determine gluten extensibility. Gluten
strip of about 10 mm x 10 mm x 70 mm was clamped at two ends using plastic clips
and extended at the centre by hook at speed of 300 mm min-1
. Extensibility
parameters such as original gluten length, gluten length at fracture, measured force,
actual force acting on the gluten strips, strain and stress were obtained using the
formulas derived from the results of tensile test. The tensile test set-up was
successful in terms of providing the gluten extensibility measurements and also the
gluten did not fracture at the clamping area. Rheological characteristics of gluten, K
and n, were obtained by fitting stress-strain curve following an exponential equation,
ε
σn
Ke= . Two types of flour, strong and weak, were used as a comparison.
Correlation between two analyses measurements of the gluten quantity and quality
are determined at the end of this thesis.
An adequate polynomial equation model which fits the data was produced from
Design Expert V.6.0.4. P-value, R2 and lack-of-fit value were determined to verify
the fitness of the polynomial model equation to the actual data and thus can be used
as a good prediction of the data. The results from Design Expert were then
transferred to Microsoft Excel file where the graph of the response was plotted
against the three factors studied.
v
Results suggested that from the three factors studied, salt gave the most significant
effect (0.0001 < P < 0.02) on the gluten quantity and quality. As salt level increases,
it decreases the wet and dry gluten content. The volume expansion of gluten and the
extensibility seem to decrease with increasing salt level. This indicates that gluten
network strength reduces and it does not mix into elastic dough as salt level
increases. The next significant factor was water level (0.0001 < P < 0.67). Mixing
time was the least significant factor among the three (0.0001 < P < 0.95). For all
factors studied, the results for strong flour were higher than the weak flour in the
quantity, volume expansion and also extensibility. This demonstrates that the
quality of gluten is affected by the protein content of the flour. All correlations
between two analyses of quantity and quality measurements show positive
coefficient of correlation (R). Strong correlation between (i) gluten quantity and
volume expansion (R > 0.75), (ii) gluten quantity and extensibility (R > 0.80) and
(iii) volume expansion and extensibility of gluten (R > 0.60) were obtained for
strong flour compared to weak flour (R > 0.45; R > 0.50; R > 0.30, respectively).
These results indicate that the quality of gluten is influenced by the protein content
of the flour and the extensibility and volume expansion of gluten is positively
correlated. These correlations could be used in the food industry to improve the
gluten quantity and quality in the future.
vi
Abstrak tesis yang dikemukakan kepada Senat Universiti Putra Malaysia sebagai
memenuhi keperluan untuk ijazah Master Sains
FAKTOR – FAKTOR MEMPENGARUHI PENGHASILAN GLUTEN
DAN SIFAT – SIFAT REOLOGINYA
Oleh
DAYANG NORULFAIRUZ BINTI ABANG ZAIDEL
Disember 2007
Pengerusi : Chin Nyuk Ling, PhD
Fakulti : Kejuruteraan
Dalam tesis ini, tumpuan diberikan kepada tiga faktor yang mempengaruhi
penghasilan dan perkembangan gluten semasa pengadunan doh iaitu masa
pengadunan, kandungan garam dan kandungan air. Penghasilan gluten ditentukan
dari segi kuantiti dan kualiti gluten. Kuantiti gluten diukur dari segi kandungan
basah dan kering gluten. Kandungan basah gluten diperolehi daripada doh yang
dibasuh di bawah air paip yang mengalir. Gluten basah dikeringkan menggunakan
kaedah pengeringan angin-ketuhar untuk memperoleh kandungan kering gluten.
Kualiti gluten dinilai menerusi analisis pengembangan isipadu, kekenyalan dan sifat
reologi. Pengembangan isipadu gluten dijalankan dengan menggoreng gluten di
dalam minyak panas pada suhu 170oC menggunakan periuk penggoreng selama 15
minit. Isipadu gluten yang digoreng ditentukan dengan menggunakan kaedah
vii
sesaran biji sawi dan perbezaan di antara isipadu gluten yang digoreng dan gluten
basah diambil sebagai pengembangan isipadu gluten.
Masalah utama yang dihadapi semasa menjalankan ujian kekenyalan doh dan gluten
ialah bagi mengepit sampel supaya ia tidak putus pada kawasan pengepit. Oleh itu,
salah satu daripada objektif tesis ini adalah untuk membina sebuah alat penguji tensil
yang ringkas untuk menguji kekenyalan gluten, yang merupakan satu cara untuk
menentukan kualiti gluten. Sebuah alat penguji tensil yang ringkas untuk
dipasangkan kepada Instron 5566 telah dibina untuk menentukan kekenyalan gluten.
Kepingan gluten yang berukuran 10 mm x 10 mm x 70 mm dikepit pada hujung
kedua-dua belah menggunakan klip plastik dan ditarik di tengah-tengah dengan
menggunakan cangkuk pada kelajuan 300 mm min-1
. Ukuran kekenyalan seperti
panjang asal gluten, panjang gluten semasa putus, daya ukuran, daya sebenar
bertindak pada gluten, tegangan dan regangan dikira dengan menggunakan rumus
yang diperoleh melalui ujian tensil. Alat penguji tensil ini berjaya dari segi
menghasilkan ukuran kekenyalan gluten dan juga gluten tidak putus pada kawasan
apitan. Sifat reologi gluten, K dan n, diperolehi dengan memadankan lengkungan
tegangan-regangan mengikut persamaan eksponensial,ε
σn
Ke= . Dua jenis tepung,
kuat dan lemah, digunakan sebagai perbandingan. Korelasi antara dua ukuran bagi
kuantiti dan kualiti gluten ditentukan di akhir kajian ini.
viii
Model persamaan polinomial yang menepati data telah dihasilkan daripada Design
Expert V.6.0.4. Nilai P, R2 dan lack-of-fit ditentukan bagi mengesahkan kesesuaian
model persamaan polinomial tersebut terhadap data sebenar dan seterusnya akan
digunakan sebagai ramalan yang bagus untuk data tersebut. Keputusan daripada
Design Expert kemudian dipindahkan ke fail Microsoft Excel di mana graf respon
diplot melawan tiga faktor yang dikaji.
Keputusan menunjukkan di antara tiga faktor yang dikaji, garam memberikan kesan
yang paling signifikan (0.0001 < P < 0.02) terhadap kuantiti dan kualiti gluten.
Dengan peningkatan kandungan garam, ia mengurangkan kandungan basah dan
kering gluten. Isipadu pengembangan dan kekenyalan gluten menurun dengan
peningkatan kandungan garam. Ini menunjukkan bahawa kekuatan rangkaian
gluten berkurangan dan ia tidak diadun menjadi doh yang kenyal apabila kandungan
garam bertambah. Faktor yang signifikan berikutnya ialah kandungan air
(0.0001 < P < 0.67). Masa pengadunan adalah faktor yang paling kurang signifikan
di antara tiga faktor tersebut (0.0001 < P < 0.95). Untuk semua faktor yang dikaji,
keputusan bagi jenis tepung yang kuat adalah lebih tinggi berbanding tepung yang
lemah dari segi kuantiti, isipadu pengembangan dan juga kekenyalan. Ini
menunjukkan bahawa kualiti gluten dipengaruhi oleh kandungan protin tepung.
Semua korelasi di antara kuantiti dan kualiti menunjukkan nilai pekali hubungkait (R)
yang positif. Korelasi yang tinggi di antara (i) kuantiti gluten dan pengembangan
isipadu gluten (R > 0.75), (ii) kuantiti gluten dan kekenyalan gluten (R > 0.80) dan
ix
(iii) pengembangan isipadu dan kekenyalan gluten (R > 0.60) diperolehi bagi tepung
yang kuat dibandingkan dengan tepung yang lemah (R > 0.45; R > 0.50; R > 0.30,
masing-masing). Keputusan ini menunjukkan bahawa kualiti gluten dipengaruhi
oleh kandungan protin tepung dan kekenyalan dan pengembangan isipadu gluten
adalah berkorelasi secara positif. Korelasi – korelasi ini boleh digunakan dalam
industri makanan bagi meningkatkan kuantiti dan kualiti gluten pada masa hadapan.
x
ACKNOWLEDGEMENTS
In the name of Allah, The Most Gracious and The Most Merciful.
Alhamdulillah. I would like to thank my supervisor, Dr. Chin Nyuk Ling, for her
guidance, helpful advice, generous encouragement and motivation, never-ending
patience, kind attention and willingness to assist me throughout this research. I have
learnt a lot of useful knowledge from her throughout this research. Thank you also
to my supervisory committee members, Prof. Russly Abdul Rahman and
Dr. Roselina Karim, for their advice and guidance.
I am also grateful to Encik Nazri Meor Razlan, Encik Raman Morat and Encik
Kamarul Zaman from Process and Food Engineering Department laboratory for
providing technical support and guidance throughout my laboratory works. My
sincere appreciation also goes to all Process and Food Engineering Department
staffs and master and PhD students year 2005-2007, who have helped and guided me
throughout my studies. I would like to thank Malayan Flour Mill (M) Sdn. Bhd. for
supplying the flour for this study. Thank you to other individuals who I have not
mentioned but have helped me in any possible way.
Last but not least, I would like to express heartiness gratitude and love to my
parents, family and friends for their love, encouragement and support.
THANK YOU ALL!!!
xi
I certified that an Examination Committee has met on 18 December 2007 to conduct
the final examination of Dayang Norulfairuz binti Abang Zaidel on her Master of
Science thesis entitled “Factors Affecting Gluten Production and its Rheological
Characterizations” in accordance with Universiti Pertanian Malaysia (Higher Degree)
Act 1980 and Universiti Pertanian Malaysia (Higher Degree) Regulation 1981. The
Committee recommends that the student be awarded the degree of Master of Science.
Members of the Examination Committee were as follows:
Mohd. Nordin Ibrahim, PhD
Associate Professor
Faculty of Engineering
Universiti Putra Malaysia
(Chairman)
Siti Mazlina Mustapa Kamal, PhD
Lecturer
Faculty of Engineering
Universiti Putra Malaysia
(Internal Examiner)
Ling Tau Chuan, PhD
Lecturer
Faculty of Engineering
Universiti Putra Malaysia
(Internal Examiner)
Ida Idayu Muhammad, PhD
Senior Lecturer
Faculty of Chemical and Natural Resources Engineering
Universiti Teknologi Malaysia
(External Examiner)
____________________________________
HASANAH MOHD. GHAZALI, PhD
Professor and Deputy Dean
School of Graduate Studies
Universiti Putra Malaysia
Date: 29 January 2008
xii
This thesis was submitted to the Senate of Universiti Putra Malaysia and has been
accepted as fulfilment of the requirement for the degree of Master of Science. The
members of the Supervisory Committee were as follows:
Chin Nyuk Ling, PhD
Lecturer
Faculty of Engineering
Universiti Putra Malaysia
(Chairman)
Russly Abdul Rahman, PhD
Professor
Faculty of Food Science and Technology
Universiti Putra Malaysia
(Member)
Roselina Karim, PhD
Lecturer
Faculty of Food Science and Technology
Universiti Putra Malaysia
(Member)
______________________
AINI IDERIS, PhD
Professor and Dean
School of Graduate Studies
Universiti Putra Malaysia
Date: 21 February 2008
xiii
DECLARATION
I hereby declare that the thesis is based on my original work except for quotations
and citations which have been duly acknowledged. I also declare that it has not been
previously or concurrently submitted for any other degree at UPM or other
institutions.
__________________________
DAYANG NORULFAIRUZ BINTI
ABANG ZAIDEL
Date: 4 January 2008
xiv
TABLE OF CONTENTS
Page
DEDICATION ii
ABSTRACT iii
ABSTRAK vi
ACKNOWLEDGEMENTS x
APPROVAL xi
DECLARATION xiii
LIST OF TABLES xvi
LIST OF FIGURES xvii
LIST OF APPENDICES xxvi
LIST OF ABBREVIATIONS xxvii
NOMENCLATURE xxviii
CHAPTER
1 INTRODUCTION 1
1.1 Gluten Uses and Properties 1
1.2 Significance of This Study 4
1.3 Objectives 5
1.4 Scope of Work and Thesis Outlines 5
2 LITERATURE REVIEW 8
2.1 Introduction to Wheat Gluten 9
2.1.1 Wheat Flour Composition 9
2.1.2 Gluten Networks Development during Flour-Water Mixing 11
2.1.3 Gluten Preparation and Washing Method 14
2.1.4 Current Uses of Wheat Gluten in Food Industry 16
2.2 Gluten Quantity 18
2.3 Gluten Volume Expansion 19
2.3.1 Frying Method 19
2.3.2 Volume Displacement Method 23
2.4 Rheology of Gluten 24
2.4.1 Basic Concepts of Rheology 25
2.4.2 Introduction to Food Texture Analysis 31
2.4.3 Rheological Properties of Gluten 32
2.5 Gluten Extensibility 34
2.5.1 Tensile Test 35
2.5.2 Derivation of Extensibility Parameters 40
2.6 Factors Affecting Gluten Properties 43
2.6.1 Effect of Flour Composition 43
2.6.2 Effect of Processing Factors 44
2.6.3 Effect of Ingredient Factors 46
2.7 Summary 48
xv
3 RESEARCH DESIGN AND METHODOLOGY 49
3.1 Raw Materials 49
3.1.1 Flour 49
3.1.2 Water and Salt 50
3.2 Methods for Quantity Analysis of Gluten 51
3.2.1 Dough Preparations 52
3.2.2 Gluten Preparations 55
3.2.3 Gluten Analysis 56
3.3 Methods for Quality Analysis of Gluten 59
3.3.1 Dough Preparations 60
3.3.2 Gluten Preparations 60
3.3.3 Gluten Analysis 63
3.4 Experimental Design 73
3.4.1 Preliminary Experiment 73
3.4.2 Response Surface Methodology 74
3.4.3 Data Analysis 77
3.5 Summary 79
4 RESULTS AND DISCUSSION 80
4.1 Dough and Gluten Preparations 81
4.2 Quantity Analysis of Gluten 82
4.2.1 Preliminary Experiment 82
4.2.2 Wet Gluten Content Analysis 84
4.2.3 Dry Gluten Content Analysis 91
4.3 Quality Analysis of Gluten 98
4.3.1 Preliminary Experiment 98
4.3.2 Gluten Volume Expansion Analysis 103
4.3.3 Extensibility Analysis 111
4.3.4 Stress-Strain Curve-Fitting Analysis 123
4.4 Correlation between Quantity and Quality Measurements 154
4.5 Summary 160
5 CONCLUSIONS AND RECOMMENDATIONS 163
5.1 Introduction 163
5.2 Summary of the Works 164
5.3 Recommendations for Future Work 167
REFERENCES 168
APPENDICES 175
BIODATA OF THE AUTHOR 196
xvi
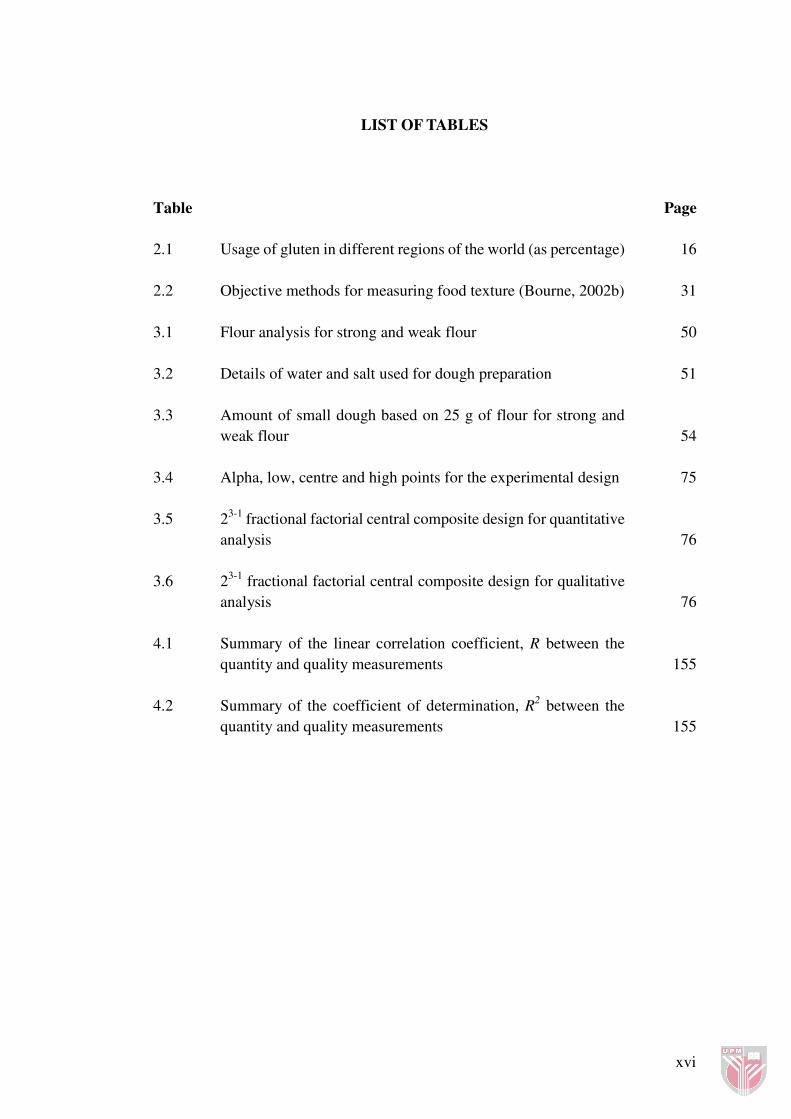
LIST OF TABLES
Table Page
2.1 Usage of gluten in different regions of the world (as percentage) 16
2.2 Objective methods for measuring food texture (Bourne, 2002b) 31
3.1 Flour analysis for strong and weak flour 50
3.2 Details of water and salt used for dough preparation 51
3.3 Amount of small dough based on 25 g of flour for strong and
weak flour
54
3.4 Alpha, low, centre and high points for the experimental design 75
3.5 23-1
fractional factorial central composite design for quantitative
analysis
76
3.6 23-1
fractional factorial central composite design for qualitative
analysis
76
4.1 Summary of the linear correlation coefficient, R between the
quantity and quality measurements
155
4.2 Summary of the coefficient of determination, R2 between the
quantity and quality measurements
155
xvii
LIST OF FIGURES
Figure Page
2.1 A model for the molecular structure of gluten. HMW subunits are
approximately by linear polymers, interchain disulphide links are
not shown. Other polymers are approximated by spheres
(adapted from Belton, 1999)
12
2.2 Molecular interpretation of gluten development (a) beginning of
mixing, (b) optimum development and (c) overmixing (adapted
from Létang et al., 1999)
13
2.3 Heat transfer in (a) shallow frying and (b) deep-fat frying
(adapted from Fellows, 2000)
20
2.4 (a) Schematic cross-section of a piece of food during deep-fat
frying (adapted from Mellema, 2003) (b) cross-section of the
crust of fried gluten
21
2.5 Displacement method (adapted from Anon. 2007a) 24
2.6 Mustard seeds used in solid displacement method 24
2.7 Diagramatic representation of (a) shear and (b) extensional
deformation of an isolated macromolecule (adapted from
Menjivar, 1989)
26
2.8 Curves for typical time-independent fluids (a) shear stress in
function of shear rate and (b) apparent viscosity in function of
shear rate (adapted from Steffe, 1996a)
29
2.9 Curves of time-dependent behavior of fluids (a) Shear stress in
function of time at constant shear rate and (b) apparent viscosity
in function of shear rate showing hysteresis loop (adapted from
Steffe, 1996a)
30
2.10 Creep and recovery curves for ideal elastic, ideal viscous and
viscoelastic materials (adapted from Steffe, 1996b)
30
xviii
2.11 The deformation of polymers resulting from extending the
network. (a) The equilibrium configuration. (b) Small extension -
only the loops are deformed. (c) Large deformation loops are
flattenned and the interchain hydrogen bonds are broken so that
the chains slip over each other (adapted from Belton, 1999)
34
2.12 Extension test of dough on Brabender extensograph (adapted
from Anon., 2007b)
36
2.13 Load-Extension curve obtained from Brabender extensograph 37
2.14 The extension test of a strip of gluten on a Kieffer dough and
gluten extensibility rig fitted to a texture analyzer (adapted from
Wang, 2003)
37
2.15 Graph of gluten extension from Kieffer dough and gluten
extensibility rig (adapted from Tronsmo et al., 2003)
39
2.16 Attachment for measuring chapati extensibility on Instron
(adapted from Gujral and Pathak, 2002)
40
2.17 Schematic diagram of forces acting on gluten and the length of
gluten during tensile test (adapted from Dunnewind et al., 2004)
41
2.18 Typical Farinograph curve (adapted from Létang et al., 1999) 45
3.1 Flow of methods and preparations for quantitative analysis 52
3.2 Electronic balance (a) Model EL-4100D, Setra Systems Inc.,
USA used for weighing flour, water, dough and gluten (b) Model
ER-120A, A&D Company Limited, Tokyo Japan
53
3.3 (a) Mixer (5K5SS, KitchenAid, Belgium) (b) Dough hook blade 53
3.4 Gannt chart of time period in gluten preparations for strong and
weak flour
56
3.5 Aluminium foil numbered and gluten arranged on baking pan
before oven drying
57
3.6 Oven (UM200-800, Memmert GmbH+Co.KG, Germany) 58
3.7 Flow of methods and preparations for qualitative analysis 59
xix
3.8
(a) Paper clip for shaping the gluten at a consistent size and (b)
paper cutter used for gluten cutting
62
3.9 Gluten cutting at consistent size using paper clip (a) top (b)
cross-sectional view
62
3.10 (a) Deep-fryer (PDF-9989, Pensonic, Malaysia) and (b) the four
channel datalogging thermometer (Monarch 309, Monarch
Instrument, USA) and thermocouple probe (TP-K01, Monarch
Instrument, USA) to monitor the oil temperature
63
3.11 Determination of volume of container, V1 64
3.12 Determination of volume of displaced seeds, V2 65
3.13 Instron (5566 series, Instron Corporation, USA) connected to
computer software and fitted with gluten extensibility attachment
67
3.14 Gluten extensibility attachment on Instron utilising two plastic
clips set at 40 mm distance at each other and a hook attached to
the Instron and placed in between the clips
68
3.15 Tensile test set-up diagram from (a) top and (b) side view 69
3.16 Tensile test showing gluten extensibility at various stages: (a)
gluten clamped at clips (b) gluten pulled upward by hook (c)
gluten became thinner (d) gluten fractured
70
3.17 Force versus hook displacement graph produced by Instron
computer software
71
3.18 Graph of actual force versus gluten extension 71
3.19 Curve-fitting of stress-strain curve using exponential equation 72
4.1 Gluten mass obtained after washing of dough 81
4.2 Profile for (a) wet gluten content and (b) dry gluten content at
various mixing times for strong and weak flour
83
4.3 Predicted versus actual wet gluten content for (a) strong and (b)
weak flour
85
xx
4.4 Wet gluten content at various mixing times for (a) 3 water levels
and (b) 3 salt levels for strong flour
86
4.5 Wet gluten content at various mixing times for (a) 3 water levels
and (b) salt levels for weak flour
87
4.6 Wet gluten content at various salt levels for (a) 3 mixing times
and (b) 3 water levels for strong flour
88
4.7 Wet gluten content at various salt levels for (a) 3 mixing times
and (b) 3 water levels for weak flour
88
4.8 Wet gluten content at various water levels for (a) 3 mixing times
and (b) 3 salt levels for strong flour
89
4.9 Wet gluten content at various water levels for (a) 3 mixing times
and (b) 3 salt levels for weak flour
90
4.10 Wet gluten content at various mixing times for strong (filled
symbols) and weak flour (empty symbols) for different salt levels
(solid lines 2%, broken lines 5%, dotted lines 8%) and different
water levels (rectangular – low, square – middle, round – high
level)
91
4.11 Predicted versus actual dry gluten content for (a) strong and (b)
weak flour
92
4.12 Dry gluten content at various mixing times for (a) 3 water levels
and (b) 3 salt levels for strong flour
93
4.13 Dry gluten content at various mixing times for (a) 3 water levels
and (b) 3 salt levels for weak flour
94
4.14 Dry gluten content at various salt levels for (a) 3 mixing times
and (b) 3 water levels for strong flour
95
4.15 Dry gluten content at various salt levels for (a) 3 mixing times
and (b) 3 water levels for weak flour
95
4.16 Dry gluten content at various water levels for (a) 3 mixing times
and (b) 3 salt levels for strong flour
96
4.17 Dry gluten content at various water levels for (a) 3 mixing times
and (b) 3 salt levels for weak flour
97
xxi
4.18 Dry gluten content at various mixing times for strong (filled
symbols) and weak flour (empty symbols) for different salt levels
(solid lines 2%, broken lines 5%, dotted lines 8%) and different
water levels (rectangular – low, square – middle, round – high
level)
97
4.19 Volume expansion of fried gluten for various mixing times for
strong and weak flour
99
4.20 Graph of (a) measured force-hook displacement for gluten
extensibility from strong and weak flour mixed for 8 minutes and
(b) measured and actual force versus hook displacement for
gluten extensibility from strong flour
100
4.21 Gluten length at fracture resulting from tensile test at various
mixing times for strong and weak flour
101
4.22 Curves of stress-strain for gluten from (a) strong and (b) weak
flour mixed for various mixing times
102
4.23 (a) Fracture stress (b) fracture strain (c) coefficient, K and (d)
index, n for gluten from strong and weak flour mixed for various
mixing times
103
4.24 (a) Fried gluten (b) inside of fried gluten showing the gluten
network
104
4.25 Predicted versus actual volume expansion of fried gluten for (a)
strong and (b) weak flour
105
4.26 Volume expansion of fried gluten for various mixing times for
(a) 3 water levels and (b) 3 salt levels for strong flour
106
4.27 Volume expansion of fried gluten for various mixing times for
(a) 3 water levels and (b) 3 salt levels for weak flour
107
4.28 Volume expansion of fried gluten for various salt levels for (a) 3
mixing times and (b) 3 water levels for strong flour
108
4.29 Volume expansion of fried gluten for various salt levels for (a) 3
mixing times and (b) 3 water levels for weak flour
109
4.30 Volume expansion of fried gluten for various water levels for (a)
3 salt levels and (b) 3 mixing times for strong flour
110
xxii
4.31 Volume expansion of fried gluten for various water levels for (a)
3 salt levels and (b) 3 mixing times for weak flour
110
4.32 Volume expansion of fried gluten for various mixing times for
strong (filled symbols) and weak flour (empty symbols) for
different salt levels (solid lines 2%, broken lines 5%, dotted lines
8%) and different water levels (rectangular – low, square –
middle, round – high level)
111
4.33 Gluten extensibility (a) gluten became thinner as it pulled
upward (b) gluten fractured
112
4.34 Graph of measured force-hook displacement for actual runs
obtained from Instron for gluten from (a) strong and (b) weak
flour
113
4.35 Measured and actual force versus hook displacement for gluten
from (a) strong and (b) weak flour
114
4.36 Predicted versus actual gluten length at fracture for (a) strong and
(b) weak flour
115
4.37 Gluten length at fracture for various mixing times for (a) 3 salt
levels and (b) 3 water levels for strong flour
116
4.38 Gluten length at fracture for various mixing times for (a) 3 salt
levels and (b) 3 water levels for weak flour
118
4.39 Gluten length at fracture for various salt levels for (a) 3 mixing
times and (b) 3 water levels for strong flour
119
4.40 Gluten length at fracture for various salt levels for (a) 3 mixing
times and (b) 3 water levels for weak flour
120
4.41 Gluten length at fracture for various water levels for (a) 3 salt
levels and (b) 3 mixing times for strong flour
121
4.42 Gluten length at fracture for various water levels for (a) 3 salt
levels and (b) 3 mixing times for weak flour
122
4.43 Gluten length at fracture for various mixing times for strong
(filled symbols) and weak flour (empty symbols) for different
salt levels (solid lines 2%, broken lines 5%, dotted lines 8%) and
xxiii
different water levels (rectangular – low, square – middle, round
– high level)
123
4.44 Stress-strain curves for gluten from (a) strong and (b) weak flour
mixed for various mixing times, salt and water levels.
124
4.45 Predicted versus actual value of fracture strain for (a) strong and
(b) weak flour
126
4.46 Predicted versus actual value of fracture stress for (a) strong and
(b) weak flour
127
4.47 Predicted versus actual value of coefficient, K for (a) strong and
(b) weak flour
128
4.48 Predicted versus actual index, n value for (a) strong and (b) weak
flour
130
4.49 Fracture strain for various mixing times for (a) 3 water levels and
(b) 3 salt levels for strong flour
131
4.50 Fracture strain for various mixing times for (a) 3 water levels and
(b) 3 salt levels for weak flour
132
4.51 Fracture strain for various salt levels for (a) 3 mixing times and
(b) 3 water levels for strong flour
133
4.52 Fracture strain for various salt levels for (a) 3 mixing times and
(b) 3 water levels for weak flour
133
4.53 Fracture strain for various water levels for (a) 3 mixing times and
(b) 3 salt levels for strong flour
134
4.54 Fracture strain for various water levels for (a) 3 mixing times and
(b) 3 salt levels for weak flour
135
4.55 Fracture stress for various mixing times for (a) 3 water levels and
(b) 3 salt levels for strong flour
136
4.56 Fracture stress for various mixing times for (a) 3 water levels and
(b) 3 salt levels for weak flour
137
4.57 Fracture stress for various salt levels for (a) 3 mixing times and
(b) 3 water levels for strong flour
138