Embed Size (px)
Citation preview

UNIVERSITI PUTRA MALAYSIA
DEVELOPMENT OF A MICROWAVE TECHNIQUE TO PREDICT MOISTURE CONTENT IN MORTAR
MOHAMAD ASHRY BIN JUSOH
FS 2007 25

ii
To My Lovely Mother, Brother and Sister……
And
In memorial: Father
iii
Abstract of thesis presented to the Senate of Universiti Putra Malaysia in fulfilment of the requirement for the degree of Master of Science
DEVELOPMENT OF A MICROWAVE TECHNIQUE TO PREDICT MOISTURE CONTENT IN MORTAR
By
MOHAMAD ASHRY BIN JUSOH
April 2007
Chairman : Zulkifly Abbas, PhD Faculty : Science This thesis describes a simple microwave nondestructive free space method at 17.2
GHz to determine the moisture content of mortar cement. The method is simple, fast,
contactless and accurate way to determine the moisture content in mortar. The
measurement system consists of a 17.2 GHz dielectric resonator oscillator (DRO) as
a microwave source, Power Meter as the detector, a pair of lens horn antenna to
transmit and receive microwave signal. The 17.2 GHz frequency was chosen since
the sensitivity to the moisture content is higher at this frequency compared to the low
frequency. The Agilent Visual Engineering Environment software was used to
control and retrieve data from the Power Meter. The microwave part of the
measurement system is setup to determine the amplitude of transmitted wave
(received powers). A comparison of the two received powers (with sample and
without sample) gives an estimate of the attenuation of the sample. The actual
moisture content was found by applying standard oven drying method. The
calculation and selection of mixture model were discussed thoroughly and only the
iv
best performance of mixture model was selected. The dielectric mixture equation
(Lichtenecker Mixture Model) has been chosen to calculate the complex permittivity
of sample and also predicted the attenuation of sample due to the smallest mean error
compared to other models like Kraszewski and Landau. An optimization technique
was used to improve the Lichtenecker model so that the mean error between
measured and predicted can be reduced. A calibration equation relating the measured
attenuation and moisture content was established and the sensitivity of the sensor is
2.8147 dB/ % moisture content. An empirical model of moisture content was
obtained from improved attenuation formula and was tested to the sample. The
measured and predicted attenuation were found in good agreement within ±5% of
mean relative error.
v
Abstrak tesis yang dikemukakan kepada Senat Universiti Putra Malaysia sebagai memenuhi keperluan untuk ijazah Master sains
PEMBANGUNAN TEKNIK GELOMBANG MIKRO UNTUK MERAMAL KANDUNGAN KELENGASAN DALAM MORTAR
Oleh
MOHAMAD ASHRY BIN JUSOH
April 2007
Pengerusi : Zulkifly Abbas, PhD Fakulti : Sains
Tesis ini memperihalkan kaedah ruang terbuka ringkas gelombang mikro tanpa
musnah pada 17.2 GHz untuk menentukan kandungan kelengasan dalam simen
mortar. Teknik ini adalah ringkas, cepat, tanpa sentuh, dan cara yang tepat untuk
menentukan kandungan kelengasan dalam mortar. Sistem pengukuran terdiri
daripada 17.2 GHz Pengayun Resonator Dielektrik sebagai punca gelombang mikro,
Meter Kuasa sebagai pengesan isyarat dan sepasang Lens Horn Antenna untuk
menghantar dan menerima isyarat gelombang mikro. Frekuensi 17.2 GHz dipilih
kerana sensitiviti yang tinggi terhadap kandungan kelengasan berbanding dengan
frequensi rendah. Perisian Agilent Visual Engineering Environment digunakan untuk
mengawal dan memperoleh data daripada Meter Kuasa. Bahagian gelombang mikro
pada sistem pengukuran diatur untuk menentukan amplitud kuasa yang diterima.
Perbandingan dua kuasa yang diterima (dengan sampel dan tanpa sampel)
memberikan anggaran pengecilan pada sampel. Nilai sebenar kandungan kelengasan
dicari dengan pelaksanaan kaedah piawai pengeringan oven. Pengiraan dan
vi
pemilihan model campuran telah dibincangkan dengan sepenuhnya dan model
campuran yang prestasi terbaik telah dipilih. Persamaan campuran dielektrik (Model
campuran Lichtenecker) telah dipilih untuk mengira ketelusan kompleks pada sampel
dan meramalkan pengecilan pada sampel kerana min ralat terkecil dibandingkan
dengan model lain seperti Kraszewski dan Landau. Teknik optimum digunakan
untuk memperbaiki model Lichtenecker supaya min ralat antara diukur dan diramal
dapat dikurangkan. Persamaan penentukuran yang mengaitkan antara pengecilan
dan kandungan kelengasan telah dihasilkan dan kesensitifan pengesan adalah 2.8147
dB/ % kandungan kelengasan. Model empirikal bagi kandungan kelengasan telah
diperolehi daripada formula pengecilan yang ditingkatkan dan telah diuji pada
sampel. Pengecilan yang diukur dan diramal masing-masing didapati dalam
persefahaman yang baik dengan min ralat bandingan ±5%

vii
ACKNOWLEDGEMENTS
The author wishes to thank his family members for their love, support and
encouragement as well as for always being there for him.
The author extends his deepest gratitude to the chairman of supervisory committee,
Dr. Zulkifly B Abbas for his kindness, guidance, suggestion and his willingness to
help.
The author also wishes to thank the member of the supervisory committee, Prof. Dr.
Kaida B Khalid for their advice, supervision and guidance.
Appreciation also given to my colleagues, Mr Cheng Ee Meng and my senior, Mr
Lee Kim Yee and all members in the RF & Microwave Lab, past and present, for
their guidance, help and support.

viii
I certify that an Examination Committee has met on 12 April 2007 to conduct the final examination of Mohamad Ashry Bin Jusoh on his Master of Science thesis entitled “Development of a Microwave Technique To Predict Moisture Content in Mortar” in accordance with Universiti Pertanian Malaysia (Higher Degree) Act 1980 and Universiti Pertanian Malaysia (Higher Degree) Regulation 1981. The Committee recommends that the candidate be awarded the relevant degree. Members of the Examination Committee are as follows: Noorhana Yahya, PhD Assoc. Professor Faculty of Science Universiti Putra Malaysia (Chairman) Jumiah Hassan, PhD Assoc. Professor Faculty of Science Universiti Putra Malaysia (Internal Examiner) Husaini Omar, PhD Assoc. Professor Faculty of Engineering Universiti Putra Malaysia (Internal Examiner) Kaharudin Dimyati, PhD Assoc. Professor Faculty of Engineering Universiti of Malaya Malaysia (External Examiner)
_____________________________________ HASANAH MOHD. GHAZALI, PhD Professor and Deputy Dean School of Graduate Studies Universiti Putra Malaysia Date:
ix
This thesis was submitted to the Senate of Universiti Putra Malaysia and has been accepted as fulfilment of the requirement for the degree of Master of Science. The members of the Supervisory Committee were as follows: Zulkifly Abbas, PhD Lecturer Faculty of Science Universiti Putra Malaysia (Chairman) Kaida Khalid, PhD Professor Faculty of Science Universiti Putra Malaysia (Member) ____________________ AINI IDERIS, PhD Professor and Dean School of Graduate Studies Universiti Putra Malaysia Date: 17TH JULY 2007
x
DECLARATION I declare that the thesis is my original work except for quotations and citations which have been duly acknowledged. I also declare that it has not been previously, and is not concurrently, submitted for any other degree at Universiti Putra Malaysia or at any other institution.
______________________________
MOHAMAD ASHRY BIN JUSOH
Date: 20TH JUNE 2007

xi
TABLE OF CONTENTS Page DEDICATION ii ABSTRACT iii ABSTRAK v ACKNOWLEDGEMENTS vii APPROVAL viii DECLARATION x LIST OF TABLES xiii LIST OF FIGURES xiv LIST OF ABBREVIATIONS xvii CHAPTER
1 INTRODUCTION 1 1.1 An overview of Microwave Non-Destructive Technique 1 1.2 Problem Statement 3 1.3 Microwave Technique 4 1.4 Objective 6 1.5 Scope of Thesis 6
2 LITERATURE REVIEW 8 2.1 An Overview of Cement 9
2.1.1 Types of Cement 10 2.1.2 Portland Cement 10 2.1.3 Portland Cement Manufacturing 11 2.1.4 Chemical Properties of Portland Cement 12 2.1.5 Types of Portland Cement 14
2.2 Sand 16 2.3 Moisture Content Measurement 17
2.3.1 Conventional Oven Method 17 2.3.2 Microwave Moisture Measurements 17
2.4 Attenuation Measurement 19 2.5 Microwave Measurement Technique 20
2.5.1 Closed Waveguide or Coaxial Line Technique 21 2.5.2 Free Space Method 22 2.5.3 Open-Ended Transmission Technique 23 2.5.4 Open Resonator Technique 24 2.5.5 Far-Field and Near-Field Technique 25
2.5.5.1 Transmission Technique 28 2.5.5.2 Reflection Technique 28 2.5.5.3 Transmission/ Reflection Technique 29
2.5.6 Dielectric Waveguide Technique 30 2.5.7 Reducing Error Cause by Multiple Reflection 31

xii
3 ELECTROMAGNETIC THEORY 33 3.1 Wave Equation 33 3.2 Losses in Materials 38 3.3 Wave Propagation in a Multi-layer Structure 39 3.4 Reflection and Transmission for Layered Materials 42 3.5 Signal Flow Graph Analysis 45 3.6 Effective Permittivity Model/ Mixture Model 50
4 METHODOLOGY 54 4.1 Materials 55 4.2 Sample Preparation 55 4.3 Measurement Set up 56 4.4 Microwave Instrumentation and Control 57
5 RESULTS AND DISCUSSION 62 5.1 Relationship between Attenuation, Moisture Content and
Thickness 63 5.2 Effect of Complex Permittivity to Attenuation 69 5.3 Selection of Mixture Model 73 5.4 The Accuracy of Data between Theory and Measurement 79 5.5 Optimization Technique 81 5.6 Validation Process 88 5.7 Statistical Analysis of Data 91
6 CONCLUSION AND SUGGESTION 98 6.1 Main Contribution 98 6.2 Suggestion for Further Work 99
6.2.1 Portable Instrument 99 6.2.2 Dielectric Permittivity Model 99
REFERENCES 100 APPENDICES 104 A Mason Non-Touching Loop 105 B Measurement Data from VNA 110 C Photo of Devices and Instruments 112
D Specification of Portland Cement By Malaysian Standard and Accreditation 113
BIODATA OF STUDENT 116

xiii
LIST OF TABLES Table Page
1.1 The electromagnetic spectrum. 2
2.1 Main Constituents in a Typical Portland Cement 13
5.1 The relative error on each moisture content for sample 500 g sand+500 g cement+200 g water. 75 5.2 The relative error on each moisture content for sample 400 g sand+600 g cement+200 g water. 76 5.3 The relative error on each moisture content for sample 600 g sand+400 g cement+200 g water. 77 5.4 A constant parameter of A and B for each sample. 82 5.5 A comparison of attenuation and relative error for sample 400 g sand+ 600 g cement+200 g water. 84 5.6 A comparison of attenuation and relative error for sample 500 g sand+ 500 g cement+200 g water. 84 5.7 A comparison of attenuation and relative error for sample 600 g sand+ 400 g cement+200 g water. 85 5.8 Relative error and percentages of improvement after optimization for various sample. 87
5.9 Validation result and relative error for 400 g sand+600 g cement+ 200 g water. 90
5.10 Validation result and relative error for 500 g sand+500 g
cement+ 200 g water. 90
5.11 Validation result and relative error for 600 g sand+400 g cement+ 200 g water. 91
5.12 Experimental data for calibration. 92
5.13 Relative error between predicted and measured moisture content. 95 B.1 The complex permittivity of mortar which measure
by Vector Network Analyzer at 17.2 GHz 110
xiv
LIST OF FIGURES
Figure Page 2.1 Manufacture of Portland Cement. 12 2.2 Slotted line technique of measuring complex permittivity of materials. 21 2.3 Completely dielectric filled waveguide (a) Reflection only (b) Combined Transmission and Reflection method. 22 2.4 Dielectric waveguide technique. (a) Resonance method. (b) Transmission-Reflection method. 31
3.1 Schematic diagram of the transmission measurement. 41
3.2 Transmission and reflection phenomena in the transmission 41 sensors. 3.3 Reflection and transmission at a general interface: normal incidence between two dielectric medium. 42
3.4 Reflection and transmission for multiple dielectric interfaces. 43
3.5 A signal flow graph that represents the transmission and reflection phenomena in the sensor structure. 47
3.6 A simplified signal flow graph of Figure 3-5. 48
3.7 A simplified signal flow graph of Figure 3-6. 49
3.8 A simplified signal flow graph of Figure 3-7. 49
4.1 Measurement set up for moisture content measurement of mortar sample. 58
4.2 Microwave measurement set up 61 4.3 Sample inside the container 61
5.1 Relationship between moisture content and attenuation at 17.2GHz. 63
5.2 Relationship between attenuation and frequency for various moisture contents on mortar. (a) 0% to 20% moisture content. (b) 30% to 70% moisture content 65
5.3 Relationship between sensitivity FA ∂∂ / and moisture content at 17.2 GHz. 66 5.4 Relationship between attenuation, moisture content and
thickness at 17.2 GHz. 66 5.5 Relationship between attenuation and thickness of sample
for dry samples. 68
5.6 Relationship between attenuation, thickness and complex permittivity at 17.2 GHz. 70
5.7 Relationship between sensitivity d/A ∂∂ and complex
permittivity (dielectric constant and loss factor) at 17.2 GHz. 70
5.8 Dielectric constant and loss factor for mortar with 12 mm
thickness as a function of moisture content. 72 5.9 Comparison of measurement and three models for various samples. 74 5.10 Relative error on each moisture content for three mixture models (Kraszewski, Landau and Lichtenecker). 78 5.11 A comparison of measurement and theory for various samples 80
5.12 Relationship between attenuation and moisture content and comparison between measurement, Lichtenecker and
optimization (improved Lichtenecker). 83
5.13 A comparison between relative error before optimization (Lichtenecker) and after optimization for each moisture contents for various samples. 86
5.14 A comparison of between Lichtenecker, optimization and validation for various samples. 89
5.15 Calibration line obtained from regression of attenuation on moisture content. (a) Attenuation versus moisture content. (b) Moisture content versus attenuation. 94
5.16 Direct comparison between predicted and measured moisture content. 95
xv
xvi
5.17 Relationship between relative error and moisture content. 96
B.1 Dielectric constant measured by Vector Network Analyzer for sample (a) sand, (b) water and (c) cement 109
C.1 Photo of devices and instruments that were used in attenuation measurement 110

LIST OF ABBREVIATIONS
α attenuation constant c velocity of light ε*, ε’ , ε” complex permittivity, dielectric constant (or real part of
permittivity) and loss factor (or imaginary part of permittivity)
m.c moisture content mw mass before drying md mass after dried
Pi power measured with the material inserted Po power measured without material inserted S11, S12, S21, S22 scattering parameters E the electric field intensity H the magnetic field intensity D the electric flux density B the magnetic flux density Ρ the electric charge density J the current density μ permeability σ conductivity γ propagation constant β phase constant ∇ Laplacian vector k wave number TE Transverse Electric
xvii
TM Transverse Magnetic TEM Transverse Electromagnetic Modes
δtan loss tangent d sample thickness η impedance
0η impedance in free space ω angular frequency f frequency OPC Ordinary Portland Cement dB decibels Agilent VEE Agilent Visual Engineering Environment ASTM American Society for Testing and Material Standards AASHTO American Association of State Highway and
Transportation Officials MATLAB Matrix Laboratory
xviii
CHAPTER 1
INTRODUCTION
1.1 An overview of Microwave Non-Destructive Technique
Microwave Non-Destructive Technique (MNDT) has been applied successfully to
specific testing problems for more than 50 years. The first few papers describing
such techniques appeared in the early 1950’s but the bulk of papers being published
where after 1960’s. Before this time, equipment was not generally available for the
generation and measurement of such short electromagnetic waves. It is likely that the
exploitation of their full potential in this field will have to await the development of
affordable robust generators operating at the higher microwave frequencies.
The term MNDT refers to electromagnetic testing conducted at frequencies in the
microwave region. Most electromagnetic book identifies that the microwave region
is roughly between 300 MHz to 300 GHz and wavelength are between 10-3 and
10-1m (Table 1.1). Testing with microwave is dominated by the basic properties of
microwaves. Since their penetration in good conducting materials in minimal, they
are mainly used to test the nonconducting materials.
1
2
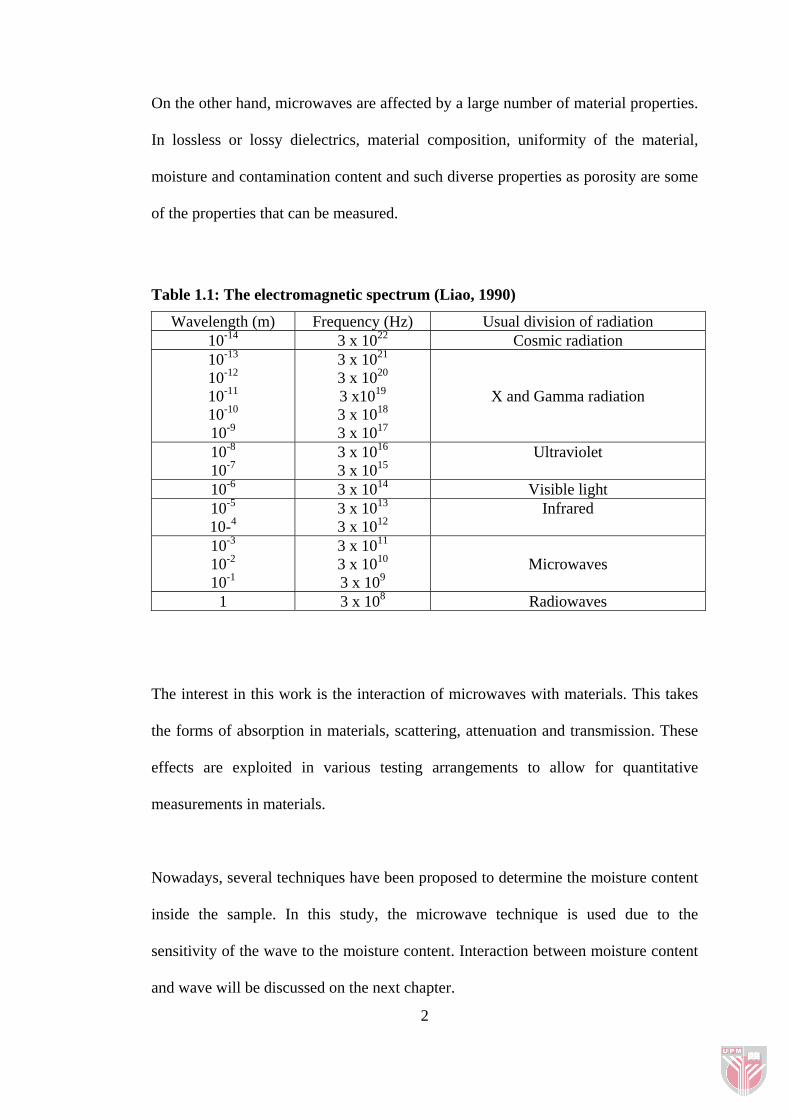
On the other hand, microwaves are affected by a large number of material properties.
In lossless or lossy dielectrics, material composition, uniformity of the material,
moisture and contamination content and such diverse properties as porosity are some
of the properties that can be measured.
Table 1.1: The electromagnetic spectrum (Liao, 1990)
Wavelength (m) Frequency (Hz) Usual division of radiation 10-14 3 x 10²² Cosmic radiation 10-13 10-12 10-11 10-10
10-9
3 x 10²¹ 3 x 10²⁰ 3 x10¹⁹ 3 x 10¹⁸ 3 x 10¹⁷
X and Gamma radiation
10-8 10-7
3 x 10¹⁶ 3 x 10¹⁵
Ultraviolet
10-6 3 x 10¹⁴ Visible light 10-5 10-4
3 x 10¹³ 3 x 10¹²
Infrared
10-3
10-2 10-1
3 x 10¹¹ 3 x 10¹⁰ 3 x 10⁹
Microwaves
1 3 x 10⁸ Radiowaves
The interest in this work is the interaction of microwaves with materials. This takes
the forms of absorption in materials, scattering, attenuation and transmission. These
effects are exploited in various testing arrangements to allow for quantitative
measurements in materials.
Nowadays, several techniques have been proposed to determine the moisture content
inside the sample. In this study, the microwave technique is used due to the
sensitivity of the wave to the moisture content. Interaction between moisture content
and wave will be discussed on the next chapter.
3
1.2 Problem statement Mortar is the most common material used in many structures. It is a heterogeneous
material composed of cement powder, sand and water. The conventional process to
determine the moisture content of the samples is by using the oven drying method.
The advantage of oven drying method is precise but it takes a long time to analyze
the sample. Furthermore, this technique is not practical for in-situ measurement or
field work measurement.
Recently, microwave technique is also used to measure the moisture content. In
microwave method, the weakness of conventional oven method can be overcome.
Using this method, it takes a shorter time to determine the moisture content
compared to the conventional method and also the sample can be measured as it is.
Besides that, measurement can be done using free space technique. In other words,
sample and detector are contactless.
Many researchers like Kharkovsky (2002), Kraszewski (1977), Okamura (1981) and
Ma (1999) have published about moisture content determination at low frequency.
The operating frequency in this work is 17.2 GHz which coincide with the relaxation
frequency of water at 20oC (Kaatze and Uhlendorf 1981). This will result in higher
dielectric losses and thus greater attenuation due to the moisture content in mortar.
4
1.3 Microwave technique Microwave behave much like light wave in that travel in straight lines, refract,
reflect, diffract, scatter, and interfere according to the same physical length. However
they (microwave and optical wave) are difference in behavior because of the
difference in wavelength. Microwave wavelengths are typically 105 larger than
optical wavelengths. Thus microwave tend to interact with materials and structures
on a macroscopic scale. For example, microwaves are capable of penetrating most
nonmetallic materials, reflecting and scattering from internal boundaries and
interacting with molecules (Bahr, 1982).
Ultrasound (elastic wave) and microwave are two types of wave which have the
ability to penetrate into some materials. However, they are also major differences
between them. Ultrasound/ultrasonic wave can penetrate metal (conductor) but
microwave cannot. As well known, metal is a good conductor and exhibit skin depth
of a few micrometers or less (Bahr, 1982). Thus, microwaves are essentially totally
reflected at the surface of a metal. Ultrasound transducer usually requires direct
contact to the object under test. However microwave technique is contactless.
Ultrasound velocities are typically five orders of magnitude (105) less than the
electromagnet wave velocities. An advantage of high velocity microwave
propagation is that it permits rapid inspection, limited only by mechanical
considerations.
In this study, the measurement of attenuation can be performed using microwave
technique. This measurement is also known as Microwave Non-Destructive
Technique (MNDT). There are two classes of MNDT: free space methods and open-
5
ended waveguide methods (Tamyis et al., 2002). However, the free space method is
the more commonly used method as it does not require surface contact during
measurement. In this study, a free space method is used to measure the attenuation of
mortar at 17.2 GHz. This thesis also presents the correlation between attenuation of
received signal and moisture content. By using the characteristics of water containing
in the material, a microwave passing through the moistened material is absorbed by
the water and the quantity of attenuation changes according to the moisture content.
Determination of attenuation using free space method can be measured using
reflection or transmission technique. In transmission/reflection technique, the
materials under test are inserted in a piece of transmission line and the properties of
the material are deduce from the basis of the reflection from the material or the
transmission through the material.
The general consideration of this thesis is to use only the amplitudes of the
transmission power to determine the attenuation of. According to the analysis, the
permittivity of the sample can be determined uniquely from the measurement values
of the amplitudes in the case which the sample has large enough attenuation. Thus,
this method can be used for the dynamic measurement of permittivity.
6
1.4 Objective
The main objectives of this work are
• To compare measured attenuation results with available predicted models.
• To improve the performance of the best predicted model.
• To develop a model to predict moisture content in mortar based on
microwave attenuation measurements.
1.5 Scope of Thesis
This thesis describes the method of microwave in determination of moisture content
of mortar material. The transmission modes in microwave method are used in this
measurement. Chapter 2 describes about raw material and the microwave
measurement techniques that will be used in this measurement.
Chapter 3 is about Electromagnetic theory. The attenuation equation was derived
from Maxwell equation and was used to predict the attenuation of sample. This
chapter also described about wave and interaction with matter. The signal flow graph
and Mason Non-Touching Loop (Appendix A) method was used to calculate the
attenuation of sample which is multiple reflections was considered inside the sample.
Chapter 4 presents about methodology whereby this chapter was discussed about
sample that was used in attenuation measurement and the preparation of that sample.
7
This chapter also described about measurement set up and followed by microwave
instrumentation and control for attenuation measurement.
The simulation and measurement results were discussed in chapter 5. The analysis of
parameter for attenuation equation such as thickness, frequency and moisture content
was shown in this chapter. The result was shown in relationship between attenuation
versus that parameters and attenuation versus moisture content as well. This chapter
also presents the optimization technique to improve the attenuation formula and to
get the calibration line of moisture content to predict the moisture content of the
sample. The validation of new model (improved Lichtenecker Model) has been done
and shown in this chapter. The sensitivity of sensor was found to be 2.8147 dB/ %
moisture content.
Finally, the conclusion and suggestion for future work were presented in chapter 6.