Embed Size (px)
Citation preview

UNIVERSITI PUTRA MALAYSIA
APPLICATION OF DATA MINING TECHNIQUES FOR ECONOMIC EVALUATION OF AIR POLLUTION IMPACT AND CONTROL
IING LUKMAN
FPAS 2007 7
brought to you by COREView metadata, citation and similar papers at core.ac.uk
provided by Universiti Putra Malaysia Institutional Repository

APPLICATION OF DATA MINING TECHNIQUES FOR ECONOMIC EVALUATION OF AIR POLLUTION IMPACT AND CONTROL
IING LUKMAN
Thesis Submitted to the School of Graduate Studies, Universiti Putra Malaysia, in Fulfilment of the Requirements for the Degree of Doctor of Philosophy
August 2007

To all my family, My teachers, IPB, UPM, and Tanah Air……Indonesia
ii
Abstract of thesis presented to the Senate of Universiti Putra Malaysia in fulfilment of requirement for the degree of Doctor of Philosophy
APPLICATION OF DATA MINING TECHNIQUES FOR ECONOMIC EVALUATION OF AIR POLLUTION IMPACT AND CONTROL
By
IING LUKMAN
August 2007
Chairman: Associate Professor Mohd Nasir Hassan, PhD Faculty : Environmental Studies
In this research we examine aspects of the interdependence between economic
development and the use of environmental and natural resources assets from global data
published by United Nations. For that purpose, we use data mining techniques.
Data mining techniques applied in this thesis were: 1) Group method of data handling
(GMDH), originally from engineering, introducing principles of evolution - inheritance,
mutation and selection - for generating a network structure systematically to develop the
automatic model, synthesis, and its validation; 2) The weighted least square (WLS) and
step wise regression were also applied for some cases; 3) The classification-based
association rules were applied.
iii

Data sets for this research consist of two sets integration data of air quality data and
macroeconomic data of the cross-country data of World Development Indicator 2003
(WDI 2003), and from www.nationmaster.com. The results from www.nationmaster.com
were as follows: the corruption index was strongly related to the urban SO2
concentration. The corruption index along with NOx emission has big contribution to the
debt. Debt is the debt of the home country to the foreign country or external debt or
foreign debt.
The result from WDI 2003 shows that the mortality rate of children under five years old
depended on sanitation and water facilities obtained from GMDH results. However, the
results from stepwise regression shows that mortality rate was dependent on annual
deforestation, particulate matter, nationally protected area, but the big contribution was
from annual deforestation.
Based on GMDH, new Gross National Income (GNI) formula was found. Previously
GNI was known as Gross National Product (GNP). It was different from the common
formula of GNP. The formula or equation model of urban SO2 concentration was also
found through the GMDH algorithms. The results were then compared to WLS and
Stepwise regression.
The debt was found by GMDH to be dependent on the corruption index as well as urban
SO2 concentration. Corruption index along with NOx emission were related to debt.
iv

Results from weighted least square using SAS software showed that the corruption index
was significant to the concentration of urban SO2.
Results from classification rules of the WDI 2003 data showed that the more energy
imports net from foreign country was associated with the smaller in adjusted net saving in
home country. Energy imports net were calculated as energy use in oil equivalents. This
indicated that if the energy imports net was higher, then the adjusted net saving was
small, and then CO2 emissions was small also. Thus, to reduce global warming in home
country, a country can import energy from foreign country. According to the result from
association rules on nationamaster.com data there were indication that corruption index
was related with higher urban SO2 concentration, and inflation.
Results from association rules of item sets shows that the urban SO2 always follows the
direction of corruption index. In addition, if any country wants to reduce the urban SO2
concentration, more works can be conducted on controlling corruption index than
controlling SO2 emission per populated area.
v

Abstrak tesis yang dikemukakan kepada Senat Universiti Putra Malaysia sebagai memenuhi keperluan untuk ijazah Doktor Falsafah
APLIKASI TEKNIK PERLOMBONGAN DATA UNTUK PENILAIAN EKONOMI BAGI IMPAK DAN KAWALAN PENCEMARAN UDARA
Oleh
IING LUKMAN
Ogos 2007
Pengerusi: Profesor Madya Mohd Nasir Hassan, PhD Fakulti : Pengajian Alam Sekitar
Dalam kajian ini, aspek saling bergantung antara pembangunan ekonomi dengan
penggunaan harta alam sekitar dan sumber semulajadi daripada data global yang
diterbitkan oleh Bangsa-bangsa Bersatu dikaji. Bagi tujuan itu, kami gunakan kaedah-
kaedah perlombongan data.
Kaedah pelombongan data yang digunakan dalam tesis ini adalah: 1) Kaedah kumpulan
dalam pengendalian data (GMDH) berasal dari bidang kejuruteraan yang
memperkenalkan prinsip evolusi –warisan, mutasi dan pilihan – untuk menjana satu
struktur rangkaian yang teratur dalam pembinaan model automatik, sintesis and
pengesahannya; 2) Regresi kuasa-dua berpemberat (WLS) dan regresi langkah cerdik
juga diaplikasikan untuk sesetengah kes; 3) Peraturan asosiasi berasaskan klasifikasi
digunakan.
vi

Set data untuk kajian ini terdiri daripada dua set integrasi data dari data kualiti udara dan
data makroekonomi dari kumpulan data serata dunia dari penunjuk pembinaan dunia
2003 (WDI 2003), dan juga dari www.nationmaster.com. Keputusan dari
www.nationmaster.com adalah seperti berikut: indeks rasuah berkait rapat dengan
kandungan urban S02. Indeks rasuah berserta kepulan NOx memiliki sumbangan yang
besar kepada hutang. Hutang bermakna hutang sesebuah negara sendiri ke negara asing
atau hutang ke dunia luar atau hutang ke negara luar.
Keputusan dari WDI 2003 menunjukkan bahawa kadar kematian kanak-kanak dibawah
umur lima tahun bergantung kepada kebersihan dan fasiliti air yang diperolehi dari
keputusan GMDH. Walau bagaimanapun, keputusan dari regresi langkah cerdik
menunjukkan kadar kematian bergantung kepada kepupusan setiap tahun kawasan
perhutanan, jirim debu halus, kawasan lindungan negara, tetapi sumbangan besar yalah
dari kepupusan setiap tahun kawasan perhutanan.
Berasaskan pada GMDH, kemudiannya formula pendapatan kotor kebangsaan (GNI)
yang baru telah ditemui. Dahulunya GNI dikenali sebagai hasil kotor kebangsaan (GNP).
Ianya berbeza dengan formula biasa hasil kotor kebangsaan. Formula atau persamaan
model kandungan urban SO2 juga ditemui menggunakan algoritma GMDH.
Keputusannya kemudian diperbandingkan dengan keputusan dari WLS dan regresi
langkah cerdik.
vii

Hutang ditemui oleh GMDH sebagai bergantung pada indeks rasuah sepertimana
kandungan urban SO2. Index rasuah bersama dengan kepulan NOx berkait kepada
hutang. Keputusan dari WLS menggunakan perisian SAS menunjukkan bahawa indeks
rasuah penting kepada kandungan urban SO2.
Keputusan dari peraturan klasifikasi daripada data WDI 2003 menunjukan bahawa lebih
banyaknya impot bersih tenaga dari negara asing berkaitan dengan simpanan bersih
terubahsuai yang kecil di negara sendiri. Impot tenaga bersih dicongak sebagai
penggunaan tenaga yang disamakan dengan penggunaan minyak. Ini bermakna bahawa
jika impot bersih tenaga adalah tinggi, maka simpanan bersih terubahsuai adalah kecil,
dan kepulan CO2 pun kecil. Maka, untuk mengurangkan kepanasan global di negara
sendiri, sesebuah negara boleh mengimpot tenaga dari negara asing. Berasaskan pada
keputusan dari peraturan asosiasi pada data nationmaster.com ada tanda bahawa indeks
rasuah berkait dengan kandungan urban SO2 dan juga inflasi.
Keputusan dari peraturan asosiasi daripada set-set item menunjukkan bahawa urban SO2
selalu mengikut hala indeks rasuah. Dengan demikian, jika sesebuah negara ingin
mengurangkan kadar kandungan urban SO2, lebih banyak kerja yg boleh dilaksanakan
dengan mengawal indeks rasuah daripada dengan mengawal kepulan SO2 pada setiap
kawasan penduduk.
viii

ACKNOWLEDGEMENTS
All praises do to Allah SWT, Lord of the universe. Only by His grace and mercy this
thesis can be completed.
I wish to express my sincere thanks to my supervisor Associate Prof. Dr. Mohd Nasir
Hassan for his invaluable guidance, support and continuous encouragement throughout
the course of the project.
My gratitude also goes to the member of my supervisory committee, Assoc. Prof. Dr.
Noor Akma Ibrahim for unending helps during my study, starting from giving me
guidance, great advice, until trying to find me some alternative resource fund for my
living costs, and providing much time for the methodology discussion, and checking the
whole content of this thesis draft. My gratitude also goes to another supervisory
committee Assoc. Prof. Dr. Md Nasir Sulaiman for his useful suggestions and helpful
comments during the preparation of this thesis.
I also wish to express my sincere gratitude to Dr. Gregory Alexander Ivakhnenko from
National Institute for Strategic Studies of the Council of National Security and Defense
of Ukraine, Kiev, Ukraine for sending me the GMDH Software and its source codes, and
also to Dr Bing Liu from National University of Singapore for obtaining the CBA
Software.
ix

Grateful acknowledgement is made to Malaysian Government, Universiti Putra Malaysia,
and Department of Mathematics for giving me a room for doing research.
Financial supports from Malaysian Government under the IRPA programme during my
time of study, financial supports from my siblings (especially Ali Abdurrahman SH, MH
and Drs Aziz Taufik Hirzi, MSi) and from best friend Ir. Slamet Soedarsono, MSc of
BAPPENAS Jakarta, and from excellent friend Ir. Elfajri Hanif, Jakarta, and from Uni
Sjarkiah Muhammad Yasie, Kelantan, all are gratefully acknowledged.
Special thanks are extended to other members of the academic and technical staff of the
Mathematics Department, Institut Penyelidikan Matematik (INSPEM), and
Environmental Studies Faculty (especially Assoc. Prof. Dr. M Pauzi Zakaria), students
and friends who helped me in every way possible and providing a congenial and
enthusiastic atmosphere in the laboratory.
Acknowledgement is also extended to Indonesian Student Association, for giving me
moral supports, the sweet friendship that made life easier during my difficult-time in
Malaysia, especially to Dollaris Riauaty Suhadi, Abdul Kudus, and Aris Slamet Widodo .
I wish to express my deepest gratitude to my late parents, brothers and sisters for their
prayers, continuous moral support and unending encouragement.
x

Last but not least, I wish especially to acknowledge my beloved wife, Dr Maria Viva
Rini, and my dearest sons (Tanukh and Fatih) and daughters (Haifa, Putri, and Ghaida)
for their love, support, patience and understanding.
xi

I certify that an Examination Committee met on 20 April 2007 to conduct the final examination of Iing Lukman on his Doctor of Philosophy thesis entitled “Data Mining for Economic Evaluation of Air Pollution Impacts and Controls” in accordance with Universiti Pertanian Malaysia (Higher Degree) Act 1980 and Universiti Pertanian Malaysia (Higher Degree) Regulations 1981. The Committee recommends that the candidate be awarded the relevant degree. Members of the Examination Committee are as follows:
Ahmad Makmum Abdullah, PhD Associate Professor Department of Environmental Management Faculty of Environmental Studies Universiti Putra Malaysia (Chaiman) Latifah Binti Abd Manaf, PhD Lecturer (Assistant Professor) Department of Environmental Sciences Faculty of Environmental Studies Universiti Putra Malaysia (Internal Examiner) Isa Bin Daud, PhD Associate Professor Department of Mathematics Faculty of Science Universiti Putra Malaysia (Internal Examiner) Abdul Razak Bin Hamdan, PhD Professor Department of System and Management Sciences Faculty of Information Science and Technology Universiti Kebangsaan Malaysia (External Examiner)
__________________________________ HASANAH MOHD. GHAZALI, PhD Professor / Deputy Dean School of Graduate Studies Universiti Putra Malaysia Date:
xii
This thesis submitted to the Senate of Universiti Putra Malaysia and has been accepted as fulfilment of the requirement for the degree of Doctor of Philosophy. The members of the Supervisory Committee are as follows: Mohd Nasir Hassan, PhD Associate Professor Faculty of Environmental Studies Universiti Putra Malaysia (Chairman) Noor Akma Ibrahim, PhD Associate Professor Faculty of Science Universiti Putra Malaysia (Member) Md Nasir Sulaiman, PhD Associate Professor Faculty of Computer Science and Information Technology Universiti Putra Malaysia (Member)
____________________ AINI IDERIS, PhD Professor /Dean School of Graduate Studies Universiti Putra Malaysia
Date: 9 August 2007
xiii

DECLARATION
I hereby declare that the thesis is based on my original work except for quotations and citations which have been duly acknowledged. I also declare that it has not been previously or concurrently submitted for any other degree at Universiti Putra Malaysia or other institutions.
IING LUKMAN
Date: 13 July 2007
xiv
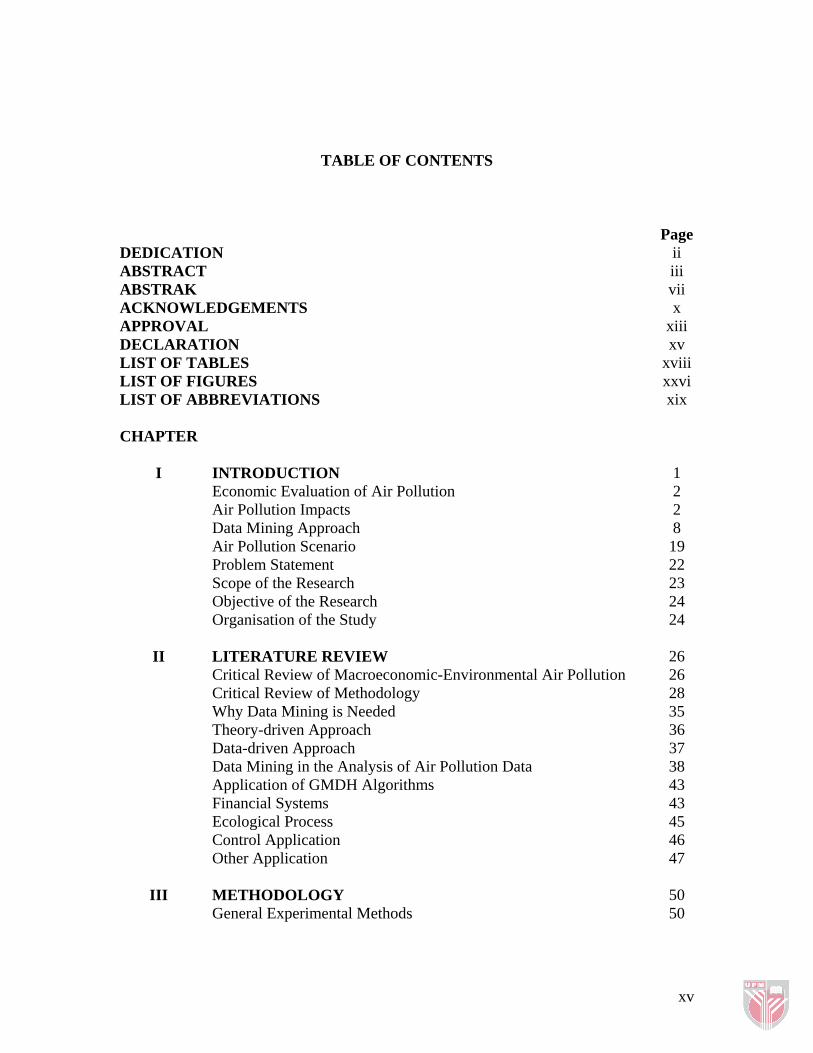
TABLE OF CONTENTS
DEDICATION ABSTRACT ABSTRAK ACKNOWLEDGEMENTS APPROVAL DECLARATION LIST OF TABLES LIST OF FIGURES LIST OF ABBREVIATIONS
Page ii iii vii x
xiii xv
xviii xxvi xix
CHAPTER
I INTRODUCTION 1 Economic Evaluation of Air Pollution 2 Air Pollution Impacts 2 Data Mining Approach 8 Air Pollution Scenario 19 Problem Statement 22 Scope of the Research
Objective of the Research Organisation of the Study
23 24 24
II LITERATURE REVIEW Critical Review of Macroeconomic-Environmental Air Pollution
26 26
Critical Review of Methodology 28 Why Data Mining is Needed 35 Theory-driven Approach 36 Data-driven Approach 37 Data Mining in the Analysis of Air Pollution Data Application of GMDH Algorithms
38 43
Financial Systems 43 Ecological Process 45 Control Application 46 Other Application
47
III METHODOLOGY General Experimental Methods
50 50
xv

The Steps of Research Methodology in Data Mining Data Selection
52 52
Data Cleansing 54 EM Algorithm for Data with Missing Values 55 Hot-deck Imputation 57 Data Enrichment and Coding 59 Data Mining Process 59 Variables for Computation from Nationamaster.com Data Result Interpretation and Validation
61 66
Incorporation of the Discovered Knowledge 66 Report Writing 66 Group Method of Data Handling (GMDH) 69 The Steps of the GMDH Algorithm 71 Sorting of Models by Groups of Equal Structure 76 External and Internal criteria 76 Physical and Nonphysical Models 77 Deductive and Inductive GMDH Algorithms 78 The problem of Identifying Physical Laws 79 Identify Laws for Noisy Data and Short Samples 81 Basis of the Multilayered Theory of Statistical Decision 83 Normative vector Forecasting for Macroeconomic System 83 Mining Association Rules with Multiple Minimum Supports 94 The Extended Model 98
Mining Large Itemsets with Multiple MISs 100 Downward Closure Property 100 The Algorithm 101 Algorithm MSapriori 103 Candidate Generation 105 Correctness of level2-candidate-gen 105 Subset Function 108 Rule Generation 109 Association Rule Generation Algorithm 109 Problems and Solutions 111 Algorithm New MSapriori 113 Application to Real-Life Data
Related Work 114 114
IV RESULTS AND DISCUSSION 116
Chapter Overview 116 GMD Computation from Nationmaster.com Data 117
GNI Model Development 117 Urban SO2 Concentration Model Development 127 Debt of the Countries Model Development 159 The Stepwise Procedure 168 Corruption Index Model Development 179 GMDH Computation from WDI 2003 Data 186
xvi

Develop Under 5 Years old Mortality Rate Model Computation 186 The Stepwise Procedure 192 CO2 Emission Per Capita Model Development
Stepwise Procedure Classification Rules of WDI 2003
200 207 215
Results for Single Support 218 Classification Rules from nationmaster.com data set
Discussion and Policy 222 228
Discussion 228 Advantage of Data Mining Techniques 230 Policies
233
V CONCLUSION 239
BIBLIOGRAPHY 246 APPENDICES 257 BIODATA OF THE AUTHOR 323
xvii
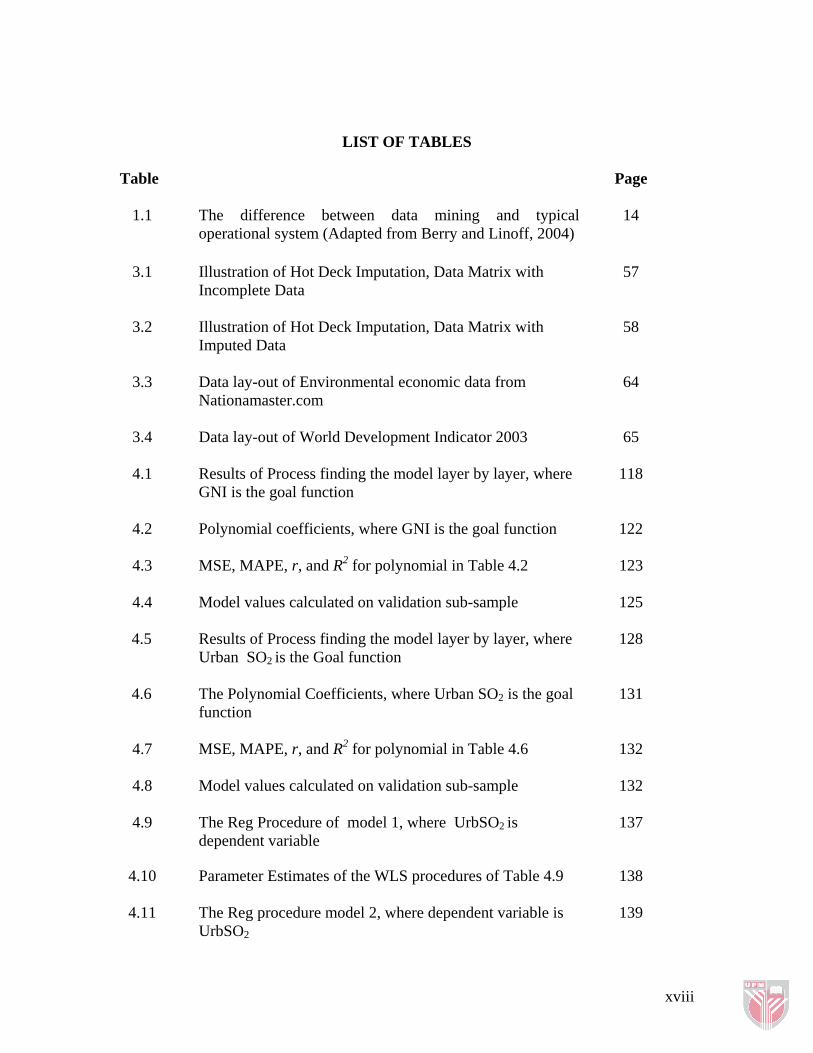
LIST OF TABLES
Table Page
1.1 The difference between data mining and typical operational system (Adapted from Berry and Linoff, 2004)
14
3.1 Illustration of Hot Deck Imputation, Data Matrix with Incomplete Data
57
3.2 Illustration of Hot Deck Imputation, Data Matrix with Imputed Data
58
3.3 Data lay-out of Environmental economic data from Nationamaster.com
64
3.4 Data lay-out of World Development Indicator 2003 65
4.1 Results of Process finding the model layer by layer, where GNI is the goal function
118
4.2 Polynomial coefficients, where GNI is the goal function 122
4.3 MSE, MAPE, r, and R2 for polynomial in Table 4.2 123
4.4 Model values calculated on validation sub-sample 125
4.5 Results of Process finding the model layer by layer, where Urban SO2 is the Goal function
128
4.6 The Polynomial Coefficients, where Urban SO2 is the goal function
131
4.7 MSE, MAPE, r, and R2 for polynomial in Table 4.6 132
4.8 Model values calculated on validation sub-sample 132
4.9 The Reg Procedure of model 1, where UrbSO2 is dependent variable
137
4.10 Parameter Estimates of the WLS procedures of Table 4.9 138
4.11 The Reg procedure model 2, where dependent variable is UrbSO2
139
xviii

4.12 Parameter Estimates of the WLS procedures of Table 4.11 139
4.13 The Reg procedure model 3, where dependent variable is: UrbSO2
140
4.14 Parameter Estimates of the WLS procedure of Table 4.13 139
4.15 The Regression procedure model 4, where dependent variable is UrbSO2
141
4.16 Parameter Estimates of the WLS procedure of Table 4.15 140
4.17 Stepwise Procedure of Maximum R-Square Improvement: Step 1
144
4.18 Parameter Estimates of Table 4.16, where Urban SO2 concentration is the dependent variable
145
4.19 Stepwise Procedure of Maximum R-Square Improvement: Step 2
145
4.20 Parameter Estimates of Table 4.19, where Urban SO2 concentration is the dependent variable
146
4.21 Stepwise Procedure of Maximum R-Square Improvement: Step 3
145
4.22 Parameter Estimates of Table 4.21, where Urban SO2 concentration is the dependent variable
147
4.23 Stepwise Procedure of Maximum R-Square Improvement: Step 4
146
4.24 Parameter Estimates of Table 4.23, where Urban SO2 concentration is the dependent variable
148
4.25 Stepwise Procedure of Maximum R-Square Improvement: Step 5
148
4.26 Parameter Estimates of Table 4.25, where Urban SO2 concentration is the dependent variable
149
4.27 Stepwise Procedure of Maximum R-Square Improvement: Step 6
150
4.28 Parameter Estimates of Table 4.27, where Urban SO2 concentration is the dependent variable
151
xix

4.29 Stepwise Procedure of Maximum R-Square Improvement:
Step 7
151
4.30 Parameter Estimates of Table 4.29, where Urban SO2 concentration is the dependent variable
152
4.31 Stepwise Procedure of Maximum R-Square Improvement: Step 8
152
4.32 Parameter Estimates of Table 4.31, where Urban SO2 concentration is the dependent variable
152
4.33 Stepwise Procedure of Maximum R-Square Improvement: Step 9
154
4.34 Parameter Estimates of Table 4.33, where Urban SO2 concentration is the dependent variable
155
4.35 Stepwise Procedure of Maximum R-Square Improvement: Step 10
155
4.36 Parameter Estimates of Table 4.35, where Urban SO2 concentration is the dependent variable
156
4.37 Stepwise Procedure of Maximum R-Square Improvement: Step 11
156
4.38 Parameter Estimates of Table 4.37, where Urban SO2 concentration is the dependent variable
157
4.39 Stepwise Procedure of Maximum R-Square Improvement: Step 30
158
4.40 Parameter Estimates of Table 4.39, where Urban SO2 concentration is the dependent variable
159
4.41 Results of Process finding the model layer by layer, where Debt of the countries is the Goal function
160
4.42 The Polynomial Coefficients, where debt is the goal function
164
4.43 MSE, MAPE, r, and R2 for polynomial in Table 4.42 166
4.44 Model values calculated on validation subsample 167
xx

4.45 Stepwise Procedure of Maximum R-Square Improvement: Step 3
169
4.46 Parameter Estimates of Table 4.45, where Debt is the dependent variable
170
4.47 Stepwise Procedure of Maximum R-Square Improvement: Step 4
170
4.48 Parameter Estimates of Table 4.47, where Debt is the dependent variable
171
4.49 Stepwise Procedure of Maximum R-Square Improvement: Step 5
171
4.50 Parameter Estimates of Table 4.49, where Debt is the dependent variable
172
4.51 Stepwise Procedure of Maximum R-Square Improvement: Step 6
172
4.52 Parameter Estimates of Table 4.51, where Debt is the dependent variable
173
4.53 Stepwise Procedure of Maximum R-Square Improvement: Step 7
174
4.54 Parameter Estimates of Table 4.53, where Debt is the dependent variable
175
4.55 Stepwise Procedure of Maximum R-Square Improvement: Step 8
175
4.56 Parameter Estimates of Table 4.55, where Debt is the dependent variable
176
4.57 Stepwise Procedure of Maximum R-Square Improvement: Step 9
176
4.58 Parameter Estimates of Table 4.57, where Debt is the dependent variable
177
4.59 Stepwise Procedure of Maximum R-Square Improvement: Step 10
178
xxi

4.60 Parameter Estimates of Table 4.59, where Debt is the dependent variable
179
4.61 Results of Process finding the model layer by layer: Corruption Index of the countries as the Goal function
180
4.62 Polynomial coefficients of Table 4.61
183
4.63 MSE, MAPE, r, and R2 for polynomial in Table 4.62
184
4.64 Model values calculated on validation subsample 185
4.65 Results of Process finding the model layer by layer: Children under five years old mortality rate of the countries as the Goal function
187
4.66 Polynomial coefficients of Table 4.65 189
4.67 MSE, MAPE, r, and R2 for polynomial in Table 4.66
189
4.68 Model values calculated on validation subsample 191
4.69 Stepwise Procedure of Maximum R-Square Improvement: Step 5
193
4.70 Parameter Estimates of Table 4.69, where Under-five years old mortality rate is the dependent variable
194
4.71 Stepwise Procedure of Maximum R-Square Improvement: Step 6
194
4.72 Parameter Estimates of Table 4.71, where Under-five years old mortality rate is the dependent variable
195
4.73 Stepwise Procedure of Maximum R-Square Improvement: Step 7
195
4.74 Parameter Estimates of Table 4.73, where Under-five years old mortality rate is the dependent variable
196
4.75 Stepwise Procedure of Maximum R-Square Improvement: Step 14
197
4.76 Parameter Estimates of Table 4.75, where Under-five years old mortality rate is the dependent variable
198
xxii
4.77 Stepwise Procedure of Maximum R-Square Improvement: Step 31
198
4.78 Parameter Estimates of Table 4.77, where Under-five years old mortality rate is the dependent variable
200
4.79 Results of Process finding the model layer by layer: CO2 emission Per capita as Goal function
201
4.80 Polynomial coefficients of Table 4.79
204
4.81 MSE, MAPE, r, and R2 for polynomial in Table 4.80
205
4.82 Stepwise Procedure of Maximum R-Square Improvement: Step 3
207
4.83 Parameter Estimates of Table 4.82, where CO2 emission per capita is the dependent variable
208
4.84 Stepwise Procedure of Maximum R-Square Improvement: Step 9
208
4.85 Parameter Estimates of Table 4.84, where CO2 emission per capita is the dependent variable
210
4.86 Stepwise Procedure of Maximum R-Square Improvement: Step 16
210
4.87 Parameter Estimates of Table 4.86, where CO2 emission per capita is the dependent variable
211
4.88 Stepwise Procedure of Maximum R-Square Improvement: Step 56
212
4.89 Parameter Estimates of Table 4.88, where CO2 emission per capita is the dependent variable
213
4.90 Mining Classification Rules from WDI 2003 Data set with number of training case is 205 with multiple supports.
216
4.91 Mining Classification Rules from WDI 2003 Data set with number of training case is 205 with single support.
219
4.92 Interesting itemset rules generated from mining association rules WDI 2003 data set out of 1865 itemset rules : MinSup:10.000%, MinConf:50.000% RuleLimit : 80000
221
xxiii

LevelLimit : 4. NumTrainingCase= 205
4.93 Important Classification Rule mined from nationamaster data set, the Rules are generated at : MinSup:10.000%, MinConf:50.000% RuleLimit : 80000 LevelLimit : 6
222
4.94 Interesting itemsets rules generated from association rule mining for nationmaster data set from 929 rules generated. The Rules are generated at : MinSup:10.000%, MinConf:50.000% RuleLimit : 80000 LevelLimit : 4. NumTrainingCase== 95
223
xxiv