Embed Size (px)
Citation preview
UNIVERSITI PUTRA MALAYSIA
NUR ZALIKHA REBITANIM
FK 2013 106
CARBON DIOXIDE ADSORPTION ON BIOCHARS PRODUCED AT DIFFERENT TEMPERATURES
© COPYRIG
HT UPM
CARBON DIOXIDE ADSORPTION ON BIOCHARS PRODUCED AT DIFFERENT
TEMPERATURES
By
NUR ZALIKHA REBITANIM
Thesis Submitted to the School of Graduate Studies, Universiti Putra Malaysia, in Fulfillment of the Requirement for the Degree of Master of
Science
JULY 2013
© COPYRIG
HT UPM
COPYRIGHT
All material contained within the thesis, including without limitation text, logos, icons, photographs and all other artwork, is copyright material of Universiti Putra Malaysia unless otherwise stated. Use may be made of any material contained within the thesis for non-commercial purposes from the copyright holder. Commercial use of material may only be made with the express, prior, written permission of Universiti Putra Malaysia.
Copyright © Universiti Putra Malaysia

© COPYRIG
HT UPM
DEDICATIONS
To Rebitanim Idris, Rozina Zainol, Azman Shah, my
family, supervisors and friends.
© COPYRIG
HT UPM
ii
Abstract of the thesis presented to the Senate of Universiti Putra Malaysia in fulfillment of the requirement for the degree of Master of Science
CARBON DIOXIDE ADSORPTION ON BIOCHARS PRODUCED AT DIFFERENT TEMPERATURES
By
NUR ZALIKHA REBITANIM July 2013
Chairman: Wan Azlina Wan Abdul Karim Ghani, PhD
Faculty: Engineering
Biochar has been acknowledged for its unique property which makes it a potential candidate for carbon dioxide adsorbent in soil and adsorbent for carbon dioxide (CO2) in the flue gas system. Although there is a wide range of feedstock and techniques available for biochar production, there have been limited reports on the correlation of its properties by different production method with the effectiveness of the biochar for CO2 adsorption. In this study, the properties of several biochar produced at different temperatures (ranging from 450 to 850°C) from gasification and pyrolysis are being compared. Physiochemical characterization has been performed to characterize the biochar properties. Fourier transform infrared spectroscopy (FTIR) and scanning electron microscopy (SEM) were used to evaluate the functional groups and surface morphology of the biochar. Thermogravimetric analyzer (TGA) was used to discover the thermal properties, reactivity during adsorption and kinetic analysis with carbonation model. The biochar are chemically treated with monoethanolamine (MEA) and the adsorption capacity of raw and amine treated biochar are being compared. During the adsorption study, it was observed that raw sawdust pyrolyzed at 850°C and amine treated coconut shell gasified at 800°C gave the highest adsorption of 47.48 and 35.57mgCO2/g sorbent at temperature of 30°C. For adsorption temperature at 70°C, commercialized activated carbon and amine treated coconut shell gave adsorption values of 34.36 and 35.496mgCO2/g accordingly. CO2 adsorption may happen at two different phases whereby physisorption occurs at lower temperature of less than 50°C and physisorption coupled with chemisorption reactions takes place at higher temperature range. The CO2 chemisorption is a complex reaction that is further complicated by heterogeneity of the biochar surface. Although the adsorption capacity may be associated with the surface area of sample, this statement can be further studied whereby

© COPYRIG
HT UPM
iii
samples with low surface area have higher adsorption compared with higher surface area. The presence of some functional groups such as carboxylic acids, quinones and ketones may contribute in the effectiveness of CO2 chemisorption. Nitrogen functionalities and the basicity of samples increased after the amine treatment and is said to assist the adsorption capacity. However its presence does not necessarily increases the CO2 uptake where all treated biochar except coconut shell gives low values of CO2 uptake as compared to raw samples at temperature of 70°C. Therefore the effectiveness of the CO2 adsorption may not only be contributed by the value of the surface area but also the chemical functionalities that appear after the production process and amine treatment. Saturated adsorption model provides a fundamental analysis of the dominant process of each adsorbent. In this study, all biochar has dominant product layer diffusion regime. The product layer diffusion control gives values of 85-99% ultimate adsorption. This may indicate that the CO2 gas has saturated the reacting particle at which the adsorption of CO2 takes place. Therefore the adsorption requires more time to reach its ultimate conversion. Overall, all the objectives has been satisfied and it can be said that biochar has the potential to be used as adsorbent for CO2 and the ability is comparable to the commercial activated carbon. Therefore it is suitable to be applied in industry particularly flue gas system for CO2 adsorption.
© COPYRIG
HT UPM
iv
Abstrak tesis ini dikemukakan kepada Senat Universiti Putra Malaysia
sebagai memenuh ikeperluan untuk ijazah Master Sains
PENJERAPAN KARBON DIOKSIDA DARIPADA BIOCHAR YANG DIHASILKAN PADA SUHU BERBEZA
Oleh
NUR ZALIKHA REBITANIM Julai 2013
Pengerusi: Wan Azlina Wan Abdul Karim Ghani, PhD
Fakulti: Kejuruteraan
Biochar telah diakui berpotensi untuk menjerap karbon dioksida (CO2) di dalam dalam sistem gas. Walaupun pelbagai bahan mentah dan teknik tersedia untuk pengeluaran biochar, hanya terdapat laporan terhad pada korelasi ciri-ciri penjerap dari kaedah penghasilan yang berbeza dengan keberkesanan biochar untuk mensekuester CO2. Dalam kajian ini, sifat biochar yang dihasilkan pada suhu yang berbeza (antara 450-850°C) daripada penggegasan dan pirolisis dibandingkan. Pencirian fisiokimia telah dilakukan untuk mencirikan sifat biochar. Spektroskopi Inframerah Transformasi Fourier (FTIR) dan Mikroskop Elektron Imbasan (SEM) telah digunakan untuk menilai kumpulan berfungsi dan morfologi permukaan biocha. Penganalisis Termogravimetri (TGA) telah digunakan untuk menemui sifat haba, kereaktifan semasa penjerapan dan analisis kinetik dengan model penjerapan tepu. Biochar dirawat secara kimia dengan Monoethanolamine (MEA) dan kapasiti penjerapan karbon dioksida antara biochar mentah dan biochar yang telah dirawat dengan amine dibandingkan. Dalam kajian penjerapan, telah diperhatikan bahawa habuk kayu dipirolisis biochar mentah terhasil pada suhu 850°C dan tempurung kelapa terhasil pada 800°C dan dirawat dengan amine memberikan penjerapan tertinggi pada 47.48 dan 35.57mgCO2/g penjerap pada suhu 30°C. Untuk suhu penjerapan pada 70°C, karbon komersial dan tempurung kelapa dirawat dengan amine memberikan penjerapan sebanyak 34.36 dan 35.496mgCO2/g setiap satu. Penjerapan karbon dioksida berlaku pada dua fasa yang berbeza dimana fisiopenjerapan berlaku pada suhu yang lebih rendah iaitu kurang daripada 50°C dan physisorption bersama dengan reaksi chemisorption berlaku pada julat suhu yang lebih tinggi. Fisiokimia CO2 adalah reaksi kompleks yang rumit
© COPYRIG
HT UPM
v
melibatkan permukaan biochar yang heterogenitas. Walaupun kapasiti penjerapan boleh dikaitkan dengan kawasan permukaan sampel, kenyataan ini adalah kurang tepat di mana sampel dengan kawasan permukaan yang rendah mempunyai penjerapan lebih tinggi berbanding dengan kawasan permukaan yang lebih tinggi. Kehadiran beberapa kumpulan berfungsi seperti asid karboksilik, kuinon dan keton boleh menyumbang kepada keberkesanan CO2 fisiokimia. Fungsi nitrogen dan basicity sampel meningkat selepas rawatan amine dan dikatakan dapat meningkatkan kapasiti penjerapan. Walau bagaimanapun rawatan amine ini didapati tidak meningkatkan pengambilan CO2 di mana semua biochar dirawat kecuali tempurung kelapa memberi nilai rendah penjerapan CO2 berbanding kepada sampel mentah biochar pada suhu 70°C. Oleh itu, keberkesanan penjerapan CO2 mungkin tidak hanya dipengaruhi oleh nilai kawasan permukaan tetapi juga fungsi kimia yang muncul selepas proses pengeluaran dan rawatan amine. Model penjerapan tepu menyediakan analisis tentang proses domina yang terjadi bagi setiap sampel penjerap. Dalam kajian ini, semua sampel biochar mempunyai proses produk lapisan menyerap yang domina iaitu pada 85-99% transformasi. Ini mungkin menandakan bahawa gas CO2 telah tepu di permukaan teras di mana penjerapan CO2 berlaku. Oleh itu penjerapan mengambil masa yang lebih untuk mencapai penjerapan maksimum. Secara keseluruhan, semua objektif telah dicapai dan biochar boleh dikatakan mempunyai potensi untuk digunakan sebagai penjerap menjerap CO2 dan keupayaan adalah setanding dengan karbon komersil. Oleh itu, ia adalah sesuai untuk diaplikasikan dalam industri sistem gas.

© COPYRIG
HT UPM
vi
ACKNOWLEDGEMENTS
First and foremost I offer my sincerest gratitude to my supervisor, Associate Professor Dr. Wan Azlina Wan Abdul Karim Ghani, who has given me invaluable guidance and advice throughout my research. Her scholarly guidance, sound advice, teaching, good company and suggestions have provided a good basis for the present thesis. In addition, I would like to thank Dr. Mohamad Amran and Associate Professor Dr. Suzana Yusup for their role as my co-supervisors for their encouragement and personal guidance. My appreciation also goes to the entire staff of Department of Chemical and Environmental Engineering, UPM. Appreciation also goes out to my friends for their support and caring throughout my academic career. My warm regards to my fellow research group members for their support and friendly approach. I would like to thank all who in any way have helped to make my master degree a success. This research journey would not have been successful without the ultimate moral support from my adoring family, my mother, Rozina Zainol and father, Rebitanim Idris. They raised me, supported me, taught me, and loved me. My loving thanks to my husband, brother and sister. To them I dedicate this thesis.

© COPYRIG
HT UPM
ix
This thesis was submitted to the Senate of Universiti Putra Malaysia and has been accepted as fulfillment of the requirement for the degree of Master of Science. The members of the Supervisory Committee were as follows:
Wan Azlina Wan Abdul Karim Ghani, PhD
Associate Professor Faculty of Engineering Universiti Putra Malaysia (Chairman) Mohamad Amran Mohd Salleh, PhD
Senior Lecturer Faculty of Engineering Universiti Putra Malaysia (Member) Suzana Yusup, PhD Associate Professor Faculty of Chemical Engineering Universiti Teknologi PETRONAS (Member)
BUJANG BIN KIM HUAT, PHD
Professor and Dean School of Graduate Studies Universiti Putra Malaysia Date:
© COPYRIG
HT UPM
x
DECLARATION
I declare that the thesis is my original work except for quotations and citations which have been duly acknowledged. I also declare that it has not been previously, and is not concurrently, submitted for any other degree at Universiti Putra Malaysia or at any other institutions.
NUR ZALIKHA REBITANIM
Date: 31 July 2013
© COPYRIG
HT UPM
xi
TABLE OF CONTENTS Page ABSTRACT ii ABSTRAK iii DEDICATIONS i ACKNOWLEDGEMENTS vi APPROVAL vii DECLARATION x
LIST OF TABLES xiii LIST OF FIGURES xiv LIST OF ABBREVIATION AND ACRONYMS xiii
CHAPTER 1
1 INTRODUCTION 1
1.1 Background 1
1.2 Problem Statement 3 1.3 Research Objectives 4
1.4 Scope of Research 4 1.5 Thesis Layout 4
2 LITERATURE REVIEW 5
2.1 Global climate change issues 5
2.2 Availability of biomass in Malaysia 7 2.3 Biochar 8
2.4 Adsorptive properties 14 2.4.1 Physisorption Analysis 14
2.4.2 Functional groups 16 2.4.3 Nitrogen content and pH values 23
2.4.4 Surface morphology 26 2.5 Carbon dioxide adsorption 29
2.6 Saturated Adsorption Model 34 2.7 Chapter summary 37
3 METHODOLOGY 39
3.1 Chapter Overview 39
3.2 Raw and amine treated biochar preparation 41 3.3 Material characterizations 41
3.3.1 Brunauer-Emmett-Teller (BET) surface area 41 3.3.2 Proximate and Ultimate Analysis 42
3.3.3 Fourier Transform Infrared Spectroscopy (FTIR) Spectral Analysis 42
3.3.4 Scanning Electron Microscopy (SEM) Analysis 42 3.3.5 Physisorption Analyzer 42
3.5 CO2 Adsorption Study onto biochar 43 3.6 Saturated Adsorption Model of biochar 44
3.7 Chapter Summary 44
© COPYRIG
HT UPM
xii
4 RESULTS AND DISCUSSIONS 45
4.1 Chapter Overview 45 4.2 Material characterization 45
4.2.1 Proximate and Ultimate Analysis 46 4.2.2 Scanning Electron Microscopy (SEM) Analysis 49
4.2.3 Physisorption Analysis 52 4.3 CO2 Adsorption-Desorption Study onto biomass-derived biochar 53
4.3.1 Adsorption Behavior of Biomass derived Biochar 53
4.3.2 Effects of temperature during adsorption 55 4.4 Comparison of biochar properties with different performances 4.4.1 Surface area, pore volume and pore sizes 56
4.4.2 Functional groups 62
4.4.3 Nitrogen content and pH values 70 4.5 Saturated adsorption model 71
4.6 Economic of Scale 77 4.7 Chapter Summary 79
CONCLUSIONS AND RECOMMENDATIONS 81
REFERENCES 83 APPENDICES 95
BIODATA OF STUDENT 108 LIST OF PUBLICATIONS 109
© COPYRIG
HT UPM
xiii
LIST OF TABLES
Table Page
2.1 Current and emerging technologies for CO2 capture in post combustion capture
6
2.2a Feedstock amount of pyrolysis and gasification process 12 2.2b Elemental composition of conocarpus wastes biochar 14 2.3 Surface Area, Pore Size, and Pore Volume of commercial and
modified 13X Zeolite 15
2.4 Comparison of adsorption capacities of commercial and modified 13X Zeolite
15
2.5 The surface area and pore volume of raw and aminated almond shells 15 2.6 Chemical and textural characterization of the aminated olive stones
and CO2 capture capacity at 25 and 100 °C in pure CO2 16
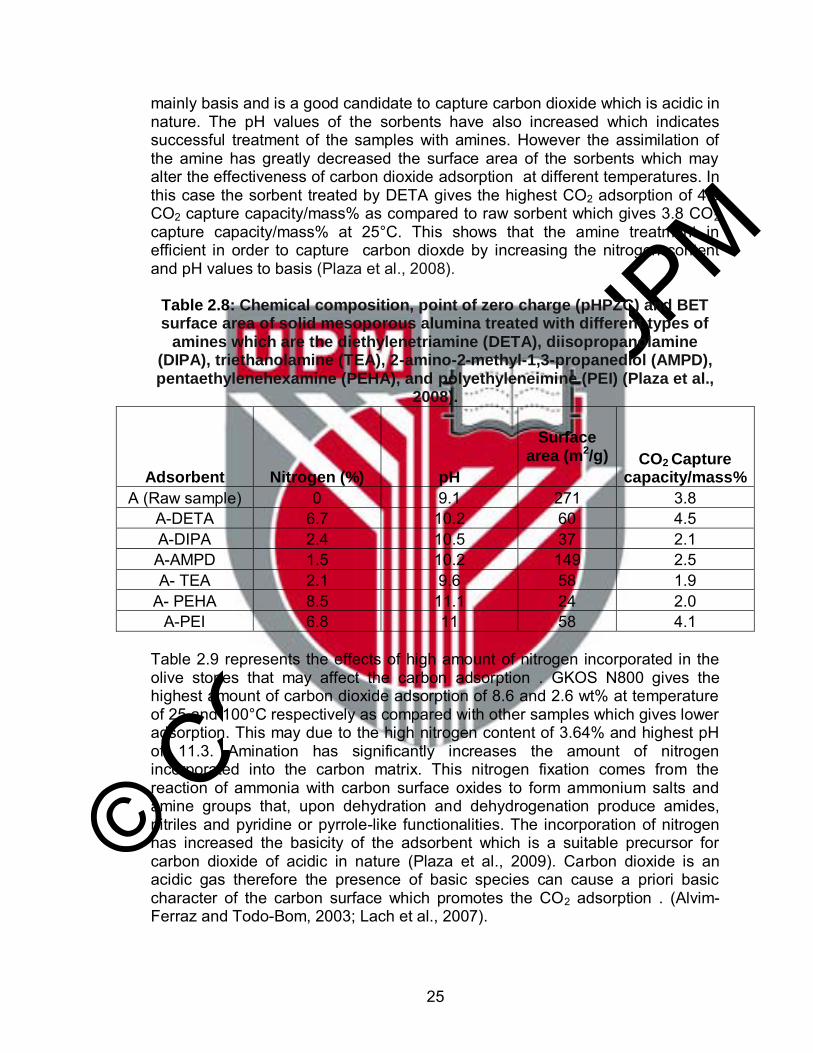
2.7 Wave number assignments for different functional groups 18 2.8 Chemical composition, point of zero charge (pHPZC) and BET surface
area of solid mesoporous alumina treated with different types of amines which are the diethylenetriamine (DETA), diisopropanolamine (DIPA), triethanolamine (TEA), 2-amino-2-methyl-1,3-propanediol (AMPD), pentaethylenehexamine (PEHA), and polyethyleneimine (PEI)
25
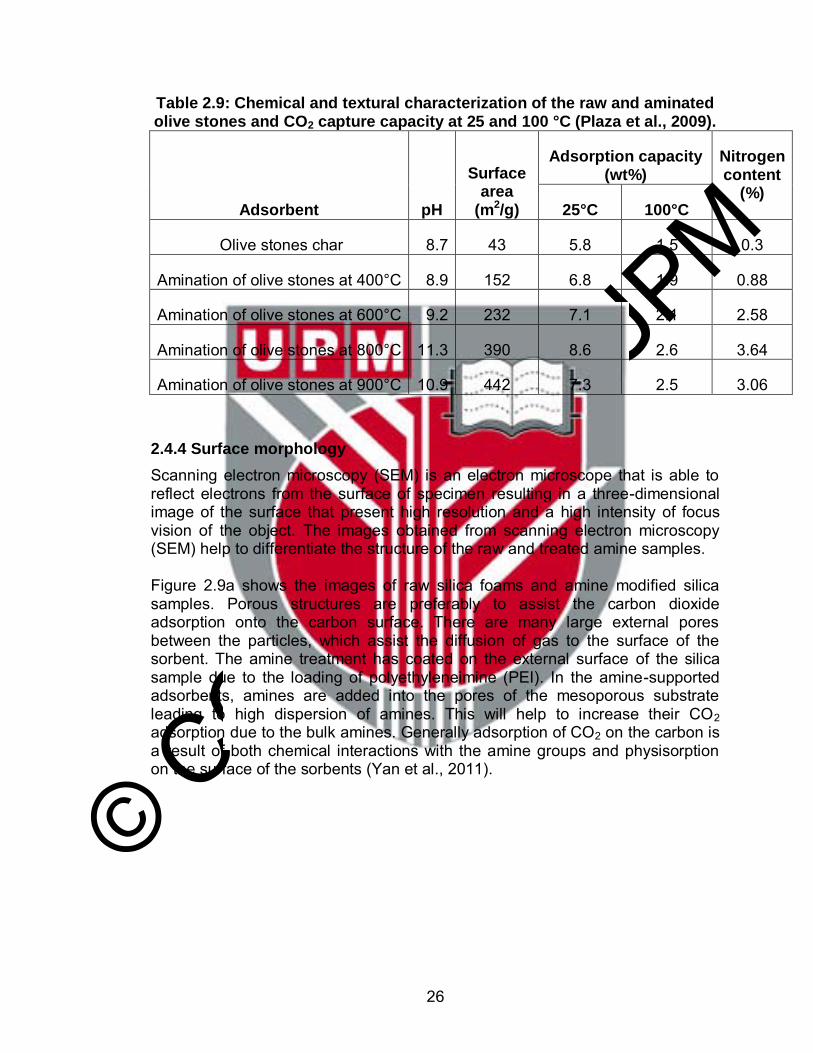
2.9 Chemical and textural characterization of the raw and aminated olive stones and CO2 capture capacity at 25 and 100 °C
26
2.10 Carbon dioxide adsorption data on different types of adsorbents. 31 3.1 The production temperatures of different types of biochar 41 4.1 The ultimate analyses of raw and amine treated biochar. 46
4.2a The surface area, CHNO contents and pH of raw and amine treated palm kernel shell, coconut shell, rice husk and sawdust biochar.
47
4.2b The amine weight percentage incorporated in biochar samples after amine treatment.
48
4.3 The ultimate analyses of biochar 52 4.4 Adsorption of carbon dioxide at temperature of 30°C. 54 4.5 Adsorption of carbon dioxide at temperature of 70°C. 54 4.6 Summary of the group functinality of the biochar samples. 70 4.8 Analysis of the saturated adsorption model for raw and treated biochar 75 4.9 Regression values, R2 of the saturated adsorption model for raw and
treated biochar 76
4.10 Amount of CO2 captured by using 1 kg of adsorbent 78
© COPYRIG
HT UPM
xiv
LIST OF FIGURES
Figure Page 1.1 Concentration of CO2 in the atmosphere 1 2.1 Biomass residues produced from various industries in Malaysia 7 2.2 Generation of products from oil mill production 8 2.3 Summary of thermal process in relation to their biomass feedstock
and applications 10
2.4a A closed 200kg steel barrel kiln in Institute of Advanced
Technology (ITMA), University Putra Malaysia 11
2.4b Illustration of pyrolysis, gasification, and combustion process by using a flaming match
11
2.4c Physical and microscopic structure of wood –derived biochar 13 2.5 DRIFT spectra of raw sample (N) and commercial activated carbon
Norit CGP Super treated with Diethylentriamine (DETA), Pentaethylenehexamine (PEHA) and Polyethylenimine (PEI)
19
2.6 FTIR transmission spectra of virgin palm shell-based activated carbon and carbon molecular basket (CMB) via impregnation of polyethyleneimine (PEI) at different concentrations
20
2.7 FTIR spectra of the raw and amine-attached MCM-48 silica of aminopropyl, pyrrolidinepropyl, polymerized aminopropyl and polyethyleneimine-attached MCM-48 samples are referred to as APS-, PyrPS-, and p-APS –MCM-48 respectively
21
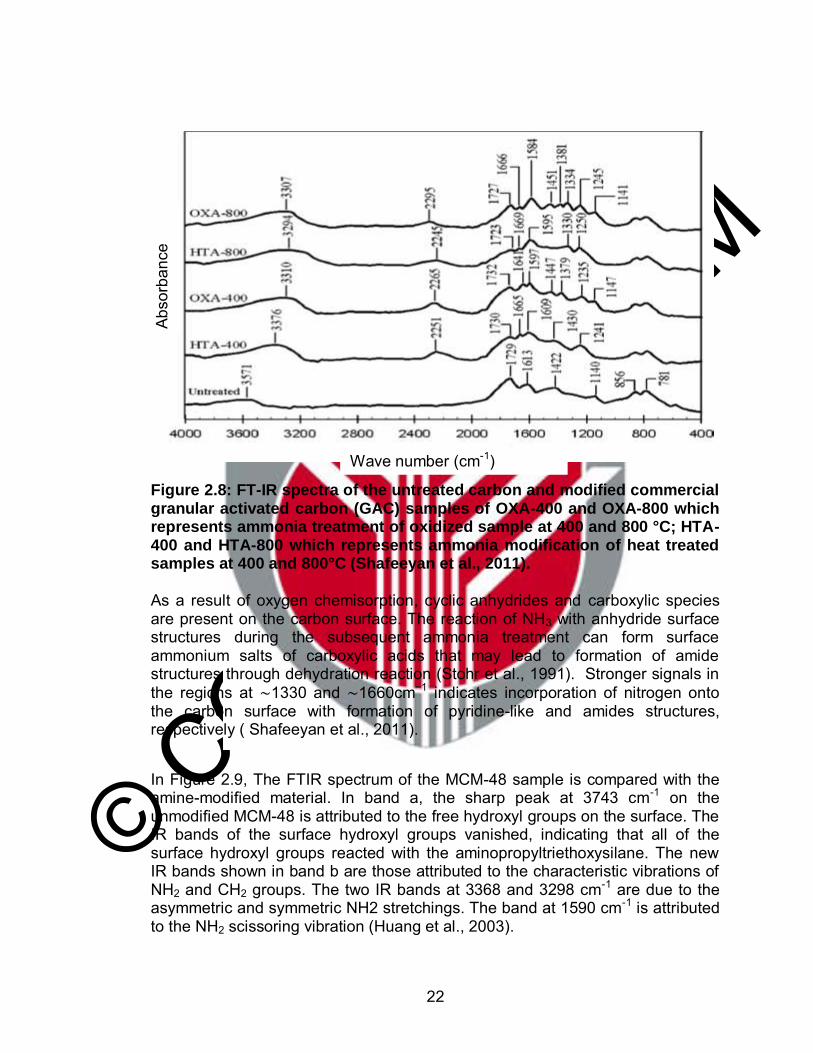
2.8 FT-IR spectra of the untreated carbon and modified commercial granular activated carbon (GAC) samples of OXA-400 and OXA-800 which represents ammonia treatment of oxidized sample at 400 and 800 °C; HTA-400 and HTA-800 which represents ammonia modification of heat treated samples at 400 and 800°C
22
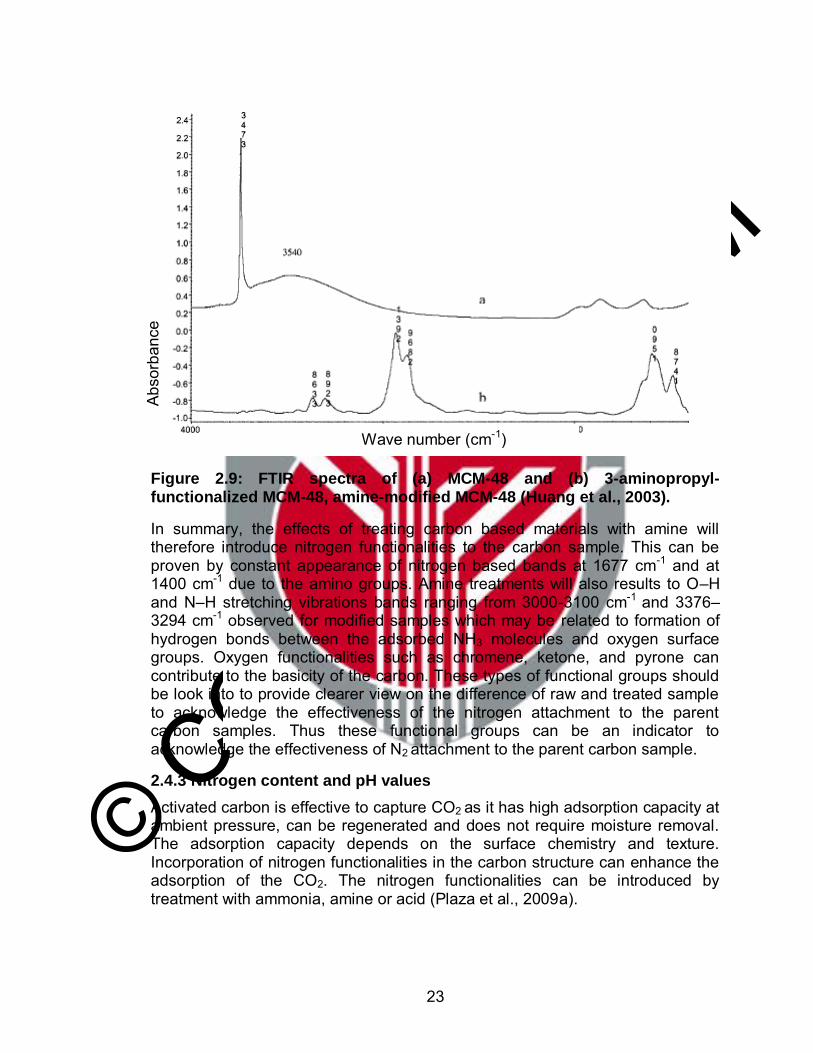
2.9 FTIR spectra of (a) MCM-48 and (b) 3-aminopropyl-functionalized MCM-48, amine-modified MCM-48
23
2.9a SEM images of (a) raw silica foams and (b) amine modified silica samples
27
2.10 SEM images of eucaliptus sawdust (a) and (b) eucaliptus sawdust biochar
27
2.11 SEM images of (a) eucalyptus sawdust, (b) hydrochar -starch, (c) hydrochar -cellulose and (d) hydrochar -sawdust
28
2.12 SEM images of: (a) dried spent coffee grounds, (b) char carbonized at 673K, (c) char carbonized at 873K and (d) carbon activated with potassium hydroxide (KOH)
29
2.13 Plot of 1/X versus 1/t using conversion data of (A) (Bhatia and Perlmutter, 1983) and (B) (Gupta and Fan, 2002), in the gas diffusion control and chemical reaction control regime
36
3.1 Flowchart of overall process involved in the CO2 adsorption study 40 3.2 Experimental set up in the TGA for the adsorption-desorption study 43 4.1 SEM results of the raw and treated biochar 50 4.2 TGA plof for CO2 adsorption of the palm kernel biochar at 30°C. 53 4.3 Comparison on the adsorption of CO2 at temperature of 30°C 55

© COPYRIG
HT UPM
xv
4.4 Comparison on the adsorption of CO2 at temperature of 70°C 56 4.5 Surface area values for raw and treated biochar samples 57 4.6 Surface area values for biochar samples and adsorption values at
temperature 30 and 70°C 58
4.7 Pore volume of the raw and treated biochar samples 59 4.8 Pore sizes of raw and treated biochar samples 59 4.9 Pore sizes (nm) of the raw biochar and adsorption study at
temperature 30°C 60
4.10 Pore sizes (nm) of the treated biochar and adsorption study at temperature 30°C
60
4.11 Pore sizes (nm) of the raw biochar and adsorption study at temperature 70°C
61
4.12 Pore sizes (nm) of the treated biochar and adsorption study at temperature 70°C
62
4.13 FTIR spectra of (a) raw and (b) treated coconut shell biochar 63 4.14 FTIR spectra of (a) raw and (b) treated palm kernel shell biochar 64 4.15 FTIR spectra of (a) raw and (b) treated rice husk biochar 65 4.16 FTIR spectra of (a) raw and (b) treated sawdust 450°C biochar 66 4.17 FTIR spectra of (a) raw and (b) treated sawdust 750°C biochar 67 4.18 FTIR spectra of (a) raw and (b) treated sawdust 850°C biochar. 68 4.19 The pH difference of the raw and treated carbon samples 70 4.20 The difference of nitrogen contents of the raw and treated carbon
samples 71
4.21 Plot 1/X vs. 1/t with regions of chemical reaction control and the product layer diffusion control region.
72
4.22 Plot 1/X vs. 1/t for a) chemical reaction control region and b) product layer diffusion control region for coconut shell.
73
© COPYRIG
HT UPM
xvi
LIST OF ABBREVIATION AND ACRONYMS
TGA Thermogravimetric Analyzer FTIR Fourier Transform Infrared Spectroscopy BET Brunauer-Emmett-Teller SEM Scanning Electron Microscopy AC Activated carbon NAC Amine treated Activated carbon CS Coconut shell NCS Amine treated Coconut shell PKS Palm kernel shell NPKS Amine treated Palm kernel shell RH Rice Husk NRH Amine treated Rice Husk SD450 Sawdust 450°C NSD450 Amine treated Sawdust 450°C SD750 Sawdust 750°C NSD750 Amine treated Sawdust 750°C SD850 Sawdust 850°C NSD850 Amine treated Sawdust 850°C GHG Green House Gasses
© COPYRIG
HT UPM
1
CHAPTER 1 INTRODUCTION
1.1 Background
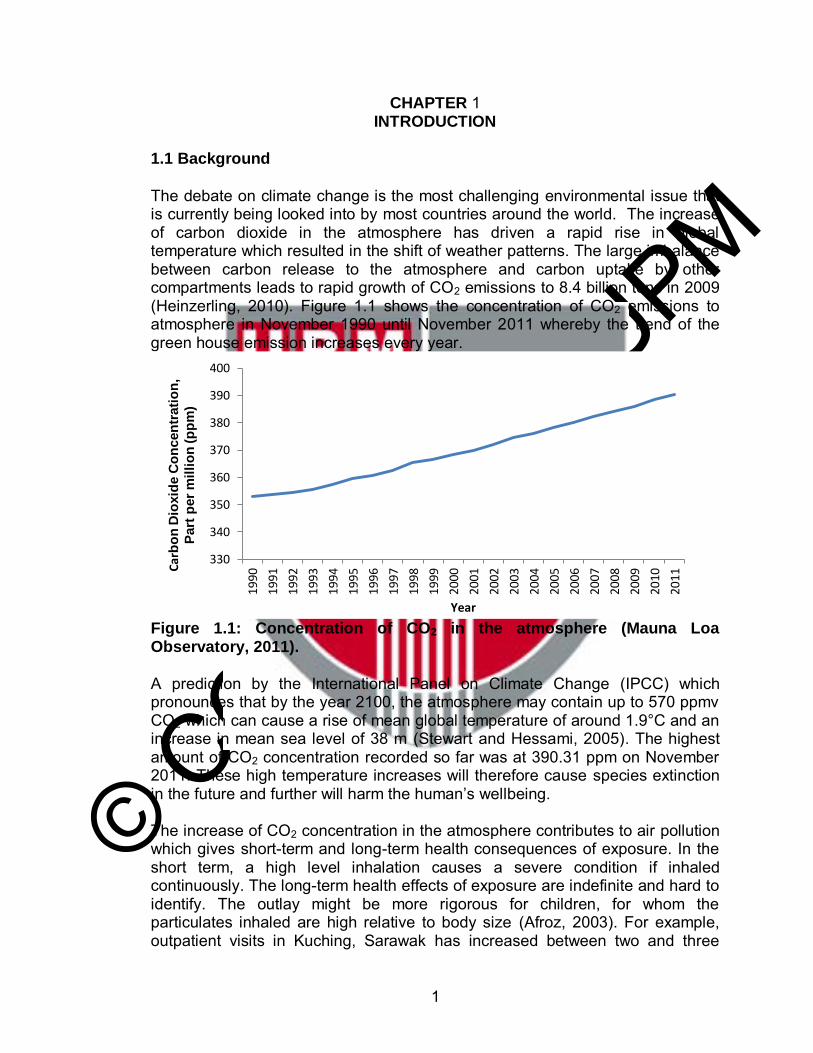
The debate on climate change is the most challenging environmental issue that is currently being looked into by most countries around the world. The increase of carbon dioxide in the atmosphere has driven a rapid rise in global temperature which resulted in the shift of weather patterns. The large imbalance between carbon release to the atmosphere and carbon uptake by other compartments leads to rapid growth of CO2 emissions to 8.4 billion tons in 2009 (Heinzerling, 2010). Figure 1.1 shows the concentration of CO2 emissions to atmosphere in November 1990 until November 2011 whereby the trend of the green house emission increases every year.
Figure 1.1: Concentration of CO2 in the atmosphere (Mauna Loa Observatory, 2011). A prediction by the International Panel on Climate Change (IPCC) which pronounces that by the year 2100, the atmosphere may contain up to 570 ppmv CO2 which can cause a rise of mean global temperature of around 1.9°C and an increase in mean sea level of 38 m (Stewart and Hessami, 2005). The highest amount of CO2 concentration recorded so far was at 390.31 ppm on November 2011. These high temperature increases will therefore cause species extinction in the future and further will harm the human’s wellbeing. The increase of CO2 concentration in the atmosphere contributes to air pollution which gives short-term and long-term health consequences of exposure. In the short term, a high level inhalation causes a severe condition if inhaled continuously. The long-term health effects of exposure are indefinite and hard to identify. The outlay might be more rigorous for children, for whom the particulates inhaled are high relative to body size (Afroz, 2003). For example, outpatient visits in Kuching, Sarawak has increased between two and three
330
340
350
360
370
380
390
400
1990
1991
1992
1993
1994
1995
1996
1997
1998
1999
2000
2001
2002
2003
2004
2005
2006
2007
2008
2009
2010
2011
Car
bo
n D
ioxid
e C
on
cen
trati
on
,
Part
per
mil
lio
n (p
pm
)
Year
© COPYRIG
HT UPM
2
times during the peak period of smoke haze and respiratory disease outpatient visits to Kuala Lumpur General Hospital increased from 250 to 800 per day in 1997 (World Health Organization, 1998). Assembled data indicated an increase of asthma, acute respiratory infection, and conjunctivitis cases during August–September 1997 at a number of major hospitals in Kuala Lumpur (Brauer and Jamal, 1998). Power generation and manufacturing industries are the main contributors to the green house gasses emission. Efforts have been executed that could benefit both parties in order to address this issue. The implementation of Kyoto protocol was foreseen to improve the climate change by execution of environmental policy and improving Clean Development Mechanism which allows countries to meet their obligations by helping developing countries in clean energy projects. Strict technical standards and rules were employed for the energy efficiency of buildings and vehicles. Incentives were also provided to encourage power companies to develop greenhouse gas efficient technologies. Supports were provided to improve the cost efficiency of carbon capture and storage technologies. Nevertheless these efforts were found to be ineffective in reducing the greenhouse gas emissions (Sohi, 2009). Therefore extensive studies were performed to find proficient techniques for CO2 adsorbent. Some of the alternatives that should be implemented to reduce the CO2 concentration in the atmosphere are by using renewable energy and non fossil fuels, reducing the energy intensity and improving the adsorption process of CO2 (Yang et al., 2008). In power generating plants, CO2 are removed from a diluted flue gas stream by using amine as solvent scrubbing for CO2 adsorbent. However the disadvantages of utilizing liquid amine are high maintenance costs, it requires a significant amount of utility consumption and problem with thermal efficiency losses due to the regeneration process. Mesoporous and microporous supported carbons and zeolites facilitate to enhance the uptake of CO2. There are currently many types of adsorbents that are used in the coal fired power plants for post combustion carbon dioxide capture. Zeolites provide regular pore structure but have low CO2 adsorption at high temperature (Siriwardane et al., 2005). Porous crystals has low energy requirement for regeneration, good thermal stability and low cost, however possess high selectivity of water (Arstad et al., 2007; Figueroa et al., 2008). Natural minerals such as limestone maintain a low cost except it has slow sorption rate Activated carbon has fine structure and provides good adsorption but is expensive in price (Ida and Lin, 2003). Therefore by analyzing the advantages and disadvantages of the current adsorbents that are currently being used, it is important to develop new cost saving and promising approach. A subject that is currently growing in interest is by utilizing biochar to capture the CO2 emission from fuel combustion sources. Biochar is foreseen to be a potentially good adsorbent as it has fine structure, stable low price and has suitable chemical properties (Garcia et al., 2011). The
© COPYRIG
HT UPM
3
utilization of biochar is considered a new discovery whereby very few studies have been performed to evaluate its mechanism to capture CO2. As a substitute to the physical solvent that is currently being employed in the post combustion system, adsorption using biochar that is treated with amine is a promising technology that offers potential energy savings with lower capital and operating costs. Solid adsorbents of biochar are foreseen to be able to capture CO2 via strong chemisorption interactions or by weak physical adsorption.
1.2 Problem Statement
It is important to develop new methods for CO2 adsorption in the flue gas system. Several studies have been performed to evaluate the uptake of the acid gas by the utilization of porous carbon (Kim et al., 2010), membranes (Chew et al., 2010; Wang et al., 2012), zeolites (Xu et al., 2009; Othman et al., 2006), silica gel (Leal et al., 1995) and aqueous solution (Mores et al., 2011; Rivera-Tinoco et al, 2010). The chemical incorporation of base and acid alter the properties of carbon and therefore modifies the capability of the adsorbent to adsorb CO2. One highly potential approach that is foreseen to reduce CO2 release in the atmosphere is by the utilization of biochar. Biochar adsorption seems to present the suitable approach for CO2 uptake mainly in the flue gas system and post combustion process. At present physical solvent such as amine base solvent are being employed in the system to capture CO2. The impregnation of amine onto activated carbon is being looked into to replace the current application as it is more cost saving and the adsorbent can be regenerated. Biochar is anticipated to be a suitable candidate to replace activated carbon and physical solvent as it has low price and can be easily obtained in bulk. It is usually generated as a byproduct from biomass through thermal process such as pyrolysis, gasification and combustion in producing energy. The conversion of biomass to biochar is able to solve the large volume of wastes and at the same time produce bio fuel to generate energy. In this paper, the abundant supply of biomass in Malaysia is utilized to produce biochar. Although there are numerous feedstock and techniques available to produce biochar, very few works have been reported on the mechanisms of biochar properties significant to CO2 adsorption. The adsorption capacity of the biochar onto CO2 is evaluated by using thermogravimetric analyzer (TGA). In this study, six types of biochar which are coconut shell, palm kernel shell, rice husk and sawdust produced at three different temperatures were investigated. The adsorption study consists of raw and amine treated biochar. The biochar were residues from the gasification and pyrolysis process.
© COPYRIG
HT UPM
4
1.3 Research Objectives
The objectives of the project are: 1. To characterize and evaluate physiochemical properties of prepared
biomass-derived biochar such as the surface morphology, surface area, functional groups and ultimate properties (C, H, N, S) using various analytical instruments.
2. To investigate and compare the reactivity of untreated biochar samples and amine treated biochar samples in carbon dioxide adsorption using thermogravimetric analysis (TGA).
3. To perform and evaluate the saturated adsorption model of biochar to capture carbon dioxide.
1.4 Scope of Research
The scope of research of the project is to prepare amine treated biochar and raw biochar-adsorbent from palm kernel shell, coconut shell, rice husk and sawdust biomass. The biochar were then tested by using TGA to understand the mechanism of CO2 chemisorption and physisorption of biochar materials. Fundamental questions regarding adsorption process will be examined, in particular the stability of the carbon- CO2 complexes. It is expected that the multi-scale characterizations and the CO2 adsorption study of these biochar samples will provide new insight into the mechanisms of biochar formation and its ability as CO2 adsorbent. The saturated adsorption model was also identified to correlate the stability of the sample with the CO2 adsorption rate.
1.5 Thesis Layout
This thesis consists of 5 chapters as described below: 1. Chapter 1 consists of the introduction of the undertaking research. The
chapter presents the fundamental and background information which consists of the introduction, objectives, scope of research and thesis layout.
2. Chapter 2 describes the literature review which provides important theory and findings from preceding researchers that is significant to the project.
3. Chapter 3 consists the methodology of the project which consists of experimental method, samples characterization and background of thermal decomposition kinetics study were discussed.
4. Chapter 4 mainly justifies the results and findings of the experimental work. The results obtained will be linked to the previous theory and new discovery will be highlighted and justified.
5. Chapter 5 covers the final part of the report which summarizes the research findings and recommendation for future works.
With this preliminary study on various types of biochar, it is hoped that the discovery will be developed further and used by others as an efficient CO2 adsorbent in the flue gas system.
© COPYRIG
HT UPM
5
CHAPTER 2 LITERATURE REVIEW
2.1 Global climate change issues
The major source of climate change is large emission of global greenhouse gases (GHGs) such as carbon dioxide and methane into the atmosphere. The emission is from daily human activities such as power generation, transportation and industrial activities. The release of the GHGs will result to the trap of excessive sunlight energy which will then heat the Earth’s atmosphere (Lau et al., 2009). The melting of glaciers in the north and south poles has increased the worldwide concern as a result to the raise of the atmosphere temperature. A forecast of sea level rise of 15 to 99 cm will bring unfortunate consequences to the residents living in the coastline area (Greenpeace, 2004). Global carbon dioxide emission has increased significantly from 19,380 million tons in 1980 to 31,577 million tons in 2008 (British Petroleum, 2008). The Intergovernmental Panel on Climate Change (IPCC) has recorded that the average world temperature was estimated to rise between 1.1 and 6.4°C in the next 100 years. This is considered an alarming figure at which an average temperature of only 2°C will cause extensive destruction to many living creatures and farming activities. The carbon dioxide emission is expected to increase to 40 billion tons in year 2030 if no tremendous efforts are thrown in to ease the release of CO2 (Lim and Teong, 2010). Tremendous efforts have been implemented to mitigate the climate change issues. The United Nation Frame-work Convention on Climate Change (UNFCCC) has organized a convention in Kyoto Japan, in 1997. During the meeting, the green house gasses such as carbon dioxide, methane, nitrous oxide, hydrofluorocarbons, perfluorocarbons and sulfur hexafluoride were recognized as the main cause of green house effect. The cutback target of the GHGs release has been regulated and emission reduction projects were promoted to all developed countries. Clean Development Mechanism (CDM) and Joint Implementation (JI) programs were also introduced in conjunction with the Kyoto Protocol. The objective of CDM and JI establishment are to ensure developing countries to accomplish continuous development and attain GHGs emission reduction commitment. Several methods have been applied to reduce CO2 emission to the atmosphere. Negotiations through Kyoto protocol for industrial country emission have been launched and the effectiveness of the modus operandi has been revised to improve the regulations. Efforts can be made to improve the competence of the energy production while reducing the carbon content of fuels. Carbon dioxide is largely produced through combustion by the fossil fuel that is used in energy production. Currently amine is used for scrubbing of the flue gasses. This chemical absorption method is performed by using monoethanolamine (MEA)
© COPYRIG
HT UPM
6
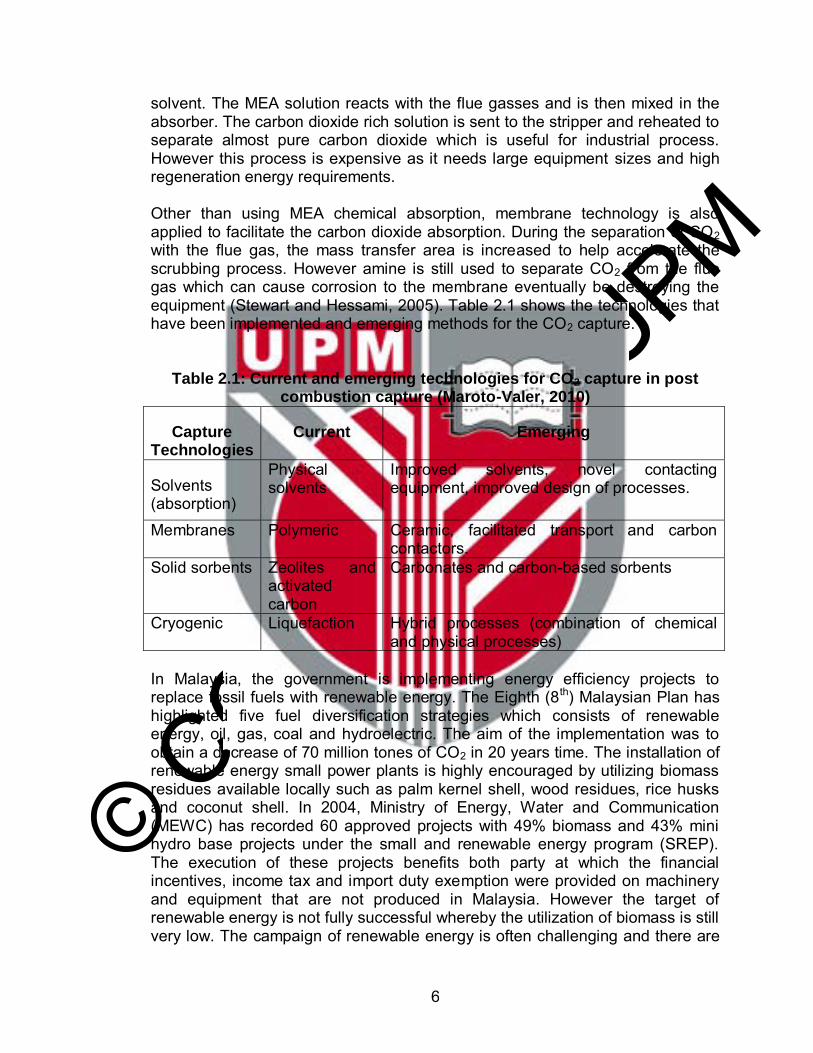
solvent. The MEA solution reacts with the flue gasses and is then mixed in the absorber. The carbon dioxide rich solution is sent to the stripper and reheated to separate almost pure carbon dioxide which is useful for industrial process. However this process is expensive as it needs large equipment sizes and high regeneration energy requirements. Other than using MEA chemical absorption, membrane technology is also applied to facilitate the carbon dioxide absorption. During the separation of CO2 with the flue gas, the mass transfer area is increased to help accelerate the scrubbing process. However amine is still used to separate CO2 from the flue gas which can cause corrosion to the membrane eventually be destroying the equipment (Stewart and Hessami, 2005). Table 2.1 shows the technologies that have been implemented and emerging methods for the CO2 capture.
Table 2.1: Current and emerging technologies for CO2 capture in post combustion capture (Maroto-Valer, 2010)
Capture Technologies
Current Emerging
Solvents (absorption)
Physical solvents
Improved solvents, novel contacting equipment, improved design of processes.
Membranes Polymeric Ceramic, facilitated transport and carbon contactors.
Solid sorbents Zeolites and activated carbon
Carbonates and carbon-based sorbents
Cryogenic Liquefaction Hybrid processes (combination of chemical and physical processes)
In Malaysia, the government is implementing energy efficiency projects to replace fossil fuels with renewable energy. The Eighth (8th) Malaysian Plan has highlighted five fuel diversification strategies which consists of renewable energy, oil, gas, coal and hydroelectric. The aim of the implementation was to obtain a decrease of 70 million tones of CO2 in 20 years time. The installation of renewable energy small power plants is highly encouraged by utilizing biomass residues available locally such as palm kernel shell, wood residues, rice husks and coconut shell. In 2004, Ministry of Energy, Water and Communication (MEWC) has recorded 60 approved projects with 49% biomass and 43% mini hydro base projects under the small and renewable energy program (SREP). The execution of these projects benefits both party at which the financial incentives, income tax and import duty exemption were provided on machinery and equipment that are not produced in Malaysia. However the target of renewable energy is not fully successful whereby the utilization of biomass is still very low. The campaign of renewable energy is often challenging and there are
© COPYRIG
HT UPM
7
not enough loans, consulting services and financial support to aid the plan. The lack of policy framework and financial mechanism also inhibit the execution of the renewable energy development. Therefore the utilization of biomass as renewable energy and the optimization of power generation process need to be ventured further to lessen the climate change issues (Lau et al., 2009).
2.2 Availability of biomass in Malaysia
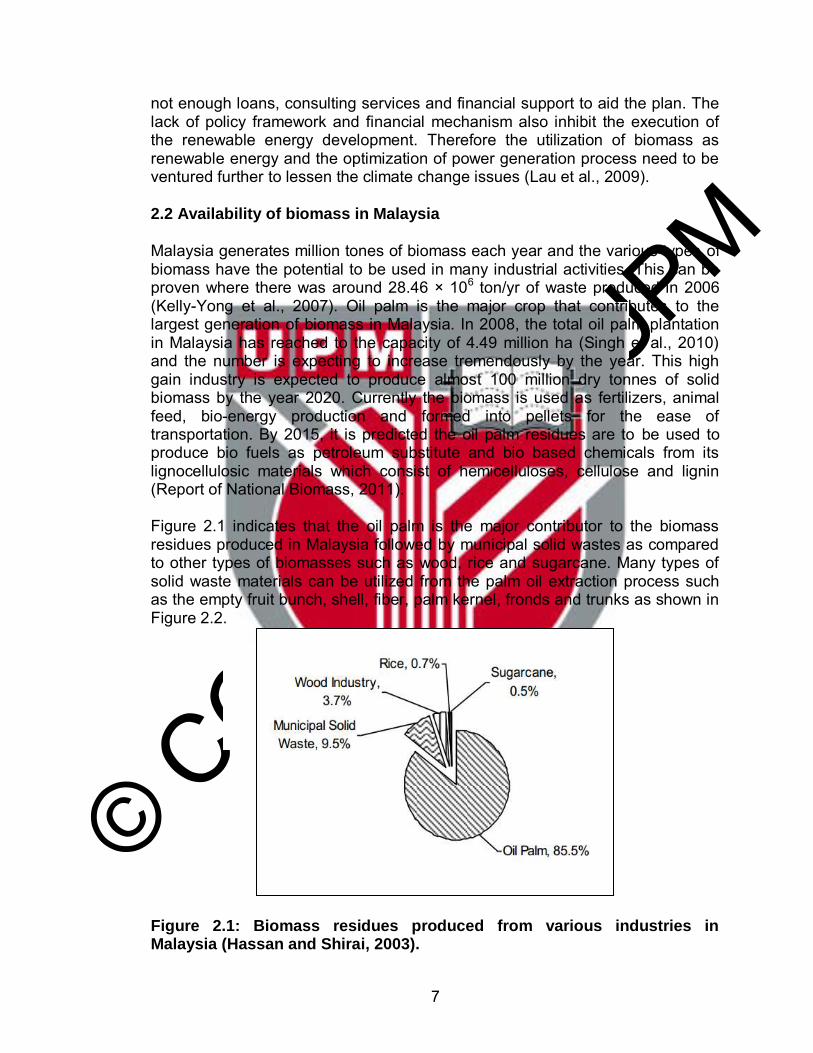
Malaysia generates million tones of biomass each year and the various types of biomass have the potential to be used in many industrial activities. This can be proven where there was around 28.46 × 10⁶ ton/yr of waste produced in 2006 (Kelly-Yong et al., 2007). Oil palm is the major crop that contributes to the largest generation of biomass in Malaysia. In 2008, the total oil palm plantation in Malaysia has reached to the capacity of 4.49 million ha (Singh et al., 2010) and the number is expecting to increase tremendously by the year. This high gain industry is expected to produce almost 100 million dry tonnes of solid biomass by the year 2020. Currently the biomass is used as fertilizers, animal feed, bio-energy production and formed into pellets for the ease of transportation. By 2015, it is predicted the oil palm residues are to be used to produce bio fuels as petroleum substitute and bio based chemicals from its lignocellulosic materials which consist of hemicelluloses, cellulose and lignin (Report of National Biomass, 2011). Figure 2.1 indicates that the oil palm is the major contributor to the biomass residues produced in Malaysia followed by municipal solid wastes as compared to other types of biomasses such as wood, rice and sugarcane. Many types of solid waste materials can be utilized from the palm oil extraction process such as the empty fruit bunch, shell, fiber, palm kernel, fronds and trunks as shown in Figure 2.2.
Figure 2.1: Biomass residues produced from various industries in Malaysia (Hassan and Shirai, 2003).
© COPYRIG
HT UPM
8
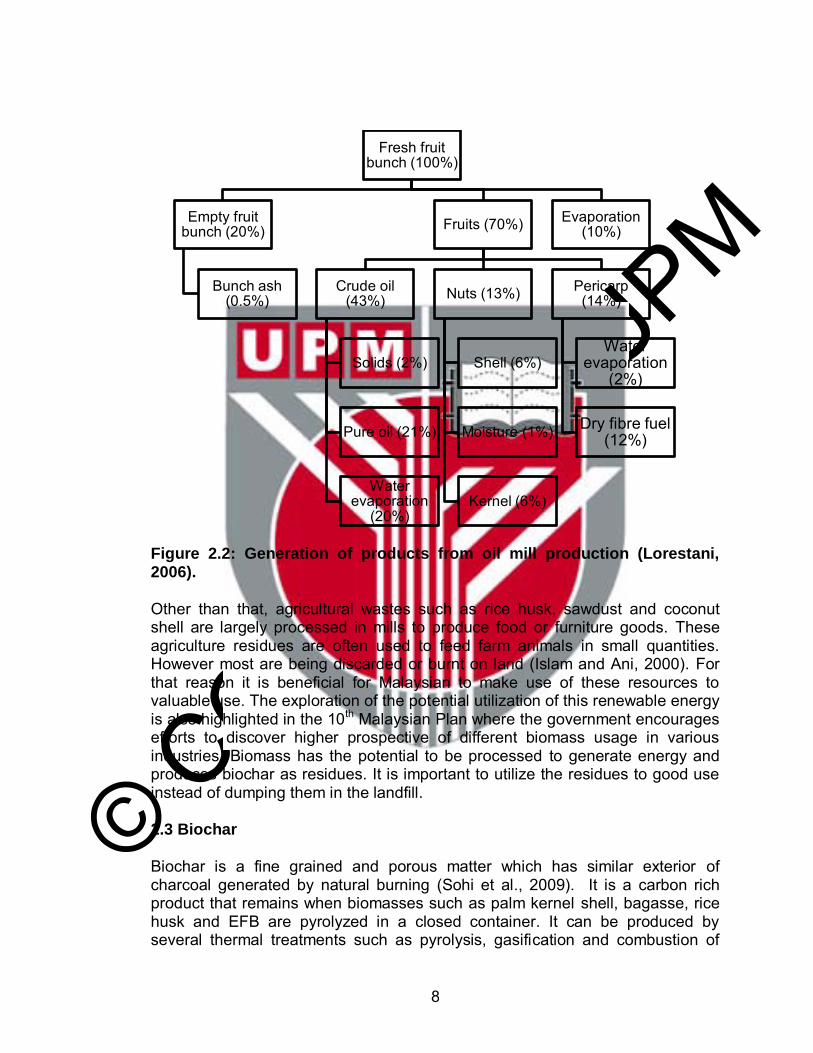
Figure 2.2: Generation of products from oil mill production (Lorestani, 2006). Other than that, agricultural wastes such as rice husk, sawdust and coconut shell are largely processed in mills to produce food or furniture goods. These agriculture residues are often used to feed farm animals in small quantities. However most are being discarded or burnt on land (Islam and Ani, 2000). For that reason it is beneficial for Malaysian to make use of these resources to valuable use. The exploration of the potential utilization of this renewable energy is also highlighted in the 10th Malaysian Plan where the government encourages efforts to discover higher prospective of different biomass usage in various industries. Biomass has the potential to be processed to generate energy and produces biochar as residues. It is important to utilize the residues to good use instead of dumping them in the landfill.
2.3 Biochar
Biochar is a fine grained and porous matter which has similar exterior of charcoal generated by natural burning (Sohi et al., 2009). It is a carbon rich product that remains when biomasses such as palm kernel shell, bagasse, rice husk and EFB are pyrolyzed in a closed container. It can be produced by several thermal treatments such as pyrolysis, gasification and combustion of
Fresh fruit bunch (100%)
Empty fruit bunch (20%)
Bunch ash (0.5%)
Fruits (70%)
Crude oil (43%)
Solids (2%)
Pure oil (21%)
Water evaporation
(20%)
Nuts (13%)
Shell (6%)
Moisture (1%)
Kernel (6%)
Pericarp (14%)
Water evaporation
(2%)
Dry fibre fuel (12%)
Evaporation (10%)

© COPYRIG
HT UPM
9
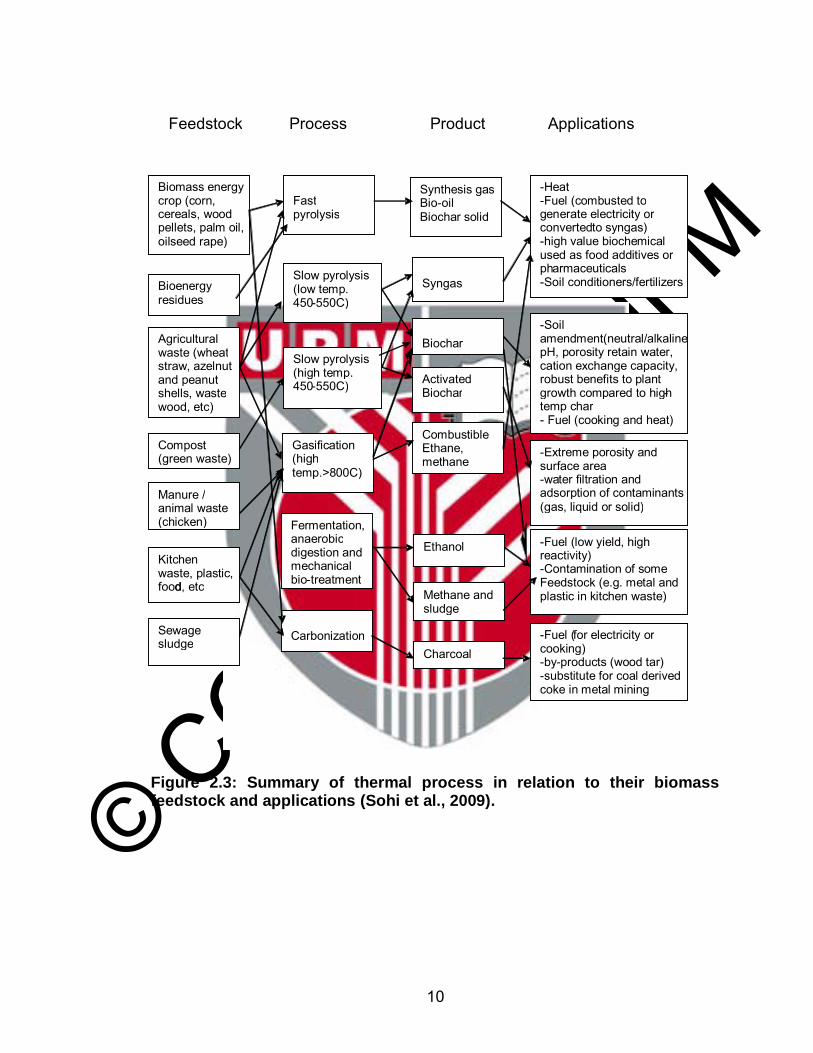
biomass resources (Gary, 1943). From a chemical point of view biochar can be define as an organic portion with a high C content, which mainly consists of aromatic compounds characterized by rings of six C atoms linked together without oxygen (O) or hydrogen (H) (Ghani, 2010). Figure 2.3 shows the thermal process in relation to their biomass feedstock and applications. There is a large variety of biochar produced in the industry. In order to produce biochar, low temperatures are required and the reaction may take place at an excess air whereby traditional charcoal is usually described as carbonization. Torrefaction which is described as drying and roasting of biomass happens at a lower temperature (Arias et al., 2008). Biochar may also be produced by gasification at high temperature with limited amount of air. The objective of gasification is to produce high amount of syngas. Therefore the properties of the biochar vary depending on the thermal treatments at which the biochar are being produced.
© COPYRIG
HT UPM
10
Figure 2.3: Summary of thermal process in relation to their biomass feedstock and applications (Sohi et al., 2009).
Feedstock Process Product Applications
Biomass energy crop (corn, cereals, wood pellets, palm oil, oilseed rape)
Bioenergy residues
Agricultural waste (wheat straw, azelnut and peanut shells, waste wood, etc)
Compost (green waste)
Manure / animal waste (chicken)
Kitchen waste, plastic, food d, etc
Fast pyrolysis
Slow pyrolysis (low temp. 450 - 550C)
Slow pyrolysis (high temp. 450 - 550C)
Gasification (high temp.>800C)
Fermentation, anaerobic digestion and mechanical bio - treatment
Carbonization
Synthesis gas Bio - oil Biochar solid
Syngas
Biochar
Combustible Ethane, methane
Methane and sludge
- Heat - Fuel (combusted to g enerate electricity or converted to syngas) - high value biochemical used as food additives or ph armaceuticals - Soil conditioners/fertilizers
- Soil amendment(neutral/alkaline pH, porosity retain water, cation exchange capacity, robust benefits to plant growth compared to high - temp char - Fuel (cooking and heat)
- Extreme porosity and surface area - wa ter filtration and adsorption of contaminants (gas, liquid or solid)
- Fuel (low yield, high reactivity) - Contamination of some Feedstock (e.g. metal and plastic in kitchen waste)
- Fuel ( for electricity or cooking) - by - products (wood tar) - substitute for coal derived coke in metal mining
Sewage sludge
Activated Biochar
Ethanol
Charcoal
© COPYRIG
HT UPM
11
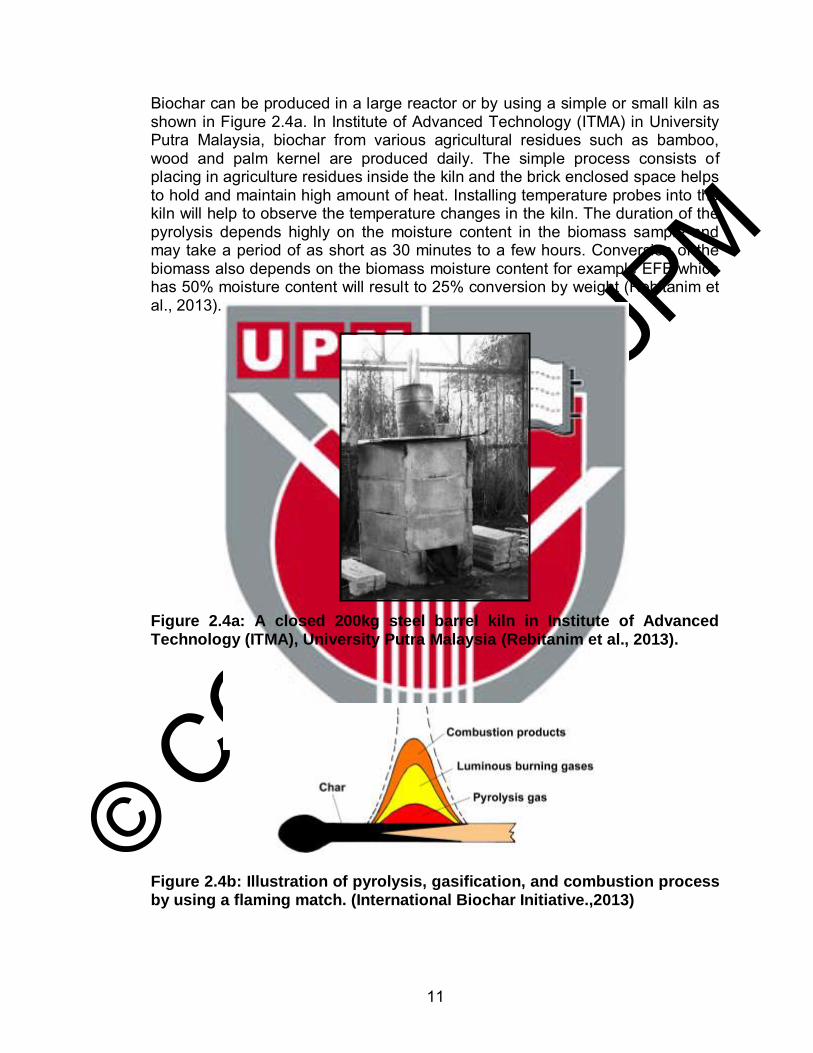
Biochar can be produced in a large reactor or by using a simple or small kiln as shown in Figure 2.4a. In Institute of Advanced Technology (ITMA) in University Putra Malaysia, biochar from various agricultural residues such as bamboo, wood and palm kernel are produced daily. The simple process consists of placing in agriculture residues inside the kiln and the brick enclosed space helps to hold and maintain high amount of heat. Installing temperature probes into the kiln will help to observe the temperature changes in the kiln. The duration of the pyrolysis depends highly on the moisture content in the biomass sample and may take a period of as short as 30 minutes to a few hours. Conversion of the biomass also depends on the biomass moisture content for example EFB which has 50% moisture content will result to 25% conversion by weight (Rebitanim et al., 2013).
Figure 2.4a: A closed 200kg steel barrel kiln in Institute of Advanced Technology (ITMA), University Putra Malaysia (Rebitanim et al., 2013).
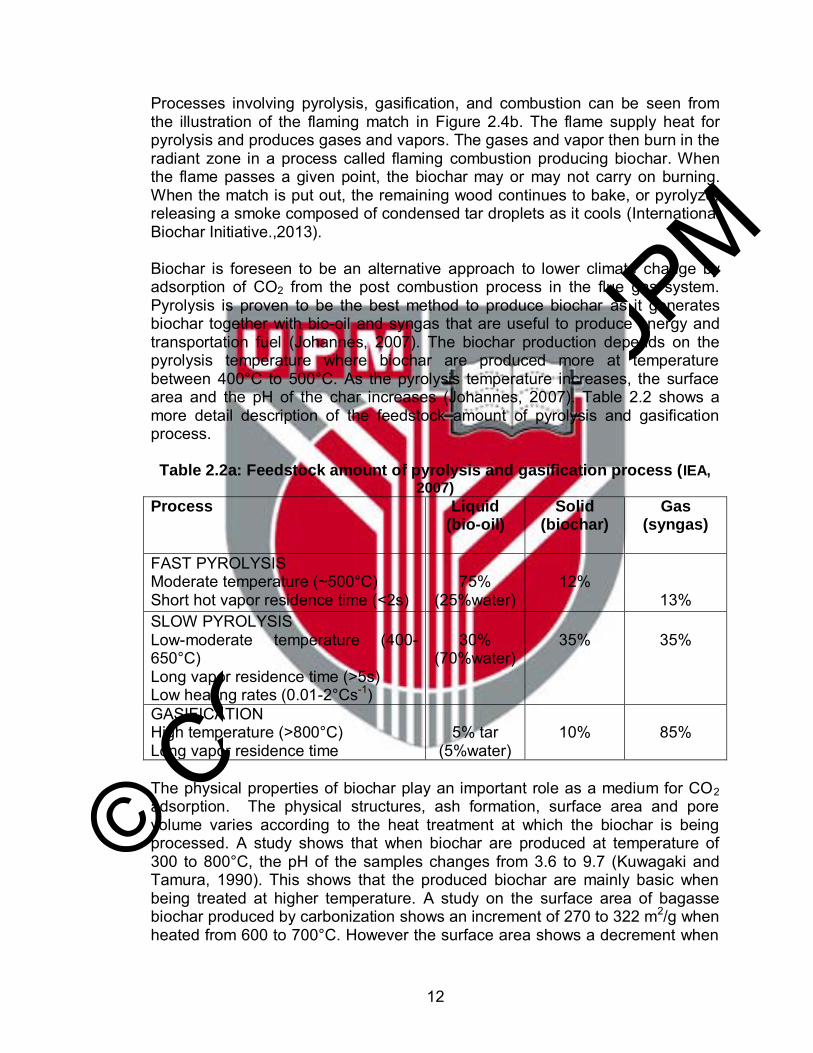
Figure 2.4b: Illustration of pyrolysis, gasification, and combustion process by using a flaming match. (International Biochar Initiative.,2013)
© COPYRIG
HT UPM
12
Processes involving pyrolysis, gasification, and combustion can be seen from the illustration of the flaming match in Figure 2.4b. The flame supply heat for pyrolysis and produces gases and vapors. The gases and vapor then burn in the radiant zone in a process called flaming combustion producing biochar. When the flame passes a given point, the biochar may or may not carry on burning. When the match is put out, the remaining wood continues to bake, or pyrolyze, releasing a smoke composed of condensed tar droplets as it cools (International Biochar Initiative.,2013). Biochar is foreseen to be an alternative approach to lower climate change by adsorption of CO2 from the post combustion process in the flue gas system. Pyrolysis is proven to be the best method to produce biochar as it generates biochar together with bio-oil and syngas that are useful to produce energy and transportation fuel (Johannes, 2007). The biochar production depends on the pyrolysis temperature where biochar are produced more at temperature between 400°C to 500°C. As the pyrolysis temperature increases, the surface area and the pH of the char increases (Johannes, 2007). Table 2.2 shows a more detail description of the feedstock amount of pyrolysis and gasification process. Table 2.2a: Feedstock amount of pyrolysis and gasification process (IEA,
2007) Process Liquid
(bio-oil) Solid
(biochar) Gas
(syngas)
FAST PYROLYSIS Moderate temperature (~500°C) Short hot vapor residence time (<2s)
75%
(25%water)
12%
13% SLOW PYROLYSIS Low-moderate temperature (400-650°C) Long vapor residence time (>5s) Low heating rates (0.01-2°Cs-1)
30%
(70%water)
35%
35%
GASIFICATION High temperature (>800°C) Long vapor residence time
5% tar
(5%water)
10%
85%
The physical properties of biochar play an important role as a medium for CO2 adsorption. The physical structures, ash formation, surface area and pore volume varies according to the heat treatment at which the biochar is being processed. A study shows that when biochar are produced at temperature of 300 to 800°C, the pH of the samples changes from 3.6 to 9.7 (Kuwagaki and Tamura, 1990). This shows that the produced biochar are mainly basic when being treated at higher temperature. A study on the surface area of bagasse biochar produced by carbonization shows an increment of 270 to 322 m2/g when heated from 600 to 700°C. However the surface area shows a decrement when
© COPYRIG
HT UPM
13
heated at temperature 800°C giving surface area of only 273 m2/g (Ueno et al., 2007). Thus the temperature of the thermal process plays a significant role in producing the suitable biochar with the required surface area. Other than that, the porous structure of the biochar plays an important role in the capability of the biochar to capture CO2 (Ogawa et al., 2006; Yu et al., 2006). Chemical composition of highly aromatic functional groups and high carbon content of the sample will also reflect the stability of the biochar samples (Sohi et al., 2009).
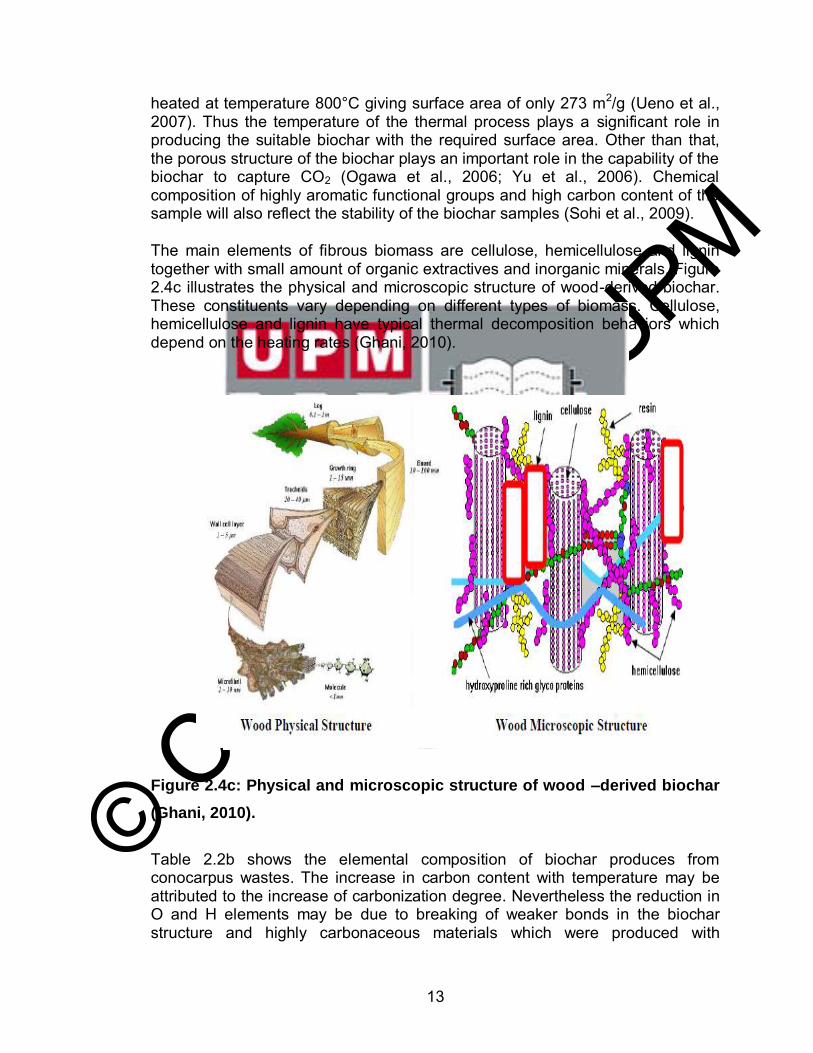
The main elements of fibrous biomass are cellulose, hemicellulose and lignin together with small amount of organic extractives and inorganic minerals. Figure 2.4c illustrates the physical and microscopic structure of wood-derived biochar. These constituents vary depending on different types of biomass. Cellulose, hemicellulose and lignin have typical thermal decomposition behaviors which depend on the heating rates (Ghani, 2010).
Figure 2.4c: Physical and microscopic structure of wood –derived biochar
(Ghani, 2010).
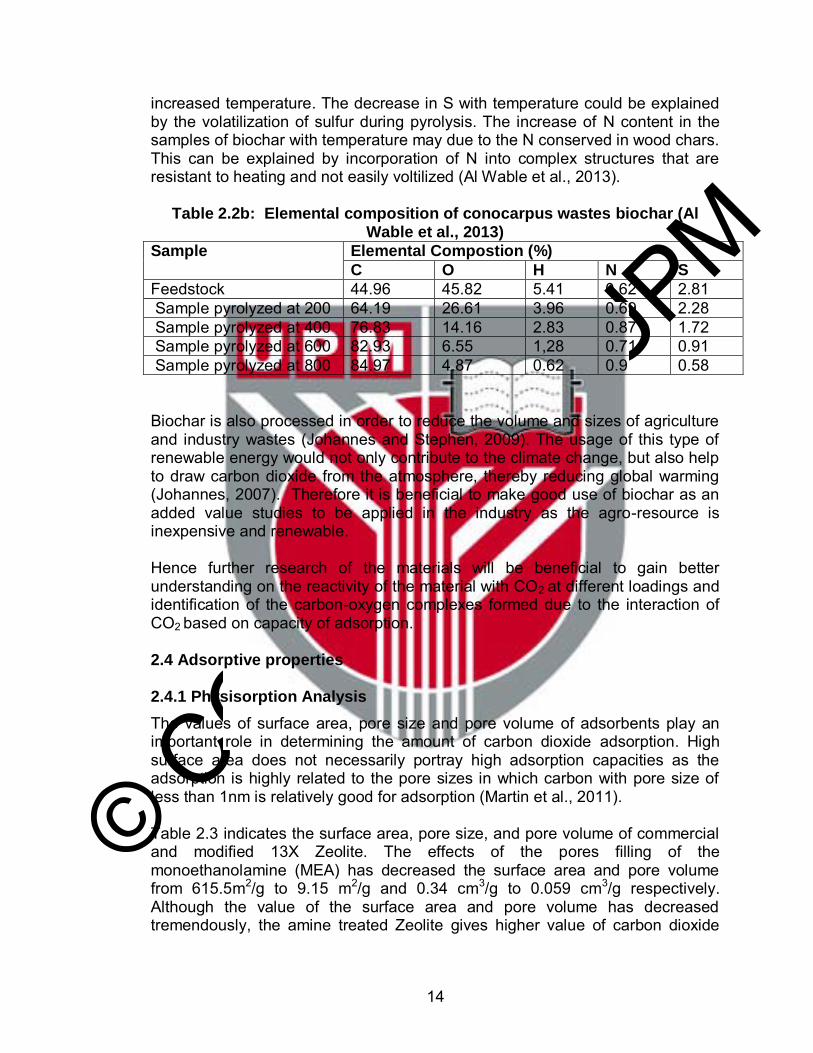
Table 2.2b shows the elemental composition of biochar produces from conocarpus wastes. The increase in carbon content with temperature may be attributed to the increase of carbonization degree. Nevertheless the reduction in O and H elements may be due to breaking of weaker bonds in the biochar structure and highly carbonaceous materials which were produced with
© COPYRIG
HT UPM
14
increased temperature. The decrease in S with temperature could be explained by the volatilization of sulfur during pyrolysis. The increase of N content in the samples of biochar with temperature may due to the N conserved in wood chars. This can be explained by incorporation of N into complex structures that are resistant to heating and not easily voltilized (Al Wable et al., 2013).
Table 2.2b: Elemental composition of conocarpus wastes biochar (Al Wable et al., 2013)
Sample Elemental Compostion (%)
C O H N S
Feedstock 44.96 45.82 5.41 0.62 2.81 Sample pyrolyzed at 200 64.19 26.61 3.96 0.69 2.28 Sample pyrolyzed at 400 76.83 14.16 2.83 0.87 1.72 Sample pyrolyzed at 600 82.93 6.55 1,28 0.71 0.91 Sample pyrolyzed at 800 84.97 4.87 0.62 0.9 0.58
Biochar is also processed in order to reduce the volume and sizes of agriculture and industry wastes (Johannes and Stephen, 2009). The usage of this type of renewable energy would not only contribute to the climate change, but also help to draw carbon dioxide from the atmosphere, thereby reducing global warming (Johannes, 2007). Therefore it is beneficial to make good use of biochar as an added value studies to be applied in the industry as the agro-resource is inexpensive and renewable. Hence further research of the materials will be beneficial to gain better understanding on the reactivity of the material with CO2 at different loadings and identification of the carbon-oxygen complexes formed due to the interaction of CO2 based on capacity of adsorption.
2.4 Adsorptive properties
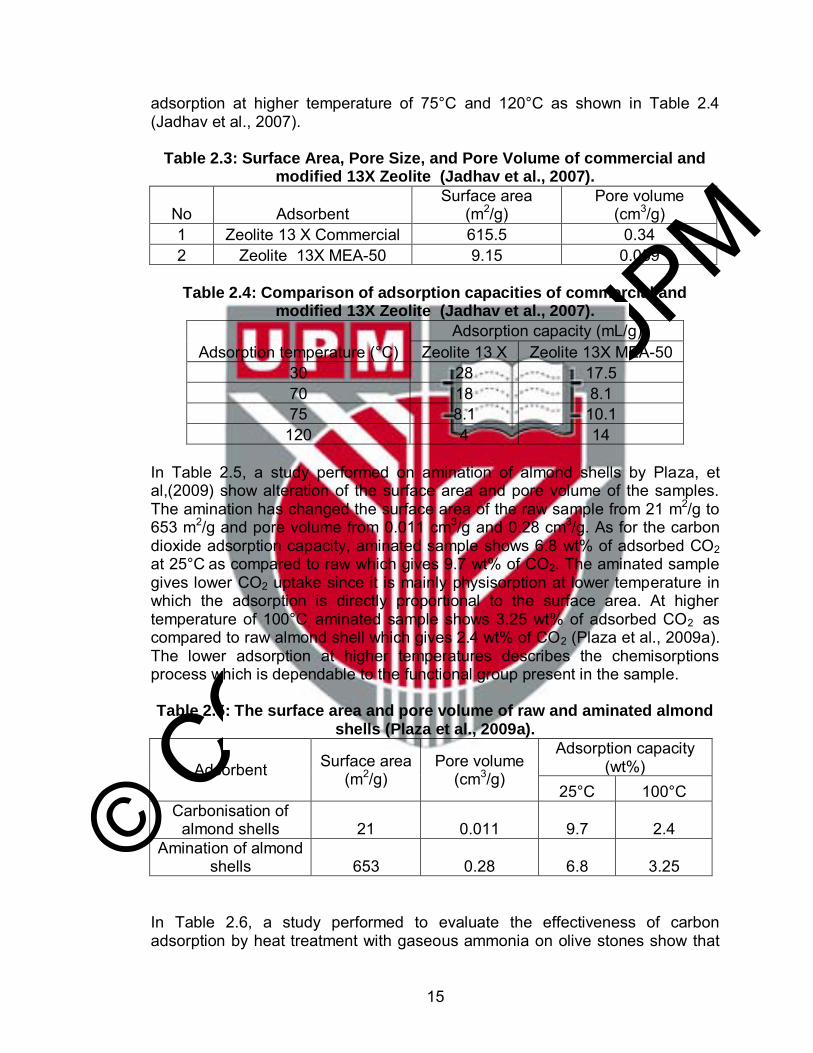
2.4.1 Physisorption Analysis The values of surface area, pore size and pore volume of adsorbents play an important role in determining the amount of carbon dioxide adsorption. High surface area does not necessarily portray high adsorption capacities as the adsorption is highly related to the pore sizes in which carbon with pore size of less than 1nm is relatively good for adsorption (Martin et al., 2011). Table 2.3 indicates the surface area, pore size, and pore volume of commercial and modified 13X Zeolite. The effects of the pores filling of the monoethanolamine (MEA) has decreased the surface area and pore volume from 615.5m2/g to 9.15 m2/g and 0.34 cm3/g to 0.059 cm3/g respectively. Although the value of the surface area and pore volume has decreased tremendously, the amine treated Zeolite gives higher value of carbon dioxide
© COPYRIG
HT UPM
15
adsorption at higher temperature of 75°C and 120°C as shown in Table 2.4 (Jadhav et al., 2007).
Table 2.3: Surface Area, Pore Size, and Pore Volume of commercial and modified 13X Zeolite (Jadhav et al., 2007).
No Adsorbent Surface area
(m2/g) Pore volume
(cm3/g) 1 Zeolite 13 X Commercial 615.5 0.34 2 Zeolite 13X MEA-50 9.15 0.059
Table 2.4: Comparison of adsorption capacities of commercial and
modified 13X Zeolite (Jadhav et al., 2007).
Adsorption temperature (°C) Adsorption capacity (mL/g)
Zeolite 13 X Zeolite 13X MEA-50 30 28 17.5 70 18 8.1 75 8.1 10.1
120 4 14 In Table 2.5, a study performed on amination of almond shells by Plaza, et al,(2009) show alteration of the surface area and pore volume of the samples. The amination has changed the surface area of the raw sample from 21 m2/g to 653 m2/g and pore volume from 0.011 cm3/g and 0.28 cm3/g. As for the carbon dioxide adsorption capacity, aminated sample shows 6.8 wt% of adsorbed CO2 at 25°C as compared to raw which gives 9.7 wt% of CO2. The aminated sample gives lower CO2 uptake since it is mainly physisorption at lower temperature in which the adsorption is directly proportional to the surface area. At higher temperature of 100°C, aminated sample shows 3.25 wt% of adsorbed CO2 as compared to raw almond shell which gives 2.4 wt% of CO2 (Plaza et al., 2009a). The lower adsorption at higher temperatures describes the chemisorptions process which is dependable to the functional group present in the sample. Table 2.5: The surface area and pore volume of raw and aminated almond
shells (Plaza et al., 2009a).
Adsorbent Surface area (m2/g)
Pore volume (cm3/g)
Adsorption capacity (wt%)
25°C 100°C Carbonisation of
almond shells 21 0.011 9.7 2.4 Amination of almond
shells 653 0.28 6.8 3.25
In Table 2.6, a study performed to evaluate the effectiveness of carbon adsorption by heat treatment with gaseous ammonia on olive stones show that
© COPYRIG
HT UPM
16
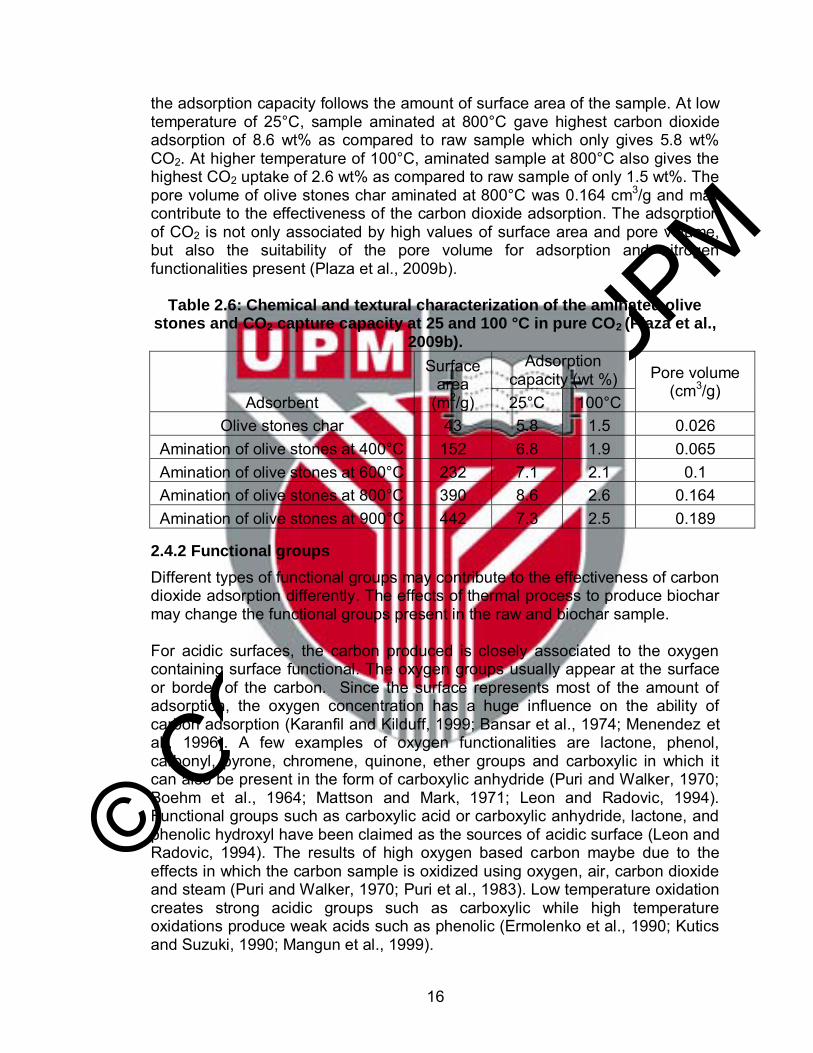
the adsorption capacity follows the amount of surface area of the sample. At low temperature of 25°C, sample aminated at 800°C gave highest carbon dioxide adsorption of 8.6 wt% as compared to raw sample which only gives 5.8 wt% CO2. At higher temperature of 100°C, aminated sample at 800°C also gives the highest CO2 uptake of 2.6 wt% as compared to raw sample of only 1.5 wt%. The pore volume of olive stones char aminated at 800°C was 0.164 cm3/g and may contribute to the effectiveness of the carbon dioxide adsorption. The adsorption of CO2 is not only associated by high values of surface area and pore volume, but also the suitability of the pore volume for adsorption and nitrogen functionalities present (Plaza et al., 2009b).
Table 2.6: Chemical and textural characterization of the aminated olive stones and CO2 capture capacity at 25 and 100 °C in pure CO2 (Plaza et al.,
2009b).
Adsorbent
Surface area
(m2/g)
Adsorption capacity (wt %) Pore volume
(cm3/g) 25°C 100°C
Olive stones char 43 5.8 1.5 0.026 Amination of olive stones at 400°C 152 6.8 1.9 0.065 Amination of olive stones at 600°C 232 7.1 2.1 0.1 Amination of olive stones at 800°C 390 8.6 2.6 0.164 Amination of olive stones at 900°C 442 7.3 2.5 0.189
2.4.2 Functional groups
Different types of functional groups may contribute to the effectiveness of carbon dioxide adsorption differently. The effects of thermal process to produce biochar may change the functional groups present in the raw and biochar sample. For acidic surfaces, the carbon produced is closely associated to the oxygen containing surface functional. The oxygen groups usually appear at the surface or border of the carbon. Since the surface represents most of the amount of adsorption, the oxygen concentration has a huge influence on the ability of carbon adsorption (Karanfil and Kilduff, 1999; Bansar et al., 1974; Menendez et al., 1996). A few examples of oxygen functionalities are lactone, phenol, carbonyl, pyrone, chromene, quinone, ether groups and carboxylic in which it can also be present in the form of carboxylic anhydride (Puri and Walker, 1970; Boehm et al., 1964; Mattson and Mark, 1971; Leon and Radovic, 1994). Functional groups such as carboxylic acid or carboxylic anhydride, lactone, and phenolic hydroxyl have been claimed as the sources of acidic surface (Leon and Radovic, 1994). The results of high oxygen based carbon maybe due to the effects in which the carbon sample is oxidized using oxygen, air, carbon dioxide and steam (Puri and Walker, 1970; Puri et al., 1983). Low temperature oxidation creates strong acidic groups such as carboxylic while high temperature oxidations produce weak acids such as phenolic (Ermolenko et al., 1990; Kutics and Suzuki, 1990; Mangun et al., 1999).
© COPYRIG
HT UPM
17
The basicity of a carbon sample can be highly related to basic surface functionalities such as nitrogen containing groups. It is suggested that some oxygen functionalities such as chromene, ketone, and pyrone can contribute to the basicity of the carbon. Studies have shown that nitrogen incorporation to the carbon surface help to increase the capability of the adsorbent to capture carbon dioxide (Maroto et al., 2005; Plaza et al., 2005; Huang et al., 2003; Xu et al., 2009). Nitrogen functionalities generally provide basic property, which can enhance the interaction between carbon surface and acid molecules such as, dipole–dipole, H-bonding and covalent bonding. The nitrogen can be assimilated to the carbon by reaction with nitrogen containing chemical such as nitric acid, amines (Plaza et al., 2007) and activation with nitrogen based gas (Stohr et al., 1991; Jansen and Bekkum, 1995). Examples of some nitrogen functionalities structures are amide group, imide group, lactame group, pyrrolic group, and pyridinic group (Abe et al., 2000; Pels et al., 1995).
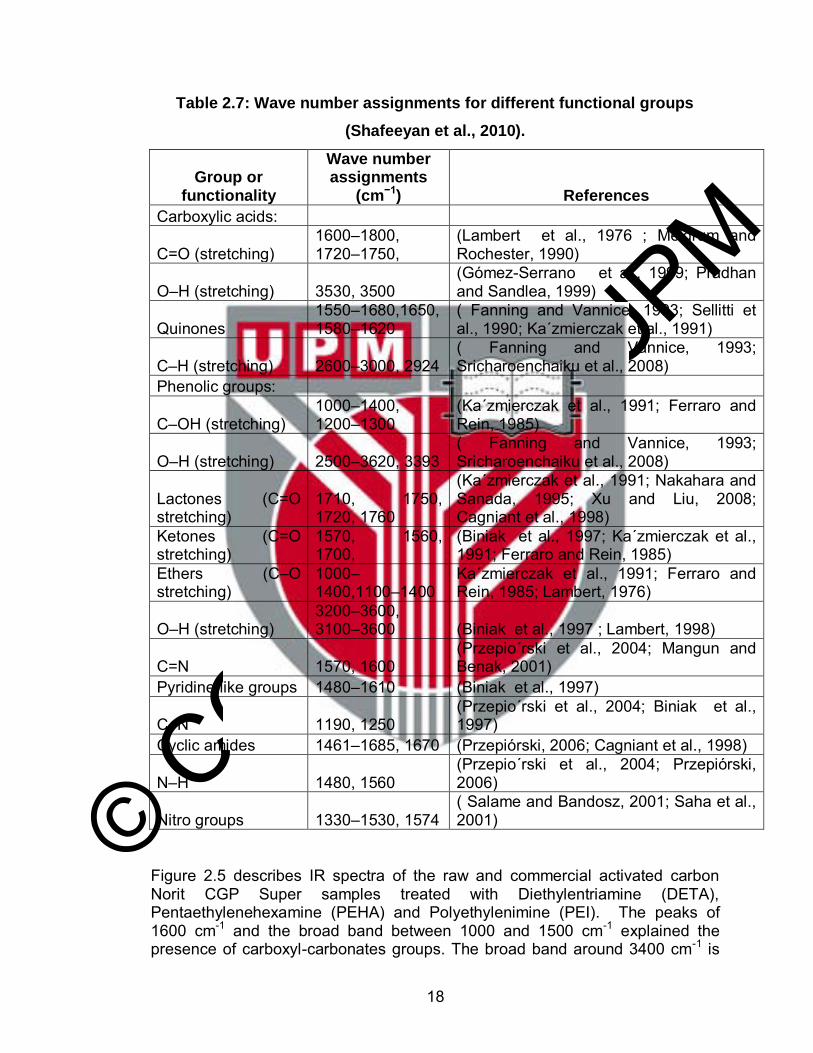
Fourier Transform Infrared (FT-IR) which is a qualitative technique has been employed to detect the variation of functional groups present in the surface of the activated carbon. The FT-IR band produces infrared intensity (transmittance units) versus wave number of light (inverse of wavelength) representing the spectra of surface functional groups produced or spent throughout treatment. Wave number designations of functional groups on carbon surface are tabulated in Table 2.7 (Shafeeyan et al., 2010).
© COPYRIG
HT UPM
18
Table 2.7: Wave number assignments for different functional groups
(Shafeeyan et al., 2010).
Group or functionality
Wave number assignments
(cm−1) References
Carboxylic acids:
C=O (stretching) 1600–1800, 1720–1750,
(Lambert et al., 1976 ; Meldrum and Rochester, 1990)
O–H (stretching) 3530, 3500 (Gómez-Serrano et al., 1999; Pradhan and Sandlea, 1999)
Quinones 1550–1680,1650, 1580–1620
( Fanning and Vannice, 1993; Sellitti et al., 1990; Ka´zmierczak et al., 1991)
C–H (stretching) 2600–3000, 2924 ( Fanning and Vannice, 1993; Sricharoenchaiku et al., 2008)
Phenolic groups:
C–OH (stretching) 1000–1400, 1200–1300
(Ka´zmierczak et al., 1991; Ferraro and Rein, 1985)
O–H (stretching) 2500–3620, 3393 ( Fanning and Vannice, 1993; Sricharoenchaiku et al., 2008)
Lactones (C=O stretching)
1710, 1750, 1720, 1760
(Ka´zmierczak et al., 1991; Nakahara and Sanada, 1995; Xu and Liu, 2008; Cagniant et al., 1998)
Ketones (C=O stretching)
1570, 1560, 1700,
(Biniak et al., 1997; Ka´zmierczak et al., 1991; Ferraro and Rein, 1985)
Ethers (C–O stretching)
1000–1400,1100–1400
Ka´zmierczak et al., 1991; Ferraro and Rein, 1985; Lambert, 1976)
O–H (stretching) 3200–3600, 3100–3600 (Biniak et al., 1997 ; Lambert, 1998)
C=N 1570, 1600 (Przepio´rski et al., 2004; Mangun and Benak, 2001)
Pyridine-like groups 1480–1610 (Biniak et al., 1997)
C–N 1190, 1250 (Przepio´rski et al., 2004; Biniak et al., 1997)
Cyclic amides 1461–1685, 1670 (Przepiórski, 2006; Cagniant et al., 1998)
N–H 1480, 1560 (Przepio´rski et al., 2004; Przepiórski, 2006)
Nitro groups 1330–1530, 1574 ( Salame and Bandosz, 2001; Saha et al., 2001)
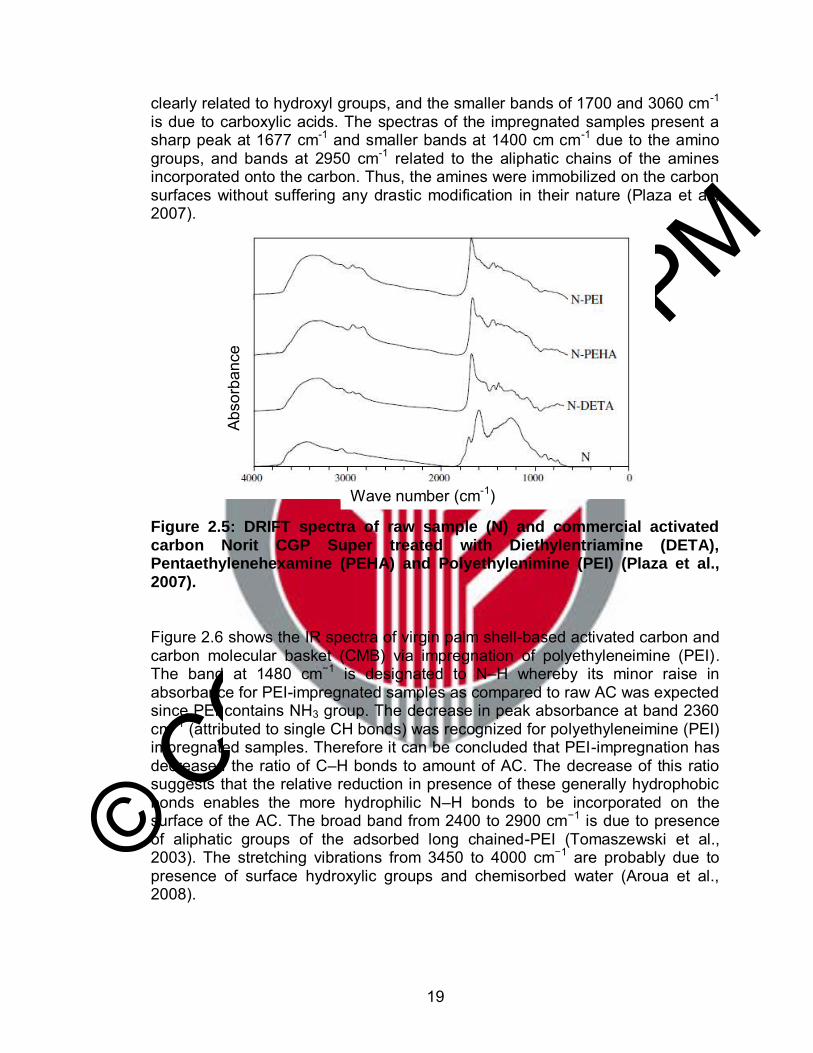
Figure 2.5 describes IR spectra of the raw and commercial activated carbon Norit CGP Super samples treated with Diethylentriamine (DETA), Pentaethylenehexamine (PEHA) and Polyethylenimine (PEI). The peaks of 1600 cm-1 and the broad band between 1000 and 1500 cm-1 explained the presence of carboxyl-carbonates groups. The broad band around 3400 cm-1 is
© COPYRIG
HT UPM
19
clearly related to hydroxyl groups, and the smaller bands of 1700 and 3060 cm-1 is due to carboxylic acids. The spectras of the impregnated samples present a sharp peak at 1677 cm-1 and smaller bands at 1400 cm cm-1 due to the amino groups, and bands at 2950 cm-1 related to the aliphatic chains of the amines incorporated onto the carbon. Thus, the amines were immobilized on the carbon surfaces without suffering any drastic modification in their nature (Plaza et al., 2007).
Figure 2.5: DRIFT spectra of raw sample (N) and commercial activated carbon Norit CGP Super treated with Diethylentriamine (DETA), Pentaethylenehexamine (PEHA) and Polyethylenimine (PEI) (Plaza et al., 2007).
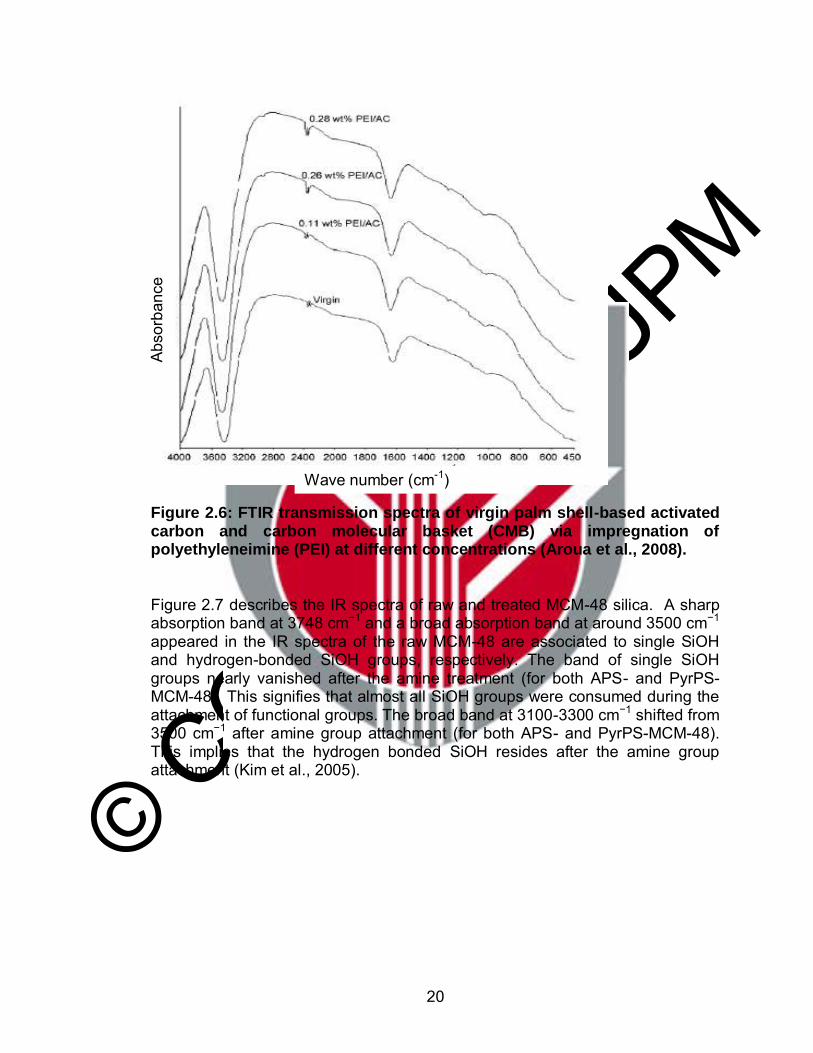
Figure 2.6 shows the IR spectra of virgin palm shell-based activated carbon and carbon molecular basket (CMB) via impregnation of polyethyleneimine (PEI). The band at 1480 cm−1 is designated to N–H whereby its minor raise in absorbance for PEI-impregnated samples as compared to raw AC was expected since PEI contains NH3 group. The decrease in peak absorbance at band 2360 cm−1 (attributed to single CH bonds) was recognized for polyethyleneimine (PEI) impregnated samples. Therefore it can be concluded that PEI-impregnation has decreased the ratio of C–H bonds to amount of AC. The decrease of this ratio suggests that the relative reduction in presence of these generally hydrophobic bonds enables the more hydrophilic N–H bonds to be incorporated on the surface of the AC. The broad band from 2400 to 2900 cm−1 is due to presence of aliphatic groups of the adsorbed long chained-PEI (Tomaszewski et al., 2003). The stretching vibrations from 3450 to 4000 cm−1 are probably due to presence of surface hydroxylic groups and chemisorbed water (Aroua et al., 2008).
Abso
rban
ce
Wave number (cm-1)
© COPYRIG
HT UPM
20
Figure 2.6: FTIR transmission spectra of virgin palm shell-based activated carbon and carbon molecular basket (CMB) via impregnation of polyethyleneimine (PEI) at different concentrations (Aroua et al., 2008).
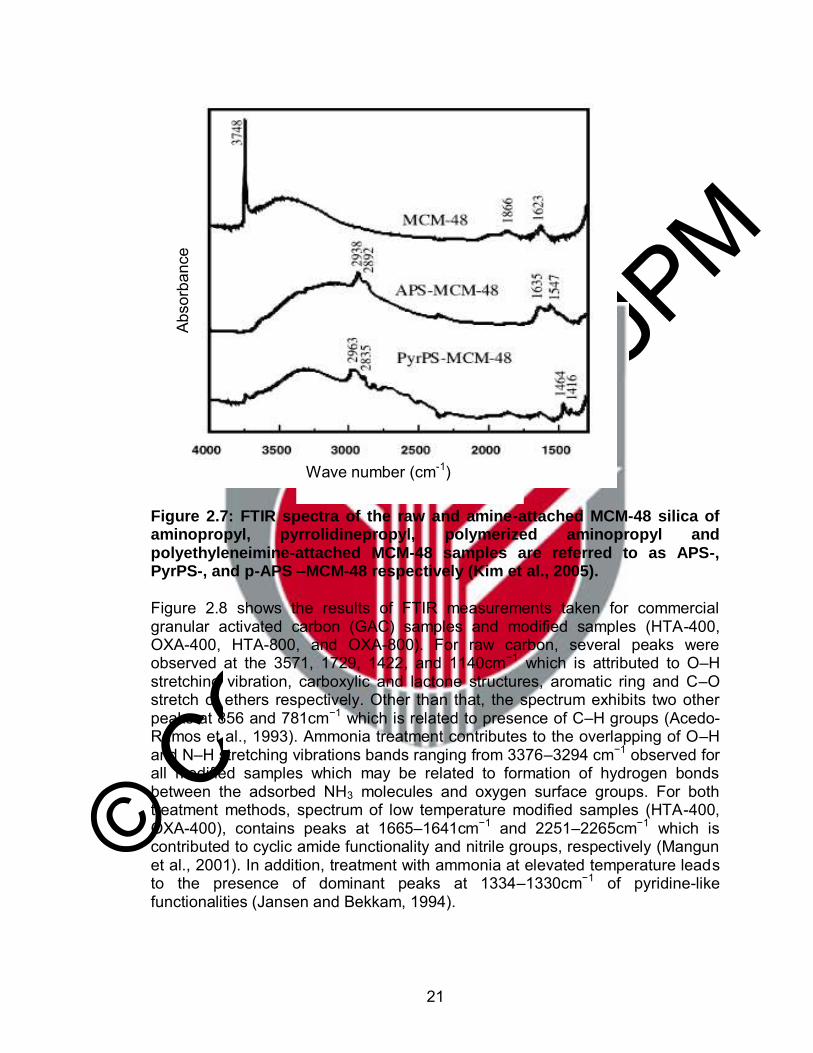
Figure 2.7 describes the IR spectra of raw and treated MCM-48 silica. A sharp absorption band at 3748 cm−1 and a broad absorption band at around 3500 cm−1 appeared in the IR spectra of the raw MCM-48 are associated to single SiOH and hydrogen-bonded SiOH groups, respectively. The band of single SiOH groups nearly vanished after the amine treatment (for both APS- and PyrPS-MCM-48). This signifies that almost all SiOH groups were consumed during the attachment of functional groups. The broad band at 3100-3300 cm−1 shifted from 3500 cm−1 after amine group attachment (for both APS- and PyrPS-MCM-48). This implies that the hydrogen bonded SiOH resides after the amine group attachment (Kim et al., 2005).
Abso
rban
ce
Wave number (cm-1)
© COPYRIG
HT UPM
21
Figure 2.7: FTIR spectra of the raw and amine-attached MCM-48 silica of aminopropyl, pyrrolidinepropyl, polymerized aminopropyl and polyethyleneimine-attached MCM-48 samples are referred to as APS-, PyrPS-, and p-APS –MCM-48 respectively (Kim et al., 2005).
Figure 2.8 shows the results of FTIR measurements taken for commercial granular activated carbon (GAC) samples and modified samples (HTA-400, OXA-400, HTA-800, and OXA-800). For raw carbon, several peaks were observed at the 3571, 1729, 1422, and 1140cm−1 which is attributed to O–H stretching vibration, carboxylic and lactone structures, aromatic ring and C–O stretch of ethers respectively. Other than that, the spectrum exhibits two other peaks at 856 and 781cm−1 which is related to presence of C–H groups (Acedo-Ramos et al., 1993). Ammonia treatment contributes to the overlapping of O–H and N–H stretching vibrations bands ranging from 3376–3294 cm−1 observed for all modified samples which may be related to formation of hydrogen bonds between the adsorbed NH3 molecules and oxygen surface groups. For both treatment methods, spectrum of low temperature modified samples (HTA-400, OXA-400), contains peaks at 1665–1641cm−1 and 2251–2265cm−1 which is contributed to cyclic amide functionality and nitrile groups, respectively (Mangun et al., 2001). In addition, treatment with ammonia at elevated temperature leads to the presence of dominant peaks at 1334–1330cm−1 of pyridine-like functionalities (Jansen and Bekkam, 1994).
Abso
rban
ce
Wave number (cm-1)
© COPYRIG
HT UPM
22
Figure 2.8: FT-IR spectra of the untreated carbon and modified commercial granular activated carbon (GAC) samples of OXA-400 and OXA-800 which represents ammonia treatment of oxidized sample at 400 and 800 °C; HTA-400 and HTA-800 which represents ammonia modification of heat treated samples at 400 and 800°C (Shafeeyan et al., 2011).
As a result of oxygen chemisorption, cyclic anhydrides and carboxylic species are present on the carbon surface. The reaction of NH3 with anhydride surface structures during the subsequent ammonia treatment can form surface ammonium salts of carboxylic acids that may lead to formation of amide structures through dehydration reaction (Stohr et al., 1991). Stronger signals in the regions at ∼1330 and ∼1660cm−1 indicates incorporation of nitrogen onto the carbon surface with formation of pyridine-like and amides structures, respectively ( Shafeeyan et al., 2011).
In Figure 2.9, The FTIR spectrum of the MCM-48 sample is compared with the amine-modified material. In band a, the sharp peak at 3743 cm-1 on the unmodified MCM-48 is attributed to the free hydroxyl groups on the surface. The IR bands of the surface hydroxyl groups vanished, indicating that all of the surface hydroxyl groups reacted with the aminopropyltriethoxysilane. The new IR bands shown in band b are those attributed to the characteristic vibrations of NH2 and CH2 groups. The two IR bands at 3368 and 3298 cm-1 are due to the asymmetric and symmetric NH2 stretchings. The band at 1590 cm-1 is attributed to the NH2 scissoring vibration (Huang et al., 2003).
Abso
rban
ce
Wave number (cm-1)
© COPYRIG
HT UPM
23
Figure 2.9: FTIR spectra of (a) MCM-48 and (b) 3-aminopropyl-functionalized MCM-48, amine-modified MCM-48 (Huang et al., 2003).
In summary, the effects of treating carbon based materials with amine will therefore introduce nitrogen functionalities to the carbon sample. This can be proven by constant appearance of nitrogen based bands at 1677 cm-1 and at 1400 cm-1 due to the amino groups. Amine treatments will also results to O–H and N–H stretching vibrations bands ranging from 3000-3100 cm-1 and 3376–3294 cm-1 observed for modified samples which may be related to formation of hydrogen bonds between the adsorbed NH3 molecules and oxygen surface groups. Oxygen functionalities such as chromene, ketone, and pyrone can contribute to the basicity of the carbon. These types of functional groups should be look into to provide clearer view on the difference of raw and treated sample to acknowledge the effectiveness of the nitrogen attachment to the parent carbon samples. Thus these functional groups can be an indicator to acknowledge the effectiveness of N2 attachment to the parent carbon sample.
2.4.3 Nitrogen content and pH values Activated carbon is effective to capture CO2 as it has high adsorption capacity at ambient pressure, can be regenerated and does not require moisture removal. The adsorption capacity depends on the surface chemistry and texture. Incorporation of nitrogen functionalities in the carbon structure can enhance the adsorption of the CO2. The nitrogen functionalities can be introduced by treatment with ammonia, amine or acid (Plaza et al., 2009a).
Abso
rban
ce
Wave number (cm-1)
© COPYRIG
HT UPM
24
One well-known recommendation to improve adsorption capacities of biochar is by incorporating amine compounds onto the carbon structure. A study on CO2 capture from high carbon fly ashes was conducted by Mercedes et al., (2008). Steam activation at 850°C and amine treatment consisting of monoethanolamine (MEA), diethanolamine (DEA) and methyldiethanolamine (MDEA) were performed for 20 minutes and dried in air at 120°C. The adsorption capacity of activated fly ashes treated with amine gives higher adsorption capacity compared to previous study with only fly ashes amine treatment with adsorption of 68.6 versus 45 mg CO2/g sorbent. As temperature increase for adsorption of CO2, the contribution of physical adsorption decreases and equalizes any gain in the chemical adsorption of the loaded amine group. Chemically attached amino groups in fly ash derived sorbents may have great potential when used in flue gases for CO2 capture (Maroto-Valer et al., 2008). CO2 is an acid gas; alkaline surface functional groups will favor chemisorptions of CO2. Some nitrogen groups are alkaline which are amine groups and imine groups (Maroto-Valer et al., 2005). A study performed by Plaza et al., (2005) has shown the effects of two different chemical treatments than enhances the nitrogen group in the samples which gives different amount of CO2 adsorption. Almond shells are treated by amination (pure ammonia flow) and ammoxidation (mixture of ammonia and oxygen gases) at 800°C. Ammonia reacts with the surface oxides present in the carbon, thereby forming ammonium salts and amine groups that through dehydration and dehydrogenation reactions lead to amides, nitriles, and pyridine- and pyrrol-like functionalities (Stohr et al., 1991; Jansen and Bekkum, 1995). Both amination and ammoxidation increases the nitrogen content to 5.1 wt% and 4 wt% with pH 12.0 and 10.3 respectively as compared to raw almond which has only 0.4 wt% of nitrogen with pH 9.6 indicating all the sorbents present a predominantly basic character. As of the adsorption carbon dioxide adsorption capacity, aminated and ammoxidised samples shows 9.7 wt% and 7 wt% of adsorbed CO2 as compared to raw which gives 6.8 wt% of CO2. Although ammoxidised sample has comparable amount of nitrogen contents of 4 wt% with aminated sample, the CO2 adsorbed by ammoxidation is lesser which may due to the different nature of nitrogen functionalities introduced by the two ammonia treatments. From the pH values of the ammoxidised sample, the functionalities present seems to be more acidic. Ammoxidation has incorporated nitrogen into amide groups leading to more acidic nature than the pyridinie (C5H5N) and pyrrole (C4H5N) group present in the aminated samples (Plaza et al., 2009). Table 2.8 shows the effects of sorbents synthesis with different types of amines which are diethylenetriamine (DETA), diisopropanolamine (DIPA), triethanolamine (TEA), 2-amino-2-methyl-1,3-propanediol (AMPD), pentaethylenehexamine (PEHA), and polyethyleneimine (PEI). The impregnation of immobilized amine increases the nitrogen and carbon content of samples. The increment of the N value shows the effectiveness of amine incorporation to the sample during chemical treatment. Amine is used as it is
© COPYRIG
HT UPM
25
mainly basis and is a good candidate to capture carbon dioxide which is acidic in nature. The pH values of the sorbents have also increased which indicates successful treatment of the samples with amines. However the assimilation of the amine has greatly decreased the surface area of the sorbents which may alter the effectiveness of carbon dioxide adsorption at different temperatures. In this case the sorbent treated by DETA gives the highest CO2 adsorption of 4.5 CO2 capture capacity/mass% as compared to raw sorbent which gives 3.8 CO2 capture capacity/mass% at 25°C. This shows that the amine treatment in efficient in order to capture carbon dioxde by increasing the nitrogen content and pH values to basis (Plaza et al., 2008).
Table 2.8: Chemical composition, point of zero charge (pHPZC) and BET surface area of solid mesoporous alumina treated with different types of
amines which are the diethylenetriamine (DETA), diisopropanolamine (DIPA), triethanolamine (TEA), 2-amino-2-methyl-1,3-propanediol (AMPD), pentaethylenehexamine (PEHA), and polyethyleneimine (PEI) (Plaza et al.,
2008).
Adsorbent Nitrogen (%) pH
Surface area (m2/g) CO2 Capture
capacity/mass%
A (Raw sample) 0 9.1 271 3.8 A-DETA 6.7 10.2 60 4.5 A-DIPA 2.4 10.5 37 2.1 A-AMPD 1.5 10.2 149 2.5 A- TEA 2.1 9.6 58 1.9
A- PEHA 8.5 11.1 24 2.0 A-PEI 6.8 11 58 4.1
Table 2.9 represents the effects of high amount of nitrogen incorporated in the olive stones that may affect the carbon adsorption . GKOS N800 gives the highest amount of carbon dioxide adsorption of 8.6 and 2.6 wt% at temperature of 25 and 100°C respectively as compared with other samples which gives lower adsorption. This may due to the high nitrogen content of 3.64% and highest pH of 11.3. Amination has significantly increases the amount of nitrogen incorporated into the carbon matrix. This nitrogen fixation comes from the reaction of ammonia with carbon surface oxides to form ammonium salts and amine groups that, upon dehydration and dehydrogenation produce amides, nitriles and pyridine or pyrrole-like functionalities. The incorporation of nitrogen has increased the basicity of the adsorbent which is a suitable precursor for carbon dioxide of acidic in nature (Plaza et al., 2009). Carbon dioxide is an acidic gas therefore the presence of basic species can cause a priori basic character of the carbon surface which promotes the CO2 adsorption . (Alvim-Ferraz and Todo-Bom, 2003; Lach et al., 2007).
© COPYRIG
HT UPM
26
Table 2.9: Chemical and textural characterization of the raw and aminated olive stones and CO2 capture capacity at 25 and 100 °C (Plaza et al., 2009).
Adsorbent pH
Surface area
(m2/g)
Adsorption capacity (wt%)
Nitrogen content
(%) 25°C 100°C
Olive stones char 8.7 43 5.8 1.5 0.3
Amination of olive stones at 400°C 8.9 152 6.8 1.9 0.88
Amination of olive stones at 600°C 9.2 232 7.1 2.1 2.58
Amination of olive stones at 800°C 11.3 390 8.6 2.6 3.64
Amination of olive stones at 900°C 10.9 442 7.3 2.5 3.06
2.4.4 Surface morphology
Scanning electron microscopy (SEM) is an electron microscope that is able to reflect electrons from the surface of specimen resulting in a three-dimensional image of the surface that present high resolution and a high intensity of focus vision of the object. The images obtained from scanning electron microscopy (SEM) help to differentiate the structure of the raw and treated amine samples. Figure 2.9a shows the images of raw silica foams and amine modified silica samples. Porous structures are preferably to assist the carbon dioxide adsorption onto the carbon surface. There are many large external pores between the particles, which assist the diffusion of gas to the surface of the sorbent. The amine treatment has coated on the external surface of the silica sample due to the loading of polyethyleneimine (PEI). In the amine-supported adsorbents, amines are added into the pores of the mesoporous substrate leading to high dispersion of amines. This will help to increase their CO2 adsorption due to the bulk amines. Generally adsorption of CO2 on the carbon is a result of both chemical interactions with the amine groups and physisorption on the surface of the sorbents (Yan et al., 2011).
© COPYRIG
HT UPM
27
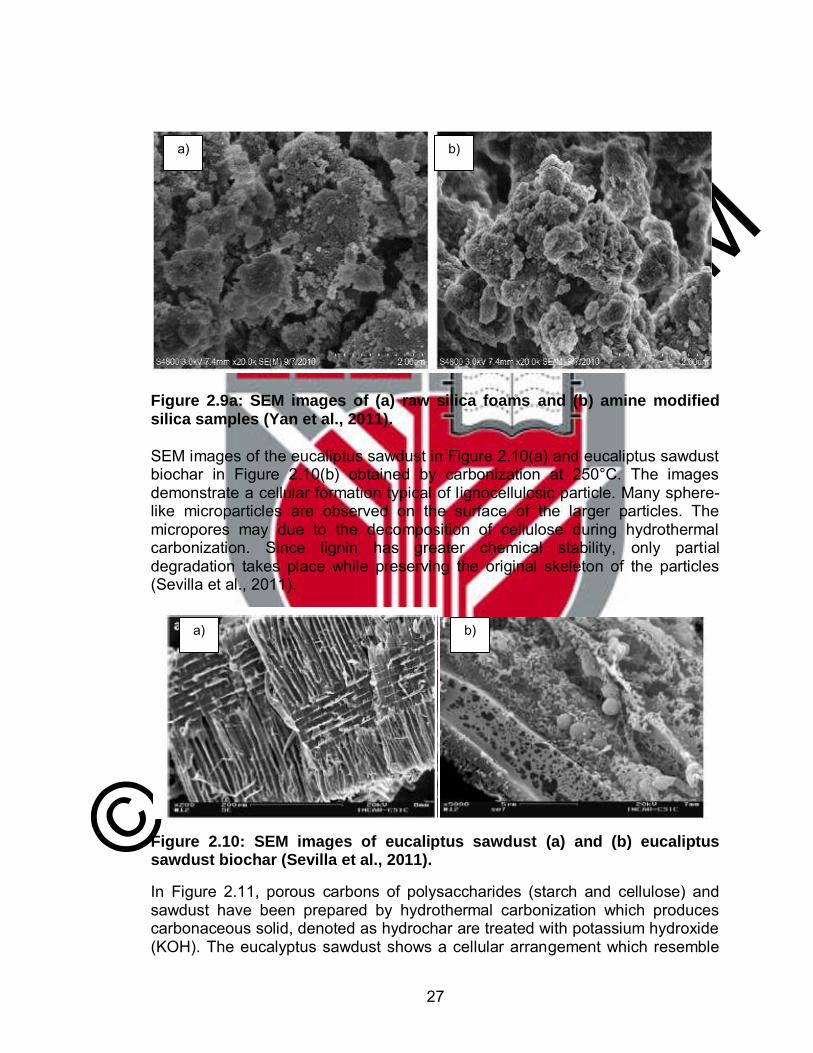
Figure 2.9a: SEM images of (a) raw silica foams and (b) amine modified silica samples (Yan et al., 2011).
SEM images of the eucaliptus sawdust in Figure 2.10(a) and eucaliptus sawdust biochar in Figure 2.10(b) obtained by carbonization at 250°C. The images demonstrate a cellular formation typical of lignocellulosic particle. Many sphere-like microparticles are observed on the surface of the larger particles. The micropores may due to the decomposition of cellulose during hydrothermal carbonization. Since lignin has greater chemical stability, only partial degradation takes place while preserving the original skeleton of the particles (Sevilla et al., 2011).
Figure 2.10: SEM images of eucaliptus sawdust (a) and (b) eucaliptus sawdust biochar (Sevilla et al., 2011).
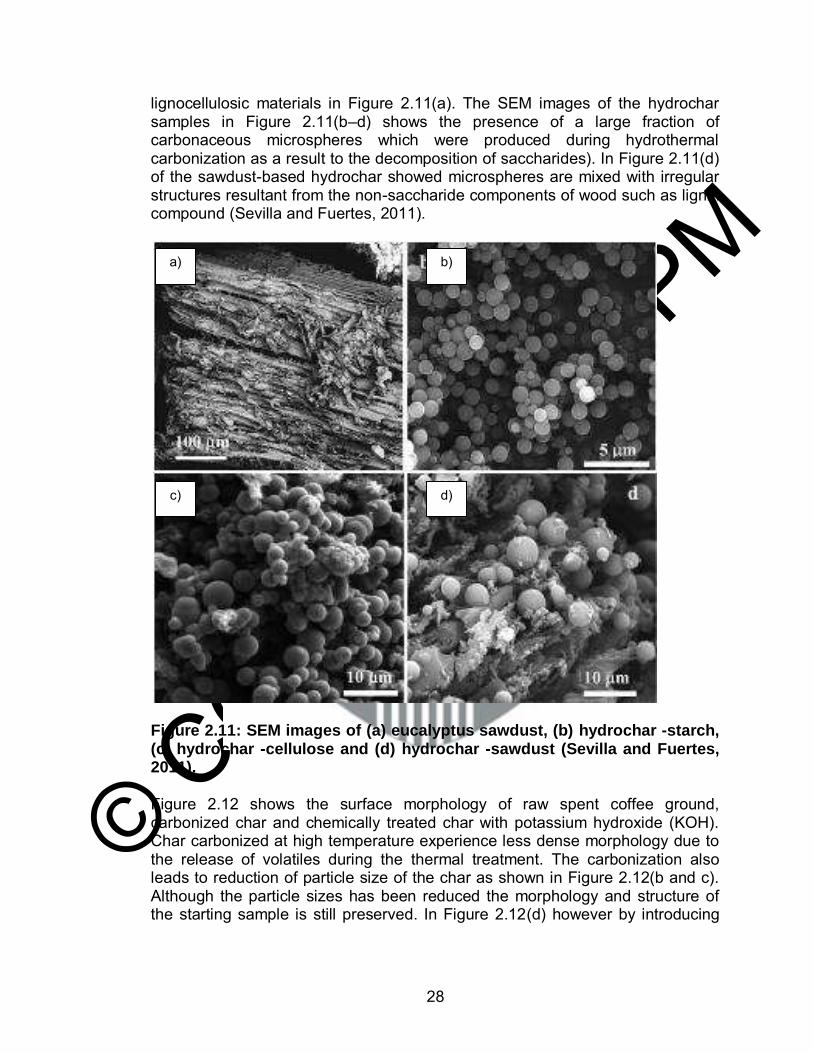
In Figure 2.11, porous carbons of polysaccharides (starch and cellulose) and sawdust have been prepared by hydrothermal carbonization which produces carbonaceous solid, denoted as hydrochar are treated with potassium hydroxide (KOH). The eucalyptus sawdust shows a cellular arrangement which resemble
a) b)
a) b)
© COPYRIG
HT UPM
28
lignocellulosic materials in Figure 2.11(a). The SEM images of the hydrochar samples in Figure 2.11(b–d) shows the presence of a large fraction of carbonaceous microspheres which were produced during hydrothermal carbonization as a result to the decomposition of saccharides). In Figure 2.11(d) of the sawdust-based hydrochar showed microspheres are mixed with irregular structures resultant from the non-saccharide components of wood such as lignin compound (Sevilla and Fuertes, 2011).
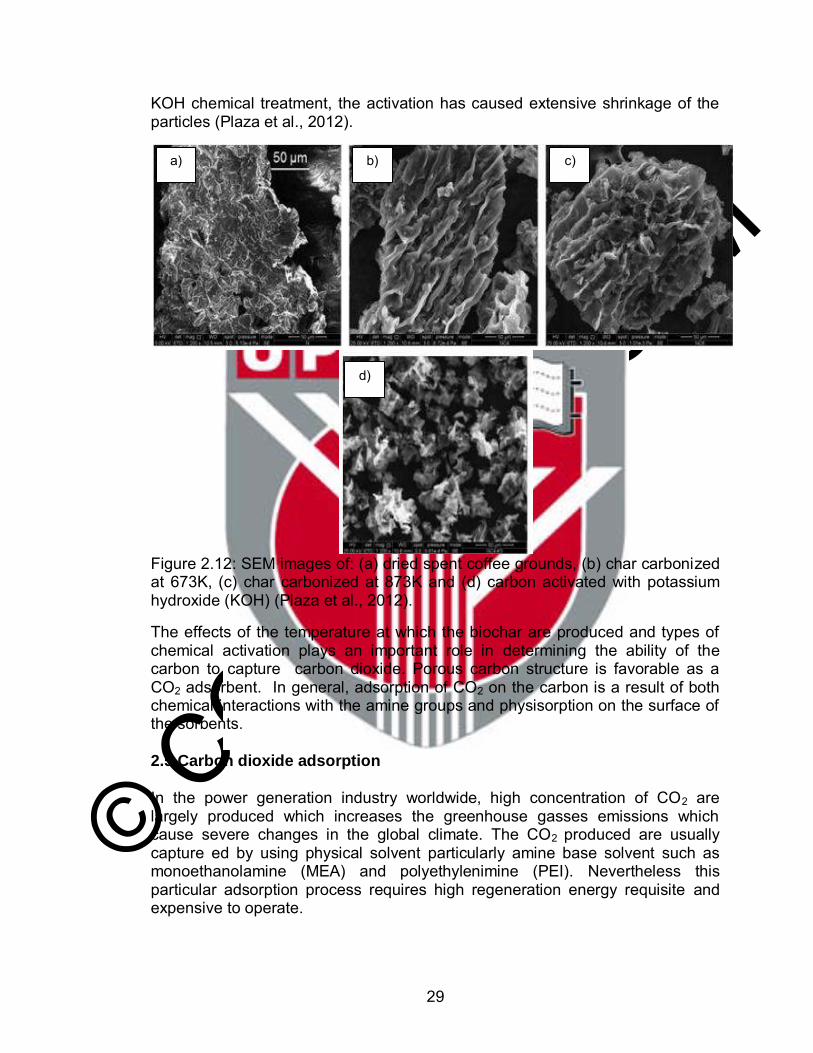
Figure 2.11: SEM images of (a) eucalyptus sawdust, (b) hydrochar -starch, (c) hydrochar -cellulose and (d) hydrochar -sawdust (Sevilla and Fuertes, 2011). Figure 2.12 shows the surface morphology of raw spent coffee ground, carbonized char and chemically treated char with potassium hydroxide (KOH). Char carbonized at high temperature experience less dense morphology due to the release of volatiles during the thermal treatment. The carbonization also leads to reduction of particle size of the char as shown in Figure 2.12(b and c). Although the particle sizes has been reduced the morphology and structure of the starting sample is still preserved. In Figure 2.12(d) however by introducing
a) b)
c) d)
© COPYRIG
HT UPM
29
KOH chemical treatment, the activation has caused extensive shrinkage of the particles (Plaza et al., 2012).
Figure 2.12: SEM images of: (a) dried spent coffee grounds, (b) char carbonized at 673K, (c) char carbonized at 873K and (d) carbon activated with potassium hydroxide (KOH) (Plaza et al., 2012).
The effects of the temperature at which the biochar are produced and types of chemical activation plays an important role in determining the ability of the carbon to capture carbon dioxide. Porous carbon structure is favorable as a CO2 adsorbent. In general, adsorption of CO2 on the carbon is a result of both chemical interactions with the amine groups and physisorption on the surface of the sorbents.
2.5 Carbon dioxide adsorption
In the power generation industry worldwide, high concentration of CO2 are largely produced which increases the greenhouse gasses emissions which cause severe changes in the global climate. The CO2 produced are usually capture ed by using physical solvent particularly amine base solvent such as monoethanolamine (MEA) and polyethylenimine (PEI). Nevertheless this particular adsorption process requires high regeneration energy requisite and expensive to operate.
a) b) c)
d)
© COPYRIG
HT UPM
30
In order to find a suitable substitute to the current CO2 adsorption technology, activated carbon incorporated with nitrogen functionalities are being utilized. Since CO2 is an acid gas, the attached alkaline groups will favor chemisorptions of CO2 (Maroto-Valer et al., 2005). Studies have shown that by incorporating amine base chemicals to the activated carbon at which the adsorbent has higher potential to uptake CO2, provides more stable condition and is cost saving (Xu et al., 2009; Wang et al., 2012; Kim et al., 2010). The chemical incorporation of basis and acid modifies the properties of carbon consequently changes the capability of the adsorbent to adsorb CO2. Biochar which provides good surface area, stable condition and is easily acquired is anticipated as a potentially excellent adsorbent to capture CO2. Table 2.10 shows several treatments involving amine that affects the CO2 adsorption capacity of the carbon.
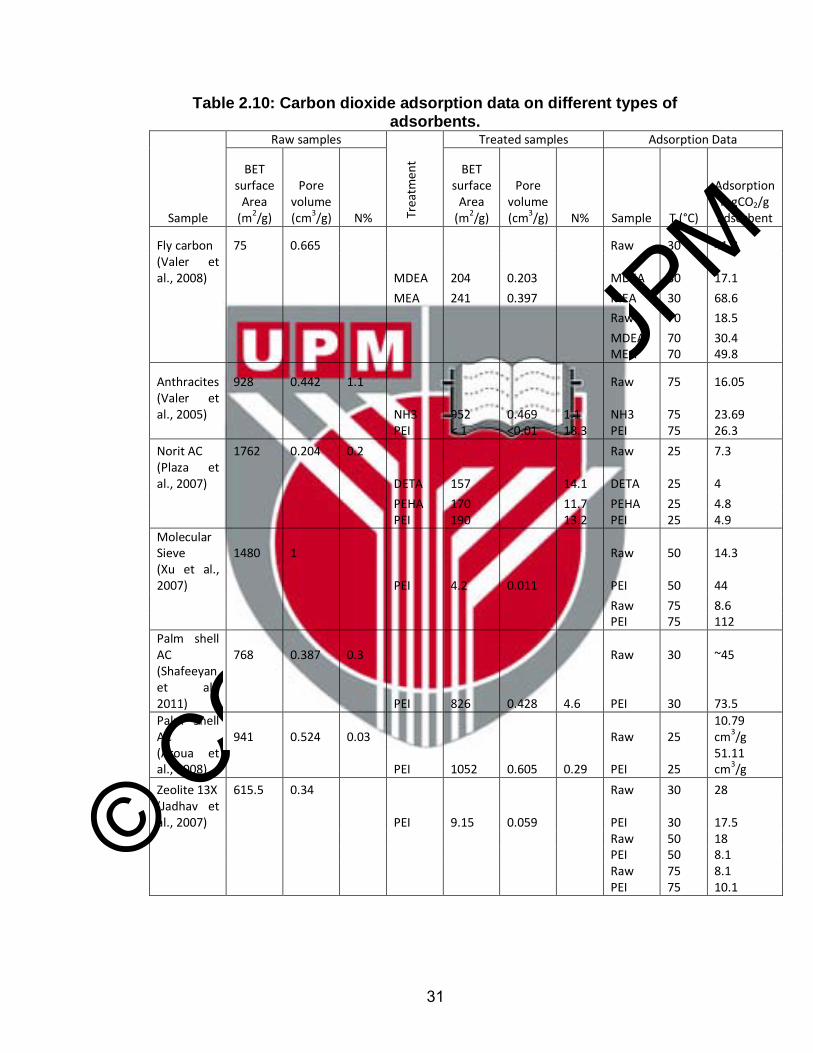
© COPYRIG
HT UPM
31
Table 2.10: Carbon dioxide adsorption data on different types of adsorbents.
Sample
Raw samples
Trea
tmen
t
Treated samples Adsorption Data
BET surface
Area (m
2/g)
Pore volume (cm
3/g) N%
BET surface
Area (m
2/g)
Pore volume (cm
3/g) N% Sample T (°C)
Adsorption mgCO2/g
adsorbent
Fly carbon 75 0.665 Raw 30 41.8 (Valer et al., 2008)
MDEA 204 0.203
MDEA 30 17.1
MEA 241 0.397
MEA 30 68.6
Raw 70 18.5
MDEA 70 30.4
MEA 70 49.8
Anthracites 928 0.442 1.1 Raw 75 16.05 (Valer et al., 2005)
NH3 952 0.469 1.1 NH3 75 23.69
PEI < 1 <0.01 18.3 PEI 75 26.3
Norit AC 1762 0.204 0.2 Raw 25 7.3 (Plaza et al., 2007)
DETA 157 14.1 DETA 25 4
PEHA 170 11.7 PEHA 25 4.8
PEI 190 13.2 PEI 25 4.9
Molecular Sieve 1480 1 Raw 50 14.3 (Xu et al., 2007)
PEI 4.2 0.011
PEI 50 44
Raw 75 8.6 PEI 75 112
Palm shell AC 768 0.387 0.3 Raw 30 ~45 (Shafeeyan et al., 2011) PEI 826 0.428 4.6 PEI 30 73.5
Palm Shell AC 941 0.524 0.03 Raw 25
10.79 cm3/g
(Aroua et al., 2008) PEI 1052 0.605 0.29 PEI 25
51.11 cm
3/g
Zeolite 13X 615.5 0.34 Raw 30 28 (Jadhav et al., 2007)
PEI 9.15 0.059
PEI 30 17.5
Raw 50 18
PEI 50 8.1
Raw 75 8.1 PEI 75 10.1
© COPYRIG
HT UPM
32
In the study of carbon dioxide adsorption using fly ashes residues from utilty industry, it was discovered that the adsorption is relatively low as compared to commercial activated carbon. Therefore the fly ashes were activated and treated with different types of amine to evaluate the effectiveness of the sample to capture CO2. The samples were steam activated at 850°C, which results to significant increase of the surface area to 1075 m2/g from 75 m2/g of raw sample. The activation and burn-off has initiated the formation of mesopores due to the removal of pore walls and enlargement of micropores. The highest adsorption capacity at 30 and 70 °C of 68.6 and 49.8 CO2 adsorption capacity mgCO2/g adsorbent for the Monoethanolamine (MEA) impregnation by using thermogravimetric analyzer (TGA). This is due to the combination of physical adsorption inherent from the parent sample and chemical adsorption of the loaded amine groups. The CO2 uptake is showing lower values as temperature increases. The main reaction responsible for CO2 chemical adsorption with amine is believed to be carbamate formation as temperature increases (Satyapal et al., 2001).The decline in CO2 adsorption at elevated temperatures may be related to the volatilization of the amines in which the flash point of MEA is 85°C (Maroto-Valer et al., 2008). A study by Valer, Tang and Zhang has shown that by steam activation and impregnation of amine onto anthracites can help to increase the capacity of adsorption. However the CO2 adsorption does not show a linear relationship with the surface area. This can be seen whereby sample treated with PEI with surface area of <1 m2/g gives adsorption of 26.3 mgCO2/g adsorbent as compared to raw sample with surface area of 928 m2/g giving adsorption of 16.05 mgCO2/g adsorbent. NH3 treatment and PEI impregnation can enhance the CO2 adsorption of the activated anthracites at elevated temperature, due to the introduction of alkaline nitrogen groups via amine treatment (Maroto-Valer et al., 2005). Amine incorporation onto Norit AC by Diethylentriamine (DETA), pentaethylenehexamine (PEHA) and polyethylenimine (PEI) impregnation has shown reducing value of adsorption results as compared to raw samples. Immobilized amines are foreseen to replace liquid amines in the typical absorption process, given the advantages that solids are simple to deal with and do not provide corrosion problems. Raw sample presents the highest CO2 capture of 7.3 mgCO2/g adsorbent as compared to treated samples due to the other modified sorbents has blockage of amine film in the pores. The amine incorporation significantly reduced the microporous volume of the carbon that is mainly responsible for CO2 physisorption thus decreasing the capacity of adsorption at room temperature (Plaza et al., 2007). Polyethylenimine (PEI)-modified mesoporous molecular sieve of MCM-41 carbon has shown promising adsorption capacity of 44 and 112 mgCO2/g adsorbent as compared to raw MCM-41 carbon with capacity of 14.3 and 8.6 mgCO2/g adsorbent at temperature 50 and 75°C respectively. Generally as adsorption temperature increased, the adsorption amount will decrease.
© COPYRIG
HT UPM
33
Conversely in this study the adsorption increases. At low temperature the PEI exists in the channels of carbon in nanosize particles. In this case, only the sites alike on the surface of the particles can at once react with the CO2. The reaction of the similar sites inside the nanosize particles can only happen when the CO2 are diffused into the particles. This reaction can be described as a kinetically (diffusion)-controlled process in which the access of CO2 to the affinity (similar) sites inside the PEI particles will be subject to the diffusion limitation. Therefore, CO2 may reach more attraction if the diffusion time is sufficiently long. At higher temperature, however more affinity sites are opened to the CO2 and thus the adsorption capacity increases although the adsorption time is short (Xu et al., 2002). A commercial granular activated carbon (GAC) was treated via thermal treatment with ammonia. Ammonia treatment with pre oxidation at 800°C has increased the nitrogen content of the carbon from 0.3 to 4.6 % and increased the surface area from 768 to 826 m2/g. The existence of nitrogen functionalities on the carbon surface generally increased the CO2 adsorption capacity whereby the adsorption rate from 45 to 73.5 mgCO2/g adsorbent. The decomposition of oxygen containing functionalities formed by the oxidation process increases the reactivity of ammonia molecules or nitrogen containing radicals to form nitrogen containing functional groups. Attachment of basic nitrogen surface groups over oxidation followed by amination has improved the adsorption of the carbon towards carbon dioxide, mainly due to the increase in micropore volumes and surface basicity (Shafeeyan et al., 2011). In the study by Aroua et al., 2008, it is shown that the adsorption capacity of palm shell-based activated carbon (AC) mainly depends on the value of micropores of a specific diameter present in the carbon as well as their volume. By the impregnation of Polyethylenimine (PEI), the adsorption capacity has increased from 10.79cm3/g to 51.11cm3/g. This is due to the increment of micropore volume from 0.524 to 0.605cm3/g. The nitrogen content after impregnation has also increased from 0.03 to 0.29%, which encouraged the adsorption of carbon dioxide particles on to the surface of carbon (Aroua et al., 2008). Zeolite 13X is modified with monoethanol amine (MEA) of different loadings from 0.5 to 25 wt % via impregnation method. Carbamate and bicarbonate species formation by the reaction of CO2 with amine functional groups were observed via FITR results. The adsorption of CO2 improved with raw sample giving 28, 18, 8.1 m2/g as compared to impregnated sample with adsorption of 17.5, 8.1, 10.1 m2/g at temperature of 30, 50 and 75°C respectively. The impregnated gives high adsorption values due to the role of the hybrid mechanism at higher temperatures despite reduced pore volume and lower surface area indicates whereby at 30 °C the physisorption process is dominant. At 75 °C, combined adsorption–absorption may play a role in sorption of CO2 in which the MEA molecule in the pore of the zeolite operate as a solvent contained in a reactor providing better contact between CO2 and MEA. This help to overcome typical
© COPYRIG
HT UPM
34
problems of CO2 absorption in liquid MEA like lower heat and mass transfer rates, liquid handling and corrosion (Jadhav et al., 2007).
2.6 Saturated Adsorption Model
In a study by Hutzinger et al., (2009), alkaline base industrial solid waste which contains high contents of oxides is an attractive adsorbent for mineral carbonation particularly cement kiln dust (Huntzinger et al., 2009). The adsorption of carbon dioxide appears to follow the unreacted core model theory where the reaction kinetics is controlled by a first order rate constant at early times. Nevertheless as carbonation progresses, the kinetics of the reaction slows down by the extent of the reaction due to diffusion control, with the extent of conversion never reaching completion. The product of dry mass between the initial precarbonated samples and dried carbonated product was assumed to equal the mass of CO2 consumed by the sample:
𝑀𝐶𝑂2
(𝑡) = 𝑀(𝑡) − 𝑀(𝑡 = 0) (2.1)
where MCO2(t) is the mass of CO2 capture ed after time, t, M(t) is the dry mass of the sample corrected for the mass gain due to hydration reactions and M(t=0) is the initial dry mass of the sample. The change in carbonate contents between pre- and postcarbonated samples is expressed in terms of %CO2 (dry mass):
%𝐶𝑂2(𝑡) =𝑀𝐶𝑂2
(𝑡)
𝑀(𝑡)× 100% (2.2)
The degree of carbonation (𝜉 (t)) was estimated by comparing the observed change in dry mass of each sample (MCO2(t)) with the calculated theoretical extent of carbonation based on the composition of the precarbonated waste:
𝜉 (𝑡) =𝑀𝐶𝑂2
(𝑡)
𝑀(𝑡=).𝑇ℎ𝐶𝑂2 (2.3)
where ThCO2 is the theoretical mass fraction of CO2 adsorption achievable based on stoichiometry and the reactive-oxide content of the waste. It was assumed that reactive calcium species in the waste (e.g., free CaO, Ca(OH)2, Ca2SiO3) were the major phases participating in the carbonation reactions.
A study by Lee (Lee, 2004) on the carbonation of CaO to capture CO2, utilized the results obtained by Bhatia and Permutter (Bhatia and Perlmutter, 1983) and Gupta and Fan (Gupta and Fan, 2002). The model describes the kinetics of the carbonation reaction of calcium oxide by carbon dioxide as a noncatalytic gas-solid reaction. Although the study focuses on the adsorption of CaO, the kinetic is also suitable to be implemented for other adsorbent as the reaction involves particularly gas–solid reaction. The carbonation reaction proceeds through two rate controlling regimes. At the very initial stage of reaction, the reaction occurs rapidly by heterogeneous surface chemical reaction kinetics. Following this initial stage, as compact layer is developed on the outer region of the particle, the rate
© COPYRIG
HT UPM
35
of reaction decreases due to the diffusion limitation of reacting species through the layer.
The ultimate conversion, Xu is the conversion at which no more significant conversion attained at the conversion temperature. Rate of conversion is expressed as:
𝑑𝑋
𝑑𝑡= 𝑘 (1 −
𝑋
𝑋𝑢)
𝑛
(2.4)
k = reaction constant (min-1)
X= conversion
Xu = ultimate conversion
By integrating Equation 2.4 with n=1 and n=2, the following conversion expressions can be obtained respectively:
𝑋 = 𝑋𝑈 [1 − exp (−𝑘
𝑋𝑢𝑡)] (2. 5)
𝑋 = 𝑋𝑈𝑡
(𝑋𝑢
𝑘 ) + 𝑡 (2. 6)
In Equation 2.6, if a constant b is the time taken to get half ultimate conversion, then X= Xu/b at t = b. By substituting this expression, the equation is defined as:
𝑋𝑢 = 𝑘𝑏 (2. 1)
Substituting Equation 2.7 in Equation 2.6 will yield below equation:
𝑋 = 𝑘𝑏𝑡
𝑏 + 𝑡 (2.7)
If molar rate of CO2 removal is interested, assuming no external mass transfer limitation of CO2 to CaO particles will yield another expression as below:
𝑟𝐶𝑂2 = 1
𝑀𝐶𝑎𝑂 (
𝑑𝑋
𝑑𝑡) (2.8)
𝑀𝐶𝑎𝑂 = 𝑀𝑜𝑙𝑒𝑐𝑢𝑙𝑎𝑟 𝑤𝑒𝑖𝑔ℎ𝑡 𝑜𝑓 𝐶𝑎𝑂 (𝑔
𝑚𝑜𝑙)
To determine the kinetic parameters by data fitting, Equation 2.7 can be written in linear form as follows:
1
𝑋=
1
𝑘 (
1
𝑡) +
1
𝑘𝑏 (2.9)
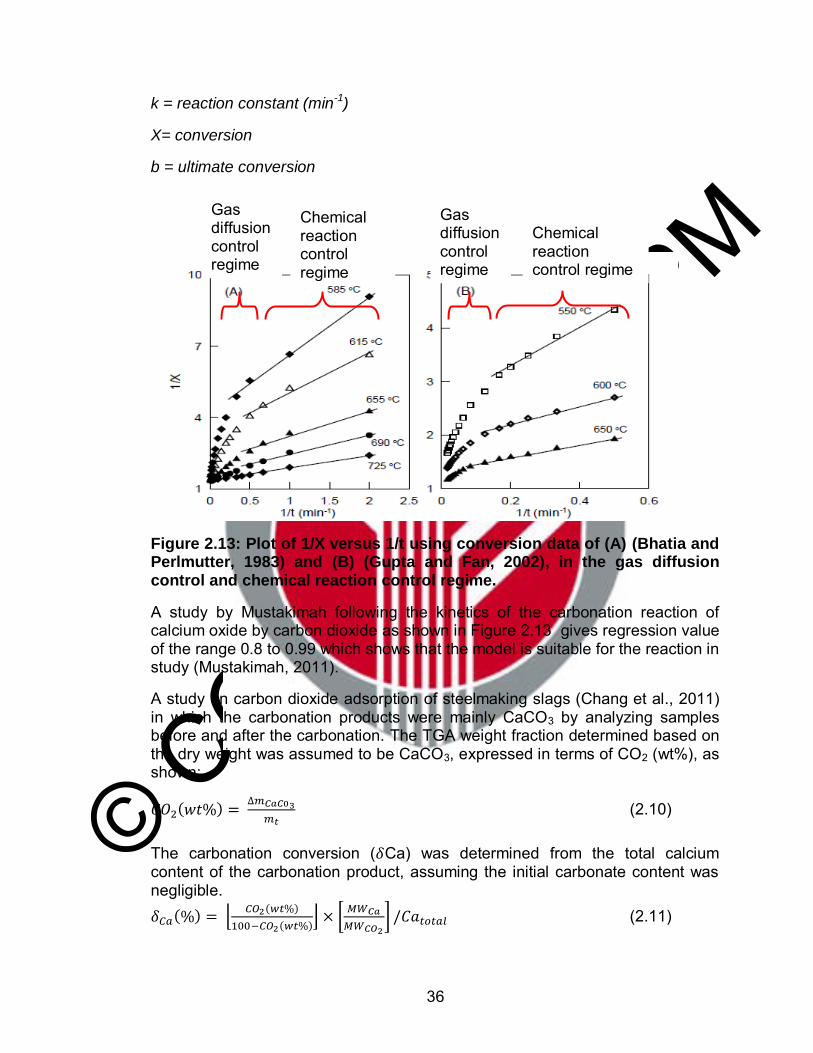
© COPYRIG
HT UPM
36
k = reaction constant (min-1)
X= conversion
b = ultimate conversion
Figure 2.13: Plot of 1/X versus 1/t using conversion data of (A) (Bhatia and Perlmutter, 1983) and (B) (Gupta and Fan, 2002), in the gas diffusion control and chemical reaction control regime.
A study by Mustakimah following the kinetics of the carbonation reaction of calcium oxide by carbon dioxide as shown in Figure 2.13 gives regression value of the range 0.8 to 0.99 which shows that the model is suitable for the reaction in study (Mustakimah, 2011).
A study on carbon dioxide adsorption of steelmaking slags (Chang et al., 2011) in which the carbonation products were mainly CaCO3 by analyzing samples before and after the carbonation. The TGA weight fraction determined based on the dry weight was assumed to be CaCO3, expressed in terms of CO2 (wt%), as shown:
𝐶𝑂2(𝑤𝑡%) = ∆𝑚𝐶𝑎𝐶03
𝑚𝑡 (2.10)
The carbonation conversion (𝛿Ca) was determined from the total calcium content of the carbonation product, assuming the initial carbonate content was negligible. 𝛿𝐶𝑎(%) = ⌊
𝐶𝑂2(𝑤𝑡%)
100−𝐶𝑂2(𝑤𝑡%)⌋ × [
𝑀𝑊𝐶𝑎
𝑀𝑊𝐶𝑂2
] /𝐶𝑎𝑡𝑜𝑡𝑎𝑙 (2.11)
Chemical reaction control regime
Gas diffusion control regime
Gas diffusion control regime
Chemical reaction control regime
© COPYRIG
HT UPM
37
where 𝛿Ca is the carbonation conversion, 𝑀𝑊𝐶𝑎 and 𝑀𝑊𝐶𝑂2 are the molar
weights of Ca and CO2, respectively, in kg/mol, and Catotal is the total Ca content of the fresh sample in kg/kg (Chang et al., 2011). The kinetic of carbonation describes that reaction occurs first at the outer layer of the particle. The zone of reaction will later move towards the solid leaving behind completely converted material and inert solid which is referred as ash. Therefore at any time there exists an unreacted core of material which reduces in size during reaction. The concentration of the gas segment differs depending on the particles radius. The gas-solid reaction proceeds through two rate controlling systems. At the early stage of reaction, the reaction occurs rapidly by heterogeneous surface chemical reaction kinetics. A compact layer at the outer region of particle is then developed in which the rate of reaction decreases because of the diffusion limitation of reacting species through the layer (Lee, 2004). In this study, the kinetic carbonation model is described as saturated adsorption model. The adsorption is foreseen to react at the outer layer at initial stage which is at the chemical regime. After the CO2 has been saturated at the outer region of the particle, diffusion limiting reaction happens whereby it takes more time for adsorption to happen.
2.7 Chapter summary
The chapter describes the potential of biochar as an adsorbent to capture CO2. In Malaysia, agricultural wastes are produced annually and potentially an attractive feedstock for producing energy as it use contributes little or no net carbon dioxide to the atmosphere. Thus the feedstock of biochar and the accessibility of the adsorbent are abundant and constantly available for CO2 adsorption purposes. Thermal gravimetric analyzer (TGA) is usually used in the study of the CO2 uptake which involves adsorbent such as zeolites, natural minerals, supported polymer, porous crystals and carbon based adsorbent. The experimental work usually involves the adsorption at different temperatures to evaluate the effectiveness of CO2 capture at different ambiance. The structural properties including surface area and pore size distribution coupled with basis surface chemistry of the biochar provide a good characteristic as a CO2 adsorbent. The studies by previous researchers have given a rough idea on the optimum condition of adsorption at which further improvements could be implemented to enhance the adsorption values of the biochar. Currently there are no detailed studies on the application of biochar to capture CO2 and its adsorptive properties that may relate to the amount of CO2 uptake. Therefore the development of biochar in this study is a good preliminary step to explore further into the knowledge of biochar adsorption mechanism. Saturated

© COPYRIG
HT UPM
38
adsorption model inspired by by Lee, (2004) is adapted in the study to evaluate the dominant process of the CO2 adsorption. The model study will be useful to describe the behavior of gas-solid reaction and the limiting steps that takes place during the CO2 adsorption.
© COPYRIG
HT UPM
39
CHAPTER 3
METHODOLOGY
3.1 Chapter Overview
This chapter illustrates the overall research methodology and procedures to produce the raw and amine treated biochar. The experimental works are discussed in detail and all materials and equipments related to mentioned goal are reported. Suitable characterization approaches, the study of carbonation kinetic and CO2 adsorption by using TGA are also described in this chapter. Figure 3.1 describes the overall procedures involved in the CO2 adsorption experiment.
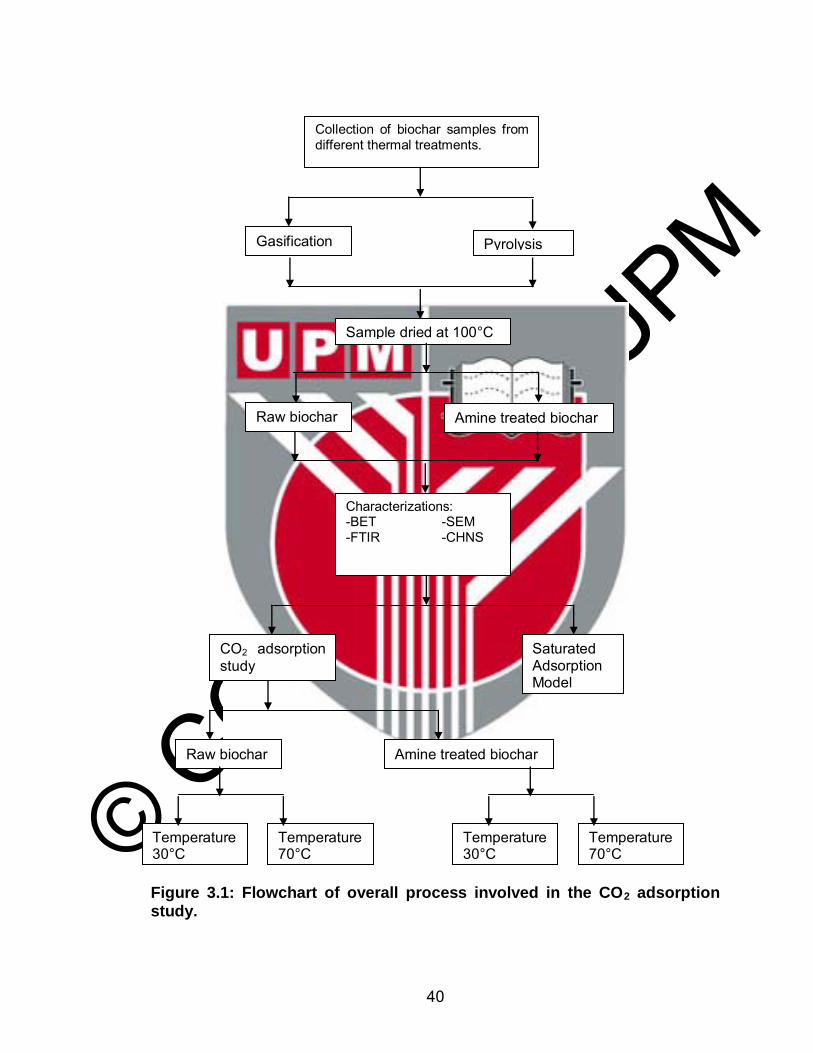
© COPYRIG
HT UPM
40
Figure 3.1: Flowchart of overall process involved in the CO2 adsorption study.
Collection of biochar samples from different thermal treatments.
Gasification Pyrolysis
Sample dried at 100°C
Raw biochar Amine treated biochar
Characterizations: -BET -SEM -FTIR -CHNS
Saturated Adsorption Model
CO2 adsorption study
Raw biochar Amine treated biochar
Temperature 30°C
Temperature 70°C
Temperature 30°C
Temperature 70°C
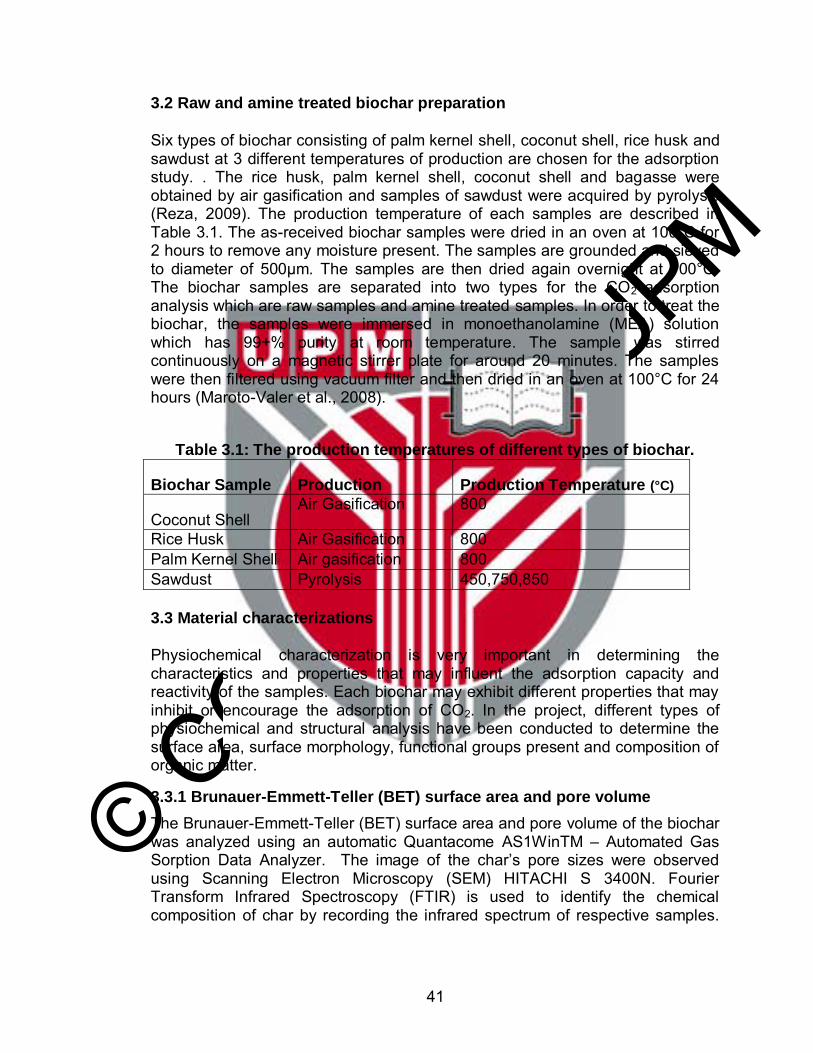
© COPYRIG
HT UPM
41
3.2 Raw and amine treated biochar preparation
Six types of biochar consisting of palm kernel shell, coconut shell, rice husk and sawdust at 3 different temperatures of production are chosen for the adsorption study. . The rice husk, palm kernel shell, coconut shell and bagasse were obtained by air gasification and samples of sawdust were acquired by pyrolysis (Reza, 2009). The production temperature of each samples are described in Table 3.1. The as-received biochar samples were dried in an oven at 100°C for 2 hours to remove any moisture present. The samples are grounded and sieved to diameter of 500μm. The samples are then dried again overnight at 100°C. The biochar samples are separated into two types for the CO2 adsorption analysis which are raw samples and amine treated samples. In order to treat the biochar, the samples were immersed in monoethanolamine (MEA) solution which has 99+% purity at room temperature. The sample was stirred continuously on a magnetic stirrer plate for around 20 minutes. The samples were then filtered using vacuum filter and then dried in an oven at 100°C for 24 hours (Maroto-Valer et al., 2008).
Table 3.1: The production temperatures of different types of biochar.
Biochar Sample Production Production Temperature (°C)
Coconut Shell Air Gasification 800
Rice Husk Air Gasification 800 Palm Kernel Shell Air gasification 800 Sawdust Pyrolysis 450,750,850
3.3 Material characterizations
Physiochemical characterization is very important in determining the characteristics and properties that may influent the adsorption capacity and reactivity of the samples. Each biochar may exhibit different properties that may inhibit or encourage the adsorption of CO2. In the project, different types of physiochemical and structural analysis have been conducted to determine the surface area, surface morphology, functional groups present and composition of organic matter.
3.3.1 Brunauer-Emmett-Teller (BET) surface area and pore volume
The Brunauer-Emmett-Teller (BET) surface area and pore volume of the biochar was analyzed using an automatic Quantacome AS1WinTM – Automated Gas Sorption Data Analyzer. The image of the char’s pore sizes were observed using Scanning Electron Microscopy (SEM) HITACHI S 3400N. Fourier Transform Infrared Spectroscopy (FTIR) is used to identify the chemical composition of char by recording the infrared spectrum of respective samples.
© COPYRIG
HT UPM
42
The compositions of the sample can be recognized by analyzing the spectra with the relative intensities which indicates different functional group.
3.3.2 Proximate and Ultimate Analysis
The proximate analysis in which to determine the moisture contents, volatile matter, fixed carbon and ash contents were performed using thermogravimetric analyzer (model Mettler Toledo, TGA/SDTA851, USA). Around ~10mg of biochar were mounted onto the crucible and inserted into the TGA furnace and weighed. The dry basis moisture content and volatile matter were determine by continuously heating the samples from 25 to 600°C at 10°C/min under nitrogen flow. The gas was then switched to air and heated to 900°C to obtain the fixed carbon content. The ash content is the residue that remains after the heating process. Elemental analysis was performed to evaluate the amount of carbon, hydrogen, nitrogen, sulfur and oxygen (by difference) in the sample. The analysis was carried out after complete combustion of the sample using a CHNS/O analyzer (model LECO TruSpec CHNS932, USA) following the ASTM D-5291 method. Approximately 2mg of dried samples were placed in a tin capsule and crimped. Blank, standard and biochar crimped sample capsules were placed in the auto sampler and oxidation was set at 1000°C. Helium was used as carrier gas while oxygen and nitrogen was used for combustion and make up gas respectively.
3.3.3 Fourier Transform Infrared Spectroscopy (FTIR) Spectral Analysis
The Fourier Transform Infrared Absorption (FTIR) spectra instrument (model Perkin-Elmer 100 series, USA) was used to identify the functional groups that are present in the biochar. Different types of functional groups may explain the capability of biochar to capture CO2.The spectrum range portrays the frequency arrays of 500 to 4000 cm-1.
3.3.4 Scanning Electron Microscopy (SEM) Analysis
The surface morphology of the biochar samples were characterized by using a SEM instrument (model HITACHI, S-3400N, Japan). Biochar was placed onto the SEM stubs which were supported by adhesives. The samples were then coated with gold for 5 minutes by placing the stub in a sputter coater (model EMITECH, K550X, USA). Gold coating is suitable for irregular shape samples such as powder and to ensure that the samples are conductive during the scanning progression.
3.3.5 Physisorption Analyzer
A Quantachrome instrument (model Atosorb-1, USA) was used to determine the physical properties of the biochar. The surface area and the pore properties were acquired by nitrogen adsorption-desorption isotherm at 77K consisting three steps which are dehydration, degassing under low vacuum pressure and gas adsorption. The resulting isotherm was analyzed using the BET adsorption
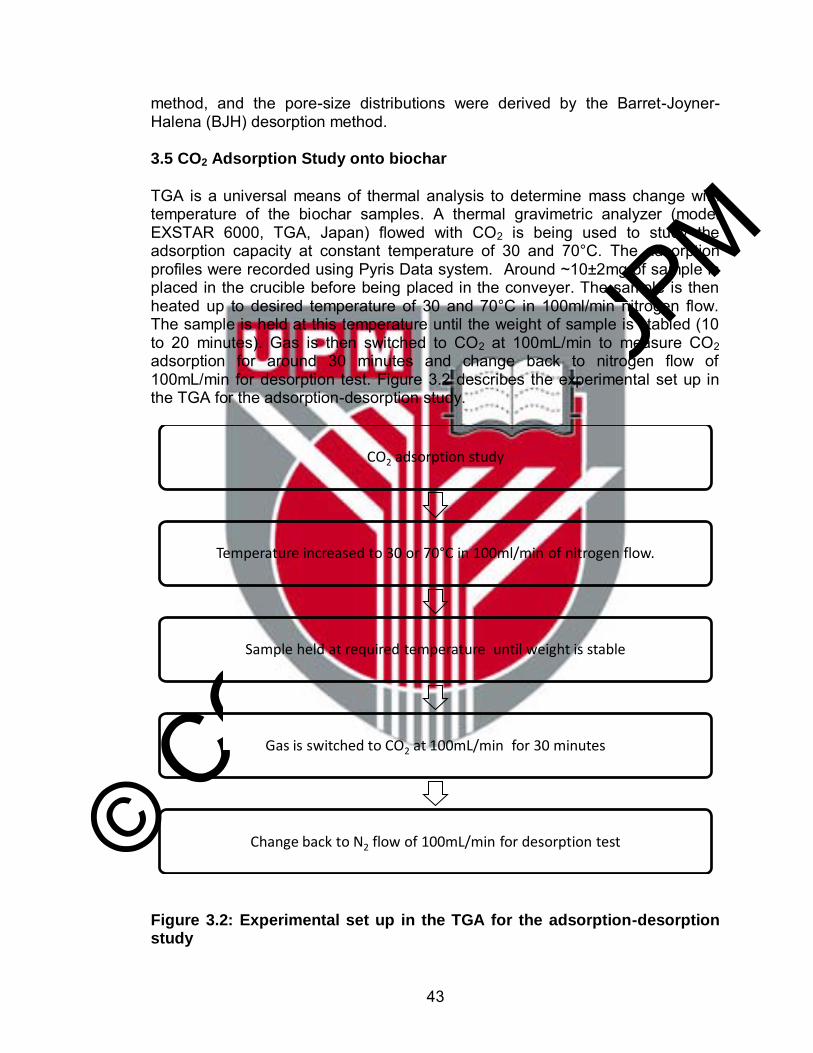
© COPYRIG
HT UPM
43
method, and the pore-size distributions were derived by the Barret-Joyner-Halena (BJH) desorption method.
3.5 CO2 Adsorption Study onto biochar
TGA is a universal means of thermal analysis to determine mass change with temperature of the biochar samples. A thermal gravimetric analyzer (model EXSTAR 6000, TGA, Japan) flowed with CO2 is being used to study the adsorption capacity at constant temperature of 30 and 70°C. The adsorption profiles were recorded using Pyris Data system. Around ~10±2mg of sample is placed in the crucible before being placed in the conveyer. The sample is then heated up to desired temperature of 30 and 70°C in 100ml/min nitrogen flow. The sample is held at this temperature until the weight of sample is stabled (10 to 20 minutes). Gas is then switched to CO2 at 100mL/min to measure CO2 adsorption for around 30 minutes and change back to nitrogen flow of 100mL/min for desorption test. Figure 3.2 describes the experimental set up in the TGA for the adsorption-desorption study.
Figure 3.2: Experimental set up in the TGA for the adsorption-desorption study
CO2 adsorption study
Temperature increased to 30 or 70°C in 100ml/min of nitrogen flow.
Sample held at required temperature until weight is stable
Gas is switched to CO2 at 100mL/min for 30 minutes
Change back to N2 flow of 100mL/min for desorption test
© COPYRIG
HT UPM
44
3.6 Saturated Adsorption Model of biochar
Saturated Adsorption Model of the biochar samples was performed by using TGA to analyze the model parameters and to understand the adsorption model of the biochar. A thermal gravimetric analyzer (model EXSTAR 6000, TGA, Japan) was used to carry out the adsorption at two different temperatures of 30 and 70°C. The sample is heated up to desired temperature of 30 and 70°C in 100ml/min nitrogen flow. The sample is held at this temperature until the weight of sample is stabled and the gas is switched to CO2 at 100mL/min to measure CO2 adsorption for around 30 minutes. The ultimate adsorptions, Xu of biochar during the adsorption are being evaluated using the saturated adsorption model inspired by carbonation kinetics by Lee (2004). The dominant process that takes place during the CO2 adsorption were evaluated and the behavior of the gas-solid adsorption were investigated in order to know whether the adsorption happens fast by chemical reaction control or the adsorption happens at slower rate by diffusion controlling rate.
3.7 Chapter Summary
The chapter has summarized the methodology and techniques that has been employed in the study. Physiochemical properties of biochar were characterized using BET, FTIR, SEM and CHNS to obtain the surface area, functional groups, surface morphology and organic contents in the biochar. The reactivity of CO2 adsorption was analyzed by using TGA. The adsorption method described in the project have been established and performed by most of previous studies (Plaza et al., 2012; Garcia et al., 2012; Sevilla et al., 2011; Kim et al., 2005; Maroto et al., 2005). The novelty of the project is the utilization of gasification and pyrolysis industrial residues for the adsorption process. By using these residues as adsorbent, the amount of waste can be minimized along with efforts to preserve the environment. Since the saturated adsorption model involves adsorption at different temperature, the pressure during the adsorption is not taken into account. During post combustion process to capture CO2, the flue gas stream usually has low pressure at which high pressure processing requires higher utility costs. Therefore the adsorption study takes place at normal atmosphere pressure at which it emphasized on low cost operation. The saturated adsorption model adapted in the study is important to evaluate the adsorption limiting factors and highlight the dominant process that takes place during the CO2 capture (Lee, 2004).
© COPYRIG
HT UPM
45
CHAPTER 4 RESULTS AND DISCUSSIONS
4.1 Chapter Overview
This chapter defines the results obtained through the experimental works and is divided into four main parts which are material characterization, CO2 adsorption-desorption study, comparison of biochar properties with its adsorption performance and saturated adsorption model. Material characterization section describes the results of characterization performed by using TGA, FTIR, SEM and BET. These analyses provide the thermal properties, functional groups, surface morphology and surface area of the studies biochar accordingly. These analyses provide information on the availability of certain properties or functional groups which may enhance the CO2 uptake. TGA provides the trend of CO2 adsorption-desorption by weight difference as time increases. The adsorption test was started by flowing nitrogen for 20 minutes and switched to CO2 for adsorption. The desorption test is performed by switching to nitrogen. The adsorption is designated by the increase of weight while the desorption is represented by the loss of weight. Comparison of biochar properties will be detailed out with its CO2 uptake. The effects of surface area, pore volume, types of functional groups and the nitrogen content will be discussed in detail to observe the relation between these characteristic which complements the adsorption capacity. Lastly the saturated adsorption model will be discussed to highlight the dominant process that takes place during the CO2 adsorption
4.2 Material characterization
Several characterization techniques that have been implemented in the study are able to support in understanding the morphology and properties of the samples which may be highly related to the effectiveness of the CO2 adsorption. Fourier Transform Infrared Spectroscopy (FTIR) helps to gather information on the presence of functional groups by using IR spectra that detects the change of transmittance intensity to frequency. Scanning Electron Microscopy (SEM) generates variety of signals on the surface of samples by using beam of electrons giving images which represents the surface morphology of the samples. Brunauer-Emmett-Teller (BET) Surface Area Analysis indicates the surface area, pore sizes and pore volumes of the biochar samples which provide highlights on the properties that influence the CO2 adsorption.
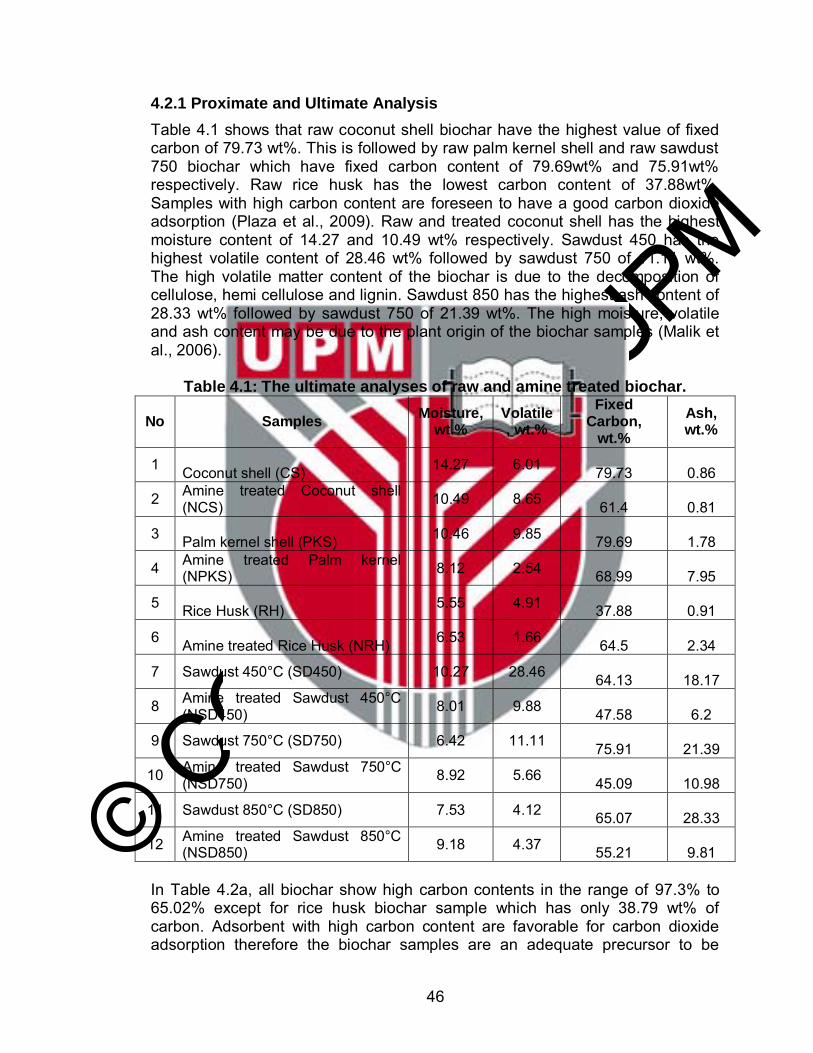
© COPYRIG
HT UPM
46
4.2.1 Proximate and Ultimate Analysis
Table 4.1 shows that raw coconut shell biochar have the highest value of fixed carbon of 79.73 wt%. This is followed by raw palm kernel shell and raw sawdust 750 biochar which have fixed carbon content of 79.69wt% and 75.91wt% respectively. Raw rice husk has the lowest carbon content of 37.88wt%. Samples with high carbon content are foreseen to have a good carbon dioxide adsorption (Plaza et al., 2009). Raw and treated coconut shell has the highest moisture content of 14.27 and 10.49 wt% respectively. Sawdust 450 has the highest volatile content of 28.46 wt% followed by sawdust 750 of 11.11 wt%. The high volatile matter content of the biochar is due to the decomposition of cellulose, hemi cellulose and lignin. Sawdust 850 has the highest ash content of 28.33 wt% followed by sawdust 750 of 21.39 wt%. The high moisture, volatile and ash content may be due to the plant origin of the biochar samples (Malik et al., 2006).
Table 4.1: The ultimate analyses of raw and amine treated biochar.
No Samples Moisture,
wt.% Volatile, wt.%
Fixed Carbon,
wt.%
Ash, wt.%
1 Coconut shell (CS) 14.27 6.01 79.73 0.86
2 Amine treated Coconut shell (NCS) 10.49 8.65 61.4 0.81
3 Palm kernel shell (PKS) 10.46 9.85 79.69 1.78
4 Amine treated Palm kernel (NPKS) 8.12 2.54 68.99 7.95
5 Rice Husk (RH) 5.55 4.91 37.88 0.91
6 Amine treated Rice Husk (NRH) 6.53 1.66 64.5 2.34
7 Sawdust 450°C (SD450) 10.27 28.46 64.13 18.17
8 Amine treated Sawdust 450°C (NSD450) 8.01 9.88 47.58 6.2
9 Sawdust 750°C (SD750) 6.42 11.11 75.91 21.39
10 Amine treated Sawdust 750°C (NSD750) 8.92 5.66 45.09 10.98
11 Sawdust 850°C (SD850) 7.53 4.12 65.07 28.33
12 Amine treated Sawdust 850°C (NSD850) 9.18 4.37 55.21 9.81
In Table 4.2a, all biochar show high carbon contents in the range of 97.3% to 65.02% except for rice husk biochar sample which has only 38.79 wt% of carbon. Adsorbent with high carbon content are favorable for carbon dioxide adsorption therefore the biochar samples are an adequate precursor to be
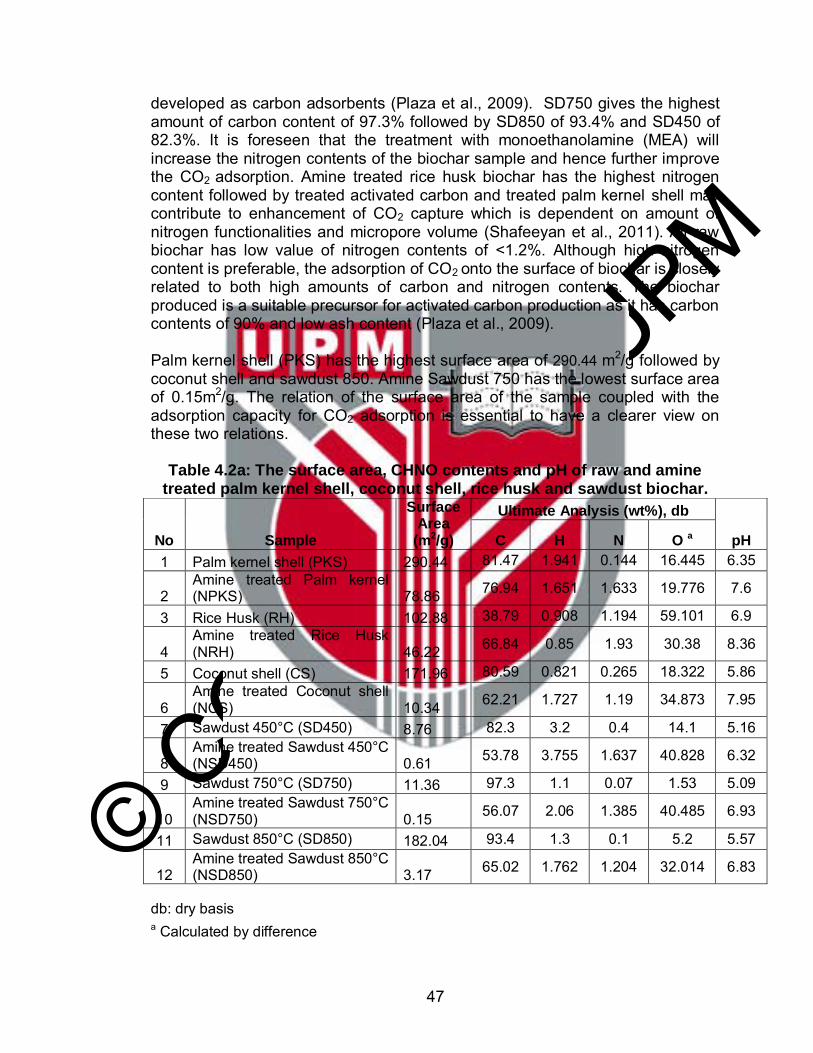
© COPYRIG
HT UPM
47
developed as carbon adsorbents (Plaza et al., 2009). SD750 gives the highest amount of carbon content of 97.3% followed by SD850 of 93.4% and SD450 of 82.3%. It is foreseen that the treatment with monoethanolamine (MEA) will increase the nitrogen contents of the biochar sample and hence further improve the CO2 adsorption. Amine treated rice husk biochar has the highest nitrogen content followed by treated activated carbon and treated palm kernel shell may contribute to enhancement of CO2 capture which is dependent on amount of nitrogen functionalities and micropore volume (Shafeeyan et al., 2011). All raw biochar has low value of nitrogen contents of <1.2%. Although high nitrogen content is preferable, the adsorption of CO2 onto the surface of biochar is closely related to both high amounts of carbon and nitrogen contents. The biochar produced is a suitable precursor for activated carbon production as it has carbon contents of 90% and low ash content (Plaza et al., 2009). Palm kernel shell (PKS) has the highest surface area of 290.44 m2/g followed by coconut shell and sawdust 850. Amine Sawdust 750 has the lowest surface area of 0.15m2/g. The relation of the surface area of the sample coupled with the adsorption capacity for CO2 adsorption is essential to have a clearer view on these two relations.
Table 4.2a: The surface area, CHNO contents and pH of raw and amine treated palm kernel shell, coconut shell, rice husk and sawdust biochar.
No Sample
Surface Area
(m2/g)
Ultimate Analysis (wt%), db
pH C H N O a
1 Palm kernel shell (PKS) 290.44 81.47 1.941 0.144 16.445 6.35
2 Amine treated Palm kernel (NPKS) 78.86 76.94 1.651 1.633 19.776 7.6
3 Rice Husk (RH) 102.88 38.79 0.908 1.194 59.101 6.9
4 Amine treated Rice Husk (NRH) 46.22 66.84 0.85 1.93 30.38 8.36
5 Coconut shell (CS) 171.96 80.59 0.821 0.265 18.322 5.86
6 Amine treated Coconut shell (NCS) 10.34 62.21 1.727 1.19 34.873 7.95
7 Sawdust 450°C (SD450) 8.76 82.3 3.2 0.4 14.1 5.16
8 Amine treated Sawdust 450°C (NSD450) 0.61 53.78 3.755 1.637 40.828 6.32
9 Sawdust 750°C (SD750) 11.36 97.3 1.1 0.07 1.53 5.09
10 Amine treated Sawdust 750°C (NSD750) 0.15 56.07 2.06 1.385 40.485 6.93
11 Sawdust 850°C (SD850) 182.04 93.4 1.3 0.1 5.2 5.57
12 Amine treated Sawdust 850°C (NSD850) 3.17 65.02 1.762 1.204 32.014 6.83
db: dry basis a Calculated by difference
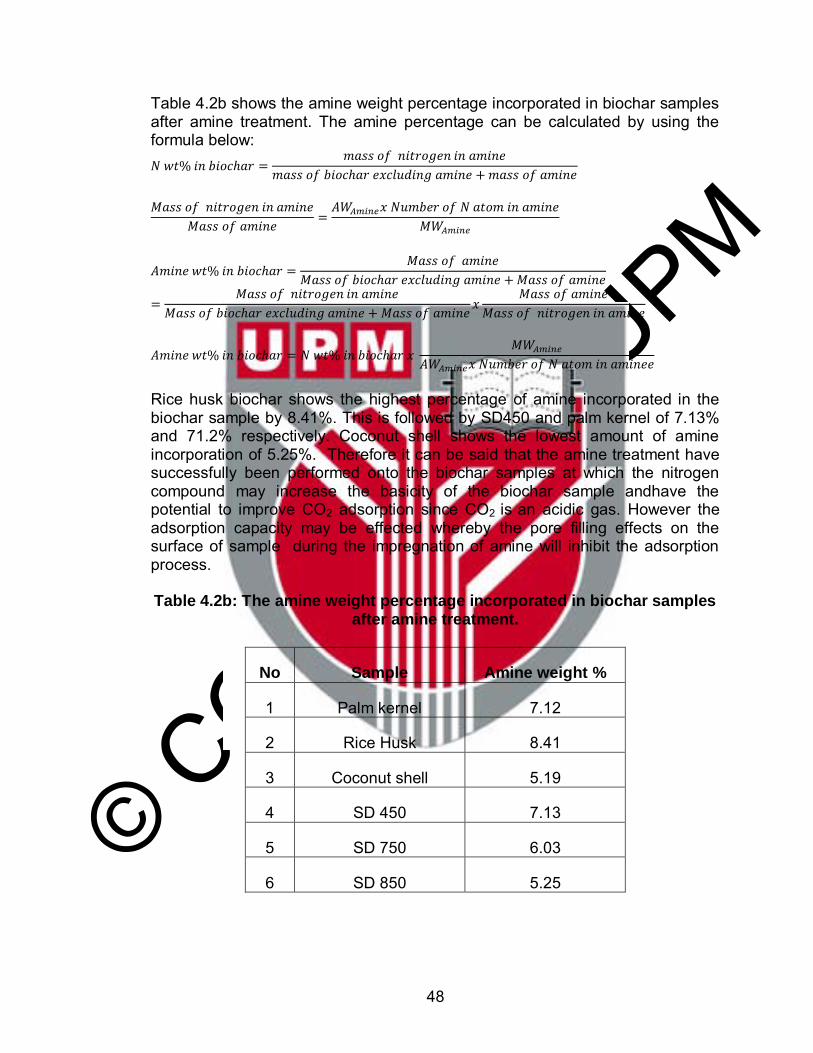
© COPYRIG
HT UPM
48
Table 4.2b shows the amine weight percentage incorporated in biochar samples after amine treatment. The amine percentage can be calculated by using the formula below: 𝑁 𝑤𝑡% 𝑖𝑛 𝑏𝑖𝑜𝑐ℎ𝑎𝑟 =
𝑚𝑎𝑠𝑠 𝑜𝑓 𝑛𝑖𝑡𝑟𝑜𝑔𝑒𝑛 𝑖𝑛 𝑎𝑚𝑖𝑛𝑒
𝑚𝑎𝑠𝑠 𝑜𝑓 𝑏𝑖𝑜𝑐ℎ𝑎𝑟 𝑒𝑥𝑐𝑙𝑢𝑑𝑖𝑛𝑔 𝑎𝑚𝑖𝑛𝑒 + 𝑚𝑎𝑠𝑠 𝑜𝑓 𝑎𝑚𝑖𝑛𝑒
𝑀𝑎𝑠𝑠 𝑜𝑓 𝑛𝑖𝑡𝑟𝑜𝑔𝑒𝑛 𝑖𝑛 𝑎𝑚𝑖𝑛𝑒
𝑀𝑎𝑠𝑠 𝑜𝑓 𝑎𝑚𝑖𝑛𝑒=
𝐴𝑊𝐴𝑚𝑖𝑛𝑒𝑥 𝑁𝑢𝑚𝑏𝑒𝑟 𝑜𝑓 𝑁 𝑎𝑡𝑜𝑚 𝑖𝑛 𝑎𝑚𝑖𝑛𝑒
𝑀𝑊𝐴𝑚𝑖𝑛𝑒
𝐴𝑚𝑖𝑛𝑒 𝑤𝑡% 𝑖𝑛 𝑏𝑖𝑜𝑐ℎ𝑎𝑟 =
𝑀𝑎𝑠𝑠 𝑜𝑓 𝑎𝑚𝑖𝑛𝑒
𝑀𝑎𝑠𝑠 𝑜𝑓 𝑏𝑖𝑜𝑐ℎ𝑎𝑟 𝑒𝑥𝑐𝑙𝑢𝑑𝑖𝑛𝑔 𝑎𝑚𝑖𝑛𝑒 + 𝑀𝑎𝑠𝑠 𝑜𝑓 𝑎𝑚𝑖𝑛𝑒
=𝑀𝑎𝑠𝑠 𝑜𝑓 𝑛𝑖𝑡𝑟𝑜𝑔𝑒𝑛 𝑖𝑛 𝑎𝑚𝑖𝑛𝑒
𝑀𝑎𝑠𝑠 𝑜𝑓 𝑏𝑖𝑜𝑐ℎ𝑎𝑟 𝑒𝑥𝑐𝑙𝑢𝑑𝑖𝑛𝑔 𝑎𝑚𝑖𝑛𝑒 + 𝑀𝑎𝑠𝑠 𝑜𝑓 𝑎𝑚𝑖𝑛𝑒𝑥
𝑀𝑎𝑠𝑠 𝑜𝑓 𝑎𝑚𝑖𝑛𝑒
𝑀𝑎𝑠𝑠 𝑜𝑓 𝑛𝑖𝑡𝑟𝑜𝑔𝑒𝑛 𝑖𝑛 𝑎𝑚𝑖𝑛𝑒
𝐴𝑚𝑖𝑛𝑒 𝑤𝑡% 𝑖𝑛 𝑏𝑖𝑜𝑐ℎ𝑎𝑟 = 𝑁 𝑤𝑡% 𝑖𝑛 𝑏𝑖𝑜𝑐ℎ𝑎𝑟 𝑥
𝑀𝑊𝐴𝑚𝑖𝑛𝑒
𝐴𝑊𝐴𝑚𝑖𝑛𝑒𝑥 𝑁𝑢𝑚𝑏𝑒𝑟 𝑜𝑓 𝑁 𝑎𝑡𝑜𝑚 𝑖𝑛 𝑎𝑚𝑖𝑛𝑒𝑒
Rice husk biochar shows the highest percentage of amine incorporated in the biochar sample by 8.41%. This is followed by SD450 and palm kernel of 7.13% and 71.2% respectively. Coconut shell shows the lowest amount of amine incorporation of 5.25%. Therefore it can be said that the amine treatment have successfully been performed onto the biochar samples at which the nitrogen compound may increase the basicity of the biochar sample andhave the potential to improve CO2 adsorption since CO2 is an acidic gas. However the adsorption capacity may be effected whereby the pore filling effects on the surface of sample during the impregnation of amine will inhibit the adsorption process. Table 4.2b: The amine weight percentage incorporated in biochar samples
after amine treatment.
No Sample Amine weight %
1 Palm kernel 7.12
2 Rice Husk 8.41
3 Coconut shell 5.19
4 SD 450 7.13
5 SD 750 6.03
6 SD 850 5.25
© COPYRIG
HT UPM
49
4.2.2 Scanning Electron Microscopy (SEM) Analysis
Carbon materials have porous surface, the size of which can easily be altered depending on activation methods (Francisco, 1998). The biochar heated at 800°C appeared brittle with planar fractures as shown in Figure 4.1a, b, c and d for the structures of rice husk and palm kernel shell. The surface morphology of rice husk in Figure 4.1a shows fiber-like hollow tubes which may have resulted from the fiber in the original plant biomass (Mei et al., 2012). After the amine treatment, the pores of the carbons have been reduced due to amine loading that takes place in between the pores as shown in Figure 4.1b, 4.1d, 4.1f and 4.1h. The SEM image of coconut shell showed that the lignin particles has softened, melted and fused into a mass of matrix and vesicles as shown in Figure 4.1e. The shape of the vesicles maintained after the cooling process (Ramesh et al., 2004). Microscopic observation shows the particle character and structure dissimilarity of the raw and treated sample. Figure 4.1e shows the gasification effects of the biochar production provide pore openings which are characterized as randomly distributed and heterogeneous in size. The particles are irregular in shape. In Figure 4.1f, the effects of amine treated sample shows close packing of the biochar grains with fewer pores and voids. Small pores are identified with agglomerations in the pores. This may justify the decrement of the surface area from the BET results of the treated sample where the pores may have been blocked. The surface morphology of the sawdust produced at 450, 750 and 850°C as shown in Figure 4.1g, h, i, j, k and l show irregular and porous surfaces. There is increased porosity from volatiles escaping during thermal treatment. (Catherine et al., 2009). This porous structure of the biochar facilitates the effectiveness of the char for CO2 adsorption as activated carbon. The porous surface does not change much for the treated sawdust samples except for the sawdust produced at 450°C as shown in 4.1h which shows blocked pores after the amine loading.
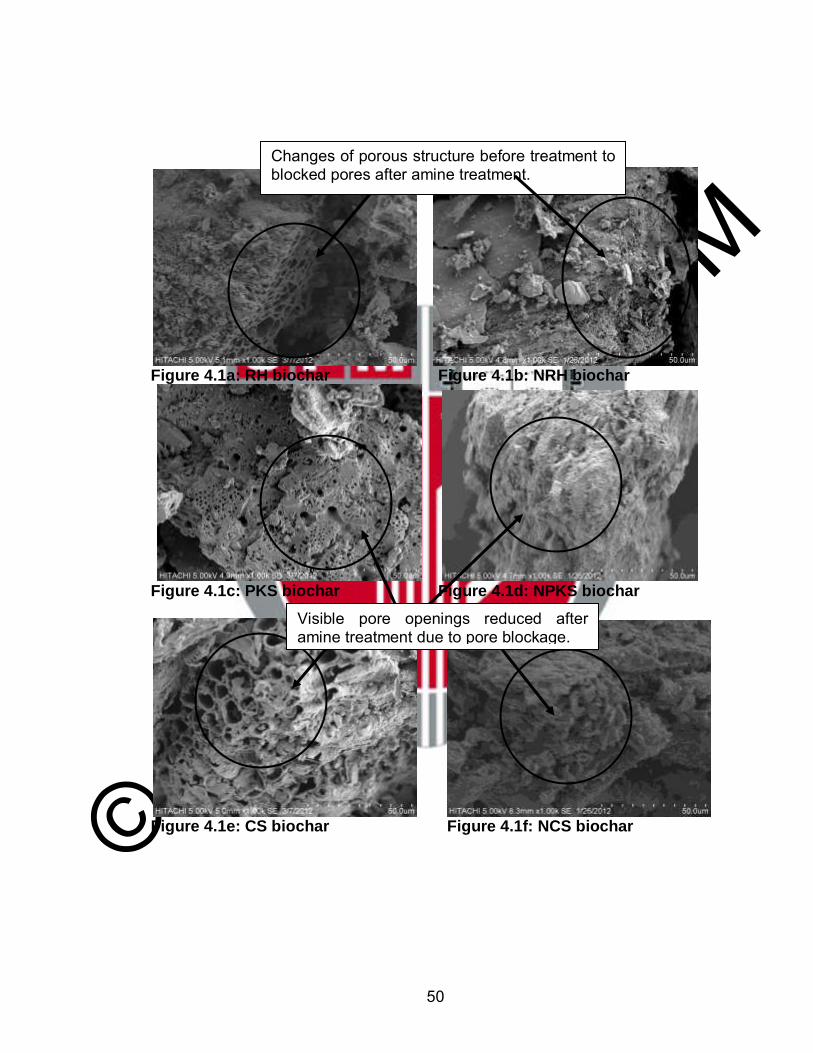
© COPYRIG
HT UPM
50
Figure 4.1a: RH biochar Figure 4.1b: NRH biochar
Figure 4.1c: PKS biochar Figure 4.1d: NPKS biochar
Figure 4.1e: CS biochar Figure 4.1f: NCS biochar
Changes of porous structure before treatment to blocked pores after amine treatment.
Visible pore openings reduced after amine treatment due to pore blockage.
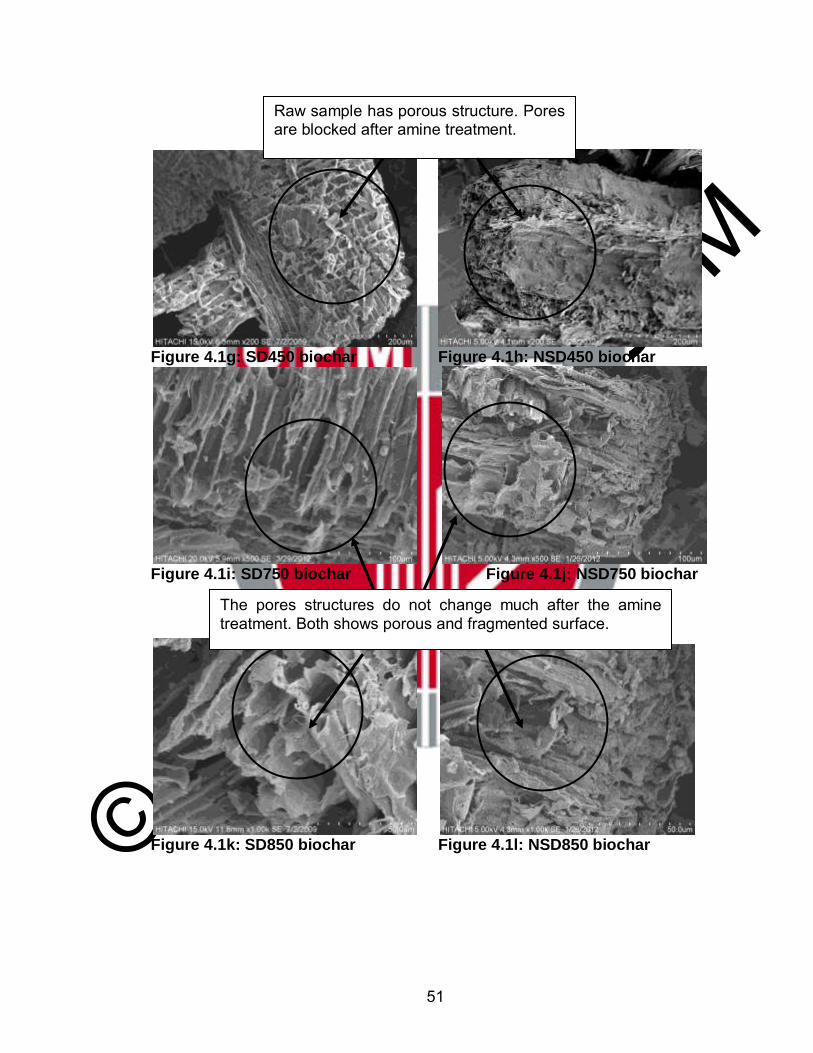
© COPYRIG
HT UPM
51
Figure 4.1g: SD450 biochar Figure 4.1h: NSD450 biochar
Figure 4.1i: SD750 biochar Figure 4.1j: NSD750 biochar
Figure 4.1k: SD850 biochar Figure 4.1l: NSD850 biochar
Raw sample has porous structure. Pores are blocked after amine treatment.
The pores structures do not change much after the amine treatment. Both shows porous and fragmented surface.
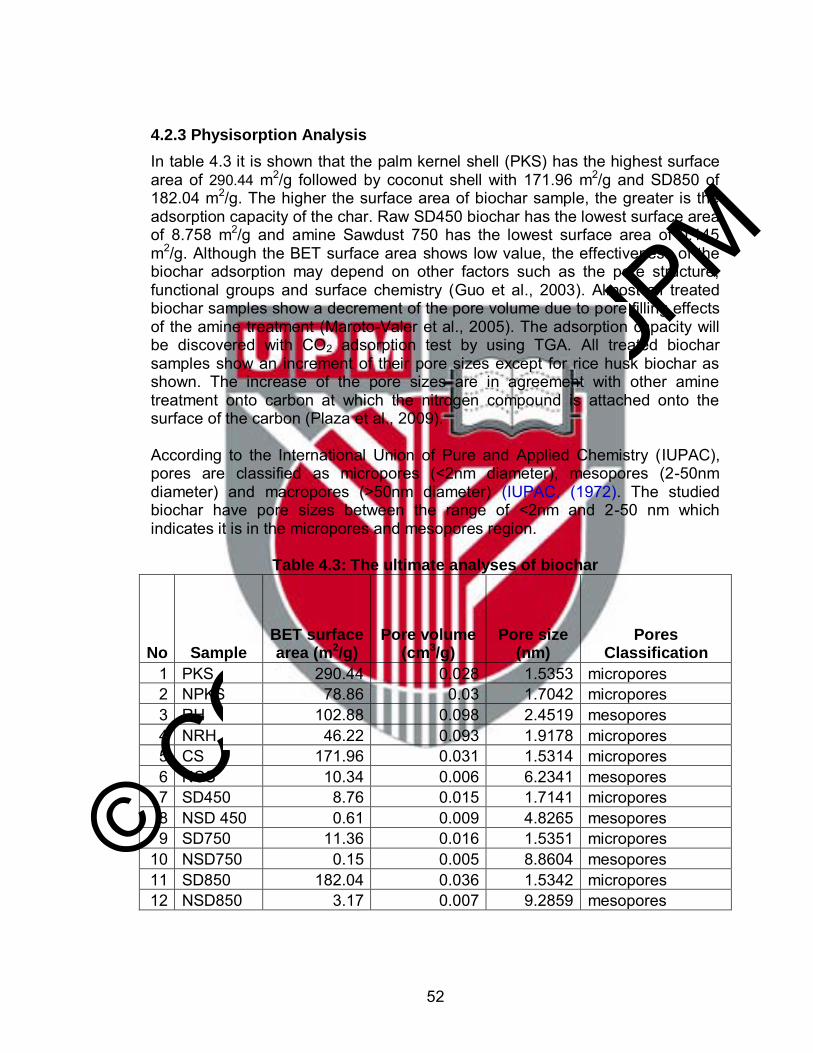
© COPYRIG
HT UPM
52
4.2.3 Physisorption Analysis
In table 4.3 it is shown that the palm kernel shell (PKS) has the highest surface area of 290.44 m2/g followed by coconut shell with 171.96 m2/g and SD850 of 182.04 m2/g. The higher the surface area of biochar sample, the greater is the adsorption capacity of the char. Raw SD450 biochar has the lowest surface area of 8.758 m2/g and amine Sawdust 750 has the lowest surface area of 0.145 m2/g. Although the BET surface area shows low value, the effectiveness of the biochar adsorption may depend on other factors such as the pore structure, functional groups and surface chemistry (Guo et al., 2003). Almost all treated biochar samples show a decrement of the pore volume due to pore filling effects of the amine treatment (Maroto-Valer et al., 2005). The adsorption capacity will be discovered with CO2 adsorption test by using TGA. All treated biochar samples show an increment of their pore sizes except for rice husk biochar as shown. The increase of the pore sizes are in agreement with other amine treatment onto carbon at which the nitrogen compound is attached onto the surface of the carbon (Plaza et al., 2009). According to the International Union of Pure and Applied Chemistry (IUPAC), pores are classified as micropores (<2nm diameter), mesopores (2-50nm diameter) and macropores (>50nm diameter) (IUPAC, (1972). The studied biochar have pore sizes between the range of <2nm and 2-50 nm which indicates it is in the micropores and mesopores region.
Table 4.3: The ultimate analyses of biochar
No Sample BET surface area (m2/g)
Pore volume (cm3/g)
Pore size (nm)
Pores Classification
1 PKS 290.44 0.028 1.5353 micropores 2 NPKS 78.86 0.03 1.7042 micropores 3 RH 102.88 0.098 2.4519 mesopores 4 NRH 46.22 0.093 1.9178 micropores 5 CS 171.96 0.031 1.5314 micropores 6 NCS 10.34 0.006 6.2341 mesopores 7 SD450 8.76 0.015 1.7141 micropores 8 NSD 450 0.61 0.009 4.8265 mesopores 9 SD750 11.36 0.016 1.5351 micropores
10 NSD750 0.15 0.005 8.8604 mesopores 11 SD850 182.04 0.036 1.5342 micropores 12 NSD850 3.17 0.007 9.2859 mesopores
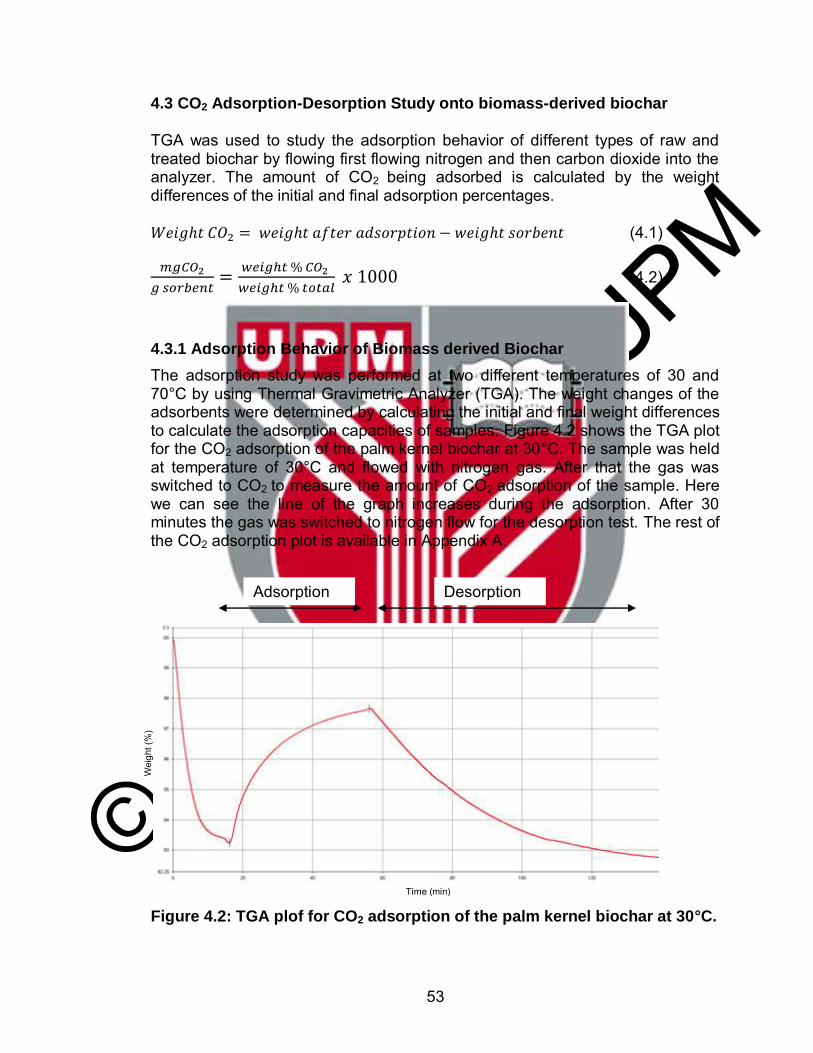
© COPYRIG
HT UPM
53
4.3 CO2 Adsorption-Desorption Study onto biomass-derived biochar
TGA was used to study the adsorption behavior of different types of raw and treated biochar by flowing first flowing nitrogen and then carbon dioxide into the analyzer. The amount of CO2 being adsorbed is calculated by the weight differences of the initial and final adsorption percentages. 𝑊𝑒𝑖𝑔ℎ𝑡 𝐶𝑂2 = 𝑤𝑒𝑖𝑔ℎ𝑡 𝑎𝑓𝑡𝑒𝑟 𝑎𝑑𝑠𝑜𝑟𝑝𝑡𝑖𝑜𝑛 − 𝑤𝑒𝑖𝑔ℎ𝑡 𝑠𝑜𝑟𝑏𝑒𝑛𝑡 (4.1)
𝑚𝑔𝐶𝑂2
𝑔 𝑠𝑜𝑟𝑏𝑒𝑛𝑡=
𝑤𝑒𝑖𝑔ℎ𝑡 % 𝐶𝑂2
𝑤𝑒𝑖𝑔ℎ𝑡 % 𝑡𝑜𝑡𝑎𝑙 𝑥 1000 (4.2)
4.3.1 Adsorption Behavior of Biomass derived Biochar
The adsorption study was performed at two different temperatures of 30 and 70°C by using Thermal Gravimetric Analyzer (TGA). The weight changes of the adsorbents were determined by calculating the initial and final weight differences to calculate the adsorption capacities of samples. Figure 4.2 shows the TGA plot for the CO2 adsorption of the palm kernel biochar at 30°C. The sample was held at temperature of 30°C and flowed with nitrogen gas. After that the gas was switched to CO2 to measure the amount of CO2 adsorption of the sample. Here we can see the line of the graph increases during the adsorption. After 30 minutes the gas was switched to nitrogen flow for the desorption test. The rest of the CO2 adsorption plot is available in Appendix A.
Figure 4.2: TGA plof for CO2 adsorption of the palm kernel biochar at 30°C.
Time (min)
Wei
ght (
%)
Adsorption Desorption
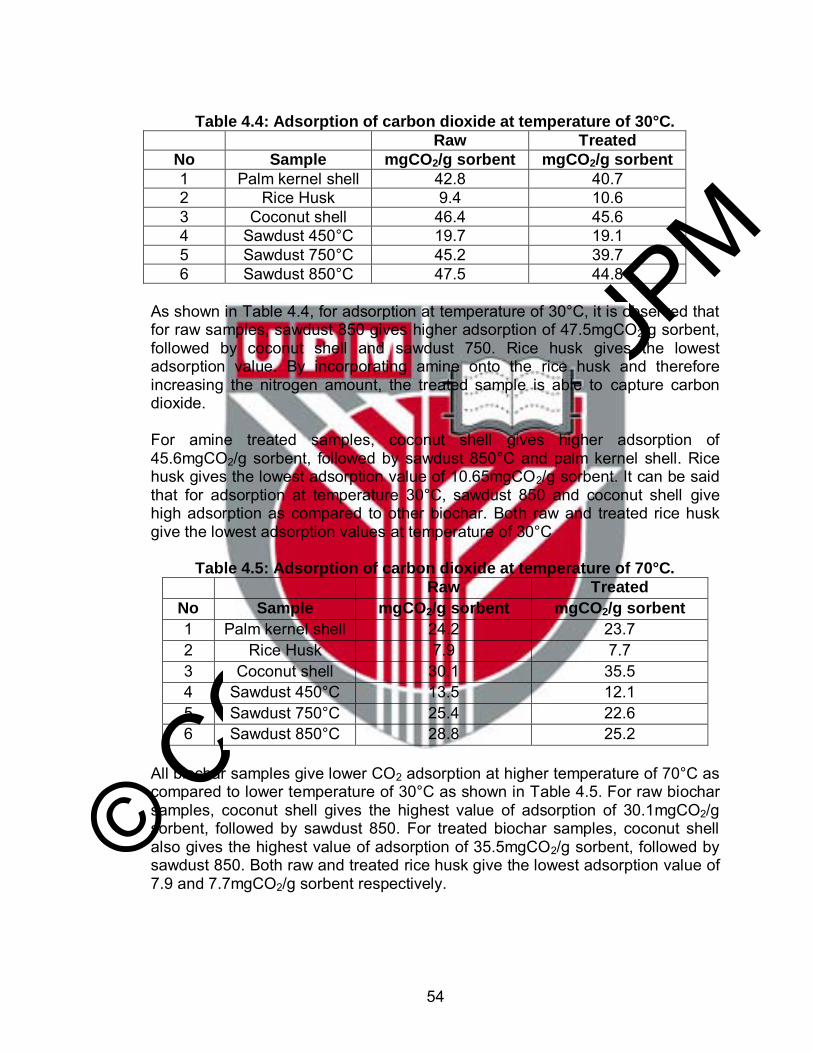
© COPYRIG
HT UPM
54
Table 4.4: Adsorption of carbon dioxide at temperature of 30°C.
Raw Treated
No Sample mgCO2/g sorbent mgCO2/g sorbent
1 Palm kernel shell 42.8 40.7 2 Rice Husk 9.4 10.6 3 Coconut shell 46.4 45.6 4 Sawdust 450°C 19.7 19.1 5 Sawdust 750°C 45.2 39.7 6 Sawdust 850°C 47.5 44.8
As shown in Table 4.4, for adsorption at temperature of 30°C, it is observed that for raw samples, sawdust 850 gives higher adsorption of 47.5mgCO2/g sorbent, followed by coconut shell and sawdust 750. Rice husk gives the lowest adsorption value. By incorporating amine onto the rice husk and therefore increasing the nitrogen amount, the treated sample is able to capture carbon dioxide. For amine treated samples, coconut shell gives higher adsorption of 45.6mgCO2/g sorbent, followed by sawdust 850°C and palm kernel shell. Rice husk gives the lowest adsorption value of 10.65mgCO2/g sorbent. It can be said that for adsorption at temperature 30°C, sawdust 850 and coconut shell give high adsorption as compared to other biochar. Both raw and treated rice husk give the lowest adsorption values at temperature of 30°C
Table 4.5: Adsorption of carbon dioxide at temperature of 70°C.
Raw Treated
No Sample mgCO2/g sorbent mgCO2/g sorbent
1 Palm kernel shell 24.2 23.7 2 Rice Husk 7.9 7.7 3 Coconut shell 30.1 35.5 4 Sawdust 450°C 13.5 12.1 5 Sawdust 750°C 25.4 22.6 6 Sawdust 850°C 28.8 25.2
All biochar samples give lower CO2 adsorption at higher temperature of 70°C as compared to lower temperature of 30°C as shown in Table 4.5. For raw biochar samples, coconut shell gives the highest value of adsorption of 30.1mgCO2/g sorbent, followed by sawdust 850. For treated biochar samples, coconut shell also gives the highest value of adsorption of 35.5mgCO2/g sorbent, followed by sawdust 850. Both raw and treated rice husk give the lowest adsorption value of 7.9 and 7.7mgCO2/g sorbent respectively.
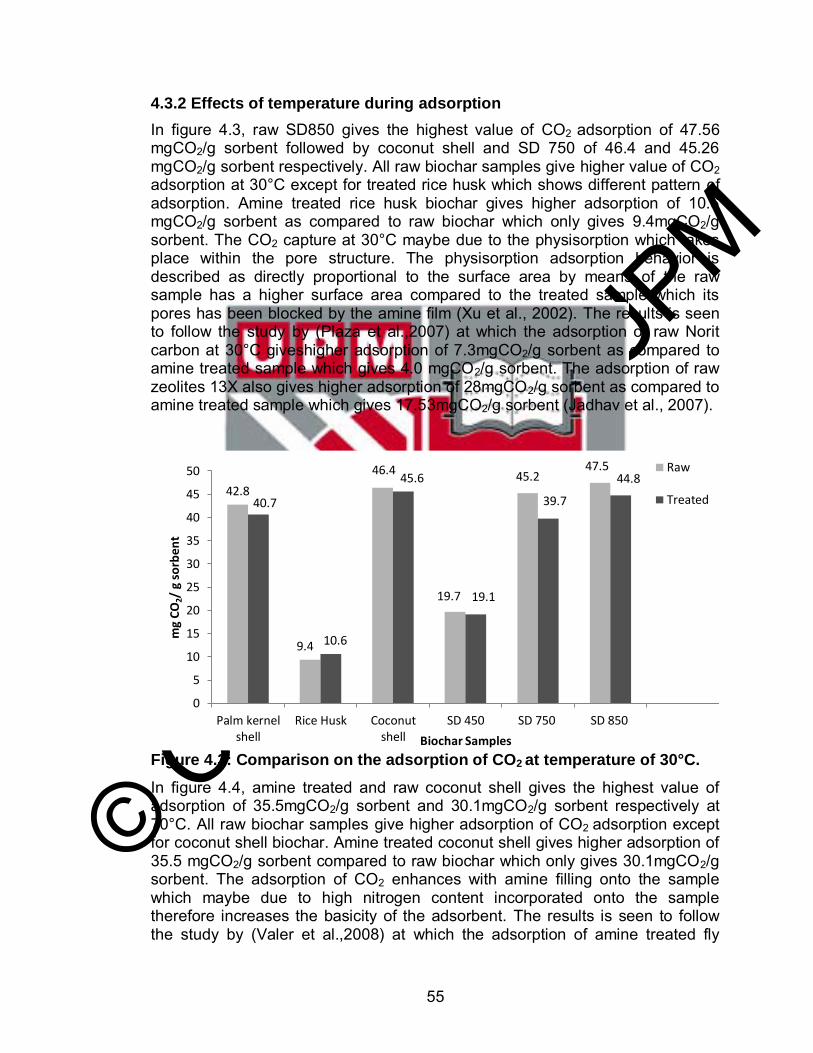
© COPYRIG
HT UPM
55
4.3.2 Effects of temperature during adsorption
In figure 4.3, raw SD850 gives the highest value of CO2 adsorption of 47.56 mgCO2/g sorbent followed by coconut shell and SD 750 of 46.4 and 45.26 mgCO2/g sorbent respectively. All raw biochar samples give higher value of CO2 adsorption at 30°C except for treated rice husk which shows different pattern of adsorption. Amine treated rice husk biochar gives higher adsorption of 10.6 mgCO2/g sorbent as compared to raw biochar which only gives 9.4mgCO2/g sorbent. The CO2 capture at 30°C maybe due to the physisorption which takes place within the pore structure. The physisorption adsorption behavior is described as directly proportional to the surface area by means of the raw sample has a higher surface area compared to the treated sample which its pores has been blocked by the amine film (Xu et al., 2002). The results is seen to follow the study by (Plaza et al.,2007) at which the adsorption of raw Norit carbon at 30°C giveshigher adsorption of 7.3mgCO2/g sorbent as compared to amine treated sample which gives 4.0 mgCO2/g sorbent. The adsorption of raw zeolites 13X also gives higher adsorption of 28mgCO2/g sorbent as compared to amine treated sample which gives 17.53mgCO2/g sorbent (Jadhav et al., 2007).
Figure 4.3: Comparison on the adsorption of CO2 at temperature of 30°C.
In figure 4.4, amine treated and raw coconut shell gives the highest value of adsorption of 35.5mgCO2/g sorbent and 30.1mgCO2/g sorbent respectively at 70°C. All raw biochar samples give higher adsorption of CO2 adsorption except for coconut shell biochar. Amine treated coconut shell gives higher adsorption of 35.5 mgCO2/g sorbent compared to raw biochar which only gives 30.1mgCO2/g sorbent. The adsorption of CO2 enhances with amine filling onto the sample which maybe due to high nitrogen content incorporated onto the sample therefore increases the basicity of the adsorbent. The results is seen to follow the study by (Valer et al.,2008) at which the adsorption of amine treated fly
42.8
9.4
46.4
19.7
45.2 47.5
40.7
10.6
45.6
19.1
39.7
44.8
0
5
10
15
20
25
30
35
40
45
50
Palm kernelshell
Rice Husk Coconutshell
SD 450 SD 750 SD 850
mg
CO
2/ g
so
rben
t
Biochar Samples
Raw
Treated
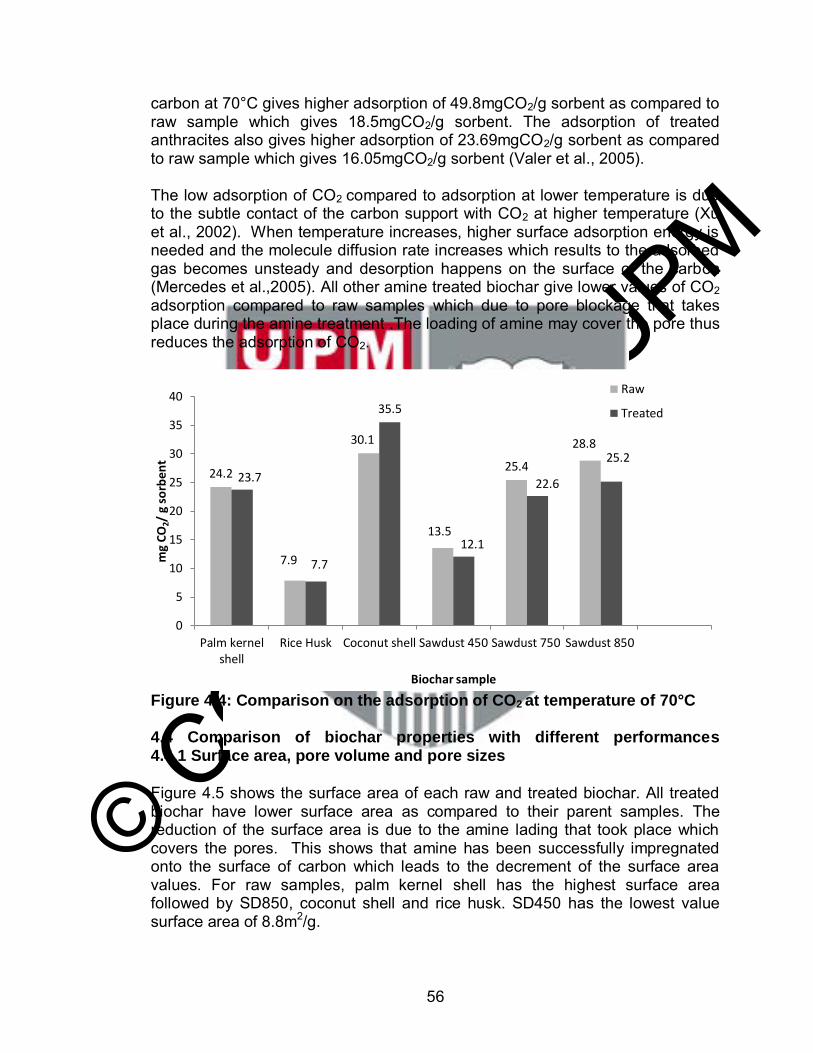
© COPYRIG
HT UPM
56
carbon at 70°C gives higher adsorption of 49.8mgCO2/g sorbent as compared to raw sample which gives 18.5mgCO2/g sorbent. The adsorption of treated anthracites also gives higher adsorption of 23.69mgCO2/g sorbent as compared to raw sample which gives 16.05mgCO2/g sorbent (Valer et al., 2005). The low adsorption of CO2 compared to adsorption at lower temperature is due to the subtle contact of the carbon support with CO2 at higher temperature (Xu et al., 2002). When temperature increases, higher surface adsorption energy is needed and the molecule diffusion rate increases which results to the adsorbed gas becomes unsteady and desorption happens on the surface of the carbon (Mercedes et al.,2005). All other amine treated biochar give lower values of CO2 adsorption compared to raw samples which due to pore blockage that takes place during the amine treatment .The loading of amine may cover the pore thus reduces the adsorption of CO2.
Figure 4.4: Comparison on the adsorption of CO2 at temperature of 70°C
4.4 Comparison of biochar properties with different performances 4.4.1 Surface area, pore volume and pore sizes
Figure 4.5 shows the surface area of each raw and treated biochar. All treated biochar have lower surface area as compared to their parent samples. The reduction of the surface area is due to the amine lading that took place which covers the pores. This shows that amine has been successfully impregnated onto the surface of carbon which leads to the decrement of the surface area values. For raw samples, palm kernel shell has the highest surface area followed by SD850, coconut shell and rice husk. SD450 has the lowest value surface area of 8.8m2/g.
24.2
7.9
30.1
13.5
25.4
28.8
23.7
7.7
35.5
12.1
22.6
25.2
0
5
10
15
20
25
30
35
40
Palm kernelshell
Rice Husk Coconut shell Sawdust 450 Sawdust 750 Sawdust 850
mg
CO
2/ g
so
rben
t
Biochar sample
Raw
Treated
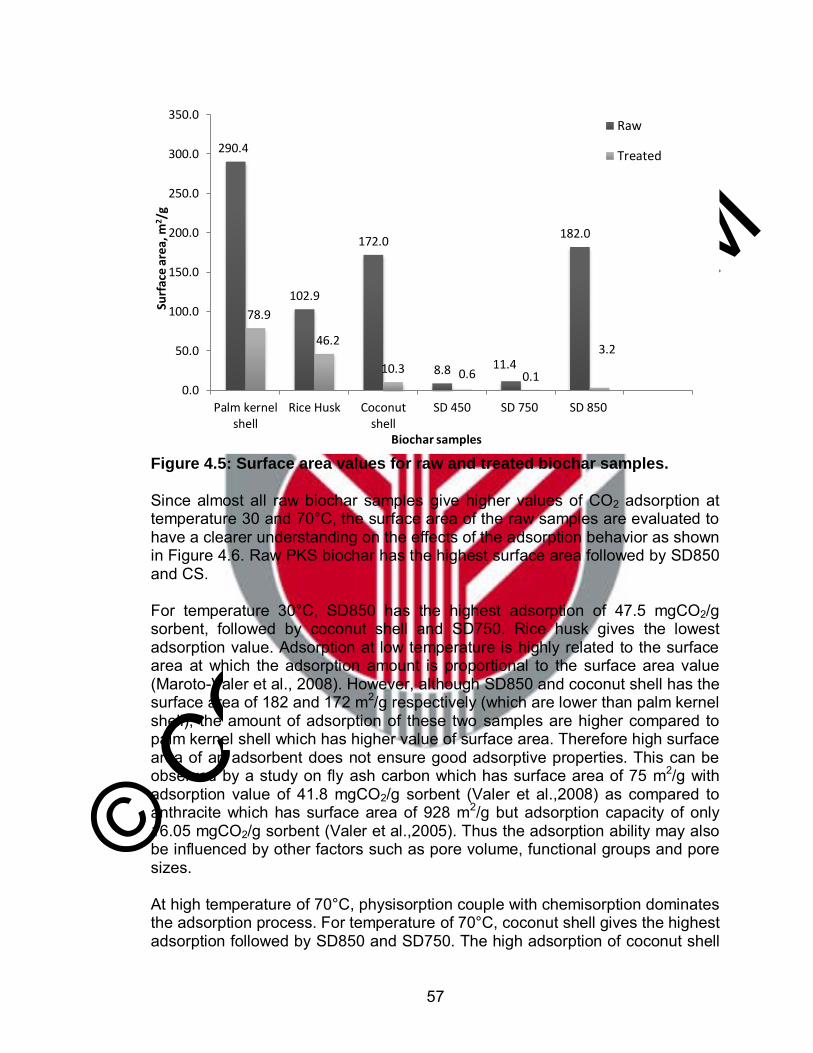
© COPYRIG
HT UPM
57
Figure 4.5: Surface area values for raw and treated biochar samples. Since almost all raw biochar samples give higher values of CO2 adsorption at temperature 30 and 70°C, the surface area of the raw samples are evaluated to have a clearer understanding on the effects of the adsorption behavior as shown in Figure 4.6. Raw PKS biochar has the highest surface area followed by SD850 and CS. For temperature 30°C, SD850 has the highest adsorption of 47.5 mgCO2/g sorbent, followed by coconut shell and SD750. Rice husk gives the lowest adsorption value. Adsorption at low temperature is highly related to the surface area at which the adsorption amount is proportional to the surface area value (Maroto-Valer et al., 2008). However, although SD850 and coconut shell has the surface area of 182 and 172 m2/g respectively (which are lower than palm kernel shell), the amount of adsorption of these two samples are higher compared to palm kernel shell which has higher value of surface area. Therefore high surface area of an adsorbent does not ensure good adsorptive properties. This can be observed by a study on fly ash carbon which has surface area of 75 m2/g with adsorption value of 41.8 mgCO2/g sorbent (Valer et al.,2008) as compared to anthracite which has surface area of 928 m2/g but adsorption capacity of only 16.05 mgCO2/g sorbent (Valer et al.,2005). Thus the adsorption ability may also be influenced by other factors such as pore volume, functional groups and pore sizes. At high temperature of 70°C, physisorption couple with chemisorption dominates the adsorption process. For temperature of 70°C, coconut shell gives the highest adsorption followed by SD850 and SD750. The high adsorption of coconut shell
290.4
102.9
172.0
8.8 11.4
182.0
78.9
46.2
10.3 0.6 0.1
3.2
0.0
50.0
100.0
150.0
200.0
250.0
300.0
350.0
Palm kernelshell
Rice Husk Coconutshell
SD 450 SD 750 SD 850
Surf
ace
are
a, m
2/g
Biochar samples
Raw
Treated
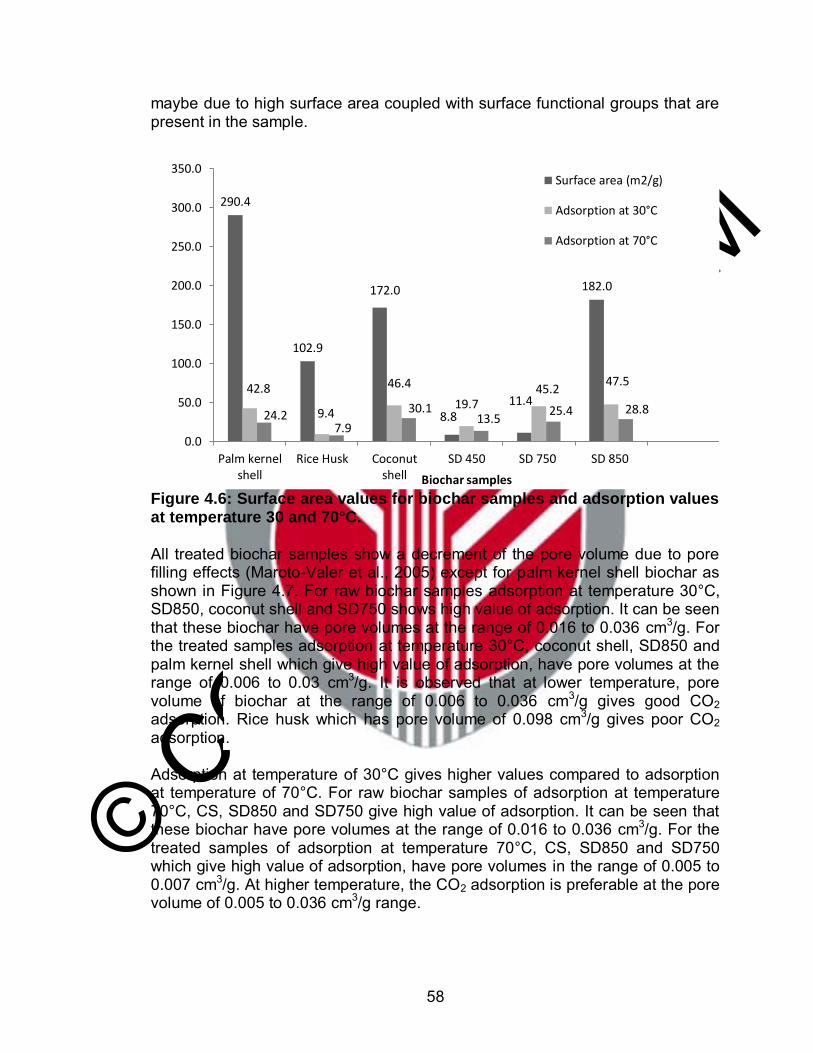
© COPYRIG
HT UPM
58
maybe due to high surface area coupled with surface functional groups that are present in the sample.
Figure 4.6: Surface area values for biochar samples and adsorption values at temperature 30 and 70°C. All treated biochar samples show a decrement of the pore volume due to pore filling effects (Maroto-Valer et al., 2005) except for palm kernel shell biochar as shown in Figure 4.7. For raw biochar samples adsorption at temperature 30°C, SD850, coconut shell and SD750 shows high value of adsorption. It can be seen that these biochar have pore volumes at the range of 0.016 to 0.036 cm3/g. For the treated samples adsorption at temperature 30°C, coconut shell, SD850 and palm kernel shell which give high value of adsorption, have pore volumes at the range of 0.006 to 0.03 cm3/g. It is observed that at lower temperature, pore volume of biochar at the range of 0.006 to 0.036 cm3/g gives good CO2 adsorption. Rice husk which has pore volume of 0.098 cm3/g gives poor CO2 adsorption. Adsorption at temperature of 30°C gives higher values compared to adsorption at temperature of 70°C. For raw biochar samples of adsorption at temperature 70°C, CS, SD850 and SD750 give high value of adsorption. It can be seen that these biochar have pore volumes at the range of 0.016 to 0.036 cm3/g. For the treated samples of adsorption at temperature 70°C, CS, SD850 and SD750 which give high value of adsorption, have pore volumes in the range of 0.005 to 0.007 cm3/g. At higher temperature, the CO2 adsorption is preferable at the pore volume of 0.005 to 0.036 cm3/g range.
290.4
102.9
172.0
8.8 11.4
182.0
42.8
9.4
46.4
19.7 45.2
47.5
24.2 7.9
30.1 13.5
25.4 28.8
0.0
50.0
100.0
150.0
200.0
250.0
300.0
350.0
Palm kernelshell
Rice Husk Coconutshell
SD 450 SD 750 SD 850
Biochar samples
Surface area (m2/g)
Adsorption at 30°C
Adsorption at 70°C
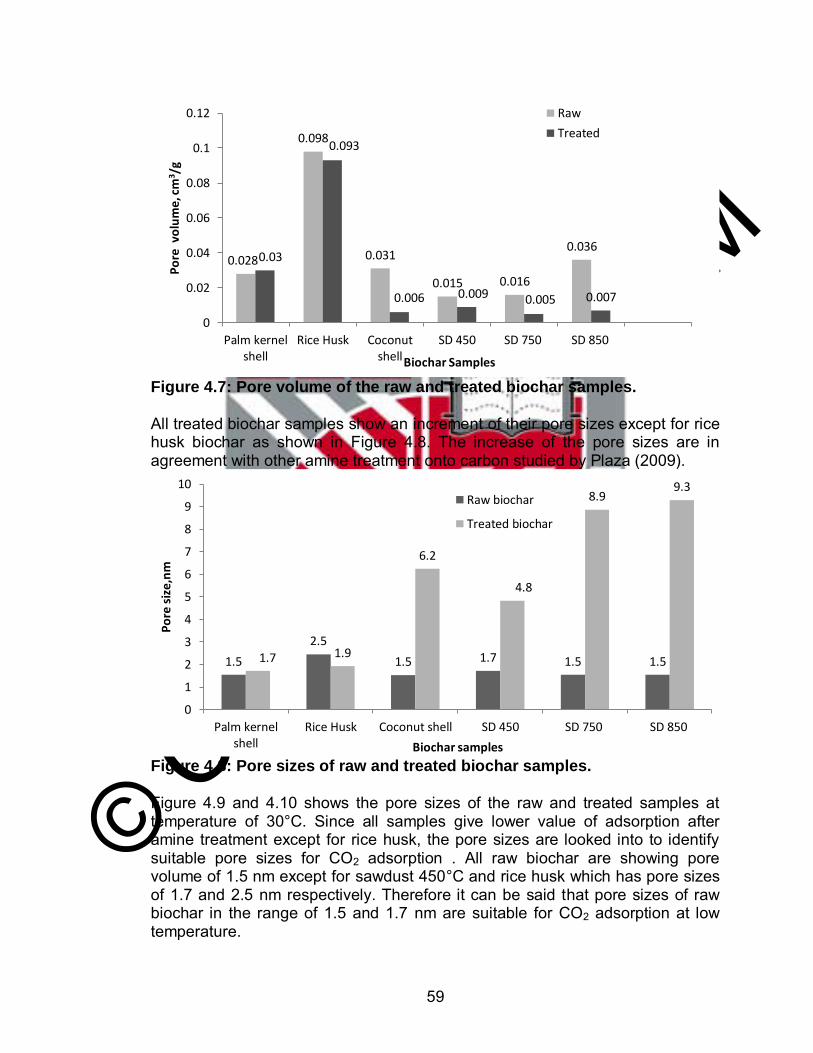
© COPYRIG
HT UPM
59
Figure 4.7: Pore volume of the raw and treated biochar samples. All treated biochar samples show an increment of their pore sizes except for rice husk biochar as shown in Figure 4.8. The increase of the pore sizes are in agreement with other amine treatment onto carbon studied by Plaza (2009).
Figure 4.8: Pore sizes of raw and treated biochar samples.
Figure 4.9 and 4.10 shows the pore sizes of the raw and treated samples at temperature of 30°C. Since all samples give lower value of adsorption after amine treatment except for rice husk, the pore sizes are looked into to identify suitable pore sizes for CO2 adsorption . All raw biochar are showing pore volume of 1.5 nm except for sawdust 450°C and rice husk which has pore sizes of 1.7 and 2.5 nm respectively. Therefore it can be said that pore sizes of raw biochar in the range of 1.5 and 1.7 nm are suitable for CO2 adsorption at low temperature.
0.028
0.098
0.031
0.015 0.016
0.036 0.03
0.093
0.006 0.009 0.005 0.007
0
0.02
0.04
0.06
0.08
0.1
0.12
Palm kernelshell
Rice Husk Coconutshell
SD 450 SD 750 SD 850
Po
re v
olu
me
, cm
3 /g
Biochar Samples
Raw
Treated
1.5
2.5
1.5 1.7 1.5 1.5 1.7 1.9
6.2
4.8
8.9 9.3
0
1
2
3
4
5
6
7
8
9
10
Palm kernelshell
Rice Husk Coconut shell SD 450 SD 750 SD 850
Po
re s
ize,
nm
Biochar samples
Raw biochar
Treated biochar
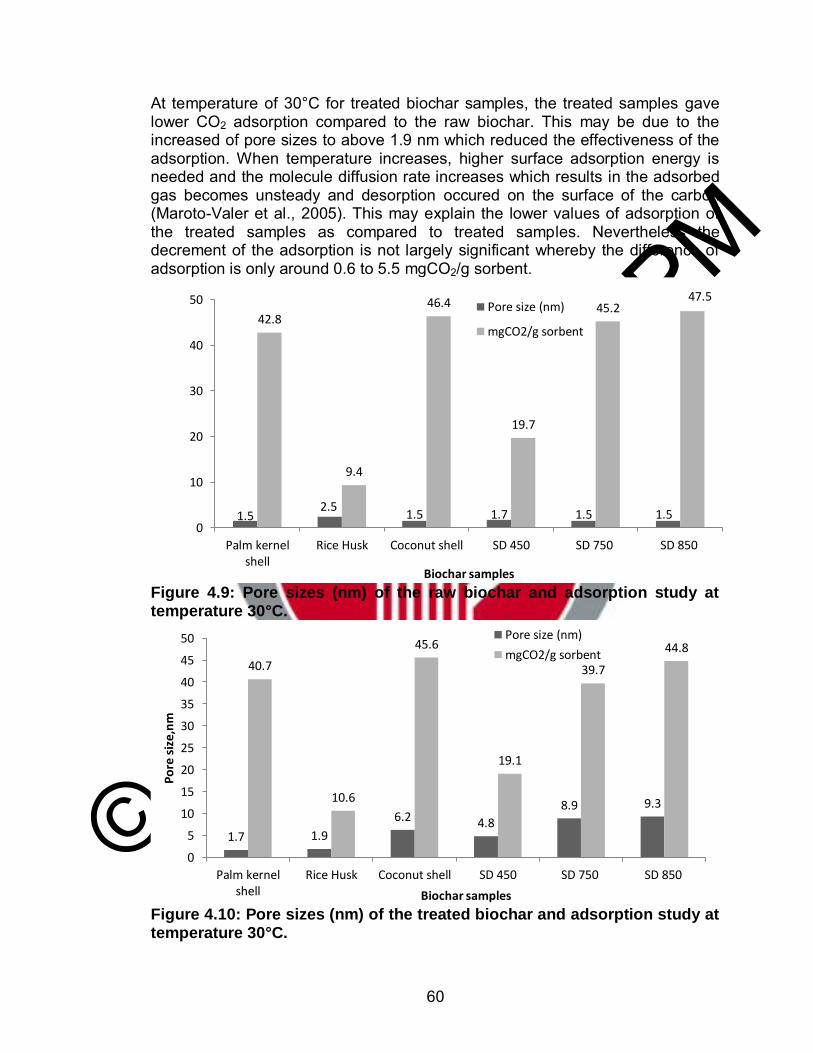
© COPYRIG
HT UPM
60
At temperature of 30°C for treated biochar samples, the treated samples gave lower CO2 adsorption compared to the raw biochar. This may be due to the increased of pore sizes to above 1.9 nm which reduced the effectiveness of the adsorption. When temperature increases, higher surface adsorption energy is needed and the molecule diffusion rate increases which results in the adsorbed gas becomes unsteady and desorption occured on the surface of the carbon (Maroto-Valer et al., 2005). This may explain the lower values of adsorption of the treated samples as compared to treated samples. Nevertheless the decrement of the adsorption is not largely significant whereby the difference of adsorption is only around 0.6 to 5.5 mgCO2/g sorbent.
Figure 4.9: Pore sizes (nm) of the raw biochar and adsorption study at temperature 30°C.
Figure 4.10: Pore sizes (nm) of the treated biochar and adsorption study at temperature 30°C.
1.5 2.5
1.5 1.7 1.5 1.5
42.8
9.4
46.4
19.7
45.2 47.5
0
10
20
30
40
50
Palm kernelshell
Rice Husk Coconut shell SD 450 SD 750 SD 850
Biochar samples
Pore size (nm)
mgCO2/g sorbent
1.7 1.9
6.2 4.8
8.9 9.3
40.7
10.6
45.6
19.1
39.7
44.8
0
5
10
15
20
25
30
35
40
45
50
Palm kernelshell
Rice Husk Coconut shell SD 450 SD 750 SD 850
Po
re s
ize,
nm
Biochar samples
Pore size (nm)
mgCO2/g sorbent
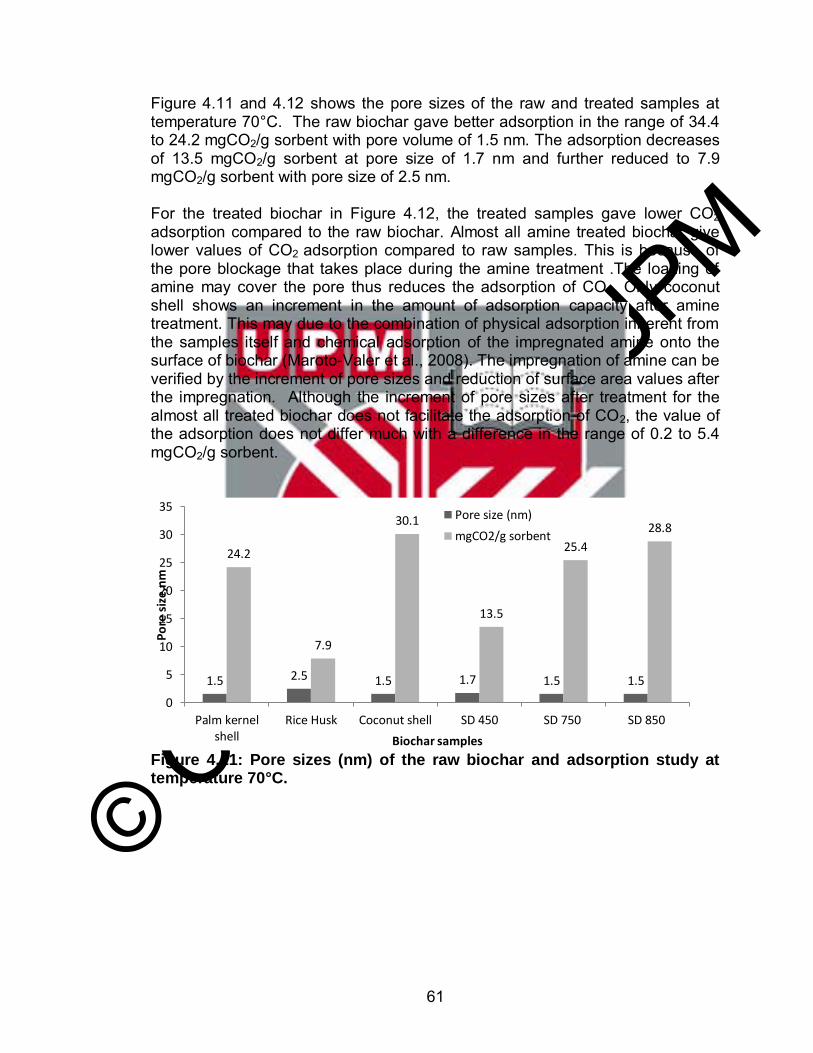
© COPYRIG
HT UPM
61
Figure 4.11 and 4.12 shows the pore sizes of the raw and treated samples at temperature 70°C. The raw biochar gave better adsorption in the range of 34.4 to 24.2 mgCO2/g sorbent with pore volume of 1.5 nm. The adsorption decreases of 13.5 mgCO2/g sorbent at pore size of 1.7 nm and further reduced to 7.9 mgCO2/g sorbent with pore size of 2.5 nm. For the treated biochar in Figure 4.12, the treated samples gave lower CO2 adsorption compared to the raw biochar. Almost all amine treated biochar give lower values of CO2 adsorption compared to raw samples. This is because of the pore blockage that takes place during the amine treatment .The loading of amine may cover the pore thus reduces the adsorption of CO2. Only coconut shell shows an increment in the amount of adsorption capacity after amine treatment. This may due to the combination of physical adsorption inherent from the samples itself and chemical adsorption of the impregnated amine onto the surface of biochar (Maroto-Valer et al., 2008). The impregnation of amine can be verified by the increment of pore sizes and reduction of surface area values after the impregnation. Although the increment of pore sizes after treatment for the almost all treated biochar does not facilitate the adsorption of CO2, the value of the adsorption does not differ much with a difference in the range of 0.2 to 5.4 mgCO2/g sorbent.
Figure 4.11: Pore sizes (nm) of the raw biochar and adsorption study at temperature 70°C.
1.5 2.5 1.5 1.7 1.5 1.5
24.2
7.9
30.1
13.5
25.4
28.8
0
5
10
15
20
25
30
35
Palm kernelshell
Rice Husk Coconut shell SD 450 SD 750 SD 850
Po
re s
ize,
nm
Biochar samples
Pore size (nm)
mgCO2/g sorbent
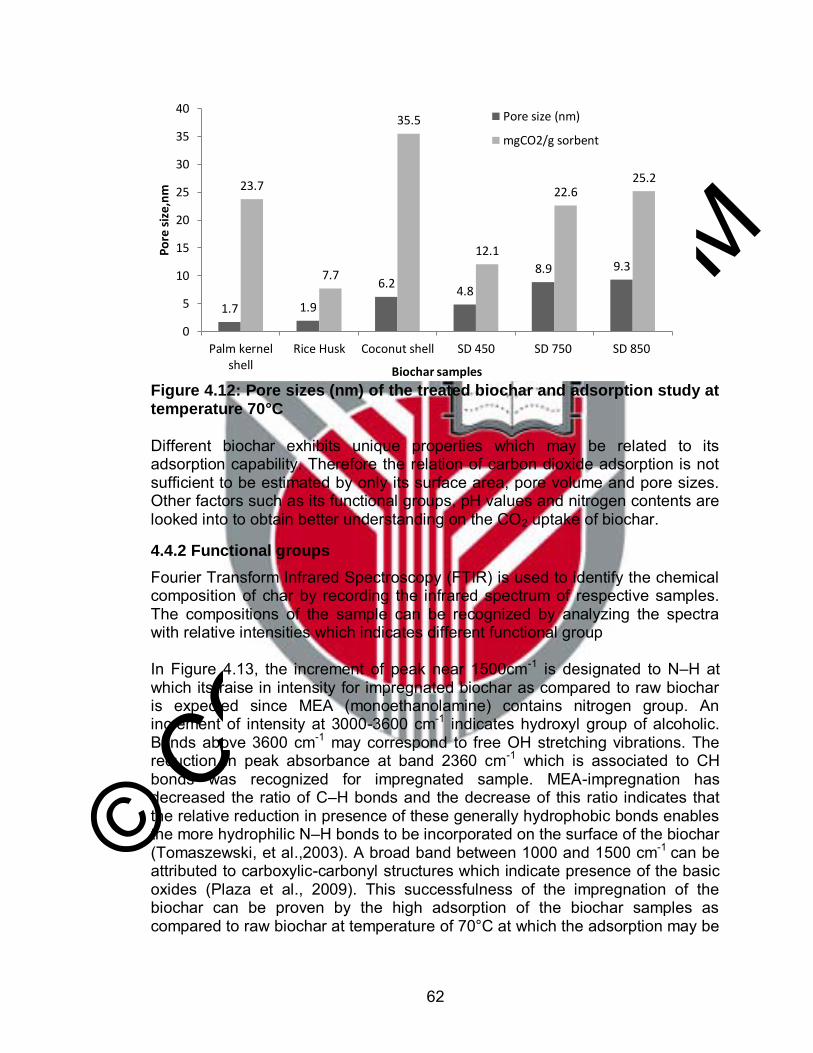
© COPYRIG
HT UPM
62
Figure 4.12: Pore sizes (nm) of the treated biochar and adsorption study at temperature 70°C Different biochar exhibits unique properties which may be related to its adsorption capability. Therefore the relation of carbon dioxide adsorption is not sufficient to be estimated by only its surface area, pore volume and pore sizes. Other factors such as its functional groups, pH values and nitrogen contents are looked into to obtain better understanding on the CO2 uptake of biochar.
4.4.2 Functional groups
Fourier Transform Infrared Spectroscopy (FTIR) is used to identify the chemical composition of char by recording the infrared spectrum of respective samples. The compositions of the sample can be recognized by analyzing the spectra with relative intensities which indicates different functional group In Figure 4.13, the increment of peak near 1500cm-1 is designated to N–H at which its raise in intensity for impregnated biochar as compared to raw biochar is expected since MEA (monoethanolamine) contains nitrogen group. An increment of intensity at 3000-3600 cm-1 indicates hydroxyl group of alcoholic. Bands above 3600 cm-1 may correspond to free OH stretching vibrations. The reduction in peak absorbance at band 2360 cm-1 which is associated to CH bonds was recognized for impregnated sample. MEA-impregnation has decreased the ratio of C–H bonds and the decrease of this ratio indicates that the relative reduction in presence of these generally hydrophobic bonds enables the more hydrophilic N–H bonds to be incorporated on the surface of the biochar (Tomaszewski, et al.,2003). A broad band between 1000 and 1500 cm-1 can be attributed to carboxylic-carbonyl structures which indicate presence of the basic oxides (Plaza et al., 2009). This successfulness of the impregnation of the biochar can be proven by the high adsorption of the biochar samples as compared to raw biochar at temperature of 70°C at which the adsorption may be
1.7 1.9
6.2 4.8
8.9 9.3
23.7
7.7
35.5
12.1
22.6 25.2
0
5
10
15
20
25
30
35
40
Palm kernelshell
Rice Husk Coconut shell SD 450 SD 750 SD 850
Po
re s
ize
,nm
Biochar samples
Pore size (nm)
mgCO2/g sorbent
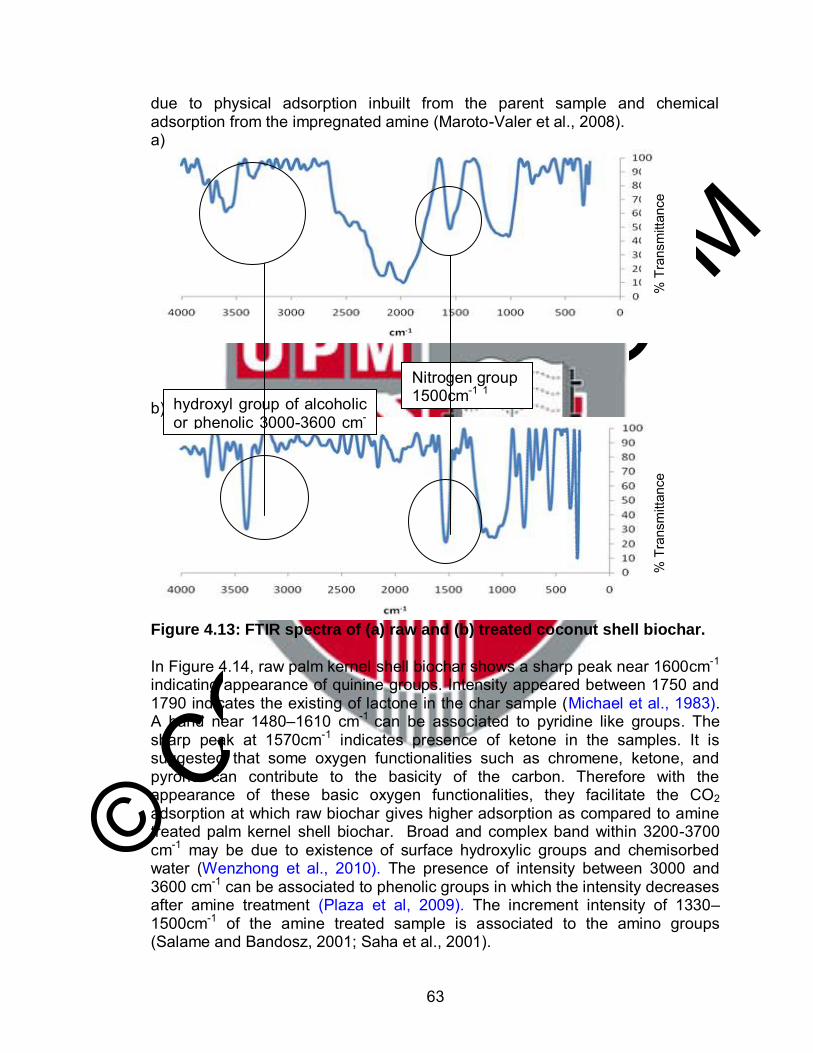
© COPYRIG
HT UPM
63
due to physical adsorption inbuilt from the parent sample and chemical adsorption from the impregnated amine (Maroto-Valer et al., 2008). a)
b)
Figure 4.13: FTIR spectra of (a) raw and (b) treated coconut shell biochar. In Figure 4.14, raw palm kernel shell biochar shows a sharp peak near 1600cm-1 indicating appearance of quinine groups. Intensity appeared between 1750 and 1790 indicates the existing of lactone in the char sample (Michael et al., 1983). A band near 1480–1610 cm-1 can be associated to pyridine like groups. The sharp peak at 1570cm-1 indicates presence of ketone in the samples. It is suggested that some oxygen functionalities such as chromene, ketone, and pyrone can contribute to the basicity of the carbon. Therefore with the appearance of these basic oxygen functionalities, they facilitate the CO2 adsorption at which raw biochar gives higher adsorption as compared to amine treated palm kernel shell biochar. Broad and complex band within 3200-3700 cm-1 may be due to existence of surface hydroxylic groups and chemisorbed water (Wenzhong et al., 2010). The presence of intensity between 3000 and 3600 cm-1 can be associated to phenolic groups in which the intensity decreases after amine treatment (Plaza et al, 2009). The increment intensity of 1330–1500cm-1 of the amine treated sample is associated to the amino groups (Salame and Bandosz, 2001; Saha et al., 2001).
% T
rans
mitt
ance
%
Tra
nsm
ittan
ce
Nitrogen group 1500cm-1 1 hydroxyl group of alcoholic
or phenolic 3000-3600 cm-
1
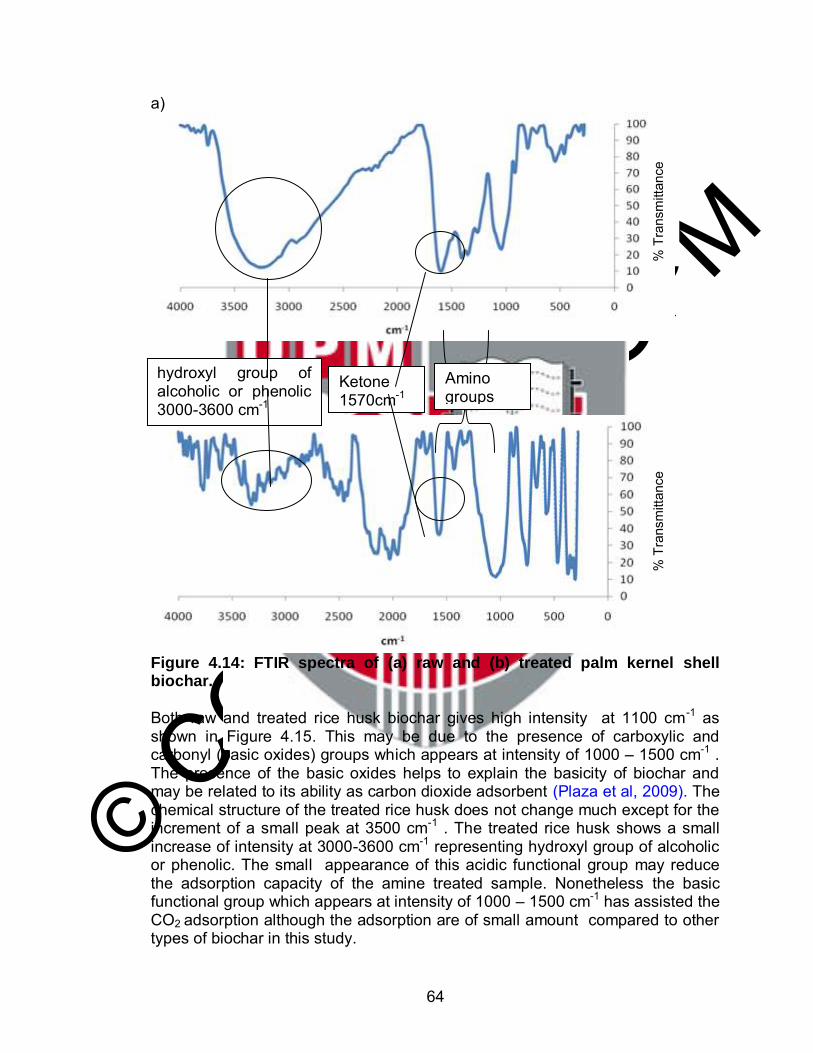
© COPYRIG
HT UPM
64
a)
b)
Figure 4.14: FTIR spectra of (a) raw and (b) treated palm kernel shell biochar.
Both raw and treated rice husk biochar gives high intensity at 1100 cm-1 as shown in Figure 4.15. This may be due to the presence of carboxylic and carbonyl (basic oxides) groups which appears at intensity of 1000 – 1500 cm-1 . The presence of the basic oxides helps to explain the basicity of biochar and may be related to its ability as carbon dioxide adsorbent (Plaza et al, 2009). The chemical structure of the treated rice husk does not change much except for the increment of a small peak at 3500 cm-1 . The treated rice husk shows a small increase of intensity at 3000-3600 cm-1 representing hydroxyl group of alcoholic or phenolic. The small appearance of this acidic functional group may reduce the adsorption capacity of the amine treated sample. Nonetheless the basic functional group which appears at intensity of 1000 – 1500 cm-1 has assisted the CO2 adsorption although the adsorption are of small amount compared to other types of biochar in this study.
% T
rans
mitt
ance
%
Tra
nsm
ittan
ce
hydroxyl group of alcoholic or phenolic 3000-3600 cm-1
Ketone
1570cm-1 Amino groups 1330–1500cm-1
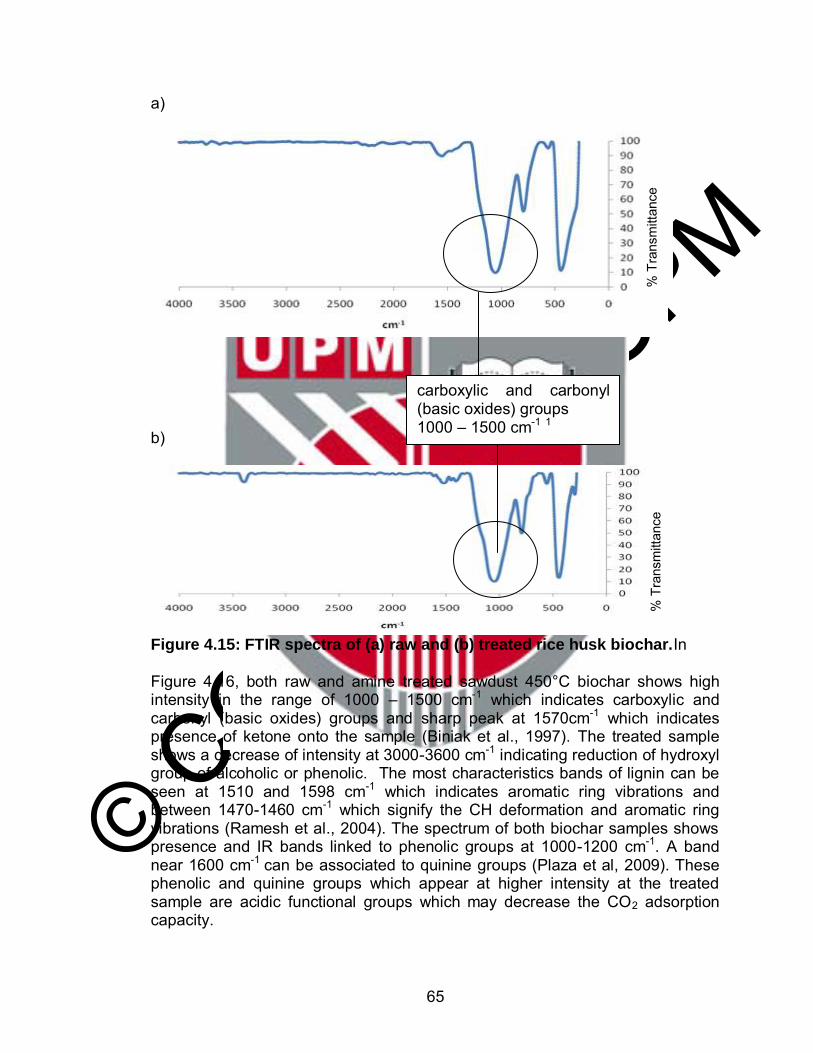
© COPYRIG
HT UPM
65
a)
b)
Figure 4.15: FTIR spectra of (a) raw and (b) treated rice husk biochar.In Figure 4.16, both raw and amine treated sawdust 450°C biochar shows high intensity in the range of 1000 – 1500 cm-1 which indicates carboxylic and carbonyl (basic oxides) groups and sharp peak at 1570cm-1 which indicates presence of ketone onto the sample (Biniak et al., 1997). The treated sample shows a decrease of intensity at 3000-3600 cm-1 indicating reduction of hydroxyl group of alcoholic or phenolic. The most characteristics bands of lignin can be seen at 1510 and 1598 cm-1 which indicates aromatic ring vibrations and between 1470-1460 cm-1 which signify the CH deformation and aromatic ring vibrations (Ramesh et al., 2004). The spectrum of both biochar samples shows presence and IR bands linked to phenolic groups at 1000-1200 cm-1. A band near 1600 cm-1 can be associated to quinine groups (Plaza et al, 2009). These phenolic and quinine groups which appear at higher intensity at the treated sample are acidic functional groups which may decrease the CO2 adsorption capacity.
% T
rans
mitt
ance
%
Tra
nsm
ittan
ce
carboxylic and carbonyl (basic oxides) groups 1000 – 1500 cm-1 1
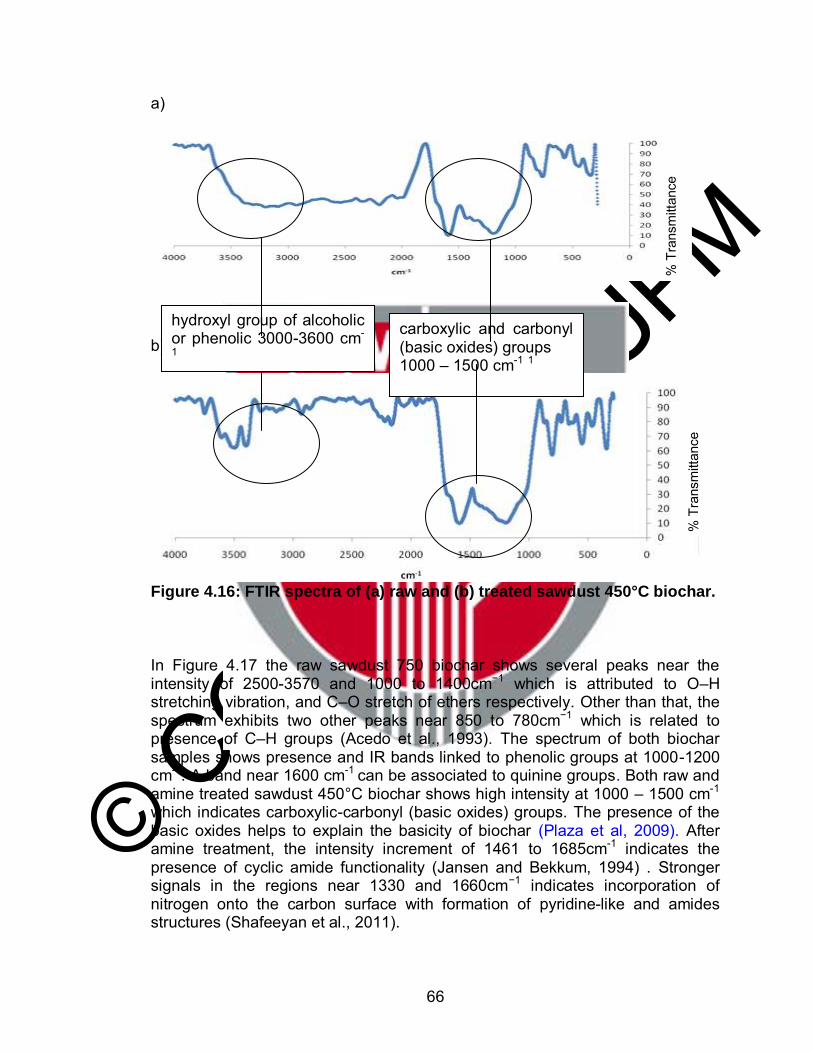
© COPYRIG
HT UPM
66
a)
b)
Figure 4.16: FTIR spectra of (a) raw and (b) treated sawdust 450°C biochar.
In Figure 4.17 the raw sawdust 750 biochar shows several peaks near the intensity of 2500-3570 and 1000 to 1400cm−1 which is attributed to O–H stretching vibration, and C–O stretch of ethers respectively. Other than that, the spectrum exhibits two other peaks near 850 to 780cm−1 which is related to presence of C–H groups (Acedo et al., 1993). The spectrum of both biochar samples shows presence and IR bands linked to phenolic groups at 1000-1200 cm-1. A band near 1600 cm-1 can be associated to quinine groups. Both raw and amine treated sawdust 450°C biochar shows high intensity at 1000 – 1500 cm-1 which indicates carboxylic-carbonyl (basic oxides) groups. The presence of the basic oxides helps to explain the basicity of biochar (Plaza et al, 2009). After amine treatment, the intensity increment of 1461 to 1685cm-1 indicates the presence of cyclic amide functionality (Jansen and Bekkum, 1994) . Stronger signals in the regions near 1330 and 1660cm−1 indicates incorporation of nitrogen onto the carbon surface with formation of pyridine-like and amides structures (Shafeeyan et al., 2011).
% T
rans
mitt
ance
%
Tra
nsm
ittan
ce
carboxylic and carbonyl (basic oxides) groups 1000 – 1500 cm-1 1
hydroxyl group of alcoholic or phenolic 3000-3600 cm-
1
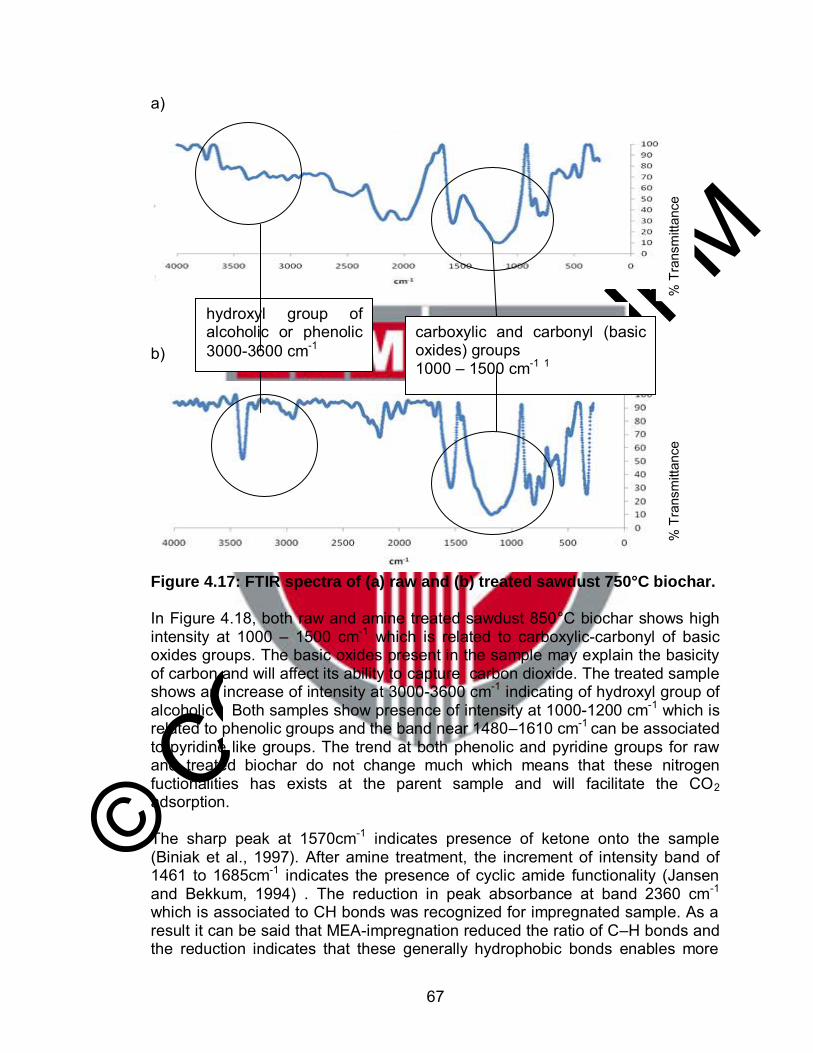
© COPYRIG
HT UPM
67
a)
b)
Figure 4.17: FTIR spectra of (a) raw and (b) treated sawdust 750°C biochar.
In Figure 4.18, both raw and amine treated sawdust 850°C biochar shows high intensity at 1000 – 1500 cm-1 which is related to carboxylic-carbonyl of basic oxides groups. The basic oxides present in the sample may explain the basicity of carbon and will affect its ability to capture carbon dioxide. The treated sample shows an increase of intensity at 3000-3600 cm-1 indicating of hydroxyl group of alcoholic . Both samples show presence of intensity at 1000-1200 cm-1 which is related to phenolic groups and the band near 1480–1610 cm-1 can be associated to pyridine like groups. The trend at both phenolic and pyridine groups for raw and treated biochar do not change much which means that these nitrogen fuctionalities has exists at the parent sample and will facilitate the CO2 adsorption. The sharp peak at 1570cm-1 indicates presence of ketone onto the sample (Biniak et al., 1997). After amine treatment, the increment of intensity band of 1461 to 1685cm-1 indicates the presence of cyclic amide functionality (Jansen and Bekkum, 1994) . The reduction in peak absorbance at band 2360 cm-1 which is associated to CH bonds was recognized for impregnated sample. As a result it can be said that MEA-impregnation reduced the ratio of C–H bonds and the reduction indicates that these generally hydrophobic bonds enables more
% T
rans
mitt
ance
%
Tra
nsm
ittan
ce
carboxylic and carbonyl (basic oxides) groups 1000 – 1500 cm-1 1
hydroxyl group of alcoholic or phenolic 3000-3600 cm-1
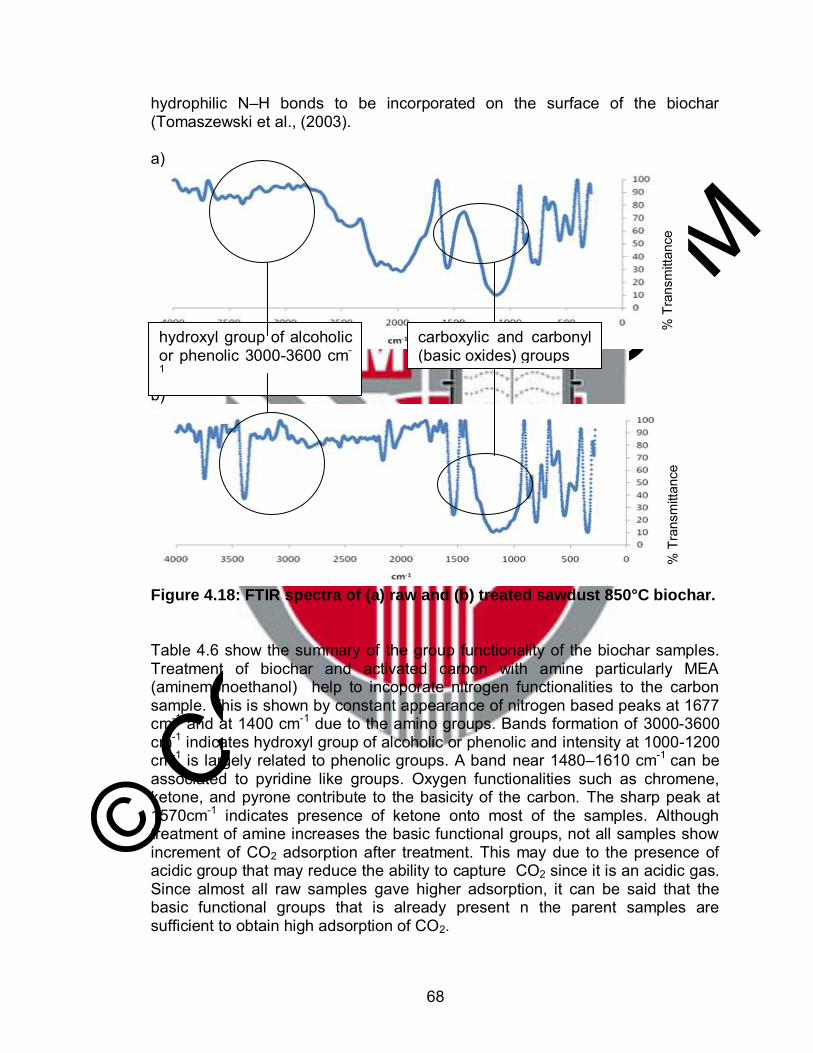
© COPYRIG
HT UPM
68
hydrophilic N–H bonds to be incorporated on the surface of the biochar (Tomaszewski et al., (2003).
a)
b)
Figure 4.18: FTIR spectra of (a) raw and (b) treated sawdust 850°C biochar. Table 4.6 show the summary of the group functionality of the biochar samples. Treatment of biochar and activated carbon with amine particularly MEA (aminemonoethanol) help to incoporate nitrogen functionalities to the carbon sample. This is shown by constant appearance of nitrogen based peaks at 1677 cm-1 and at 1400 cm-1 due to the amino groups. Bands formation of 3000-3600 cm-1 indicates hydroxyl group of alcoholic or phenolic and intensity at 1000-1200 cm-1 is largely related to phenolic groups. A band near 1480–1610 cm-1 can be associated to pyridine like groups. Oxygen functionalities such as chromene, ketone, and pyrone contribute to the basicity of the carbon. The sharp peak at 1570cm-1 indicates presence of ketone onto most of the samples. Although treatment of amine increases the basic functional groups, not all samples show increment of CO2 adsorption after treatment. This may due to the presence of acidic group that may reduce the ability to capture CO2 since it is an acidic gas. Since almost all raw samples gave higher adsorption, it can be said that the basic functional groups that is already present n the parent samples are sufficient to obtain high adsorption of CO2.
% T
rans
mitt
ance
%
Tra
nsm
ittan
ce
hydroxyl group of alcoholic or phenolic 3000-3600 cm-
1
carboxylic and carbonyl (basic oxides) groups 1000 – 1500 cm-1 1
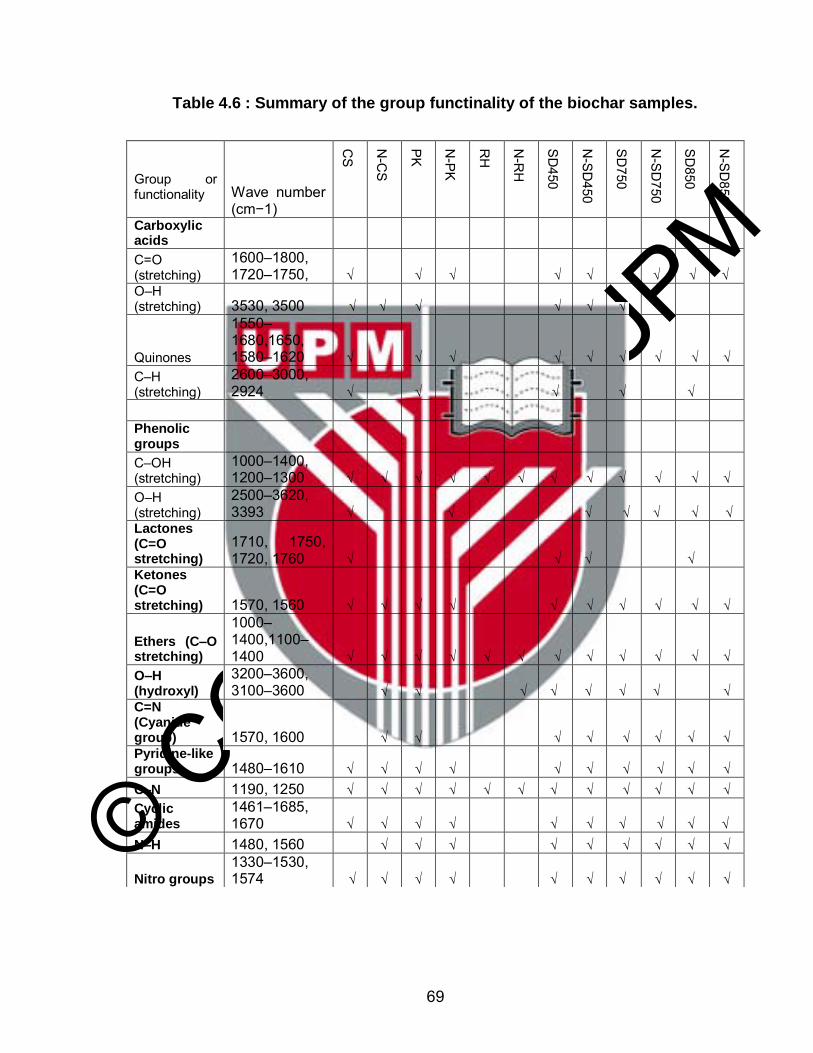
© COPYRIG
HT UPM
69
Table 4.6 : Summary of the group functinality of the biochar samples.
Group or functionality
Wave number (cm−1)
CS
N-C
S
PK
N-PK
RH
N-R
H
SD450
N-SD
450
SD750
N-SD
750
SD850
N-SD
850
Carboxylic acids C=O (stretching)
1600–1800, 1720–1750, √ √ √ √ √ √ √ √ √
O–H (stretching) 3530, 3500 √ √ √ √ √ √
Quinones
1550–1680,1650, 1580–1620 √
√ √ √ √ √ √ √ √
C–H (stretching)
2600–3000, 2924 √ √ √ √ √
Phenolic groups C–OH (stretching)
1000–1400, 1200–1300 √ √ √ √ √ √ √ √ √ √ √ √
O–H (stretching)
2500–3620, 3393 √
√ √ √ √ √ √
Lactones (C=O stretching)
1710, 1750, 1720, 1760 √
√ √ √
Ketones (C=O stretching) 1570, 1560 √ √ √ √ √ √ √ √ √ √
Ethers (C–O stretching)
1000–1400,1100–1400 √ √ √ √ √ √ √ √ √ √ √ √
O–H (hydroxyl)
3200–3600, 3100–3600 √ √ √ √ √ √ √ √
C=N (Cyanide group) 1570, 1600 √ √
√ √ √ √ √ √
Pyridine-like groups 1480–1610 √ √ √ √ √ √ √ √ √ √ C–N 1190, 1250 √ √ √ √ √ √ √ √ √ √ √ √ Cyclic amides
1461–1685, 1670 √ √ √ √ √ √ √ √ √ √
N–H 1480, 1560 √ √ √ √ √ √ √ √ √
Nitro groups
1330–1530, 1574 √ √ √ √ √ √ √ √ √ √
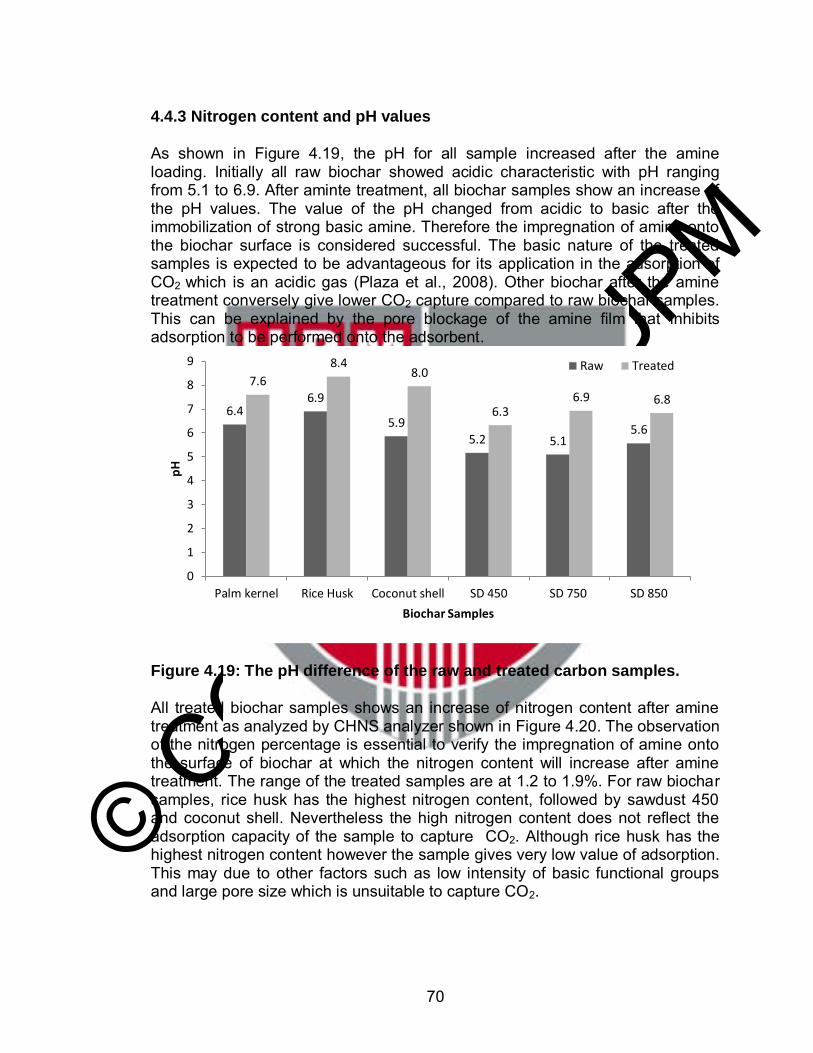
© COPYRIG
HT UPM
70
4.4.3 Nitrogen content and pH values
As shown in Figure 4.19, the pH for all sample increased after the amine loading. Initially all raw biochar showed acidic characteristic with pH ranging from 5.1 to 6.9. After aminte treatment, all biochar samples show an increase of the pH values. The value of the pH changed from acidic to basic after the immobilization of strong basic amine. Therefore the impregnation of amine onto the biochar surface is considered successful. The basic nature of the treated samples is expected to be advantageous for its application in the adsorption of CO2 which is an acidic gas (Plaza et al., 2008). Other biochar after the amine treatment conversely give lower CO2 capture compared to raw biochar samples. This can be explained by the pore blockage of the amine film that inhibits adsorption to be performed onto the adsorbent.
Figure 4.19: The pH difference of the raw and treated carbon samples. All treated biochar samples shows an increase of nitrogen content after amine treatment as analyzed by CHNS analyzer shown in Figure 4.20. The observation of the nitrogen percentage is essential to verify the impregnation of amine onto the surface of biochar at which the nitrogen content will increase after amine treatment. The range of the treated samples are at 1.2 to 1.9%. For raw biochar samples, rice husk has the highest nitrogen content, followed by sawdust 450 and coconut shell. Nevertheless the high nitrogen content does not reflect the adsorption capacity of the sample to capture CO2. Although rice husk has the highest nitrogen content however the sample gives very low value of adsorption. This may due to other factors such as low intensity of basic functional groups and large pore size which is unsuitable to capture CO2.
6.4 6.9
5.9 5.2 5.1
5.6
7.6
8.4 8.0
6.3 6.9 6.8
0
1
2
3
4
5
6
7
8
9
Palm kernel Rice Husk Coconut shell SD 450 SD 750 SD 850
pH
Biochar Samples
Raw Treated
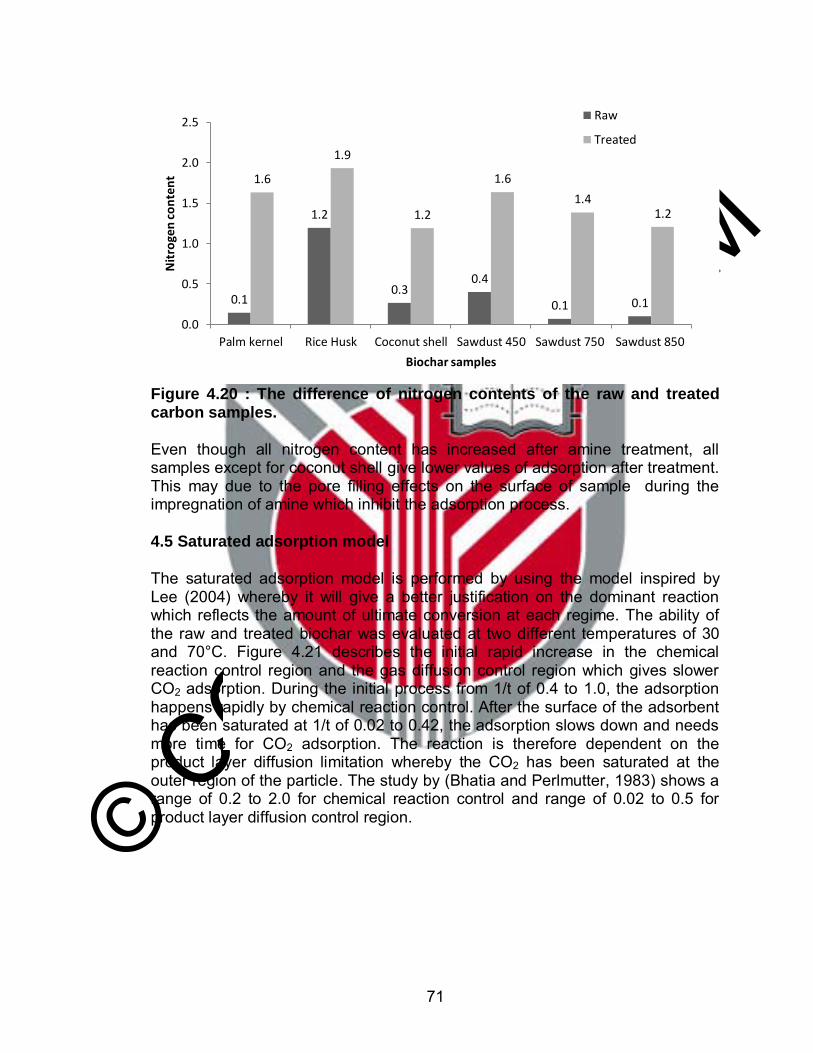
© COPYRIG
HT UPM
71
Figure 4.20 : The difference of nitrogen contents of the raw and treated carbon samples. Even though all nitrogen content has increased after amine treatment, all samples except for coconut shell give lower values of adsorption after treatment. This may due to the pore filling effects on the surface of sample during the impregnation of amine which inhibit the adsorption process.
4.5 Saturated adsorption model
The saturated adsorption model is performed by using the model inspired by Lee (2004) whereby it will give a better justification on the dominant reaction which reflects the amount of ultimate conversion at each regime. The ability of the raw and treated biochar was evaluated at two different temperatures of 30 and 70°C. Figure 4.21 describes the initial rapid increase in the chemical reaction control region and the gas diffusion control region which gives slower CO2 adsorption. During the initial process from 1/t of 0.4 to 1.0, the adsorption happens rapidly by chemical reaction control. After the surface of the adsorbent has been saturated at 1/t of 0.02 to 0.42, the adsorption slows down and needs more time for CO2 adsorption. The reaction is therefore dependent on the product layer diffusion limitation whereby the CO2 has been saturated at the outer region of the particle. The study by (Bhatia and Perlmutter, 1983) shows a range of 0.2 to 2.0 for chemical reaction control and range of 0.02 to 0.5 for product layer diffusion control region.
0.1
1.2
0.3 0.4
0.1 0.1
1.6
1.9
1.2
1.6
1.4 1.2
0.0
0.5
1.0
1.5
2.0
2.5
Palm kernel Rice Husk Coconut shell Sawdust 450 Sawdust 750 Sawdust 850
Nit
roge
n c
on
ten
t
Biochar samples
Raw
Treated
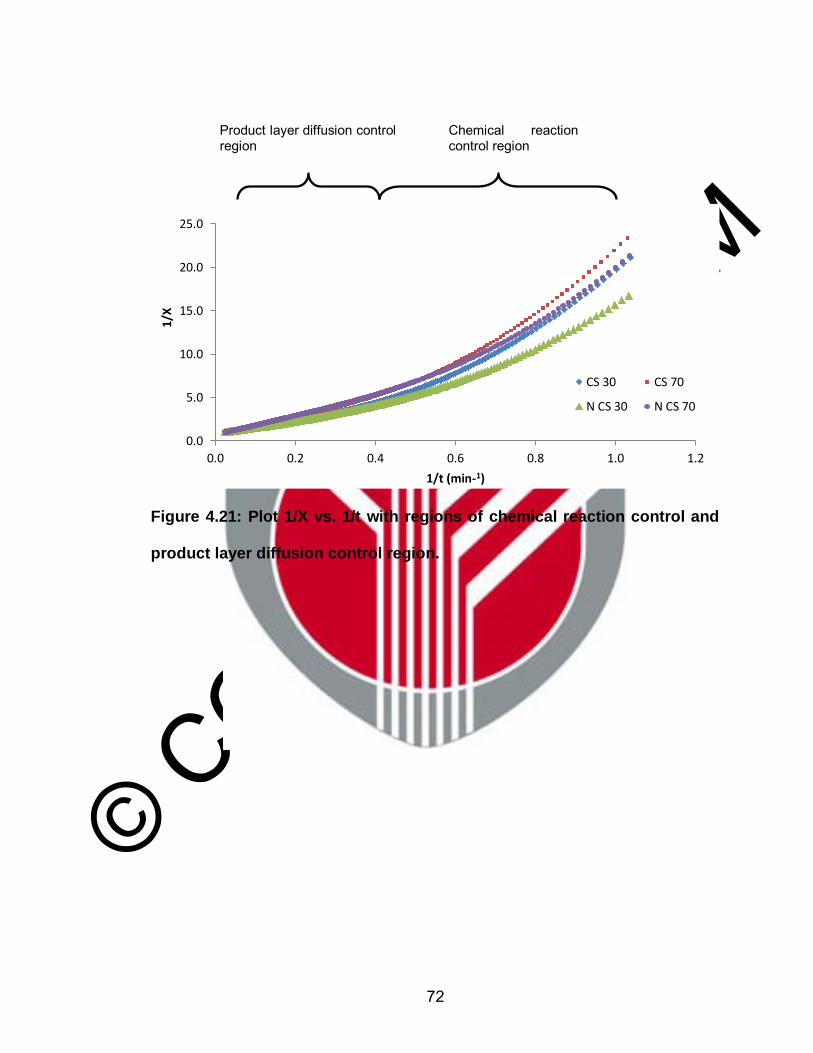
© COPYRIG
HT UPM
72
Figure 4.21: Plot 1/X vs. 1/t with regions of chemical reaction control and
product layer diffusion control region.
0.0
5.0
10.0
15.0
20.0
25.0
0.0 0.2 0.4 0.6 0.8 1.0 1.2
1/X
1/t (min-1)
CS 30 CS 70
N CS 30 N CS 70
Chemical reaction control region
Product layer diffusion control region
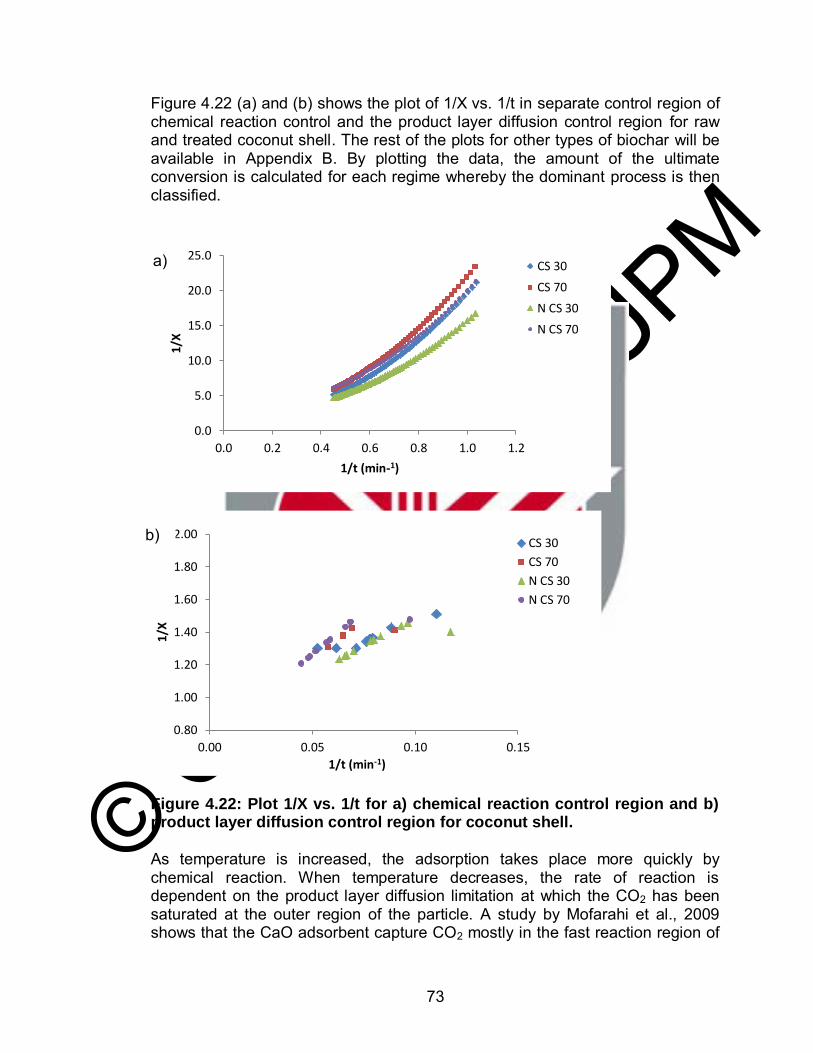
© COPYRIG
HT UPM
73
Figure 4.22 (a) and (b) shows the plot of 1/X vs. 1/t in separate control region of chemical reaction control and the product layer diffusion control region for raw and treated coconut shell. The rest of the plots for other types of biochar will be available in Appendix B. By plotting the data, the amount of the ultimate conversion is calculated for each regime whereby the dominant process is then classified.
Figure 4.22: Plot 1/X vs. 1/t for a) chemical reaction control region and b) product layer diffusion control region for coconut shell.
As temperature is increased, the adsorption takes place more quickly by chemical reaction. When temperature decreases, the rate of reaction is dependent on the product layer diffusion limitation at which the CO2 has been saturated at the outer region of the particle. A study by Mofarahi et al., 2009 shows that the CaO adsorbent capture CO2 mostly in the fast reaction region of
0.0
5.0
10.0
15.0
20.0
25.0
0.0 0.2 0.4 0.6 0.8 1.0 1.2
1/X
1/t (min-1)
CS 30
CS 70
N CS 30
N CS 70
0.80
1.00
1.20
1.40
1.60
1.80
2.00
0.00 0.05 0.10 0.15
1/X
1/t (min-1)
CS 30
CS 70
N CS 30
N CS 70
a)
b)
© COPYRIG
HT UPM
74
chemical reaction control at which the ultimate conversion is at the range of 70 to 80% (Mofarhi et al., 2009). Although all samples should be dependent of chemical reaction control at high temperature adsorption of 70°C, all biochar samples have dominant product layer diffusion control as shown in Table 4.8. The conversion is calculated from Xu=kb. The product layer diffusion control gives values of 85% to 99% ultimate conversion. The biochar does not capture much CO2 in the chemical reaction control since the ultimate conversion is only ranging from 4% to 55%. This may indicate that the biochar samples may take more time to capture CO2 as compared to the ultimate conversion values during the chemical reaction control. Table 4.9 shows the regression analysis, R2 of the saturated adsorption model for raw and treated biochar. The product layer diffusion gives R2 values at the range of 0.9800 to 0.9982. The chemical reaction control gives R2 values at the range of 0.7513 to 0.9656. This indicates the experimental fits well with the reaction mechanism.
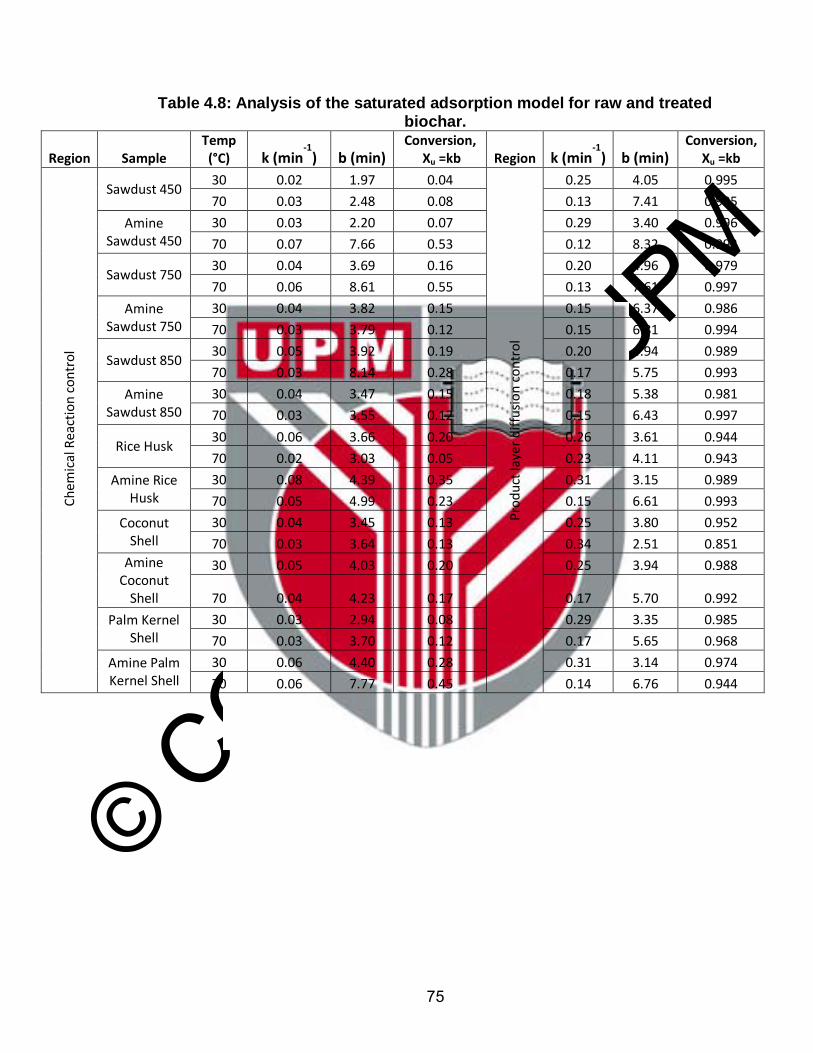
© COPYRIG
HT UPM
75
Table 4.8: Analysis of the saturated adsorption model for raw and treated biochar.
Region Sample Temp (°C) k (min
-1) b (min)
Conversion, Xu =kb Region k (min
-1) b (min)
Conversion, Xu =kb
Ch
emic
al R
eact
ion
co
ntr
ol
Sawdust 450 30 0.02 1.97 0.04
Pro
du
ct la
yer
dif
fusi
on
co
ntr
ol
0.25 4.05 0.995
70 0.03 2.48 0.08 0.13 7.41 0.995
Amine Sawdust 450
30 0.03 2.20 0.07 0.29 3.40 0.996
70 0.07 7.66 0.53 0.12 8.32 0.993
Sawdust 750 30 0.04 3.69 0.16 0.20 4.96 0.979
70 0.06 8.61 0.55 0.13 7.61 0.997
Amine Sawdust 750
30 0.04 3.82 0.15 0.15 6.37 0.986
70 0.03 3.79 0.12 0.15 6.81 0.994
Sawdust 850 30 0.05 3.92 0.19 0.20 4.94 0.989
70 0.03 8.14 0.28 0.17 5.75 0.993
Amine Sawdust 850
30 0.04 3.47 0.15 0.18 5.38 0.981
70 0.03 3.55 0.12 0.15 6.43 0.997
Rice Husk 30 0.06 3.66 0.20 0.26 3.61 0.944
70 0.02 3.03 0.05 0.23 4.11 0.943
Amine Rice Husk
30 0.08 4.39 0.35 0.31 3.15 0.989
70 0.05 4.99 0.23 0.15 6.61 0.993
Coconut Shell
30 0.04 3.45 0.13 0.25 3.80 0.952
70 0.03 3.64 0.13 0.34 2.51 0.851
Amine Coconut
Shell
30 0.05 4.03 0.20 0.25 3.94 0.988
70 0.04 4.23 0.17 0.17 5.70 0.992
Palm Kernel Shell
30 0.03 2.94 0.08 0.29 3.35 0.985
70 0.03 3.70 0.12 0.17 5.65 0.968
Amine Palm Kernel Shell
30 0.06 4.40 0.28 0.31 3.14 0.974
70 0.06 7.77 0.45 0.14 6.76 0.944
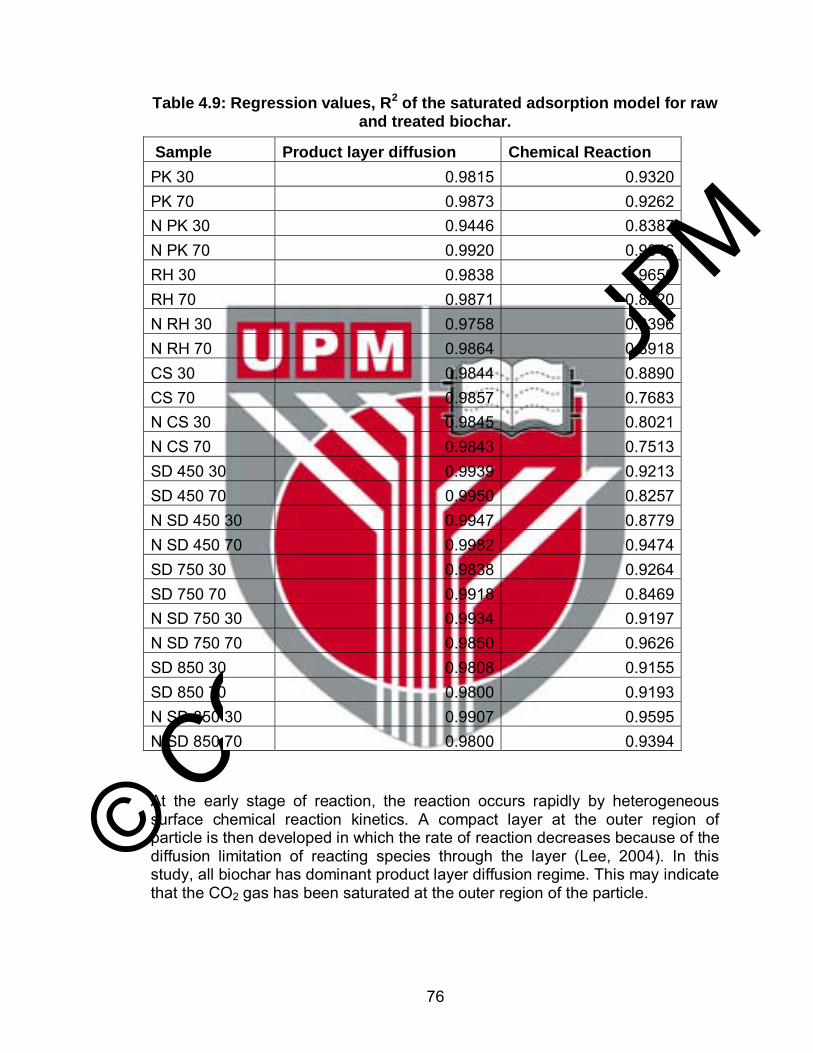
© COPYRIG
HT UPM
76
Table 4.9: Regression values, R2 of the saturated adsorption model for raw and treated biochar.
At the early stage of reaction, the reaction occurs rapidly by heterogeneous surface chemical reaction kinetics. A compact layer at the outer region of particle is then developed in which the rate of reaction decreases because of the diffusion limitation of reacting species through the layer (Lee, 2004). In this study, all biochar has dominant product layer diffusion regime. This may indicate that the CO2 gas has been saturated at the outer region of the particle.
Sample Product layer diffusion Chemical Reaction
PK 30 0.9815 0.9320 PK 70 0.9873 0.9262 N PK 30 0.9446 0.8387 N PK 70 0.9920 0.9046 RH 30 0.9838 0.9656 RH 70 0.9871 0.8220 N RH 30 0.9758 0.8396 N RH 70 0.9864 0.8918 CS 30 0.9844 0.8890 CS 70 0.9857 0.7683 N CS 30 0.9845 0.8021 N CS 70 0.9843 0.7513 SD 450 30 0.9939 0.9213 SD 450 70 0.9950 0.8257 N SD 450 30 0.9947 0.8779 N SD 450 70 0.9982 0.9474 SD 750 30 0.9838 0.9264 SD 750 70 0.9918 0.8469 N SD 750 30 0.9934 0.9197 N SD 750 70 0.9850 0.9626 SD 850 30 0.9808 0.9155 SD 850 70 0.9800 0.9193 N SD 850 30 0.9907 0.9595 N SD 850 70 0.9800 0.9394
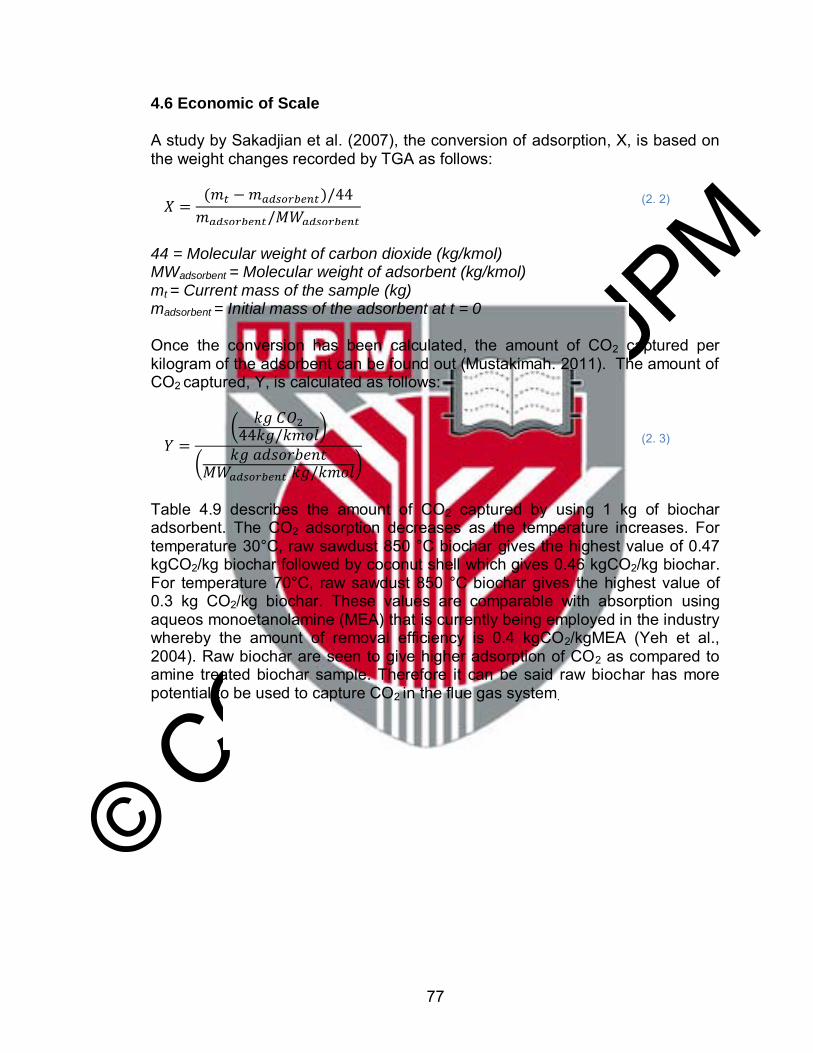
© COPYRIG
HT UPM
77
4.6 Economic of Scale
A study by Sakadjian et al. (2007), the conversion of adsorption, X, is based on the weight changes recorded by TGA as follows:
𝑋 =(𝑚𝑡 − 𝑚𝑎𝑑𝑠𝑜𝑟𝑏𝑒𝑛𝑡 )/44
𝑚𝑎𝑑𝑠𝑜𝑟𝑏𝑒𝑛𝑡/𝑀𝑊𝑎𝑑𝑠𝑜𝑟𝑏𝑒𝑛𝑡 (2. 2)
44 = Molecular weight of carbon dioxide (kg/kmol) MWadsorbent = Molecular weight of adsorbent (kg/kmol) mt = Current mass of the sample (kg) madsorbent = Initial mass of the adsorbent at t = 0 Once the conversion has been calculated, the amount of CO2 captured per kilogram of the adsorbent can be found out (Mustakimah. 2011). The amount of CO2 captured, Y, is calculated as follows:
𝑌 =(
𝑘𝑔 𝐶𝑂2
44𝑘𝑔/𝑘𝑚𝑜𝑙)
(𝑘𝑔 𝑎𝑑𝑠𝑜𝑟𝑏𝑒𝑛𝑡
𝑀𝑊𝑎𝑑𝑠𝑜𝑟𝑏𝑒𝑛𝑡 𝑘𝑔/𝑘𝑚𝑜𝑙) (2. 3)
Table 4.9 describes the amount of CO2 captured by using 1 kg of biochar adsorbent. The CO2 adsorption decreases as the temperature increases. For temperature 30°C, raw sawdust 850 °C biochar gives the highest value of 0.47 kgCO2/kg biochar followed by coconut shell which gives 0.46 kgCO2/kg biochar. For temperature 70°C, raw sawdust 850 °C biochar gives the highest value of 0.3 kg CO2/kg biochar. These values are comparable with absorption using aqueos monoetanolamine (MEA) that is currently being employed in the industry whereby the amount of removal efficiency is 0.4 kgCO2/kgMEA (Yeh et al., 2004). Raw biochar are seen to give higher adsorption of CO2 as compared to amine treated biochar sample. Therefore it can be said raw biochar has more potential to be used to capture CO2 in the flue gas system.

© COPYRIG
HT UPM
78
Table 4.9: Amount of CO2 captured by using 1 kg of adsorbent
No Sample
Weight of CO2 captured (kg)
Adsorption at 30 °C Adsorption at 70 °C
1 Palm kernel shell 0.40 0.18
2 Rice Husk 0.09 0.06
3 Coconut shell 0.46 0.27
4 Sawdust 450 °C 0.23 0.16
5 Sawdust 750 °C 0.43 0.27
6 Sawdust 850 °C 0.47 0.30
7 Amine Palm kernel shell 0.35 0.23
8 Amine Rice Husk 0.09 0.06
9 Amine Coconut shell 0.36 0.27
10 Amine Sawdust 450 °C 0.22 0.14
11 Amine Sawdust 750 °C 0.40 0.20
12 Amine Sawdust 850 °C 0.43 0.21
© COPYRIG
HT UPM
79
4.7 Chapter Summary
In the ultimate analysis, the nitrogen content for all samples increased after the amine treatment. It can be said that the impregnation of amine onto the adsorbent is successful with the increase of nitrogen contents. Nitrogen functionalities which are of basic characteristics impregnated in the sample may assist the CO2 adsorption since it is an acid gas. Palm kernel shell biochar has the highest surface area of 290.4m2/g followed by SD850 and coconut shell. The SEM results show porous and fragmented surfaces for raw biochar. However the pores of the carbon have been observed to reduce due to amine loading that takes place in between the pores. The studied biochar have pore sizes between the range of <2nm and 2-50 nm which indicates it is in the micropores and mesopores region evaluated from the physisorption analysis. The CO2 adsorption behavior of the raw and amine treated biochar are analyzed using TGA at two different temperatures of 30 and 70°C. For raw samples, SD850 gives higher adsorption of 47.5mgCO2/g sorbent, followed by coconut shell and SD750. Rice husk gives the lowest adsorption value. At higher temperature of 70°C, lower CO2 adsorption occurs due to the need of higher surface adsorption energy and molecule diffusion rate. This will result to the adsorbed gas becomes unsteady and desorption happens on the surface of the carbon (Mercedes et al.,2005). Adsorption at low temperature is highly related to the surface area at which the adsorption amount is proportional to the surface area value (Maroto-Vaer et al., 2008). SD850 and coconut shell which has the surface area of 182 and 172m2/g give the highest adsorption of 47.5 and 46.45mgCO2/g sorbent respectively. For temperature of 70°C, coconut shell gives the highest adsorption of 30.1mgCO2/g sorbent followed by SD850. The high adsorption of the coconut shell and SD850 may be due to the high surface area coupled with the surface functional groups that are present in the sample since at high temperature physisorption couple with chemisorptions dominates the adsorption process. It is observed that at lower temperature, pore volume of biochar at the range of 0.006 to 0.036cm3/g gives good CO2 adsorption. Pore volume of rice husk of 0.098cm3/g gives poor CO2 adsorption. At higher temperature, the CO2 adsorption is preferable at the pore volume of 0.005 to 0.036cm3/g range. All treated biochar samples show an increment of their pore sizes except for rice husk biochar. Pore sizes of raw biochar at the range of 1.5 and 1.7nm are suitable for CO2 adsorption at low temperature of 30°C. When pore sizes has been increased above 1.9 nm this will lead to the reduction of CO2 adsorption effectiveness. Although the increment of pore sizes after treatment for the almost all treated biochar decreases the adsorption of CO2, the value of the adsorption does not differ much with a difference in the range of 0.2 to 6.1 mgCO2/g sorbent at temperature of 70°C. FTIR results show group functionality of the raw and treated biochar samples. Treatment of biochar with MEA (aminemonoethanol) will facilitate the
© COPYRIG
HT UPM
80
incorporation of nitrogen functionalities to the adsorbents. Some oxygen functionalities such as chromene, ketone, and pyrone contribute to the basicity of the carbon. Amine treatment helps to promote the nitrogen group onto the adsorbent. Examples of some nitrogen functionalities structures are amide group, imide group, lactame group, pyrrolic group, and pyridinic group (Abe et al., 2000; Pels et al., 1995). Although initially the amine treatment was seen to improve the adsorption of CO2, this is not applicable for biochar since raw biochar gives better adsorption compared to amine treated biochar. Therefore it can be said that raw biochar has better potential to capture CO2. All samples show an increase of the pH values and nitrogen content after the amine treatment. The observation of the nitrogen percentage and pH values are essential to verify the impregnation of amine onto the surface of biochar at which the nitrogen content will increase after amine treatment. Nevertheless the high nitrogen content does not reflect the adsorption capacity of the sample to capture CO2. Although rice husk has the highest nitrogen content however the sample gives very low value of adsorption. This may due to other factors such as low intensity of basic functional groups and large pore size which is unsuitable to capture CO2. Since almost all biochar except for coconut shell give low adsorption after amine treatment. This may due to the pore filling effects on the surface of sample during the impregnation of amine which inhibit the adsorption process. The high nitrogen content is not significant to be related to the efffectiveness of adsorption but is essential to prove that the amine has been incorporated to the surface of the adsorbent. Saturated adsorption model provides a fundamental analysis on the dominant process of the adsorption studies. In this study, all biochar samples have dominant product layer diffusion regime. This may indicate that the CO2 has been saturated at the outer region of the particle whereby it takes more time for adsorption to happen. In general the chapter manages to resolve the objectives of the study by evaluating the characteristics of different types of adsorbents differentiate the adsorption capacity of adsorbent at temperatures of 30 and 70°C and describe the saturated adsorption model via CO2 adsorption. Raw biochar has the ability to capture higher CO2 as it is without amine treatment.
© COPYRIG
HT UPM
81
CHAPTER 5 CONCLUSIONS AND RECOMMENDATIONS
The research is able to achieve its objectives which are to characterize the raw and treated biochar to evaluate the adsorption capacity of various adsorbents at temperatures of 30 and 70°C. The biochar residues collected via gasification and pyrolysis were evaluated with TGA to estimate its ability to capture CO2. It is shown that the adsorption capacities are related to the temperature during adsorption. 1. The porous structure shown by SEM demonstrates that the biochar samples are suitable to be used as adsorbent. It is observed that raw biochar gives porous and fragmented surfaces. After amine treatment, the porous surface has reduced which due to amine loading onto the surface of pores. The BET surface area of all raw biochar also gives higher values compared to amine treated biochar. The decrease of surface area after amine treatment shows that the amine has been successfully impregnated onto the surface of adsorbent. 2. The amine impregnation onto biochar is successful by the increment of nitrogen content after treatment by using CHNS analyzer. The value of the pH changed from acidic to basic after the immobilization of strong basic amine onto the biochar. Amino groups have been detected from FTIR analysis which gives constant appearance of nitrogen based peaks. Oxygen functionalities presence also contributes to the basicity of the samples. 3. Raw biochar give higher adsorption as compared to treated biochar samples. The CO2 capture at 30°C may be due to the physisorption which is described as directly proportional to the surface area. 4. At higher temperature of 70°C, raw coconut shell and SD 850 have the highest CO2 adsorption. The high adsorption of these samples may be due to the high surface area coupled with the surface functional groups that are present in the sample. At high temperature, physisorption coupled with chemisorptions dominates the adsorption process whereby the treated sample would give better adsorption. Nevertheless the incorporation of amine does not show good results of CO2 adsorption for all amine treated biochar samples at temperature 70°C except for coconut shell. This may due to the blockage of pores by the amine film which can be seen from the reduction of surface area values after treatment. 5. Biochar for both raw and treated rice husk gives lowest CO2 adsorption at temperature 30 and 70°C due to the large pore sizes of the samples. At lower temperature, the pore sizes of raw biochar in the range of 1.5 and 1.7nm are suitable for CO2 adsorption. The high value of pore size will result in adsorbed gas becomes unsteady and desorption happens on the surface of the carbon. 6. Saturated adsorption model provides the dominant process of each adsorbent. In this study, all biochar gives dominant product layer diffusion
© COPYRIG
HT UPM
82
control. The adsorption is foreseen to react at the outer layer at initial stage which is at the chemical regime. After the CO2 has been saturated at the outer region of the particle, diffusion limiting reaction happens whereby it takes more time for adsorption to happen. The product layer diffusion control gives values of 85-99% ultimate conversion. Overall, all the objectives has been satisfied and it can be said that biochar has the potential to be used as adsorbent to capture CO2. Even though originally the amine treatment was seen to improve the adsorption of CO2, this is not applicable for biochar since raw biochar gives better adsorption as compared to amine treated biochar. Therefore it can be said that raw biochar is suitable to be applied in industry that has flue gas system to capture CO2. Recommendations
In the future, it is recommended that the adsorption is to be performed in several cycles to evaluate the capacity of the biochar towards continual adsorption. Other types of amine chemical treatments may be able to increase the adsorption capacity of the samples without blocking the pore structure. In depth understanding on the relation of pore sizes and pore volume to the ability to capture CO2 should be performed with other biochar samples to verify certain ranges of pore sizes and volume that is suitable for CO2 adsorption. Other than that, the ability and full potential of biochar to capture CO2 should be evaluated in a pilot plant scale to estimate the suitability of the biochar to be implemented in the industries and power plants.
© COPYRIG
HT UPM
83
REFERENCES
Abanades, J. C., Alvarez, D. (2003). Conversion Limits in the Reaction of
CO2 with Lime. Energy and fuels, 17(2), 308–315.
Abe, M., Kawashima, K., Kozawa, K., Sakai, H., Kaneko, K. (2000). Amination of activated carbon and adsorption characteristics of its aminated surface, Langmuir, 16, 5059–5063.
Acedo-Ramos, M., Gomez-Serrano, V., Valenzuela-Calahorro, C., Lopez- Peinado, A. J. (1993). Oxidation of Activated Carbon in Liquid Phase. Spectroscopy Letters: An International Journal for Rapid Communication, 26(6), 1117-1137.
Afroz, R. (2003). Review of air pollution and health impacts in Malaysia. Environmental Research, 92(2), 71–77.
Alvim-Ferraz, M. C. M., Todo-Bom Gaspar, C. M. (2003). Impregnated active carbons to control atmospheric emissions. Journal of Colloid and Interface Science, 266(1), 160–167.
Al-Wabel, M. I., Al-Omran, A., El-Naggar, A. H., Nadeem, M., & Usman, A. R. a. (2013). Pyrolysis temperature induced changes in characteristics and chemical composition of biochar produced from conocarpus wastes. Bioresource technology, 131, 374–9.
Arias, B., Pevida, C., Fermoso, J., Plaza, M.G., Rubiera, F., Pis, J.J. (2008). Influence of torrefaction on the grindability and reactivity of woody biomass. Fuel Processing Technology, 89, 169-175.
Aroua, M. K., Daud, W. M. A. W., Yin, C. Y., & Adinata, D. (2008). Adsorption capacities of carbon dioxide, oxygen, nitrogen and methane on carbon molecular basket derived from polyethyleneimine impregnation on microporous palm shell activated carbon. Separation and Purification Technology, 62(3), 609–613.
Arstad, B., Fjellvag, H., Kongshaug, K. O., Swang, O., Blom, R. (2007). MOFs as low temperature adsorbents for carbon dioxide. In: Gale, J, Rokke N, Zweigel P amd Svenson H (eds), Proceedings of the 8th International Conference on Greenhouse Gas Control Technologies, GHGT : 8 Oxford , UK, Elsevier.
Bansal, R. C., Vastola, F. J., Walker, Jr. P. L. (1974). Influence of H Chemisorption on the Subsequent Chemisorption of O on Activated Graphon. Carbon, 12,355–357.
Bhatia, S. K., Perlmutter, D.D. (1983). Effect of the product layer on the kinetics of the CO2-lime reaction. AIChE Journal, 29 (1) 79-86.
© COPYRIG
HT UPM
84
Biniak, S., Szymański, G., Siedlewski, J., & Świa̧Tkowski, A. (1997). The characterization of activated carbons with oxygen and nitrogen surface groups. Carbon, 35(12), 1799–1810.
Biniak, S., Szymanski, G., Siedlewski, J., Swiatkowski, A. (1997).The characterization of activated carbons with oxygen and nitrogen surface groups. Carbon, 35, 1799–1810.
Boehm, H. P., Diehl, E., Heck, W., Sappok, R. (1964). Surface Oxides of Carbon. Chem. Int. Ed. 3.
Brauer, M., Jamal, H.H. (1998). Fires in Indonesia: Crisis and Reaction. Environment Science and Technology, 404–407.
British Petroleum. (2008). BP Statistical review of world energy. British: BP Plc, http://www.bp.com. Accessed on the 4th of November 2011.
Cagniant, D., Gruber, R., Boudou, J. P., Bilem, C., Bimer, J., Salbut, P. D. (1998). Structural Characterization of Nitrogen-Enriched Coals. Energy Fuels, 12(4), 672–68.
Catherine, E. B., Klaus, S-R., Justinus. A. S., Robert, C. B. (2009). Characterization of biochar from fast pyrolysis and gasification systems, Environmental Progress & Sustainable Energy,28 (3), 386-396.
Chang, E., Pan, S., Chen, Y., Chu, H., Wang, C., & Chiang, P. (2011). CO2 sequestration by carbonation of steelmaking slags in an autoclave reactor. Journal of Hazardous Materials, 195, 107–114.
Chew, T.-L., Ahmad, A. L., Bhatia, S. (2010). Ordered mesoporous silica (OMS) as an adsorbent and membrane for separation of carbon dioxide (CO2). Advances in colloid and interface science, 153(1-2), 43–57.
Dibenedetto, A., Aresta, M., Girardi, R. (2003). New amines for carbon dioxide separation from gas mixtures. Division of fuel chemistry, American Chemical Society-Preprints of Symosia, 48(1),167-168.
Donohue, M. ., & Aranovich, G. . (1998). Classification of Gibbs adsorption isotherms. Advances in Colloid and Interface Science, 76-77, 137–152.
Ermolenko, I. N., Lyubliner, I. P., Gulko, N. V. (1990). Chemically Modified Carbon Fibers and Their Applications, VCH Publishers, New York.
Fanning, P. E., Vannice, M. A. (1993). A DRIFTS study of the formation of surface groups on carbon by oxidation. Carbon, 31(5), 721–730.

© COPYRIG
HT UPM
85
Fargione, J., Hill, J., Tilman, D., Polasky, S., Hawthorne. P. (2008). Land clearing and the biofuel carbon debt. Science; 319 (5867), 1235-1238.
Ferraro, J. R., Rein, A. J. (1985). Applications of Diffuse Reflectance Spectroscopy in the Far-Infrared
Figueroa, J. D., Fout, T., Plasynski. S., McIlvried, H., Srivastava, R. D. (2008) Advances in CO2 capture technology- the U.S Department of Energy’s carbon Sequestration Program. International Journal of Greenhouse Gas Control, 2 (1); 9-20
Francisco, R. (1998). The role of carbon materials in heterogeneous catalysis. Carbon, 36 (3) 159–175.
García, S., Gil, M. V., Martín, C. F., Pis, J. J., Rubiera, F., & Pevida, C. (2011). Breakthrough adsorption study of a commercial activated carbon for pre-combustion CO2 capture, 171, 549–556.
Gary, C. Y. (1943). Municipal Solid Waste to energy conversion processes: Economic, Technical and Renewable Comparisons Book, John Wiley & Sons.
Ghani, W.A.W.A.K, (2010) Negative CO2 emissions: The role of biomass ashes (Biochar). Post Doctoral Thesis. Chemical and Environmental Engineering Department, Universiti Putra Malaysia.
Gómez-Serrano, V., Piriz-Almeida, F., Durán-Valle, C.J., Pastor-Villegas, J. (1999). Formation of oxygen structures by air activation. A study by FT-IR spectroscopy. Carbon, 37(10), 1517–1528.
Gray, M. L., Champagne, K. J., Fauth, D., Baltrus, J. P., & Pennline, H. (2008). Performance of immobilized tertiary amine solid sorbents for the capture of carbon dioxide. International Journal of Greenhouse Gas Control, 2(1), 3–8.
Greenpeace. (2004). Impacts of Climate Change on Glaciers around the World. http://www.greenpeace.org/raw/content/international/press/reports/impacts-of-climate-change-on-g.pdf. Accessed on 25th December 2011.
Guo, Y., Zhang, H., Tao, N., Liu, Y., Qi, J., Wang, Z., & Xu, H. (2003). Adsorption of malachite green and iodine on rice husk-based porous carbon. Materials Chemistry and Physics, 82(1), 107–115.
Gupta, H., & Fan, L.-S. (2002). Carbonation−Calcination Cycle Using High Reactivity Calcium Oxide for Carbon Dioxide Separation from Flue Gas. Industrial & Engineering Chemistry Research, 41(16), 4035–4042.
© COPYRIG
HT UPM
86
Hassan, M. A., Shirai, Y. (2003) Palm biomass utilization in Malaysia for the production of bioplastic. www.biomass-asia-workshop.jp/presentation_files/21_AliHassan.pdf. Accessed on 20th June 2011.
Heinzerling, A. (2010). July 20, 2010, Global Carbon Dioxide Emissions Fall in 2009 - Past Decade Still Sees Rapid Emissions Growth. Eco-Economy Indicators, http://www.earth-policy.org . Accessed on the 4th of February 2012.
Huang, H. Y., Yang, R. T., Chinn, D., & Munson, C. L. (2003). Amine-Grafted MCM-48 and Silica Xerogel as Superior Sorbents for Acidic Gas Removal from Natural Gas, (10), 2427–2433.
Huntzinger, D. N., Gierke, J. S., Kawatra, S. K., Eisele, T. C., Sutter, L. L., Sutter, L. L. (2009). Carbon Dioxide Sequestration in Cement Kiln Dust through Mineral Carbonation. Environmental Science and Technology, 43, 1986–1992.
Ida, J., Lin, Y. S. (2003). Mechanism of high-temperature CO2 sorption on lithium zirconate. Environmental science & technology, 37(9), 1999–2004.
IEA Bioenergy. (2007). Task 34: Pyrolysis of Biomass, http://www.ieabioenergy.com. Accessed on 20th December 2011
International Biochar Initiative. (2013) Biochar Production Units. http://www.biochar-international.org/technology/production. Accessed on the 21st of August 2013.
Islam, M. N., Ani, F. N. (2000). Techno-economics of rice husk pyrolysis, conversion with catalytic treatment to produce liquid fuel. Bioresource Technology, 73(1), 67-75.
IUPAC. (1972). IUPAC manual of symbols and terminology, Pure Appl. Chem. 31, 587
Jadhav, P. D., Chatti, R. V., Biniwale, R. B., Labhsetwar, N. K., Devotta, S., Rayalu, S. S. (2007). Monoethanol Amine Modified Zeolite 13X for CO2 Adsorption at Different Temperatures. Energy & Fuels, 21, 3555–3559.
Jansen, R .J. J., Bekkum, H. V. (1995). XPS of nitrogen-containing functional groups on activated carbon. Carbon, 33,1021-1027.
Jansen, R. J. J., van Bekkum, H. (1994). Amination and ammoxidation of activated carbons. Carbon, 32(8), 1507–1516.
Johannes L. (2007). Bio-energy in the black. Ecol Environ, 5(7), 381-387.

© COPYRIG
HT UPM
87
Johannes, L. and Stephen, J. (2009). Biochar for Environmental Management, Science and Technology, Earthscan Publishers Ltd. London.
Ka´zmierczak, J., Biniak, S., Swiatkowski, A., Radeke, H., (1991). Interdependence of different parameters characterizing the chemistry of an activated carbon surface. Journal of the Chemical Society, Faraday Transactions, 87(21), 3557–3561.
Karanfil, T., Kilduff, J. E. (1999). Role of Granular Activated Carbon Surface Chemistry on the Adsorption of Organic Compounds. 1. Priority Pollutants. Environmental science & technology, 33, 3217–3224.
Kelly-Yong, T. L., Lee, K. T., Mohamed, A. R., Bhatia, S. (2007). Potential of hydrogen from oil palm biomass as a source of renewable energy worldwide. Energy Policy, 35(11), 5692-5701.
Kim, B.-J., Cho, K.-S., Park, S.-J. (2010). Copper oxide-decorated porous carbons for carbon dioxide adsorption behaviors. Journal of colloid and interface science, 342(2), 575–8.
Kim, S., Ida, J., Guliants, V. V., & Lin, J. Y. S. (2005). Tailoring pore properties of MCM-48 silica for selective adsorption of CO2. The journal of physical chemistry, 109(13), 6287–6293.
Koenig, P. C., Squires, R. G., Laurendeau, N. M. (1985). Evidence for two-site model of char gasification by carbon dioxide. Carbon, 23(5), 531–536.
Kutics, K., Suzuki, M. (1992). Attachment and Growth of Biomass on Surface-Modified Activated Carbon Fibers. Water Science and Technology, 26, 665-671.
Lach, J., Okoniewska, E., Neczaj, E., & Kacprzak, M. (2007). Removal of Cr(III) cations and Cr(VI) anions on activated carbons oxidized by CO2. Desalination, 206(1-3), 259–269.
Lambert, J. B., Shurvell, H. F., Lightner. D. A., Cooks, R. G. (1998). Organic Structural Spectroscopy, Prentice Hall, Upper Saddle River, New Jersey.
Lambert, J. B., Shurvell, H. F., Verbit, L., Cooks, R. G., Stout, G. H. (1976). Organic Structural Analysis, Macmillan, New York.
Lambert, J. B., Shurvell, H. F., Verbit, L., Cooks, R. G., Stout, G. H. (1976). Organic Structural Analysis, Macmillan, New York.
Lau, L. C., Tan, K. T., Lee, K. T., & Mohamed, A. R. (2009). A comparative study on the energy policies in Japan and Malaysia in fulfilling their
© COPYRIG
HT UPM
88
nations’ obligations towards the Kyoto Protocol. Energy Policy, 37(11), 4771–4778.
Leal, O., Bolivar, C., Ovalles, C., Jos, J., & Espidel, Y. (1995). Reversible adsorption of carbon dioxide on amine surface-bonded silica gel, 240, 183–189.
Lee, D. (2004). An apparent kinetic model for the carbonation of calcium oxide by carbon dioxide. Chemical Engineering Journal, 100(1-3), 71–77.
Leon, C. A., Radovic, L.R.,(1994). Chemistry and Physics of Carbon. P.A. Thrower (Ed.), Marcel Dekker, New York.
Li, P., Ge, B., Zhang, S., Chen, S., Zhang, Q., & Zhao, Y. (2008). CO2 capture by polyethylenimine-modified fibrous adsorbent. Langmuir: the ACS journal of surfaces and colloids, 24(13), 6567–74.
Lim, S., & Teong, L. K. (2010). Recent trends, opportunities and challenges of biodiesel in Malaysia: An overview. Renewable and Sustainable Energy Reviews, 14(3), 938–954.
Lorestani , A. Z. (2006). Biological treatment of palm oil mill effluent (POME) using an up-flow anaerobic sludge fixed film (UASFF) bioreactor. Ph.D. thesis. School of Chemical Engineering,. Universiti Sains Malaysia.
Malik, R., Ramteke, D. S., & Wate, S. R. (2006). Physico-chemical and surface characterization of adsorbent prepared from groundnut shell by ZnCl2 activation and its ability to adsorb colour, 13(July), 319–328.
Mangun, C. L., Benak, K. R., Daley, M. A. (1999). Oxidation of activated carbon fibers: effect on pore size, surface chemistry, and adsorption properties. J. Economy, Chem. Mater. 11, 3476–3483.
Mangun, C. L., Benak, K. R., Economy, J., & Foster, K. L. (2001). Surface chemistry, pore sizes and adsorption properties of activated carbon fibers and precursors treated with ammonia. Carbon, 39, 1809–1820.
Maroto-Valer, M. M. (2010). Developments and innovation in carbon dioxide (CO2) capture and storage technology. Volume 1: Carbon dioxide (CO2) capture, transport and industrial applications, CRC Press, Woodhead Publishing Series in Energy.
Maroto-Valer, M. M., Lu, Z., Zhang, Y., & Tang, Z. (2008). Sorbents for CO2 capture from high carbon fly ashes. Waste management, 28(11), 2320–2328.
© COPYRIG
HT UPM
89
Maroto-Valer, M. M., Tang, Z., & Zhang, Y. (2005). CO2 capture by activated and impregnated anthracites. Fuel Processing Technology, 86(14-15), 1487–1502.
Maroto-Valer, M. M., Zhong, T., Z., Zhang, Y. (2005). CO2 capture by activated and impregnated anthracites. Fuel processing technology, 8, 1487-1502.
Martín, C. F., Plaza, M. G., García, S., Pis, J. J., Rubiera, F., Pevida, C. (2011). Microporous phenol–formaldehyde resin-based adsorbents for pre-combustion CO2 capture. Fuel, 90, 2064–2072.
Mattson, J. S., Mark, Jr H. B. (1971). Activated Carbon: Surface Chemistry and Adsorption from Solution. Marcel Dekker, New York.
Mauna Loa Observatory. (2011) CO2 Data, http://co2now.org/. Accessed on the 4th of November 2011.
Mei, Z., Yin, W., Jian, Y., Yajun, T., Guangwen, X. (2012). Porous carbon from vinegar lees for phenol adsorption. Particuology, 10 (1) 2012 , 35–41.
Meldrum, B. J., Rochester, C. H. (1990). In situ infrared study of the surface oxidation of activated carbon dispersed in potassium bromide. Journal of the Chemical Society, Faraday Trans, 86, 2997–3002.
Menendez, J. A., Phillips, J., Xia, B., Radovic, L. R. (1996). On the Modification and Characterization of Chemical Surface Properties of Activated Carbon: In the Search of Carbons with Stable Basic Properties. Langmuir, 12, 4404–4410.
Michael, S., Rodney, L., Taylor, Philip, L., Walker, Jr., Paul, C. P. (1983). FTIR studies of saran chars. Carbon, 21, 69-74.
Mofarahi, M., Roohi, P., Farshadpoor, F. (2009). Study of Cao Sorbent for CO2 Capture from Flue Gases, Chemical Engineering Transactions, 17, 403-408.
Mores, P., Scenna, N., Mussati, S. (2011) Post-combustion CO2 capture process: Equilibrium stage mathematical model of the chemical absorption of CO2 into monoethanolamine (MEA) aqueous solution. Chemical engineering research and design, 89, 1587–1599.
Mores, P., Scenna, N., Mussati, S. (2011). Post-combustion CO2 capture process: Equilibrium stage mathematical model of the chemical absorption of CO2 into monoethanolamine (MEA) aqueous solution. Chemical engineering research and design. 89, 1587–1599.
© COPYRIG
HT UPM
90
Mustakimah, M. (2011). Synthesis of calcium oxide from waste cockle shell for CO2 adsorption, Master Thesis, Chemical Engineering Department, Universiti Teknologi PETRONAS.
Nakahara, M., Sanada, Y. (1995). FT-IR ATR spectroscopy of the edge surface of pyrolytic graphite and its surface/PVC interface. Journal of Material Science, 30(17), 4363–4368.
Octave, L. (1999). Chemical Reaction Engineering Book, third edition, Wiley,
Othman, M. R., Rasid, N. M., & Fernando, W. J. N. (2006). Mg–Al hydrotalcite coating on zeolites for improved carbon dioxide adsorption. Chemical Engineering Science, 61(5), 1555–1560.
Paolo, D, (1993). Adsorption and desorption of sulphur dioxide from simulated flue gas on active carbon: The effect of the ash content. Carbon, 31(1), 47–51.
Pels, J.R., Kapteijn, F., Moulijn, J.A, Zhu, Q., Thomas, K.M. (1995). Evolution of nitrogen functionalities in carbonaceous materials during pyrolysis, Carbon, 33,1641–1653.
Plaza, M. G., González, a. S., Pevida, C., Pis, J. J., & Rubiera, F. (2012). Valorisation of spent coffee grounds as CO2 adsorbents for postcombustion capture applications. Applied Energy, 99, 272–279.
Plaza, M. G., Pevida, C., Arenillas, A., Rubiera, F., Pis, J. J. (2007).CO2 capture by adsorption with nitrogen enriched carbons. Fuel, 86, 2204-2212.
Plaza, M. G., Pevida, C., Arias, B., Fermoso, Casal, M. D., Martín, C. F., Rubiera, F., Pis, J.J. (2009b). Development of low-cost biomass-based adsorbents for postcombustion CO2 capture. Fuel, 88, 2442–2447.
Plaza, M. G., Pevida, C., Arias, B., Fermoso, J., Arenillas, a., Rubiera, F., & Pis, J. J. (2008). Application of thermogravimetric analysis to the evaluation of aminated solid sorbents for CO2 capture. Journal of Thermal Analysis and Calorimetry, 92(2), 601–606.
Plaza, M. G., Pevida, C., Arias, B., Fermoso, J., Rubiera, F., Pis, J. J. (2009a). A comparison of two methods for producing CO2 capture adsorbents. Energy Procedia, 1,1107–1113.
Pradhan, B. K., Sandlea, N. K. (1999). Effect of different oxidizing agent treatments on the surface properties of activated carbons. Carbon, 37(8), 1323-1332.
© COPYRIG
HT UPM
91
Przepio´rski, J., Skrodzewicz, M., Morawski, A. W. (2004). High temperature ammonia treatment of activated carbon for enhancement of CO2 adsorption, Applied Surface Science, 22(5),235–242.
Przepiórski,J. (2006). Enhanced adsorption of phenol from water by ammonia-treated activated carbon. Journal of Hazardous Material, 135, 453–456.
Puri, B. R., McGuire, M. J., Suffet, I. H. (1983). Physicochemical aspects of carbon affecting adsorption from the aqueous phase. Advances in Chemistry Series, American Chemical Society, Washington, 77–93.
Puri, B. R., Walker, Jr. P. L. (1970). Chemistry and Physics of Carbon. Marcel Dekker, New York.
Ramesh, K., S., Jan, B. W., Vicki, L. B., Xuehao, L., Geoffrey, W. C., Mohammad, R. H. (2004). Characterization of chars from pyrolysis of lignin. Fuel, 83, 1469-1482.
Rebitanim, N. Z., Wan Ab Karim Ghani, W. A., Rebitanim, N. A., & Amran Mohd Salleh, M. (2013). Potential applications of wastes from energy generation particularly biochar in Malaysia. Renewable and Sustainable Energy Reviews, 21, 694–702.
Region. Fourier Transform Infrared Spectroscopy, Vol 4. Academic, Orlando Academic Press, New York.
Report of National Biomass Strategy 2020: New wealth creation for Malaysia’s palm oil industry. (2011). http://www.poic.com.my. Accessed on 25th June 2011.
Rivera-Tinoco, R., Bouallo, C. (2010). Comparison of absorption rates and absorption capacity of ammonia solvents with MEA and MDEA aqueous blends for CO2 capture. Journal of Cleaner Production, 18, 875-880.
Rivera-Tinoco, R., Bouallou, C. (2010). Comparison of absorption rates and absorption capacity of ammonia solvents with MEA and MDEA aqueous blends for CO2 capture. Journal of Cleaner Production, 18(9), 875–880.
Saha, B., Tai, M. H., Streat, M. (2001). Study of activated carbon after oxidation and subsequent treatment characterization. Process Safety and Environment Protection, 79, 211–217
Sakadjian, B. B., Iyer, M. V., Gupta, H., & Fan, L. (2007). KINETICS , CATALYSIS , AND REACTION ENGINEERING Kinetics and Structural Characterization of Calcium-Based Sorbents Calcined
© COPYRIG
HT UPM
92
under Subatmospheric Conditions for the High-Temperature CO 2 Capture Process, 35–42.
Salame, I. I., Bandosz, T. J. (2001). Surface Chemistry of Activated Carbons: Combining the Results of Temperature-Programmed Desorption, Boehm, and Potentiometric Titrations. Journal of colloid and interface science, 240(1), 252–258.
Satyapal, S., Filburn, T., Trela, J., Strange, J. (2001). Performance and Properties of a Solid Amine Sorbent for Carbon Dioxide Removal in Space Life Support Applications. Energy and Fuels, 15, 250–255.
Sellitti, C., Koenig, J. L., Ishida, H. (1990). Surface characterization of graphitized carbon fibers by attenuated total reflection fourier transform infrared spectroscopy. Carbon, 28(1), 221–228.
Sevilla, M., Fuertes, A. B. (2011). Sustainable porous carbons with a superior performance for CO2 capture. Energy & Environmental Science, 4(5), 1765.
Sevilla, M., Maciá-Agulló, J. A., Fuertes, A. B. (2011). Hydrothermal carbonization of biomass as a route for the sequestration of CO2: Chemical and structural properties of the carbonized products. Biomass and Bioenergy, 35(7), 3152–3159.
Shafeeyan, M. S., Daud, W. M. A. W., Houshmand, A., & Arami-Niya, A. (2011). Ammonia modification of activated carbon to enhance carbon dioxide adsorption: Effect of pre-oxidation. Applied Surface Science, 257(9), 3936–3942.
Shafeeyan, M. S., Daud, W. M. A. W., Houshmand, A., Shamiri A. (2010). A review on surface modification of activated carbon for carbon dioxide adsorption. Journal of Analytical and Applied Pyrolysis, 89, 143–151.
Singh, R. P., Hakimi, I. M., Norizan, E., Iliyana, M.S. (2010). Composting of waste from palm oil mill: a sustainable waste management practice. Rev Environ Sci Bioethanol , 9, 331-344.
Siriwardane, R. V., Shen M-S Fisher, E. P., Losch, J. (2005). Adsorption of CO2 on zeolites at moderate temperatures. Energy and Fuels; 19(3), 1153-1159.
Sohi, S., Lopez-capel, E., Krull, E., & Bol, R. (2009). Biochar , climate change and soil : A review to guide future research, February.
Sricharoenchaikul, V., Pechyen, C., Aht-Ong, D., Atong, D. (2008). Preparation and Characterization of Activated Carbon from the Pyrolysis of Physic Nut (Jatropha curcas L.) Waste, Energy Fuels, 22(1), 31–37.
© COPYRIG
HT UPM
93
Stewart, C., Hessami, M. (2005). A study of methods of carbon dioxide capture and sequestration –– the sustainability of a photosynthetic bioreactor approach. Energy Conversion and Management, 46, 403–420.
Stewart, C., Hessami, M. (2005). A study of methods of carbon dioxide capture and sequestration–the Sustainability of a photosynthetic bioreactor approach. Energy Conversion and Management, 46, 403–420.
Stohr, B., Boehm, H. P., Schlogl, R. (1991) Enhancement of the catalytic activity of activated carbons in oxidation reactions by thermal treatment with ammonia or hydrogen cyanide and observation of a superoxide species as a possible intermediate. Carbon. 29, 707-720.
Tomaszewski, W., Gun’ko, V. ., Skubiszewska-Zięba, J., & Leboda, R. (2003). Structural characteristics of modified activated carbons and adsorption of explosives. Journal of Colloid and Interface Science, 266(2), 388–402.
Ueno, M., Kawamitsu, Y., Komiya, Y., Sun, L. (2007). Carbonisation and gasification of bagasse for effective utilisation of sugarcane biomass. International Sugar Journal. 110, 22-26.
Wang, Z., Achenie, L. E. K., Khativ, S. J., & Oyama, S. T. (2012). Simulation study of single-gas permeation of carbon dioxide and methane in hybrid inorganic–organic membrane. Journal of Membrane Science, 387-388, 30–39.
Wenzhong, S., Shouchun, Z., Peimang, J., Yihong, L. (2010). Surface chemistry of pyrolyzed starch carbons on adsorption of ammonia and carbon disulfide. Colloids and surfaces A: Physiochem Engineering Aspects, 356, 16-20.
World Health Organization. (1998). Report of the Bioregional Workshop on Health Impacts of Haze Related Air Pollution. WHO, Manila, Philippines.
Xu, T., Liu, X. (2008). Peanut Shell Activated Carbon: Characterization, Surface Modification and Adsorption of Pb2+ from Aqueous Solution. Chinese Journal of Chemical Engineering, 16(3), 401–406.
Xu, X., Song, C., Andresen, J. M., Miller, B. G., & Scaroni, A. W. (2002). Novel Polyethylenimine-Modified Mesoporous Molecular Sieve of MCM-41 Type as High-Capacity Adsorbent for CO2 Capture. Energy and Fuels, 16(18), 1463–1469.
© COPYRIG
HT UPM
94
Xu, X., Zhao, X., Sun, L., Liu, X. (2009). Adsorption separation of carbon dioxide, methane and nitrogen on monoethanol amine modified β-zeolite. Journal of Natural Gas Chemistry, 18(2), 167–172.
Yagi, S. & Kunii, D. (1955) Studies on combustion of carbon particles in flames and fluidized beds. in Proceedings of 5th International Symposium on Combustion, Reinhold, New York, 231-244.
Yan, X., Zhanga, L., Zhang, Y., Ke Qiao, Yana, Z., Komarneni, S. (2011). Amine-modified mesocellular silica foams for CO2 capture. Chemical Engineering Journal, 168, 918–924.
Yang, H., Xu, Z., Fan, M., Gupta, R., Slimane, R. B., Bland, A. E., & Wright, I. (2008). Progress in carbon dioxide separation and capture: A review. Journal of environmental sciences (China), 20(1), 14–27.
Yeh, J. T., Pennline, H. W., Resnik, K. P., & Rygle, K. (2004). Absorption and regeneration studies for CO2 capture by aqueous ammonia, 1–12. Third Annual Conference on carbon capture & sequestration, Alexandria, VA.
© COPYRIG
HT UPM
95
APPENDICES
Appendix A
The pH values were evaluated by using the pH meter. The instrument was switched on for 30 minutes for the electronics to warm up. The electrode was then rinsed with distilled water and dried. Then the electrode was immersed in pH 7 buffer and calibrated. Electrode was then dried again and submerged in pH 4 buffer to check the pH reading. After the pH meter has given the correct reading, the instrument is then ready to be used to acquire the pH values of the biochar. The biochar were mixed with distilled water in a ratio of 1:1. The mixture was then stirred for 15 minutes and filtered. The filtrate was then used to get the pH reading.
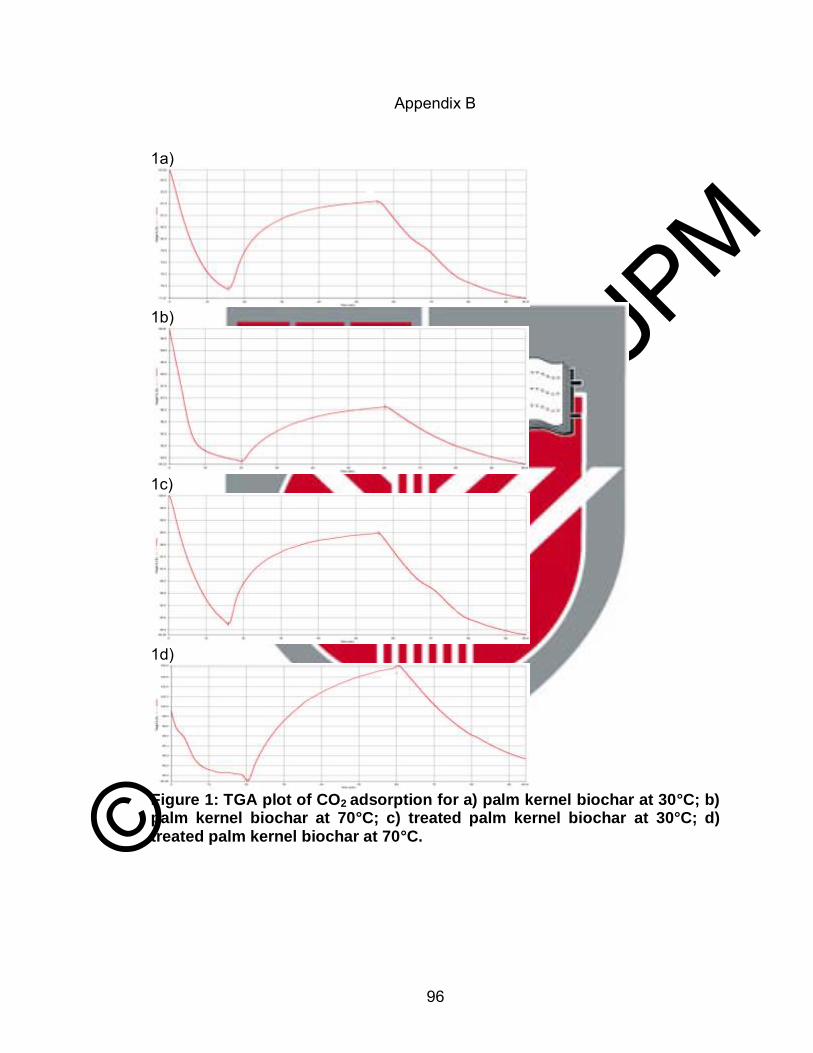
© COPYRIG
HT UPM
96
Appendix B
1a)
1b)
1c)
1d)
Figure 1: TGA plot of CO2 adsorption for a) palm kernel biochar at 30°C; b) palm kernel biochar at 70°C; c) treated palm kernel biochar at 30°C; d) treated palm kernel biochar at 70°C.
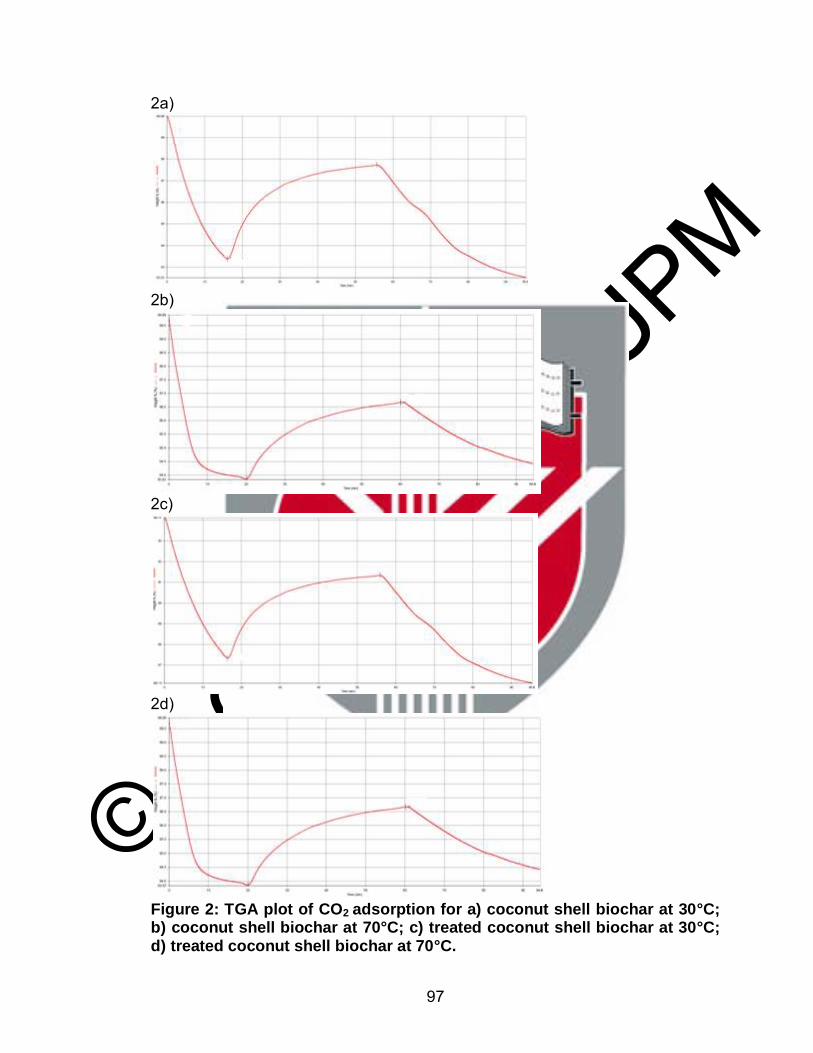
© COPYRIG
HT UPM
97
2a)
2b)
2c)
2d)
Figure 2: TGA plot of CO2 adsorption for a) coconut shell biochar at 30°C; b) coconut shell biochar at 70°C; c) treated coconut shell biochar at 30°C; d) treated coconut shell biochar at 70°C.
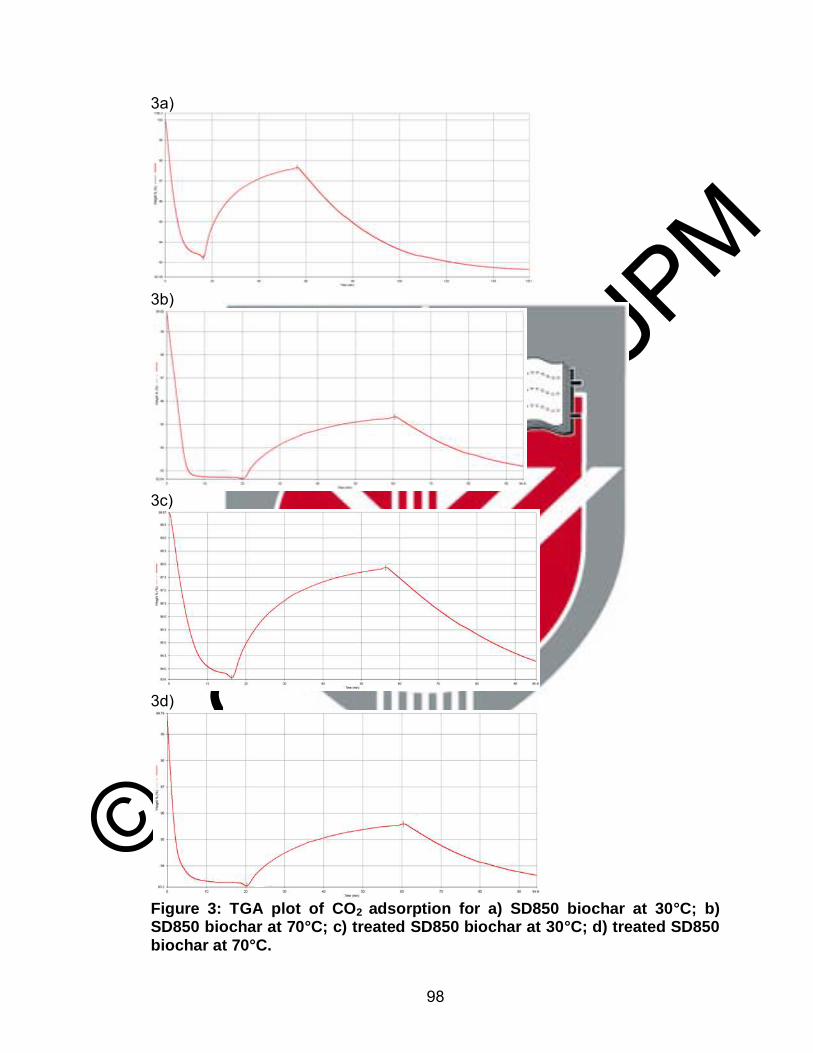
© COPYRIG
HT UPM
98
3a)
3b)
3c)
3d)
Figure 3: TGA plot of CO2 adsorption for a) SD850 biochar at 30°C; b) SD850 biochar at 70°C; c) treated SD850 biochar at 30°C; d) treated SD850 biochar at 70°C.
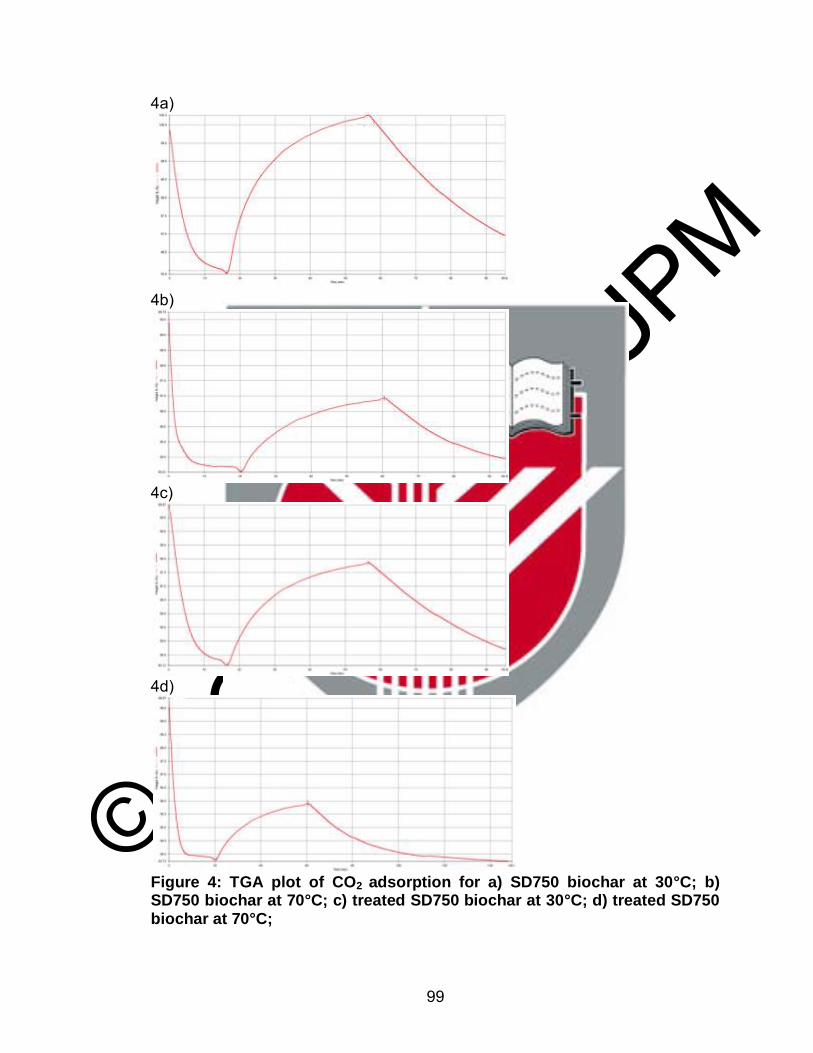
© COPYRIG
HT UPM
99
4a)
4b)
4c)
4d)
Figure 4: TGA plot of CO2 adsorption for a) SD750 biochar at 30°C; b) SD750 biochar at 70°C; c) treated SD750 biochar at 30°C; d) treated SD750 biochar at 70°C;
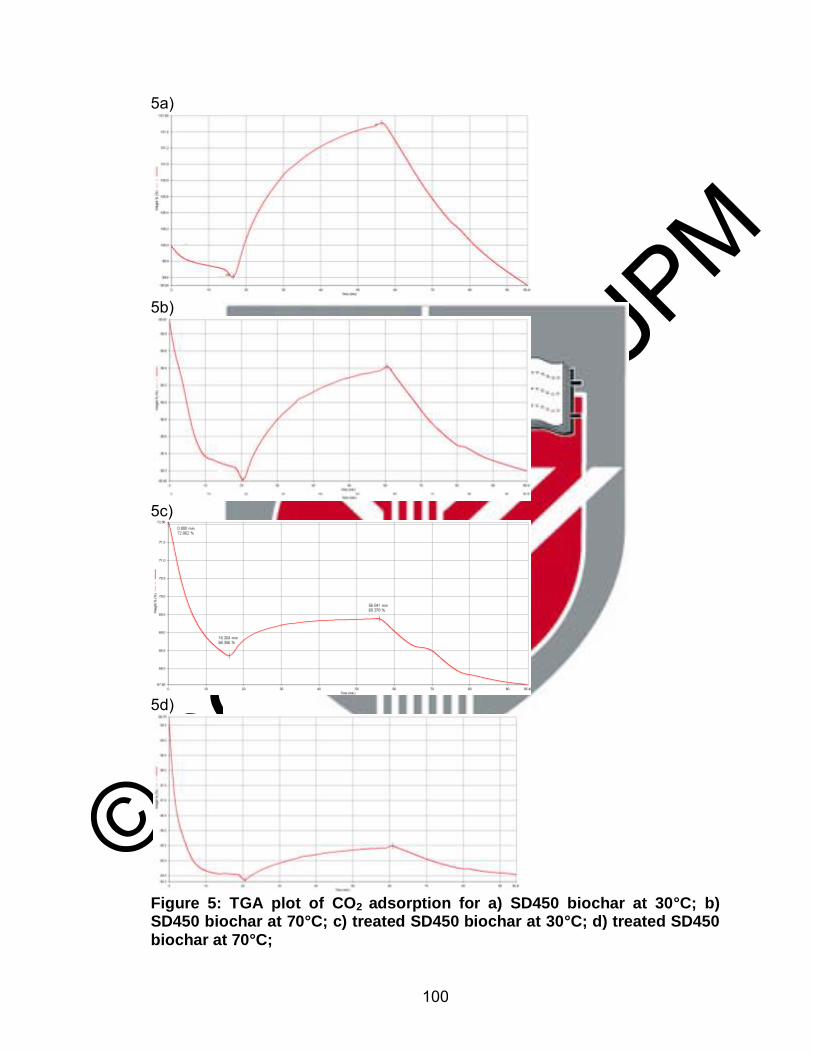
© COPYRIG
HT UPM
100
5a)
5b)
5c)
5d)
Figure 5: TGA plot of CO2 adsorption for a) SD450 biochar at 30°C; b) SD450 biochar at 70°C; c) treated SD450 biochar at 30°C; d) treated SD450 biochar at 70°C;
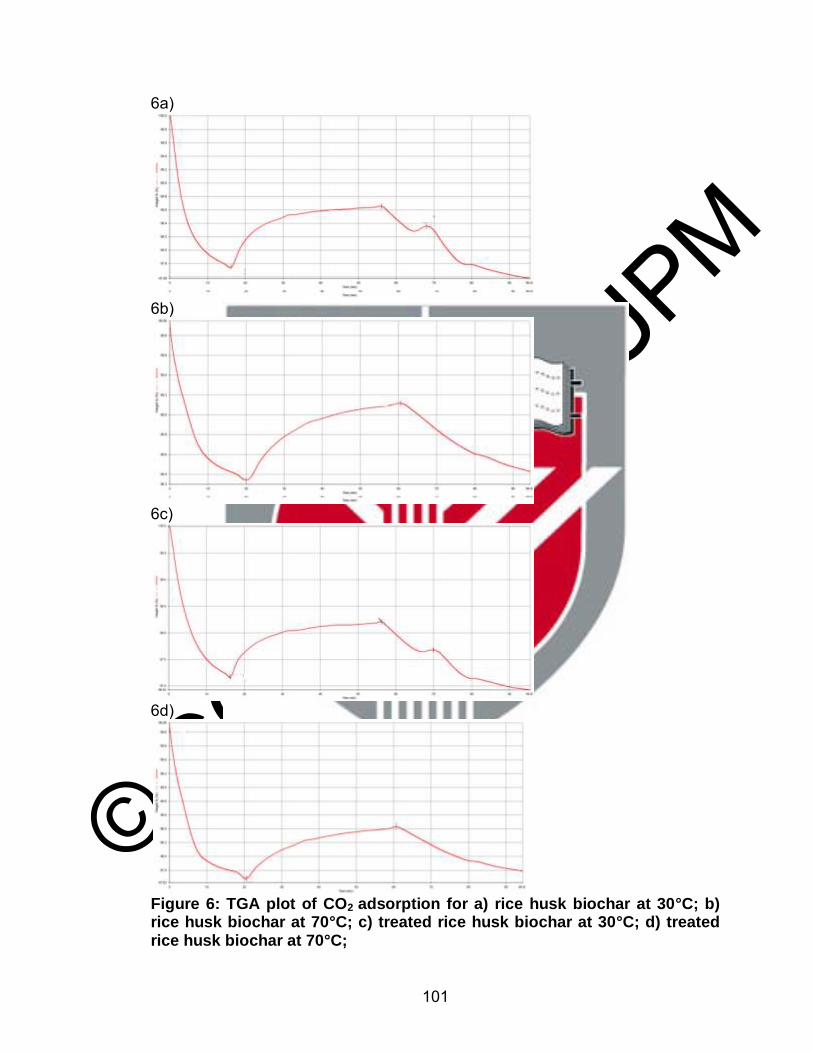
© COPYRIG
HT UPM
101
6a)
6b)
6c)
6d)
Figure 6: TGA plot of CO2 adsorption for a) rice husk biochar at 30°C; b) rice husk biochar at 70°C; c) treated rice husk biochar at 30°C; d) treated rice husk biochar at 70°C;
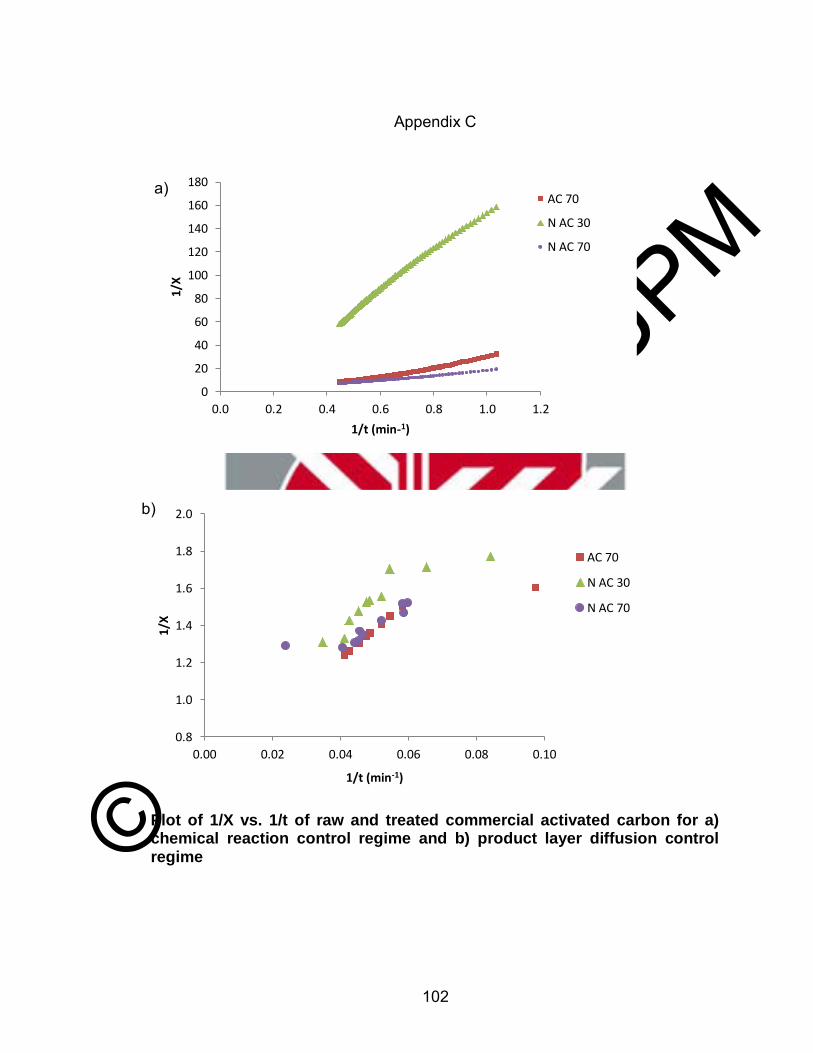
© COPYRIG
HT UPM
102
Appendix C
Plot of 1/X vs. 1/t of raw and treated commercial activated carbon for a) chemical reaction control regime and b) product layer diffusion control regime
0
20
40
60
80
100
120
140
160
180
0.0 0.2 0.4 0.6 0.8 1.0 1.2
1/X
1/t (min-1)
AC 70
N AC 30
N AC 70
0.8
1.0
1.2
1.4
1.6
1.8
2.0
0.00 0.02 0.04 0.06 0.08 0.10
1/X
1/t (min-1)
AC 70
N AC 30
N AC 70
a)
b)
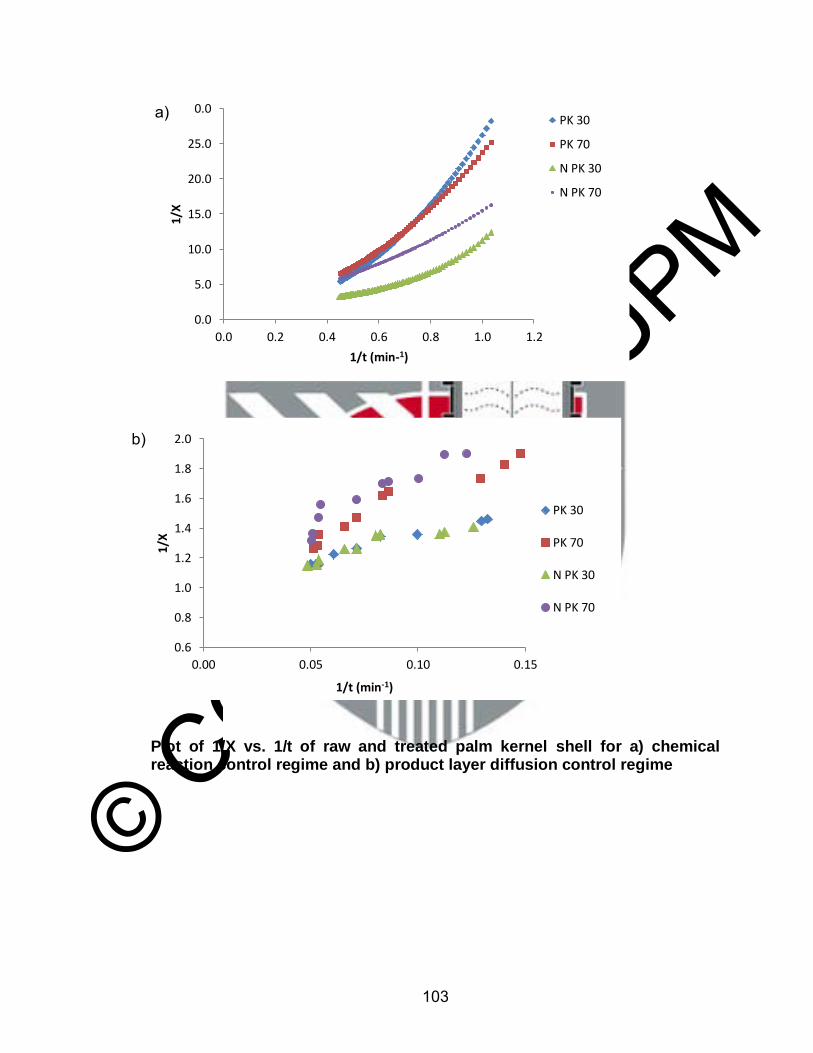
© COPYRIG
HT UPM
103
Plot of 1/X vs. 1/t of raw and treated palm kernel shell for a) chemical reaction control regime and b) product layer diffusion control regime
0.0
5.0
10.0
15.0
20.0
25.0
30.0
0.0 0.2 0.4 0.6 0.8 1.0 1.2
1/X
1/t (min-1)
PK 30
PK 70
N PK 30
N PK 70
0.6
0.8
1.0
1.2
1.4
1.6
1.8
2.0
0.00 0.05 0.10 0.15
1/X
1/t (min-1)
PK 30
PK 70
N PK 30
N PK 70
a) a)
b)
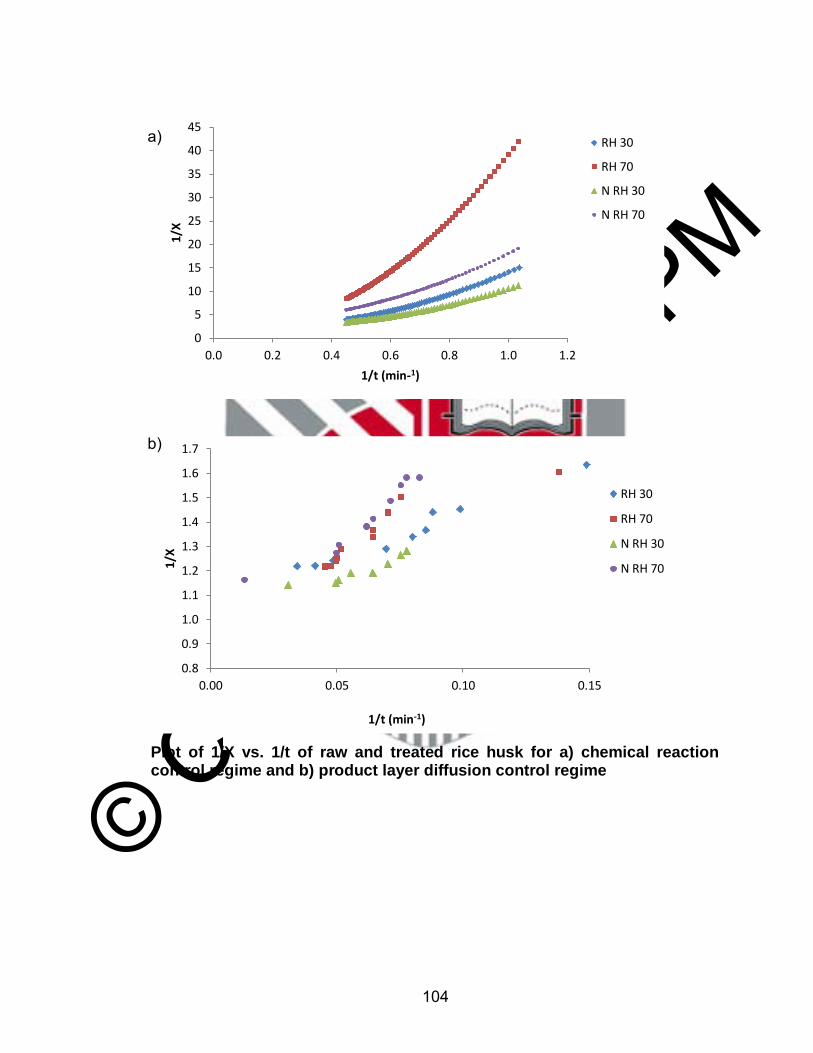
© COPYRIG
HT UPM
104
Plot of 1/X vs. 1/t of raw and treated rice husk for a) chemical reaction control regime and b) product layer diffusion control regime
0
5
10
15
20
25
30
35
40
45
0.0 0.2 0.4 0.6 0.8 1.0 1.2
1/X
1/t (min-1)
RH 30
RH 70
N RH 30
N RH 70
0.8
0.9
1.0
1.1
1.2
1.3
1.4
1.5
1.6
1.7
0.00 0.05 0.10 0.15
1/X
1/t (min-1)
RH 30
RH 70
N RH 30
N RH 70
a)
b)
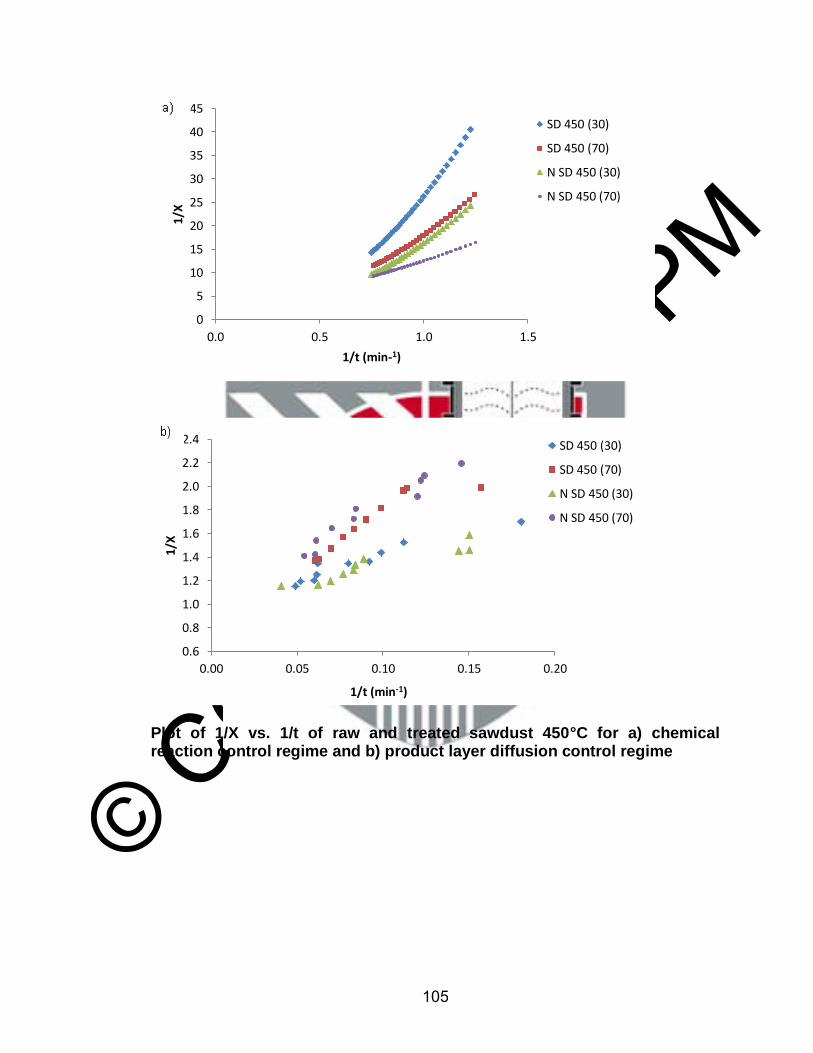
© COPYRIG
HT UPM
105
Plot of 1/X vs. 1/t of raw and treated sawdust 450°C for a) chemical reaction control regime and b) product layer diffusion control regime
0
5
10
15
20
25
30
35
40
45
0.0 0.5 1.0 1.5
1/X
1/t (min-1)
SD 450 (30)
SD 450 (70)
N SD 450 (30)
N SD 450 (70)
0.6
0.8
1.0
1.2
1.4
1.6
1.8
2.0
2.2
2.4
0.00 0.05 0.10 0.15 0.20
1/X
1/t (min-1)
SD 450 (30)
SD 450 (70)
N SD 450 (30)
N SD 450 (70)
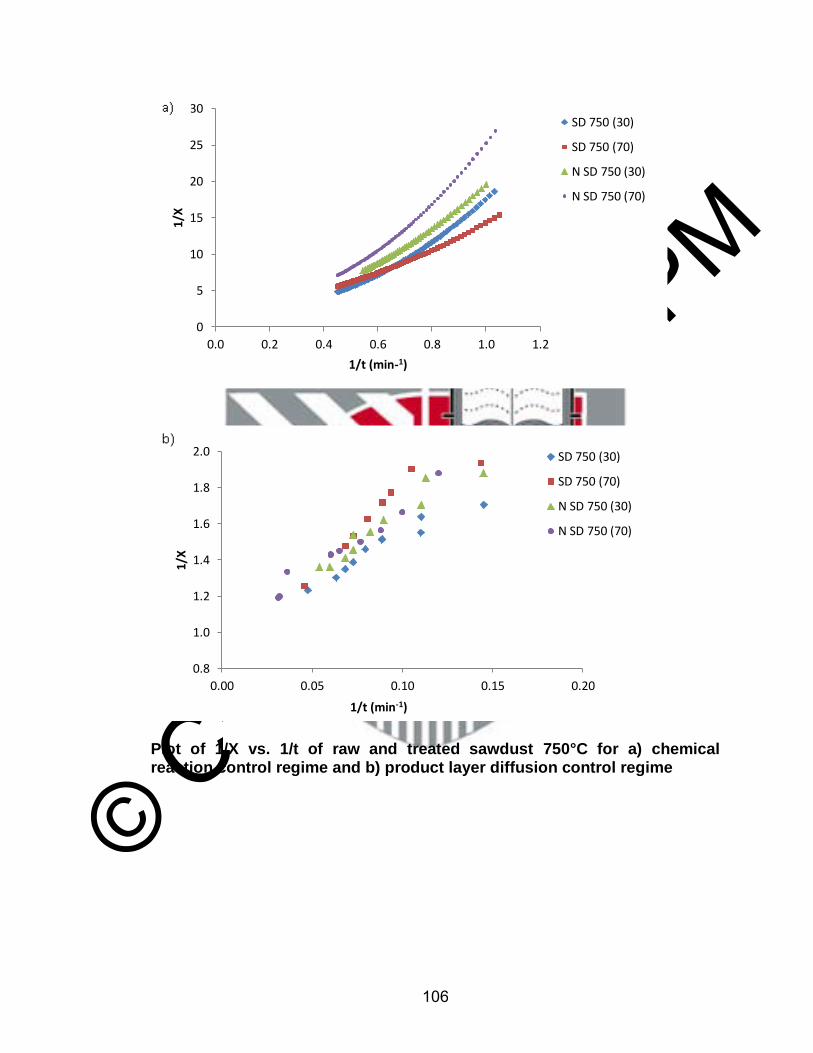
© COPYRIG
HT UPM
106
Plot of 1/X vs. 1/t of raw and treated sawdust 750°C for a) chemical reaction control regime and b) product layer diffusion control regime
0
5
10
15
20
25
30
0.0 0.2 0.4 0.6 0.8 1.0 1.2
1/X
1/t (min-1)
SD 750 (30)
SD 750 (70)
N SD 750 (30)
N SD 750 (70)
0.8
1.0
1.2
1.4
1.6
1.8
2.0
0.00 0.05 0.10 0.15 0.20
1/X
1/t (min-1)
SD 750 (30)
SD 750 (70)
N SD 750 (30)
N SD 750 (70)
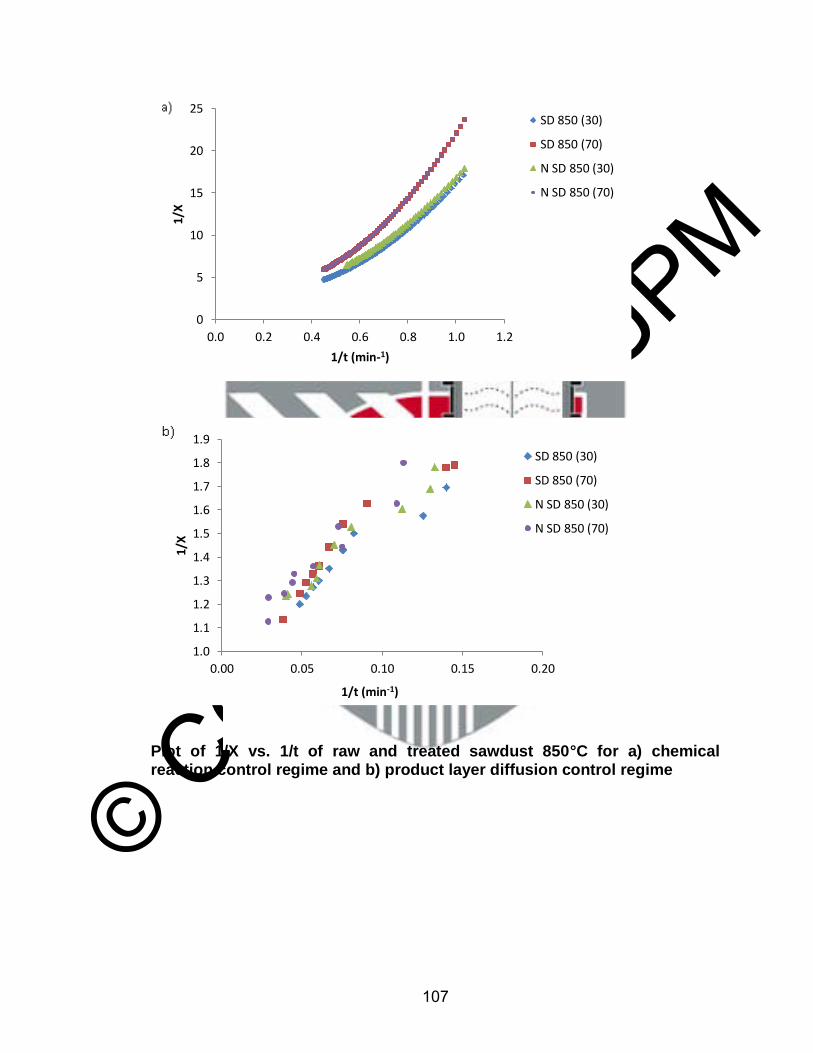
© COPYRIG
HT UPM
107
Plot of 1/X vs. 1/t of raw and treated sawdust 850°C for a) chemical reaction control regime and b) product layer diffusion control regime
0
5
10
15
20
25
0.0 0.2 0.4 0.6 0.8 1.0 1.2
1/X
1/t (min-1)
SD 850 (30)
SD 850 (70)
N SD 850 (30)
N SD 850 (70)
1.0
1.1
1.2
1.3
1.4
1.5
1.6
1.7
1.8
1.9
0.00 0.05 0.10 0.15 0.20
1/X
1/t (min-1)
SD 850 (30)
SD 850 (70)
N SD 850 (30)
N SD 850 (70)

© COPYRIG
HT UPM
108
BIODATA OF STUDENT
Nur Zalikha Rebitanim received her Bachelor of Engineering Degree from Universiti Teknologi PETRONAS, Tronoh, Perak in October 2010. She is currently pursuing her Master Degree in Chemical and Environmental Engineering at Universiti Putra Malaysia. Her main research interest is on carbon dioxide adsorption by using raw and amine treated biochar.

© COPYRIG
HT UPM
109
LIST OF PUBLICATIONS
1. Towards CO2 reduction: The role of biochar (2011); Accepted for Publication in Sains Malaysiana. 2. Review: Carbon Dioxide Capture: Biomass-Derived-Biochar and its Applications (2011); Journal of Dispersion Science and Technology (in press). 3. Potential Applications of Wastes from Energy Generation particularly Biochar and Fly Ashes in Malaysia (2012); Renewable & Sustainable Energy Reviews. 4. Carbon Dioxide Adsorption and Desorption Study on Coconut Shell Biochar with Nitrogen Enrichment (2011); Under Review in Arabian Journal of chemistry. 5. Sawdust–Derived Biochar: Preparation, Characterization and CO2 Adsorption/Desorption Study (2011); Under Review in Chemical Engineering Journal. 6. Carbon Dioxide Adsorption Study on Biochar with Nitrogen Enrichment (2011); Poster Presentation in MPOB International Oil Palm Conference.