Embed Size (px)
Citation preview

Master thesis Educational Science and Technology | Kim Evers
UNIVERSITEITTWENTE.
EXPLORING UNIVERSITY TEACHERS’ ATTITUDESTOWARDS CURRICULUM REFORM

Exploring University Teachers’ Attitudes
Towards a Curriculum Reform
in Which a Process-oriented and Student-centred
Model is Central
Master thesis
Educational Science and Technology
University of Twente
Kim E.M. Evers
s0169129
Supervisors: S.I. van Aalderen-Smeets and J.H. Walma van der Molen
Colloquium: 24 April, 2015


Last year I spend my time struggling, fighting
and finally conquering attitudes. Who would
have thought that attitudes are such
complicated creatures? We all have attitudes,
but I challenge you: try to capture thisintangible concept in a definition or a
conceptual model (are you even aware of
having attitudes?). This was the challenge I
studied last year and with success, I caught
the university teachers’ attitudes towards a
curriculum reform in my conceptual model for
attitudes and measured them with my
instruments. This resulted in somerecommendations for curriculum reform and
training for getting hold on these influential
creatures.
This master thesis is the final proof for having
the competencies needed for obtaining myMaster’s Degree in Educational Science. This
research was commissioned by Marije Hahnen
of the Centre for Educational Support (CES) of
the University of Twente (UT) and supervised
by Sandra van Aalderen and Juliette Walma
van der Molen of the Centre for Science
Education and Talent Development of the UT.
Thanks to everyone who have guided me
through this research process. I thank the
teachers who filled in the questionnaire or
were interviewed by me and gave me insight
into their personal beliefs, thoughts and
feelings about the curriculum reform. I alsowant to extend a special thank you to Sandra
and Nelleke for believing in my research
capacities and making me feel enthusiastic
about research again. Thank you, Juliette, for
your fresh insights for my thesis. I am really
grateful for the patience of Adam and Marije,
thank you for offering me the space I needed.
Thank you, friends and family, for just beingthere and believing in me, I took your advices
to heart.
As a smart person once said to me: “Getting
your Master’s Degree is like having your
driver’s license. Only after you got your
driver’s license, do you really learn to drive.” I
would love to really learn to do research. Iwant to know more about research regarding
professional development and I’m looking
forward to grow professionally within the
team of inspiring researchers I met during my
thesis.
I hope you will enjoy reading my thesis.
Enschede, The Netherlands,
March 2015,
Kim E.M. Evers
PS: If you don’t like something in this thesis…
Well, you can’t change it, so change yourattitude instead.
1 Preface
Start 2 Abstract 3 Introduction 4 Context 6
Theoreticalframework
8Hypothesis and researchquestions
9Conceptualmodel
12
Method 17 Procedure 18 Questionnaires 20Pilotinterviews
23 Interviews 23
Results 24 Questionnaires 25 Interviews 30
Conclusion and discussion 34
The end 41 References 42 Appendices 47

1
Start
2
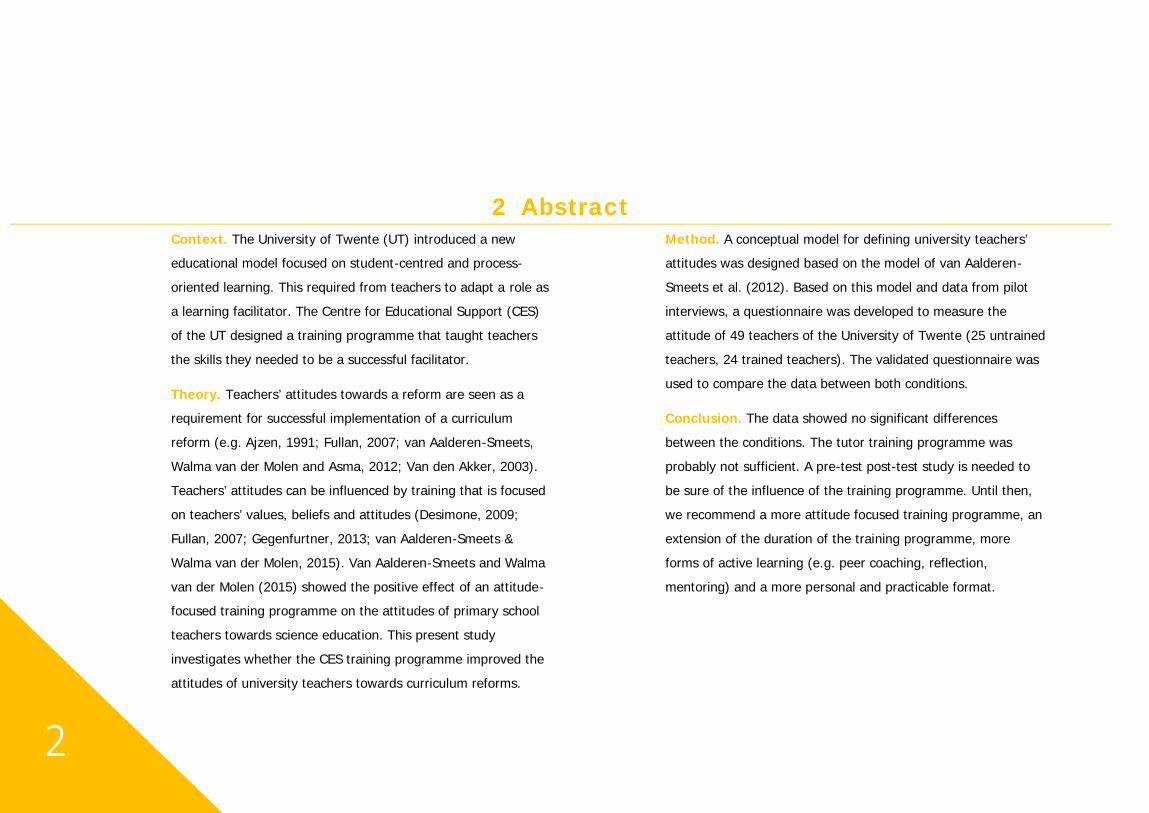
Context. The University of Twente (UT) introduced a neweducational model focused on student-centred and process-
oriented learning. This required from teachers to adapt a role as
a learning facilitator. The Centre for Educational Support (CES)
of the UT designed a training programme that taught teachers
the skills they needed to be a successful facilitator.
Theory. Teachers’ attitudes towards a reform are seen as arequirement for successful implementation of a curriculum
reform (e.g. Ajzen, 1991; Fullan, 2007; van Aalderen-Smeets,
Walma van der Molen and Asma, 2012; Van den Akker, 2003).
Teachers’ attitudes can be influenced by training that is focused
on teachers’ values, beliefs and attitudes (Desimone, 2009;
Fullan, 2007; Gegenfurtner, 2013; van Aalderen-Smeets &
Walma van der Molen, 2015). Van Aalderen-Smeets and Walma
van der Molen (2015) showed the positive effect of an attitude-focused training programme on the attitudes of primary school
teachers towards science education. This present study
investigates whether the CES training programme improved the
attitudes of university teachers towards curriculum reforms.
Method. A conceptual model for defining university teachers’attitudes was designed based on the model of van Aalderen-
Smeets et al. (2012). Based on this model and data from pilot
interviews, a questionnaire was developed to measure the
attitude of 49 teachers of the University of Twente (25 untrained
teachers, 24 trained teachers). The validated questionnaire was
used to compare the data between both conditions.
Conclusion. The data showed no significant differences
between the conditions. The tutor training programme was
probably not sufficient. A pre-test post-test study is needed to
be sure of the influence of the training programme. Until then,
we recommend a more attitude focused training programme, an
extension of the duration of the training programme, more
forms of active learning (e.g. peer coaching, reflection,
mentoring) and a more personal and practicable format.
2 Abstract
3
In 2011, the Dutch Advisory Council for
Education (Onderwijsraad) stated that highlyeducated people should fulfil an innovative
role in society. The aim of higher education is
therefore to develop and support an
innovative and creative way of thinking. Bell
(2010) argues that project based education
(PBE) provides students with the skills they
need nowadays. Examples of these skills are
creative thinking, being self-reliant, andcollaborative and evaluative skills. The speed
of technological, professional and societal
changes asks for process-oriented teaching
models like PBE, where students learn skills to
self-regulate their learning processes
(Vermunt & Verloop, 1999). However, the
educational model of most universities does
not fit the goals of higher education.Therefore the curriculum of higher education
should change to provide the opportunities for
students to develop these skills.
Teachers play a highly important role in
curriculum reforms (Donche, 2005; Fullan,2009; Maskit, 2011). They are the leading
figures in the implementation of the
curriculum (Van den Akker, 2003). As the link
between policymakers and students, teachers
have to interpret and implement the formal
written ideas of others (e.g. Fullan, 2007) and
they have to create a constructive interaction
with the students that leads to lastinglearning results (Delhoofen in Donche, 2005;
Vermunt & Verloop in Donche, 2005). This is
not easy, since curriculum change is a
complex innovation, in which teachers have to
go through serious and fundamental changes
in professional behaviour and their role in
education (Bergen & Van Veen, 2004;
Oolbekkink-Marchand, 2006, Vermunt &Verloop, 1999).
Curriculum reforms require from teachers to
adapt new skills, knowledge and to change
their behaviour. Korthagen (2010) explains
that teachers have to reflect on their beliefsand habits regarding learning and education
when they have to change their behaviour,
because this reflection leads to new views on
education and new competences what will
change their behaviour (Fullan, 2007). Fullan
(2007) agrees that teachers need to reculture
in order to change their behaviour
successfully. If the attitude of the teachers isnot in line with the desired behaviour, than
there is little chance the teacher will execute
this behaviour (Ajzen, 1991). Therefore
teachers’ attitudes towards change are
described as one of the most influential
factors for successful implementation of
reforms (Beets et al, 2008; Evers, Brouwers &
Tomic, 2002; Rafferty et al, 2013).
Changes in attitudes can be achieved by
training, however there is little research about
the link between training and the intention to
3 Introduction
4
reform (Gegenfurtner, 2013). Gegenfurtner
(2013) and the self-determination theory of
Ryan and Deci (2000) argue that people are
more motivated to engage in a reform when
they can identify themselves with the reformor integrate the reform with their own values.
A sense of autonomy is needed to reach these
levels of motivation, e.g. teachers should
initiate the implementation themselves
(autonomous motivation).
Furthermore, van Aalderen-Smeets and
Walma van der Molen (2015) found a
significant effect of attitude-focused training,
in which teachers conscious reflect on their
attitudes, on primary teachers’ attitudes
towards science education. These findings
confirm the plea of Fullan (2007) for
reculturing, and emphasize the importance of
training focused on values, beliefs and
attitudes for stimulating a curriculum reform.
Superficial, fragmented and brief trainingprogrammes do not support teachers
sufficiently to successfully implement a
curriculum reform (Ball and Cohen in Fullan,
2007; Cohen and Hill in Fullan, 2007).
Gegenfurtner (2013) suggests that trainings
should focus on gaining interests and that
trainees should have more autonomy in their
job when one wants to have effective trainingresults (cf Ryan & Deci, 2000).
In conclusion, the importance of training
teachers in curriculum reforms is clear.
Teachers are the key figures in educational
reforms and their attitudes have great
influence on the implementation of the
curriculum reform. On top of that, van
Aalderen-Smeets and Walma van der Molen(2015) showed the positive effect of an
attitude-focused training programme on the
attitudes of primary school teachers.
However, it is less clear whether a training
programme improves the attitudes of
university teachers towards curriculum
reforms. Therefore the aim of this study is to
investigate the influence of a trainingprogramme on university teachers’ attitudes
towards a curriculum reform in which a
process-oriented educational model is central.

5
As a response to the demand for more
student-centred and process-oriented
education, the University of Twente (UT)
introduced a new model of education called
TOM (Twents Onderwijs Model) in September2014. It was rolled out over six participating
university faculties. The aim of the TOM
model is to improve students’ study results
and provide students with the skills they need
in their future jobs. Key characteristics of this
model are modular education (ME) and
student-centred education (SCE). In ME, the
study programme consists of thematic periods
that contain one project and several coherentand supporting modules. This thematic
approach makes it easier for students to
connect the different subject matters and the
opportunity for practical application
encourages deep learning. Models for SCE
focus on the role of the student in the
learning process: the students are responsible
for their own learning process. The classic
teacher role as the leader who steers the
students’ learning processes, changes into the
role of a learning facilitator who cooperates
with students to guide them in their personal
learning processes. Within the TOM modelthis is called a tutor. A tutor in TOM is
someone who supports a group of students
during their project, focussing mainly on the
development of learning- and group
processes. The tutor serves both an important
academic purpose; he teaches them academic
skills and provides information, and an
important social purpose; he is students’ first
contact and is able to refer students forpsychological support (Moust, 1993; Schmidt,
2011).
Tutor training programmeThe Centre for Educational Support of the
University Twente (CES) designed a basic
tutor training programme to teach
unexperienced tutors the skills they needed to
be a successful tutor in TOM. This training
programme was adaptable to the specific
wishes, needs and culture of the concerning
UT faculty. The training programme consisted
of two sessions of approximately three hours
spread over two days. There were sixsuggested topics during the training
programme: the definition of a tutor within
TOM, group processes, conversation
techniques, assessment, academic and
professional skills, and tips and tricks. The
goals of the training programme were:
the tutor knows his role and tasks;
the tutor is able to support a studentgroup;
the tutor keeps the diverse roles in mind;
the tutor is able to execute the rightcommunication techniques;
the tutor knows how and when to refer
students;
the tutor is able to assess projects;
the tutor is able to design the first
meeting with the student group.
4 Context

6
During the training programme tutors
attended some lectures on for example the
definition of a tutor, academic skills and
instruments like Belbin’s Team Role test and
Leary’s Rose. Furthermore, tutorsbrainstormed about the role of the tutor, they
discussed various cases with each other, and
they did some role-playing exercises to
develop their communication- and coaching
skills. Tutors also received some information
about student-centred learning, peer feedback
and assessing projects. They were also
assigned a take-home assignment in whichthey needed to do the Belbin test, read
something about student-centred learning,
answer some questions about how they had
organised their assessments and answer
some questions about the academic skills in
their module.
The training programme was tailor-made, so
there were some differences between the
trainings the tutors of different faculties
received. These differences were for example
in content, but also in voluntariness of
participation and the duration and planning of
the training programme (some tutors had the
entire training in one day).
The training programme was focused on
improving the tutors’ skills and knowledge
about tutoring and SCE, but not specifically on
changing the tutors’ attitudes towards TOM.
Nevertheless, during the training days, the
CES noticed that the tutors’ attitudes did not
always match with the intentions of TOM and
sometimes led to resistance. This couldinfluence the effectiveness of the training
programme and the success of the
implementation of TOM. From this perspective
it is interesting to get more insights into the
impact of the training programme on the
attitudes of the tutors.

7
Theoretical
framework
8
The study of van Aalderen-Smeets and
Walma van der Molen (2015) and other
studies about professional development of
teachers and adults (e.g. Compton & Jones,
1998; Desimone, 2009; and Fullan, 2007)give some insight in what is needed for a
suitable training for changing attitudes.
Desimone (2009) argues that there are five
critical characteristics of professional
development that can increase teachers’
knowledge, skills and change in attitudes
and beliefs: (1) content focus, (2) active
learning, (3) coherence, (4) duration, and
(5) collective participation. These elementsare further explained below.
Content focus. University teachers are
content experts and therefore often more
focused on content matter than on the
learning process of the student (Oolbekkink-Marchand, 2006). Therefore the CES training
programme was mainly focused on the
pedagogical and didactical aspects of
tutoring. Tutors were provided with
extensive information about the required
tasks, skills and role of a tutor. This is in line
with the findings of Ingvarson (1998). He
observed a dynamic, encouraging andstudent-centred teaching practice when
teachers’ content knowledge and
pedagogical knowledge was more explicit,
better connected and more integrated.
Active learning and collectiveparticipation. The techniques that are seenas powerful ways of learning in adult
education show in most cases both, active
learning and collective participation. For that
reason, these characteristics are discussed
together. Active learning and collective
participation can be achieved by peer
coaching, mentoring, reflection (with
colleagues), and discussions aboutexperiences. (Compton & Johnes, 1998;
Otero et al., 2005; Polly, Mims, Shepherd &
Inan, 2010). The CES used these approaches
in their training programme. Tutors had to
bring their own experiences and they did
role-playing exercises to get familiar with
their tutor role. However, there was also a
lot of lecturing (typically characterised aspassive learning, the opposite of active
learning).
Coherence. Coherence is about the
consistency between policies, practice, and
the training, and also about the coherence
between the training and the beliefs andknowledge of the trainees (Desimone, 2009).
Ajzen (1991) and Gegenfurtner (2013) both
state that the reform will not be properly
implemented when it is not in line with the
attitudes, beliefs and values of the teachers.
The training programme of van Aalderen-
Smeets and Walma van der Molen (2015)
focused on attitude. Teachers receivedinformation about what attitudes are and
were provided with exercises to discover
their own attitudes. This was not done in the
5 Hypothesis and research questions

9
training programme of the CES. Tutors’
attitudes, beliefs and values were hardly
used before and during the training
programme. As far as we know, there was
no indexation of the beliefs and values oftutors concerning for instance SCE or
tutoring. Tutors talked a lot about their
experiences and practical doubts, but they
never consciously reflected on their beliefs
and how these could fit with TOM.
Duration. The duration of the training
programme is also important; fragmented
and brief training programmes do not
support teachers enough to implement a
curriculum reform (Ball and Cohen in Fullan,
2007; Cohen and Hill in Fullan, 2007). Also,
the study of Asma, Walma van der Molen
and van Aalderen-Smeets (2011) showedthat teachers with little training saw more
obstacles in implementing the reform. Van
Aalderen-Smeets and Walma van der Molen
(2015) designed a training programme of six
sessions (eighteen hours) and in their
conclusions Van Aalderen-Smeets and
Walma van der Molen expected enhanced
effects with a more substantiated training
programme (of twenty to fifty hours). This isa lot more than the two sessions, with a total
of six to eight hours of the CES training
programme.
Autonomy. Based on recent studies, there
is one factor we want to add to Desimone’slist: tutors want autonomy in their training,
as high levels of self-control could lead to
higher intentions to reform (Gegenfurtner,
2013). They want control over their own
learning process and they are more
committed when they set their own goals
(Putnam & Borko in Jimoyiannis & Gravani,
2010). This demand for autonomy is logical,because in adult education there are great
differences between learners’ learning needs.
Therefore tutors’ prior knowledge and
experiences should be taken into account to
meet these individual needs (Compton &
Jones, 1998; Korthagen, 2010). The CES
fitted the training programme to the needs,
wishes and culture of every faculty, but
hardly to the individual needs and wishes ofthe teachers.
Based on the previous comparison with
literature, the CES training programme
seems to miss some critical characteristics
which are suggested to be essential toachieve an attitude change. The training
programme might not be attitude-focused
enough to realise a difference in teachers’
attitudes and the effectiveness of the
training programme is doubtful because the
duration of the training programme seems
too short. Therefore hypothesis of this study
is: “the CES training programme was notsufficient to achieve a difference in attitudes
between tutors who followed the training
programme and tutors who did not”.
10
To test this hypothesis, this study answers the following research
questions:
1. How can university tutors’ attitudes towards TOM be defined?
2. How can university’s teachers’ attitudes be measured in a valid
and reliable way?
3. Is there a significant difference in the attitude towards TOM
between teachers who followed the CES tutor training programme
(trained condition) and teachers who did not (untrained condition)?
To answer the first question, a literature study on attitudes towards
curriculum reform, and related attitudes was conducted and a
conceptual model was developed. To answer the second question a
questionnaire is developed and analysed with pilot interviews, factor
analysis and Cronbach’s alpha. To answer the third question the datafrom the questionnaire was analysed with a MANOVA. At the end, the
results of semi-structured in-depth interviews gave detailed information
about teachers’ experiences with and thoughts about TOM and the
tutor training programme to clarify the results of the questionnaire.
11
Successfully researching attitudes requires a
clear conceptual framework. There is a lot of
literature about attitudes, but the definition of
the concept attitude itself is not always clearly
described (Stevens, 2013; Tabata & Johnsrud,2008; van Aalderen-Smeets, van der Molen
and Asma, 2012). Consequently, Van
Aalderen-Smeets et al (2012) did a review
study to develop a conceptual framework that
describes the attitudes of primary education
teachers towards science education. This
model can also be suitable for measuring
university teachers’ attitudes, because the
context of the study of Van Aalderen-Smeetset al. (2012) shows considerable similarities
within the context of this study. First of all, in
both studies teachers had to go through a
curriculum reform; the primary education
teachers have to implement science education
and the university teachers have to implement
TOM. Both reforms are about a change
towards process-oriented and student-centred
education. This required a change from the
role of a leader into the role of a facilitator
that supports students in their learning
process during designing and researching
practical problems. Both groups of teachersfaced a similar change in their tasks as a
teacher (e.g. creating a suitable learning
environment, contact with students, designing
curriculum materials).
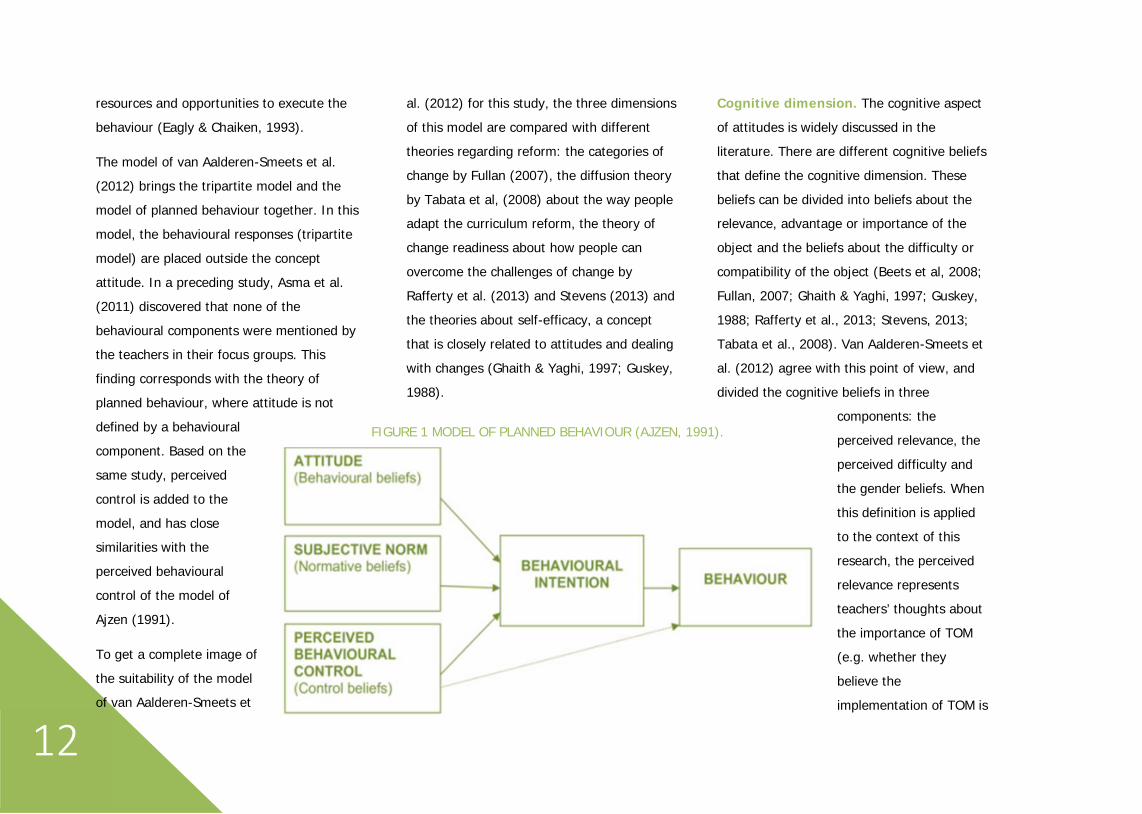
According to the model of van Aalderen-
Smeets et al. (2012) there are threecomponents that represent an attitude
towards science: cognitive beliefs, affective
states and perceived control (see Figure 1).
These components are based on the tripartite
model and the model of planned behaviour of
Ajzen (1991). These are two well-known
models that describe the concept of attitude
and the connections with other concepts likebehaviour, intentions and beliefs.
The tripartite model describes attitude as a
concept covering different components. This
theory is useful for understanding and
measuring attitudes, because it divides the
evaluative responses that express attitudes in
three measurable categories: cognitive
responses (beliefs), affective responses(feelings, moods, emotions) and behavioural
responses (overt actions and intentions)
(Bohner & Wänke, 2002; Eagly & Chaiken,
2007; Eagly & Chaiken, p.10, 1993).
Ajzen states that there are two things that
directly predict whether or not the behaviouris executed: the intention to perform a
behaviour and the perceived behavioural
control (see Figure 1). Intention is influenced
by attitudes towards the behaviour (with a
cognitive and affective component),
subjective norms (social influences) and also
by the perceived behavioural control. These
factors, in turn, influenced by correspondingbeliefs: bits of salient information about the
behaviour. For example, control beliefs are
about the belief that there are sufficient
6 A conceptual model for university tutors’ attitudes towards curriculum reform
12
resources and opportunities to execute the
behaviour (Eagly & Chaiken, 1993).
The model of van Aalderen-Smeets et al.
(2012) brings the tripartite model and the
model of planned behaviour together. In this
model, the behavioural responses (tripartite
model) are placed outside the concept
attitude. In a preceding study, Asma et al.
(2011) discovered that none of the
behavioural components were mentioned bythe teachers in their focus groups. This
finding corresponds with the theory of
planned behaviour, where attitude is not
defined by a behavioural
component. Based on the
same study, perceived
control is added to the
model, and has closesimilarities with the
perceived behavioural
control of the model of
Ajzen (1991).
To get a complete image of
the suitability of the modelof van Aalderen-Smeets et
al. (2012) for this study, the three dimensions
of this model are compared with different
theories regarding reform: the categories of
change by Fullan (2007), the diffusion theory
by Tabata et al, (2008) about the way peopleadapt the curriculum reform, the theory of
change readiness about how people can
overcome the challenges of change by
Rafferty et al. (2013) and Stevens (2013) and
the theories about self-efficacy, a concept
that is closely related to attitudes and dealing
with changes (Ghaith & Yaghi, 1997; Guskey,
1988).
Cognitive dimension. The cognitive aspect
of attitudes is widely discussed in the
literature. There are different cognitive beliefs
that define the cognitive dimension. These
beliefs can be divided into beliefs about therelevance, advantage or importance of the
object and the beliefs about the difficulty or
compatibility of the object (Beets et al, 2008;
Fullan, 2007; Ghaith & Yaghi, 1997; Guskey,
1988; Rafferty et al., 2013; Stevens, 2013;
Tabata et al., 2008). Van Aalderen-Smeets et
al. (2012) agree with this point of view, and
divided the cognitive beliefs in threecomponents: the
perceived relevance, the
perceived difficulty and
the gender beliefs. When
this definition is applied
to the context of this
research, the perceived
relevance representsteachers’ thoughts about
the importance of TOM
(e.g. whether they
believe the
implementation of TOM is
FIGURE 1 MODEL OF PLANNED BEHAVIOUR (AJZEN, 1991).
13
needed to improve the study results of the
students and their success in later careers).
The perceived difficulty describes how difficult
university teachers find it to teach in TOM
(e.g. whether tutors find it difficult toimplement the pedagogical and didactical
skills of TOM in their role as tutor). Van
Aalderen-Smeets et al. (2012) added the
component gender beliefs to measure the
beliefs concerning differences between men
and women teaching science. This component
is not relevant in this study, since there is no
evidence for stereotype beliefs regardingprocess-oriented and student-centred
learning.
Affective dimension. The affective
dimension encompasses the emotions and
feelings teachers have concerning the reformtowards TOM. This component was long seen
as subordinate to the cognitive component
and is hardly mentioned in literature; the
affective component showed up after
cognitive considerations were made (Fazio &
Petty, 2008; Raferty et al., 2013; Zajonc,
1980). However, Zajonc (1980) started a
foundation of arguments for considering
affect as another isolated component that
defines attitudes. For example feelings of fear
influence the attitudes and behaviour by
being helpful when they are low and whenpeople think they are able to avert the
behaviour. On the other hand, high levels of
fear activate defensive responses as
inattention, aggression or avoidance (Eagly
and Chaiken, 1992). The affect in this study is
based on the feelings teachers have while
being a tutor within a TOM module. The affect
is defined by feelings of enthusiasm andpositive energy (enjoyment) and by feelings
of stress or being nervous (anxiety) (Beets et
al., 2008; Raferty et al., 2013; van Aalderen-
Smeets et al., 2012).
Perceived control. The dimension ofperceived control is about the presence of
resources and opportunities needed to
implement TOM successfully. Ajzen (1991)
describes his component perceived
behavioural control as compatible with
Bandura’s concept of perceived self-efficacy.
Self-efficacy was defined by Bandura (1977)
as one’s belief in one’s ability to perform an
action that will lead towards a specific goal.
Someone with high sense of self-efficacy will
set higher goals, is less afraid to fail and is
able to find new strategies to cope with aproblem. Although Ajzen (1991) puts
perceived behaviour control apart from the
attitudes towards behaviour, Guskey found in
1988 that teachers’ sense of personal efficacy
had a great influence on their attitudes
towards change. Teachers with high scores on
personal efficacy thought that the reform was
important, that the reform fitted well withtheir current practice and that the reform was
easier to implement (Ghaith & Yaghi, 1997;
Guskey, 1988). Guskey’s findings give a clear
scientific underpinning to incorporate self-
efficacy in the conceptual model for attitudes.
Perceived control is also about influences
from the context, for example
acknowledgement and support from the
management and colleagues and availability
of the right resources and materials (Fullan,
2007; Geerlings & Van der Veen, 2010). In
the study of Asma et al. (2011) teachers
14
mentioned context factors often in connection
with the intention to implement the
curriculum reform. However, teachers who
were better trained didn’t mention context
factors as much as teachers with little trainingwho felt more dependent on support. So,
these two groups of teachers had a different
perception on how much contextual support
they needed for implementing the reform.
Therefore this component is called perceived
control. In this study, the perceived control is
about the self-efficacy of teachers about
executing tutor tasks within TOM and aboutthe support they think they need to
implement TOM.
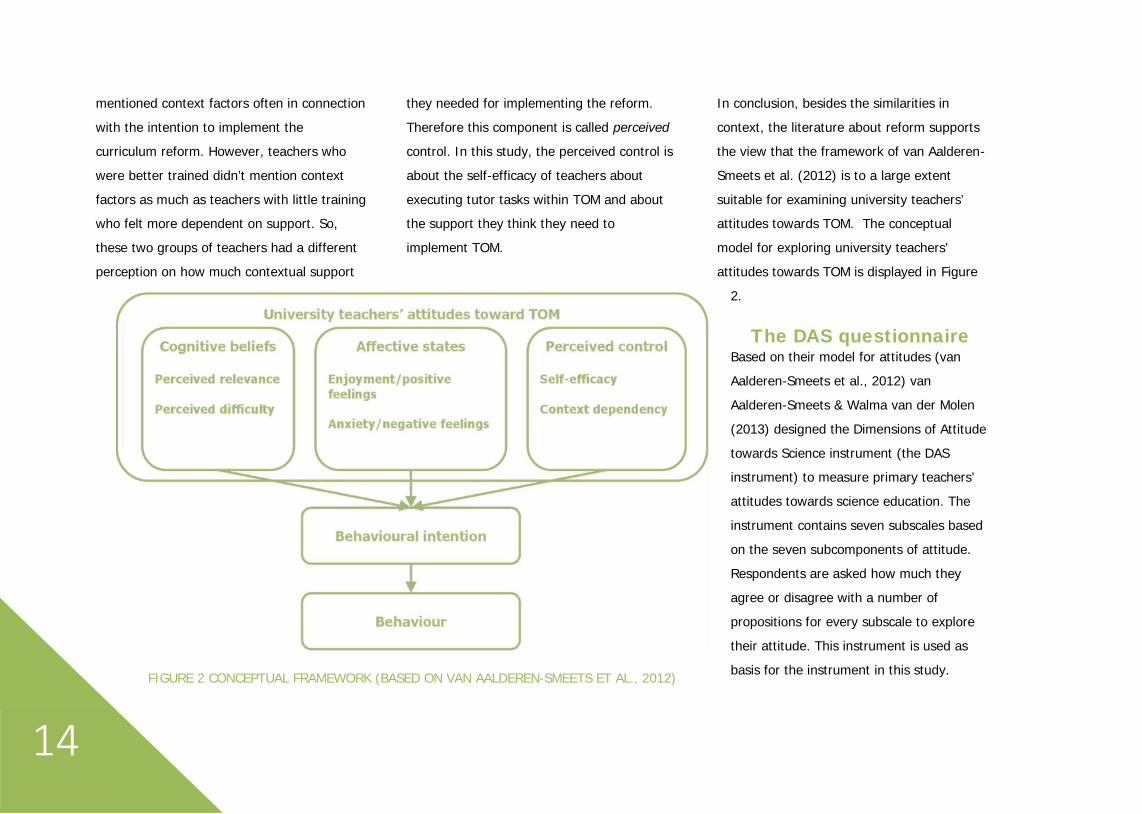
In conclusion, besides the similarities in
context, the literature about reform supports
the view that the framework of van Aalderen-
Smeets et al. (2012) is to a large extent
suitable for examining university teachers’attitudes towards TOM. The conceptual
model for exploring university teachers’
attitudes towards TOM is displayed in Figure
2.
The DAS questionnaireBased on their model for attitudes (van
Aalderen-Smeets et al., 2012) van
Aalderen-Smeets & Walma van der Molen
(2013) designed the Dimensions of Attitude
towards Science instrument (the DASinstrument) to measure primary teachers’
attitudes towards science education. The
instrument contains seven subscales based
on the seven subcomponents of attitude.
Respondents are asked how much they
agree or disagree with a number of
propositions for every subscale to explore
their attitude. This instrument is used as
basis for the instrument in this study.FIGURE 2 CONCEPTUAL FRAMEWORK (BASED ON VAN AALDEREN-SMEETS ET AL., 2012)

15
Method
16
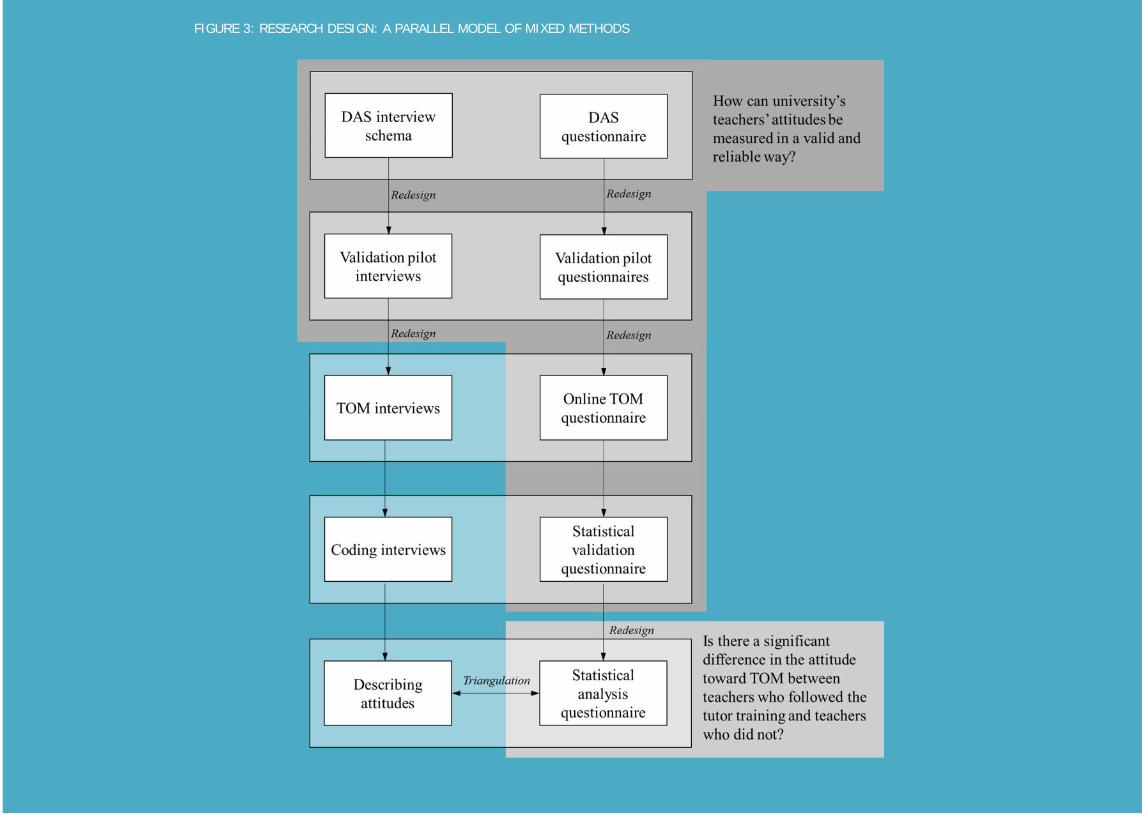
A parallel model of mixed method design wasused: data were gathered with interviews and
questionnaires to answer the following
questions: “How can university’s teachers’
attitudes be measured in a valid and reliable
way?” and “Is there a significant difference in
the attitude towards TOM between the two
conditions?” (see Figure 3).
The first question was answered with pilot
interviews, reviews of the questionnaire by
educationalists and statistical analysis of the
developed questionnaire. During the pilot
interviews the conceptual model was tested
and a walkthrough of the questionnaire wasconducted. The conceptual model and the
interview schema turned out to be addequate,
the questionnaire needed some alternations.
The remarks were mainly about vagueness
and ambiguity of the propositions, about
terms tutors did not know and about the
introduction on privacy. Their remarks were
incorporated in the redesigned questionnaire.The redesigned questionnaire was send to
five educationalist for feedback. After this,
some ambiguity was removed and the
questionnaire about tutor tasks was added to
check for differences between the conditions
in behaviour. This questionnaire was send to
96 tutors by e-mail. The data were analysed
with factor analysis and Cronbach’s alpha.
The items that were not valid and reliablewere removed from the questionnaire. The
remaining items and scales resulted in a valid
questionnaire.
The second question was answered with the
data of the items and scales that remained in
the valid questionnaire. A MANOVA was
conducted to define the differences in
attitudes between the trained and untrainedcondition. The questionnaire about the tutor
tasks was also analysed with MANOVA to
define differences in executing tutor tasks
between the two conditions.
Interviews were conducted to get more
insight into the attitudes of the tutors of theUT. The interviews were typed out and coded.
The data from the interviews was set side by
side with the attitude scores on the
questionnaire for additional practical
information.
7 Procedure
17
FIGURE 3: RESEARCH DESIGN: A PARALLEL MODEL OF MIXED METHODS
18
There were five sub questionnaires combined
into one online questionnaire (see Appendix
B). Sub questionnaires one till three were
based on the DAS questionnaire; these
measured respectively the attitude towardsTOM, SCE and ME. The attitude towards TOM
describes the tutors’ perception of the
combination of all characteristics representing
TOM, which is quite comprehensive. Two
questionnaires about SCE and ME were
added, because of expected differences in
attitude towards the attitude towards TOM,
the attitude towards SCE, defined by the
tutors’ view on their role as a facilitator andtheir view on the students’ role in learning,
and the attitude towards ME, defined by the
tutors’ view on interdisciplinary working and
the combination of knowledge domains into
one project. The items about affect and
perceived context dependency focused only
on TOM, because we expected tutors would
not be able to describe their feelings and
perceived context dependency for a specific
part of TOM. As many as possible items that
fit with this research were as least as possible
changed. The propositions about gender
beliefs were deleted. The subject of theremained propositions was changed into TOM,
SCE or ME and accompanying themes like
tutors, project groups and module teams. The
propositions were also adjusted to the context
of the university teachers (e.g. about the
teaching research nexus, their lack of
pedagogical and didactical education and
supporting university students). The level of
the language of the propositions was adjustedto the target group. The 5-point Likert-scale
remained, to keep the validity of this
instrument as high as possible. The online
questionnaire contained twelve items (four
TOM related, four SCE related, four ME
related) about perceived relevance (e.g. “I
think TOM is that important for education on
the UT that tutors should be trained in tutor
skills that fit TOM.”), twelve items (four TOM
related, four SCE related, four ME related)
about perceived difficulty (e.g. “I think most
tutors of the UT find it difficult to be a tutor
as meant in TOM.”), four items aboutenjoyment (e.g. “Being a tutor in TOM gives
me positive energy.”), four items about
anxiety (e.g. “When I am a tutor in TOM I feel
stressed.”), twelve items (four TOM related,
four SCE related, four ME related) about self-
efficacy (e.g. “I think I have the skills needed
to perform as tutor in a TOM module.”), and
six items about context dependency (e.g. “For
me, the support of my colleagues determineshow well I can perform as a tutor in TOM.”).
For every sub questionnaire the items were
mixed up, in that way similar items did not
follow each other up directly. Sub
questionnaire four contained eight items
about demographic variables (e.g. age, years
of work experience, participation in the tutor
training programme and sex). Sub
8 Questionnaires
19
questionnaire five contained twelve items
about the tasks of a tutor, these were based
on the task description of a tutor in the tutor
training programme (e.g. “I stimulate
reflection within the student group.”). Thissub questionnaire was added to give
additional information about differences
between the two groups of tutors in
behaviour. Tutors could indicate their
behaviour on a three point scale (never,
sometimes, and always).
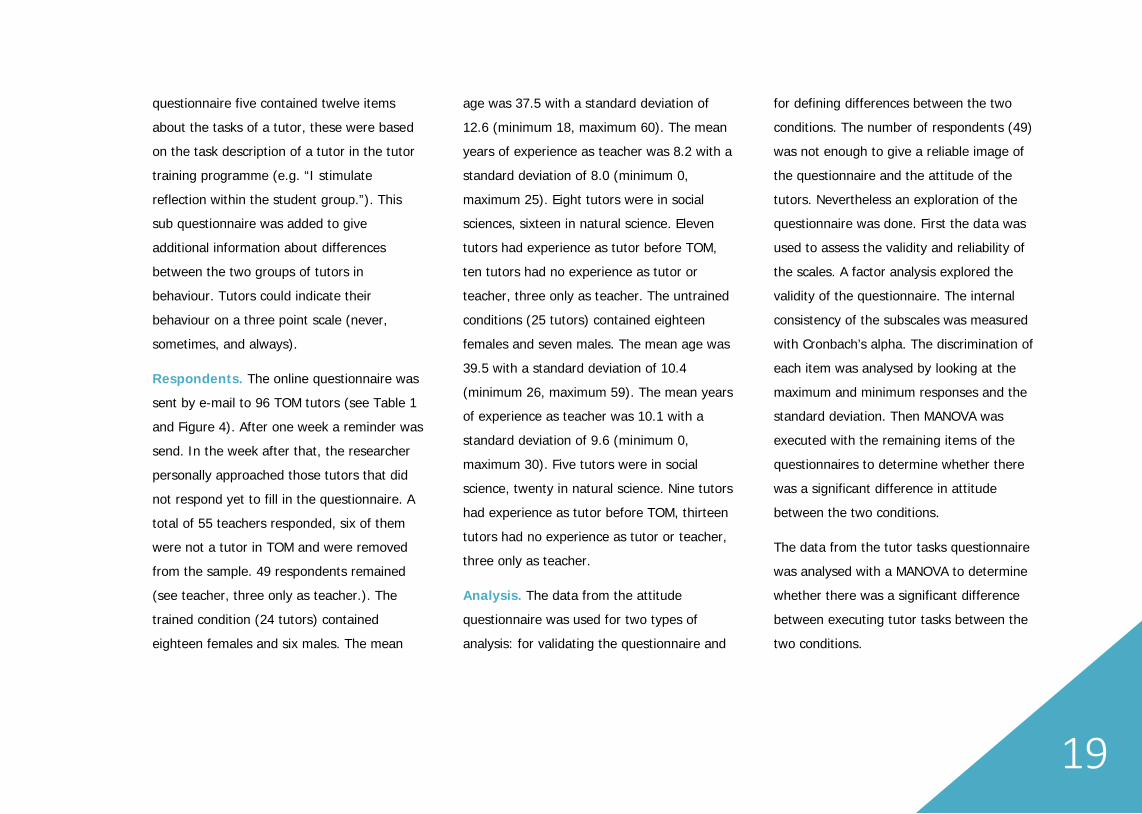
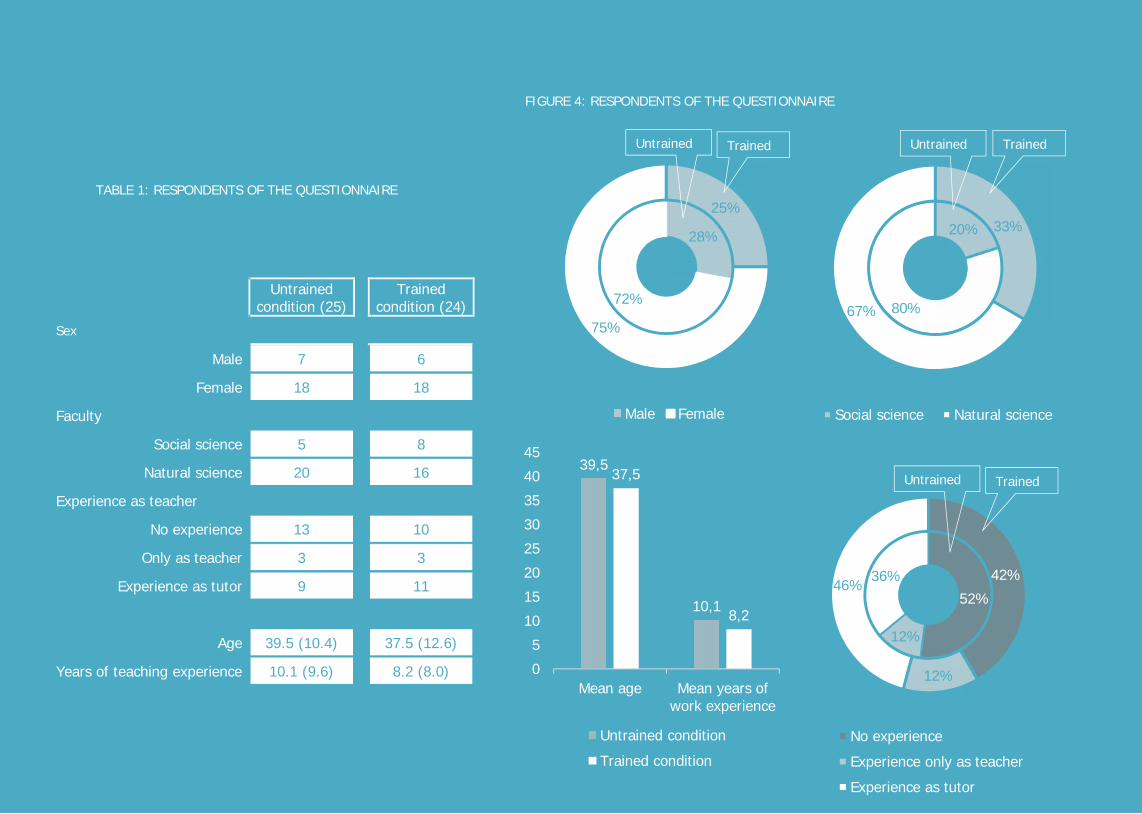
Respondents. The online questionnaire was
sent by e-mail to 96 TOM tutors (see Table 1
and Figure 4). After one week a reminder was
send. In the week after that, the researcher
personally approached those tutors that did
not respond yet to fill in the questionnaire. A
total of 55 teachers responded, six of themwere not a tutor in TOM and were removed
from the sample. 49 respondents remained
(see teacher, three only as teacher.). The
trained condition (24 tutors) contained
eighteen females and six males. The mean
age was 37.5 with a standard deviation of
12.6 (minimum 18, maximum 60). The mean
years of experience as teacher was 8.2 with a
standard deviation of 8.0 (minimum 0,
maximum 25). Eight tutors were in socialsciences, sixteen in natural science. Eleven
tutors had experience as tutor before TOM,
ten tutors had no experience as tutor or
teacher, three only as teacher. The untrained
conditions (25 tutors) contained eighteen
females and seven males. The mean age was
39.5 with a standard deviation of 10.4
(minimum 26, maximum 59). The mean yearsof experience as teacher was 10.1 with a
standard deviation of 9.6 (minimum 0,
maximum 30). Five tutors were in social
science, twenty in natural science. Nine tutors
had experience as tutor before TOM, thirteen
tutors had no experience as tutor or teacher,
three only as teacher.
Analysis. The data from the attitude
questionnaire was used for two types of
analysis: for validating the questionnaire and
for defining differences between the two
conditions. The number of respondents (49)
was not enough to give a reliable image of
the questionnaire and the attitude of the
tutors. Nevertheless an exploration of thequestionnaire was done. First the data was
used to assess the validity and reliability of
the scales. A factor analysis explored the
validity of the questionnaire. The internal
consistency of the subscales was measured
with Cronbach’s alpha. The discrimination of
each item was analysed by looking at the
maximum and minimum responses and thestandard deviation. Then MANOVA was
executed with the remaining items of the
questionnaires to determine whether there
was a significant difference in attitude
between the two conditions.
The data from the tutor tasks questionnaire
was analysed with a MANOVA to determine
whether there was a significant difference
between executing tutor tasks between the
two conditions.
20
TABLE 1: RESPONDENTS OF THE QUESTIONNAIRE
Untrainedcondition (25)
Trainedcondition (24)
Sex
Male 7 6
Female 18 18
Faculty
Social science 5 8
Natural science 20 16
Experience as teacher
No experience 13 10
Only as teacher 3 3
Experience as tutor 9 11
Age 39.5 (10.4) 37.5 (12.6)
Years of teaching experience 10.1 (9.6) 8.2 (8.0)
39,5
10,1
37,5
8,2
05
1015202530354045
Mean age Mean years ofwork experience
Untrained conditionTrained condition
28%
72%
25%
75%
Male Female
Untrained
20%
80%
33%
67%
Social science Natural science
TrainedUntrained
52%
12%
36% 42%
12%
46%
No experienceExperience only as teacherExperience as tutor
Trained
TrainedUntrained
FIGURE 4: RESPONDENTS OF THE QUESTIONNAIRE

21
The semi-structured interviews were based on the focus group interview
schedule of Asma et al (2011). The schedule was adapted to the target
group and context of this research (see Appendix A). Tutors were asked
to give their first thoughts about TOM. Follow up questions were about
their perceived relevance, their perceived difficulties, their affect andtheir self-efficacy in TOM as a tutor. Then tutors were asked about the
support activities that found place and their support needs in TOM. At
the end there was a walkthrough of the questionnaire. The tutors were
asked with every item what they thought the item meant, if the right
terms were used, if the item was ambiguous or vague, and if it was
clear how to answer.
Respondents. Trainers of the CES were asked to send a list with tutors
to the researcher (based on motivation, openness and demographic
factors). Seven tutors were selected for a pilot interview by purposeful
and convenience sampling, because the pilot interviews ask for
motivated and involved respondents that can give constructive feedback
(Dooley, 2009; Onwuegbuzie & Leech, 2007). Three tutors participated.
The interview schema of the pilot interviews was adequate. The same
schema was used for the interviews, except for the last section with the
walkthrough of the questionnaire.
Respondents. From the tutors that engaged in the training
programme, 24 tutors were selected by random stratification and asked
to participate in an interview (Dooley, 2009, p. 126-130; Onwuegbuzie &
Leech, 2007, p. 110). Diverse results were expected between groups of
teachers based on, among others, the factor discipline. Therefore threetutors in social science (faculties: behavioural science and school of
management and governance) and three tutors in natural science
(engineering technology, science and technology and electrical
engineering, mathematics and computer science) were selected.
Analysis. All interviews were typed out and coded using a predefinedcodebook based on the model for measuring university teachers’
attitudes (see Appendix C). For example, when a respondent said he
found the reform in TOM relevant and important, this sentence got the
code “TOM relevancy positive”. The data from the interviews was coded
using ATLAS.ti. To avoid an interpretation bias, another researcher also
coded one interview. Inter-coder agreement was calculated to test if the
data was similarly interpreted by both coders. The Krippendorff’s alpha
was 0.87, this is above the required 0.80 (Krippendorff, 2004). Theinterview data was used to give some background on the data from the
questionnaire.
9 Pilot interviews 10 Interviews

22
Results
23
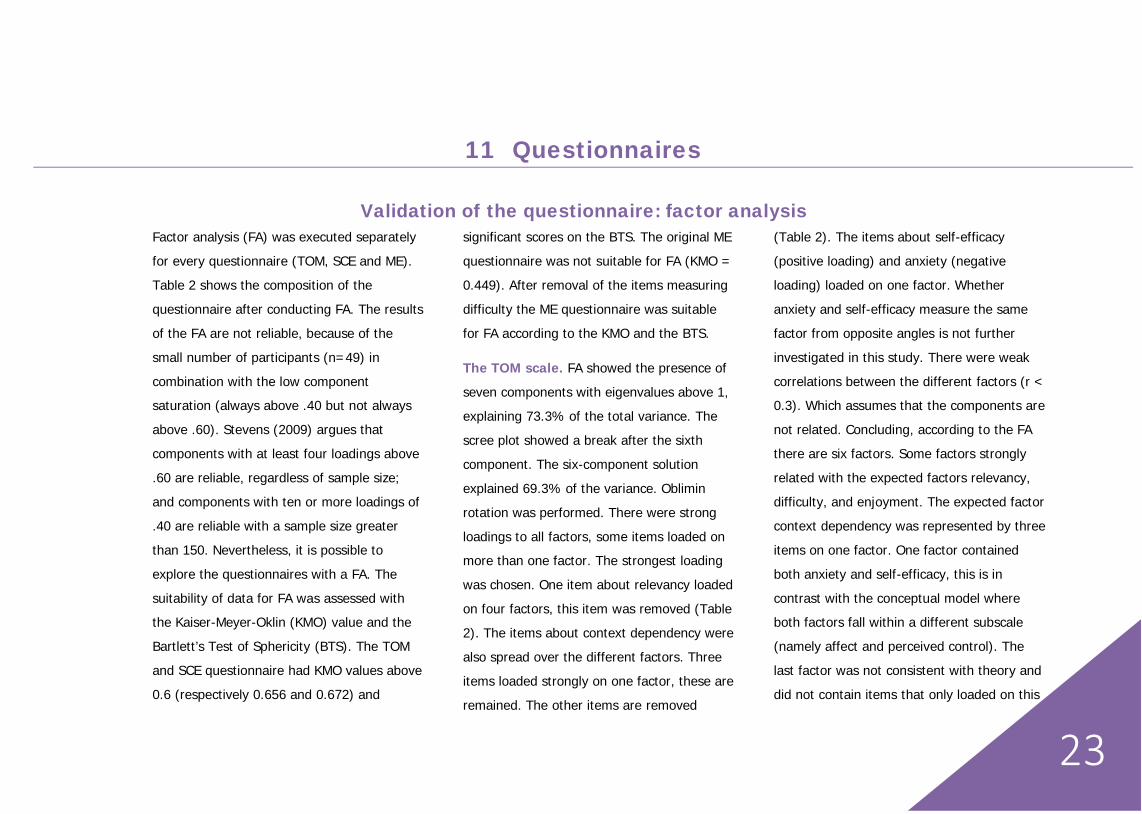
Factor analysis (FA) was executed separately
for every questionnaire (TOM, SCE and ME).
Table 2 shows the composition of the
questionnaire after conducting FA. The results
of the FA are not reliable, because of the
small number of participants (n=49) in
combination with the low componentsaturation (always above .40 but not always
above .60). Stevens (2009) argues that
components with at least four loadings above
.60 are reliable, regardless of sample size;
and components with ten or more loadings of
.40 are reliable with a sample size greater
than 150. Nevertheless, it is possible to
explore the questionnaires with a FA. The
suitability of data for FA was assessed withthe Kaiser-Meyer-Oklin (KMO) value and the
Bartlett’s Test of Sphericity (BTS). The TOM
and SCE questionnaire had KMO values above
0.6 (respectively 0.656 and 0.672) and
significant scores on the BTS. The original ME
questionnaire was not suitable for FA (KMO =
0.449). After removal of the items measuring
difficulty the ME questionnaire was suitable
for FA according to the KMO and the BTS.
The TOM scale. FA showed the presence of
seven components with eigenvalues above 1,
explaining 73.3% of the total variance. The
scree plot showed a break after the sixth
component. The six-component solution
explained 69.3% of the variance. Oblimin
rotation was performed. There were strong
loadings to all factors, some items loaded onmore than one factor. The strongest loading
was chosen. One item about relevancy loaded
on four factors, this item was removed (Table
2). The items about context dependency were
also spread over the different factors. Three
items loaded strongly on one factor, these are
remained. The other items are removed
(Table 2). The items about self-efficacy
(positive loading) and anxiety (negative
loading) loaded on one factor. Whether
anxiety and self-efficacy measure the same
factor from opposite angles is not further
investigated in this study. There were weak
correlations between the different factors (r <0.3). Which assumes that the components are
not related. Concluding, according to the FA
there are six factors. Some factors strongly
related with the expected factors relevancy,
difficulty, and enjoyment. The expected factor
context dependency was represented by three
items on one factor. One factor contained
both anxiety and self-efficacy, this is in
contrast with the conceptual model whereboth factors fall within a different subscale
(namely affect and perceived control). The
last factor was not consistent with theory and
did not contain items that only loaded on this
11 Questionnaires
Validation of the questionnaire: factor analysis
24
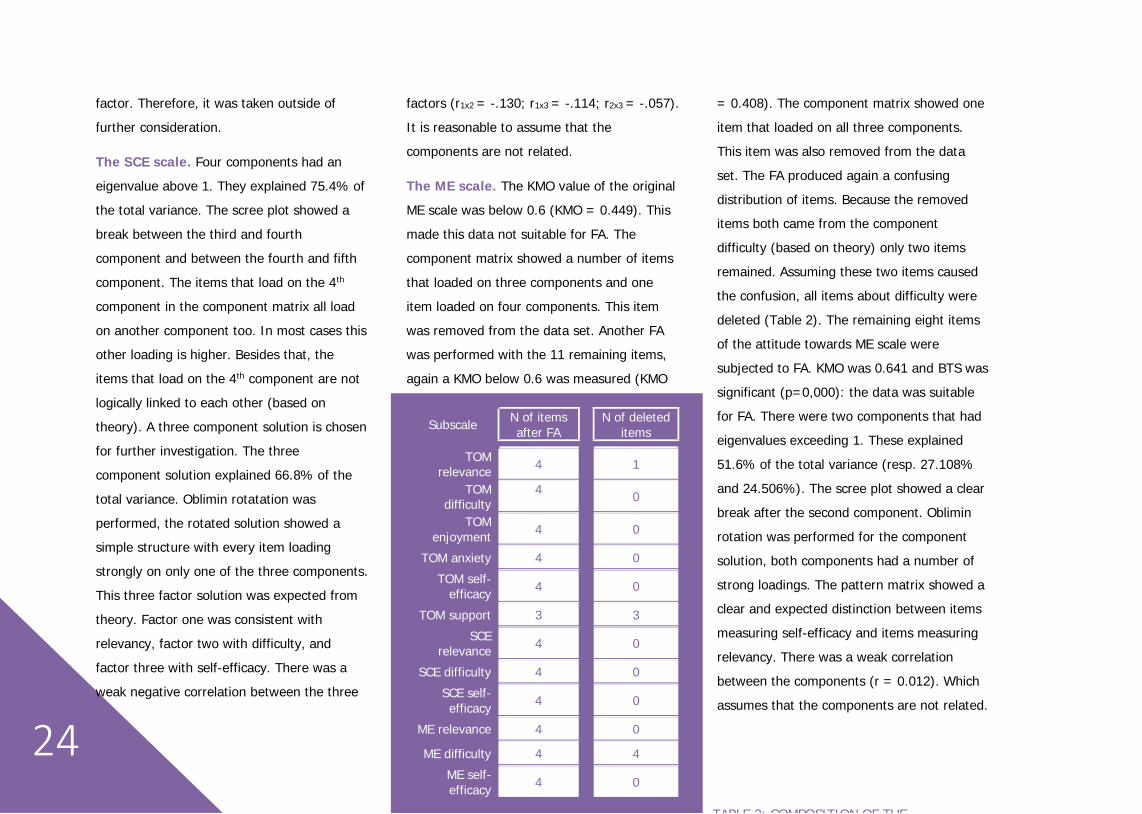
factor. Therefore, it was taken outside of
further consideration.
The SCE scale. Four components had an
eigenvalue above 1. They explained 75.4% of
the total variance. The scree plot showed a
break between the third and fourth
component and between the fourth and fifth
component. The items that load on the 4th
component in the component matrix all load
on another component too. In most cases thisother loading is higher. Besides that, the
items that load on the 4th component are not
logically linked to each other (based on
theory). A three component solution is chosen
for further investigation. The three
component solution explained 66.8% of the
total variance. Oblimin rotatation was
performed, the rotated solution showed asimple structure with every item loading
strongly on only one of the three components.
This three factor solution was expected from
theory. Factor one was consistent with
relevancy, factor two with difficulty, and
factor three with self-efficacy. There was a
weak negative correlation between the three
factors (r1x2 = -.130; r1x3 = -.114; r2x3 = -.057).
It is reasonable to assume that the
components are not related.
The ME scale. The KMO value of the original
ME scale was below 0.6 (KMO = 0.449). This
made this data not suitable for FA. The
component matrix showed a number of items
that loaded on three components and one
item loaded on four components. This item
was removed from the data set. Another FAwas performed with the 11 remaining items,
again a KMO below 0.6 was measured (KMO
= 0.408). The component matrix showed one
item that loaded on all three components.
This item was also removed from the data
set. The FA produced again a confusing
distribution of items. Because the removeditems both came from the component
difficulty (based on theory) only two items
remained. Assuming these two items caused
the confusion, all items about difficulty were
deleted (Table 2). The remaining eight items
of the attitude towards ME scale were
subjected to FA. KMO was 0.641 and BTS was
significant (p=0,000): the data was suitablefor FA. There were two components that had
eigenvalues exceeding 1. These explained
51.6% of the total variance (resp. 27.108%
and 24.506%). The scree plot showed a clear
break after the second component. Oblimin
rotation was performed for the component
solution, both components had a number of
strong loadings. The pattern matrix showed aclear and expected distinction between items
measuring self-efficacy and items measuring
relevancy. There was a weak correlation
between the components (r = 0.012). Which
assumes that the components are not related.
Subscale N of itemsafter FA
N of deleteditems
TOMrelevance 4 1
TOMdifficulty
4 0
TOMenjoyment 4 0
TOM anxiety 4 0TOM self-
efficacy 4 0
TOM support 3 3SCE
relevance 4 0
SCE difficulty 4 0SCE self-efficacy 4 0
ME relevance 4 0
ME difficulty 4 4ME self-efficacy 4 0
TABLE 2: COMPOSITION OF THE
25
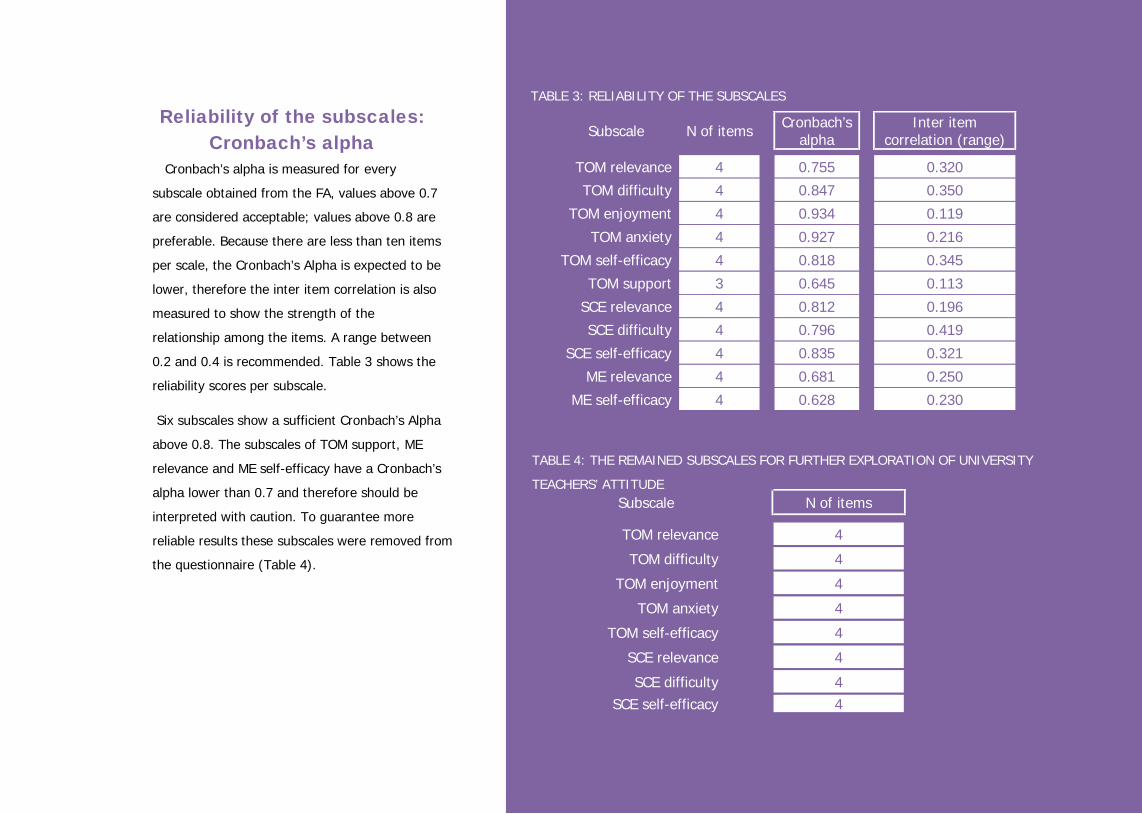
Cronbach’s alpha is measured for every
subscale obtained from the FA, values above 0.7are considered acceptable; values above 0.8 are
preferable. Because there are less than ten items
per scale, the Cronbach’s Alpha is expected to be
lower, therefore the inter item correlation is also
measured to show the strength of the
relationship among the items. A range between
0.2 and 0.4 is recommended. Table 3 shows the
reliability scores per subscale.
Six subscales show a sufficient Cronbach’s Alpha
above 0.8. The subscales of TOM support, ME
relevance and ME self-efficacy have a Cronbach’s
alpha lower than 0.7 and therefore should be
interpreted with caution. To guarantee more
reliable results these subscales were removed fromthe questionnaire (Table 4).
Subscale N of items Cronbach’salpha
Inter itemcorrelation (range)
TOM relevance 4 0.755 0.320TOM difficulty 4 0.847 0.350
TOM enjoyment 4 0.934 0.119TOM anxiety 4 0.927 0.216
TOM self-efficacy 4 0.818 0.345TOM support 3 0.645 0.113
SCE relevance 4 0.812 0.196SCE difficulty 4 0.796 0.419
SCE self-efficacy 4 0.835 0.321ME relevance 4 0.681 0.250
ME self-efficacy 4 0.628 0.230
Subscale N of items
TOM relevance 4TOM difficulty 4
TOM enjoyment 4TOM anxiety 4
TOM self-efficacy 4SCE relevance 4SCE difficulty 4
SCE self-efficacy 4
Reliability of the subscales:Cronbach’s alpha
TABLE 3: RELIABILITY OF THE SUBSCALES
Subscale N ofitems
Cronbach’salpha
Inter itemcorrelation
(range)TOM
relevance 4 0.755 0.320
TOMdifficulty 4 0.847 0.350
TOMenjoyment 4 0.934 0.119
TOManxiety 4 0.927 0.216
TOM self-efficacy 4 0.818 0.345
TOMsupport 3 0.645 0.113
SCErelevance 4 0.812 0.196
SCEdifficulty 4 0.796 0.419
SCE self-efficacy 4 0.835 0.321
MErelevance 4 0.681 0.250
ME self-efficacy 4 0.628 0.230
TABLE 3: RELIABILITY OF THE SUBSCALES
TABLE 4: THE REMAINED SUBSCALES FOR FURTHER EXPLORATION OF UNIVERSITY
TEACHERS’ ATTITUDE
26
Condition untrained(n = 25)
Condition trained(n = 24) F-value Sig.
M SD M SD
TOM M SD M SD 1.255 .301
Relevancy 2.75 .80 3.17 .88 2.997 .090Difficulty 3.22 .79 2.92 .71 1.998 .164
Enjoyment 3.28 .89 3.59 .86 1.568 .217Anxiety 2.14 1.02 1.98 .96 .323 .573
Self-efficacy 3.79 .70 3.85 .56 .125 .725
SCE .664 .578
Relevancy 2.79 .17 3.10 .18 1.649 .205Difficulty 3.15 .14 3.04 .15 .285 .596
Self-efficacy 3.49 .13 3.58 .13 .247 .621
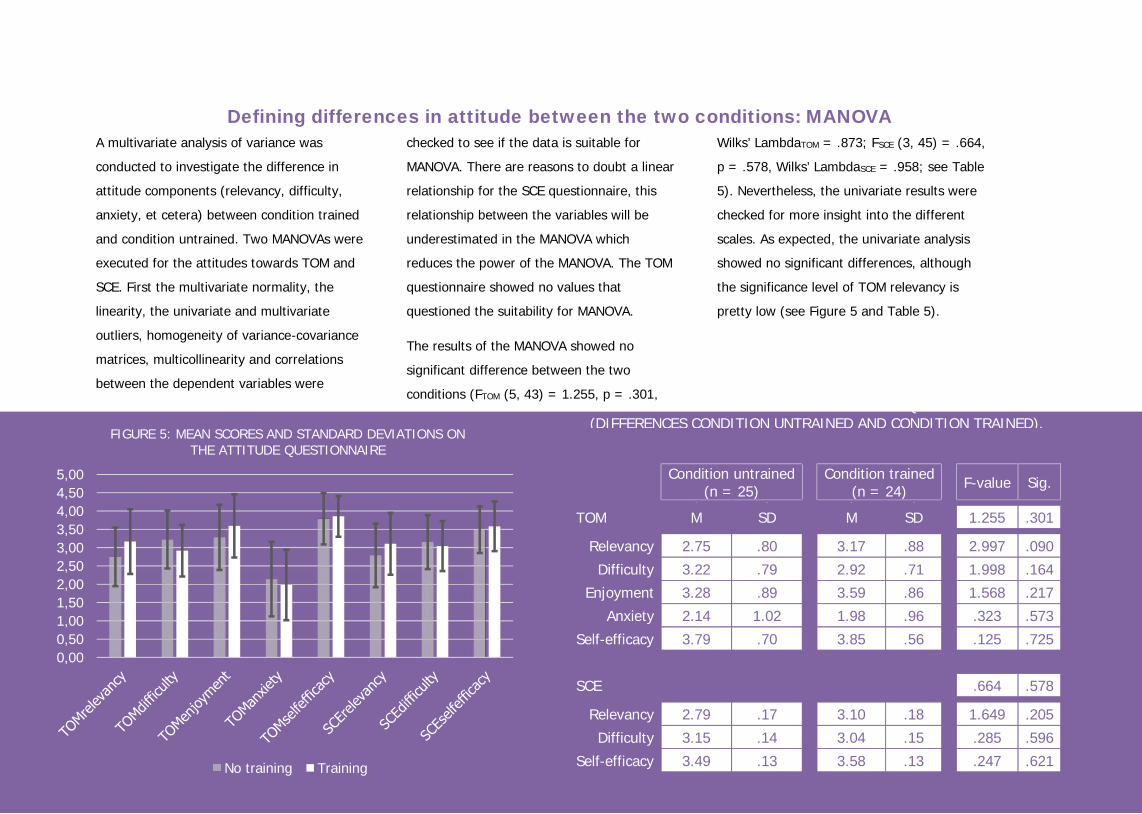
A multivariate analysis of variance was
conducted to investigate the difference in
attitude components (relevancy, difficulty,
anxiety, et cetera) between condition trained
and condition untrained. Two MANOVAs wereexecuted for the attitudes towards TOM and
SCE. First the multivariate normality, the
linearity, the univariate and multivariate
outliers, homogeneity of variance-covariance
matrices, multicollinearity and correlations
between the dependent variables were
checked to see if the data is suitable for
MANOVA. There are reasons to doubt a linear
relationship for the SCE questionnaire, this
relationship between the variables will be
underestimated in the MANOVA whichreduces the power of the MANOVA. The TOM
questionnaire showed no values that
questioned the suitability for MANOVA.
The results of the MANOVA showed no
significant difference between the two
conditions (FTOM (5, 43) = 1.255, p = .301,
Wilks’ LambdaTOM = .873; FSCE (3, 45) = .664,
p = .578, Wilks’ LambdaSCE = .958; see Table
5). Nevertheless, the univariate results were
checked for more insight into the different
scales. As expected, the univariate analysisshowed no significant differences, although
the significance level of TOM relevancy is
pretty low (see Figure 5 and Table 5).
Defining differences in attitude between the two conditions: MANOVA
0,000,501,001,502,002,503,003,504,004,505,00
FIGURE 5: MEAN SCORES AND STANDARD DEVIATIONS ONTHE ATTITUDE QUESTIONNAIRE
No training Training
TABLE 5: MEAN SCORES ON THE ATTITUDE QUESTIONNAIRE(DIFFERENCES CONDITION UNTRAINED AND CONDITION TRAINED).
27
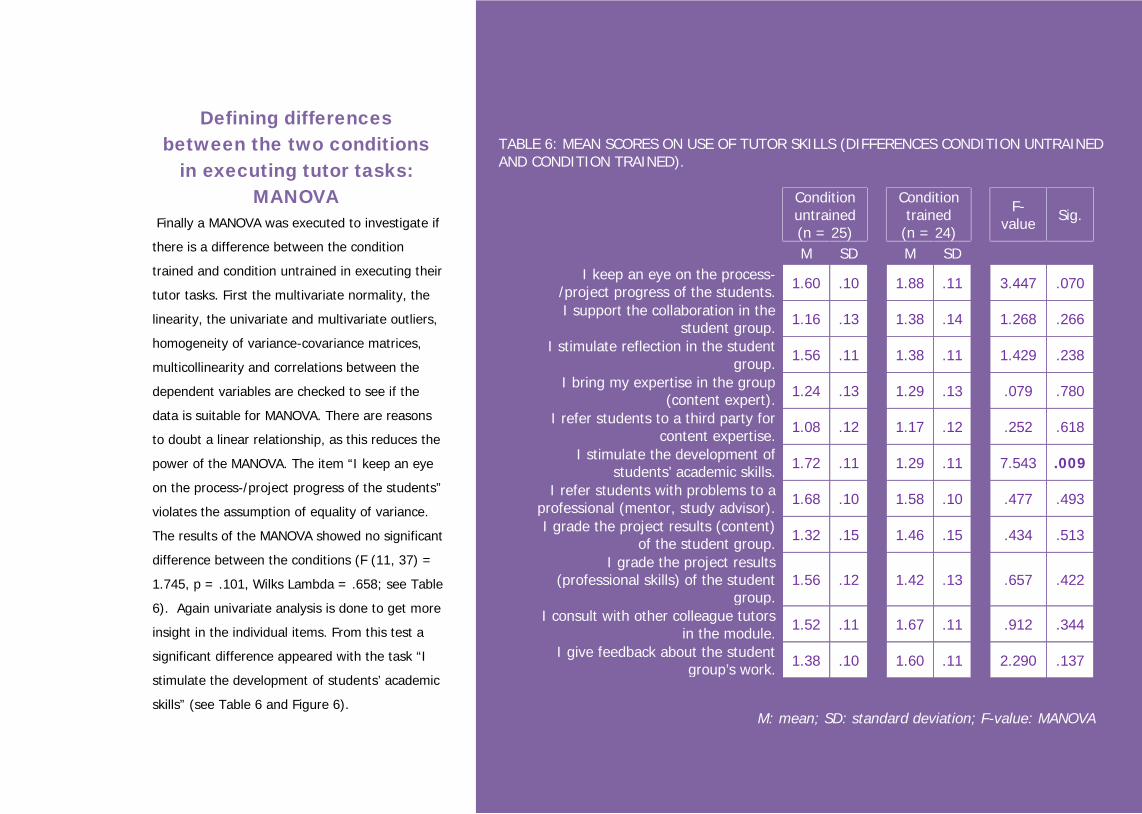
Finally a MANOVA was executed to investigate ifthere is a difference between the condition
trained and condition untrained in executing their
tutor tasks. First the multivariate normality, the
linearity, the univariate and multivariate outliers,
homogeneity of variance-covariance matrices,
multicollinearity and correlations between the
dependent variables are checked to see if the
data is suitable for MANOVA. There are reasonsto doubt a linear relationship, as this reduces the
power of the MANOVA. The item “I keep an eye
on the process-/project progress of the students”
violates the assumption of equality of variance.
The results of the MANOVA showed no significant
difference between the conditions (F (11, 37) =
1.745, p = .101, Wilks Lambda = .658; see Table
6). Again univariate analysis is done to get more
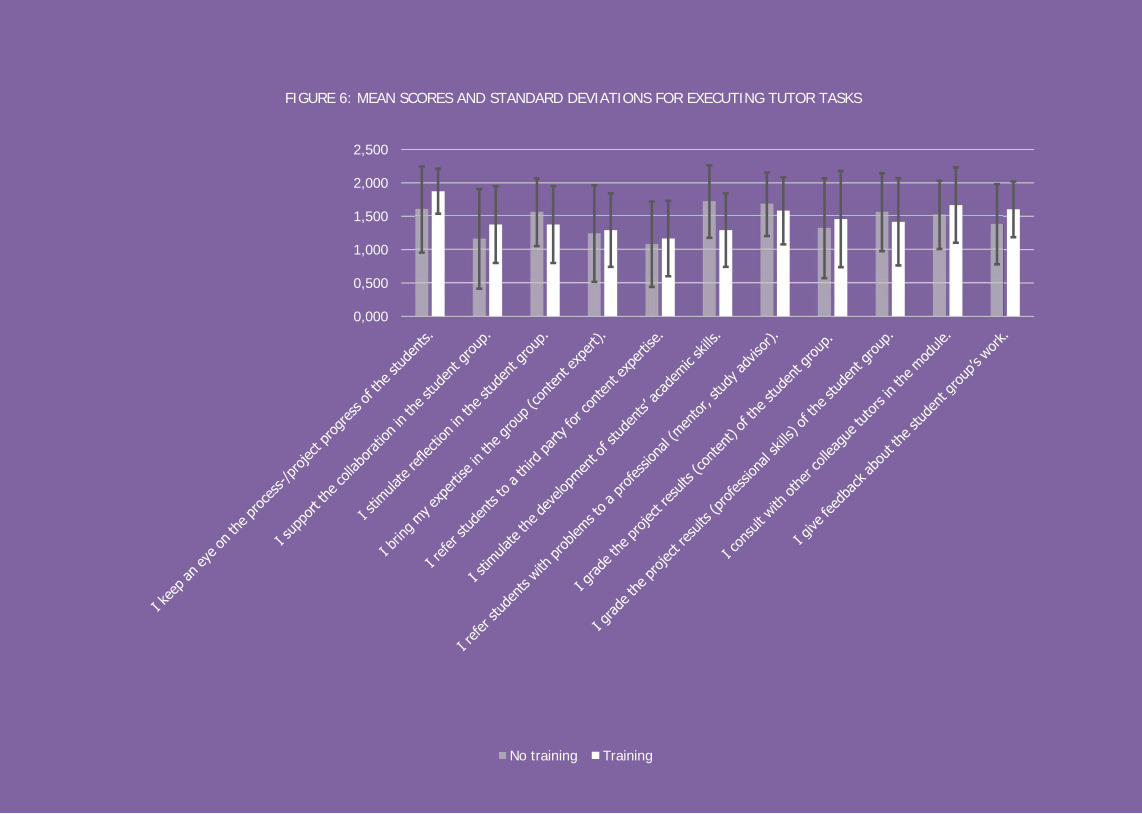
insight in the individual items. From this test asignificant difference appeared with the task “I
stimulate the development of students’ academic
skills” (see Table 6 and Figure 6).
Conditionuntrained(n = 25)
Conditiontrained
(n = 24)F-
value Sig.
M SD M SDI keep an eye on the process-
/project progress of the students. 1.60 .10 1.88 .11 3.447 .070
I support the collaboration in thestudent group. 1.16 .13 1.38 .14 1.268 .266
I stimulate reflection in the studentgroup. 1.56 .11 1.38 .11 1.429 .238
I bring my expertise in the group(content expert). 1.24 .13 1.29 .13 .079 .780
I refer students to a third party forcontent expertise. 1.08 .12 1.17 .12 .252 .618
I stimulate the development ofstudents’ academic skills. 1.72 .11 1.29 .11 7.543 .009
I refer students with problems to aprofessional (mentor, study advisor). 1.68 .10 1.58 .10 .477 .493
I grade the project results (content)of the student group. 1.32 .15 1.46 .15 .434 .513
I grade the project results(professional skills) of the student
group.1.56 .12 1.42 .13 .657 .422
I consult with other colleague tutorsin the module. 1.52 .11 1.67 .11 .912 .344
I give feedback about the studentgroup’s work. 1.38 .10 1.60 .11 2.290 .137
Defining differencesbetween the two conditions
in executing tutor tasks:MANOVA
M: mean; SD: standard deviation; F-value: MANOVA
TABLE 6: MEAN SCORES ON USE OF TUTOR SKILLS (DIFFERENCES CONDITION UNTRAINEDAND CONDITION TRAINED).
28
0,000
0,500
1,000
1,500
2,000
2,500
FIGURE 6: MEAN SCORES AND STANDARD DEVIATIONS FOR EXECUTING TUTOR TASKS
No training Training

29
The results from the questionnaire measuring
tutors’ attitudes towards TOM showed no
differences between the two conditions. Both
conditions showed moderate scores on
different scales of the questionnaire. The datafrom the interviews can explain the moderate
scores on attitude.
Perceived relevance. Tutors reported
positive and negative arguments regarding
the implementation of TOM. Negative
comments were about the way TOM wasimplemented: top-down and pretty rigorous
(such as “If you want to implement an
educational model like TOM you have to
invest in team building. TOM is not a model
that works with a top-down
implementation.”). Tutors stated that one
model could never be suitable for all courses.
Furthermore they were not convinced that theold educational model needed such a drastic
change. Apart from that, they doubted TOM
whether would improve the quality and the
efficiency of education (such as “How is it
possible to cost-cut on the one hand, and
offer more support to students on the other
hand?”). They thought TOM contains
too much project work (such as“Project based education is at the
expense of the content of
education”) and it is a scholastic way
of supporting students. Finally, they
stated that their research activities
were overlooked; they could not understand
that TOM was considered more important
than their research activities.
Most positive comments were about the
practical skills (cooperate, creative thinking,
conferencing, et cetera) that students learned
in TOM. Tutors thought this practical
approach fitted Bachelor education and
students’ future working life better. Moreover,some tutors experienced higher success rates
and more study commitment of students.
Tutors believed the students benefited of the
modular, thematic division of education; the
curriculum seems better integrated and
structured now. Finally, they experienced that
the growing pains of TOM slowly
disappear (“TOM works out morestructured the second year.”),
they believe that the
implementation of TOM would
eventually turn out right.
In conclusion, the tutors that were
interviewed started often with some negativethoughts about TOM, especially about the
top-down implementation and the big role of
projects in TOM. However, they also
acknowledged positive aspects about TOM;
such as the fact that students were more
committed and students learned the skills
they needed. This constant consideration of
pros and cons explains the moderate scoreson the questionnaire (see table 5).
Maybe tutors were not convinced of the
necessity of TOM, but at the same time
12 Interviews
“Project basededucation is at the
expense of thecontent ofeducation”
30
experienced some advantages while working
with the students in TOM.
Perceived difficulty. While asking tutors
about their perceived difficulty, they shifted
immediately to their own capabilities and
difficulties in TOM education which fits with
the attitude component self-efficacy better
than perceived difficulty.
Tutors answered they had no idea whether
their colleagues struggled with TOM or others
thought colleagues encountered not big
difficulties with TOM.
The moderate scores on the questionnairecan possibly be explained by the lack of
insight into or awareness of the difficulties
colleagues encounter (see Table 5).
Enjoyment. The enjoyment tutors
experienced was for a great part dependenton the students they coached. If students
were not motivated, tutors had to invest a lot
of energy to put them to work. Besides that,
tutors considered TOM as time consuming,
you don’t have time left to develop yourself
(e.g. in research skills or creative thinking).
Especially the diminishing time for research
and the top-down implementation were seen
as very tedious and made it less fun to be
involved with TOM. However, tutors got
excited about the personal contact withstudents (such as “I like the
students, although they were
also nice when there was no
TOM.”), it made teaching less
predictable. They found it
nice to see the progress of
the students and how students used the
feedback in their products. Besides that,tutors liked the more intense contact with
their colleagues and felt proud about their
module (such as “I like the team spirit. It’s
like, together we create something nice.”).
The mean scores in the questionnaire show
that tutors enjoyed working in TOM (see
Table 5).
Apparently the social contacts with students
and colleagues gave tutors energy and
outweighed the lack of time to spend on tasks
of their own choice.
Anxiety. The implementation of TOM caused
a lot of stress. Almost every tutor reported an
immense increase in workload and too less
time to implement TOM properly. Moreover,
they had to deal with organisational problemsand dissatisfaction and stress of students
(such as “At the end it felt like I was an
emotional wastebasket for students.”).
Tutors stated that sometimes it was hard to
mark exams without being aware of the
strict consequences (redoing the whole
module) when a student failed on a test. The
low mean scores on the questionnaire seemtherefore a bit unexpected (see Table 5). A
possible explanation is that the items in the
questionnaire did focus on the tutor role.
The interviewed tutors mentioned they were
not stressed about only executing the tutortasks, the combination with other tasks made
it stressful.
Self-efficacy. The general self-efficacy about
working in TOM seemed to be pretty low. The
enormous workload and the lack of time
made it difficult to combine TOM withresearch activities. The modular construction
“I like the teamspirit. It’s like,
together wecreate something
nice”
31
asked for more preparation time and
meetings with colleagues and the educational
duties are very compelling (such as “You have
many responsibilities and the deadlines are
short term. You also have sixty disappointedstudents in front of you if you don’t do
enough.”).
Nevertheless, when focussing only on
executing the tutor tasks, most tutors thought
they are capable enough to be a good tutor.
They were aware of their new identity and
were trying to find balances between support
on content and group- and learning processes
and between personal and formal contact
with students. Some tutors adopted the “wait
and see” attitude easily, because they puttedthe responsibilities with the students. But a lot
of tutors found it difficult to decide when to
interfere or not to interfere in the learning
process. Especially tutors who were more
content focused found it difficult to be
dependent on the students learning processes
(such as “You have to give students space …
And then it is uncertain where the ship goesand whether it reaches the harbour.”). Some
tutors thought they were not the appropriate
person for the job (such as “When I talk with
a student who did nothing I say “You did
nothing again!” while a tutor would say “Why
didn’t you manage to complete yourtasks?”. I think tutoring is not my
expertise.”). Most tutors thought they
could motivate students, but
experienced now and then that it did
not work; sometimes they
experienced a lot of resistance of
students towards TOM. Frequently,
tutors experienced vagueness aboutthe organisation (of the module), this made it
more difficult to deal with questions of
students and made tutors extra uncertain.
Howevesr, almost every tutor expected to
become a better tutor (such as “I thought:
this is the first time I’m a tutor, so I’m
learning. For now, I’m a good tutor, the next
time I’m better.”). This positive view on theirtutor capabilities explains the high scores on
the questionnaire (see Table 5).
Perceived control. The questionnaire could
not measure the perceived control of the
tutors, nevertheless, the interviews gave an
interesting and informative picture about
perceived control. First of all, tutors
experienced TOM as something that is
implemented top-down. Theyhad the feeling that the plans
around TOM were made without
hearing the voice of the
teachers, students and faculty
staff. Which made it difficult to
translate TOM into something
that fits within their teaching
practice. Consequently, this leadto lots of questions towards CES and policy
makers about the practical interpretation of
TOM (CES tutor training, personal
communication, July 3, 2013). Besides that,
they felt that TOM education is compelling,
because of the regular interaction with the
students and the high frequency of
assessments. This left not much time toimplement all aspects of TOM.
In general, tutors saw the support of
colleagues and module coordinators as
necessary for successful TOM education.
“You have to givestudents space …
And then it isuncertain where the
ship goes andwhether it reaches
the harbour.”
32
Some tutors experienced little support from
their environment and felt they had to sort
out their role in the module themselves. This
led to uncertainty and heightened work
pressure. Others experienced a lot of supportfrom their module coordinator and colleagues.
There were some module coordinators that
gave regular updates, explanations and
schedules, and organised tutor meetings
where tutors could discuss the student groups
and the problems they
encounter. This
structured way ofworking and the
contact with other
tutors, the study
advisor, the
programme
coordinator, the module coordinator, and/or
an educationalist was highly
appreciated by the tutors. Team
building and working closely with
colleagues were seen as valuable
investments to ensure the successof TOM; delivering TOM education
is only possible in a team. Some
faculties had already a close team,
but other faculties experienced
teamwork as a kind of a struggle
(such as: “In our faculty I don’t feel the real
team-effort yet. A technical university
accommodates a lot of people that arecontent oriented; working as a team is not a
second nature of this organisation.”)
Tutors experienced sufficient support from the
CES. They agreed that the CES is easily
accessible when they need educationalsupport, although they hardly made use of
the services of the CES. Tutors also reported
that the tutor training programme of the CES
prepared them for their role in TOM.
Nevertheless, tutors found the training
programme content too generic (such as:
“The tutor training is interesting, but when
I’m in front of a group students
other things happen. You’ve
learned some basic things about
tutoring, but you know nothing
about the interaction and howthat can go wrong.”). Tutors
thought they needed the support
of the CES on specific things to be
better prepared. For successful
implementation of TOM, they
were more in need of extra time or supporting
staff that supports them on the primary
process; designing a project, help duringmeetings with student groups, and checking
assessments (such as: “I think the CES
supports me till I’m in the lecture room.
Whereas, for me, it all starts when I’m in the
lecture room.”).
“A technicaluniversity
accommodates a lotof people that arecontent oriented;
working as a team isnot a second nature
of this organisation.”
“The tutor trainingis interesting, butwhen I’m in front
of a groupstudents other
things happen.”

33
Conclusion &
discussion
34
The results of this study show no difference in university tutors’ attitudes towards TOM between tutors who followed the CES training programme andtutors who did not. This supports the hypothesis “the CES training programme was not sufficient to achieve a difference in attitudes between tutors
who followed the training programme and tutors who did not”.
This study contributes to research on defining
and measuring attitudes: the model and the
questionnaire of van Aalderen-Smeets et al.(2012) can be used as a basis for defining
and measuring teachers’ attitudes towards
reforms regarding student-centred and
process-oriented education in another
context. The adapted conceptual model of
this present study seems to be a sufficient
basis for exploring university teachers’
attitudes. Furthermore, the adaptedquestionnaire is a valid and reliable way to
measure university tutors’ attitudes towards
TOM. Finally, the results of this questionnaire
showed no significant differences in attitudes
towards TOM between the two conditions.
There are two possible explanations: training
does not affect attitude at all in spite of the
content and structure of the training. On theother hand, it is possible that the CES training
programme did not contain all the required
characteristics for changing attitudes.
However, van Aalderen and Walma van der
Molen (2015) found in their follow-up study
that proper training can influence attitude;
they found improved self-efficacy beliefs, less
context dependent and more enjoyment inscience teaching. Concluding, training can
influence attitude. This could imply that the
CES training programme was not adequate for
changing attitudes.
An added questionnaire measured the effect
of the training on executing tutoring skills.
The most items showed no significant
difference between the conditions. This is in
line with the conceptual model which arguesthat the behaviour will not change when the
attitudes are not changed. However, this
study focused only on the attitudes and not
the connection between attitudes and
behaviour, therefore these conclusions are
just suggestions and should be interpreted
with caution. The results of this questionnaire
also showed an unexpected significant higherscore of the untrained condition on the item
“I stimulate the development of students’
academic skills”. Untrained tutors indicated
they stimulated the development of students’
academic skills more often than trained
tutors. Possibly, the trained tutors found out
how comprehensive academic skills are, which
13 Conclusion and discussion
35
suggests that the untrained tutors may be
underestimating the complexity and extension
of academic skills, and therefore thought they
already fulfilled this task. The results on the
remaining items on executing tutor tasksshowed no significant differences between the
two conditions, which suggests that the CES
training programme was not adequate to
induce teachers to execute the tutor tasks.
We think that an extensive training of
teachers is needed when you want to change
their attitudes. This is confirmed by the
results from other studies (e.g. Desimone,2009; Fullan, 2007; Gegenfurtner, 2013).
Recommendations for futureresearch on attitudes
The conclusions from this study should be
interpreted with some caution. Firstly, this
study should be seen as an explorative study,
because the number of respondents of the
questionnaire was 49 which is not enough toobtain reliable results. It would be interesting
to see whether the instruments are still valid
and reliable with a greater number of
respondents. Secondly, to be sure of the
influence of training on university teachers’
attitudes, an effect study should be
conducted. The research design could be a
pre-test post-test design with control group.
Thirdly, a part of the respondents participatedvoluntary in the training programme of the
CES. Thus, it is possible that these
respondents were more interested in TOM
than those who did not follow the training
programme. A similar effect may be expected
for the respondents of the questionnaire; only
those who were more interested in or
concerned with TOM did respond.
Moreover, the results were quite moderate.
There are several ways that could be the
cause of this. Firstly, the online questionnaire
was experienced by some respondents as
long and boring, because of the many itemsand the resemblance between the items. This
could have led to careless, moderate
answering. Secondly, it is possible the items
were too broad and still too ambiguously
formulated, which induces doubtfulness and
long considerations, weighing pros and cons,
leading to moderate answers.
This study narrowed down to a part of the
theoretical framework, we made no explicit
link between the attitude and the behaviour
of the tutors. A follow-up study could
incorporate that part of the theoreticalframework to get insight in the influence of
teachers’ attitudes on behaviour. Besides that,
we focused on the professional attitudes of
the teachers. Pajares states there is a
distinction between teachers’ general
(personal) attitudes towards education and
their educational (professional) attitudes
towards education (Pajares, 1992). It couldbe interesting to investigate the influence of
the personal attitudes of teachers next to the
professional attitudes.
This study showed the applicability of the
model of van Aalderen-Smeets et al. (2012)and the DAS instrument of van Aalderen-
Smeets and Walma van der Molen (2013) to
another educational context. It can be
interesting to investigate whether the model
and the instrument are also adaptable to a
context with less similarities, e.g. to

36
investigate industry workers’ attitudes
towards a change in their company.
Recommendations fordesigning an attitude
focused training programmeBefore, we mentioned five critical
characteristics of professional development
that increase teachers’ knowledge, skills and
change in attitudes and beliefs: (1) contentfocus, (2) active learning and collective
participation, (3) coherence, (4) duration, and
(5) autonomy (e.g. Compton & Johnes, 1998;
Desimone, 2009; Fullan, 2007).
Content focus. The CES did focus on the
pedagogical sides of tutoring. However, tutorsstill mentioned they wanted to have more
pedagogical knowledge (e.g. tutor from
interview: “I know enough about the content,
but still I can learn a lot about the
pedagogical side of education.”). Based on
what Ingvarson (1998) found in his study, the
focus of the training should be regarding
integrating student-centred, process-orientedpedagogical approaches with subject matter.
For tutors of the UT, it could be more helpful
when they link the pedagogical approaches
directly to their content knowledge to make it
more practicable.
Active learning and collectiveparticipation. The CES training programme
used several active forms of learning during
their training programme. However, the CES
training could address deeper learning
activities to support attitude change, an
important form of deeper learning isreflection. Reflection makes (subconscious)
learned knowledge, strategies and skills
concrete. It’s a conscious process of
remembering, thinking of and evaluating
experiences which leads to new knowledge
and new preferences (Boud in Chirema, 2007;
Maclean in Boud et al. 1985; Pearson &
Smith, 1985). A lack of consciousness ofteaching attitudes can make traditional
teaching practices highly persistent. Because
teachers often have to react quickly, they
show a lot of unconscious behaviours and
routines that may be do not fit with the
intensions of the curriculum reform that ask
for new teaching behaviours (Könings, Brand-
Gruwel & van Merriënboer, 2007). Firstly,
reflection can be integrated into the CES
training programme. Moreover, it is more
valuable when reflection occurs more often,
for example with colleagues during the dailyteaching practice. An interesting form of
reflection with others is peer coaching: a
process of goal setting and reflecting on
actions, skills and ideas between two
professionals. It creates a safe learning
environment for constant exchange of
knowledge and skills, leading to attitude
changes and successful curriculum reforms(Donegan, Ostrosky & Fowler, 2000; Geijsel
et al., 2009; Thoonen et al., 2011).
Coherence. The coherence in the CES
training programme was experienced as
weak. Tutors talked a lot about theirexperiences and practical doubts, but never
consciously reflected on their attitudes and
how these could fit with TOM. Besides that,
they often mentioned a gap between what
they had learned from the training
programme and how it worked out in practice
(such as “But when you stand in front of a
37
group of students, unexpected things happen
… You don’t learn about that kind of things in
the training. However, I do learn how to
handle these situations from my colleagues.”)
and how it builds on their prior knowledge(such as “I was already tutor for half a year,
the training did not add something I had not
found out already by myself”). The coherence
between tutors’ attitudes and knowledge and
the content of the training programme could
be strengthened with peer coaching. Training
and coaching could be motivating and
strongly related with the learners’ practiceand needs when learners define and reflect
on their own learning goals and learning
activities.
Duration. The duration is about the number
of hours spent on the training programmeand the time span of the training programme.
The CES training programme’s duration was
approximately one day (sometimes spread
over two days with a week in between). In
general, a teacher with less than forty hours
of professional development follow more
traditional teaching practices than an average
teacher. A teacher that received 40-79 hours
of professional development showed average
teaching practices. Only a teacher who had
more than eighty hours of professional
development showed the implementation ofthe reform in their teaching practices
(Supovitz & Turner, 2000, Yoon, 2007).
Nevertheless, these numbers should be
interpreted with some caution, because the
duration of a training programme depends on
the content and target group of the training
programme.
Autonomy. The CES training programme
was tailor-made for every faculty. Tutors had
also some control in their learning process;
there was room for suggestions and tutors
could indicate their own goals. Nevertheless,
the training programme was not experiencedtailor-made by the tutors (such as “The
information was too generic, in practice things
are different” and “I have worked fourteen
years as a teacher, most of what was handled
during the training I already knew”). Adults
want control over their own learning process,
they are more committed when they set their
own goals (Putnam & Borko in Jimoyiannis &
Gravani, 2010) (such as “Maybe they can
make an educational curriculum vitae for
every teacher and you can fill in the gaps with
trainings and exercises”).
In conclusion, combining literature about the
professional development of adults and the
results from the interviews with the tutors
offers some suggestions to develop a training
programme appropriate for changingattitudes. Amongst these suggestions are:
more forms of personal, deeper and active
learning (e.g. peer coaching, reflection,
mentoring), a more personal and practical
touch, extension of the duration of the
training and above all a higher focus on
attitudes by including experiences that discuss
current personal beliefs and exercises forreflection on attitudes. Most training
programmes mentioned in literature use
workshops and peer coaching and mentoring
as a way to organise and share information
(Compton & Jones, 1998; Otero et al., 2005;
Polly et al., 2010; Wright, 2010). Probably, a
combination of training and coaching fits the
38
teachers’ learning needs and wishes and
eventually leads to successful curriculum
reform.
Recommendations forsuccessful curriculum
reform in higher educationThe attitude of the tutors was not only
influenced by the CES tutor training. There
are a lot of other factors that play a role incurriculum reform and influence teachers’
attitudes. The way the reform is implemented
by the management also influences teachers’
attitudes. Bergen and van Veen (2004) argue
that most reforms are still executed in a
dominant, top-down way, while this is the
opposite of what is recommended by
literature and other research. Teachers are
often not involved in the reform and there islittle room for professionalization. Secondly, in
most cases it is difficult for teachers to fully
implement the designed curriculum reform in
their teaching (Könings, Brand-Gruwel & van
Merriënboer, 2007). Nevertheless, the
expectations towards teachers are that
teachers realize and execute the reform as
others (i.e. government, school management)
intended (Bergen & van Veen, 2004). Thirdly,
the management lacks to present evidence
regarding how the reform improves education
and executes organizational and financialchanges that suggest that education is not
the priority. This is closely connected with the
component perceived relevancy directly
influencing teachers’ attitudes in the
conceptual model. In higher education, this
impression is reinforced by the focus on
research activities. University teachers have to
combine their research activities with theirteaching activities (Oolbekkink-Marchand,
2006), while they are in most cases judged on
their research activities. That is why a lot of
teachers experience teaching as a time
consuming activity and rather focus on other
responsibilities (van der Rijst, 2009; Visser-
Wijnveen, 2009). Finally, the teachers who do
not agree with the reform with legitimatereasons are depicted as conservative,
traditional or unmotivated. Altogether, this
doesn’t create a save climate which is
necessary for professional development
(Bergen & van Veen, 2004).
This is mainly how the UT tutors experienced
the implementation of TOM. They experienced
it as a rigorous, imposed and top-down
process. Only a few tutors understood the
added value and the necessity of theimplementation of TOM. This led to
uninvolved and unmotivated tutors. Besides
that, tutors noticed that the compelling TOM
activities were at the expense of research
activities. Moreover, they found it frustrating
to be judged only on their research activities,
while they put a lot of effort in successfully
implementing TOM.
Contrary to the top-down approach,
transformational leadership has positive
effects on teachers’ motivation and
professional development (Thoonen et al.,
2011). Transformational leaders focus onhuman resources for reforms. Their main
tasks are vision building, individual support,
and providing intellectual stimulation
(Thoonen et al., 2011; Kennisnet, 2011). By
setting up a clear and shared vision, teachers
feel more motivated, more committed and
more responsible regarding the curriculum

39
reform. Individual support of the
management leads to a stronger connection
between teachers’ personal needs and beliefs
and the school’s vision and goals. Intellectual
stimulation support teachers in solving theirproblems and questioning their beliefs and
attitudes towards the curriculum reform,
which helps in changing their attitudes
(Thoonen et al., 2011; Kennisnet, 2011).
Concluding, the management of the UTshould have involved the teachers and
students more in their vision building
processes. However, since TOM is already
implemented, the approach should be
different. Firstly, the management should
carry out an unambiguous vision on TOM and
a clear explanation of the added value andnecessity of TOM. Besides that, they should
invest in professional development, preferably
attitude-focused coaching: creating a
possibility for teachers to discuss about and
reflect on TOM together with colleagues, TOM
specialists, students and educationalists.
Teachers have to find a closer link between
the implementation of TOM and their needs
and beliefs. Hopefully, this will lead to tutors’
improved attitudes towards TOM.
Nowadays, the main focus of universities is on
research, leading to the educational tasks in
danger of being overlooked. However, when
universities want to deliver highly educated
professionals, they should value the teaching
activities of their current staff and take both,
employees’ research contributions and
teaching contributions into account.

40
References &
appendices
41
Ajzen, I. (1991). The theory of planned behavior. Organizational behavior and human decision processes, 50(2), 179-211.
Asma, L. J. F., Walma van der Molen, J. H., & van Aalderen-Smeets, S. I. (in press). Primary teachers’ attitudes towards science: Results of a focus
group study. In M. J. de Vries, H. van Keulen, S. Peters, & J. H. Walma van der Molen (Eds.). Professional development for primary teachers inscience. The Dutch VTB-Pro project in an international perspective. Rotterdam, The Netherlands: SensePublishers.
Bandura, A. (1977). Self-efficacy: towards a unifying theory of behavioral change. Psychological review, 84(2), 191.
Beets, M. W., Flay, B. R., Vuchinich, S., Acock, A. C., Li, K. K., & Allred, C. (2008). School climate and teachers’ beliefs and attitudes associated with
implementation of the positive action programme: A diffusion of innovations model.Prevention Science, 9(4), 264-275. doi: 10.1007/s11121-008-
0100-2
Bergen, T., & Veen, K. V. (2004). Het leren van leraren in een context van onderwijsvernieuwingen: waarom is het zo moeilijk. Velon tijdschrift voor
lerarenopleiders, 25(4), 29-39.
Bohner, G., & Wänke, M. (2002). Attitudes and attitude change. Psychology Press.
Boud, D., Keogh, R., & Walker, D. (Eds.). (2013). Reflection: Turning experience into learning. Routledge.
Chirema, K. D. (2007). The use of reflective journals in the promotion of reflection and learning in post-registration nursing students. Nurse educationtoday, 27(3), 192-202.
Compton, V., & Jones, A. (1998). Reflecting on teacher development in technology education: Implications for future programmes. International Journalof Technology and Design Education, 8(2), 151-166.
Desimone, L. M. (2009). Improving impact studies of teachers’ professional development: Towards better conceptualizations and measures. Educational
researcher, 38(3), 181-199.
14 References
42
Dooley, D. (2009). Social research methods. New Jersey: Pearson.
Donche, V. (2005). Leren, onderwijzen en leren onderwijzen: onderzoek naar opvattingen en handelingen van studenten en docenten. Gent: AcademiaPress.
Donegan, M. M., Ostrosky, M. M., & Fowler, S. A. (2000). Peer Coaching: Teachers Supporting Teachers. Young Exceptional Children, 3(3), 9-16.
Eagly, A. H., & Chaiken, S. (1993). The psychology of attitudes. Harcourt Brace Jovanovich College Publishers.
Eagly, A. H., & Chaiken, S. (2007). The advantages of an inclusive definition of attitude. Social Cognition, 25(5), 582-602.
Evers, W. J., Brouwers, A., & Tomic, W. (2002). Burnout and self‐efficacy: A study on teachers' beliefs when implementing an innovative educational
system in the Netherlands. British Journal of Educational Psychology, 72(2), 227-243.
Fazio, R. H., & Petty, R. E. (Eds.). (2008). Attitudes: Key Readings: Their Structure, Function, and Consequences. Psychology Press.
Fullan, M. (2007). The new meaning of educational change. New York: Teachers College Press.
Ghaith, G., & Yaghi, H. (1997). Relationships among experience, teacher efficacy, and attitudes towards the implementation of instructional
innovation.Teaching and Teacher Education, 13(4), 451-458.
Geerlings, T. & Veen, T. van der (2010). Lesgeven en zelfstandig leren. (14e druk). Assen: Van Gorcum.
Gegenfurtner, A. (2013). Dimensions of motivation to transfer: a longitudinal analysis of their influence on retention, transfer, and attitude
change. Vocations and Learning, 6(2), 187-205.
Geijsel, F. P., Sleegers, P. J., Stoel, R. D., & Krüger, M. L. (2009). The effect of teacher psychological and school organizational and leadership factorson teachers' professional learning in Dutch schools. The elementary school journal, 109(4), 406-427.
Guskey, T. R. (1988). Teacher efficacy, self-concept, and attitudes towards the implementation of instructional innovation. Teaching and teacher
education,4(1), 63-69.
43
Ingvarson, L. (1998). Teaching standards: Foundations for professional development reform. In International handbook of educational change (pp.
1006-1031). Springer Netherlands.
Kennisnet (2011). Vier in balans monitor. ICT in het onderwijs: de stand van zaken. Zoetermeer: Kennisnet.
Könings, K. D., Brand-Gruwel, S., & van Merriënboer, J. J. (2007). Teachers’ perspectives on innovations: Implications for educational design. Teachingand Teacher Education, 23(6), 985-997.
Korthagen, F. A. (2010). Situated learning theory and the pedagogy of teacher education: Towards an integrative view of teacher behavior and teacher
learning. Teaching and teacher education, 26(1), 98-106.
Krippendorff, K. (2004). Reliability in content analysis. Human Communication Research, 30(3), 411-433.
Maskit, D. (2011). Teachers’ attitudes towards pedagogical changes during various stages of professional development. Teaching and TeacherEducation,27(5), 851-860.
Moust, J. (1993). De rol van tutoren in probleemgestuurd onderwijs. Contrasten tussen studenten docent-tutoren.
Onderwijsraad (2011). Advies Hoger onderwijs voor de toekomst. (Report No. 20110270/997). Retrieved fromhttp://www.onderwijsraad.nl/upload/documents/publicaties/volledig/hoger-onderwijs-voor-de-toekomst.pdf.
Onwuegbuzie, A. J., & Leech, N. L. (2007). A call for qualitative power analyses. Quality & Quantity, 41(1), 105-121.
Oolbekkink-Marchand, H.W. (2006). Teachers’ perspectives on self-regulated learning: an exploratory study in secondary and university education.(Doctoral dissertation). Leiden: ICLON.
Otero, V., Peressini, D., Meymaris, K. A., Ford, P., Garvin, T., Harlow, D. & Mears, C. (2005). Integrating Technology into Teacher Education A CriticalFramework for Implementing Reform. Journal of Teacher Education, 56(1), 8-23.
Pajares, M.F. (1992). Teachers’ Beliefs and Educational Research: Cleaning up a messy construct. Review of Educational Research, 62(3), 307-332.
Pearson, M., & Smith, D. (1985). Debriefing in experience-based learning. Reflection: Turning experience into learning, 69-84.
44
Polly, D., Mims, C., Shepherd, C. E., & Inan, F. (2010). Evidence of impact: Transforming teacher education with preparing tomorrow's teachers toteach with technology (PT3) grants. Teaching and Teacher Education, 26(4), 863-870.
Rafferty, A. E., Jimmieson, N. L., & Armenakis, A. A. (2013). Change Readiness A Multilevel Review. Journal of Management, 39(1), 110-135.Rijst, R. M.
V. D. (2009). The research-teaching nexus in the sciences: Scientific research dispositions and teaching practice. ICLON, Leiden University
Graduate School of Teaching.
Rijst, R. M. V. D. (2009). The research-teaching nexus in the sciences: Scientific research dispositions and teaching practice. ICLON, Leiden University
Graduate School of Teaching.
Ryan, R. M., & Deci, E. L. (2000). Intrinsic and extrinsic motivations: Classic definitions and new directions. Contemporary educational
psychology, 25(1), 54-67.
Schmidt, H. (2011). Communication patterns that define the role of the university-level tutor. Journal of College Reading and Learning, 42(1), 45-60.
Stevens, G. W. (2013). Towards a Process-Based Approach of Conceptualizing Change Readiness. The Journal of Applied Behavioral Science, 49(3),
333-360.
Stevens, J. P. (2012). Applied multivariate statistics for the social sciences. Routledge.
Tabata, L. N., & Johnsrud, L. K. (2008). The impact of faculty attitudes towards technology, distance education, and innovation. Research in Higher
Education,49(7), 625-646.
Thoonen, E. E., Sleegers, P. J., Oort, F. J., Peetsma, T. T., & Geijsel, F. P. (2011). How to improve teaching practices the role of teacher motivation,organizational factors, and leadership practices. Educational Administration Quarterly, 47(3), 496-536.
van Aalderen-Smeets, S.I., & Walma van der Molen, J. (2013). Measuring primary teachers' attitudes towards teaching science: Development of the
dimensions of attitude towards science (DAS) instrument. International Journal of Science Education, 35(4), 577-600.
van Aalderen-Smeets, van, S.I., & Walma van der Molen, J.H. (2015). Improving primary teachers’ attitudes towards science by attitude-focused
professional development.
45
van Aalderen‐Smeets, S. I., Walma van der Molen, J. H., & Asma, L. J. (2012). Primary teachers' attitudes towards science: A new theoretical
framework.Science Education, 96(1), 158-182.
Van den Akker, J. (2003). Curriculum perspectives: An introduction (pp. 1-10). Springer Netherlands.
Vermunt J.D. & Verloop N. (1999). Congruence and friction between lear teaching. Learning and Instruction, 9, 257-280.
Visser-Wijnveen, G. J. (2009). The research-teaching nexus in the humanities: Variations among academics. Leiden University Graduate School of
Teaching (ICLON), Faculty of Social and Behavioural Sciences, Leiden University.
Wright, V. H. (2010). Professional development and the master technology teacher: The evolution of one partnership. Education, 131(1), 139.
Zajonc, R. B. (1980). Feeling and thinking: Preferences need no inferences.American psychologist, 35(2), 151.


Additional information and appendices may be requested from the researcher.