Embed Size (px)
Citation preview
Pour l’obtention du grade de
Docteu
Ecole Doctorale : Systèmes Intégrés en Biologie, Agronomie, Geoscience, Hydroscience et Environnement
CIRAD-Département BIOS, Umr AGAP (équipe PAM)
THERMAL STRESSES AND SPIKELET STERILITY IN
SENSITIVE PHASES AND
STRESS THERMIQUE ET STERILITE DES EPILLETS CHEZ LE RIZ
LES PHASES SENSIBLES ET
Soutenance le 20 décembre
Bruno ANDRIEU
Folkard ASCH
Thierry SIMONNEAU
Olivier TURC
Vincent ALLARD
Michael DINGKUHN
Directeur de recherche INRA
Professeur à l’Université d’Hohenheim (Allemagne)
Directeur de recherche INRA
Chargé de recherche INRA
Chargé de recherche INRA
Cherche
Place Eugène Bataillon, 34095 Montpellier Cedex 5, France
THESE
Pour l’obtention du grade de
Docteur en Biologie Intégrative des Plantes
Ecole Doctorale : Systèmes Intégrés en Biologie, Agronomie, Geoscience, Hydroscience et Environnement
Cécile JULIA
Département BIOS, Umr AGAP (équipe PAM)
RMAL STRESSES AND SPIKELET STERILITY IN
SENSITIVE PHASES AND ROLE OF MICROCLIMATE
STRESS THERMIQUE ET STERILITE DES EPILLETS CHEZ LE RIZ
PHASES SENSIBLES ET LE ROLE DU MICROCLIMAT
Soutenance le 20 décembre 2012 devant le jury composé de:
Directeur de recherche INRA (Thiverval-Grignon)
Professeur à l’Université d’Hohenheim (Allemagne)
Directeur de recherche INRA (Montpellier)
Chargé de recherche INRA (Montpellier)
Chargé de recherche INRA (Clermont-Ferrand)
hercheur CIRAD (Montpellier) & IRRI (Philippines)
UNIVERSITE MONTPELLIER 2
Place Eugène Bataillon, 34095 Montpellier Cedex 5, France
Ecole Doctorale : Systèmes Intégrés en Biologie, Agronomie, Geoscience, Hydroscience et Environnement
Département BIOS, Umr AGAP (équipe PAM)
RMAL STRESSES AND SPIKELET STERILITY IN RICE:
ROLE OF MICROCLIMATE
STRESS THERMIQUE ET STERILITE DES EPILLETS CHEZ LE RIZ :
ROLE DU MICROCLIMAT
de:
Professeur à l’Université d’Hohenheim (Allemagne)
Rapporteur
Rapporteur
Examinateur
Examinateur
Examinateur
Directeur de thèse
Place Eugène Bataillon, 34095 Montpellier Cedex 5, France

1
AKNOWLEDGEMENTS
Tout d’abord je remercie les membres de mon jury de thèse d’avoir accepté d’évaluer ce travail.
A Christophe Jourdan, pour m’avoir encouragé à me lancer dans cette aventure quand j’hésitais
après mon l’école d’ingénieur.
A tous les membres des équipes CIRAD-PAM et GIV, particulièrement ceux qui m’ont aidé à repiquer
le riz en Camargue (malgré les désastres irréversibles du froid post repiquage la deuxième année) :
Alain, Jean-Charles, Joseph, Denis, Sandrine, Tanguy (pour les photos :), Julien, Anne, Nathalie, les
stagiaires, Romain, Péio et ma mère ! Aux irréductibles gaulois : Jean-Claude Combres et Guy
Clément. Guy, merci pour ton aide et ton agréable compagnie en Camargue, tu es une source de
savoir intarissable !
Au Sénégal, merci à Sabine et Sow pour leur aide et leur bienveillance. Je n’oublierai jamais mes
longues journées de mesures au champ avec ces gars supers : Omar, Youssou G., Mbaye, Diop,
Youssou and Co. Ils ont le cœur sur la main et pas besoin de parler peul ou wolof, on se comprend
toujours et avec le sourire ! Merci aussi à Matty l’artiste agro économiste, le seul séné-gaulois qui
roule en mercedes classe A et qui forcément se fait arrêter pour rien ! (souvenirs, souvenirs). Et à
Bertrand l’infatigable pour nous avoir accueilli Kwanho et moi. Que serait mon essai en saison froide
et mon 1er séjour en Afrique sans Kwanho ? Bonne question.
To my pinoy colleagues. IRRI was one of the best professional and social experience I had. My
experiment was successfully conducted thanks to Tanguy, Leny, Luis, Man Pit, RJ and Co. who were
even able to deal with my special field driving and karaoke performances! (the food I leave it to you
Leny). To Frias and RJ, thanks for the pinoy adventures.
Thanks to Krishna, Coast, Wanju, Xian and Co. who warmly welcomed me for my second stay at IRRI
in 2011. Forgive me if I forgot to mention someone, there are so many of you there!
A special thanks to the Japanese colleagues Toshi and Mayumi for their help. I hope we’ll keep
collaborating in the future.
A Danny, ami de toute heure qui sait me pousser et me motiver.
A Alex, « kwé la fé ? Ti Hache i coupe gro bois » est la seule chose que je peux dire en réunionnais !
Merci de m’avoir soutenu dans la dernière phase de la thèse qui n’est pas la moins difficile…
2
A mon cher Cyrille, comme tu dirais « Merci ! merci ! merci ! ».
To my friends CJ and Moni who always understand me and support me with an incredible kindness.
Tell me now, Is a PhD the best way to become a Rockstar ? Not so sure. My guitar and I should now
catch up before it’s too late!
Enfin :
A mes parents, toujours là pour moi.
A Michael, un incroyable scientifique doté d’une dimension humaine unique. Boss :), tu as été et tu
restes pour moi un soutien énorme, un mentor, et un exemple à suivre. Comme on dit « le monde
est petit », notre sphère scientifique est relativement étroite, ce qui me laisse espérer et me réjouir
de collaborer à nouveau avec toi quelque soit le contexte futur. Et vive le POEFL ! Surtout quand c’est
fini :-)
To Kwanho. I’m afraid words aren’t strong enough to explain how much you helped me during all
those years. You were always there for me. You even assisted me in the field/lab for half of my
experiments and you did it with no hesitation because you are an amazingly nice person. You always
believed in me so much, I wouldn’t have made it without you and your legendary smile around =).
Fighting! C’est notre devise! Gamsahamnida so much Kwanho. Prêt pour de nouvelles aventures?

3
A mes Parents, et à Kwanho
4
TABLE OF CONTENTS
AKNOWLEDGEMENTS .......................................................................................................................... 1
ABSTRACT : .................................................................................................................................................. 6
RESUME : ..................................................................................................................................................... 8
CONTEXT, OBJECTIVES AND OVERVIEW OF THE THESIS ....................................................................... 10
CONTEXT ....................................................................................................................................................10
OBJECTIVE AND OVERVIEW OF CHAPTERS ...............................................................................................27
REFERENCES ..............................................................................................................................................29
CHAPTER 1: Variation in time of day of anthesis in rice in different climatic environments .................. 40
INTRODUCTION .........................................................................................................................................41
MATERIALS AND METHODS ......................................................................................................................42
RESULTS .....................................................................................................................................................47
DISCUSSION ...............................................................................................................................................54
CONCLUSION .............................................................................................................................................57
Acknowledgement.....................................................................................................................................57
REFERENCES ..............................................................................................................................................58
CHAPTER 2: Predicting heat induced sterility of rice spikelets requires simulation of crop-generated
microclimate ..................................................................................................................................... 61
ABSTRACT ..................................................................................................................................................61
INTRODUCTION .........................................................................................................................................62
MATERIALS AND METHODS ......................................................................................................................63
RESULTS .....................................................................................................................................................70
DISCUSSION ...............................................................................................................................................79
Acknowledgement.....................................................................................................................................83
REFERENCES ..............................................................................................................................................84
CHAPTER 3: Development of RIDEV V.2, Rice Model of Phenology and Thermal Sterility of Spikelets .. 89
INTRODUCTION .........................................................................................................................................89
REPORT ......................................................................................................................................................90
5
CHAPTER 4: Preliminary modeling exercises and perspectives for future applications ....................... 105
INTRODUCTION .......................................................................................................................................105
MODEL COMPARISON ACROSS THE SITE USING THE PHD DATA ............................................................106
RIDEV APPLICATION : AN EXAMPLE OF SIMULATION .............................................................................112
OUTLOOK FOR MODELING OF CROP RESPONSE TO THERMAL CONTRAINTS .........................................115
SYNTHESIS, DISCUSSIONS AND PERSPECTIVES .................................................................................. 117
SYNTHESIS ...............................................................................................................................................117
DISCUSSION .............................................................................................................................................118
REFERENCES ............................................................................................................................................123
GENERAL CONCLUSION .................................................................................................................... 125
APPENDIX ....................................................................................................................................... 126
6
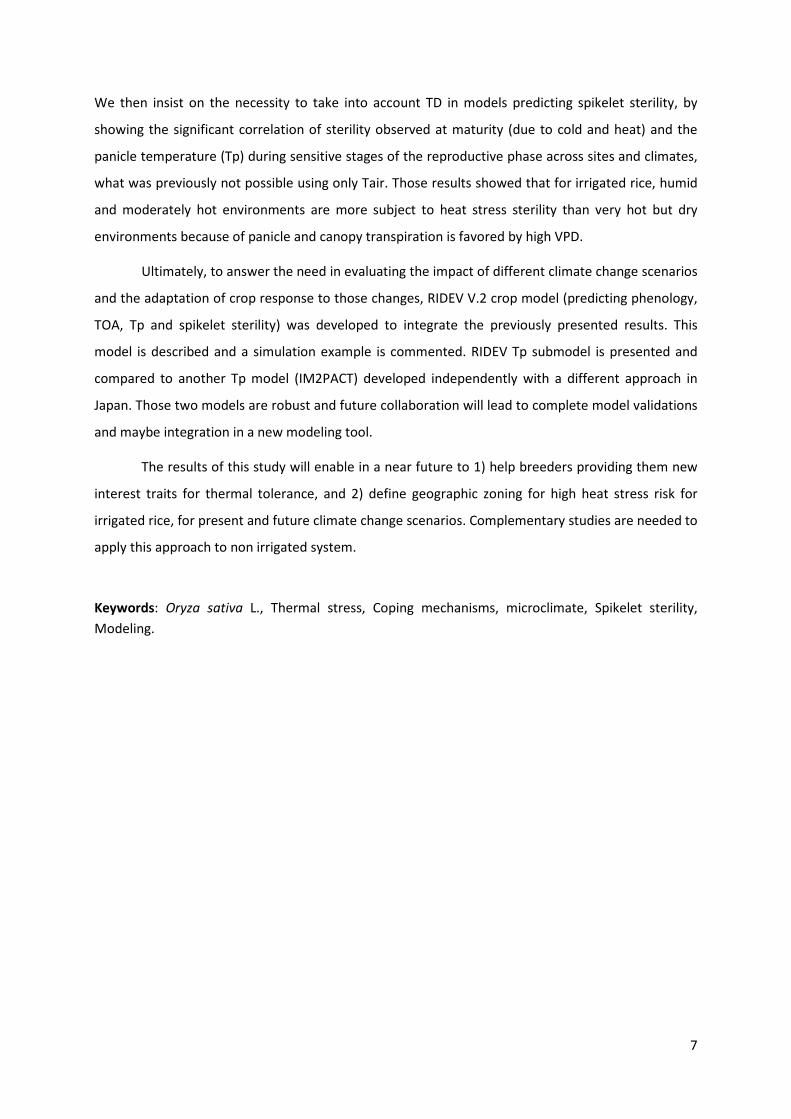
ABSTRACT :
Cultivated rice (oryza sativa) is a staple crop facing production uncertainty because of future
climate changes. Predicting how the future climates will impact on rice is necessary to make
appropriate decisions to cope with it.
In this context, thermal stress is one of the main abiotic stress to address. At the reproductive stage,
rice spikelets are sensitive to cold and to heat which can lead to spikelet sterility. However, it is not
the air temperature but the temperature of the sensitive organ itself during some specific sensitive
stages that is involved.
Cold affects spikelet fertility through 1) meiosis disruption during the early microspore stage
(sensitive organs enclosed by the leaf sheaths and exposed to the temperature of the floodwater and
not the atmosphere), 2) incomplete panicle exertion (insufficient peduncle elongation). Heat induces
sterility mostly by disrupting pollination and reducing pollen fertility during anthesis (sensitive organ
located at the top of the canopy and exposed to air temperature)
Coping with thermal stress involves different strategies: physiological tolerance of a particular
variety; temporal escape of the stress by phenology and time of day of anthesis (TOA) adjustments;
and stress avoidance through microclimate generated by crop architecture and transpiration.
This Ph.D. aims to characterize the effect of environment on 1) phenoly, 2) TOA, and 3)
temperature difference between air at 2m and panicle during flowering (canopy structure taken into
account). To attain this goal, the same experiment was conducted with four rice varieties irrigated
and grown in four different climatic environments (Philippines dry season, Senegal dry-hot and dry-
cold seasons, France temperate summer) in 2009-2010. Standard meteorological (T, RH, wind speed,
solar radiation at 2m from ground) and micrometeorological (Twater, T inside canopy, T and RH in
the panicle layer) data were made in parallel of measurements of phenology, canopy architecture,
and organ temperature with infra red (IR) thermotracer during flowering.
Even though few varietal differences were observed within a site, a great variability of TOA response
to environment was shown and explained with Tair(min) and VPD (Vapour Pressure Deficit) observed
before anthesis. However, anthesis duration is stable and limited to 2 hours per day.
Architecture and canopy transpiration rate generate a microclimate where sensitive organs
temperature can sensibly differs from air temperature measured at 2 meters from the ground.
During anthesis, difference between panicle and air temperature (TD) observed varied between -9.5
and +2°C. TD was explained mostly by transpiration and modeled by VPD and Tair.
7
We then insist on the necessity to take into account TD in models predicting spikelet sterility, by
showing the significant correlation of sterility observed at maturity (due to cold and heat) and the
panicle temperature (Tp) during sensitive stages of the reproductive phase across sites and climates,
what was previously not possible using only Tair. Those results showed that for irrigated rice, humid
and moderately hot environments are more subject to heat stress sterility than very hot but dry
environments because of panicle and canopy transpiration is favored by high VPD.
Ultimately, to answer the need in evaluating the impact of different climate change scenarios
and the adaptation of crop response to those changes, RIDEV V.2 crop model (predicting phenology,
TOA, Tp and spikelet sterility) was developed to integrate the previously presented results. This
model is described and a simulation example is commented. RIDEV Tp submodel is presented and
compared to another Tp model (IM2PACT) developed independently with a different approach in
Japan. Those two models are robust and future collaboration will lead to complete model validations
and maybe integration in a new modeling tool.
The results of this study will enable in a near future to 1) help breeders providing them new
interest traits for thermal tolerance, and 2) define geographic zoning for high heat stress risk for
irrigated rice, for present and future climate change scenarios. Complementary studies are needed to
apply this approach to non irrigated system.
Keywords: Oryza sativa L., Thermal stress, Coping mechanisms, microclimate, Spikelet sterility,
Modeling.
8
RESUME :
Le riz (Oryza sativa L.), culture céréalière la plus importante au monde, est menacé par les
changements climatiques. Il est essentiel de déterminer de quelle manière et dans quelle mesure sa
production sera affectée par ces changements afin de faire face en prenant les décisions stratégiques
adéquates dans le futur.
Le stress thermique est un des facteurs de stress abiotique majeur à prendre en compte. Les
inflorescences de riz sont sensibles au froid et à la chaleur ce qui se traduit par une stérilité des
épillets à floraison. Ce n’est cependant pas directement la température de l’air qui est en cause mais
la température des tissus à des stades de développement précis.
Le froid est source de stérilité via deux principaux processus qui sont (1) la perturbation de la
méiose au début du stade microspore (organes sensibles localisés à la base et soumis à la
température de l’eau), et (2) une exersion paniculaire incomplète (élongation des entrenœuds
ralentie). La chaleur affecte principalement la pollinisation et la fertilité du pollen au moment de
l’anthèse (organes sensibles localisés au sommet de la canopée et soumis à la température de l’air).
Pour faire face au stress thermique, la plante dispose de plusieurs stratégies : la tolérance
physiologique d’une variété particulière; l’échappement temporel au stress par l’ajustement de la
phénologie et de l’heure de l’anthèse; et l’évitement du stress par le microclimat généré par la
culture grâce à son architecture et à sa transpiration.
Cette thèse a pour but de caractériser l’effet des composantes climatiques sur 1) La
phénology, 2) l’heure de l’anthèse et 3) la différence de température entre l’air à 2m et la panicule à
floraison (structure de canopée prise en compte).
Pour cela, le même essai a été mené au champ sur quatre variétés de riz irrigué cultivées dans quatre
environnements climatiques contrastés (la saison sèche aux Philippines, les saisons sèches chaude et
froide au Sénégal, et l’été tempéré du sud de la France) en 2009-2010. Des données météorologiques
classiques (T, RH, vitesse du vent, radiation à 2m du sol) ainsi que des données
micrometeorologiques (Teau, T dans la canopée, T et RH dans la couche paniculaire) ont été relevées
en parallèle de mesures phénologiques, architecturales, et de température d’organe à l’aide de
mesures Infrarouges prises à floraison.
Bien que peu de différence variétale ait été observée au sein de chaque site, une grande variabilité
de l’heure de l’anthèse en réponse à l’environnement a été mise en évidence et expliquée par
Tair(min) et VPD (Vapour Pressure Deficit) observés antérieurement à l’anthèse. La duree de
l’anthese, par contre, est stable et limitée a environ 2 heures par jour.
9
L’architecture et le taux de transpiration de la canopée génèrent un microclimat dans lequel la
température des organes reproducteurs peut considérablement différer de la température de l’air à
deux mètres du sol. Au moment de l’anthèse, des différences de température (TD) entre -9.5 et +2°C
ont été observées. Cette différence est principalement expliquée par la transpiration et modélisée
par le VPD et Tair. Dans un second temps, on souligne la nécessité de prendre en compte TD dans les
modèles de prédiction de stérilité paniculaire en montrant la corrélation significative entre la stérilité
(chaud ou froid) observée à maturité et la température paniculaire aux stades sensibles au travers
des différents sites et climats, ce qui était auparavant impossible en utilisant seulement Tair. Ces
résultats montrent que pour le riz irrigué à floraison, un climat moyennement chaud et humide est
plus dangereux qu’un climat très chaud mais sec en termes de risque de stérilité due à la chaleur, à
cause de la transpiration de la panicule et de la canopée impulsées par un fort VPD.
Enfin, aux vues de la nécessité d’évaluer l’impact des différents scenarios climatiques et
l’adaptation des variétés à ceux-ci, le modèle de culture RIDEV V.2 (qui prédit la phénologie, l’heure
de l’anthèse, la température de la panicule et son taux de stérilité) a été développé afin d’intégrer les
résultats présentés précédemment. Ce modèle est décrit de façon complète et un exemple de
simulation est présenté. Les simulations de TD par RIDEV sont comparées à celles d’un autre modèle
(IM2PACT) à l’approche différente et développé indépendamment au Japon. Ces deux modèles
s’avèrent robustes et de futures collaborations mèneront à une validation complète de chaque
modèle voire une intégration de ceux-ci à un nouvel outil.
Les résultats de cette étude permettront dans un futur proche 1) d’aider les sélectionneurs
en apportant de nouveaux traits d’intérêts, et 2) de définir un zonage des territoires à haut risque de
stress thermique pour le riz irrigué, pour des scénarios climatiques actuels et anticipés. Des études
complémentaires seront nécessaires pour permettre l’application de cette approche aux systèmes
non irrigués.
Mots clés: Oryza sativa L., Stress thermique, Mécanismes d’évitement, Microclimat, Stérilité des
épillets, Modélisation.
Context, objectives and overview of the thesis
10
CONTEXT, OBJECTIVES AND OVERVIEW OF THE THESIS
CONTEXT
Hosting project
This study was part of the RISOCAS project (developing RIce and SOrghum Crop Adaptation
Strategies for climate change in vulnerable environments in Africa) (RISOCAS, 2011) funded by the BMZ
(German Ministry of Economic Cooperation and Development) and coordinated by the Institute of Crop
Production and Agroecology in the Tropics and Subtropics of Hohenheim University (Stuttgart, Germany).
In a climate change context, this project aimed to develop strategies for coping with the increasing
climate variability and weather extremes. To attain that goal, a broad range of varietal types of rice and
sorghum were studied on existing climatic gradients that cover expected ranges of change, such as
temporal/intra-annual gradients (irrigated rice in Senegal), latitudinal gradients (sorghum on a N-S
transect in Mali) and altitudinal gradients (upland rice in Madagascar), in collaboration with AfricaRice,
CIRAD (Agricultural Research for Development, Montpellier, France), IER (Institute for Rural Economy,
Bamako, Mali), and FOFIFA (National Center for Applied Research for Rural Development, Antananarivo,
Madagascar). Relevant meteorological data, site-specific soil characteristics and water balances, and
parameters of growth and yield were monitored. These data are being used by the project consortium to
identify valuable traits and ideotype concepts for varietal improvement and to develop/improve,
calibrate and field validate crop models.
The points of departure for modeling were the existing models RIDEV in its original now
technically and scientifically outdated version (Dingkuhn et al. 1995a, Wopereis et al. 2003), SARRAH
(Dingkuhn et al. 2003, Heinemann et al. 2008) and SAMARA (Dingkuhn 2011 unpublished) crop models.
The resulting tools will allow predictive applications in the context of climate change scenarios.
Many questions remain open on how the new abiotic stress combinations associated with climate
change translate into phenology and yield and which varietal types are better adapted to the expected
variation patterns of temperature, water availability, and atmospheric CO2 concentration. The RISOCAS
project aims at predicting the appropriateness of complex trait combinations by providing physiological
models that are well validated for targeted environments.
Context, objectives and overview of the thesis
11
The present multi-site study is one of four Ph.D. theses supported by RISOCAS and is focused on irrigated
rice and thermal stresses at reproductive stage. Its role within RISOCAS is to:
- gather microclimate data along the soil-water-canopy-air gradient and organ temperatures
across 4 contrasting environments;
- to link them to crop performance, in particular spikelet sterility; and
- to integrate the results to a crop model.
The thesis research was based at CIRAD (Phenotypic plasticity and Adaptation of perennial Monocots
team of the AGAP unit, BIOS Department). The work was implemented at field research sites at AfricaRice
in Senegal, the International Rice Research Institute (IRRI) in the Philippines and the Centre Francais du
Riz (CFR) in France.
Rice in the world
Cultivated rice is an annual cereal with a C3 metabolism and belongs to the Poaceae botanical
family. The two cultivated species Oryza sativa L. (Asian rice) and Oryza glaberrina Steud. (African rice),
were respectivelely domesticated around 10 000 BC in China and 2500 BC in the Niger inland delta in Mali
(MacNeish et al. 1995). O. sativa has two major genetic groups (sometimes classified as subspecies) called
japonica (short-grained, tropical upland and temperate lowland rice) and indica (long-grained, tropical,
mainly lowland rice). Around 90% of the rice produced in the world is cultivated in Asia at sometimes very
high cropping intensity (3 growing seasons per year in some parts of South East Asia). Africa and Latin
America provide around 7% of global production, at about 25 M tons each per annum (Seck et al. 2012).
O. sativa cultivated under irrigated, flooded conditions represents around 50% of the world rice grown
area (158 M hectares grown with rice in 2009) and provides 75% of the global rice supply (700 M tons
produced in 2009) (IRRI, AfricaRice and CIAT 2010). During the last 50 years, world rice production has
more than tripled and average yield more than doubled, to attain 4.3 tonnes per hectare in 2010 (China
being the largest rice producer with 197.2 M tons and Australia the most productive with 10.8 t/ha)
(FAOSTAT 2011).
Irrigated flooded systems are intensive in terms of management and fertilizer inputs and attain
higher yields than other rice systems. Developed countries with highest yields, such as Korea, Japan, the
USA or Australia, grow rice exclusively under irrigated conditions (Seck et al. 2012). This is also true for all
temperate rice environments and (sub)tropical-arid environments such as the Sahel and Egypt. World
population growth keeps increasing the demand for rice (Wild 2003) but arable land surface is limited or
even diminishing in key areas such as China because of urbanization, or in marginal rainfed ecosystems
due to unsustainable intensification and soil degradation (Daily et al. 1998). There is no doubt that the
Context, objectives and overview of the thesis
12
much needed increases in global rice production must come from intensification of production (thus
increasing attainable yields where they are currently low) and by reducing the yield gap (thus achieving
the locally attainable yield). To attain food security, this must be achieved in a climate change context,
which is a challenging goal to the global rice research and development community (Lal 2000).
The potential impact of research on yields can be expected to be greatest in environments and
systems where (1) the biophysical potential for production is high, namely through the abundance of
water high climatic potential for production; and (2) actual yields frequently fall short of this potential
through yield reducing factors that can theoretically be overcome. One such group of situations is high-
radiation, irrigated environments affected by thermal stresses that can be overcome with improved crop
tolerance, avoidance or temporal escape strategies (Dingkuhn et al. 1995b, Dingkuhn and Miezan 1995,
Dingkuhn 1995). The present thesis research addresses this problem.
Rice cycle and reproductive stage
The rice crop takes between 3 and 6 months from germination to maturity, depending on the
variety and the environmental factors (Yoshida 1981). The cycle is divided in 3 main phases, namely, the
vegetative phase, the reproductive phase and the maturation or grain filling phase. The vegetative phase
starts at germination and is characterized by the development of the roots and the leaf area needed for
resource acquisition, and tillering which sets the potential number of panicles at maturity (Yoshida 1981).
The end of the vegetative phase is marked by a photoperiod-sensitive period (PSP) which can significantly
delay panicle initiation under long-day conditions if the genotype is sensitive to them. The PSP can last
between 2 and 200 days in extreme cases (Yoshida 1981). The PSP ends with panicle initiation: The apical
meristel stops initiating leaves and instead initiates phytomers constituting the panicle.
The reproductive stage starts at the panicle initiation when the panicle begins to develop inside
the sheath, and it ends with anthesis. During the reproductive phase, the panicle goes through
differentiation (successive differentiation of neck node, rachis and branches, spikelets, and pollen) and
stem elongation (internode elongation), followed by heading (panicle emergence from the sheath) and
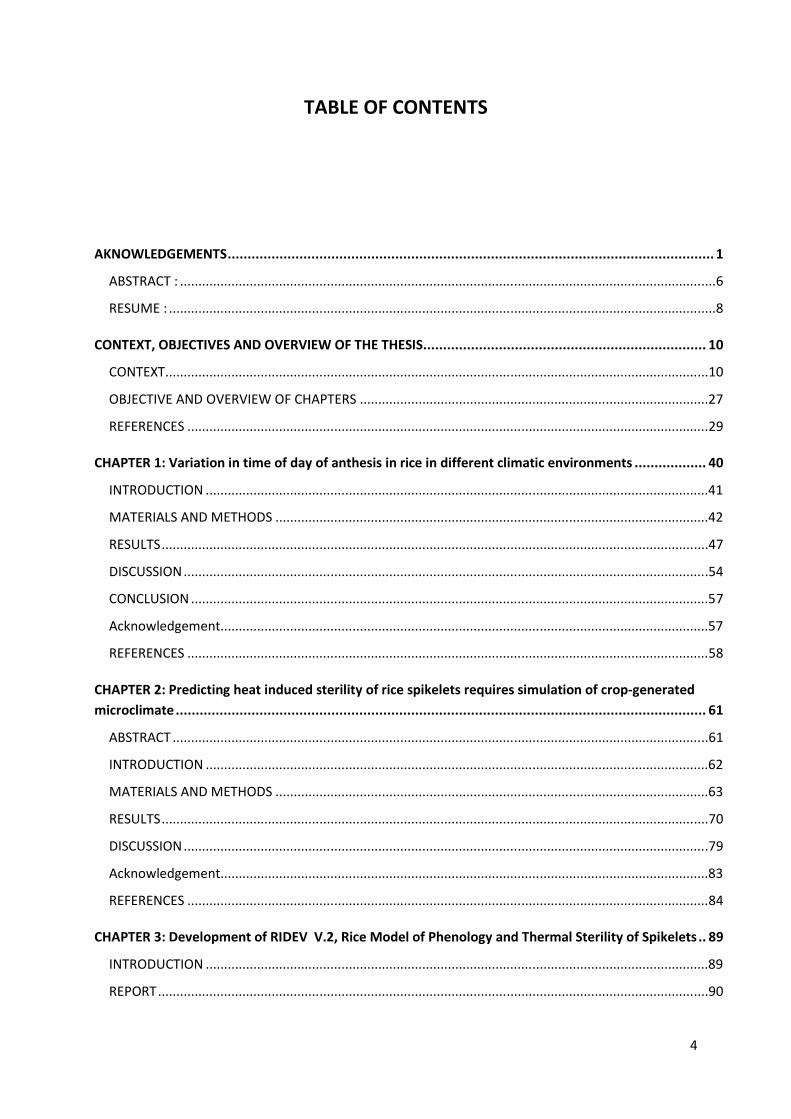
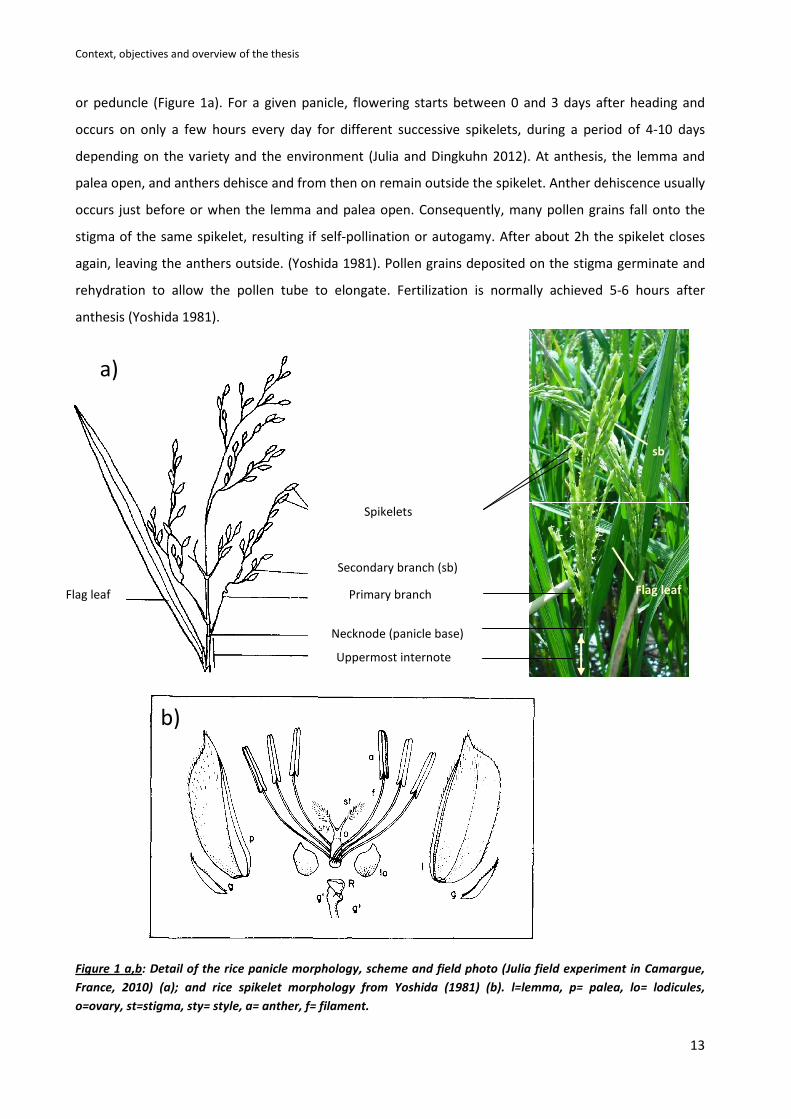
flowering or anthesis (opening of spikelets and mostly autogamous pollination). A panicle is composed of
a base marked by a bulge (neck node), a primary axis (rachis) that supports several primary and
secondary branches, holding pedicels at the end of which are the spikelets. The spikelets are composed of
two envelopes (lemma and palea) enclosing stigma and pistil (Figure 1 a,b).
The initiation of the panicle primordium starts about 1 month before heading (depending on the
environment), and the panicle differentiation ends when the pollen is fully matured (Yoshida 1981). At
that time the panicle is still enclosed in the sheath and located at the bottom of the canopy. It is then
pushed up to near the top of the canopy by internode elongation, particularly the uppermost internode
Context, objectives and overview of the thesis
13
or peduncle (Figure 1a). For a given panicle, flowering starts between 0 and 3 days after heading and
occurs on only a few hours every day for different successive spikelets, during a period of 4-10 days
depending on the variety and the environment (Julia and Dingkuhn 2012). At anthesis, the lemma and
palea open, and anthers dehisce and from then on remain outside the spikelet. Anther dehiscence usually
occurs just before or when the lemma and palea open. Consequently, many pollen grains fall onto the
stigma of the same spikelet, resulting if self-pollination or autogamy. After about 2h the spikelet closes
again, leaving the anthers outside. (Yoshida 1981). Pollen grains deposited on the stigma germinate and
rehydration to allow the pollen tube to elongate. Fertilization is normally achieved 5-6 hours after
anthesis (Yoshida 1981).
Figure 1 a,b: Detail of the rice panicle morphology, scheme and field photo (Julia field experiment in Camargue,
France, 2010) (a); and rice spikelet morphology from Yoshida (1981) (b). l=lemma, p= palea, lo= lodicules,
o=ovary, st=stigma, sty= style, a= anther, f= filament.
b)
Flag leaf
sb
a)
Uppermost internote
Necknode (panicle base)
Primary branch
Spikelets
Secondary branch (sb)
Flag leaf
Context, objectives and overview of the thesis
14
Rice crop performance under thermal stress
Rice is a tropical plant but has wide genetic diversity, allowing it to be cultivated between the
53°N parallel (in Russia) and the 40°S parallel (in Argentina) (Nguyen 2005), including diverse climates
ranging from tropical, subtropical humid or arid to temperate conditions. Rice is also grown at more than
2000 m altitude (e.g., Nepal) and under arid conditions if irrigated (e.g., Sahel region and Egypt). Some of
these climates (like temperate, subtropical or high-altitude) cause thermal stresses, particularly if cold or
heat spells coincide with sensitive phases of rice phenology, causing injury and yield loss. Along with
water-related constraints (drought or water scarcity for irrigation, and sometimes submergence; Bouman
et al. 2007), thermal stresses is a foremost abiotic constraint and largely determines where rice can be
cultivated and where not.
Thermal stress and climate change: actual situation and future implication for rice production
Chilling stress
Low temperature and cold damage are associated with rice grown under high latitude (temperate
climate), the cool season in arid-tropical environments and tropical high-altitude regions. Mid-altitude
mountainous zones are frequently cultivated with upland rainfed rice. This ecosystem is important for
local food security but of minor global economic importance (less than 5% of the world rice production
according to Seck et al., 2012). High-altitude rice is generally irrigated in terraced systems (e.g., Nepal,
Madagascar). Rice-growing areas in the temperate environments (latitude higher than 23°27’N or
23°27’S) represent about 20% of the world’s total rice area and are located in East Asia (China, Korea,
Japan), Central Asia, North America (USA), South America (Uruguay), Australia, Mediterranean North
Africa, and some parts of Europe (Italy, France, Spain). In these environments, mainly temperate-japonica
rices are grown under flooded conditions.
In Asia, cold damage is regularly reported in several countries like China, South Korea, Japan and
more recently in Vietnam and India. In the north-east provinces in China for example, cold damage due to
low temperatures occurs frequently and can reduce grain production by 30%. The estimated yield loss
due to low temperature is 3-5 million tons per year (Temperate Rice Research Consortium 2007).
In West Africa, cold is also a problem during the cold season for arid or semi arid areas like the Sahel
(Dingkuhn et al. 1995a,b). Rice double cropping calendars need to be carefully managed to avoid cold-
induced sterility (Dingkuhn, 1995), and changes in climatic patterns can increase the cold damage and
may lead to changes in cropping calendars and cropping systems (De Vries et al. 2011).
Context, objectives and overview of the thesis
15
Global warming and heat stress
During the last century, Asia, Africa and South America experienced a 0.7–1.0°C increase in
average temperature and climate models predict an increase of global temperature due to climate
change of 2°C to 4.5°C by the end of the 21st century (Salinger 2005; IPCC 2007). The temperature rises
are likely to be higher locally (particularly in vulnerable areas like subtropical regions) and heat stress may
become a major threat for staple crops like rice (IPCC 2007).
Higher temperatures can reduce rice yield and grain quality (Fitzgerald and Resurreccion 2009,
Kim et al. 2011) by altering phenology (Mitchell et al. 1993; Peng et al. 2004; Craufurd et al. 2009) and
inducing heat injury at during periods of extreme temperatures (Spiertz et al. 2006). Crop model
applications to the current climate change scenarios predict a global mean rice yield reduction by 41% by
the end of the century (Ceccarelli et al. 2010). In line with these simulations, Horie et al. (1996) predicted
that the yield reduction of current rice varieties in southern Japan would be up to 40% for future climate
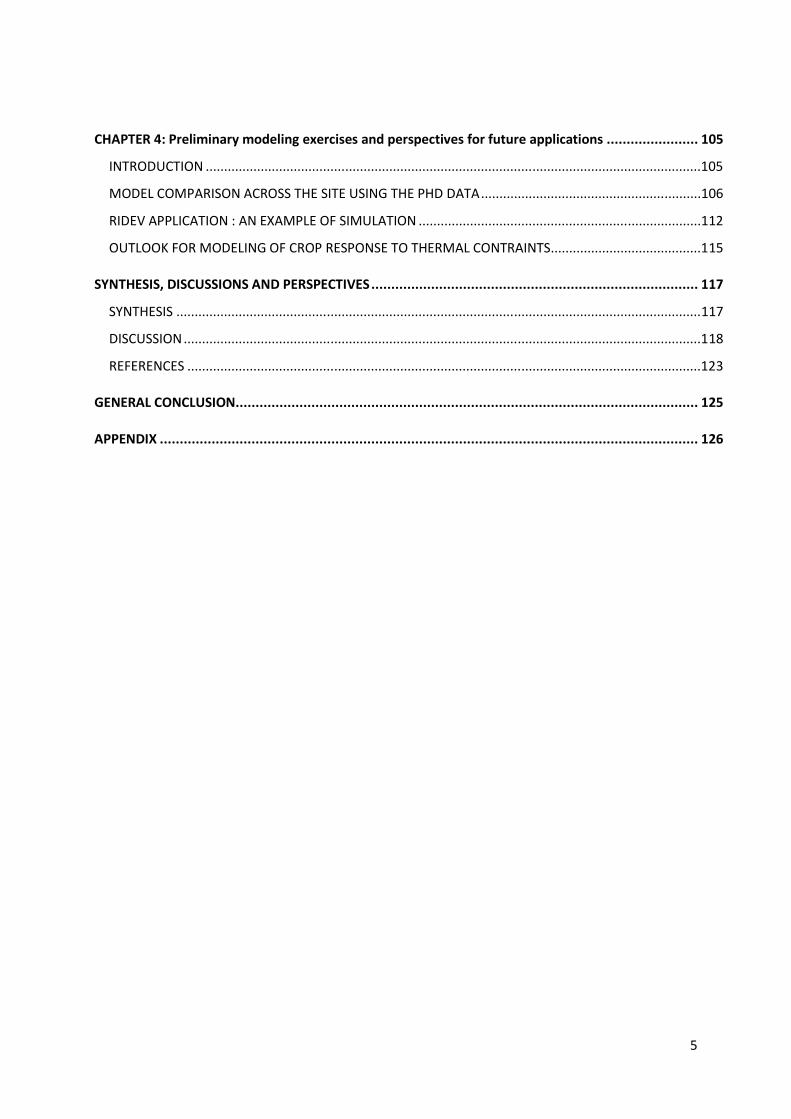
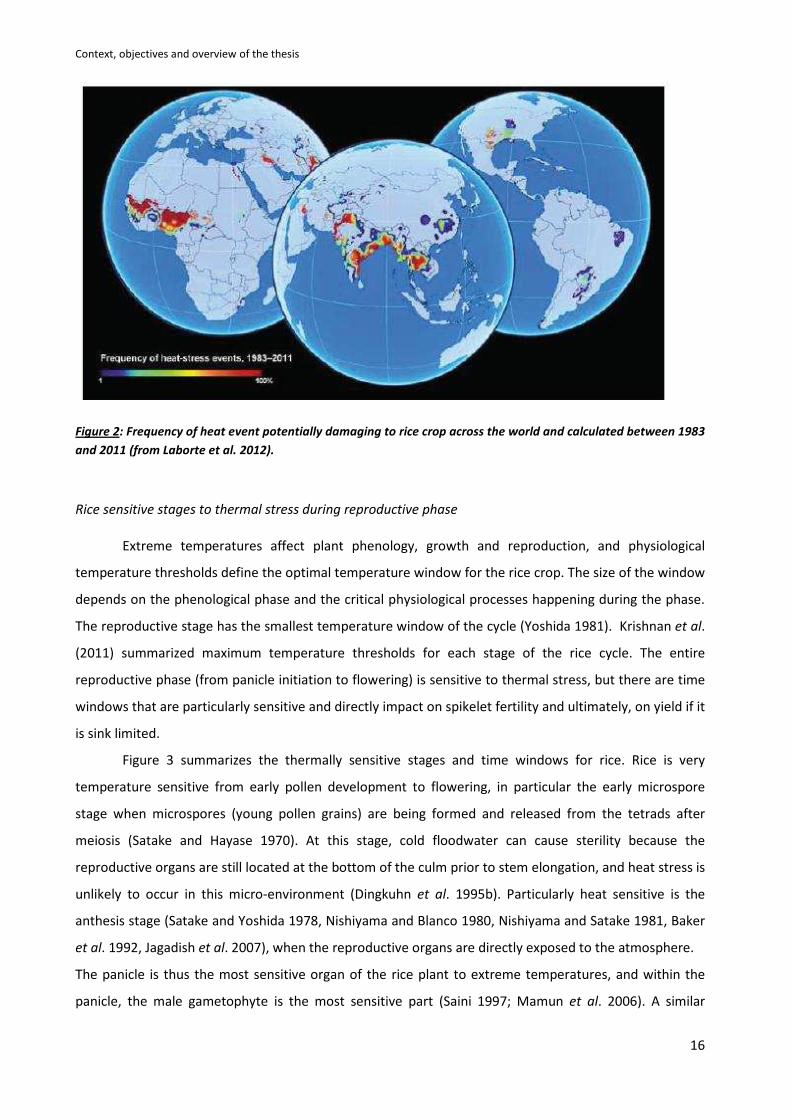
change scenarios. In a preliminary study using NASA Prediction of Worldwide Energy Resource (POWER),
meteorological station data, and air temperature thresholds found in the literature (Tair max=34°C for
flowering), Laborte et al. (2012) showed that many areas cultivated with rice in Asia and western Africa
have experienced frequent heat stress events during the sensitive reproductive stage between 1983 and
2011 (Figure 2). Indeed, high temperature and heat damage were regularly reported in many countries
including major rice producers like India (Mohandrass et al. 1995) or China (Fan et al. 1979, Huang et al.
2004, Tian et al. 2009, Tao et al. 2012). Heat affects rice based cropping systems from irrigated Sahelian
rice in West Africa (Dingkuhn and Sow 1997, Haefele et al. 2002) to irrigated systems in Japan (Hasegawa
et al. 2009, 2011).
The increase of mean temperature is the result of both higher minimum and maximum
temperatures. High temperatures at night or during the day act differently on the plant. Several studies
showed that higher night-time temperatures reduced rice yields (Kukla and Karl 1993, Ziska and Manalo
1996, Peng et al. 2004, Sheehy et al. 2005) by 10% for every 1 oC increase in minimum temperature (Peng
et al. 2004) and can also affect grain quality (Lanning et al. 2011). Kanno and Makino (2010) showed a
positive effect of low (but not stressful) night temperatures on yield.
Context, objectives and overview of the thesis
16
Figure 2: Frequency of heat event potentially damaging to rice crop across the world and calculated between 1983
and 2011 (from Laborte et al. 2012).
Rice sensitive stages to thermal stress during reproductive phase
Extreme temperatures affect plant phenology, growth and reproduction, and physiological
temperature thresholds define the optimal temperature window for the rice crop. The size of the window
depends on the phenological phase and the critical physiological processes happening during the phase.
The reproductive stage has the smallest temperature window of the cycle (Yoshida 1981). Krishnan et al.
(2011) summarized maximum temperature thresholds for each stage of the rice cycle. The entire
reproductive phase (from panicle initiation to flowering) is sensitive to thermal stress, but there are time
windows that are particularly sensitive and directly impact on spikelet fertility and ultimately, on yield if it
is sink limited.
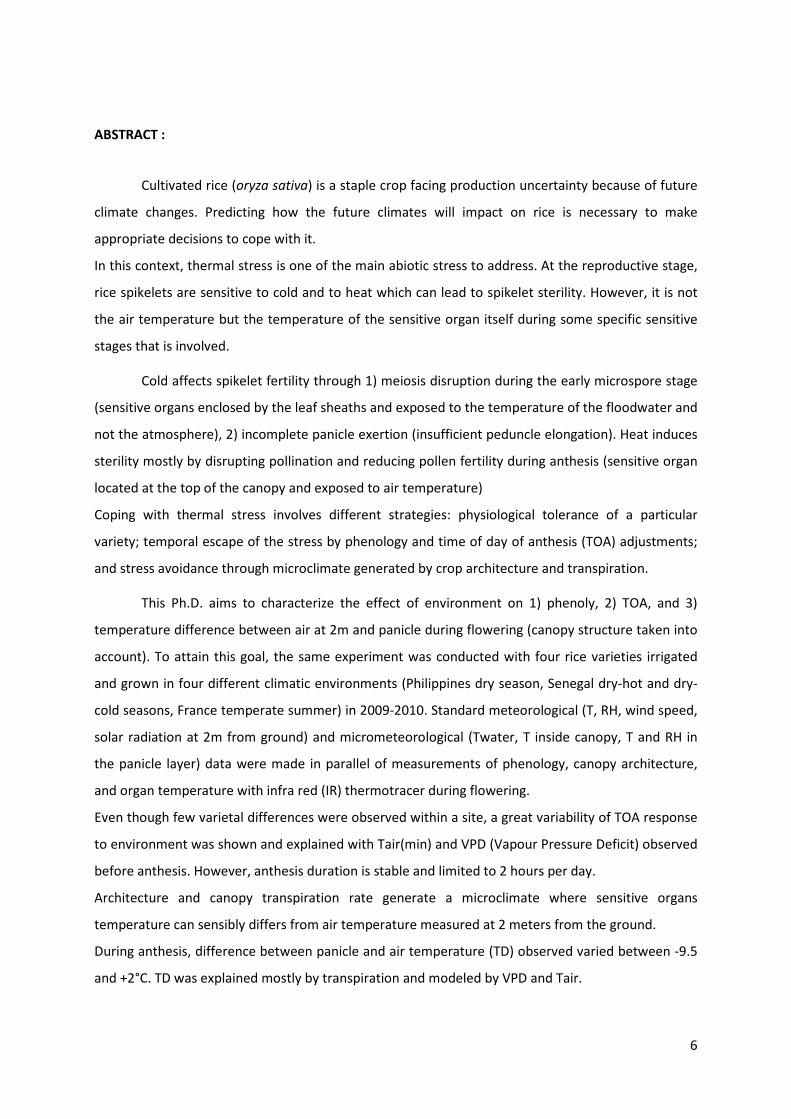
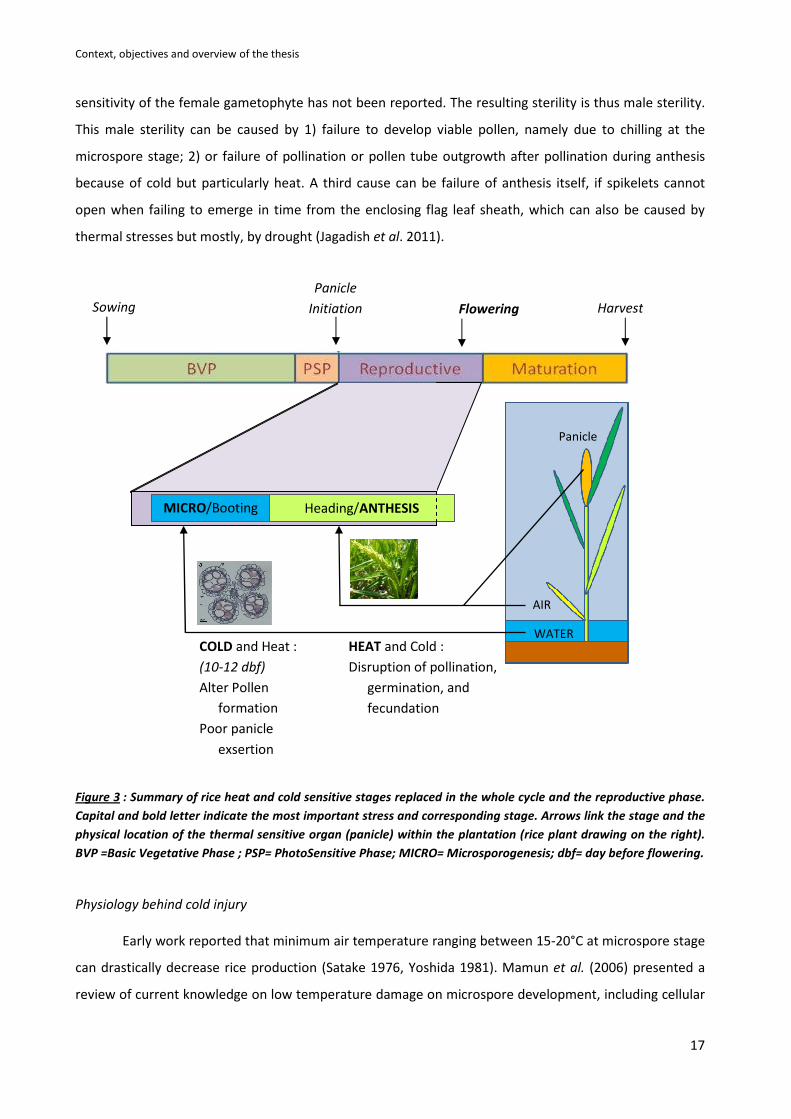
Figure 3 summarizes the thermally sensitive stages and time windows for rice. Rice is very
temperature sensitive from early pollen development to flowering, in particular the early microspore
stage when microspores (young pollen grains) are being formed and released from the tetrads after
meiosis (Satake and Hayase 1970). At this stage, cold floodwater can cause sterility because the
reproductive organs are still located at the bottom of the culm prior to stem elongation, and heat stress is
unlikely to occur in this micro-environment (Dingkuhn et al. 1995b). Particularly heat sensitive is the
anthesis stage (Satake and Yoshida 1978, Nishiyama and Blanco 1980, Nishiyama and Satake 1981, Baker
et al. 1992, Jagadish et al. 2007), when the reproductive organs are directly exposed to the atmosphere.
The panicle is thus the most sensitive organ of the rice plant to extreme temperatures, and within the
panicle, the male gametophyte is the most sensitive part (Saini 1997; Mamun et al. 2006). A similar
Context, objectives and overview of the thesis
17
sensitivity of the female gametophyte has not been reported. The resulting sterility is thus male sterility.
This male sterility can be caused by 1) failure to develop viable pollen, namely due to chilling at the
microspore stage; 2) or failure of pollination or pollen tube outgrowth after pollination during anthesis
because of cold but particularly heat. A third cause can be failure of anthesis itself, if spikelets cannot
open when failing to emerge in time from the enclosing flag leaf sheath, which can also be caused by
thermal stresses but mostly, by drought (Jagadish et al. 2011).
Figure 3 : Summary of rice heat and cold sensitive stages replaced in the whole cycle and the reproductive phase.
Capital and bold letter indicate the most important stress and corresponding stage. Arrows link the stage and the
physical location of the thermal sensitive organ (panicle) within the plantation (rice plant drawing on the right).
BVP =Basic Vegetative Phase ; PSP= PhotoSensitive Phase; MICRO= Microsporogenesis; dbf= day before flowering.
Physiology behind cold injury
Early work reported that minimum air temperature ranging between 15-20°C at microspore stage
can drastically decrease rice production (Satake 1976, Yoshida 1981). Mamun et al. (2006) presented a
review of current knowledge on low temperature damage on microspore development, including cellular
MICRO/Booting Heading/ANTHESIS
AIR
WATER
Panicle
COLD and Heat :
(10-12 dbf)
Alter Pollen
formation
Poor panicle
exsertion
HEAT and Cold :
Disruption of pollination,
germination, and
fecundation
Sowing Flowering Harvest
Panicle
Initiation

Context, objectives and overview of the thesis
18
scale observations. When exposed to cold at microspore stage, anther layers and microspores suffer from
distortions, deformations and lesions, (cf. Light microscope images figure 4). The microspore cell walls are
not well formed and show tapetal hypertrophy (cellular layer of anther envelope abnormally thick). Cold
treatment also induces excessive starch accumulation in the anther endothecium (inside cellular layer of
anther wall) and premature callose degradation around the developing microspores (Mamun et al. 2006).
Consequently, there is a physiological breakdown of regulatory and possibly metabolic processes at the
cellular level.
At the whole-plant scale, cold affects phenology (temporal organization of development including
flowering time) (Dingkuhn and Miezan 1995; Dingkuhn 1995). This extends the duration of the cycle and
in many situations increases the probability of chilling stress affecting the sensitive stages. Cold can also
inhibit organ elongation processes in general (stunting) and peduncle elongation in particular (Chung et
al. 1979, Hamdani et al. 1979) resulting in incomplete panicle exertion at heading. Spikelets remaining
enclosed in the sheath are mostly infertile.
All these stresses effects affect yield through sink limitation (number of fertile spikelets
developing into grains). Chilling effects on assimilate source capacity are generally less severe than those
on the sink. The earliest and latest stages of the plant cycle are most sensitive, resulting in either failure
of crop establishment or incomplete grain filling. These phenomena are not discussed here because they
are outside the scope of this thesis research.
Figure 4 a, b: Light microscope images of transverse sections of microsporangia showing overview of anther at
vacuolated stage from Mamun et al. (2006). (a) Anther growing in normal temperature comprise spherical
microspores and well-shaped anther cell layers. (b) Chilling stress drastically altered the shape and development
of the microspores and other cell layers. Ep= epidermis; en= endothecium; t= tapetum; mi= microspore.
Context, objectives and overview of the thesis
19
Genetics and breeding work on cold tolerance
At the molecular level, in response to cold, rice plants express a series of genes that may be
related to adaptive responses. Transcription factors (TF) play important roles in enhancing plant cold
tolerance and Wang et al. (2003) have identified a TF (OsbHLH1) involved in the cold signal-transduction
pathway. A recent study conducted at CIRAD demonstrated that the zink-finger protein coded by the SAP
network gene, acting as TF, may have a key role in abiotic stress tolerance including chilling (Ben Saad et
al., 2011). The ortholog of this gene from Aeluropus littoralis, a halophyte, was over-expressed in Nippon
Bare rice and rendered the plant highly tolerant to salinity, drought, chilling and oxidative stress, while
expressing a large number of resident genes known to be related to abiotic stress tolerance. Many other
genes are known to contribute to chilling tolerance in rice during vegetative growth, but little is still
known on the genetic control of the specific processes affected by chilling during reporoductive
development.
Cold is a threat at every stage of the cycle (most sensitive stage being microsporogenesis) and
improving cold tolerance in rice is very important in term of rice breeding. Degree of panicle exertion is
an important trait used for cold screening, tolerant varieties having a better panicle exertion than
sensitive ones (Nanda and Seshu 1979, Pandey and Gupta 1993). Cold tolerance at plant reproductive
stage is a complex trait controlled by many genes. Three regions of the rice genome have been identified
to have a direct link to cold tolerance (Temperate Rice Research Consortium, 2007). QTLs and genes have
been detected for cold tolerance traits. A common strategy in breeding for cold tolerance is to cross
japonica and indica type varieties to obtain cold tolerant varieties which maintain high yield, the yield
potential traits coming from the indica germplasm (Andaya et al. 2003, Ye et al. 2010, Saito et al. 2001,
2010).
In irrigated systems, water and crop management can also contribute to control cold injury.
Maintaining deep floodwater in plots reduces day-night temperature differences (increased system
inertia) and increases the minimum temperature, thus protecting the young panicle from cold stress at
microsporogenesis, especially under high N fertilization (Williams et al. 1994). At this stage, the sensitive
and developing panicle is located at the base of the plant (inside the sheath) and in the water.
Physiology of heat stress inducing spikelet sterility
At the biochemical level, abiotic stresses such as heat affect protein structure through unfolding
and misfolding (which can lead to protein denaturation or aggregation), and reduce enzyme activity
including Rubisco, the major enzyme involved in photosynthesis (Prasad et al., 2004). Heat also induces
membranes dysfunction (higher fluidity of membrane lipids, increased leakage) (Savchenko et al., 2002,
Falcone et al. 2004). Oxidative stress from the production of reactive oxygen species (ROS) in chloroplasts
Context, objectives and overview of the thesis
20
and mitochondria (Mohammed et al. 2009b) is involved in most physiological stresses including heat, and
is ultimately responsible for cell death following stress. In this respect, the study by Ben Saad (2011)
previously mentioned is of interest because the over-expression of the TF gene AlSAP caused tissue
tolerance to H2O2 in rice, along with increased general abiotic stress tolerance including chilling.
Antioxidant and ROS quenching capacity may thus also be an important component of heat tolerance in
rice.
Rice is relatively more tolerant to high temperatures during the vegetative phase (Yoshida et al.
1981, Prasad et al. 2006a) but highly susceptible during the reproductive phase, particularly at flowering
stage and during anthesis (Matsui et al. 2001, Jagadish et al.2008). Many studies have been done in
controlled environments and they have shown that maximal (or day-time) temperatures above 34ºC
(Satake and Yoshida, 1978; Jagadish et al., 2007) or 35ºC (Matsui et al., 2001) during anthesis induce
spikelet sterility. The stigma, however, is tolerant to heat (Yoshida et al. 1981), but high temperatures
during rice booting and flowering cause spikelet sterility by reducing the number and the quality of pollen
grains produced (Shimazaki et al. 1964, Takeoka et al. 1992, Sage et al. 2008, Endo et al. 2009) or
released (Prasad et al. 2006a) by disrupting anther dehiscence (Matsui et al. 2000; Jagadish et al. 2010),
pollination (Prasad et al. 2006a, Jagadish et al. 2010), and pollen germination (Endo et al. 2009, Jagadish
et al. 2010).
Heat stress at flowering induces a chain reaction by inhibiting the swelling of pollen grains
(rehydration) and also limits anther dehiscence and grains interception by stigmas. The number of pollen
grains intercepted by the stigma is correlated with grain fertility and Jagadish et al. (2009) showed that 10
to 20 pollen grains need to be intercepted by the stigma to ensure successful pollen germination.
Consequently, genotypes producing much pollen have greater fertility.
Strategies to cope with heat stress
Rice strategies to deal with thermal stress (cold or heat) can be divided into two types: Avoidance
or escape processes which represent the adaptability to a genotype or cropping system through
minimizing the stress vector itself; and real physiological tolerance under exposure to the stress vector,
which is a genotypic characteristic and expressed at the tissue level.
Escaping or avoiding the stress
In terms of crop management, shifting planting dates to adapt the crop calendar to changing
climate patterns is an obvious possibility, but may be sometimes limited by the length of growing season
particularly in double or triple cropping systems (Dingkuhn, 1995; Nagarajan et al. 2010). Short duration
Context, objectives and overview of the thesis
21
varieties are a partial solution of this category. A frequent problem, however, is that heat spells are
unpredictable.
Work has been done to characterize the early heading and flowering traits (Jiang et al. 2007,
Takahashi et al. 2009), short duration carries a yield penalty which may be unacceptable in high-input,
intensified irrigated system where availability of water generates high yield potential (Jagadish et al.
2012). When shifting sowing dates and growing short cycle varieties are insufficient as solutions to heat,
genetic improvement is called for. There may be some scope for reducing the yield penalty of earliness,
for example. Probably more promising is advancing the time of day of anthesis (TOA). This trait was
characterized in both controlled (Ishimaru et al. 2010) and field experiments (Kobayashi et al. 2010, Julia
and Dingkuhn 2012) and early TOA varieties might in the future be developed by breeders.
Previous studies showed that canopy cooling can be an effective avoidance response to high temperature
under low relative humidity. No breeding efforts have been made to our knowledge in this area. Panicle
or spikelet temperature, and not air temperature, would be the reference in screening for adapted
germplasm in this respect (Weerakoon et al. 2008, Matsui et al. 2007). More attention should be paid to
crop architectural avoidance of heat stress affecting the panicle, and the possibility to combine good
panicle exertion with hiding it within the shade of the canopy. We found no references in the literature
on this issue, however.
Structural and physiological tolerance
Physiological tolerance is expressed under actual exposure of the plant or organ to heat stress
that cannot be escaped from or avoided. Tolerance can be intrinsic to the genotype (constitutive) or
acquired through a hardening process (inducible response). Among the structural traits involved in heat
tolerance are a greater production of viable pollen grains to ensure pollen germination and fecundation
(Prasad et al. 2005, Matsui et al. 2000; Jagadish et al. 2010), and a specific structure of anther allowing a
better dehiscence (Matsui et al. 2001, Matsui and Omasa 2002).
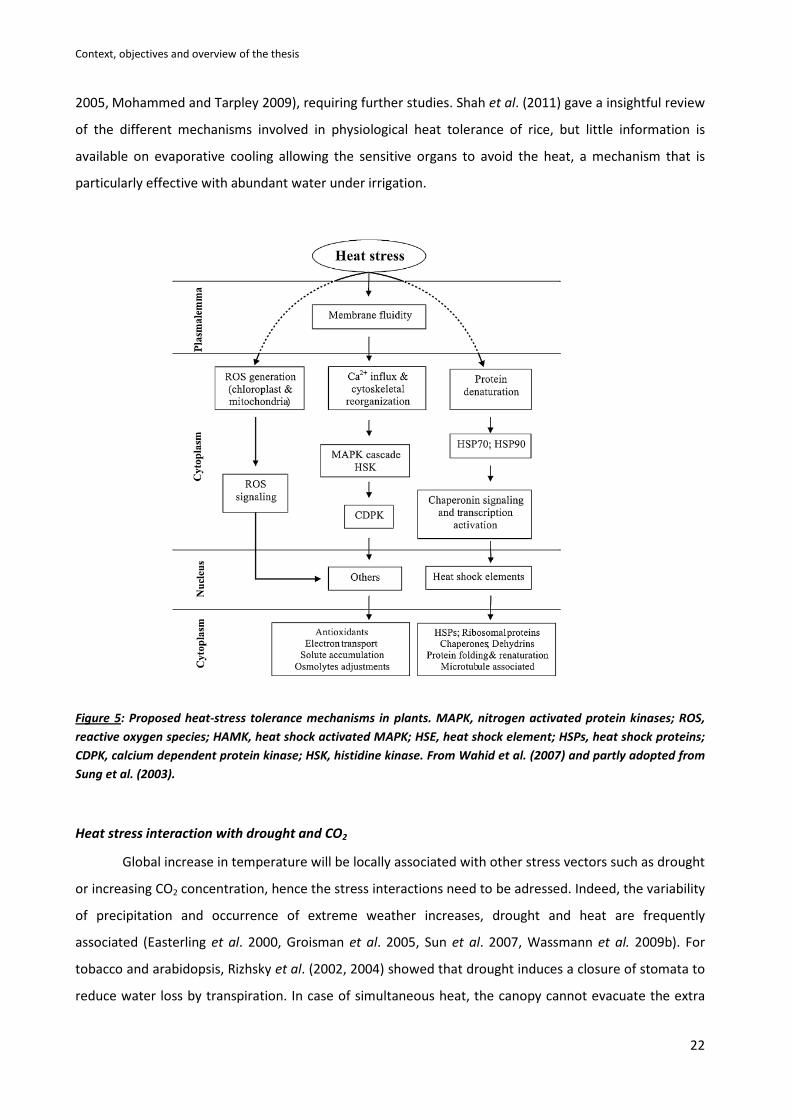
Physiological response to heat stress is linked to the production of diverse heat shock proteins (HSP)
(Hsieh et al. 1992, Sung et al. 2001, Koo et al. 2003) which induce high temperature tolerance to the plant
(Wahid et al. 2007) thru their molecular chaperone role in protein structure and degradation (Wang et al.
2004). (cf. summary in Figure 5 below).
In proteomic studies Jagadish et al. (2009, 2011) identified 18 different HSP in spikelets and
anthers of N22 (genetic group aus), the international heat tolerant check variety for rice. A great
variability in level of expression of HSP was observed in response to high temperature. However, HSP is
not the only protection to heat damage. Growth hormones like ethylene, salicylic acid and abscisic acid
seem to be involved, and act as antioxidants and provide for thermal membrane stability (Larkindale et al.
Context, objectives and overview of the thesis
22
2005, Mohammed and Tarpley 2009), requiring further studies. Shah et al. (2011) gave a insightful review
of the different mechanisms involved in physiological heat tolerance of rice, but little information is
available on evaporative cooling allowing the sensitive organs to avoid the heat, a mechanism that is
particularly effective with abundant water under irrigation.
Figure 5: Proposed heat-stress tolerance mechanisms in plants. MAPK, nitrogen activated protein kinases; ROS,
reactive oxygen species; HAMK, heat shock activated MAPK; HSE, heat shock element; HSPs, heat shock proteins;
CDPK, calcium dependent protein kinase; HSK, histidine kinase. From Wahid et al. (2007) and partly adopted from
Sung et al. (2003).
Heat stress interaction with drought and CO2
Global increase in temperature will be locally associated with other stress vectors such as drought
or increasing CO2 concentration, hence the stress interactions need to be adressed. Indeed, the variability
of precipitation and occurrence of extreme weather increases, drought and heat are frequently
associated (Easterling et al. 2000, Groisman et al. 2005, Sun et al. 2007, Wassmann et al. 2009b). For
tobacco and arabidopsis, Rizhsky et al. (2002, 2004) showed that drought induces a closure of stomata to
reduce water loss by transpiration. In case of simultaneous heat, the canopy cannot evacuate the extra
Context, objectives and overview of the thesis
23
heat by transpiration cooling, which increases the risk of heat damage. Response to heat stress
associated with drought has been recently addressed by Jagadish et al. (2011) using proteomics. Even if
combined stress did not involve the same molecular responses, it is clear that combined stress decreases
rice productivity more than individual stress.
Global warming is also characterized by increased greenhouse gases and particularly CO2. The
interaction between CO2 and temperature on the crop is less clear than the synergistic negative effect of
heat and drought. CO2 reduces photorespiration particularly for C3 plants like rice which potentially
enhances yield (Baker et al. 1990, 1992; Ziska and Teramura 1991). However, CO2 combined with heat
also induces a reduction in transpiration cooling which leads to an increase in canopy temperature
(Matsui et al. 2007) and thus may have a global negative effect on rice crop (Moya et al. 1998; Wassmann
et al. 2009a). From simulations based for north-west India, Lal et al. 1998 predicted that the positive
effect of elevated CO2 would be canceled for an increase in temperature of 2°C, and a 20% yield reduction
in case of water shortage in the same thermal and CO2 concentration conditions.
Combined stress effects are not simply the addition of two individual stresses and each couple of stress
represents as a new stress. Gene pyramiding for different stresses is a promising approach
using marker-assisted selection, for example in the case of submergence and salinity stress (Jagadish et
al. 2012).
Breeding for heat tolerance
Ziska et al. (1996) demonstrated genetic diversity in the response of rice yield to high CO2
concentration and high temperature for 17 cultivars in controlled environments. Heat stress response in
rice is a quantitative trait controlled by multiple genes having interactive effects. Sequencing of the full
rice genome (IRGSP 2005) and high resolution QTL mapping for several traits including heat (Ismail et al.
2007) helped the research. Rice genetic resources for tolerance to high temperature at flowering have
been identified in both indica and japonica groups and are being used as genetic donors (Matsui et al.
1997, Matsui et al. 2001, Prasad et al. 2006a), and morphological and molecular markers were developed
in order to accelerate breeding (Cao et al. 2003, Zhang et al. 2008, 2009, Xiao et al. 2010, Jagadish et al.
2009). A recent study (Ye et al. 2011) includes N22 (international heat tolerant control) × IR64 population
mapping. N22 is so far the most heat tolerant variety, but alternative donor materials need to be
identified because of the poor combining ability of N22. Ishimaru et al. (2010) recently demonstrated the
positive effect of introgressing the early morning flowering gene from Oryza officinalis into O. sativa to
increase spikelet fertility under heat. Jagadish et al. (2012) proposed to combine different molecular
techniques and to make use of the Global Rice Phenotyping Network of GRISP (Global Rice Science
Context, objectives and overview of the thesis
24
Partnership) using standard methods to enhance of the probability of gene discoveries for heat tolerance
and other stresses (i.e. drought and salinity).
As for most environmental stresses, a simple genetic or agronomic solution is unlikely to be satisfactory
and only the combination of genetic tolerance and avoidance with appropriate crop calendars and water
management will work for rice.
Identifying risk environments: importance of modeling organ temperature
Facing climate change: Modeling for identifying potentially risky weather patterns
At the end of the 1960’s, an important phenomenon equivalent to the industrial revolution and
called the green revolution completely changed the rice market until now. In the 50’s and 60’s, the
demand for increasing rice production was urgent and crucial to face the threat of famine mostly due to
the exponential population growth in some developing countries like India. Thanks to the availability of a
great germplasm collection, conventional breeding allowed IRRI to release more than 40 semi-dwarf high-
yielding varieties (some of them becoming globally adopted mega varieties), with high tillering ability,
erect leaves and lodging resistance that produced more grain per plants, and responded favourably to
fertilizers and irrigation (Hubbart et al. 2007, Paterson and Li 2011). Thanks to those mega rice varieties
(from the original ‘miracle rice’ variety IR8 to more recent IR64 and IR72), yields improved consistently in
Asia but less in Africa because of the greater diversity of cropping systems and other factors.
However, the positive impact of the green revolution is now declining as while population keeps
increasing. New solutions need to be sought which, in addition, have to work in a challenging climate
change context. To face the decline, different large international research programs have been initiated
like the Green Super Rice (founded by Bill and Melinda Gates Foundation, Green Super Rice 2007), IRRI-
Stress Tolerant Rice for Africa and South Asia (STRASA) and C4 Rice Project (Mitchell and Sheehy 2006,
Hibberd et al. 2008) now under the umbrella of GRISP involving three CGIAR centers and many advanced
research centers worldwide.
Temperature issues are prominent in this global collaborative context. However current modeling
tools for rice do not consider many of the physiological mechanisms involved in heat tolerance and
avoidance, thus requiring improved tools to accurately map out risk environments and the potential
impact new varieties might generate, and where.
In this context, a certain number of features of thermal stress need to be understood better. Warmer
temperatures are not always synonymous with yield loss, and spikelet sterility depends on other climatic
parameters as well.
For instance, a recent study on rice reported serious heat stress damage under moderately hot
(maximum Tair=35°C) and humid conditions in China (Tian et al., 2010) at flowering, whereas another
Context, objectives and overview of the thesis
25
study did not find any serious damage under extremely hot (maximum air T=40°C) and dry conditions in
Australia (Matsui et al., 2007). The role of humidity has been previously described for controlled
environments (Weerakoon et al. 2008, Yan et al. 2010) and those studies confirm the negative effects of
high humidity with increasing temperature. But there is a need to further characterize the link between
climatic parameters and heat stress damage in the field. The key parameter involved in heat damage is
not the air temperature itself, but the temperature of the sensitive organ (the panicle) at the precise time
of anthesis, which can differ sensibly from air temperature because of panicle transpiration cooling
(Yoshimoto et al. 2005, Prasad et al.2006a,b, Matsui et al. 2007, Jagadish et al. 2007, Weerakoon et al.
2008, Yan et al. 2008, 2010). On the basis of information on how climate translates into time of day of
flowering (TOA) and the panicle temperature at TOA, there is a need to identify high-risk climate profiles,
today and for future climate-change scenarios, to reduce the threat of rice yield loss due to heat. To
attain that goal, we need 1) a better comprehension of the effect of the climatic parameters on the
sensitive organ’s temperature during sensitive stages in the field, 2) a modeling approach to give better
prediction of potential yield loss in a given climatic environment. At the moment, no multi-site and field
study involving contrasting climate patterns is available to analyze rice sterility response to climate. Such
a study must imperatively take into account the microclimate generated by the crop itself.
Modeling of thermal stress and sterility: Current situation
Models can be process-based or statistical. Process-based models relate input to output variables
using knowledge of physical and physiological mechanisms (in the case of biological models), based on
previous research, and they generally require parameterization of many auxiliary parameters related to
the biological entity and the processes formalized. Statistical models empirically relate relevant input and
output variables using a sufficient number of observations to capture system response, but without
descending to the elemental process level. Statistical models have limited domain of validity beyond the
observed domain and thus tend to be inaccurate when used for extrapolation (Lobell et al. 2010), but
they provide a rapid solution and can be robust and accurate if broad variation of all relevant input
variables is available. There are three different methods used in statistical modeling: the time series
method (time series data from a single experimental site), the panel (variation in both time and site), and
the cross section (variation in site) model. All those method have strength and limits discussed by Lobell
and Burke (2009). In a more recent study Lobell et al 2010 tested the prediction power of the three
methods against a ‘perfect crop model’ (robust and well validated) on data from 200 different locations in
Africa. The yield responses to temperature, precipitation, and solar radiation were investigated and the
cross-section method model provided the most accurate predictions for temperature.
Context, objectives and overview of the thesis
26
An alternative consist in combining a mechanistic and statistical approach. Many crop models were built
in the past two decades but they are facing difficulties regarding the multiplicity of environments. The
prediction of the potential effects of climate change on rice yields is a particular challenge because it
involves new environments, in part not available yet for experimental study.
No biological model is entirely mechanistic because this would require descending to ever smaller scales.
Simplifications are introduced, and the parameters for such simplified algorithms are calibrated
empirically using experimental data and statistics – either on a reductionist basis for each individual
process or systemically by statistical parameter optimization against integrative observed variables such
as yield.
With regards to thermal response of rice spikelet sterility, the major available crop models follow
a very simple and probably inaccurate approach (e.g., ORYZA2000 (Bouman 2001), CERES/DSSAT (Jones et
al. 2003), SARRAH (Dingkuhn et al. 2003)). The panicle sink size on a per-area basis, corresponding to
spikelet number X potential grain weight, is dimensioned during the phenological phase corresponding to
panicle development (reproductive phase, from panicle initiation to flowering), as a function of growth
and assimilate partitioning processes. The resulting sink capacity is then down-sized according to stress
coefficients derived from environmental conditions during sensitive phases of panicle development. In
the case of heat stress, the maximum daily air temperature during the flowering period is used and the
sterility response calibrated according to estimated critical temperatures governing the response.
This simple approach has the weakness of not considering the microclimate generated by the crop,
including organ temperature. Dingkuhn et al. (1995b) introduced the simulation of floodwater
temperature for modeling of cold stress effects on spikelet sterility, which resulted in much improved
simulation of thermal stress effects for irrigated rice in the Sahel (Dingkuhn and Miezan, 1995; Dingkuhn,
1995). This also improved the simulation of phenology, which is temperature dependent and governs the
timing of temperature stress sensitive phases. Heat effects on spikelet sterility at flowering, however, was
still simulated with air temperatures as stress vector. The present research will lay the basis for
developing an improved version of RIDEV that fully considers microclimate and organ temperature.
More recently, the heat balance model for rice IM2PACT was developed at Tsukuba University in Japan
(Yoshimoto et al. 2011). This model, although not (yet) a full crop simulator, simulates canopy and panicle
temperature on the basis of climatic variables and some crop morphological variables. The research
generating IM2PACT model coincided with the present thesis research. It was not possible to fully
exchange data but a preliminary model comparison will be attempted further down.
Context, objectives and overview of the thesis
27
OBJECTIVE AND OVERVIEW OF CHAPTERS
Within the RISOCAS project (RISOCAS 2011), extensive panel type data were collected from
different environments in order to improve crop (rice, sorghum) models, particularly regarding thermal
responses of the crop. The ultimate aim of the project, which involved four PhD theses and partners
Hohenheim University, CIRAD, AfricaRice, IER of Mali and FOFIFA of Madagascar, was to 1) Identify
valuable traits for better adapted cultivars; 2) Extrapolate varietal responses and adaptation potentials
for different climate change scenarios; 3) Develop ideotype concepts for varietal selection; and 4)
Develop a basis for tactical and strategic decision making to adapt African cereal cropping systems to
climate change. The present PhD study furnished answers to specific questions, namely the microclimatic
basis of thermal response of rice spikelet sterility and its modeling. The thesis focused on the
reproductive phase and the flowering stage of rice, including the phenology that governs its timing and
the thermal micro-environment the sensitive organs are exposed to. It also included observations of the
relevant canopy properties during sensitive phases and the sterility observed on panicles at maturity.
This objective was realized by the generation and analysis of micro-meteorological and crop data
based on similar field experiments implemented in four contrasting climatic environments and using four
morphologically distinct rice varieties. At the core of the resulting data base are rice panicle temperatures
observed by IR imagery in the field, backed by the necessary simultaneous environment observations to
interpret them. The work concludes by integrating the results in a new version of the crop model RIDEV
specifically simulating rice phenology and thermal sterility. The aim is to subsequently incorporate RIDEV
into broadly used crop models such as ORYZA2000 (Bouman 2001) and the more detailed physiological
models EcoMeristem (Luquet et al. 2006) and SAMARA.
In the 1st chapter, we studied the phenology and the in particular the timing of the reproductive
phase and the flowering stage of irrigated rice, as well as the time of day of anthesis (TOA) in response to
the various climatic environments. Anthesis happens during a distinct time of day and this decides on
whether the panicle is exposed to heat stress or not. This chapter was therefore entitled “Variation in
time of day of anthesis in rice in different climatic environments”. The hypothesis of this sub-study was
that TOA dependes on genotype and environment and can be predicted on this basis. Chapter 1 has been
published in 2012 by the European Journal of Agronomy.
Chapter 2 focuses on the organ temperature (developing or exerted panicle) as a function of climatic
environment during the main thermally sensitive stages i.e. miscroporogenesis (main cold sensitive stage)
and anthesis (main heat sensitive stage), in order to predict organ temperature from crop and
environment data. This information was then to be linked to observed spikelet sterility on the same plots
at maturity. This second chapter named “Predicting heat induced sterility of rice spikelets requires
Context, objectives and overview of the thesis
28
simulation of crop-generated microclimate”, addresses the hypothesis that i) organ temperature can
strongly differ from the air temperature (classically measured at 2m from the ground), ii) the temperature
difference between the air and the organ can be explained and predicted from crop and climatic variables
across different environments, and iii) spikelet sterility can be better predicted by taking into account the
microclimate and the organ temperature, as compared to air temperature.
Chapter 3 presents the new RIDEV model developed on the basis of this thesis research, as a prototype.
This model was commissioned by AfricaRice and a 9-month extension of the thesis research was funded
for model development. A commented terminal report of this project is presented here, written by the
author of this thesis and the project leader, Dr. Michael Dingkuhn. The full source code of the model is
presented and commented.
The 4th chapter presents two modeling exercises, 1) a comparative simulation of observed panicle
temperature in different environments using a statistical model developed here (similar to RIDEV) and
IM2PACT, the heat balance model from Japan; and 2) an application of RIDEV to an independent set
phenology and spikelet sterility data.
Context, objectives and overview of the thesis
29
REFERENCES
Andaya, V.C., Mackill, D.J., 2003. QTLs conferring cold tolerance at the booting stage of rice using
recombinant inbred lines from a japonica x indica cross. Theoretical and Applied Genetics 106,
1084–1090.
Baker, J.T., Allen, L.H., Boote, K.J., 1990. Growth and yield responses of rice to carbon dioxide
concentration. J. Agric. Sci. 115, 313–320.
Baker, J.T., Allen Jr., L.H., Boote, K.J., 1992. Effects of CO2 and temperature on growth and yield of rice. J.
Exp. Bot. 43, 959–964.
Ben Saad R., Fabre D., Mieulet D., Meynard D., Dingkuhn M., Al-Doss A., Guiderdoni E., Hassairi A. 2011.
Expression of the Aeluropus littoralis AlSAP gene in rice confers broad tolerance to abiotic
stresses through maintenance of photosynthesis. Plant, Cell and Environment 35, 626–643.
Bouman, B. A. M., Kropff, M.J., Tuong T.P., Wopereis M.C.S., ten Berge, H.F.M., van Lax, H.H., 2001.
ORYZA2000: Modeling lowland rice. Los Baños, Philippines: International Rice Research Institute
(IRRI) and Wageningen, The Netherlands: Wageningen university and research center. 234p.
Cao L Y, Zhao J G, Zhan X D, Li D L, He L B, Cheng S H. 2003. Mapping QTLs for heat tolerance and
correlation between heat tolerance and photosynthetic rate in rice. Chinese J. Rice Sci, 17 (3):
223–227. (in Chinese with English abstract).
Ceccarelli, S., Grando, S., Maatougui, M., Michael, M., Slash, M., Haghparast, R., Rahmanian, M., Taheri,
A., Al-Yassin, A., Benbelkacem, A., Labdi, M., Mimoun, H. and Nachit,M., 2010. Plant breeding and
climate changes. Journal of Agricultural Science, Cambridge 148, 627–637.
Chung, G.S, 1979. The rice cold tolerance program in Korea. In: Report of a rice cold tolerance workshop.
Los Baños, Philippines: International Rice Research Institute (IRRI), pp. 7–19.
Craufurd, P.Q., Wheeler, T.R., 2009. Climate change and the flowering time of annual crops. J. Exp. Bot.
60, 2529-2539.
Daily, G., Dasgupta, P., Bolin, B., et al., 1998. Policy forum: Global food supply—Food production,
population growth, and the environment. Science 281, 1291–1292
De Vries, M., Leffelaar, P., Sakane, N., Bado, B., Giller, K., 2011. Adaptability of irrigated rice to
temperature change in sahelian environments. Experimental Agriculture 47, 69–87
Dingkuhn, M., K.M. Miezan. 1995. Climatic determinants of irrigated rice performance in the Sahel. II.
Validation of photothermal constants and characterization of genotypes. Agricultural Systems 48,
411-434.
Context, objectives and overview of the thesis
30
Dingkuhn, M. 1995. Climatic determinants of irrigated rice performance in the Sahel. III. Characterizing
environments by simulating the crop's photothermal responses. Agricultural Systems 48, 435-456.
Dingkuhn, M, Le Gal, P.Y., Poussin, J.C., 1995a. RIDEV, un modele de developpement du riz pour le choix
des varietes et des calendriers. In: Boivin, P., Dia, I., Lericollais, A., Poussin, J.C., Santoir, C.,
Dingkuhn, M., Sow, A., Samb, A., Diack, S., Asch, F., 1995b. Climatic determinants of irrigated rice
performance in the Sahel. I. Photothermal and microclimatic responses of flowering. Agirc. Syst.
48, 385–410.
Dingkuhn, M., A. Sow, A. Samb, S. Diack, F. Asch. 1995b. Climatic determinants of irrigated rice
performance in the Sahel. I. Photothermal and microclimatic responses of flowering. Agricultural
Systems 48, 385-410.
Dingkuhn, M., Sow, A., 1997. Potential yields of irrigated rice in the Sahel. In: Miezan, Wopereis, M.C.S.,
Dingkuhn, M., Deckers, J., Randolf, T.F., (Eds.), Irrigated Rice in the Sahel: Prospect for Sustainable
Development. WARDA, Bouake (Coote d’Ivoire), ISBN 92 9113 1091, pp. 361–379.
Dingkuhn, M., Baron, C., Bonnal, V., Maraux, F., Sarr, B., Sultan, B., Clopes, A., Forest, F., 2003. Decision-
support tools for rainfed crops in the Sahel at the plot and regional scales. In: Struif-Bontkes, T.E.,
Wopereis, M.C.S. (Eds.), A Practical Guide to Decision-support Tools for Agricultural Productivity
and Soil Fertility Enhancement in Sub-Saharan Africa, IFDC, CTA, pp.127–139.
Easterling, D.R., Meehl, G.A., Parmesan, C., Changnon, S.A., Karl, T.R., Mearns, L.O., 2000. Climate
extremes: Observations, modeling, and impacts. Science 289, 2068–2074
Endo, M., Tsuchiya, T., Hamada, K., Kawamura, S., Yano, K., Ohshima, M., Higashitani, A., Watanabe, M.
and Kawagishi-Kobayashi, M., 2009. High Temperatures Cause Male Sterility In Rice Plants With
Transcriptional Alterations During Pollen Development. Plant And Cell Physiology, 50, 1911-1922.
Falcone, D., Ogas, J., Somerville, C., 2004. Regulation of membrane fatty acid composition by temperature
in mutants of Arabidopsis with alterations in membrane lipid composition. BMC Plant Biology 4,
17.
Fan, G.T., 1979. The sterility of Nanyou 2 as a mid-season crop. Hubei Agricultural Sciences, 18:13-18.(
In Chinese with English abstract)
FAOSTAT, 2011. "http://faostat.fao.org/." Retrieved 09.2012.
Fitzgerald, M. A., and Resurreccion, A. P., 2009. Maintaining the yield of edible rice in a warming world.
Funct. Plant Biol. 36, 1037 – 1045
Green Super Rice, “www.thegsr.org”. Retrieved 09.2012.
Context, objectives and overview of the thesis
31
Groisman, P.Y., Knight, R.W., Easterling, D.R., Karl, T.R., Hegerl, G.C., Razuvaev, V., 2005. Trends in intense
precipitation in the climate record. J Clim 18, 1326–1350
Haefele, S. M., Wopereis, M. C. S. and Donovan, C., 2002. Farmers’ perceptions, practices and
performance in a Sahelian irrigated rice scheme. Experimental Agriculture 38, 197–210.
Hamdani, A.R., 1979. Low-temperature problems and cold tolerance research activities for rice in India.
In: Rice cold tolerance workshop report, Los Baños, Philippines: International Rice Research
Institute (IRRI), p. 39–48.
Hasegawa, T., Ishimaru, T., Kondo, M., Kuwagata, T., Yoshimoto, M., Fukuoka, M., 2011. Spikelet sterility
of rice observed in the record hot summer of 2007 and the factors associated with its variation.
Journal of Agricultural Meteorology 67, 225–232.
Hasegawa, T., Kuwagata, T., Nishimori, M., Ishigooka, Y., Murakami, M., Yoshimoto, M., Kondo, M.,
Ishimaru, T., Sawano, S., Masaki, Y., Matsuzaki, H., 2009. Recent warming trends and rice growth
and yield in Japan. In: Hasegawa, T., Sakai, H. (eds) Crop production under heat stress:
monitoring, impact assessment and adaptation. Proceedings of the MARCO symposium 2009 held
in Tsukuba, Japan, 5–9 October 2009. Tsukuba (Japan). National Institute for Agro-Environmental
Sciences (NIAES), pp 44–51.
Hibberd, J. M., Sheehy, J. E., Langdale, J. A., 2008. Using C4 Photosynthesis To Increase The Yield Of
Rice—Rationale And Feasibility. Current Opinion In Plant Biology 11, 228-231.
Horie, T., Matsui, T., Nakagawa, H., Omasa, K., 1996. Effect of elevated CO2 and global climate change on
rice yield in Japan. In: Omasa K., Kai K., Taoda H., Uchijima Z., Yoshino M., (Eds). Climate change
and plants in east Asia. Tokyo, p. 39–56.
Hsieh, M. H., Chen, J. T., JInn, T. L., Chen, Y. M., Lin C. Y., 1992. A class of soybean low molecular weight
heat shock proteins: immunological study and quantitation. Plant Physiology 99: 1279–1284.
Huang Y-D , Cao L-J , Wu L-Q ,Yan P ,Chen D-P, Yang A-Z. 2004. Investigation and analysis of heat damage
on rice at blossoming stage in Anhui Province in 2003. Journal of Anhui Agricultural University,
31, 385–388 (In Chinese with English abstract).
Hubbart, S., Peng, S., Horton, P., Chen, Y., Murchie, E. H. 2007. Trends In Leaf Photosynthesis In Historical
Rice Varieties Developed In The Philippines Since 1966. Journal Of Experimental Botany 58, 3429-
3438.
IPCC 2007. Summary For Policy Makers. In: Solomon, S., Qin, D., Manning, M., Marquis, M., AVeryt, K.,
Tignor, M. M. B., Miller, J.R., H. L. and Chen, Z. (Eds.) Climate Change 2007: The Physical Science
Basis. Geneva, Switzerland, Intergovernmental Panel On Climate Change.
Context, objectives and overview of the thesis
32
IRGSP (International Rice Genome Sequencing Project). 2005. The map-based sequence of the rice
genome. Nature 436: 793-800
IRRI, AfricaRice and CIAT, 2010. Global RIce Science Partnership (GRisP). Sustainable crop productivity
increase for global food security, a CGIAR Research Program on Rice-Based Production Systems.
CGIAR thematic area 3. pp.265.
Ishimaru, T., Hirabayashi, H., Ida, M., Takai, T., San-Oh, Y. A., Yoshinaga, S., Ando, I., Ogawa, T., Kondo, M.,
2010. A genetic resource for early-morning flowering trait of wild rice Oryza officinalis to mitigate
high temperature-induced spikelet sterility at anthesis. Ann. Bot. 106, 515 –520.
Ismail, A.M., Heuer, S., Thomson, M.J. and Wissuwa, M., 2007. Genetic and genomic approaches to
develop rice germplasm for problem soils. Plant Molecular Biology 65, 547–570.
Jagadish, S. V. K., Craufurd, P. Q. and Wheeler, T. R., 2007. High Temperature Stress And Spikelet Fertility
In Rice (Oryza Sativa L.). Journal Of Experimental Botany, 58, 1627–1635.
Jagadish, S.V.K., Craufurd, P.Q., Wheeler, T.R., 2008. Phenotyping Parents of Mapping Populations of Rice
for Heat Tolerance during Anthesis. Crop Science Vol. 48, pp. 1140-1146.
Jagadish, S. V. K., Muthurajan, R., Oane, R., Wheeler, T. R., Heuer, S., Bennett, J., Craufurd, P. Q., 2009.
Physiologicaland proteomic approaches to dissect reproductive stage heat tolerance in rice
(Oryza sativa L.). J. Exp. Bot. 61, 143–156
Jagadish, S. V. K., Cairns, J. E., Lafitte, R., Wheeler, T. R., Price, A. H., Craufurd, P. Q., 2010. Genetic
analysis of heat tolerance at anthesis in rice (Oryza sativa L.). Crop Sci. 50, 1–9.
Jagadish, S. V. K., R. Muthurajan, Z. W. Rang, R. Malo,S. Heuer, J. Bennett, and P. Q. Craufurd, 2011.
Spikelet proteomic response to combined water deficit and heat stress in rice (Oryza sativa cv.
N22). Rice 4, 1–11
Jagadish, S.V.K., Septiningsih, E.M., Kohli, A., Thomson, M.J., Ye, C., Redoña, E., Kumar, A., Gregorio, G.B.,
Wassmann, R., Ismail, A.M., Singh, R.K., 2012. Genetic Advances in Adapting Rice to a Rapidly
Changing Climate. Journal of Agronomy and Crop Science 198, 360–373.
Jiang, L., Xu, J., Wei, X., Wang, S., Tang, J., Zhai, H., Wan, J., 2007. The Inheritance of Early Heading in the
Rice Variety USSR5. Journal of Genetics and Genomics 34, 46–55.
Jones, J.W., Hoogenboom, G., Porter, C.H., Boote, K.J., Batchelor, W.D., Hunt, L.A., Wilkens, P.W., Singh,
U., Gijsman, A.J., Ritchie, J.T, 2003. The DSSAT cropping system model. European Journal of
Agronomy 18, 235–265
Julia, C. and Dingkuhn, M. 2012. Variation In Time Of Day Of Anthesis In Rice In Different Climatic
Environments. European Journal Of Agronomy, 43, 166–174.
Context, objectives and overview of the thesis
33
Kanno, K., Makino, A., 2010. Increased grain yield and biomass allocation in rice under cool night
temperature. Soil Science & Plant Nutrition 56, 412–417.
Kim, J., Shon, J., Lee, C. K., Yang, W., Yoon, Y., Yang, W. H., Kim, Y. G., Lee, B. W., 2011: Relationship
between grain filling duration and leaf senescence of temperate rice under hightemperature.
Field Crops Res. 112, 207–213
Kobayashi, K., Matsui, T., Yoshimoto, M., and Hasegawa, T., 2010: Effects of temperature, solar radiation,
and vapor-pressure deficit on flower opening time in rice. Plant Prod. Sci. 13, 21–28.
Koo, H.J., Xia, X., Hong, C.B., 2003. Genes and expression pattern of tobacco mitochondrial small heat
shock protein under high temperature stress. J. Plant Biol. 46, 204–10.
Krishnan, P., B. Ramakrishnan, K. Raja Reddy, and V. R. Reddy, 2011: High temperature effects on rice
growth, yield, and grain quality. Adv. Agron. 111, 89–190.
Kukla, G. and Karl, T. R., 1993. Nighttime warming and the green house effect. Environmental Science and
Technology 27, 1468–1474.
Lal, R., 2000. Soil management in the developing countries. Soil Science, 165, 57–72.
Laborte, A., Nelson, A., Jagadish, K., Aunario, J., Sparks, A, Ye, C., and Redoña, E., 2012. Rice feels the
heat. Rice Today Vol.11, No.3
Lobell, D.B., Burke, M.B. (Eds.), 2009. Climate Change and Food Security: Adapting Agriculture to a
Warmer World. Springer.
Lobell, D.B., Burke, M.B., 2010. On the use of statistical models to predict crop yield responses to climate
change. Agricultural and Forest Meteorology 150, 1443–1452.
Laborte, A., Nelson, A., Jagadish, K., Aunario, J., Sparks, A., Ye, C., and Redoña, E., 2012. Rice feels the
heat. Rice Today Vol.11, No.3.
Lal, M., Singh, K.K., Rathore, L., Srinivasan, G., Saseendran, S.A., 1998. Vulnerability of rice and wheat
yields in NW India to future changes in climate. Agric. Forest Meterol. 89, 101–114.
Lanning, S.B., Siebenmorgen, T.J., Counce, P.A., Ambardekar, A.A., Mauromoustakos, A., 2011. Extreme
night-time air temperatures in 2010 impact rice chalkiness and milling quality. Field Crops Res.
124, 132–136.
Larkindale, J., Hall, J. D., Knight, M.R. and Vierling, E., 2005. Heat stress phenotypes of Arabidopsis
mutants implicate multiple signaling pathways in the acquisition of thermotolerance. Plant
Physiology 138, 882–897.
Context, objectives and overview of the thesis
34
Luquet, D., Dingkuhn, M., Kim, H.K., Tambour, L., Clément-Vidal, A., 2006. EcoMeristem, a model of
morphogenesis and competition among sinks in rice. 1. Concept, validation and sensitivity
analysis. Functional Plant Biology 33, 309–323.
Macneish, R. S., and Libby J., 1995. Preliminary, reports of the Sino-American Jiangxi (PRC) origin of rice
agriculture project (SAJOR). El Paso: Centennial Museum, Univ of Texas at El Paso. Anthropology,
13.
Mamun, E.A., Alfred, S., Cantrill, L.C., Overall, R.L., Sutton, B.G., 2006. Effects of chilling on male
gametophyte development in rice. Cell Biol Int 30, 583–591.
Mitchell, R., Mitchell, V.J., Driscoll, S.P., Franklin, J., Lawlor, D.W., 1993. Effects of increased CO2
concentration and temperature on growth and yield of winter wheat at two levels of nitrogen
application. Plant Cell Environ 16, 521–529
Matsui, T., O. Namuco, L. H. Ziska, and T. Horie, 1997: Effectof high temperature and CO2 concentration
on spikelet sterility in Indica rice. Field Crops Res. 51, 213–219
Matsui, T., K. Omasa, and T. Horie, 2001: The differences in sterility due to high temperature during the
flowering period among japonica rice varieties. Plant Prod. Sci. 4, 90–93.
Matsui, T., and Omasa, K., 2002. Rice (Oryza sativa L.) cultivars tolerant to high temperature at flowering:
anther characteristics. Annals of Botany 89, 683–687.
Matsui, T., Kobayashi, K., Yoshimoto, M., Hasegawa, T., 2007. Stability of Rice Pollination in the Field
under Hot and Dry Conditions in the Riverina Region of New South Wales, Australia. Plant
Production Science Vol. 10, 57–63.
Mitchell, P. L., and Sheehy, J. E., 2006. Supercharging Rice Photosynthesis To Increase Yield. New
Phytologist, 171, 688–693.
Mohammed, A.R., and Tarpley, L., 2009. Impact of high nighttime temperature on respiration, membrane
stability, antioxidant capacity, and yield of rice plants. Crop Science 49, 313–322
Mohandrass, S., Kareem, A.A., Ranganathan, T.B. & Jeyaraman, S. 1995. Rice production in India under
the current and future climate. In R.B. Mathews, M.J. Kroff, D. Bachelet and H.H. van Laar, eds.
Modeling the impact of climate change on rice production in Asia, p. 165–181. United Kingdom,
CAB International.
Moya, T. B., Ziska, L. H., Namuco, O.S. and Olszyk, D., 1998. Growth dynamics and genotypic variation in
tropical, field-grown paddy rice (Oryza sativa L.) in response to increasing carbon dioxide and
temperature. Global Change Biology 4, 645–656.
Context, objectives and overview of the thesis
35
Muthurajan R, Shobbar ZS, Jagadish SV, Bruskiewich R, Ismail A, Leung H, Bennett J., 2011. Physiological
and proteomic responses of rice peduncles to drought stress. Molecular Biotechnology 48, 173–
82.
Nagarajan, S., S. V. K. Jagadish, A. S. H. Prasad, A. K. Thomar,A. Anand, M. Pal, and P. K. Agarwal, 2010:
Local climateaffects growth, yield, and grain quality of aromatic and non-aromatic rice in
northwestern India. Agric. Ecosyst. Environ.138, 274–281.
Nanda, J.S.; Seshu, D.V., 1979. Breeding strategy for cold-tolerant rices. In: Rice Cold Tolerance
Workshop, Los Baños, Report. Los Baños: International Rice Research Institute, p.91–99.
Nguyen, N.V., 2005. Global climate changes and rice food security (English) In: International Rice
Commission Newsletter (FAO) 54, 24–30.
Nishiyama, I.; Satake, T. 1981. High temperature damage in rice plants. Japanese Journal of Tropical
Agricriculture 25, 14–19.
Nishiyama I.; Blanco L. 1980. Avoidance of high temperature sterility by flower opening in the early
morning. Japanese Agricultural Resesearch 14, 116–117.
Paterson, A. H. and LI, Z.-K. 2011. Paleo-Green Revolution For Rice. Proceedings Of The National Academy
Of Sciences 108, 10931–10932.
Pandey, D.K., Gupta, H.S., 1993.Genetics of panicle exsertion in cold tolerant rice (Oryza sativa). Plant
Breeding 111, 82–85.
Peng, S., Huang, J., Sheehy, J. E., Laza, R. C., Visperas, R. M., Zhong, X., Centeno, G. S., Khush, G.S. and
Cassman, K.G., 2004. Rice yields decline with higher night temperature from global warming.
Proceedings of the National Academy of Sciences, USA 101, 9971–9975.
Prasad, P.V.V., K.J. Boote, J.C.V. Vu, and L.H. Allen, Jr., 2004. The carbohydrate metabolism enzymes
sucrose-P synthase and ADG-pyrophosphorylase in phaseolus bean leaves are up-regulated at
elevated growth carbon dioxide and temperature. Plant Sci. 166:1565–1573.Prasad, P.V.V., P.Q.
Craufurd, and R.J. Summerfield. 1999a. Sensitivity of peanut to timing of heat stress during
reproductive development. Crop Science. 39, 1352–1357
Prasad, P. V. V., Boote, K. J., Allen, L. H., Sheehy, J. E., Thomas, J.M.G., 2006a: Species, ecotype and
cultivar differences in spikelet fertility and harvest index of rice in response to high temperature
stress. Field Crops Res. 95, 398–411
Prasad, P. V. V., Boote, K. J., Allen, H., 2006b. Adverse high temperature effects on pollen viability, seed-
set, seed yield and harvest index of grain-sorghum [Sorghum bicolor (L.) Moench] are more
Context, objectives and overview of the thesis
36
severe at elevated carbon dioxide due to higher tissue temperatures. Agric. For. Meteorol. 139,
237–251.
Rizhsky, L., L. Hongjian, and R. Mittler, 2002: The combinedeffect of drought stress and heat shock on
gene expression in tobacco. Plant Physiol. 130, 1143–1151.
Rizhsky, L., H. Liang, J. Shuman, V. Shulaev, S. Davletova, andR. Mittler, 2004: When defense pathways
collide: the responseof Arabidopsis to a combination of drought and heat stress.Plant Physiol.
134, 1683–1696
RISOCAS. (2011). " https://risocas.uni-hohenheim.de/." Retrieved 09.2012.
Sage, T. L., Bagha, S., Sault, K., Li, A. and Chiu, G., 2008. Heat Stress Induces Autophagic Programmed Cell
Death Of Microspore Mother Cells And Uninucleate Microspores In Oryza Sativa (Var. Japonica).
In: BIOLOGISTS, A. S. O. P., Ed. Joint Annual Meeting Of The American Society Of Plant Biologists,
Merida, MEXICO. Plant Biology (Rockville), 130–131.
Saini, H.S., (1997) Effects of water stress on male gametophyte development in plants. Sex Plant Reprod
10, 67–73.
Saito, K., Miura, K., Nagano, K., Hayano-Saito, Y., Araki, H., Kato, A., 2001. Identification of two closely
linked quantitative trait loci for cold tolerance on chromosome 4 of rice and their association with
anther length. Theoretical and Applied Genetics 103, 862-868.
Saito, K., Hayano-Saito, Y., Kuroki, M., Sato, Y., 2010. Map-based cloning of the rice cold tolerance gene
Ctb1. Plant Science 179, 97-102.
Salinger, M., 2005. Climate variability and change: Past, present and future—An overview. Clim Change
70, 9–29
Satake, T., Hayase, H., 1970. Male sterility caused by cooling treatment at the young microspore stage in
rice plants. V. Estimation of pollen developmental stage and the most sensitive stage to coolness.
Proc Crop Sci Soc Jpn. 39, 468–473.
Satake, T., 1976. Determination of the most sensitive stage to sterile-type cool injury in rice plants.
Research Bulletin Hokkaido Natl. Agricultural Experiment Stn. 113, 1–44.
Satake, T.; Yoshida, S., 1978. High temperature-induced sterility in indica rice at flowering. Japanese
Journal of Crop Science 47, 6–17.
Savchenko, G.E., Klyuchareva, E.A., Abrabchik, L.M., Serdyuchenko, E.V., 2002. Effect of periodic heat
shock on the membrane system of etioplasts. Russ. J. Plant Physiol. 49, 349–359.
Context, objectives and overview of the thesis
37
Seck, S.M., 1995. Nianga, laboratoire de l’agriculture irriguee en moyenne vallee du Senegal, Editions de
l’ORSTOM, Colloques et Seminaires, Paris, pp.205–222.
Seck, P., Diagne, A., Mohanty, S., Wopereis, M., 2012. Crops that feed the world 7: Rice. Food Security 4,
7-24.
Shah, F., Huang, J., Cui, K., Nie, l., Shah, T., Chen C., Wang, K., Moa. 2011. Impact of high-temperature
stress on rice plant and its traits related to tolerance. Journal of Agricultural Science 149, 545–
556.
Sheehy, J. E., Elmido, A., Centeno, G. and Pablico, P., 2005. Searching for new plants for climate change.
Journal of Agricultural Meteorology 60, 463–468.
Shimazaki, Y., Satake, T., Watanabe, K. and Ito, N., 1964. Effect of day- and night-temperature
accompanied by shading treatment during the booting stage upon the induction of sterile
spikelets in rice plants. (Studies of cool weather injuries of rice plants in northern part of Japan.
IV.) [In Japanese, with English summary]. Research Bulletin of the Hokkaido National Agricultural
Experiment Station 83, 10–16.
Spiertz, J.H.J., Hamer, R.J., Xu, H., Primo-Martin, C., Don, C., Van der Putten, P.E.L., 2006. Heat stress in
wheat (Triticum aestivum L.): Effects on grain growth and quality traits. Euro J Agron 25, 89–95
Sun, Y., Solomon, S., Dai, A.G., Portmann, R.W., 2007. How often will it rain? J Clim 20, 4801–4818
Sung, D.Y., Vierling, E., Guy, C.L., 2001. Comprehensive expression profile analysis of the Arabidopsis
Hsp70 gene family. Plant Physiol. 126, 789–800.
Sung, D.-Y., Kaplan, F., Lee, K.-J., Guy, C.L., 2003. Acquired tolerance to temperature extremes. Trends
Plant Sci. 8, 179–187.
Takahashi, Y., Teshima, K. M., Yokoi, S., Innan, H., Shimamoto, K., 2009. Variations in Hd1 proteins, Hd3a
promoters, and Ehd1 expression levels contribute to diversity of flowering time in cultivated rice.
Proc Nqtl Acad Sci USA 106, 4555–4560.
Takeoka, Y., Al Mamun, A., Wada, T. Kaufman, P.B., 1992. Primary features of the effect of environmental
stress on rice spikelet morphogenesis. In Reproductive Adaptation of Rice to Environmental Stress
(Eds Y. Takeoka, A. Al Mamun, T. Wada, P. B. Kaufman), Tokyo, Japan: Japan Scientific Societies
Press/Elsevier. Developments in Crop Science 22, 113–141.
Tao, F., Zhang, S., Zhang, Z. 2012. Changes in rice disasters across China in recent decades and the
meteorological and agronomic causes. Regional Environmental Change 13, 1-17
Temperate Rice Research Consortium (TRRC), 2007. “http://www.irri.org/”. Retrieved 09.2012.
Context, objectives and overview of the thesis
38
Tian X, Luo H, Zhou H, Wu C. 2009. Research on heat stress of rice in China: progress and prospect. Chin.
Agric. Sci. Bull. 25, 166–168.
Tian, X., Luo, H., Zhou, 2009. Research on Heat Stress of Rice in China: Progress and Prospect. MARCO
Symposium, Tsukuba, Japan, Oct.6-9. Workshop 2 Crop Production under Heat Stress:
Monitoring, Impact Assessment and Adaptation.
Tian, X., Matsui, T., Li, S., Yoshimoto, M., Kobayasi, K., Hasegawa, T., 2010. Heat-Induced Floret Sterility of
Hybrid Rice (Oryza sativa L.) Cultivars under Humid and Low Wind Conditions in the Field of
Jianghan Basin, China. Plant Production Science 13, 243–251.
Wahid, A., Gelani, S., Ashraf, M., and Foolad, M.R., 2007. Heat tolerance in plants: an overview.
Environmental and Experimental Botany 61, 199–223.
Wang, W., Vinocur, B., Shoseyov, O., Altman, A., 2004. Role of plant heat-shock proteins and molecular
chaperones in the abiotic stress response. Trends Plant Sci 9, 244–52.
Wang, Y.J., Zhang, Z.G., He, X.J., Zhou, H.L., Wen, Y.X., Dai, J.X., Zhang, J.S., Chen, S.Y., 2003. A rice
transcription factor OsbHLH1 is involved in cold stress response. Theoretical and Applied Genetics
107, 1402–1409.
Wassmann, R., Jagadish, S. V. K., Heuer, S., Ismail, A., Redona, E., Serraj, R., Singh, R. K., Howell, G.,
Pathak, H., Sumfleth, K., 2009a. Climate change affecting rice production: the physiological and
agronomic basis for possible adaptation strategies. Advances in Agronomy 101, 59–122.
Wassmann, R., Jagadish, S.V.K., Sumfleth, K., Pathak, H., Howell, G., Ismail, A., 2009b. Regional
vulnerability of climate change impacts on Asian rice production and scope for adaptation. Adv
Agron. 102, 99–133.
Weerakoon, W. M. W., Maruyama, A., and Ohba, K., 2008: Impact of humidity on temperature-induced
grain sterility inrice (Oryza sativa L.). J. Agron. Crop Sci. 194, 135–140.
Wild, A., 2003. Soils, Land and Food: Managing the Land during the 21st Century, New York
Williams, R. L., and Angus, J. F., 1994. Deep floodwater protects high nitrogen rice crops from low-
temperature damage. Aust. J. Exp. Agric. 34, 927–932
Wopereis, MCS; Haefele, SM; Dingkuhn, M.; Sow, A. 2003. Decision support tools for irrgated rice-based
systems in the Sahel. In Eds Struif Bontkes TE, Wopereis MCS. A practical guide to decision-
support tools for agricultural productivity and soil fertility enhancement in sub-Saharan Africa.
IFDC and CTA, Wageningen, The Netherlands, 114–126.
Context, objectives and overview of the thesis
39
Xiao, Y., Y. Pan, L. Luo, G. Zhang, H. Deng, L. Dai, X. Liu, W.Tang, L. Chen, and G. L. Wang, 2010:
Quantitative trait loci associated with seed set under high temperature stress at theflowering
stage in rice. Euphytica 178, 331–338
Yan, C., Ding, Y.-f., Liu, Z.-h., Wang, Q.-s., Li, G.-h., He, Y., Wang, S.-h., 2008. Temperature Difference
Between the Air and Organs of Rice Plant and Its Relation to Spikelet Fertility. Agricultural
Sciences in China 7, 678-685.
Yan, C., Ding, Y., Wang, Q., Liu, Z., Li, G., Muhammad, I., Wang, S., 2010. The impact of relative humidity,
genotypes and fertilizer application rates on panicle, leaf temperature, fertility and seed setting of
rice. Journal of Agricultural Science, Cambridge 148, 329–339.
Ye, C., Fukai, S., Godwin, I. D., Koh, H., Reinke, R., Zhou, Y., Lambrides, C., Jiang, W., Snell, P. and Redona,
E., 2010. A QTL controlling low temperature induced spikelet sterility at booting stage in rice.
Euphytica 176, 291–301.
Ye, C., Argayoso, M. A., Redona, E. D. , Sierra, S. N., Laza, M. A., Dilla, C. J., Mo, Y., Thomson, M., Chin, J.,
De la Vina, C. B., Diaz, G.Q., Hernandez, J. E., 2012. Mapping QTL for heat tolerance at flowering
stage in rice using SNP markers. PlantBreeding 131, 33–41
Yoshida, S., 1981. Fundamentals of rice crop science. International Rice Research Institute (IRRI), DAPO
Box 7777, Manila Philippines, 269 p.
Yoshimoto, M., Oue, H., Takahashi, H., Kobayashi, K., 2005. The effects of FACE (free-air CO2 enrichment)
on temperatures and transpiration of rice panicles at flowering stage. Journal of Agricultural
Meteorology 60, 597–600.
Zhang, T., L. Yang, K. Jiang, M. Huang, Q. Sun, W. Chen, andJ. Zheng, 2008. QTL mapping for heat
tolerance of the tassel period of rice. Mol. Plant Breed. 6, 867–873.
Zhang, G., Chen, L., Xiao, G., Xiao, Y., Chen, X., Zhang, S., 2009. Bulked segregant analysis to detect QTL
related to heat tolerance in rice using SSR markers. Agric. Sci. Chin. 8, 482–487.
Ziska, L.H., Teramura, A.H., 1991. Intraspecific variation in the response of rice Oryza sativa L. to
increased CO2: photosynthetic, biomass and reproductive characteristics. Physiologia Plantarum
84, 269–274.
Ziska, L.H. and Manalo, P. A., 1996. Increasing night temperature can reduce seed set and potential yield
of tropical rice. Australian Journal of Plant Physiology 23, 791–794.
Chapter 1: Variation of TOA in rice in different climatic environments
40
CHAPTER 1:
Variation in time of day of anthesis in rice in different climatic
environments
Cécile Julia1, Michael Dingkuhn1,2*
1Centre International de Recherche Agronomique pour le Developpement (CIRAD), BIOS Department,
UMR AGAP, F-34398 Montpellier, France
2International Rice Research Institute (IRRI), Crop and Environment Science Division (CESD), DAPO
Box 7777, Metro Manila, Philippines
*Corresponding author
Accepted in European Journal of Agronomy (June 2012).
Keywords: Oryza sativa L., Time of day of flowering, Escape Thermal stress, Spikelet sterility,
Modeling
ABSTRACT
Thermal stress and in particular heat during anthesis causes sterility in rice inflorescences. Rice
spikelets open in the morning and close a few hours later. Genotypic variation in the time of day of
anthesis is considered an escape mechanism from thermal stress, but little is known on its
dependency on environmental conditions. One traditional, cold-tolerant rice cultivar and three
improved tropical rice cultivars were grown in four different climatic environments under flooded
conditions to study the environmental response of time of day of anthesis. The environments were
the cold-dry season and the hot-dry season in Senegal, the temperate summer in Southern France
and the dry season in the Philippines. The time of day when the first spikelets opened, a maximum of
spikelets were open and the last spikelets closed was observed daily on a population basis (2 m2
plots replicated 3 times). The time of these observations was expressed as hours after sunrise (hasr)
calculated from astronomic day length and the local time of solar noon. Aggregate flowering periods
were 4–10 d at panicle scale and 14–32 d at population scale. Within a day, onset of anthesis was
earliest in the Philippines (3.4 hasr) and latest in the cool season in Senegal (6.75 hasr), the other
Chapter 1: Variation of TOA in rice in different climatic environments
41
environments being intermediate. The duration from onset to end of anthesis varied between 1.82 h
in the Philippines and 2.77 h in France. Genotypic differences in time of anthesis and duration of
anthesis were small. Across all genotypes and environments, 80% of the variation of the time of
maximum anthesis could be explained with the mean minimum air temperature (Tmin) during the 7
d preceding any given anthesis event. Linear, multiple regression models determined for each
cultivar using Tmin and vapor pressure deficit (VPD) observations from the three tropical
environments explained 94% of variation of time of anthesis onset and end. Low Tmin thereby
delayed and low VPD advanced anthesis processes. Under the assumption that panicle temperature
during anthesis is indeed a major determinant of spikelet fertility in rice, it is concluded that the
sensitivity of time of day of anthesis to air temperature and humidity is an effective eco-physiological
adaptation of the rice crop. Prospects for improved modeling approaches for the prediction of
thermal sterility in rice are discussed.
INTRODUCTION
Rising temperatures caused by climate change will likely depress rice yields in many parts of
the world, according to pridictions using crop models (Baker et al., 1992; Sheehy et al., 2006a,b)). The
most important mechanism of damage caused by heat is ineffective pollination during anthesis,
which can be observed in the 35–40 ◦C temperature range. Exposure of panicles for a few hours
during flowering can induce spikelet sterility and thus, grain set (Satake and Yoshida, 1978;
Nishiyama and Blanco, 1980; Nishiyama and Satake, 1981; Baker et al., 1992).
Dingkuhn (1995) mapped irrigated rice environments in the Sahel for risks of thermal stresses
causing sterility using the phenological model RIDEV (Dingkuhn, 1997; Wopereis et al., 2003). Sterility
risks caused by either heat or chilling were a function of local climate, cultivar and cropping
calendars. Yield simulations backed by field experiments (Dingkuhn and Sow, 1997) confirmed that
thermal stresses are a dominant factor for potential rice yields in semi-arid tropical environments
such as the Sahel. These studies, however, did not take into account environment effects on time of
day of anthesis which were unknown.
Although flowering on a given rice panicle can be observed during 3–9 consecutive days, and
during even longer periods at population scale depending on synchronization of flowering among
tillers and plants, anthesis of a given spikelet happens only on one day during the morning, lasting
about 2 h (Yoshida, 1981; Sheehy et al., 2007). Rice is a mainly autogamous plant but requires
spikelets to open and anthers to dehiss for pollination. After the brief anthesis period, spikelets close
again but dehisced anthers remain outside the spikelet.
Chapter 1: Variation of TOA in rice in different climatic environments
42
The time of day of anthesis of rice is under genetic control. Observations in both field and
controlled environments indicated some diversity within cultivated Oryza sativa rice (Sheehy et al.,
2005; Jagadish et al., 2008) and much greater diversity among wild rices, which are a genetic source
of traits for early flowering time (Ishimaru et al., 2010). The latter authors demonstrated that
introgression of early-flowering traits is effective in reducing heat-induced spikelet sterility under
experimental conditions.
Little is known on environmental effects on time of day of flowering in rice. A recent field
study in Japan (Kobayasi et al., 2010) indicated that high air temperature (Ta) and solar radiation (Rs)
advance anthesis, and high atmospheric vapor pressure deficit (VPD) in the early morning delays
anthesis. Although these results were statistically highly significant, however, the three
environmental factors explained only 40% of the observed variation in flowering time. Kobayasi et al.
(2010) also reported differences in sensitivity among rice cultivars to Ta, Rs and VPD.
The present study aimed at quantifying climatic effects on the time and duration of anthesis
in irrigated rice crops, in order to enable better predictions of sterility risks with models. Four
cultivars were grown and observed in the field in four contrasting environments: the hot-dry season
in Senegal, the cool-dry season in Senegal, the temperate summer season in Camargue in France and
the dry season in the Philippines. The specific objective was to identify climatic predictor variables for
time of day of flowering and to establish a model of anthesis time that is valid across diverse climatic
environments.
MATERIALS AND METHODS
Experiment sites, design and management
Field experiments were conducted between January 2009 and July 2010 in 4 environments,
named hereafter Senegal hot-dry season, Senegal cool-dry season, France temperate summer and
Philippines dry season. In Senegal, the same field was used located on the Sahel research station of
the Africa Rice Center (ARC) at Ndiaye in the Senegal river delta (16◦20 N, 16◦26 W, 5 m asl). The soil
was a clay soil (Orthothionic Gleysol), containing 40–54% clay, 44–30% silt and 16% sand, with
pH(H2O) 6.5. The field in Fance was located on the research station of the French Center for Rice
(CFR) located in the Rhone delta (Camargue, 43◦70 N, 4◦56 E, 4 m asl). The soil was a sandy loam type
consisting of 15.8% clay, 46.5% silt and 37.8% sand, with pH(H2O) 8.2, constituting a 40–50 cm layer
of fluvial sediments covering deposited on a saline, acidsulphate Mangrove soil. In the Philippines,
the field was located in the lowland part of the experiment farm of the International Rice Research
Chapter 1: Variation of TOA in rice in different climatic environments
43
Institute (IRRI) (14◦16_N, 121◦25_E, 16 m asl). The soil was an Andaqueptic Haplaquoll composed of
58% clay, 33% silt and 9% sand, with pH(H2O) of 6.6.
Elemental plot size was 16 m² (France and Senegal) or 20 m2 (Philippines). In all cases, the
field was embedded in a large irrigated rice area. In all environments, the experiment was conducted
under fully irrigated flooded conditions until surface drainage at about 14 d after end of flowering.
Floodwater depth was maintained at 5–10 cm except during crop establishment, when floodwater
depth was adapted to seedling size.
A randomized complete block design with 3 replications (2 in France) was used. Crop
establishment differed among sites following standard practices for the respective stations: in the
Philippines and France, seedlings were sown and raised in seedling trays in the greenhouse, then 15-
d old plants (29 d in France) were manually transplanted into the wet field at a density of 25 hills m−²
(20 cm spacing), each hill having 2 plants. In Senegal, pre-germinated seed was directly, manually
dibbled onto the wet field using the same density and geometry as in the Philippines and France. At
all sites, inorganic fertilizer and crop protection inputs were used according to local standards for
high-input, fully protected systems. Weed control was manual, however, and conducted as needed
to keep plots weed free.
Sowing dates are provided in Table 1, along with flowering dates and flowering duration. The
cold-adapted cultivar Chomrong, which flowers extremely early under tropical conditions, was sown
later than the other cultivars in Senegal in order to reduce the time window of flowering
observations.
Genetic materials
Four O. sativa L. cultivars were in the experiment at all sites and seasons. Among them, 3
were improved, medium-duration, indicatype, semidwarf varieties including IR64 (international
check variety known to be well adapted to conditions in both Senegal and Philippines), IR72 (similar
to IR64 but having slightly longer duration and smaller flag leaves), and Sahel 108 (local check in
Senegal, characterized by tall erect flag leaves shading the panicle). The fourth cultivar was the
traditional, lowland-adapted japonica type Chomrong from Nepal, a short-duration cultivar that is
cold tolerant and adapted to the high altitudes. Chomrong builds a distinct canopy structure at
flowering with a high panicle layer located above the leaves due to long peduncles and pronounced
panicle exertion. The 4 cultivars were thus selected for their different crop architecture at flowering
stage and for different thermal adaptation. The choice of Chomrong as a japonica type was also
motivated by reports attributing earlier anthesis to this group (Imaki et al., 1987; Singh et al., 2006).
Seed for IR64 and Sahel 108 was obtained from the rice germplasm collection of CIRAD; for
Chapter 1: Variation of TOA in rice in different climatic environments
44
Chomrong from the CIRAD-FOFIFA rice breeding program in Antsirabe, Madagascar; and for IR72
from the IRRI germplasm bank in the Philippines.
Climate and micro-meteorological measurements
At each site and season, agro-meteorological measurements were continuously made at 2 m
above ground at the center of the experimental field during the reproductive and ripening periods of
the crops: March and April 2009 in the Philippines, August and September 2009 in France, and
January–March 2010 and May–June 2010 in Senegal. They were backed by data from standard
weather stations located on the same experimental station.
For each experiment the meteorological data including air temperature (T), relative humidity
(RH) and solar radiation (Rs) was measured in the middle of the plot where an agro-meteorological
station was set up for the entire duration of the experiments. The instruments were located at 2 m
from the ground, or approximately 1–1.5 m above the canopy. We used Campbell Inc. equipment
(UK): a MP100A Rotronic temperature and Relative Humidity sensor held in a naturally ventilated
radiation shield for the air temperature and humidity, and a A100R cup anemometer for the wind
speed. A CNR1 (Campbell Inc., UK) net radiometer was set up 30 cm above the canopy to measure
solar radiation (Rs) and net radiation (not used in this study). We recorded the data with a Campbell
CR1000 data logger every 5 s and average over 1 min for the entire periods of observations in the
field.
Daily potential evapotranspiration (PET) was calculated according to the FAO Irrigation and
Drainage Paper No 56 (Allen et al., 1998) and using the hourly average of Rs, T, RH and wind speed
measured in the field. Average daily vapor pressure deficit (VPD) was calculated from daily Tmin,
Tmax, RHmin, and RHmax using FAO standards (Allen et al., 1998) based on the following equation:
VPD � 1
100 �
°�� �� RHmax � °����� RHmin
2
where e◦(T) = 0.6108 exp 17.27T/(T + 237.3) is the saturated vapour pressure at T (in kPa). (RH and T
given in percent and in degree Celcius, repectively)
Time of day of anthesis observations
Measurements of time of day of anthesis (TOA) were done at the population scale on all
panicles on a 1.4 m × 1.4 m (49 hills) called the observation square. Therefore, the results include
observations made on panicles located at different positions in the panicle layer and confound main
culms with tillers. Every subplot was observed daily during the entire flowering period every 30 min
or less, from sunrise until anthesis was terminated on the last spikelets (about midday or early
Chapter 1: Variation of TOA in rice in different climatic environments
45
afternoon). On a given day, only panicles in the observation square that had attained at least 50%
heading (panicles halfway exerted or more) were considered. This was the stage at which anthesis
would start at the earliest, as previously verified for all genotypes and environments. Within this sub-
population of panicles, we defined as the onset of anthesis the time of day when at least 5 panicles in
the observation square had started anthesis (at least one opened spikelet visible per panicle), the
maximum of anthesis when all panicles of the sub-population had attained anthesis on at least one
spikelet, and the end of anthesis when all the panicles had terminated anthesis as indicated by
spikelet closure and droopiness and change of color of stamens. In addition, 10 panicles per plot
were marked and observed for the number of days elapsing from first to last anthesis events (except
Camargue).
Walking between plots can accelerate anthesis through physical stimulus. This was avoided
by maintaining a 2-row border for the observation square, and entering into the plot was strictly
avoided. All observations were therefore made from the inter-subplot space, with a maximal
distance of 1.2 m between observer and plant.
The TOA was expressed as hours after sunrise (hasr). Solar time of sunrise was calculated on
the basis of day length (DL), which was computed using the FAO method (Allen et al., 1998) as
follows:
�� �24
π arcos#$tan�&' �. tan��)�*
where Decli is the declination angle (in radians) between the rays of the Sun and the plane of the
Earth’s equator, and is a direct function of the date (in days after the spring equinox), Lat is the
latitude (in radians).
Local legal time (LT), which can substantially deviate from solar time depending on location
within a time zone, was converted into solar time.
Statistical analysis
Analyses of variance (ANOVA), correlation matrices and multiple, linear, stepwise regression
analyses were computed with StatBox Pro (Grimmer Soft) software embedded in Excel (Microsoft).

Chapter 1: Variation of TOA in rice in different climatic environments
46
Table 1. Dates of sowing, duration of flowering at the plant population and panicle scales, and duration from
sowing to maximum flowering for four rice genotypes in four environments. Experiments in Senegal and
Philippines had 3 replications, in France 2 replications. ANOVA was conducted within sites (lower-case letters
in annotated in main Table) and across sites (appended Table). Means within columns having common group
annotation are statistically not different (P>0.05) according to Tukey test. SEM indicated standard error of
mean of 3 replications (2 in France).
Site Genotype Sowing date Flowering duration (d) Sowing to flowering (d)
Population SEM Panicle SEM SEM
Senegal Chomrong 13/03/2010 19.7 b - 6.2 bc ± 0.1 64.3 a -
(hot-dry S108 24/02/2010 13.7 a ± 0.7 4.2 a(1)
± 0.1 88.3 bc ± 2.7
season) IR64 24/02/2010 13.0 a ± 0.0 6.4 bc ± 0.0 87.7 bc ± 2.0
IR72 24/02/2010 12.0 a ± 0.0 6.0 b ± 0.1 95.0 cd ± 0.0
Senegal Chomrong 10/11/2009 31.7 c ± 0.3 10.2 d ± 0.1 82.3 ef ± 0.9
(cool-dry S108 30/10/2009 14.0 a ± 0.0 7.1 c ± 0.1 103.0 bc ± 1.0
season) IR64 30/10/2009 14.0 a ± 0.0 6.8 bc ± 0.0 107.7 b ± 3.7
IR72 30/10/2009 15.0 ab ± 1.0 7.1 c ± 0.1 120.0 a ± 0.9
Philippines Chomrong 26/01/2009 14.0 a ± 0.0 - - 52.0 a ± 0.0
(dry S108 26/01/2009 13.0 a ± 0.0 4.5 a ± 0.1 68.0 b ± 0.0
season) IR64 26/01/2009 14.0 a ± 0.0 4.2 a ± 0.0 72.0 c ± 0.0
IR72 26/01/2009 14.0 a ± 0.0 4.0 a ± 0.0 76.0 d ± 0.0
France Chomrong 20/04/2009 17.0 a ± 0.0 - - 129.0 a ± 0.0
(temperate S108 20/04/2009 15.0 b ± 0.0 - - 126.0 a ± 0.0
summer) IR64 20/04/2009 15.0 b ± 0.0 - - 129.0 a ± 0.0
IR72 20/04/2009 15.0 b ± 0.0 - - 128.5 a ± 2.5
(1) The short flowering duration observed for this particular variety is explained by a short heading duration and an incomplete
panicle exertion (spikelets stuck in the sheath) compared to other varieties which fully completed panicle exertion. For
Senegal Cool-dry season, all varieties had a longer heading duration and poor panicle exertion (except for cold tolerant
Chomrong) due to low temperatures at heading and at microspore stages.
Flowering duration (Population) Sowing to flowering (d)
ANOVA
Mean Group Mean Group
Site France 15.5 A 128.5 A
Senegal HDS 14.5 C 84.4 B
Senegal CDS 18.7 B 103.2 C
Philippines 13.8 C 67.0 D
Genotype Chomrong 20.5 A 82.5 A
IR72 14.0 B 104.9 B
IR64 14.0 B 99.2 C
Sahel 108 13.9 B 96.4 C
Chapter 1: Variation of TOA in rice in different climatic environments
47
RESULTS
Time and duration of flowering at the population scale
Duration from sowing to onset of flowering (Table 1) was shortest in the Philippines, longest
in France and intermediate in Senegal. Chomrong had the shortest duration to flowering in all
environments except France, where its duration was similar to that of the other genotypes.
Onset of flowering was observed between 17 and 29 May in the hot-dry season in Senegal,
between 29 January and 26 February in the cool-dry season in Senegal, between 18 March and 11
April in the Philippines and between 23 and 28 September in France. The duration of flowering at the
population scale was about two weeks due to variation in flowering among plants, panicles and
spikelet position within panicles. Only cv. Chomrong deviated from this observation in Senegal, with
a flowering period of 19 d in the hot-dry season and 32 d in the cool-dry season (Table 1). At the
scale of the individual panicle, the duration of flowering was much shorter, between 4 and 6 d in the
hot-dry season and between 7 and 10 d in the cool-dry season in Senegal (panicle-scale observations
were incomplete at the other sites). The difference between flowering duration at population and
panicle scale was due to de-synchronization among tillers and plants, which was large for Chomrong,
a traditional cold tolerant variety.
Environmental conditions during flowering
Assuming that time of day of anthesis is affected by environment at or shortly before
anthesis, we calculated both the conditions on the day of anthesis and the mean conditions during
the 7 d preceding anthesis. Since the 7-d means had a greater explanatory power for the observed
timing of anthesis than environmental conditions on single days (data not presented), we use here
only the 7-d means, based on calculations for each observation of anthesis and then averaged for the
genotype and site or season (Table 2).
Solar radiation was high and very similar among environments, at 20.1–22.1 MJ d−1.
Minimum air temperature was lowest in France and in the cool-dry season in Senegal (15.4–18.6 ◦C),
with minima on individual days dropping to 9 ◦C in France. Temperature minima (Tmin) were highest
and very constant in the Philippines (23.2–23.9 ◦C) and intermediate and also very constant in the
Senegalese hot-dry season (21.4–21.5 ◦C). Maximal air temperature (Tmax) was lowest in Camargue
(28.4–29.7 ◦C), highest in the Senegalese hot-dry season (31.6–35.6 ◦C), and intermediate in the
other environments.
Three weather parameters were used to characterize air humidity and atmospheric demand
for water vapor: mean daily relative humidity (RH), mean vapor pressure deficit (VPD) and potential
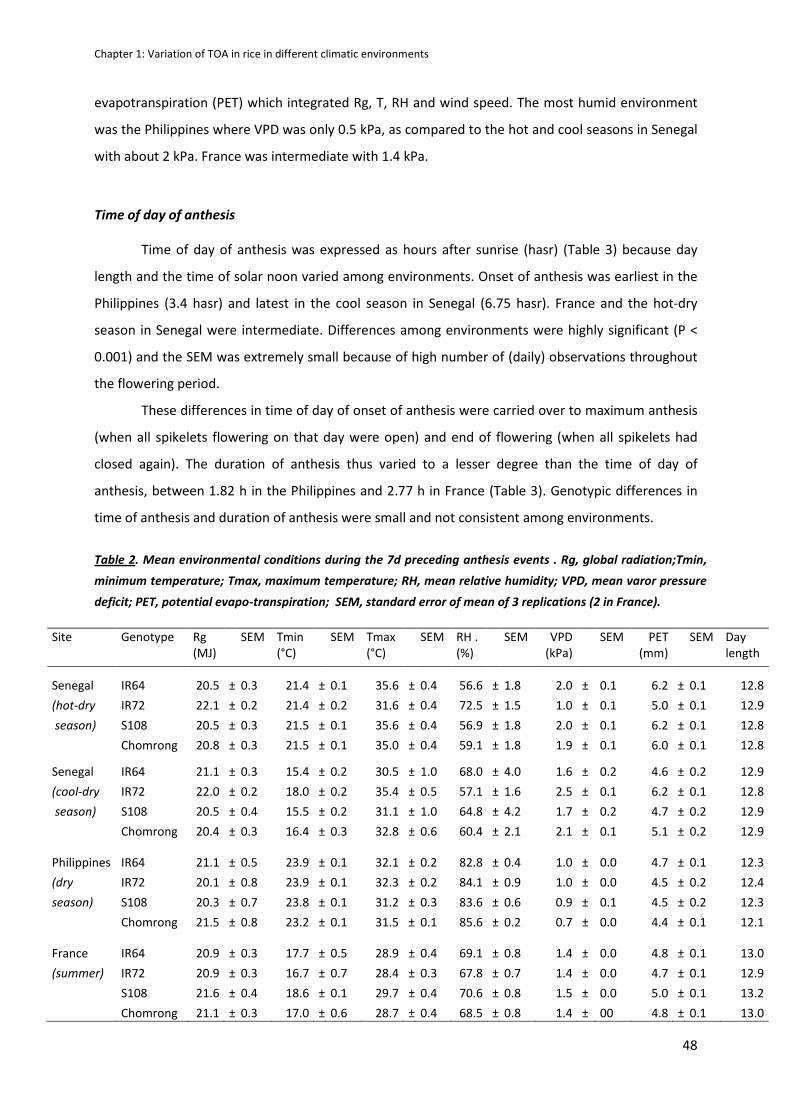
Chapter 1: Variation of TOA in rice in different climatic environments
48
evapotranspiration (PET) which integrated Rg, T, RH and wind speed. The most humid environment
was the Philippines where VPD was only 0.5 kPa, as compared to the hot and cool seasons in Senegal
with about 2 kPa. France was intermediate with 1.4 kPa.
Time of day of anthesis
Time of day of anthesis was expressed as hours after sunrise (hasr) (Table 3) because day
length and the time of solar noon varied among environments. Onset of anthesis was earliest in the
Philippines (3.4 hasr) and latest in the cool season in Senegal (6.75 hasr). France and the hot-dry
season in Senegal were intermediate. Differences among environments were highly significant (P <
0.001) and the SEM was extremely small because of high number of (daily) observations throughout
the flowering period.
These differences in time of day of onset of anthesis were carried over to maximum anthesis
(when all spikelets flowering on that day were open) and end of flowering (when all spikelets had
closed again). The duration of anthesis thus varied to a lesser degree than the time of day of
anthesis, between 1.82 h in the Philippines and 2.77 h in France (Table 3). Genotypic differences in
time of anthesis and duration of anthesis were small and not consistent among environments.
Table 2. Mean environmental conditions during the 7d preceding anthesis events . Rg, global radiation;Tmin,
minimum temperature; Tmax, maximum temperature; RH, mean relative humidity; VPD, mean varor pressure
deficit; PET, potential evapo-transpiration; SEM, standard error of mean of 3 replications (2 in France).
Site Genotype Rg
(MJ)
SEM Tmin
(°C)
SEM Tmax
(°C)
SEM RH .
(%)
SEM VPD
(kPa)
SEM PET
(mm)
SEM Day
length
Senegal IR64 20.5 ± 0.3 21.4 ± 0.1 35.6 ± 0.4 56.6 ± 1.8 2.0 ± 0.1 6.2 ± 0.1 12.8
(hot-dry IR72 22.1 ± 0.2 21.4 ± 0.2 31.6 ± 0.4 72.5 ± 1.5 1.0 ± 0.1 5.0 ± 0.1 12.9
season) S108 20.5 ± 0.3 21.5 ± 0.1 35.6 ± 0.4 56.9 ± 1.8 2.0 ± 0.1 6.2 ± 0.1 12.8
Chomrong 20.8 ± 0.3 21.5 ± 0.1 35.0 ± 0.4 59.1 ± 1.8 1.9 ± 0.1 6.0 ± 0.1 12.8
Senegal IR64 21.1 ± 0.3 15.4 ± 0.2 30.5 ± 1.0 68.0 ± 4.0 1.6 ± 0.2 4.6 ± 0.2 12.9
(cool-dry IR72 22.0 ± 0.2 18.0 ± 0.2 35.4 ± 0.5 57.1 ± 1.6 2.5 ± 0.1 6.2 ± 0.1 12.8
season) S108 20.5 ± 0.4 15.5 ± 0.2 31.1 ± 1.0 64.8 ± 4.2 1.7 ± 0.2 4.7 ± 0.2 12.9
Chomrong 20.4 ± 0.3 16.4 ± 0.3 32.8 ± 0.6 60.4 ± 2.1 2.1 ± 0.1 5.1 ± 0.2 12.9
Philippines IR64 21.1 ± 0.5 23.9 ± 0.1 32.1 ± 0.2 82.8 ± 0.4 1.0 ± 0.0 4.7 ± 0.1 12.3
(dry IR72 20.1 ± 0.8 23.9 ± 0.1 32.3 ± 0.2 84.1 ± 0.9 1.0 ± 0.0 4.5 ± 0.2 12.4
season) S108 20.3 ± 0.7 23.8 ± 0.1 31.2 ± 0.3 83.6 ± 0.6 0.9 ± 0.1 4.5 ± 0.2 12.3
Chomrong 21.5 ± 0.8 23.2 ± 0.1 31.5 ± 0.1 85.6 ± 0.2 0.7 ± 0.0 4.4 ± 0.1 12.1
France IR64 20.9 ± 0.3 17.7 ± 0.5 28.9 ± 0.4 69.1 ± 0.8 1.4 ± 0.0 4.8 ± 0.1 13.0
(summer) IR72 20.9 ± 0.3 16.7 ± 0.7 28.4 ± 0.3 67.8 ± 0.7 1.4 ± 0.0 4.7 ± 0.1 12.9
S108 21.6 ± 0.4 18.6 ± 0.1 29.7 ± 0.4 70.6 ± 0.8 1.5 ± 0.0 5.0 ± 0.1 13.2
Chomrong 21.1 ± 0.3 17.0 ± 0.6 28.7 ± 0.4 68.5 ± 0.8 1.4 ± 00 4.8 ± 0.1 13.0
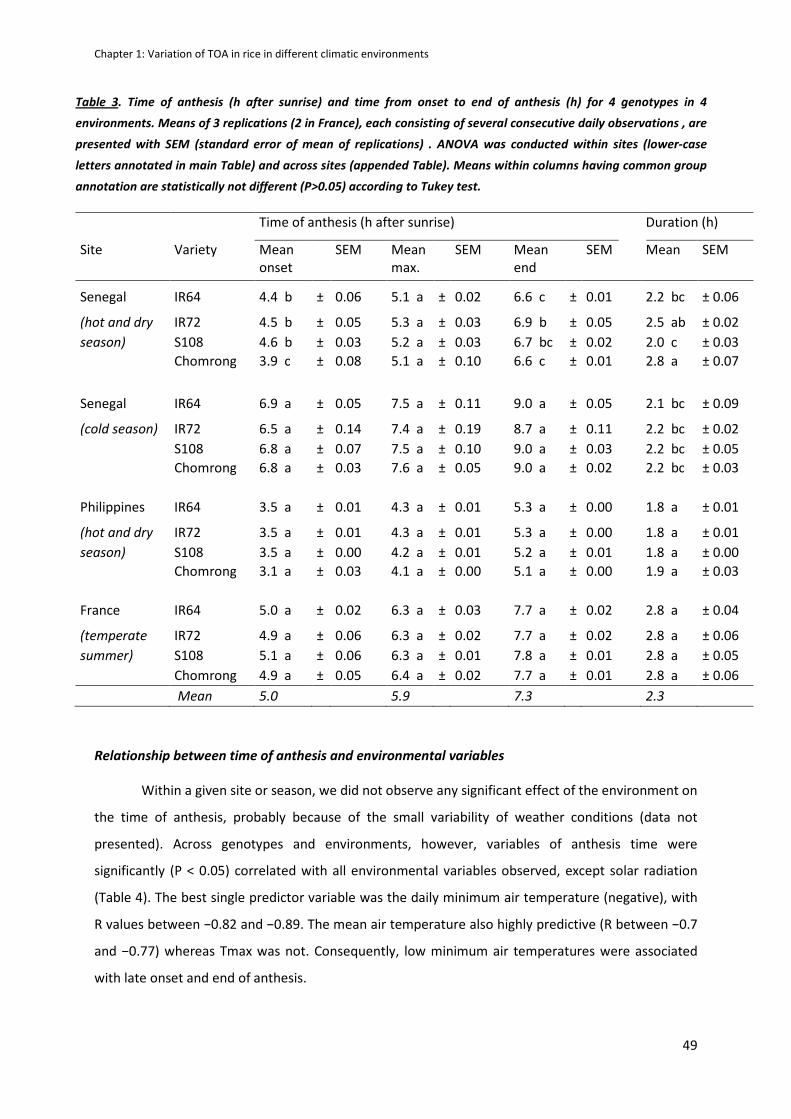
Chapter 1: Variation of TOA in rice in different climatic environments
49
Table 3. Time of anthesis (h after sunrise) and time from onset to end of anthesis (h) for 4 genotypes in 4
environments. Means of 3 replications (2 in France), each consisting of several consecutive daily observations , are
presented with SEM (standard error of mean of replications) . ANOVA was conducted within sites (lower-case
letters annotated in main Table) and across sites (appended Table). Means within columns having common group
annotation are statistically not different (P>0.05) according to Tukey test.
Time of anthesis (h after sunrise) Duration (h)
Site Variety Mean
onset
SEM Mean
max.
SEM Mean
end
SEM Mean SEM
Senegal IR64 4.4 b ± 0.06 5.1 a ± 0.02 6.6 c ± 0.01 2.2 bc ± 0.06
(hot and dry IR72 4.5 b ± 0.05 5.3 a ± 0.03 6.9 b ± 0.05 2.5 ab ± 0.02
season) S108 4.6 b ± 0.03 5.2 a ± 0.03 6.7 bc ± 0.02 2.0 c ± 0.03
Chomrong 3.9 c ± 0.08 5.1 a ± 0.10 6.6 c ± 0.01 2.8 a ± 0.07
Senegal IR64 6.9 a ± 0.05 7.5 a ± 0.11 9.0 a ± 0.05 2.1 bc ± 0.09
(cold season) IR72 6.5 a ± 0.14 7.4 a ± 0.19 8.7 a ± 0.11 2.2 bc ± 0.02
S108 6.8 a ± 0.07 7.5 a ± 0.10 9.0 a ± 0.03 2.2 bc ± 0.05
Chomrong 6.8 a ± 0.03 7.6 a ± 0.05 9.0 a ± 0.02 2.2 bc ± 0.03
Philippines IR64 3.5 a ± 0.01 4.3 a ± 0.01 5.3 a ± 0.00 1.8 a ± 0.01
(hot and dry IR72 3.5 a ± 0.01 4.3 a ± 0.01 5.3 a ± 0.00 1.8 a ± 0.01
season) S108 3.5 a ± 0.00 4.2 a ± 0.01 5.2 a ± 0.01 1.8 a ± 0.00
Chomrong 3.1 a ± 0.03 4.1 a ± 0.00 5.1 a ± 0.00 1.9 a ± 0.03
France IR64 5.0 a ± 0.02 6.3 a ± 0.03 7.7 a ± 0.02 2.8 a ± 0.04
(temperate IR72 4.9 a ± 0.06 6.3 a ± 0.02 7.7 a ± 0.02 2.8 a ± 0.06
summer) S108 5.1 a ± 0.06 6.3 a ± 0.01 7.8 a ± 0.01 2.8 a ± 0.05
Chomrong 4.9 a ± 0.05 6.4 a ± 0.02 7.7 a ± 0.01 2.8 a ± 0.06
Mean 5.0 5.9 7.3 2.3
Relationship between time of anthesis and environmental variables
Within a given site or season, we did not observe any significant effect of the environment on
the time of anthesis, probably because of the small variability of weather conditions (data not
presented). Across genotypes and environments, however, variables of anthesis time were
significantly (P < 0.05) correlated with all environmental variables observed, except solar radiation
(Table 4). The best single predictor variable was the daily minimum air temperature (negative), with
R values between −0.82 and −0.89. The mean air temperature also highly predictive (R between −0.7
and −0.77) whereas Tmax was not. Consequently, low minimum air temperatures were associated
with late onset and end of anthesis.
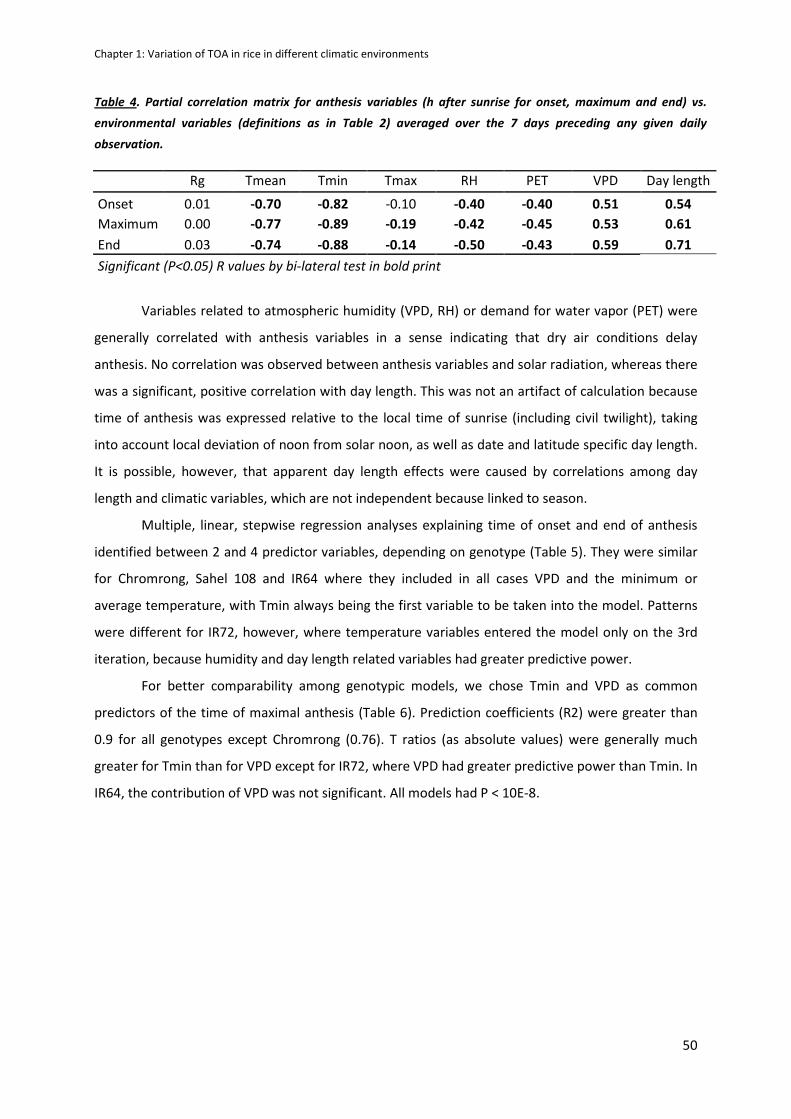
Chapter 1: Variation of TOA in rice in different climatic environments
50
Table 4. Partial correlation matrix for anthesis variables (h after sunrise for onset, maximum and end) vs.
environmental variables (definitions as in Table 2) averaged over the 7 days preceding any given daily
observation.
Rg Tmean Tmin Tmax RH PET VPD Day length
Onset 0.01 -0.70 -0.82 -0.10 -0.40 -0.40 0.51 0.54
Maximum 0.00 -0.77 -0.89 -0.19 -0.42 -0.45 0.53 0.61
End 0.03 -0.74 -0.88 -0.14 -0.50 -0.43 0.59 0.71
Significant (P<0.05) R values by bi-lateral test in bold print
Variables related to atmospheric humidity (VPD, RH) or demand for water vapor (PET) were
generally correlated with anthesis variables in a sense indicating that dry air conditions delay
anthesis. No correlation was observed between anthesis variables and solar radiation, whereas there
was a significant, positive correlation with day length. This was not an artifact of calculation because
time of anthesis was expressed relative to the local time of sunrise (including civil twilight), taking
into account local deviation of noon from solar noon, as well as date and latitude specific day length.
It is possible, however, that apparent day length effects were caused by correlations among day
length and climatic variables, which are not independent because linked to season.
Multiple, linear, stepwise regression analyses explaining time of onset and end of anthesis
identified between 2 and 4 predictor variables, depending on genotype (Table 5). They were similar
for Chromrong, Sahel 108 and IR64 where they included in all cases VPD and the minimum or
average temperature, with Tmin always being the first variable to be taken into the model. Patterns
were different for IR72, however, where temperature variables entered the model only on the 3rd
iteration, because humidity and day length related variables had greater predictive power.
For better comparability among genotypic models, we chose Tmin and VPD as common
predictors of the time of maximal anthesis (Table 6). Prediction coefficients (R2) were greater than
0.9 for all genotypes except Chromrong (0.76). T ratios (as absolute values) were generally much
greater for Tmin than for VPD except for IR72, where VPD had greater predictive power than Tmin. In
IR64, the contribution of VPD was not significant. All models had P < 10E-8.
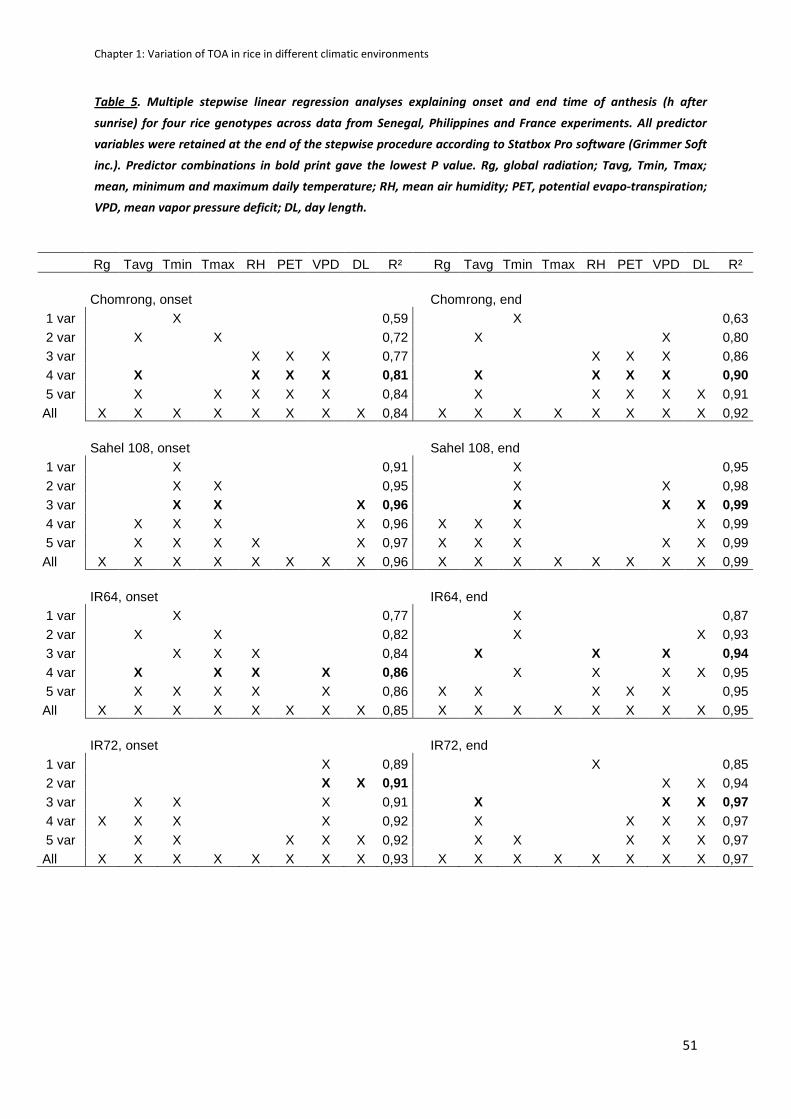
Chapter 1: Variation of TOA in rice in different climatic environments
51
Table 5. Multiple stepwise linear regression analyses explaining onset and end time of anthesis (h after
sunrise) for four rice genotypes across data from Senegal, Philippines and France experiments. All predictor
variables were retained at the end of the stepwise procedure according to Statbox Pro software (Grimmer Soft
inc.). Predictor combinations in bold print gave the lowest P value. Rg, global radiation; Tavg, Tmin, Tmax;
mean, minimum and maximum daily temperature; RH, mean air humidity; PET, potential evapo-transpiration;
VPD, mean vapor pressure deficit; DL, day length.
Rg Tavg Tmin Tmax RH PET VPD DL R² Rg Tavg Tmin Tmax RH PET VPD DL R²
Chomrong, onset Chomrong, end 1 var X 0,59 X 0,63 2 var X X 0,72 X X 0,80 3 var X X X 0,77 X X X 0,86 4 var X X X X 0,81 X X X X 0,90 5 var X X X X X 0,84 X X X X X 0,91 All X X X X X X X X 0,84 X X X X X X X X 0,92
Sahel 108, onset Sahel 108, end 1 var X 0,91 X 0,95 2 var X X 0,95 X X 0,98 3 var X X X 0,96 X X X 0,99 4 var X X X X 0,96 X X X X 0,99 5 var X X X X X 0,97 X X X X X 0,99 All X X X X X X X X 0,96 X X X X X X X X 0,99 IR64, onset IR64, end 1 var X 0,77 X 0,87 2 var X X 0,82 X X 0,93 3 var X X X 0,84 X X X 0,94 4 var X X X X 0,86 X X X X 0,95 5 var X X X X X 0,86 X X X X X 0,95 All X X X X X X X X 0,85 X X X X X X X X 0,95
IR72, onset IR72, end 1 var X 0,89 X 0,85 2 var X X 0,91 X X 0,94 3 var X X X 0,91 X X X 0,97 4 var X X X X 0,92 X X X X 0,97 5 var X X X X X 0,92 X X X X X 0,97 All X X X X X X X X 0,93 X X X X X X X X 0,97
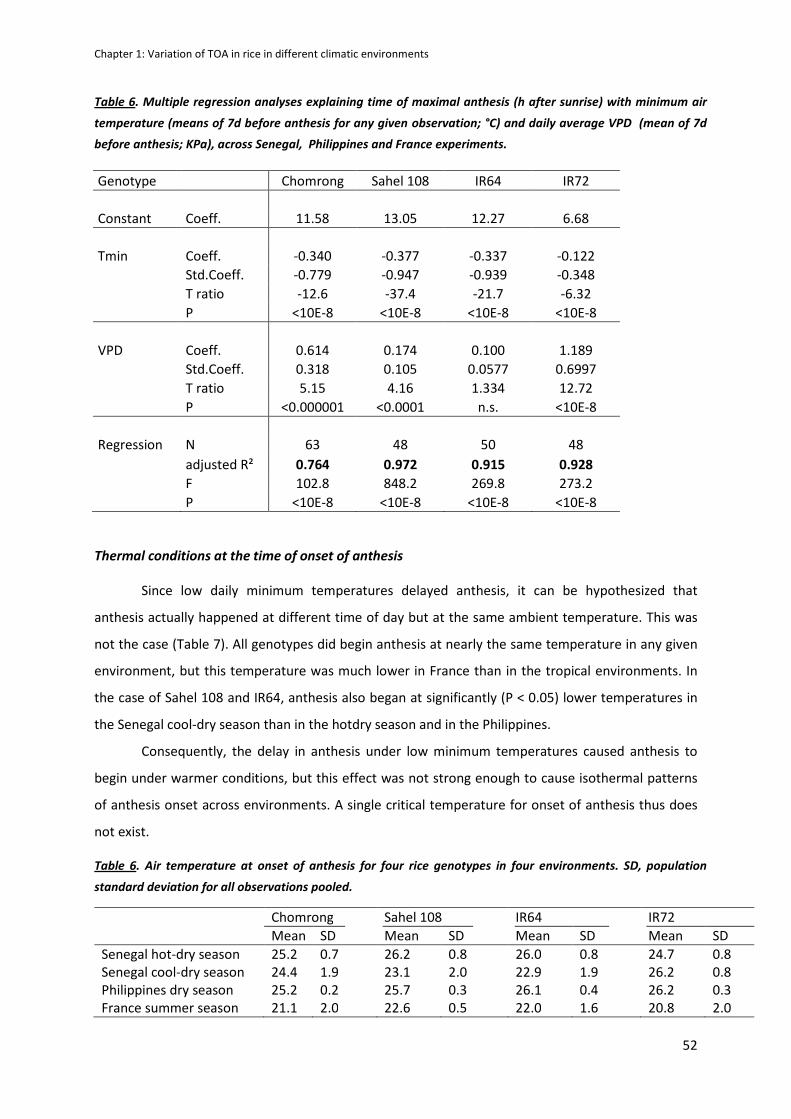
Chapter 1: Variation of TOA in rice in different climatic environments
52
Table 6. Multiple regression analyses explaining time of maximal anthesis (h after sunrise) with minimum air
temperature (means of 7d before anthesis for any given observation; °C) and daily average VPD (mean of 7d
before anthesis; KPa), across Senegal, Philippines and France experiments.
Genotype Chomrong Sahel 108 IR64 IR72
Constant Coeff. 11.58 13.05 12.27 6.68
Tmin Coeff. -0.340 -0.377 -0.337 -0.122
Std.Coeff. -0.779 -0.947 -0.939 -0.348
T ratio -12.6 -37.4 -21.7 -6.32
P <10E-8 <10E-8 <10E-8 <10E-8
VPD Coeff. 0.614 0.174 0.100 1.189
Std.Coeff. 0.318 0.105 0.0577 0.6997
T ratio 5.15 4.16 1.334 12.72
P <0.000001 <0.0001 n.s. <10E-8
Regression N 63 48 50 48
adjusted R² 0.764 0.972 0.915 0.928
F 102.8 848.2 269.8 273.2
P <10E-8 <10E-8 <10E-8 <10E-8
Thermal conditions at the time of onset of anthesis
Since low daily minimum temperatures delayed anthesis, it can be hypothesized that
anthesis actually happened at different time of day but at the same ambient temperature. This was
not the case (Table 7). All genotypes did begin anthesis at nearly the same temperature in any given
environment, but this temperature was much lower in France than in the tropical environments. In
the case of Sahel 108 and IR64, anthesis also began at significantly (P < 0.05) lower temperatures in
the Senegal cool-dry season than in the hotdry season and in the Philippines.
Consequently, the delay in anthesis under low minimum temperatures caused anthesis to
begin under warmer conditions, but this effect was not strong enough to cause isothermal patterns
of anthesis onset across environments. A single critical temperature for onset of anthesis thus does
not exist.
Table 6. Air temperature at onset of anthesis for four rice genotypes in four environments. SD, population
standard deviation for all observations pooled.
Chomrong Sahel 108 IR64 IR72
Mean SD Mean SD Mean SD Mean SD
Senegal hot-dry season 25.2 0.7 26.2 0.8 26.0 0.8 24.7 0.8
Senegal cool-dry season 24.4 1.9 23.1 2.0 22.9 1.9 26.2 0.8
Philippines dry season 25.2 0.2 25.7 0.3 26.1 0.4 26.2 0.3
France summer season 21.1 2.0 22.6 0.5 22.0 1.6 20.8 2.0
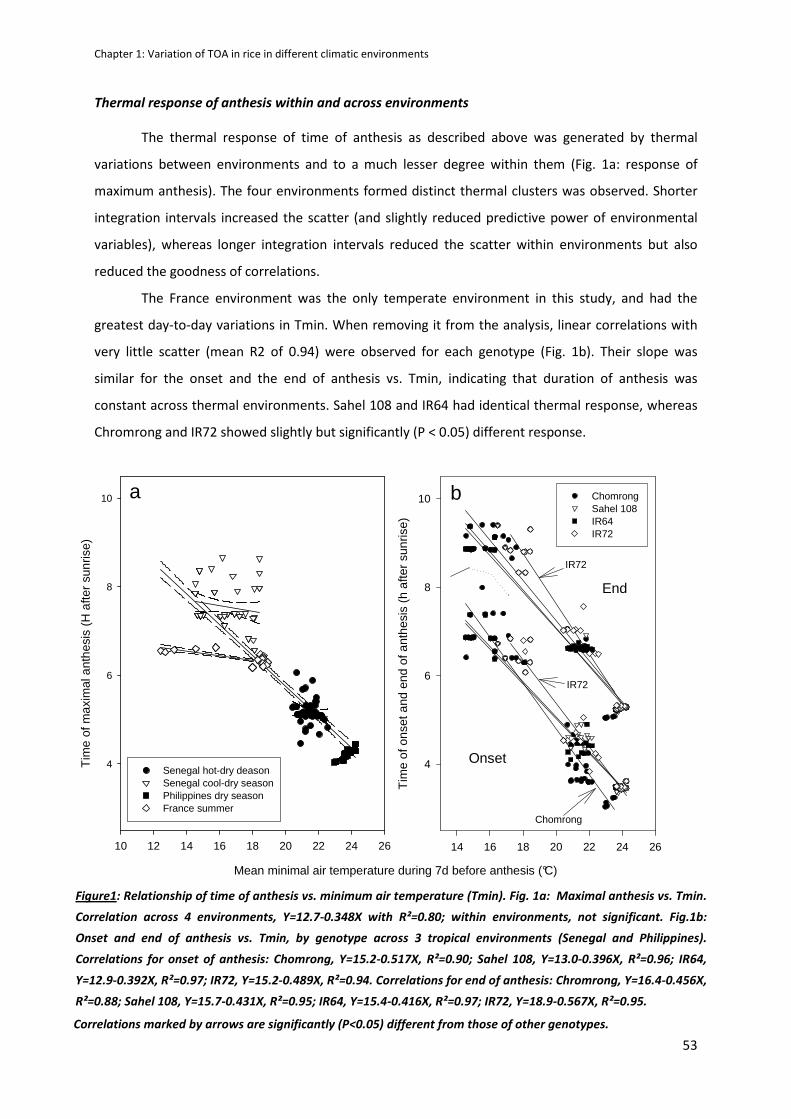
Chapter 1: Variation of TOA in rice in different climatic environments
53
Thermal response of anthesis within and across environments
The thermal response of time of anthesis as described above was generated by thermal
variations between environments and to a much lesser degree within them (Fig. 1a: response of
maximum anthesis). The four environments formed distinct thermal clusters was observed. Shorter
integration intervals increased the scatter (and slightly reduced predictive power of environmental
variables), whereas longer integration intervals reduced the scatter within environments but also
reduced the goodness of correlations.
The France environment was the only temperate environment in this study, and had the
greatest day-to-day variations in Tmin. When removing it from the analysis, linear correlations with
very little scatter (mean R2 of 0.94) were observed for each genotype (Fig. 1b). Their slope was
similar for the onset and the end of anthesis vs. Tmin, indicating that duration of anthesis was
constant across thermal environments. Sahel 108 and IR64 had identical thermal response, whereas
Chromrong and IR72 showed slightly but significantly (P < 0.05) different response.
Mean minimal air temperature during 7d before anthesis (°C)
10 12 14 16 18 20 22 24 26
Tim
e of
max
imal
ant
hesi
s (H
afte
r su
nris
e)
4
6
8
10
Senegal hot-dry deasonSenegal cool-dry seasonPhilippines dry seasonFrance summer
14 16 18 20 22 24 26
Tim
e of
ons
et a
nd e
nd o
f ant
hesi
s (h
afte
r su
nris
e)
4
6
8
10 ChomrongSahel 108 IR64IR72
Onset
End
Chomrong
IR72
IR72
a b
Figure1: Relationship of time of anthesis vs. minimum air temperature (Tmin). Fig. 1a: Maximal anthesis vs. Tmin.
Correlation across 4 environments, Y=12.7-0.348X with R²=0.80; within environments, not significant. Fig.1b:
Onset and end of anthesis vs. Tmin, by genotype across 3 tropical environments (Senegal and Philippines).
Correlations for onset of anthesis: Chomrong, Y=15.2-0.517X, R²=0.90; Sahel 108, Y=13.0-0.396X, R²=0.96; IR64,
Y=12.9-0.392X, R²=0.97; IR72, Y=15.2-0.489X, R²=0.94. Correlations for end of anthesis: Chromrong, Y=16.4-0.456X,
R²=0.88; Sahel 108, Y=15.7-0.431X, R²=0.95; IR64, Y=15.4-0.416X, R²=0.97; IR72, Y=18.9-0.567X, R²=0.95.
Correlations marked by arrows are significantly (P<0.05) different from those of other genotypes.
Chapter 1: Variation of TOA in rice in different climatic environments
54
DISCUSSION
Atmospheric temperature and VPD strongly affect time of day of anthesis
This study found strong variations in the rice spikelets’ time of onset and end of anthesis
among climatic environments, whereas the duration of anthesis varied comparatively little. Across
environments, atmospheric Tmin and VPD, averaged over the 7 d preceding any given anthesis
event, explained almost all of the variation. As previously reported by Kobayasi et al. (2010), high
temperatures and low VPD cause spikelets to open earlier in the morning. In contrast to that study,
no effect of solar radiation was found here. The correlations reported here, however, were much
stronger even for Tmin alone (R2 = 0.80 across all environments and R2 = 0.94 for the three tropical
environments), as compared to R2 = 0.4 reported for the multiple regression model reported by
Kobayasi et al. (2010). This difference was probably due to the larger range of thermal and humidity
conditions encountered in our study, which led to stronger variability in time of day of onset and end
of anthesis.
We did not find any effect of environment on anthesis time within a site and season, which
was probably caused by insufficient variability, but leaves the remote possibly that site effects were
caused by third, non-climatic factors. This, however, is extremely unlikely because (1) management
including irrigation were optimal in all environments and (2) the cool and the hot season in Senegal,
based on the same plots, gave very different times of anthesis that were consistent with the overall
trends observed in this study. We thus conclude that the regression models obtained here reflect
true effects of weather variables on time of anthesis. It is possible, however, that other
environmental variables but Tmin and VPD that varied little in our study, such as Rg (20.1–22.1 MJ
d−1), would affect time of day of flowering in rice if they varied more strongly. Kobayasi et al. (2010)
reported such effects of Rg. Day length, which varied between 12.1 and 13.2 h in our study, was
significantly (P < 0.05) correlated with time of day of flowering, particularly with the time at which
anthesis ended (Table 4). Nishiyama and Blanco (1981) reported that decreasing day length by 1 h (or
applying a dark treatment before anthesis) could delay (or advance) the onset of flowering. In
contrast to these authors, however, we found a positive correlation of anthesis time of day with day
length, suggesting the causes behind the effects were different in both studies. In field experiments,
environmental variables that change seasonally are inter-correlated. But the effects of Tmin and VPD
remained largely unchanged when day length was included in the multiple regression analyses,
indicating that temperature and atmospheric drought have strong effects.
We assumed in this study that time of day of flowering is regulated at the level of the
individual spikelet because anthesis events on a panicle are spread over an extended period,
Chapter 1: Variation of TOA in rice in different climatic environments
55
probably due to different physiological age and topological position among spikelets. The fact that
average environmental conditions during the 7 d preceding any anthesis event explained time of
flowering better than those observed on the day of anthesis itself suggests the involvement of
regulatory processes happening prior to the anthesis event itself. Sheehy et al. (2007) suggested that
the the time of day of anthesis within a given panicle is uniform, which would imply that regulation
occurs at the scale of the entire panicle before the first spikelet opens. We cannot test this
hypothesis with the present data because this study was conducted at population and not panicle
scale, but it would explain the several observations in Camargue that do not fit into the overall
thermal response shown in Fig. 1a. In these cases, very low Tmin occurred during the end of the
observation period but appeared not to delay anthesis further. If time of day of anthesis is set before
the first spikelets on a panicle open, however, these late cold nights would indeed be ineffective, and
even the apparent outliers in Fig. 1a would fall into the common relationship across all sites.
The genotypes studied here behaved very similarly. The thermal response of Chomrong, a
cold-adapted cultivar from Nepal, and of IR72, a high-yielding tropical cultivar, differed slightly (P <
0.05; Fig. 1) from that of IR64 and Sahel 108, which are also highyielding tropical cultivars. IR72 also
exhibited greater sensitivity to VPD and lower sensitivity to Tmin as compared to the other
genotypes, as indicated by the different factor effects in multiple linear regressions (standardized
coefficients and T ratios in Table 6). Similar observations were reported by Kobayasi et al. (2010) on
other cultivars. Compared to the extremely large differences in time of anthesis observed by Sheehy
et al. (2007) on various cultivated and wild Oryza species in the Philippines, however, the genotypic
differences reported here were small. Anthesis onset varied among the species between pre-dawn
and the afternoon, with 09:33 h noted for O. sativa. This was matched by our observations (3.4 h
after sunrise in the Philippines. A similar duration of anthesis of about 2 h was observed in both
studies.
Variation in time of day of anthesis has adaptive value
Thermal stresses affect rice spikelet sterility during two critical periods, first at microspore
stage during which meiosis is impeded (Satake, 1976), and about two weeks later during anthesis
when pollination happens (Satake et al., 1978; Matsui et al., 1997a,b; Farrell et al., 2006; Jagadish et
al., 2007). The former sensitive phase is frequently affected by chilling (Hayase et al., 1969; Satake et
al., 1988) but rarely by heat because at this stage, the inflorescence is still enclosed by the leaf
sheaths near the bottom of the canopy (Yoshida, 1981). During anthesis, however, the panicle is fully
exposed to the atmospheric conditions near the top of the canopy. Anthesis early in the day provides
for escape from peak temperatures during the day (Nishiyama and Blanco, 1980; Jagadish et al.,
Chapter 1: Variation of TOA in rice in different climatic environments
56
2007). Ishimaru et al. (2010) recently demonstrated that introgression of an early-anthesis trait
effectively reduces sterility under hot conditions. The adaptive value of anthesis happening early in
the day is thus an established fact.
We propose that the observed effects of air temperature and VPD on time of day of anthesis
are both of adaptive value. Earlier anthesis under high temperatures at the beginning of the day
thereby increases the probability of escape from the even higher temperatures later on during the
day. The advantage conveyed by the VPD response is related to transpirational cooling of the panicle,
or the absence of it when VPD is low. Rice panicles are known to achieve significant cooling through
spikelets’ epidermal pores that cannot be regulated, as opposed to stomata (Terai et al., 1990).
Spikelet temperature can thus be by several degrees Celsius higher under humid than under dry
conditions at any given ambient temperature (Matsui et al., 2007; Yan et al., 2008). Earlier anthesis
under humid conditions provides for potential escape from rising ambient temperatures during the
day.
Towards better models predicting impacts of climate on spikelet sterility
Most rice crop models that simulate spikelet sterility caused by thermal stresses, such as
ORYZA 2000 (www.knowledgebank.irri.org/oryzabeta/) or DSSAT/CERES (Jones et al., 2003), take into
account neither the time of day of anthesis, nor the temporal spread of the flowering process, nor
the actual organ temperature which depends on the microclimate generated by the crop. The RIDEV
model (Dingkuhn, 1997; Wopereis et al., 2003) went one step further in partially simulating
microclimate including floodwater temperature, which is affected by ground cover and feeds back on
phenology and chilling induced sterility at microspore stage. The present study provides crucial
information necessary to improve such models. It will enable incorporating algorithms predicting the
climate-dependent temporal spread of the heat sensitive pollination process, both within the day
(time of onset and end of anthesis) and throughout the crop’s flowering period (which depends on
the level of de-synchronization of flowering at panicle, plant and population scales). The present
study demonstrated that these escape mechanisms possess substantial adaptive phenotypic
plasticity. Their efficacy can thus be predicted for different environments through modeling. But a
major challenge will be to generate the necessary data to calibrate such models for different
genotypes.
More research, however, is needed to incorporate into crop models all the important
processes of the plant system determining risks of thermal sterility. The present study provided
information on the temporal dimension of a heat sensitive process, anthesis, but not on the actual
temperature the spikelet suffers during those periods. Matsui et al. (2007) reported that rice panicles
Chapter 1: Variation of TOA in rice in different climatic environments
57
can attain temperatures by more than 6 ◦C lower than ambient und dry conditions, enabling
avoidance of sterility. Conversely, Tian et al. (2010) reported panicle temperature exceeding air
temperature by 4 ◦C under humid and wind free conditions. Recently, Yoshimoto et al. (2011)
presented a model called IM2PACT that predicts panicle temperature under variable field conditions.
As another factor related to climate change, rising atmospheric CO2 increases canopy temperature
through partial stomatal closure (Yoshimoto et al., 2005). These processes need to be considered if
model predictions of thermal sterility in rice are to be accurate.
CONCLUSION
This study provided evidence of strong effects of weather, notably Tmin and VPD, effects on the time
of day of anthesis in rice. This response is of great adaptive value, particularly for scenarios of global
warming, under which heat induced spikelet sterility is expected to be a constraint to yield. As
another factor for escape from heat stress, the aggregate duration of flowering at the panicle and
population were quantified, representing a risk spreading mechanism. Models predictive of thermal
sterility in rice need to consider the temporal plasticity of the anthesis process, along with accurate
simulation of spikelet temperature during the critical periods.
Acknowledgement
This study was financially supported by the Gesellschaft fuer Internationale Zusammenarbeit (GIZ) in
the context of the RISOCAS project, as well as by AfricaRice. The authors would like to express their
gratitude for technical support by the field staff at the research stations of AfricaRice in Senegal, the
International Rice Research Institute (IRRI) in the Philippines and the Centre Francais du Riz (CFR) in
France, and in particular Tanguy Lafarge (CIRAD), Guy Clément (CIRAD/CRF) and Abdoulaye Sow
(AfricaRice).
Chapter 1: Variation of TOA in rice in different climatic environments
58
REFERENCES
Allen, R.G., Pereira, L.S., Raes, D., Smith, M., 1998. Crop evapotranspiration: guidelines for computing
crop requirements. Irrigation and Drainage Paper No 56, FAO, Rome, Italy, 300p.
Baker, J.T., Allen Jr., L.H., Boote, K.J., 1992a. Effects of CO2 and temperature on growth and yield of
rice. J. Exp. Bot. 43, 959–964.
Dingkuhn, M. 1995. Climatic determinants of irrigated rice performance in the Sahel. III.
Characterizing environments by simulating the crop's photothermal responses. Agricultural
Systems 48, 435–456.
Dingkuhn M. 1997. Characterizing irrigated rice environments using the rice phenology model RIDEV.
In: K.M. Miezan, M.C.S. Wopereis, M. Dingkuhn, J. Deckers and T.F. Randolph (Eds.). Irrigated
Rice in the Sahel: Prospects for Sustainable Development. West Africa Rice Development
Association, B.P. 2551, Bouake 01, Cote d'Ivoire, ISBN 92 9113 1091. 343–360.
Dingkuhn M, Sow A. 1997. Potential yields of irrigated rice in the Sahel. In: K.M. Miezan, M.C.S.
Wopereis, M. Dingkuhn, J. Deckers and T.F. Randolph (Eds.). Irrigated Rice in the Sahel:
Prospects for Sustainable Development. West Africa Rice Development Association, B.P.
2551, Bouake 01, Cote d'Ivoire, ISBN 92 9113 1091. 361–380.
Farrell, T.C., Fox, K.M., Williams, R.L., Fukai, S., 2006. Genotypic variation for cold tolerance during
reproductive development in rice: Screening with cold air and cold water. Field Crops Res. 98,
178–194.
Imaki, T., Tokunaga, S., Obara, N., 1987. High temperature sterility of rice spikelets at flowering in
relation to flowering time. Jpn. J. Crop Sci. 56, (extra Issue 2) 209–210. (In Japanese with
English summary)
Ishimaru T, Hirabayashi H, Ida M, Takai T, San-Oh YA, Yoshinaga S. Ando I, Ogawa T, Kondo M. 2010.
A genetic resource for early-morning flowering trait of wild rice Oryza officinalis to mitigate
high temperature-induced spikelet sterility at anthesis. Annals of Botany 106, 515–520.
Jagadish, S.V.K., Craufurd, P.Q., Wheeler, T.R., 2007. High temperature stress and spikelet fertility in
rice (Oryza sativa L.). Journal of Experimental Botany Vol. 58, pp. 1627-1635.
Jagadish SVK, Craufurd PQ, Wheeler TR. 2008. Phenotyping parents of mapping populations of rice
for heat tolerance during anthesis. Crop Science 48: 1140–1146.
Chapter 1: Variation of TOA in rice in different climatic environments
59
Jensen, M.E.; Burman, R.D.; Allen, R.G. (1990). Evapotranspiration and irrigation water requirements.
Manuals and Rep. on Engr. Practice No. 70, ASCE, New York, N.Y.
Jones JW, Hoogenboom G, Porter CH, Boote KJ, Batchelor WD, Hunt LA, Wilkens PW, Singh U,
Gijsman AJ, Ritchie JT. 2003.The DSSAT cropping systems model. Europ. J. Agronomy 18,
235–265.
Kobayasi K, Matsui T, Yoshimoto M, Hasegawa T. 2010. Effects of Temperature, Solar Radiation, and
Vapor-Pressure Deficit on Flower Opening Time in Rice. Plant Prod. Sci. 13, 21–28.
Matsui, T., Namuco, O.S., Ziska, L.H., Horie, T., 1997a. Effects of high temperature and CO2
concentration on spikelet sterility in indica rice. Field Crops Research 51, 213–219.
Matsui, T., Omasa, K., Horie, T., 1997b. High temperature-induced spikelet sterility of japonica rice at
flowering in relation to air temperature, humidity and wind velocity conditions. Jpn. J. Crop
Sci. 66, 449–455.
Matsui T, Kobayasi K, Yoshimoto M, Hasegawa T. 2007. Stability of rice pollination in the field under
hot and dry conditions in the Riverina region of New South Wales, Australia. Plant Production
Science 10, 57-63.
Nishiyama I, Blanco L. 1980. Avoidance of high temperature sterility by flower opening in the early
morning. JARQ 14, 116–117.
Nishiyama I, Satake T. 1981a. High temperature damage in rice plants. Jpn. J. Trop. Agric. 25:14-19.
Nishiyama, I., Blanco, L., 1981b. Artificial Control of Flower Opening Time during the day in Rice
Plants. Japanese Journal of Crop Science 50, 59–66.
Satake, T., 1976. Determination of the most sensitive stage to sterile-type cool injury in rice plants.
Research Bulletin Hokkaido Natl. Agricultural Experiment Stn. 113, 1–44.
Satake T, Yoshida S. 1978. High temperature-induced sterility in indica rice at flowering. Jpn. J. Crop
Sci 47, 6–17.
Sheehy JE, Elmido AE, Centeno HGS, Pablico PP. 2005. Searching for new plants for climate change. J.
Agric. Meteorol. 60, 463–468.
Sheehy JE, Mitchell PL, Allen LH, Ferrer AB. 2006. Mathematical consequences of using various
empirical expressions of crop yield as a function of temperature. Field Crops Res. 98, 216–
221.
Chapter 1: Variation of TOA in rice in different climatic environments
60
Sheehy JE, Mabilangan AE, Dionora MJA, Pablico PP. 2007. Time of day of flowering in wild species
of the genus Oryza. International Rice Research Newsletter 32, 12–13.
Sheehy J.E., Mitchell P.L., Ferrer A.B., 2006. Decline in rice grain yields with temperature: models and
correlations can give different estimates. Field Crops Res. 98, 151–156.
Singh, S., Latha, M., Ahmed, M.I., 2006. Genotypic differences for flowering behaviour in different
varietal types in rice (Oryza sativa L.). Indian Journal of Crop Science 1, 203–204.
Terai, K., Masaki, S., Kawamoto, t., Matsumoto, S., Kodama, I., Yamashita, S., 1990. Transpiration and
photosynthesis characteristics of the panicle in comparison with the flag leaf in the rice plant.
Japanese Journal of Crop Science 59, 321–326.
Tian X, Matsui T, Li S, Yoshimoto M, Kobayasi K, Hasegawa T. 2010. Heat-induced floret sterility of
hybrid rice (Oryza sativa L.) cultivars under humid and low wind conditions in the field of
Jianghan Basin, China. Plant Production Science 13, 243–251.
Yoshida S., 1981. Fundamentals of rice crop science. International Rice Research Institute (IRRI),
DAPO Box 7777, Manila Philippines, 269 p.
Yoshimoto M, Oue H, Takahashi H, Kobayashi K. 2005. The effects of FACE (Free-Air CO2 Enrichment)
on temperatures and transpiration of rice panicles at flowering stage. J. Agric. Meteorol. 60,
597–600.
Yoshimoto M, Fukuoka M, Hasegawa T, Utsumi M, Ishigooka Y, Kuwagata T. 2011. Integrated
micrometeorology model for panicle and canopy temperature (IM2PACT) for rice heat stress
studies under climate change. J. Agric. Meteorol. 67, 597–600.
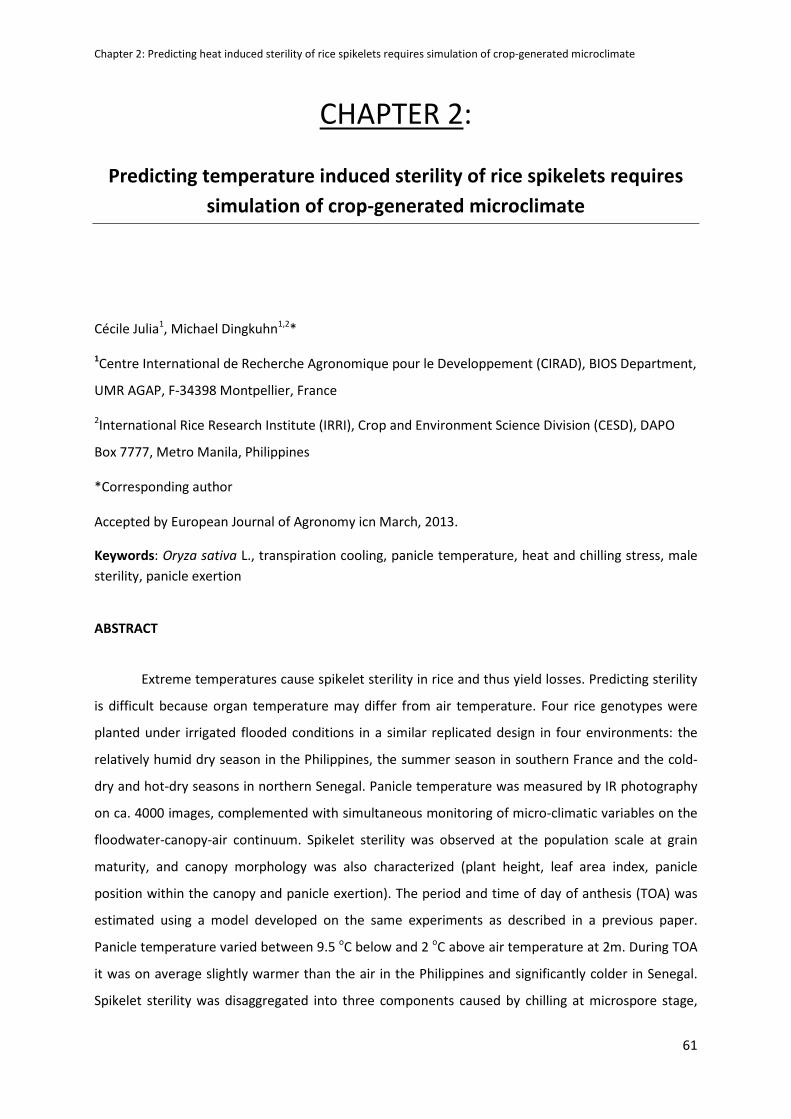
Chapter 2: Predicting heat induced sterility of rice spikelets requires simulation of crop-generated microclimate
61
CHAPTER 2:
Predicting temperature induced sterility of rice spikelets requires
simulation of crop-generated microclimate
Cécile Julia1, Michael Dingkuhn1,2*
1Centre International de Recherche Agronomique pour le Developpement (CIRAD), BIOS Department,
UMR AGAP, F-34398 Montpellier, France
2International Rice Research Institute (IRRI), Crop and Environment Science Division (CESD), DAPO
Box 7777, Metro Manila, Philippines
*Corresponding author
Accepted by European Journal of Agronomy icn March, 2013.
Keywords: Oryza sativa L., transpiration cooling, panicle temperature, heat and chilling stress, male
sterility, panicle exertion
ABSTRACT
Extreme temperatures cause spikelet sterility in rice and thus yield losses. Predicting sterility
is difficult because organ temperature may differ from air temperature. Four rice genotypes were
planted under irrigated flooded conditions in a similar replicated design in four environments: the
relatively humid dry season in the Philippines, the summer season in southern France and the cold-
dry and hot-dry seasons in northern Senegal. Panicle temperature was measured by IR photography
on ca. 4000 images, complemented with simultaneous monitoring of micro-climatic variables on the
floodwater-canopy-air continuum. Spikelet sterility was observed at the population scale at grain
maturity, and canopy morphology was also characterized (plant height, leaf area index, panicle
position within the canopy and panicle exertion). The period and time of day of anthesis (TOA) was
estimated using a model developed on the same experiments as described in a previous paper.
Panicle temperature varied between 9.5 oC below and 2 oC above air temperature at 2m. During TOA
it was on average slightly warmer than the air in the Philippines and significantly colder in Senegal.
Spikelet sterility was disaggregated into three components caused by chilling at microspore stage,
Chapter 2: Predicting heat induced sterility of rice spikelets requires simulation of crop-generated microclimate
62
incomplete panicle exertion at anthesis and high panicle temperature at anthesis. Chilling caused up
to 100% and heat up to 40% sterility, the former mainly in the Senegal cool-dry season and the latter
in the Philippines. All genotypes avoided heat sterility in the hot-dry season in Senegal despite air
temperatures up to 40 oC, by a combination of escape (early TOA) and avoidance (transpiration
cooling). Only one genotype had no chilling induced sterility due to physiological tolerance. It is
concluded that heat stress causing sterility is more likely to occur in warm-humid than hot-arid
environments due to humidity effects on transpiration cooling. Models predicting global warming
effects on sterility losses need to consider microclimate and organ temperature, and research is now
needed on the genetic control of panicle transpiration cooling.
INTRODUCTION
It is well established that high temperatures occurring at anthesis stage can cause spikelet
sterility in rice and thus, yield losses (Satake and Yoshida 1978, Nishiyama and Blanco 1980,
Nishiyama and Satake 1981, Baker et al. 1992). Global warming is likely to aggravate this problem,
and crop models have thus been used to predict rice yield losses associated with climate change
(Baker et al. 1992, Sheehy et al. 2006). In a recent study, we suggested that such extrapolations are
unreliable if they do not take into account the variability of time of day of anthesis (TOA; Julia and
Dingkuhn 2012). Rice spikelets open only during about two hours to achieve pollination, a process
that happens earlier in the day and thus helps escape from heat damage when nights are warm
and/or days are humid.
Adaptive plasticity of TOA is not the only heat protection found in rice. Some cultivars show
physiological tolerance of the reproductive processes, such as pollen quantity, morphology of the
reproductive organs and up-regulation of heat shock proteins (Jagadish et al. 2010). Rice panicles can
also avoid heat damage through evaporative cooling caused by transpiration. Matsui et al. (2007)
reported that rice panicles can attain temperatures by more than 6 0C lower than ambient when
atmospheric evaporative demand is high, whereas under humid conditions, panicle temperature can
exceed air temperature by 4 0C (Tian et al. 2010). In fact, rice panicles do not possess functioning
stomata (O'Toole and Garrity 1984, Ishihara et al. 1990, Ekanayake et al. 1993) and transpire through
permanently open epidermal pores that can be more or less clogged with silica deposits (Tahahashi
and Kurata 2007, Takahashi et al. 2008). On the basis of micro-climatic observations and
measurements of panicle temperature, Yoshimoto et al. (2011) recently presented a model called
IM2PACT using a radiative heat balance to predict rice panicle temperature.
Multi-environment, field-scale studies linking rice panicle temperature to climatic conditions
and to the resulting spikelet sterility are unavailable. As shown by Julia and Dingkuhn (2012), such
Chapter 2: Predicting heat induced sterility of rice spikelets requires simulation of crop-generated microclimate
63
studies, to be conclusive, must also observe the variability of the temporal spread of flowering at
plant and population scale, as well as the variability of TOA. Furthermore, yet another physiological
source of spikelet sterility must be factored into such an analysis, namely, incomplete panicle
exertion. Modern semi-dwarf rice cultivars have short peduncles and peduncle elongation is sensitive
to stresses, resulting in lower portions of the panicle to remain stuck in the enclosing leaf sheath
during drought (Muthurajan et al. 2011) or thermal stresses. Spikelets that do not participate in
panicle exertion remain sterile but this sterility cannot be attributed directly to organ temperature at
anthesis. Lastly, hot, semi-arid environments are prone to cold nights, resulting not only in heat
stress during anthesis but also chilling stress during the early microspore stage (Satake 1976,
Dingkuhn et al. 1995). Shimono et al. (2005) showed that spikelet sterility is correlated with the
temperature of the panicle at this stage, enclosed by the leaf sheaths. During the early microspore
stage, the panicle is exposed to the temperature of the floodwater and not the atmosphere. This
type of chilling injury should thus be studied using the water temperature (Dingkuhn et al. 1995,
Shimono et al. 2007).
Crop-generated microclimate, morphology, the timing of phenological processes and their
sensitivity to organ temperature interact to determine the final incidence of spikelet sterility. The
present study, which had the same experimental basis as the precursor study on time of day of
anthesis (Julia and Dingkuhn 2012), sought to (1) relate observed panicle temperature during
heading and flowering stages to climatic and microclimatic conditions, and (2) relate observed
spikelet sterility observed at maturity at the population scale to the temperature experienced by
panicles during the period and the time of day they underwent anthesis. Furthermore, we sought to
dissociate the observed sterility incidence into fractions attributable to heat stress at anthesis,
chilling stress and incomplete panicle exertion. For this purpose, four contrasting rice genotypes
were grown under flooded conditions in near-identical experiments in four environments: the cold-
dry and hot-dry seasons in Senegal, the summer season in southern France and the dry (but
comparatively humid) season in the Philippines.
MATERIALS AND METHODS
Experiment sites, design and management
Field experiments were conducted between January 2009 and July 2010 in 4 environments,
named hereafter Senegal hot-dry season, Senegal cool-dry season, France temperate summer and
Philippines dry season. In Senegal, the same field was used located on the Sahel research station of
the Africa Rice Center (ARC) at Ndiaye in the Senegal river delta (16°20’N, 16°26’W, 5m asl). The soil
Chapter 2: Predicting heat induced sterility of rice spikelets requires simulation of crop-generated microclimate
64
was a clay soil (Orthothionic Gleysol), containing 40–54% clay, 44–30% silt and 16% sand, with
pH(H2O) 6.5. The field in France was located on the research station of the French Center for Rice
(CFR) located in the Rhone delta (Camargue, 43°70’N, 4°56’E, 4m asl). The soil was a sandy loam type
consisting of 15.8% clay, 46.5% silt and 37.8% sand, with pH(H2O) 8.2, constituting a 40-50cm layer of
fluvial sediments deposited on a saline, acid-sulphate Mangrove soil. In the Philippines, the field was
located in the lowland part of the experiment farm of the International Rice Research Institute (IRRI)
(14°16’N, 121°25’E, 16m asl). The soil was an Andaqueptic Haplaquoll composed of 58% clay, 33% silt
and 9% sand, with pH(H2O) of 6.6.
Elemental plot size was 16m² (France and Senegal) or 20m² (Philippines). In all cases, the field
was embedded in a large irrigated rice area. In all environments, the experiment was conducted
under fully irrigated flooded conditions until surface drainage at about 14d after end of flowering.
Floodwater depth was maintained at 5-10 cm except during crop establishment, when floodwater
depth was adapted to seedling size.
A randomized complete block design with 3 replications (2 in France) was used. Crop
establishment differed among sites following standard practices for the respective stations: In the
Philippines and France, seedlings were sown and raised in seedling trays in the greenhouse, then 15-
d old plants (29d in France) were manually transplanted into the wet field at a density of 25 hills.m-²
(20cm spacing), each hill having 2 plants. In Senegal, pre-germinated seed was directly, manually
dibbled onto the wet field using the same population density and geometry as in the Philippines and
France. At all sites, inorganic fertilizer and crop protection inputs were used according to local
standards for high-input, fully protected systems. Weed control was manual, however, and
conducted as needed to keep plots weed free.
The cold-adapted cultivar Chomrong, which flowers extremely early under tropical
conditions, was sown later than the other cultivars in Senegal in order to reduce the time window of
flowering observations.
For all the sampling and measurement procedures we excluded the 3 border lines of the
subplot to avoid border effects. In all environments, experimental plots were located within a larger,
planted (flooded) irrigation scheme, thus avoiding oasis effects at the field scale.
Genetic materials
Four Oryza sativa L. cultivars were in the experiment at all sites and seasons. Among them, 3
were improved, medium-duration, indica-type, semidwarf varieties including IR64 (international
check variety known to be well adapted to conditions in both Senegal and Philippines), IR72 (similar
to IR64 but having slightly longer duration and smaller flag leaves), and Sahel 108 (local check in
Chapter 2: Predicting heat induced sterility of rice spikelets requires simulation of crop-generated microclimate
65
Senegal, characterized by tall erect flag leaves shading the panicle). The fourth cultivar was the
traditional, lowland-adapted japonica type Chomrong from Nepal, a short-duration cultivar that is
cold tolerant and adapted to the high altitudes. Chomrong builds a distinct canopy structure at
flowering with a high panicle layer located above the leaves due to long peduncles and pronounced
panicle exertion. The 4 cultivars were thus selected for their different crop architecture at flowering
stage and for different thermal adaptation. Seed for IR64 and Sahel 108 was obtained from the rice
germplasm collection of CIRAD; for Chomrong from the CIRAD-FOFIFA rice breeding program in
Antsirabe, Madagascar; and for IR72 from the IRRI germplasm bank in the Philippines.
Agro-climatic measurements
At each site and season, agro-meteorological measurements were continuously made at 2m
above ground at the center of the experimental field during the reproductive and ripening periods of
the crops: March and April 2009 in the Philippines, August and September 2009 in France, and
January-March 2010 and May-June 2010 in Senegal. They were backed by data from standard
weather stations located on the same experimental station.
For each experiment the meteorological data including air temperature (T), wind speed (V),
relative humidity (RH) and solar radiation (Rs) was measured in the middle of the plot where an agro-
meteorological station was set up for the entire duration of the experiments. The instruments were
located at 2m from the ground, or approximately 1 to 1.5m above the canopy. We used Campbell
Inc. equipment (UK): a MP100A Rotronic temperature and Relative Humidity sensor held in a
naturally ventilated radiation shield for the air temperature and humidity, and an A100R cup
anemometer for V. K thermocouples were placed in the water of each subplot to measure water
temperature. They were placed within the plant base to avoid any direct contact with incident solar
radiation. We recorded the data with a Campbell CR1000 data logger every 5s and average over 1
min (4 minutes for the Philippines) for the entire periods of observations in the field. For each
thermal image of plant leaves of panicles, corresponding, simultaneous environment data was thus
available.
For every minute (or every 4 minutes for the Philippines) we calculated the average potential
evapotranspiration (PET), the Vapor Pressure Deficit (VPD), and the sun height (H) according to the
FAO Irrigation and Drainage Paper No 56 (Allen et al., 1998). VPD was calculated based on the
following equation:
VPD = es × (1- RH/100) (Equation 1)
Where es = °T� � 0.6108 exp 01.21 3
34251.5 is the Saturation Vapor Pressure at T (in kPa)
Chapter 2: Predicting heat induced sterility of rice spikelets requires simulation of crop-generated microclimate
66
(RH and T expressed in percent and in degree Celcius, repectively)
The solar altitude angle or sun height (H) is a function of the solar time and the date and is calculated
from the following equation:
sin H = sin Lat� sin (Decli) + cos Lat� cos (Decli) cosω (Equation 2)
where: Lat is the latitude (in radian), Decl the solar declination (in radian), ω the solar time angle at
midpoint of the period of time considered (in radian).
Micro-meteorological measurement
For all the sites, a mobile micrometeorological station was set up in the field and moved from a
genotype to another when the subplot reached the flowering stage. This station was left at least for
two consecutive days on the same subplot.
Temperature sensors were placed at 3 different heights within the canopy: A MP100A Rotronic
temperature and Relative Humidity sensor (Campbell Inc. equipment, UK) held in a naturally
ventilated radiation shield was set up in the middle of the panicle layer; a T107 temperature sensor
(Campbell Inc. equipment, UK) also held in a naturally ventilated radiation shield was positioned
inside the canopy between the panicle layer and the water; and a T107 temperature sensor was
placed in the water. A net radiometer CNR1 (Campbell Inc., UK) was set up 30cm above the canopy
to measure the incident solar radiation (Rs) and net radiation (not used in this study).
We recorded the data with a Campbell CR1000 data logger every 5s and averaged them over 1 min (4
min for the Philippines) for the entire periods of observations in the field.
All equipment was clamped on a 3m long metal pole previously rammed into the soil. Each subplot
had a pole set up before the crop reached flowering stage except in France and in the Philippines
where a single pole was carefully moved with all equipment attached from a subplot to another.
Measurement of phenology for cold sensitive stage
To link the incidence of spikelet sterility observed at maturity with the environmental conditions
measured during the sensitive stages, it is necessary to identify the periods of the sensitive stages.
For heat stress, the main sensitive stage is flowering which is easy to observe directly in the field (for
details of measurements of flowering periods at crop, panicle and spikelet scale (TOA) refer to Julia
and Dingkuhn, 2012). Regarding the chilling stress, the most sensitive stage (microsporogenesis) is
not directly visible on the plants. We used an indirect method based on the Auricle distance (AD)
measurements which is the distance between the auricle of the flag leaf (last leaf) and the auricle of
the penultimate leaf. It is a non-destructive measurement to obtain a fair approximation of the time
Chapter 2: Predicting heat induced sterility of rice spikelets requires simulation of crop-generated microclimate
67
window when microsporogenesis occurs on the developing panicle enclosed in the same culm.
Previous studies involving destructive sampling and microscopy of developing pollen reported the
cold sensitive stage for AD values between -16cm and +2cm, with some variation among genotypes
(Satake and Hayase 1970, Imin et al. 2006). Note that when the flag leaf is emerging and therefore
still partially in the sheath, AD<0; when the flag leaf is totally exerted, AD≥0. To avoid destructive
sampling, we assumed that the cold sensitive stage occurred within the time window corresponding
to -16cm<AD<2cm for all genotypes and sites.
Daily AD measurements were made during both cold and hot season in Senegal on 6 plants (1
tiller/plant) per variety and per replication. The tillers were previously tagged when the flag leaf
lamina was visible. The AD was measured with a simple ruler. When AD<0, the flag leaf auricle is not
directly visible because located inside of the sheath, but the observer easily finds its position by
gently pressing the sheath to feel the auricle bulge.
We also measured the panicle heading and anthesis duration on the same tagged tillers (cf.
Julia and Dingkuhn 2012). On this basis, using weather data and for each individual tiller observed,
we calculated the thermal time in degree-days between microsporogenesis and onset of anthesis.
This was then used to evaluate the chilling sensitive time window for the whole subplot (tiller de-
synchronization included: cf. Julia and Dingkuhn 2012). We also applied these results to the trials in
the Philippines and France where no measurement of AD where done.
During microsporogenesis, the sensitive organ (young panicle) is located at the bottom of the
tiller which is in the water. We therefore calculated the daily water average, minimum and maximum
temperatures and we averaged them over the cold sensitive period for each subplot to relate it to
the sterility observed at maturity.
IR measurements on plants at flowering
A total of approximately 4000 IR images of panicles and leaves were made in all
environments except France. Images were taken on all days falling into the flowering period,
between one h before onset of anthesis until one h after end of anthesis. The time of anthesis varied
among environments (cf. Julia and Dingkuhn 2012). We took at least 10 images per subplot and per
measurement session. Each shot contained between one and five panicles well visible.
All thermal images were taken with a thermo tracer TH7800 with microbolometer FPA
system developed by NEC San-ei Instruments, Ltd (distributed by Impac, France). It operates in the
wavebands 0.78–1.00 μm and has a thermal resolution of 0.1 °C within the measuring range of -20°C
to 100°C. The images have a resolution of 320×320 pixels. All images were analysed with a dedicated
software called Microspec Pro 4.0.10 (San-ei Instruments, Ltd). Emissivity of panicles and leaves was

Chapter 2: Predicting heat induced sterility of rice spikelets requires simulation of crop-generated microclimate
68
set to 0.98 for the entire study. The camera provides a black and white image for visible light for the
same frame taken for the IR image but its quality was not satisfying so a digital photo of the same
scene was taken just before the IR shot with a commercial camera (Fujifilm, Finepix J10, 8.2Mpixel).
To avoid any side interference with the measurement, the operator made sure to have the sun
always in his back, and bright and hot backgrounds on the scene were avoided. The images were
taken at a distance of approximately 50 cm from the plants at an angle of -30 to 0 degrees relative to
horizontal. Shading of the scene by the operator was avoided. More than half of the measurements
were made on panicles that were at least half exerted and located in the center of the panicle layer
within the canopy, but measurements were also made on panicles having different position in the
canopy or exertion, and this information was recorded. For each panicle shot we measured its
position from the ground with a ruler, the flag leaf angle on the stem with a protractor, the
approximate panicle exertion as percentage , as well as the flowering status (pre-, onset, mid-, end-
or post-anthesis).
Images were taken irrespective of weather in order to capture a maximal range of environmental
conditions.
The images where analysed manually on the computer afterwards. The Microspec software allows to
manually trace object contours and extract the mean temperature within them. For every image we
outlined panicles (at least 1 per shot) and leaves (at least 2 leaves per shot, data not presented here)
and extracted their average temperatures. The recorded information was entered into a data base
where it was combined with microclimatic, agro-climatic, agronomic and morphological information.
This allowed multi-variate queries and extraction of information associated with the specific time of
an IR scene and the crop concerned.
Plant and canopy measurement at flowering
At flowering, the height of the canopy (position of the highest leaf on the subplot) and of the
panicle layer (lowest and highest panicle position on the subplot) were measured from the ground
with a 1.50m ruler. Two measurements per subplot were taken and averaged daily.
Panicle exertion and Sterility at maturity
Panicle exertion is the extent of panicle emergence from the enclosing flag leaf sheath. It was
used here to estimate the fraction of spikelet sterility attributable to incomplete exertion. At
maturity, panicle exertion was measured with a ruler on 15 tillers of 15 plants chosen randomly per
subplot (border plants excluded). We calculated the panicle exertion as the percentage of the
exerted panicle length over total panicle length. Total panicle length is the distance from the top of
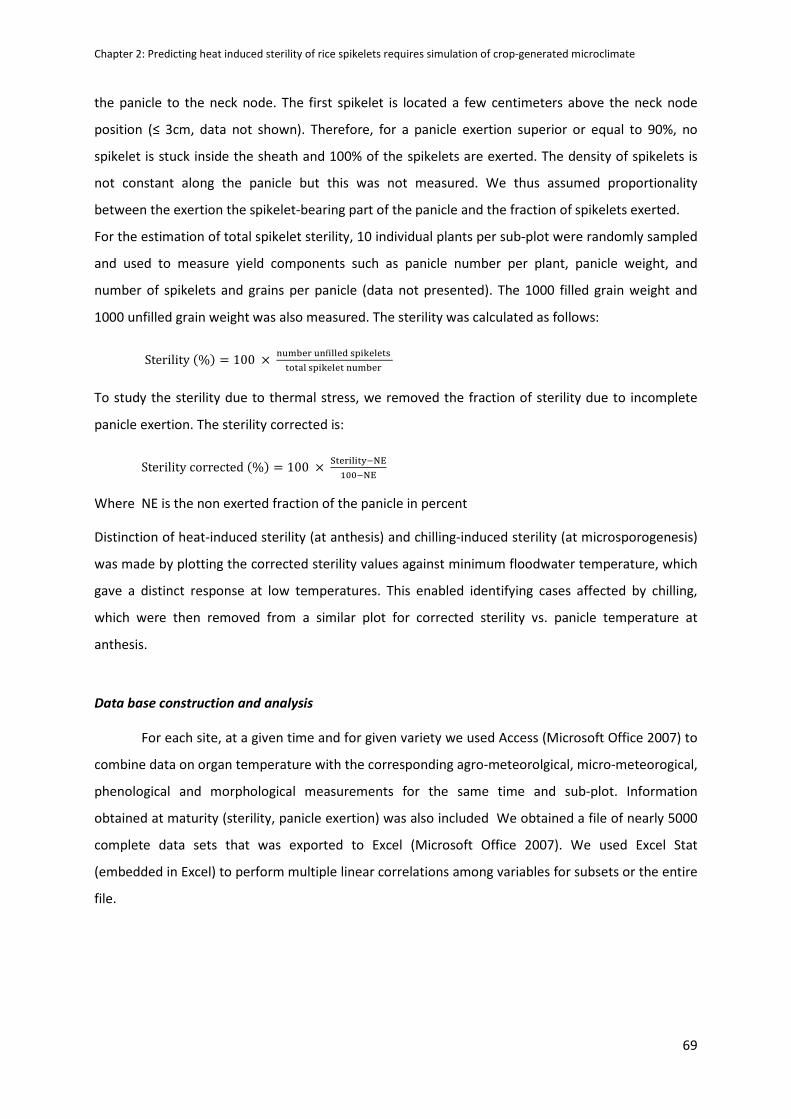
Chapter 2: Predicting heat induced sterility of rice spikelets requires simulation of crop-generated microclimate
69
the panicle to the neck node. The first spikelet is located a few centimeters above the neck node
position (≤ 3cm, data not shown). Therefore, for a panicle exertion superior or equal to 90%, no
spikelet is stuck inside the sheath and 100% of the spikelets are exerted. The density of spikelets is
not constant along the panicle but this was not measured. We thus assumed proportionality
between the exertion the spikelet-bearing part of the panicle and the fraction of spikelets exerted.
For the estimation of total spikelet sterility, 10 individual plants per sub-plot were randomly sampled
and used to measure yield components such as panicle number per plant, panicle weight, and
number of spikelets and grains per panicle (data not presented). The 1000 filled grain weight and
1000 unfilled grain weight was also measured. The sterility was calculated as follows:
Sterility %� � 100 � <=>?@A =<BCDD@E FGCH@D@IF
IJIKD FGCH@D@I <=>?@A
To study the sterility due to thermal stress, we removed the fraction of sterility due to incomplete
panicle exertion. The sterility corrected is:
Sterility corrected %� � 100 � MI@ACDCINOPQ
0RROPQ
Where NE is the non exerted fraction of the panicle in percent
Distinction of heat-induced sterility (at anthesis) and chilling-induced sterility (at microsporogenesis)
was made by plotting the corrected sterility values against minimum floodwater temperature, which
gave a distinct response at low temperatures. This enabled identifying cases affected by chilling,
which were then removed from a similar plot for corrected sterility vs. panicle temperature at
anthesis.
Data base construction and analysis
For each site, at a given time and for given variety we used Access (Microsoft Office 2007) to
combine data on organ temperature with the corresponding agro-meteorolgical, micro-meteorogical,
phenological and morphological measurements for the same time and sub-plot. Information
obtained at maturity (sterility, panicle exertion) was also included We obtained a file of nearly 5000
complete data sets that was exported to Excel (Microsoft Office 2007). We used Excel Stat
(embedded in Excel) to perform multiple linear correlations among variables for subsets or the entire
file.
Chapter 2: Predicting heat induced sterility of rice spikelets requires simulation of crop-generated microclimate
70
RESULTS
Climatic profiles of environments during flowering
The three sites provided four markedly different climatic environments during the period the
4 genotypes flowered (Fig1). The cool-dry and hot-dry seasons in Senegal had strong variations in
Tmax (24-44 °C) combined with low relative humidity during the day (frequently below 20%, data not
presented). This resulted in extremely variable and sometimes very high VPD (up to 4 kPa).
Differences between Tmin and Tmax were greatest in the Sengal cool-dry season, with Tmin
sometimes dropping below 12 °C , whereas, in the hot-dry season Tmin was generally above 20 °C .
One of the short periods when Tmax reached about 40 °C in the cool-dry season was a Harmattan
dust storm, with solar radiation reduced by about 10%.
The dry season in the Philippines was a humid environment (average RH 85%). Tmin-Tmax
differentials were small and temperatures were comparatively constant. Tmin was nearly constant at
about 24°C. VPD was generally below 1.5 kPa and mostly below 1 kPa. France temperate summer
was intermediate between Senegal and the Philippines in terms of Tmin-Tmax differences and VPD.
Average VPD was 1.7 kPa ranging between 1 and 2.3 kPa. Both Tmin and Tmax decreased during the
experiment, with Tmin dropping below 10°C (end of the summer).
Solar radiation (not presented) was similar for all sites (around 20 MJ/day) but in the
Philippines we experienced many cloudy and rainy days compared to the long-term average. Within
the 60 days of measurements, 24 days had rain. In France, 4 days of rain were recorded in September
but no rain was recorded during the two experimental periods in Senegal.
Water temperature (Figure 1, solid symbols) measured under canopies having at least a leaf
area index of 5 (data not presented) generally showed less diurnal variation than air temperature. It
also had less day to day variation than air temperature. This was particularly striking in Senegal
where maximum water temperature did not follow at all the strong oscillations of Tmax (air),
whereas in France water temperature followed air temperature closely.
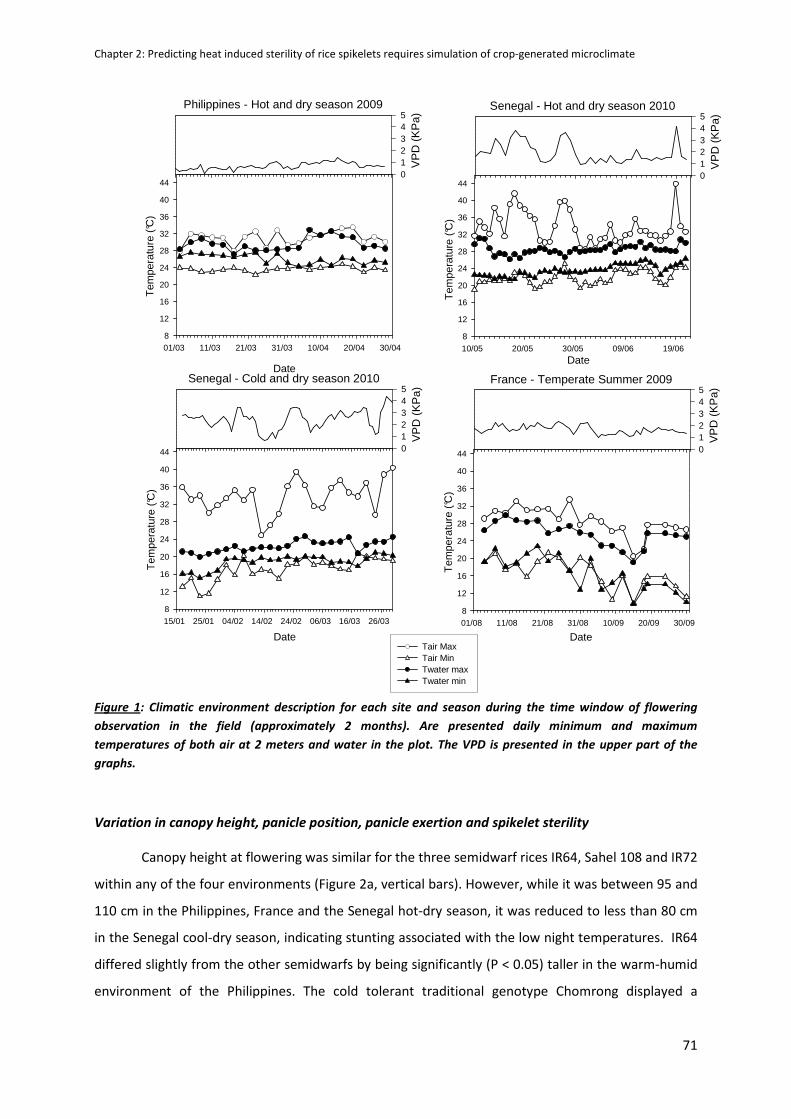
Chapter 2: Predicting heat induced sterility of rice spikelets requires simulation of crop-generated microclimate
71
Date01/08 11/08 21/08 31/08 10/09 20/09 30/09
Tem
pera
ture
(°C
)
8
12
16
20
24
28
32
36
40
44
Date
01/03 11/03 21/03 31/03 10/04 20/04 30/04
Tem
pera
ture
(°C
)
8
12
16
20
24
28
32
36
40
44
Date
15/01 25/01 04/02 14/02 24/02 06/03 16/03 26/03
Tem
pera
ture
(°C
)
8
12
16
20
24
28
32
36
40
44
Date10/05 20/05 30/05 09/06 19/06
Tem
pera
ture
(°C
)
8
12
16
20
24
28
32
36
40
44
France - Temperate Summer 2009
VP
D (
KP
a)
012345
Senegal - Cold and dry season 2010
VP
D (
KP
a)
012345
Senegal - Hot and dry season 2010
VP
D (
KP
a)
012345
Philippines - Hot and dry season 2009
VP
D (
KP
a)
012345
Figure 1: Climatic environment description for each site and season during the time window of flowering
observation in the field (approximately 2 months). Are presented daily minimum and maximum
temperatures of both air at 2 meters and water in the plot. The VPD is presented in the upper part of the
graphs.
Variation in canopy height, panicle position, panicle exertion and spikelet sterility
Canopy height at flowering was similar for the three semidwarf rices IR64, Sahel 108 and IR72
within any of the four environments (Figure 2a, vertical bars). However, while it was between 95 and
110 cm in the Philippines, France and the Senegal hot-dry season, it was reduced to less than 80 cm
in the Senegal cool-dry season, indicating stunting associated with the low night temperatures. IR64
differed slightly from the other semidwarfs by being significantly (P < 0.05) taller in the warm-humid
environment of the Philippines. The cold tolerant traditional genotype Chomrong displayed a
Tair Max Tair Min Twater max Twater min
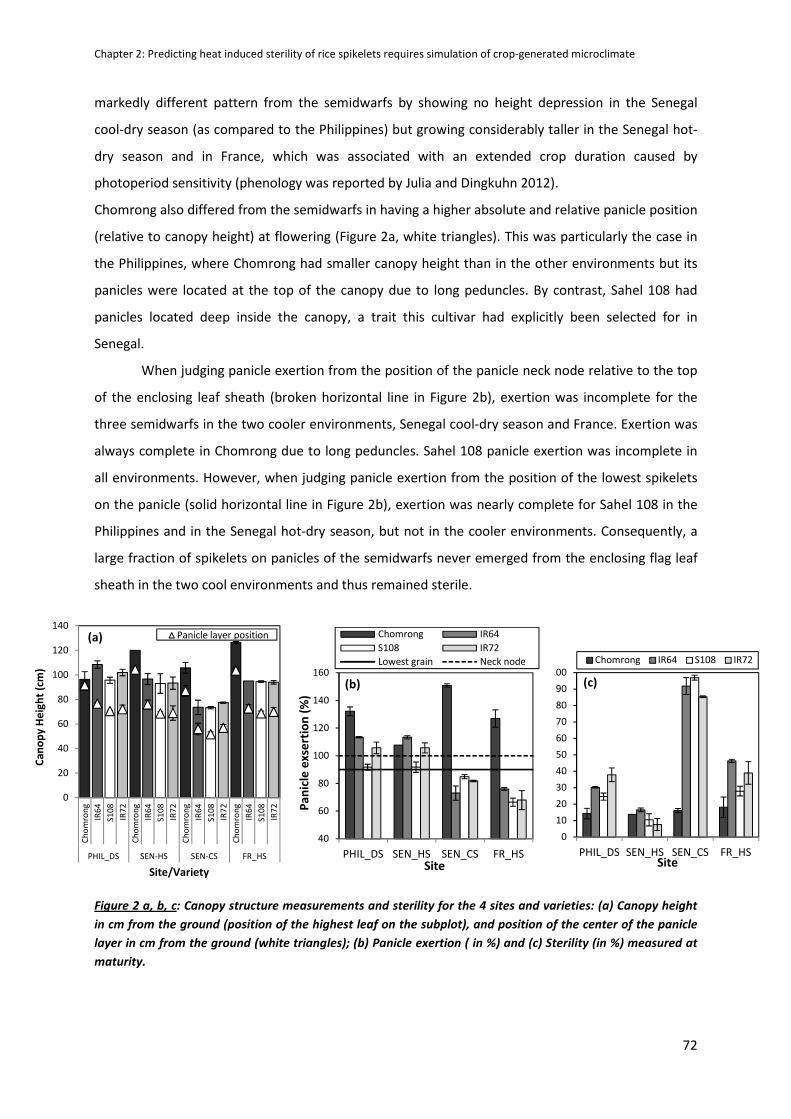
Chapter 2: Predicting heat induced sterility of rice spikelets requires simulation of crop-generated microclimate
72
markedly different pattern from the semidwarfs by showing no height depression in the Senegal
cool-dry season (as compared to the Philippines) but growing considerably taller in the Senegal hot-
dry season and in France, which was associated with an extended crop duration caused by
photoperiod sensitivity (phenology was reported by Julia and Dingkuhn 2012).
Chomrong also differed from the semidwarfs in having a higher absolute and relative panicle position
(relative to canopy height) at flowering (Figure 2a, white triangles). This was particularly the case in
the Philippines, where Chomrong had smaller canopy height than in the other environments but its
panicles were located at the top of the canopy due to long peduncles. By contrast, Sahel 108 had
panicles located deep inside the canopy, a trait this cultivar had explicitly been selected for in
Senegal.
When judging panicle exertion from the position of the panicle neck node relative to the top
of the enclosing leaf sheath (broken horizontal line in Figure 2b), exertion was incomplete for the
three semidwarfs in the two cooler environments, Senegal cool-dry season and France. Exertion was
always complete in Chomrong due to long peduncles. Sahel 108 panicle exertion was incomplete in
all environments. However, when judging panicle exertion from the position of the lowest spikelets
on the panicle (solid horizontal line in Figure 2b), exertion was nearly complete for Sahel 108 in the
Philippines and in the Senegal hot-dry season, but not in the cooler environments. Consequently, a
large fraction of spikelets on panicles of the semidwarfs never emerged from the enclosing flag leaf
sheath in the two cool environments and thus remained sterile.
Figure 2 a, b, c: Canopy structure measurements and sterility for the 4 sites and varieties: (a) Canopy height
in cm from the ground (position of the highest leaf on the subplot), and position of the center of the panicle
layer in cm from the ground (white triangles); (b) Panicle exertion ( in %) and (c) Sterility (in %) measured at
maturity.
0
20
40
60
80
100
120
140
Ch
om
ron
g
IR6
4
S1
08
IR7
2
Ch
om
ron
g
IR6
4
S1
08
IR7
2
Ch
om
ron
g
IR6
4
S1
08
IR7
2
Ch
om
ron
g
IR6
4
S1
08
IR7
2
PHIL_DS SEN-HS SEN-CS FR_HS
Ca
no
py
He
igh
t (c
m)
Site/Variety
Panicle layer position(a)
0
10
20
30
40
50
60
70
80
90
100
PHIL_DS SEN_HS SEN_CS FR_HS
Ste
rili
ty (
%)
Site
(c)
Chomrong IR64 S108 IR72
40
60
80
100
120
140
160
PHIL_DS SEN_HS SEN_CS FR_HS
Pa
nic
le e
xse
rtio
n (
%)
Site
Chomrong IR64
S108 IR72
Lowest grain Neck node
(b)
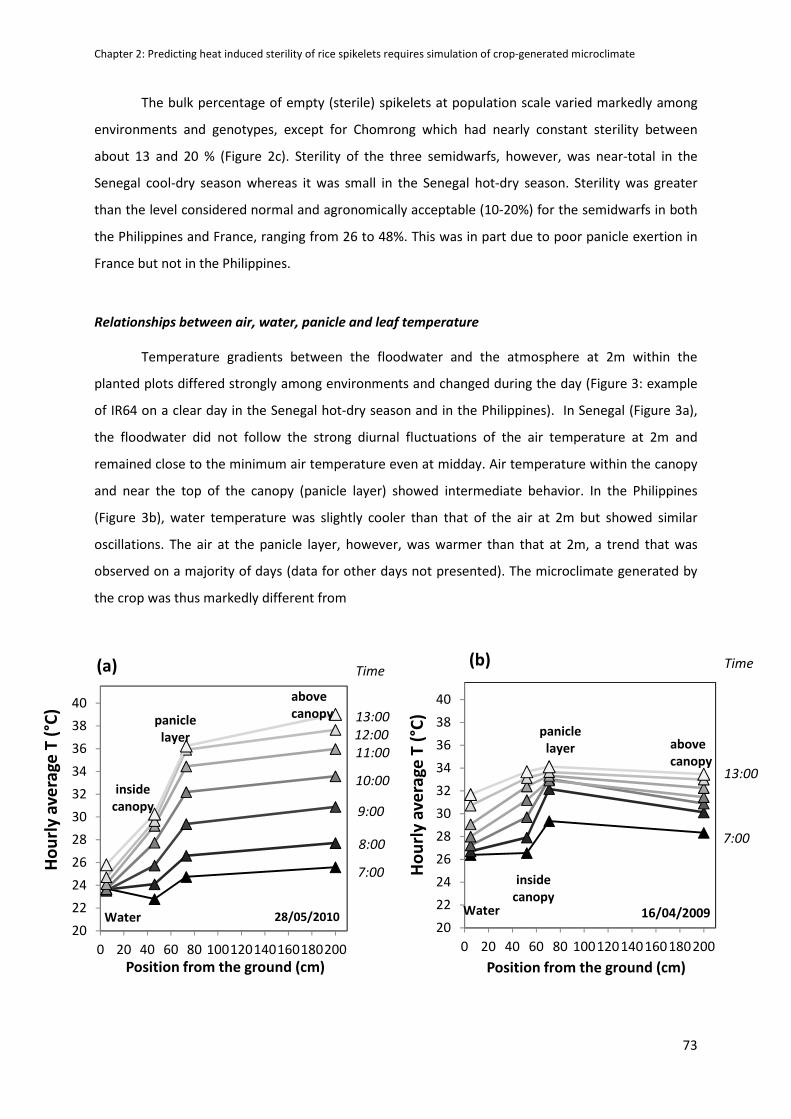
Chapter 2: Predicting heat induced sterility of rice spikelets requires simulation of crop-generated microclimate
73
The bulk percentage of empty (sterile) spikelets at population scale varied markedly among
environments and genotypes, except for Chomrong which had nearly constant sterility between
about 13 and 20 % (Figure 2c). Sterility of the three semidwarfs, however, was near-total in the
Senegal cool-dry season whereas it was small in the Senegal hot-dry season. Sterility was greater
than the level considered normal and agronomically acceptable (10-20%) for the semidwarfs in both
the Philippines and France, ranging from 26 to 48%. This was in part due to poor panicle exertion in
France but not in the Philippines.
Relationships between air, water, panicle and leaf temperature
Temperature gradients between the floodwater and the atmosphere at 2m within the
planted plots differed strongly among environments and changed during the day (Figure 3: example
of IR64 on a clear day in the Senegal hot-dry season and in the Philippines). In Senegal (Figure 3a),
the floodwater did not follow the strong diurnal fluctuations of the air temperature at 2m and
remained close to the minimum air temperature even at midday. Air temperature within the canopy
and near the top of the canopy (panicle layer) showed intermediate behavior. In the Philippines
(Figure 3b), water temperature was slightly cooler than that of the air at 2m but showed similar
oscillations. The air at the panicle layer, however, was warmer than that at 2m, a trend that was
observed on a majority of days (data for other days not presented). The microclimate generated by
the crop was thus markedly different from
20
22
24
26
28
30
32
34
36
38
40
0 20 40 60 80 100120140160180200
Ho
url
y a
ve
rag
e T
(°C
)
Position from the ground (cm)
(a)
inside
canopy
above
canopypanicle
layer
28/05/2010Water
7:00
8:00
9:00
10:00
11:00
12:00
13:00
Time
20
22
24
26
28
30
32
34
36
38
40
0 20 40 60 80 100120140160180200
Ho
url
y a
ve
rag
e T
(°C
)
Position from the ground (cm)
(b)
inside
canopy
above
canopy
panicle
layer
16/04/2009Water
7:00
13:00
Time
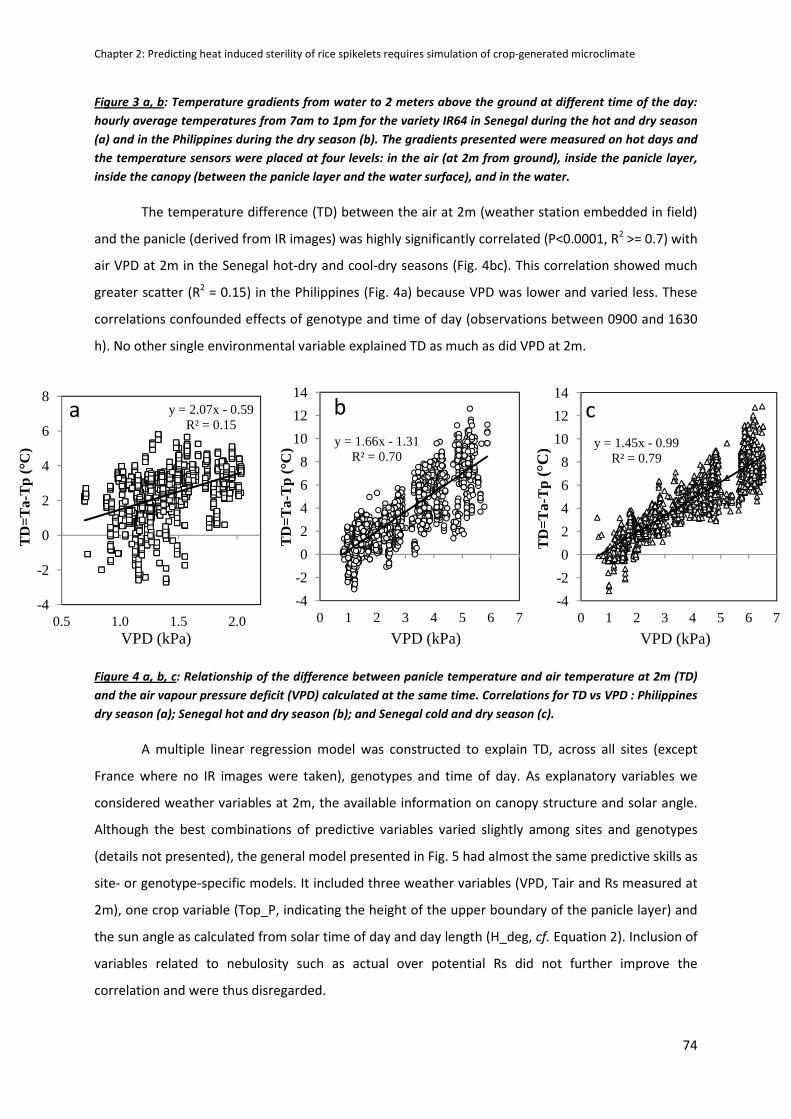
Chapter 2: Predicting heat induced sterility of rice spikelets requires simulation of crop-generated microclimate
74
Figure 3 a, b: Temperature gradients from water to 2 meters above the ground at different time of the day:
hourly average temperatures from 7am to 1pm for the variety IR64 in Senegal during the hot and dry season
(a) and in the Philippines during the dry season (b). The gradients presented were measured on hot days and
the temperature sensors were placed at four levels: in the air (at 2m from ground), inside the panicle layer,
inside the canopy (between the panicle layer and the water surface), and in the water.
The temperature difference (TD) between the air at 2m (weather station embedded in field)
and the panicle (derived from IR images) was highly significantly correlated (P<0.0001, R2 >= 0.7) with
air VPD at 2m in the Senegal hot-dry and cool-dry seasons (Fig. 4bc). This correlation showed much
greater scatter (R2 = 0.15) in the Philippines (Fig. 4a) because VPD was lower and varied less. These
correlations confounded effects of genotype and time of day (observations between 0900 and 1630
h). No other single environmental variable explained TD as much as did VPD at 2m.
Figure 4 a, b, c: Relationship of the difference between panicle temperature and air temperature at 2m (TD)
and the air vapour pressure deficit (VPD) calculated at the same time. Correlations for TD vs VPD : Philippines
dry season (a); Senegal hot and dry season (b); and Senegal cold and dry season (c).
A multiple linear regression model was constructed to explain TD, across all sites (except
France where no IR images were taken), genotypes and time of day. As explanatory variables we
considered weather variables at 2m, the available information on canopy structure and solar angle.
Although the best combinations of predictive variables varied slightly among sites and genotypes
(details not presented), the general model presented in Fig. 5 had almost the same predictive skills as
site- or genotype-specific models. It included three weather variables (VPD, Tair and Rs measured at
2m), one crop variable (Top_P, indicating the height of the upper boundary of the panicle layer) and
the sun angle as calculated from solar time of day and day length (H_deg, cf. Equation 2). Inclusion of
variables related to nebulosity such as actual over potential Rs did not further improve the
correlation and were thus disregarded.
y = 1.66x - 1.31R² = 0.70
-4
-2
0
2
4
6
8
10
12
14
0 1 2 3 4 5 6 7
TD
=Ta-
Tp
(°C
)
VPD (kPa)
b
y = 1.45x - 0.99R² = 0.79
-4
-2
0
2
4
6
8
10
12
14
0 1 2 3 4 5 6 7
TD
=Ta-
Tp
(°C
)
VPD (kPa)
cy = 2.07x - 0.59R² = 0.15
-4
-2
0
2
4
6
8
0.5 1.0 1.5 2.0
TD
=Ta-
Tp
(°C
)
VPD (kPa)
a
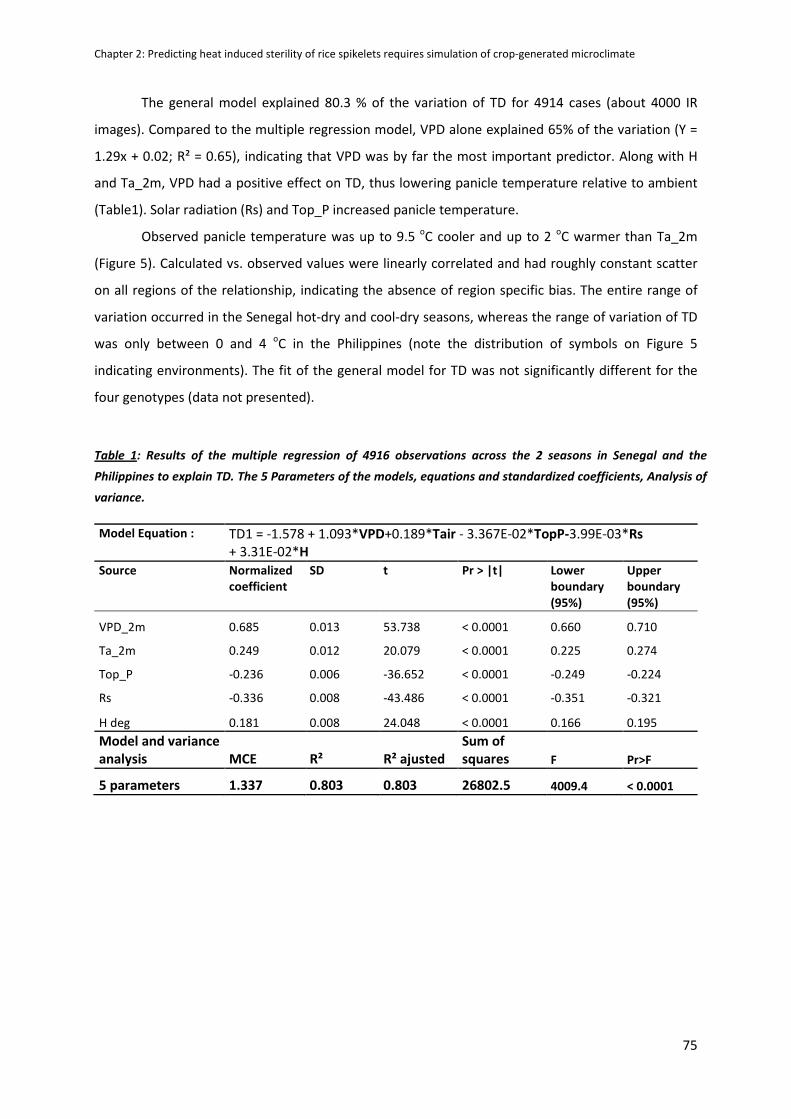
Chapter 2: Predicting heat induced sterility of rice spikelets requires simulation of crop-generated microclimate
75
The general model explained 80.3 % of the variation of TD for 4914 cases (about 4000 IR
images). Compared to the multiple regression model, VPD alone explained 65% of the variation (Y =
1.29x + 0.02; R² = 0.65), indicating that VPD was by far the most important predictor. Along with H
and Ta_2m, VPD had a positive effect on TD, thus lowering panicle temperature relative to ambient
(Table1). Solar radiation (Rs) and Top_P increased panicle temperature.
Observed panicle temperature was up to 9.5 oC cooler and up to 2 oC warmer than Ta_2m
(Figure 5). Calculated vs. observed values were linearly correlated and had roughly constant scatter
on all regions of the relationship, indicating the absence of region specific bias. The entire range of
variation occurred in the Senegal hot-dry and cool-dry seasons, whereas the range of variation of TD
was only between 0 and 4 oC in the Philippines (note the distribution of symbols on Figure 5
indicating environments). The fit of the general model for TD was not significantly different for the
four genotypes (data not presented).
Table 1: Results of the multiple regression of 4916 observations across the 2 seasons in Senegal and the
Philippines to explain TD. The 5 Parameters of the models, equations and standardized coefficients, Analysis of
variance.
Model Equation : TD1 = -1.578 + 1.093*VPD+0.189*Tair - 3.367E-02*TopP-3.99E-03*Rs
+ 3.31E-02*H
Source Normalized
coefficient
SD t Pr > |t| Lower
boundary
(95%)
Upper
boundary
(95%)
VPD_2m 0.685 0.013 53.738 < 0.0001 0.660 0.710
Ta_2m 0.249 0.012 20.079 < 0.0001 0.225 0.274
Top_P -0.236 0.006 -36.652 < 0.0001 -0.249 -0.224
Rs -0.336 0.008 -43.486 < 0.0001 -0.351 -0.321
H deg 0.181 0.008 24.048 < 0.0001 0.166 0.195
Model and variance
analysis MCE R² R² ajusted
Sum of
squares F Pr>F
5 parameters 1.337 0.803 0.803 26802.5 4009.4 < 0.0001
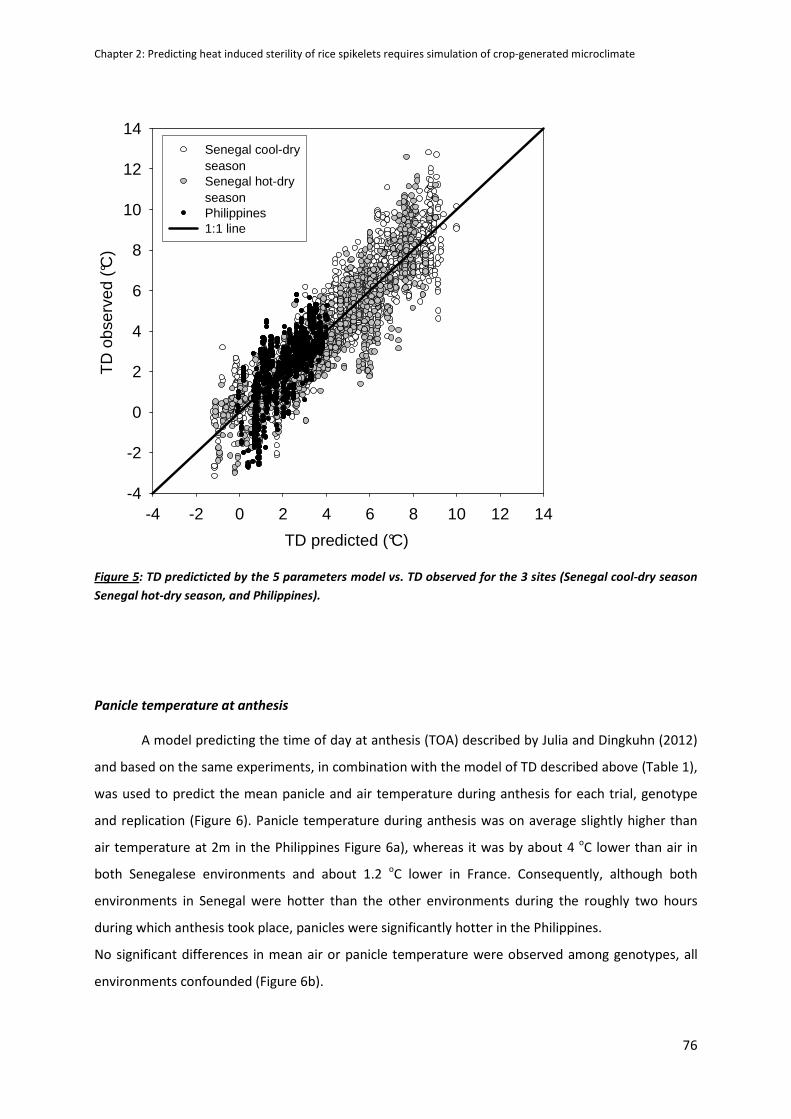
Chapter 2: Predicting heat induced sterility of rice spikelets requires simulation of crop-generated microclimate
76
TD predicted (°C)
-4 -2 0 2 4 6 8 10 12 14
TD
obs
erve
d (°C
)
-4
-2
0
2
4
6
8
10
12
14Senegal cool-dryseasonSenegal hot-dryseasonPhilippines1:1 line
Figure 5: TD predicticted by the 5 parameters model vs. TD observed for the 3 sites (Senegal cool-dry season
Senegal hot-dry season, and Philippines).
Panicle temperature at anthesis
A model predicting the time of day at anthesis (TOA) described by Julia and Dingkuhn (2012)
and based on the same experiments, in combination with the model of TD described above (Table 1),
was used to predict the mean panicle and air temperature during anthesis for each trial, genotype
and replication (Figure 6). Panicle temperature during anthesis was on average slightly higher than
air temperature at 2m in the Philippines Figure 6a), whereas it was by about 4 oC lower than air in
both Senegalese environments and about 1.2 oC lower in France. Consequently, although both
environments in Senegal were hotter than the other environments during the roughly two hours
during which anthesis took place, panicles were significantly hotter in the Philippines.
No significant differences in mean air or panicle temperature were observed among genotypes, all
environments confounded (Figure 6b).
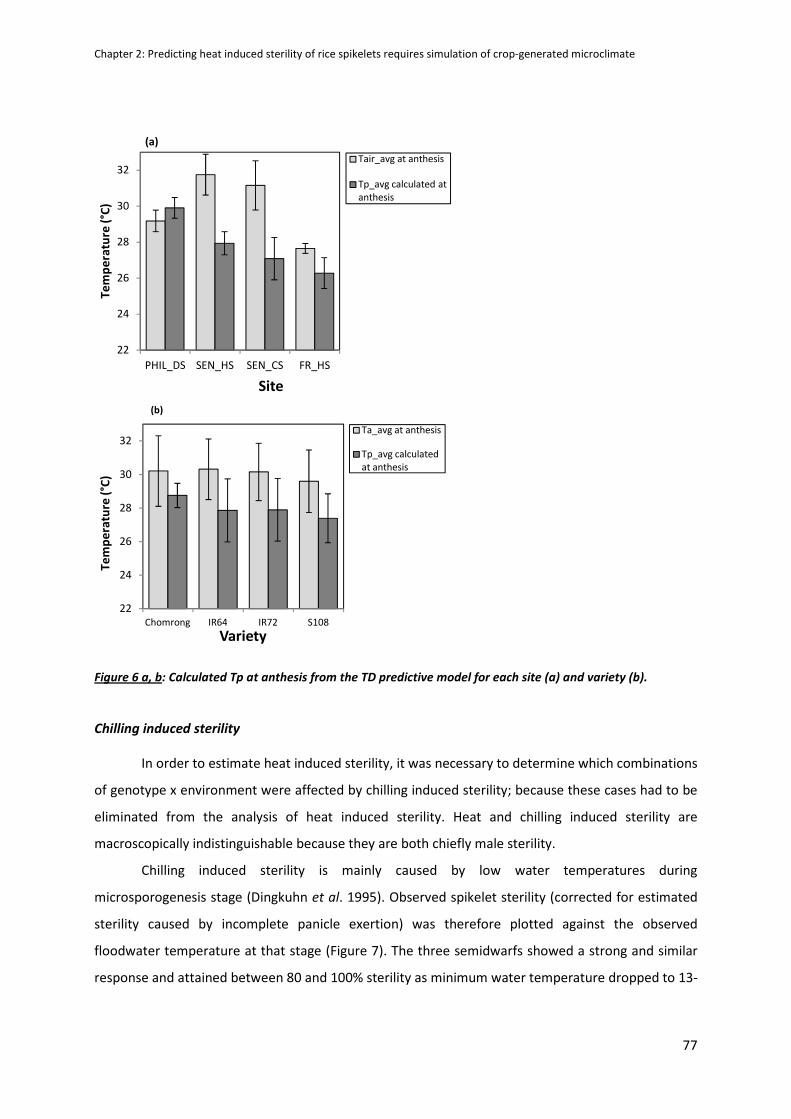
Chapter 2: Predicting heat induced sterility of rice spikelets requires simulation of crop-generated microclimate
77
Figure 6 a, b: Calculated Tp at anthesis from the TD predictive model for each site (a) and variety (b).
Chilling induced sterility
In order to estimate heat induced sterility, it was necessary to determine which combinations
of genotype x environment were affected by chilling induced sterility; because these cases had to be
eliminated from the analysis of heat induced sterility. Heat and chilling induced sterility are
macroscopically indistinguishable because they are both chiefly male sterility.
Chilling induced sterility is mainly caused by low water temperatures during
microsporogenesis stage (Dingkuhn et al. 1995). Observed spikelet sterility (corrected for estimated
sterility caused by incomplete panicle exertion) was therefore plotted against the observed
floodwater temperature at that stage (Figure 7). The three semidwarfs showed a strong and similar
response and attained between 80 and 100% sterility as minimum water temperature dropped to 13-
22
24
26
28
30
32
Chomrong IR64 IR72 S108
Te
mp
era
ture
(°C
)
Variety
(b)
Ta_avg at anthesis
Tp_avg calculated
at anthesis
22
24
26
28
30
32
PHIL_DS SEN_HS SEN_CS FR_HS
Te
mp
era
ture
(°C
)
Site
(a)
Tair_avg at anthesis
Tp_avg calculated at
anthesis
Chapter 2: Predicting heat induced sterility of rice spikelets
15 oC. The cold-tolerant genotype Chomrong, however, showed no response within that temperature
range.
On the basis of these observations, five environment x genotype combinations affected by chilling
stress were eliminated from the subsequent analysis for heat
season: IR64, Sahel 108 and IR72; France: IR64 and IR72)
Figure 7: Correlation between the minimum temperature of water during the microporogenesis stage and
the percentage of sterility observed at maturity for the 4 contrasted environments and 4 varieties. Chomrong
was left out of the regression for being the control for cold tolerance. The other observations were strongly
fitted with a polynomial equation: Y=0.94x
50% sterility calculated is 16.4°C.
Heat induced sterility
The remaining observations after elimination of cases affected by chilling stress were
analyzed for heat effects at anthesis on spikelet sterility (Fig
the estimated fraction attributed to incomplete panicle exertion subtrac
temperature observed during the period of flowering. When the mean maximal daily air temperature
during the days of flowering
temperature (Figure 8a). This was also the c
TOA, averaged over the flowering period, was used (Fig
correlation (R2=0.79; P<0.01), however, was observed when the reference temperature was that of
the panicle during TOA, averaged over the days the flowering period lasted (Fig
extrapolation, the correlation predicts a critical
Dingkuhn et al. 1995) of 33-34 oC, all genotypes and environments confound
Predicting heat induced sterility of rice spikelets requires simulation of crop-generated microclimate
tolerant genotype Chomrong, however, showed no response within that temperature
On the basis of these observations, five environment x genotype combinations affected by chilling
stress were eliminated from the subsequent analysis for heat-induced sterility (Senegal cool
season: IR64, Sahel 108 and IR72; France: IR64 and IR72).
: Correlation between the minimum temperature of water during the microporogenesis stage and
the percentage of sterility observed at maturity for the 4 contrasted environments and 4 varieties. Chomrong
or being the control for cold tolerance. The other observations were strongly
fitted with a polynomial equation: Y=0.94x2 - 43.10x + 503.90 (R² = 0.92). The Twater min threshold to reach
ing observations after elimination of cases affected by chilling stress were
analyzed for heat effects at anthesis on spikelet sterility (Figure 8). Corrected spikelet sterility (with
the estimated fraction attributed to incomplete panicle exertion subtracted) was plotted against
temperature observed during the period of flowering. When the mean maximal daily air temperature
was used, no relationship was observed between sterility and
8a). This was also the case when the maximal air temperature occurring during
TOA, averaged over the flowering period, was used (Figure 8b). A highly significant, positive
=0.79; P<0.01), however, was observed when the reference temperature was that of
during TOA, averaged over the days the flowering period lasted (Fig
extrapolation, the correlation predicts a critical panicle temperature generating 50% sterility (CT50;
C, all genotypes and environments confounded.
generated microclimate
78
tolerant genotype Chomrong, however, showed no response within that temperature
On the basis of these observations, five environment x genotype combinations affected by chilling
induced sterility (Senegal cool-dry
: Correlation between the minimum temperature of water during the microporogenesis stage and
the percentage of sterility observed at maturity for the 4 contrasted environments and 4 varieties. Chomrong
or being the control for cold tolerance. The other observations were strongly
43.10x + 503.90 (R² = 0.92). The Twater min threshold to reach
ing observations after elimination of cases affected by chilling stress were
8). Corrected spikelet sterility (with
ted) was plotted against
temperature observed during the period of flowering. When the mean maximal daily air temperature
was used, no relationship was observed between sterility and
ase when the maximal air temperature occurring during
8b). A highly significant, positive
=0.79; P<0.01), however, was observed when the reference temperature was that of
during TOA, averaged over the days the flowering period lasted (Figure 8c). By
temperature generating 50% sterility (CT50;
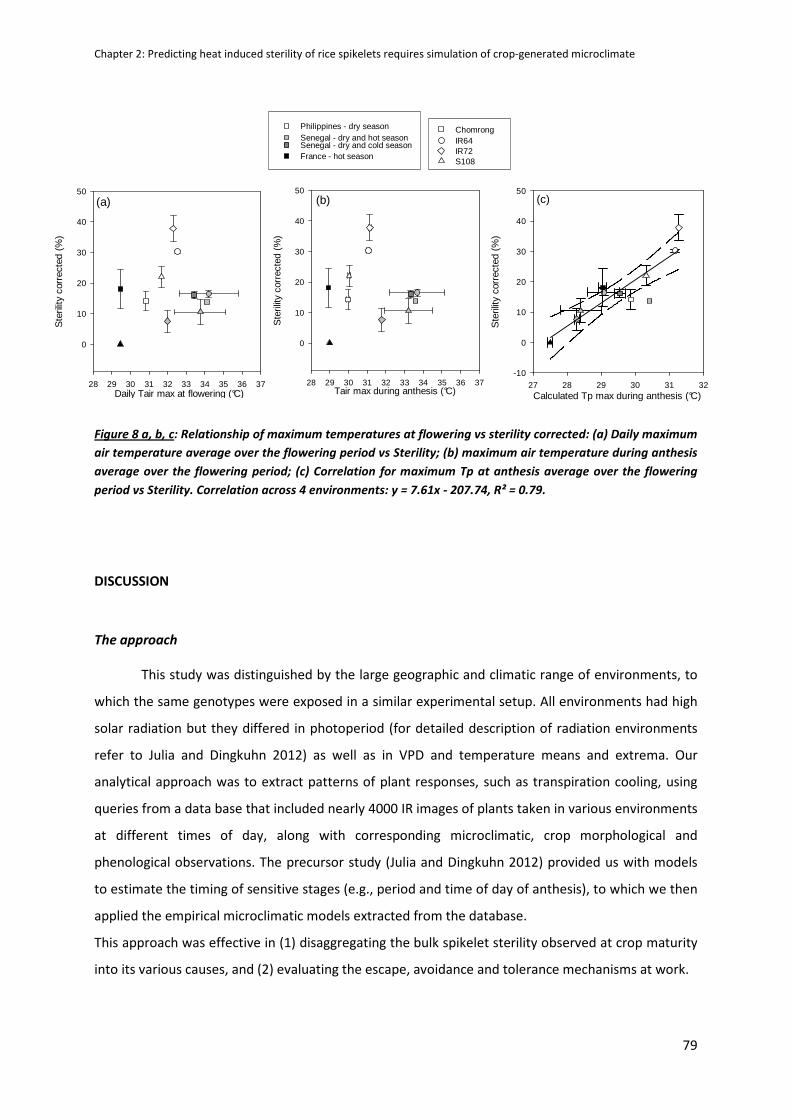
Chapter 2: Predicting heat induced sterility of rice spikelets requires simulation of crop-generated microclimate
79
Figure 8 a, b, c: Relationship of maximum temperatures at flowering vs sterility corrected: (a) Daily maximum
air temperature average over the flowering period vs Sterility; (b) maximum air temperature during anthesis
average over the flowering period; (c) Correlation for maximum Tp at anthesis average over the flowering
period vs Sterility. Correlation across 4 environments: y = 7.61x - 207.74, R² = 0.79.
DISCUSSION
The approach
This study was distinguished by the large geographic and climatic range of environments, to
which the same genotypes were exposed in a similar experimental setup. All environments had high
solar radiation but they differed in photoperiod (for detailed description of radiation environments
refer to Julia and Dingkuhn 2012) as well as in VPD and temperature means and extrema. Our
analytical approach was to extract patterns of plant responses, such as transpiration cooling, using
queries from a data base that included nearly 4000 IR images of plants taken in various environments
at different times of day, along with corresponding microclimatic, crop morphological and
phenological observations. The precursor study (Julia and Dingkuhn 2012) provided us with models
to estimate the timing of sensitive stages (e.g., period and time of day of anthesis), to which we then
applied the empirical microclimatic models extracted from the database.
This approach was effective in (1) disaggregating the bulk spikelet sterility observed at crop maturity
into its various causes, and (2) evaluating the escape, avoidance and tolerance mechanisms at work.
(a)
Daily Tair max at flowering (°C)28 29 30 31 32 33 34 35 36 37
Ste
rility
cor
rect
ed (
%)
0
10
20
30
40
50(b)
Tair max during anthesis (°C)28 29 30 31 32 33 34 35 36 37
Ste
rility
cor
rect
ed (
%)
0
10
20
30
40
50(c)
Calculated Tp max during anthesis (°C)27 28 29 30 31 32
Ste
rility
cor
rect
ed (
%)
-10
0
10
20
30
40
50
ChomrongIR64IR72S108
Philippines - dry seasonSenegal - dry and hot seasonSenegal - dry and cold seasonFrance - hot season
Chapter 2: Predicting heat induced sterility of rice spikelets requires simulation of crop-generated microclimate
80
Thermal stress caused sterility by at least three distinct mechanisms
The three major causes of thermal sterility in rice considered in this study are well known.
Chilling of spikelet primordia during microsporogenesis stage is most commonly associated with low
minimum temperatures of the air and particularly the floodwater in irrigated rice. It was investigated
in the field by Dingkuhn et al. (1995) and modeled in a systems context by Dingkuhn (1995). Although
water management options give some scope for the management of this stress (Satake et al. 1988),
temporal escape though genotypic phenology (Dingkuhn and Miezan 1995) and cropping calendars
(Dingkuhn 1995, Shreshta et al. 2011) are probably more effective. In the present study, sterility of
the traditional cold-tolerant cultivar Chomrong from Nepal proved insensitive to chilling within the
range of conditions studied, whereas the three tropical semidwarfs had near-total sterility when daily
minimum floodwater temperature dropped to ≤ 15 oC during the sensitive stage. Physiological cold
tolerance at the reproductive stage, as observed in Chomrong, can thus be very effective and has
been previously described as involving anti-oxidative enzymes protecting the tissues (Kuk et al. 2003,
Sato et al. 2011). Tolerant genotypes also produce pollen in greater quantity compared to sensitive
varieties (Satake and Hayase 1970), thus increasing probability of successful pollination. The number
of pollen grains is directly linked to spikelet fertility (Farrell et al. 2006).
The second cause of sterility observed here was incomplete panicle exertion from the
enclosing flag leaf sheath (Griest 1986). Poor elongation of internodes and peduncle during heading
can be caused by stresses such as drought (O’Toole and Namuco 1983, Muthurajan et al. 2011) and
chilling (Chung 1979, Hamdani 1979). Most spikelets trapped in the sheath remain sterile although
the causes are not fully known (Jagadish et al. 2011). Breeding of short-strawed high yielding rices
has increased the risk of incomplete panicle exertion because peduncles are shorter. The three
semidwarf cultivars in this study were all affected by this problem in the Senegal cool-dry season and
in France, the environments having low night temperatures, whereas the taller traditional cultivar
Chomrong was not. Sahel 108, selected by breeders in Senegal aiming at avoiding bird damage and
improving light use through panicles hidden deep in the canopy (Dingkuhn, pers. obs. 1995), had
particularly poor panicle exertion even in the warmer environments.
We estimated the extent of sterility caused by incomplete panicle exertion from the fraction
of spikelet-bearing panicle length failing to exert. This estimate may carry some systematic error due
to heterogenous distribution of spikelets along the panicle. The potential effect of this error on the
calculation of heat sterility (as a residual after subtraction of sterility caused by poor exertion) was
small, however, and unlikely to significantly affect the results.
Heat induced sterility affected up to nearly 40% of the spikelets located on the exerted part
of the panicle. The sterility vs. panicle temperature relationship during anthesis, for all genotypes
Chapter 2: Predicting heat induced sterility of rice spikelets requires simulation of crop-generated microclimate
81
confounded because they appeared to respond similarly, indicated that sterility commences already
at less than 30 oC and attains 50% at about 33-34 oC. Tropical rice has been reported to turn male-
sterile at about 35 oC (Matsui et al, 1997) but these measurements were based on air temperature
which may not be the same as panicle temperature even under controlled conditions. Furthermore,
there is considerable genetic diversity in physiological heat tolerance of rice spikelets (Shah et al.,
2011).
Heat sterility occurred in the most humid and not in the hottest environment
We observed more heat sterility in the Philippines than in the considerably warmer
environment of the Senegal hot-dry season. During the site and season specific time of day of
anthesis (Julia and Dingkuhn 2012), panicle temperature was higher in the Philippines (and slightly
higher than ambient temperature) than it was in Senegal (where panicles were much cooler than
ambient). This result emphasizes the great importance of air humidity and other factors affecting
transpiration cooling of the panicle. Any prediction of heat sterility from air temperature alone across
different levels of VPD and solar radiation is thus prone to very large systematic errors. It is therefore
essential that crop models used for such purposes consider the microclimate generated by the crop
and organ temperature, which is generally not the case today, with one notable and recent exception
(Yoshimoto et al. 2011). These authors developed a heat balance model simulating panicle
temperature in rice canopies. This model is currently being incorporated into a rice crop growth
model. Also the present results are being translated into a model predicting heat (and also cold)
sterility of rice on the basis of the rice phenology model RIDEV that was conceived for similar
purposes in the 19s in Senegal (Dingkuhn 1997).
Rice has highly effective escape, avoidance and tolerance mechanisms to thermal stresses
The present study demonstrated that rice panicles can cool their panicles very effectively
under conditions of high VPD, involving high transpiration rates that were not measured here.
Panicle temperature was by up to 9.5 oC below air temperature at 2m. This value is very high but is
not far from 6.8 °C, the maximum temperature difference between air and panicle observed by
Matsui et al. (2007) in Australia under hot and dry conditions based on IR measurements taken at
TOA on a different rice cultivar. Rice canopies transpire through rigid epidermal pores located on
spikelets and that cannot be regulated like stomata (Takahashi et al. 2008), enabling the panicle to
maintain transpiration cooling even under drought conditions which are frequently associated with
heat. This avoidance response, however, is not effective in warm-humid environments.
Chapter 2: Predicting heat induced sterility of rice spikelets requires simulation of crop-generated microclimate
82
The precursor paper to this study (Julia and Dingkuhn 2012) described another adaptation of
rice panicles to heat based on temporal escape. The short and singular period of TOA for each
individual spikelet (ca. 2h) happens earlier in the day as nights are warmer and as air humidity is
higher. In humid environments day-night temperature differences are small and consequently, nights
relatively warm. This leads to earlier anthesis in the day and may help escaping peak temperatures at
midday. The transpiration cooling and temporal escape processes together thus constitute
complementary adaptations for coping with heat.
In our study, heat did not affect panicle exertion whereas chilling did. Incomplete panicle,
although related to thermal stresses among other stresses, is a phenomenon restricted largely to
modern semidwarf varieties and thus has been introduced by breeding. The long peduncles of
traditional landraces of rice are, among other things, a morphological avoidance trait for
physiological stress effects on sterility.
Consequences for research on adaptation to climate change
Our results have implications for the crop modeling approaches to be used for predictions of
climate change impacts on rice production. Currently used crop models such as DSSAT (Jones et al.
2003), SARRAH (Dingkuhn et al. 2003) or ORYZA2000 (Bouman et al. 2001) do not consider
microclimate nor organ temperature when simulating thermal stresses. For example, it was
predicted with such models that for every 1 °C increase in global temperature a yield loss of 7.2 % is
to be expected for rice crop (Krishnan et al. 2007). The general notion of increasing yield losses due
to heat sterility under global warming conditions is probably true but its true magnitude and
geographic distribution might be significantly different from current predictions. In particular, even
small increases in air temperature might cause large effects in humid environments whereas rice
crops in semi-arid, irrigated situations might be more resilient due to transpiration cooling.
There may be significant trade-offs between heat avoidance and crop water use. We can
provide no quantitative information here on how water-saving management practices will affect the
efficacy of transpiration cooling. Current or anticipated water scarcity in many semi-arid irrigated
systems in the Sahel (de Vries et al. 2010) and the Indo-Gangetic Plains (Abrol 1999) has triggered
research on water-saving practices including alternate wetting and drying (AWD, Cabangon et al.
2001) and aerobic culture conditions (Tuong and Bouman 2003), along with complementary breeding
efforts (Atlin and Lafitte 2002). Although rice panicles cannot regulate their transpiration (O'Toole
and Garrity 1984, Ishihara et al. 1990, Ekanayake et al. 1993), water-saving practices are bound to
reduce transpiration cooling and soil/water evaporative cooling at the canopy and systems level,
necessarily resulting in warmer plants. This effect must imperatively be quantified and the associated
Chapter 2: Predicting heat induced sterility of rice spikelets requires simulation of crop-generated microclimate
83
sterility risks predicted before water-saving technologies are implemented at a larger scale in hot-dry
environments.
Lastly, rising atmospheric CO2 levels are known to reduce stomatal conductance of rice, thus
increasing canopy temperature by 1-2°C for anticipated conditions in 2050 (FACE experiments in
Japan: Yoshimoto et al. 2005). Our study did not consider this long-term effect but research is under
way elsewhere to quantify this effect for temperate environments using FACE experiments (Tokida et
al. 2010). Extrapolation of such results to tropical conditions, however, may require similar
experiments in the tropics, both in humid and semi-arid environments.
Efforts should also be made to study the genetic control and available genetic diversity in rice
for the escape and avoidance responses described here. Some such information is available on TOA
(Kobayasi et al. 2010), but not on its adaptive phenotypic plasticity as described by Julia and
Dingkuhn (2012). Transpiration cooling capacity of rice panicles has not yet been studied in terms of
genetic control and diversity.
Acknowledgement
This study was financially supported by the Gesellschaft fuer Internationale Zusammenarbeit (GIZ) in
the context of the RISOCAS project, as well as by AfricaRice. The authors would like to express their
gratitude for technical support by the field staff at the research stations of AfricaRice in Senegal, the
International Rice Research Institute (IRRI) in the Philippines and the Centre Francais du Riz (CFR) in
France, and in particular Tanguy Lafarge (CIRAD), Guy Clément (CIRAD/CRF) and Abdoulaye Sow
(AfricaRice).
Chapter 2: Predicting heat induced sterility of rice spikelets requires simulation of crop-generated microclimate
84
REFERENCES
Abrol, I.P., 1999. Sustaining rice/wheat system productivity in the Indo-Gangetic plains: water
management-related issues. Agricultural Water Management 40, 31–35.
Allen, R.G., Pereira, L.S., Raes, D., Smith, M, 1998. Crop evapotranspiration: Guidelines for computing
crop requirements. Irrigation and Drainage Paper No 56, FAO, Rome, Italy, 300p.
Atlin, G.N., Lafitte, H.R., 2002. Developing and testing rice varieties for water-saving systems in the
tropics. In: Bouman, B.A.M., Hengsdijk, H., Hardy, B., Bindraban, P.S., Tuong, T.P., Ladha, J.K.
(Eds.), Water- Wise Rice Production. Proceedings of the International Workshop on Water
Wise Rice Production, Los Baños, Philippines, 8–11 April. International Rice Research Institute
(IRRI), Los Baños, Philippines, pp. 275–283.
Baker, J.T., Allen Jr., L.H., Boote, K.J., 1992. Effects of CO2 and temperature on growth and yield of
rice. Journal of Experimental Botany 43, 959–964.
Bouman, B. A. M., Kropff, M.J., Tuong T.P., Wopereis M.C.S., ten Berge, H.F.M., van Lax, H.H., 2001.
ORYZA2000: Modeling lowland rice. Los Baños, Philippines: International Rice Research
Institute (IRRI) and Wageningen, The Netherlands: Wageningen university and research
center. 234p.
Cabangon, R. J., Castillo, E. G., Bao, L. X., Lu G., Wang, G. H.,. Cui Y.L., Tuong T. P., Bouman, B. A. M, Li,
Y. H., Chen, C. D., Wang, J. Z., 2001. Impact of Alternate Wetting and Drying Irrigation on Rice
Growth and Resource-Use Efficiency. Water-Saving Irrigation for Rice workshop, Wuhan,
China.
Chung, G.S, 1979. The rice cold tolerance program in Korea. In: Report of a rice cold tolerance
workshop. Los Baños, Philippines: International Rice Research Institute (IRRI), pp. 7–19.
De Vries, M.E., Rodenburg, J., Bado, B.V., Sow, A., Leffelaar, P.A., Giller, K.E., 2010. Rice production
with less irrigation water is possible in a Sahelian environment. Field Crops Research. 116,
154–164.
Dingkuhn, M., A. Sow, A. Samb, S. Diack, F. Asch. 1995. Climatic determinants of irrigated rice
performance in the Sahel. I. Photothermal and microclimatic responses of flowering.
Agricultural Systems 48, 385-410.
Dingkuhn, M., K.M. Miezan. 1995. Climatic determinants of irrigated rice performance in the Sahel. II.
Validation of photothermal constants and characterization of genotypes. Agricultural
Chapter 2: Predicting heat induced sterility of rice spikelets requires simulation of crop-generated microclimate
85
Systems 48, 411-434Dingkuhn, M., 1995. Climatic determinants of irrigated rice performance
in the Sahel. III. Characterizing environments by simulating the crop's photothermal
responses. Agricultural Systems 48, 435–456.
Dingkuhn, M., 1995. Climatic determinants of irrigated rice performance in the Sahel. III.
Characterizing environments by simulating the crop's photothermal responses. Agricultural
Systems 48, 435–456.
Dingkuhn, M., 1997. Characterizing irrigated rice environments using the rice phenology model
RIDEV. In: Miezan, K.M., Wopereis, M.C.S., Dingkuhn, M., Deckers, J., and Randolph, T.F.
(Eds.). Irrigated Rice in the Sahel: Prospects for Sustainable Development. West Africa Rice
Development Association, B.P. 2551, Bouake 01, Cote d'Ivoire, ISBN 92 9113 1091, pp. 343–
360.
Dingkuhn, M, Baron, C, Bonnal, V, Maraux, F, Sarr, B, Sultan, B, Clopes, A, Forest, F., 2003.
Decisionsupport tools for rain-fed crops in the Sahel at the plot and regional scale. In: Struif-
Bontkes TE, Wopereis MCS (Eds). A practical guide to decision-support tools for agricultural
productivity and soil fertility enhancement in Sub-Saharan Africa. IFDC, CTA, pp. 127–139
Ekanayake, I.J., De Datta, S.K., Steponkus, P.L., 1993. Effect of water deficit stress on diffusive
resistance, transpiration and spikelet desiccation of rice (Oryza sativa L.). Annals of Botany
72, 73–80.
Farrell, T.C., Fox, K.M., Williams, R.L., Fukai, S., 2006. Genotypic variation for cold tolerance during
reproductive development in rice: Screening with cold air and cold water. Field Crops
Research 98, 178–194.
Griest, G.H., 1986. Rice. Longman, Singapore.
Hamdani, A.R., 1979. Low-temperature problems and cold tolerance research activities for rice in
India. In: Rice cold tolerance workshop report, Los Baños, Philippines: International Rice
Research Institute (IRRI), p. 39–48.
Imin, N., Kerim, T., Weinman, J.J., Rolfe, B.G., 2006. Low temperature treatment at the young
microspore stage induces protein changes in rice anthers. Molecular and Cellular Proteomics
2, 274–92.
Ishihara, K., Kiyota, E., Imaizumi, N., 1990. Transpiration and photosynthesis characteristics of the
panicle in comparison to the flag leaf in the rice plant. Japanese Journal of Crop Science 59,
321–326.
Jagadish, S. V. K., Muthurajan, R. , Oane, R., Wheeler, T. R., Heuer, S, Bennett, J., Craufurd, P. Q. 2010.
Physiological and proteomic approaches to address heat tolerance during anthesis
Chapter 2: Predicting heat induced sterility of rice spikelets requires simulation of crop-generated microclimate
86
in rice (Oryza sativa L.). Journal of Experimental Botany 61, 143–156.
Jagadish, S. V. K., Muthurajan, R., Rang, Z.R., Malo, R., Heuer, S, Bennett, J., Craufurd, P., 2011.
Spikelet proteomic response to combined water deficit and heat stress in rice (Oryza sativa
cv. N22). Rice 4, 1–11.
Jones, J.W., Hoogenboom, G., Porter, C.H., Boote, K.J., Batchelor, W.D., Hunt, L.A., Wilkens, P.W.,
Singh, U., Gijsman, A.J., Ritchie, J.T, 2003. The DSSAT cropping system model. European
Journal of Agronomy 18, 235–265
Julia C, Dingkuhn M. 2012. Variation in time of day of anthesis in rice in different climatic
environments. Eur.J.Agron. 43, 166–174
Kobayasi, K., Matsui, T., Yoshimoto, M., Hasegawa, T., 2010. Effects of Temperature, Solar Radiation,
and Vapor-Pressure Deficit on Flower Opening Time in Rice. Plant Production Science 13, 21–
28.
Krishnan, P., Swain, D.K., Chandra, Bhaskar, B., Nayak, S.K., Dash, R.N., 2007. Impact of elevated CO2
and temperature on rice yield and methods of adaptation as evaluated by crop simulation
studies. Agriculture, Ecosystems and Environment 122, 233–242.
Kuk, Y.I., Shin, J.S., Burgos, N.R., Hwang, T.E., Han, O., Cho, B.H., Jung, S.Y., Guh, J.O., 2003.
Antioxidative enzymes offer protection from chilling damage in rice plants. Crop Science 43,
2109–2117.
Matsui, T., Namuco, O.S., Ziska, L.H., Horie, T., 1997. Effects of high temperature and CO2
concentration on spikelet sterility in indica rice. Field Crops Research 51, 213–219.
Matsui, T., Kobayasi, K., Yoshimoto, M., Hasegawa, T., 2007. Stability of rice pollination in the field
under hot and dry conditions in the Riverina region of New South Wales, Australia. Plant
Production Science 10, 57–63.
Muthurajan R, Shobbar ZS, Jagadish SV, Bruskiewich R, Ismail A, Leung H, Bennett J., 2011.
Physiological and proteomic responses of rice peduncles to drought stress. Molecular
Biotechnology 48, 173–82.
Nishiyama I., Blanco L., 1980. Avoidance of high temperature sterility by flower opening in the early
morning. Japan Agricultural Research Quarterly 14, 116–117.
Nishiyama, I., Satake, T., 1981. High temperature damage in rice plants. Japanese Journal of Crop
Science 25, 14–19.
Chapter 2: Predicting heat induced sterility of rice spikelets requires simulation of crop-generated microclimate
87
O’Toole, J.C., Namuco, O.S., 1983. Role of panicle exsertion in water stress induced sterility. Crop
Science 23, 1093–1097
O'Toole, J.C., Garrity, D.P., 1984. Upland rice soil-plant water relationships. pp. 395-441. In:
Ananymous. An Overview of Upland Rice Research. International Rice Research Institute, Los
Banos, Philippines.Satake, T., Hayase, H., 1970. Male sterility caused by cooling treatment at
the young microspore stage in rice plants. V. Estimation of pollen developmental stage and
the most sensitive stage to coolness. Proceedings of the Crop Science Society of Japan 39,
468–473.
Satake, T., Hayase, H., 1970. Male sterility caused by cooling treatment at the young microspore
stage in rice plants. V. Estimation of pollen developmental stage and the most sensitive stage
to coolness. Proc Crop Sci Soc Jpn. 39, 468–473.
Satake, T., 1976. Determination of the most sensitive stage to sterile-type cool injury in rice plants.
Research Bulletin Hokkaido Natl. Agricultural Experiment Station 113, 1–44.
Satake, T., Yoshida, S., 1978. High temperature-induced sterility in indica rice at flowering. Japanese
Journal of Crop Science 47, 6–17.
Satake, T, Lee, S.Y., Koike, S., 1988. Male sterility caused by cooling treatment at the young
microspore stage in rice plants. XXVIII. Prevention of cool injury with the newly devised water
management practices. Japanese Journal of Crop Science 57, 234–241.
Sato, Y., Masuta, Y., Saito, K., Murayama, S., Ozawa, K., 2011. Enhanced chilling tolerance at the
booting stage in rice by transgenic overexpression of the ascorbate peroxidase gene, OsAPXa.
Plant Cell Reports 40, 399–406
Shah F, Huang J, Cui K, Nie L, Shah T, Chen C, Wang K., 2011. Impact of high-temperature stress on
rice plant and its traits related to tolerance. Journal of Agricultural Science 149, 545–556.
Sheehy, J.E., Elmido A.E., Centeno, H.G.S., Pablico, P.P., 2005. Searching for new plants for climate
change. Journal of Agricultural Meteorology 60, 463–468.
Sheehy, J.E., Mitchell, P.L., Ferrer, A.B., 2006. Decline in rice grain yields with temperature: models
and correlations can give different estimates. Field Crops Research 98, 151–156.
Shimono, H., Hasegawa, T., Moriyama, M., Fugimura, S., Nagata, T., 2005. Modeling spikelet sterility
induced by low temperature in rice. Agronomy Journal 97, 1524–1536.
Shimono, H., Okada, M., Kanda, E., Arakaw, I., 2007. Low temperature-induced sterility in rice:
Evidence for the effects of temperature before panicle initiation. Field Crops Research 101,
221–231.
Chapter 2: Predicting heat induced sterility of rice spikelets requires simulation of crop-generated microclimate
88
Shreshta, S, Asch, F, Dingkuhn, M, Becker, M., 2011. Cropping calendar options for rice–wheat
production systems at high-altitudes. Field Crops Research 121, 158–167.
Takahashi, N., Isogai, A., Ling, P. P., Kato, Y., Kurata, K., 2008. Effects of elevated atmospheric carbon
dioxide concentration on silica deposition in rice (Oryza sativa L.) panicle. Plant Production
Science 11, 307–315.
Terai, K., Masaki, S., Kawamoto, t., Matsumoto, S., Kodama, I., Yamashita, S., 1990. Transpiration and
photosynthesis characteristics of the panicle in comparison with the flag leaf in the rice plant.
Japanese Journal of Crop Science 59, 321–326.
Tian, X., Matsui, T., Li, S., Yoshimoto, M., Kobayasi, K., Hasegawa, T., 2010. Heat-induced floret
sterility of hybrid rice (Oryza sativa L.) cultivars under humid and low wind conditions in the
field of Jianghan Basin, China. Plant Production Science 13, 243–251.
Tokida T, Fumoto T, Cheng W, Matsunami T, Adachi M, Katayanagi N, Matsushima M, Okawara Y,
Nakamura H, Okada M, Sameshima R, Hasegawa T. 2010. Effects of free-air CO2 enrichment
(FACE) and soil warming on CH4 emission from a rice paddy field: Impact assessment and
stoichiometric evaluation. Biogeosciences 7, 2639–2653.
Tuong T.P., Bouman B.A.M., 2003. Rice production in water-scarce environments. Proceedings of the
Water Productivity Workshop, 12-14 November 2001, IWMI, Sri Lanka.
Wopereis, M.C.S., Haefele, S.M., Dingkuhn, M., Sow A., 2003. Decision support tools for irrgated rice-
based systems in the Sahel. In Struif Bontkes T.E., Wopereis M.C.S., (Eds). A practical guide to
decision-support tools for agricultural productivity and soil fertility enhancement in sub-
Saharan Africa. IFDC and CTA, Wageningen, The Netherlands, pp. 114–126.
Yan, C., Ding, Y.F., Liu, Z.H., Wang, Q.H., Li, G.H., He, Y., Wang, S.H., 2008. Temperature Difference
Between the Air and Organs of Rice Plant and Its Relation to Spikelet Fertility. Agricultural
Sciences in China 7, 678–685.
Yoshimoto, M., Oue, H., Takahashi, H., Kobayashi, K., 2005. The effects of FACE (Free-Air CO2
Enrichment) on temperatures and transpiration of rice panicles at flowering stage. Journal of
Agricultural Meteorology 60, 597–600.
Yoshimoto, M., Fukuoka, M., Hasegawa, T., Utsumi, M., Ishigooka, Y., Kuwagata, T., 2011. Integrated
micrometeorology model for panicle and canopy temperature (IM2PACT) for rice heat stress
studies under climate change. Journal of Agricultural Meteorology 67, 597–600.
Chapter 3: Development of RIDEV V.2, Rice Model of Phenology and Thermal Sterility of Spikelets
89
CHAPTER 3:
Development of RIDEV V.2, Rice Model of Phenology and Thermal
Sterility of Spikelets
Michael DINGKUHN, Cecile JULIA and Jean-Christophe SOULIE
CIRAD/IRRI
Funded by AfricaRice, September 2011 to March 2012
07/04/2012
INTRODUCTION
The following report describes the development of RIDEV, a crop model simulating rice
phenology and thermal-stress related spikelet sterility, developed in the context of this thesis. In fact,
the CGIAR center AfricaRice commissioned the development of RIDEV in a 6-month project that also
funded the extension of the stipend for this thesis after the initial 3-year period. The RIDEV report
can thus be seen as a direct product of the thesis research, adding an engineering component to the
scientific research described in chapters 1 and 2. The model was developed entirely on the basis of
the data generated by this thesis.
RIDEV makes use of (1) the information on phenology and time of day of anthesis as
described in chapter 1, and (2) panicle temperature and its relationship with observed spikelet
sterility as described in chapter 2. Additional data analyses, not described in the two chapters of
floodwater temperature (important for the simulation of chilling induced sterility) are also presented
in this report.
There is one notable difference between the analysis of panicle temperature presented in
chapter 2 and RIDEV. The multiple linear regression model developed in chapter 2 on the basis of
observations in 3 environments (Senegal cool and hot dry seasons, Philippines) was not available yet
at the time RIDEV was programmed in its current form:
Chapter 3: Development of RIDEV V.2, Rice Model of Phenology and Thermal Sterility of Spikelets
90
Model 1
TD = 1.578 + 1.093 VPD_2m + 0.189 Ta_2m – 0.0337 Top_P – 0.00339 Rs + 0.0331 H
Where TD =Ta-Tp, difference between air and panicle temperature (in °C)
VPD_2m = Vapour pressure deficit at 2m from the ground (in kPa)
Ta_2m = Air temperature at 2m from the ground (in °C)
Top_P = the position of the highest panicle from the ground (in cm)
Rs = Solar radiation (in W/m²)
H = sun height or solar angle (in degree)
Instead, a different regression model based on the Senegal data only was used, as follows (details in
the RIDEV report, below):
Model 2
TD = 0.782 + 0.422 Ta_2m -0.0443 RH_2m – 0.00287 Rs – 8.05 Z – 6.59 LTR
Where TD =Ta-Tp, difference between air and panicle temperature (in °C)
Ta_2m = Air temperature at 2m from the ground (in °C)
RH_2m = Relative humidity at 2m from the ground (in %)
Rs = Solar radiation (in W/m²)
LTR = Light transmission ratio
The two models yielded very similar results. RIDEV will be modified to implement Model 1 in its final
version.
REPORT
1. Project synopsis
This 6-month project generated the prototype of RIDEV V.2, a much improved new edition of
the phenology /sterility rice model RIDEV V.1 of the 1990s. As such, it involved far greater investment
than the 6-month funding of the PhD student Cecile JULIA: It is the result of a nearly 4-year PhD
thesis and several man-months of senior scientists Michael Dingkuhn and Jean-Christophe Soulie. On
the scientific side, innovations include the simulation of panicle temperature and environment
dependent time of day of anthesis (needed for accurate sterility simulations under heat), as well as
the choice of 4 models of photoperiodism. On the informatics and development side, the model has
been developed as a shared library using C++ and is coupled with with the statistical programming
software R for graphical user interface and estimation tools, enabling multi-environment parameter

Chapter 3: Development of RIDEV V.2, Rice Model of Phenology and Thermal Sterility of Spikelets
91
optimizations in a user-friendly way. This system now needs through validation before it begins its
life (the software as a whole or only the model itself) in the hands of very diverse user communities.
These will include decision aide at the producer or extension level, research on crop/system
adaptation to climate change and variability, and phenotyping of crop panels for genetic studies. The
model’s source code, screens of the interface and templates for external files are provided with this
report.
2. Scientific background and objectives
2.1 The old RIDEV
This project served to develop a new version of RIDEV, a cereal model of crop phenology and
thermal stresses causing sterility of the spikelets on inflorescences, causing yield losses. The original
RIDEV model, developed in 1995 for irrigated rice systems in the Sahel (Dingkuhn, 1997; Wopereis et
al., 2003), was implemented in GW Basic language and had two versions, RIDEV_Sim (enabling
predictive simulations for climatic risk analyses and farmers’ guidance to chose appropriate crop
calendars) and RIDEV_Cal (enabling parameterization against target files containing phenological
observations, using a simple optimization procedure). The model was initially used for a regional
study of thermal risks (Dingkuhn et al., 1995), varietal characterization (Dingkuhn and Miezan, 1995)
and elaboration of cropping calendars (Dingkuhn, 1995), and thereafter as an agronomic decision
tool by WARDA (now AfricaRice) and its NARS partners.
RIDEV differs from other crop models (1) in its simplicity, (2) focus on phenology and sterility,
and (3) consideration of crop microclimate, namely simulation of organ temperature as a function of
the apex’ position in the soil-floodwater-atmosphere continuum.
The original RIDEV model increasingly became obsolete for a couple of reasons:
- The software basis (GW Basic on DOS) is outdated
- No investment in software maintenance and improvement
- Changes in germplasm, for which no calibration was available
- Apparently, changes in crop phenology at the Senegal study sites, either through genetic drift
in the varieties (analogous to sorghum and millet during the same period? (…)) or climate
change (CC), resulting in loss of model accuracy with the old parameter settings.
2.2 Need for a new RIDEV and projected users
A new version of RIDEV is needed, based on modern programming language, expanded
domain of geographic validity and incorporation of new scientific knowledge on rice biology. The
model is needed for the following applications:
Chapter 3: Development of RIDEV V.2, Rice Model of Phenology and Thermal Sterility of Spikelets
92
- Simulator of the crop time frame of a new decision toll for farmers currently under
development at AfricaRice and IRRI, the Rice Manager (predictive mode of model
application)
- Applications in the context of climate risk analyses for crops, measurement of CC impacts
and development of adaptation strategies for CC, as pursued by CCAFS, GRiSP and other
CGIAR Research Programs (predictive mode)
- Model-assisted phenotyping of photothermal response traits in rice and cereals in general,
through parameter optimization against observed datasets, as required by the GRiSP Global
Rice Phenotyping Network (…) and the ORYTAGE project (reverse or heuristic mode)
The first two applications require a modernized equivalent of RIDEV_Sim, but will also
require an equivalent of RIDEV_Cal as parameterization tool. The last application (phenotyping)
mainly requires a new equivalent of RIDEV_Cal equipped with a powerful parameter optimization
tool suited to multi-environment fitting for hundreds of genotypes (context of genetic QTL and
association studies).
The main potential users are AfricaRice, IRRI and CCAFS, as well as their local, regional and
global collaborators.
2.3 Skills expected from the new RIDEV (V.2)
The following skills are expected of RIDEV V.2:
- Simulation of the date of the main phenological events panicle initiation (PI), flowering (F)
and maturity (M) of the crop as a function of genotype, sowing date, cultural practice
(flooded-irrigated or upland; transplanting or direct seeding), thermal conditions of the
apical growing point and day length dynamics (function of calendar date and geographical
latitude)
- Simulation of fraction of sterile spikelets resulting from adverse temperatures (heat or cold)
of the affected organs during their sensitive periods (before and at flowering)
- Achievement of such simulations with minimal data requirements to enable applications at
sites where environmental data are scarce: daily minimum and maximum air temperature
(Tmin, Tmax), geo-reference, and if necessary, some commonly available atmospheric
variables from weather stations (but not solar radiation, which is frequently unavailable)
- Achievement of model calibration for specific genotypes using easily measureable
phenological variables and spikelet sterility fraction (but this for a variety of sowing dates
and/or latitudes as source of thermal and day-length variation)
Chapter 3: Development of RIDEV V.2, Rice Model of Phenology and Thermal Sterility of Spikelets
93
- An in-built tool for parameter optimization using automated sensitivity analysis, suited for
multi-environment fitting of parameters and serial parameterization of large genotype
numbers as needed for model-assisted phenotyping
The specific skill of the original RIDEV, namely to simulate key components of microclimate
(e.g., floodwater temperature) are to be conserved and improved in RIDEV V.2. In addition, heat-
induced spikelet sterility is to be simulated on the basis of two innovations, (1) time of day of
anthesis and (2) panicle temperature at that time. These innovative improvements benefit from the
results of Cecile Julia’s thesis on exactly those issues (Chapters 1 and 2).
Lastly, RIDEV V.2 will also optionally simulate phenology under dryland conditions (but
without considering drought), in a mode that simply bypasses the calculation of the microclimate
specific to flooded irrigated rice (use of air temperature at 2m instead of simulated microclimate).
2.4 Product package delivered upon completion of project
Along with this terminal report (due date 31 March 2012), or not more than 1 month after its
submission, we will provide the following products to AfricaRice:
- An operational prototype of RIDEV V.2 including a user interface permitting individual
simulations, external-file driven series of simulations and automatic parameterization (multi-
environment fitting using optimization tool)
- Test parameter optimizations and simulation outputs for selected Risocas field results: (1) 3
rice varieties x 11-13 sowing dates under full irrigation at Ndiaye, Senegal (thesis Stürz) and
(2) 9 sorghum genotypes x 3 sowing dates x 3 sites in Mali
- Source code of the model: RIDEV model and user interface written in Tcl/Tk, parameter
optimization tool written in R, the two linked through user interface
- Preliminary, “minimalist” instruction manual for user
3. Description of RIDEV V.2 model
3.1 Simulation of thermal time
Daily heat units (degree-days) are calculated from Tmin and Tmax of the appropriate entity
(air, floodwater, a weighted average of both, or panicle, depending on developmental stage) using a
linear broken-stick model. A physiological temperature Tphys is calculated as state variable.
Temperatures below Tbase are disregarded (Tphys=0), temperatures between Tbase and Topt are
considered effective (Tphys=Tact-Tbase), and temperatures above Topt are also considered
ineffective (Tphys=Topt).
Chapter 3: Development of RIDEV V.2, Rice Model of Phenology and Thermal Sterility of Spikelets
94
To account for diurnal patterns of T, which potentially incur Tact<Tbase or Tact>topt during
part of the day), an empirical standard distribution of T during the 24-h cycle is implemented with
hourly integration. This relative diurnal pattern is dimensioned on a daily basis using T extrema (Tmin
and Tmax of the entity concerned) and calculated day length including civil twilight (the night and
day portions of the pattern are “stretched” or “compressed” according to photoperiod). A partial
Tphys is calculated for each hour and accrued for 24 hours.
Thermal time of a day is equal to Tphys of the same day.
3.2 Simulation of phenological phases
RIDEV V.2 considers sequentially a Basic Vegetative Phase (BVP), a Photoperiod-Sensitive
Phase (PSP), a Reproductive phase (RPR) and a maturation phase (MAT). BVP, RPR and MAT are
considered to be of constant thermal duration for a given genotype, unless transplanting shock as
parameterized by the user extends the BVP. PSP thermal duration is considered to depend on both
temperature and day length on the basis of 4 alternative models the user can choose from.
Thermal time (or a day-length dependent term) is accrued until a critical value is attained,
followed by the onset of the subsequent phonological phase.
3.3 Simulation of photoperiod sensitivity
Because considerable uncertainty persists on the way how day length affects PSP duration,
and because different cereal species behave differently, the user is given the choice of 4 models of
photoperiod sensitivity.
PP Model 1: Linear “quantitative” model
This model follows the classical concept of Major and also resembles the model implemented in the
original RIDEV. It accrues [dPsp = PPsens * Tphys * max(PP-PPcrit, 0)] using [Psp = Psp + dPsp] until
[PSP >= 1], which is when panicle initiation (PI) happens and the RPR starts. PPsens sets the
sensitivity to day length (0…1) and PPcrit (10…12) sets the day length below which no response to it
occurs. The model assumes a gradual (quantitative) response, as opposed to a threshold-type
(qualitative) response.
PP Model 2: Curvi-linear model able to approximate both qualitative and quantitative responses
This model is identical to Model 1 except for the introduction of parameter PPexp (1…10), an
exponent that renders the effect of day length progressive. This is found in many traditional cereals,
Chapter 3: Development of RIDEV V.2, Rice Model of Phenology and Thermal Sterility of Spikelets
95
notably in sorghum and millet. If [PPexp=1] then Model 2 gives the same results as Model 1.
PP Model 3: Effect of day-to-day change of day length
This model was considered by Clerget et al. (2004) for sorghum and supposes that short-day plants
are actually decreasing-day plants. The model calculates at day-to-day change in day length [dPP =
PP-PPold] and accrues the term [dPsp = PPsens * Tphys * max(dPP-PPcrit, 0)]. PPsens can assume
values [0…1] and PPcrit [0…0.2], the latter usually with very small values (0.003 or less). This model
does not always give convincing results but was considered here because it makes a fundamentally
different assumption on photoperiodism.
PP Model 4 : Impatience
This model was specifically developed for sorghum where it is the only one able to accurately predict
the crop’s phenology in the off-season (Dingkuhn et al., 2008). Its broader applicability for crops
remains to be evaluated but there are indications that it captures a generic phenomenon. The
principle is that PI occurs when the plant is exposed to a critical day length (shortness of day), but
that this threshold moves as the plant’s wait state (PSP) gets longer. This is the “impatience”
principle, analogous to animal ethology (threshold lowering under prolonged wait states for an
external signal). PPsens=0…1.5, PPexp=0.1…1, SeuilPP=12.5…15. (PPcrit, a parameter also present in
this model, was permanently set to 11.5 because it seems not to vary.)
3.4 Simulation of floodwater temperature
Floodwater temperature can be very different from air temperature through evaporative
cooling and shading by the canopy. We used data generated by the thesis of Cecile Julia from Senegal
(cold and hot seasons), Camargue (summer) and IRRI (dry season) to construct an empirical model.
An initial attempt to use a multiple regression model was abandoned because it gave unrealistic
predictions for extremely humid situations (characterized by small daily Tmax-Tmin differentials) that
were not represented in the data but do occur in the monsoonal wet season. We thus constructed a
logical model that forced T(water)-T(air) differentials to be equal to zero when air Tmax-Tmin equals
zero (theoretical humid situation with minimal sunlight).
The resulting model is presented in the box below. Its parameters were optimized against
observations using the solver utility of Microsoft Excel.
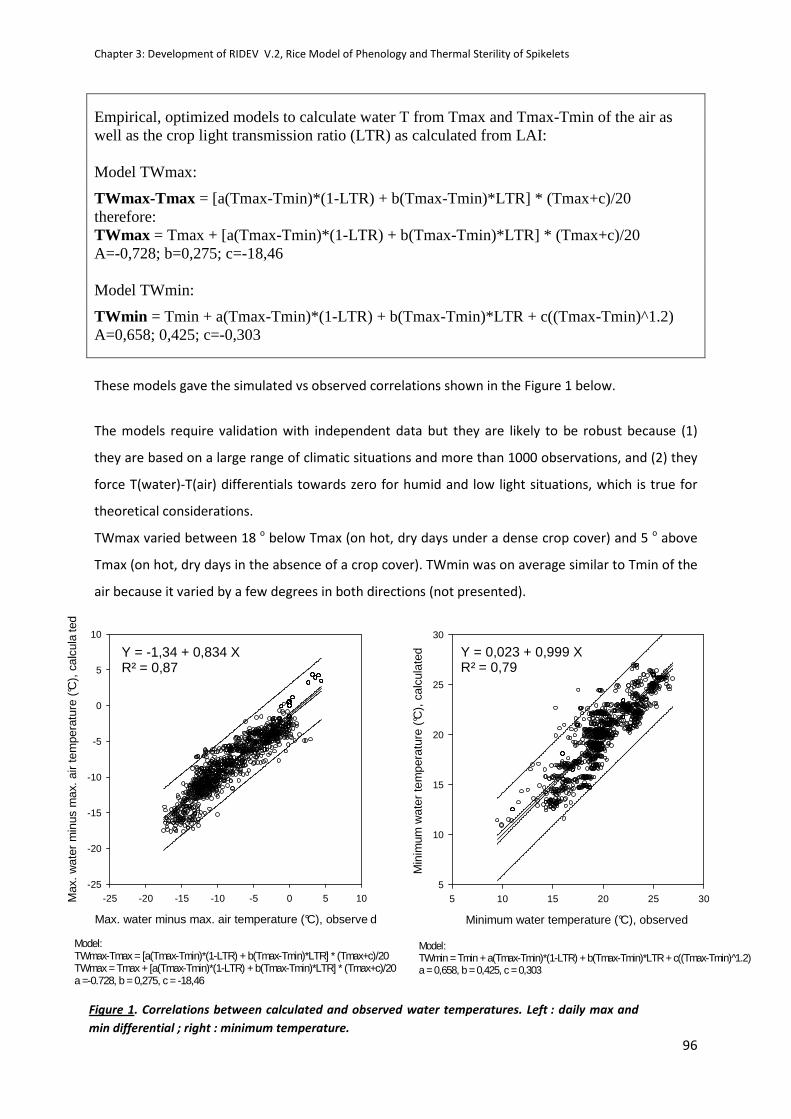
Chapter 3: Development of RIDEV V.2, Rice Model of Phenology and Thermal Sterility of Spikelets
96
Empirical, optimized models to calculate water T from Tmax and Tmax-Tmin of the air as well as the crop light transmission ratio (LTR) as calculated from LAI: Model TWmax:
TWmax-Tmax = [a(Tmax-Tmin)*(1-LTR) + b(Tmax-Tmin)*LTR] * (Tmax+c)/20 therefore: TWmax = Tmax + [a(Tmax-Tmin)*(1-LTR) + b(Tmax-Tmin)*LTR] * (Tmax+c)/20 A=-0,728; b=0,275; c=-18,46 Model TWmin:
TWmin = Tmin + a(Tmax-Tmin)*(1-LTR) + b(Tmax-Tmin)*LTR + c((Tmax-Tmin)^1.2) A=0,658; 0,425; c=-0,303
These models gave the simulated vs observed correlations shown in the Figure 1 below.
The models require validation with independent data but they are likely to be robust because (1)
they are based on a large range of climatic situations and more than 1000 observations, and (2) they
force T(water)-T(air) differentials towards zero for humid and low light situations, which is true for
theoretical considerations.
TWmax varied between 18 o below Tmax (on hot, dry days under a dense crop cover) and 5 o above
Tmax (on hot, dry days in the absence of a crop cover). TWmin was on average similar to Tmin of the
air because it varied by a few degrees in both directions (not presented).
Y = -1,34 + 0,834 XR² = 0,87
Max. water minus max. air temperature (°C), observe d
-25 -20 -15 -10 -5 0 5 10Max
. wat
er m
inus
max
. air
tem
pera
ture
(°C
), c
alcu
late
d
-25
-20
-15
-10
-5
0
5
10
Y = 0,023 + 0,999 XR² = 0,79
Minimum water temperature (°C), observed
5 10 15 20 25 30
Min
imum
wat
er te
mpe
ratu
re (
°C),
cal
cula
ted
5
10
15
20
25
30
Model:TWmin = Tmin + a(Tmax-Tmin)*(1-LTR) + b(Tmax-Tmin)*LTR + c((Tmax-Tmin) 1̂.2)a = 0,658, b = 0,425, c = 0,303
Model:TWmax-Tmax = [a(Tmax-Tmin)*(1-LTR) + b(Tmax-Tmin)*LTR] * (Tmax+c)/20TWmax = Tmax + [a(Tmax-Tmin)*(1-LTR) + b(Tmax-Tmin)*LTR] * (Tmax+c)/20a =-0.728, b = 0,275, c = -18,46
Figure 1. Correlations between calculated and observed water temperatures. Left : daily max and
min differential ; right : minimum temperature.
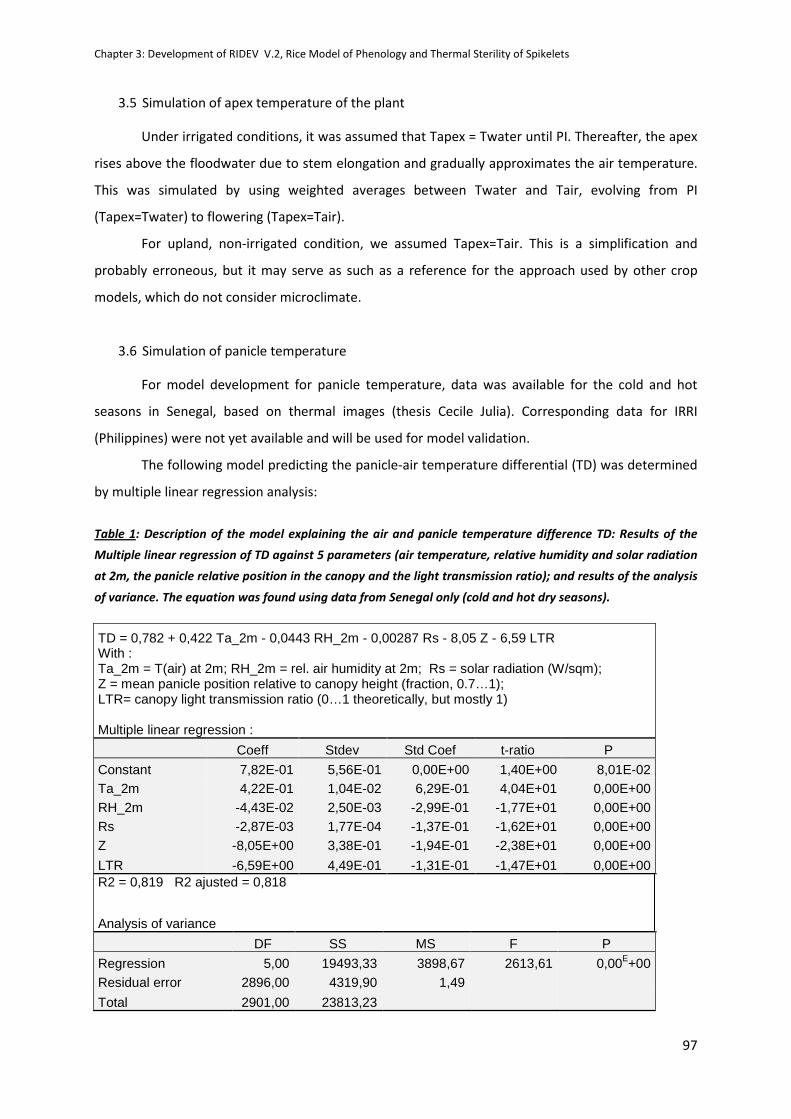
Chapter 3: Development of RIDEV V.2, Rice Model of Phenology and Thermal Sterility of Spikelets
97
3.5 Simulation of apex temperature of the plant
Under irrigated conditions, it was assumed that Tapex = Twater until PI. Thereafter, the apex
rises above the floodwater due to stem elongation and gradually approximates the air temperature.
This was simulated by using weighted averages between Twater and Tair, evolving from PI
(Tapex=Twater) to flowering (Tapex=Tair).
For upland, non-irrigated condition, we assumed Tapex=Tair. This is a simplification and
probably erroneous, but it may serve as such as a reference for the approach used by other crop
models, which do not consider microclimate.
3.6 Simulation of panicle temperature
For model development for panicle temperature, data was available for the cold and hot
seasons in Senegal, based on thermal images (thesis Cecile Julia). Corresponding data for IRRI
(Philippines) were not yet available and will be used for model validation.
The following model predicting the panicle-air temperature differential (TD) was determined
by multiple linear regression analysis:
Table 1: Description of the model explaining the air and panicle temperature difference TD: Results of the
Multiple linear regression of TD against 5 parameters (air temperature, relative humidity and solar radiation
at 2m, the panicle relative position in the canopy and the light transmission ratio); and results of the analysis
of variance. The equation was found using data from Senegal only (cold and hot dry seasons).
TD = 0,782 + 0,422 Ta_2m - 0,0443 RH_2m - 0,00287 Rs - 8,05 Z - 6,59 LTR With : Ta_2m = T(air) at 2m; RH_2m = rel. air humidity at 2m; Rs = solar radiation (W/sqm); Z = mean panicle position relative to canopy height (fraction, 0.7…1); LTR= canopy light transmission ratio (0…1 theoretically, but mostly 1) Multiple linear regression :
Coeff Stdev Std Coef t-ratio P
Constant 7,82E-01 5,56E-01 0,00E+00 1,40E+00 8,01E-02 Ta_2m 4,22E-01 1,04E-02 6,29E-01 4,04E+01 0,00E+00 RH_2m -4,43E-02 2,50E-03 -2,99E-01 -1,77E+01 0,00E+00 Rs -2,87E-03 1,77E-04 -1,37E-01 -1,62E+01 0,00E+00 Z -8,05E+00 3,38E-01 -1,94E-01 -2,38E+01 0,00E+00
LTR -6,59E+00 4,49E-01 -1,31E-01 -1,47E+01 0,00E+00 R2 = 0,819 R2 ajusted = 0,818
Analysis of variance
DF SS MS F P
Regression 5,00 19493,33 3898,67 2613,61 0,00E+00 Residual error 2896,00 4319,90 1,49
Total 2901,00 23813,23
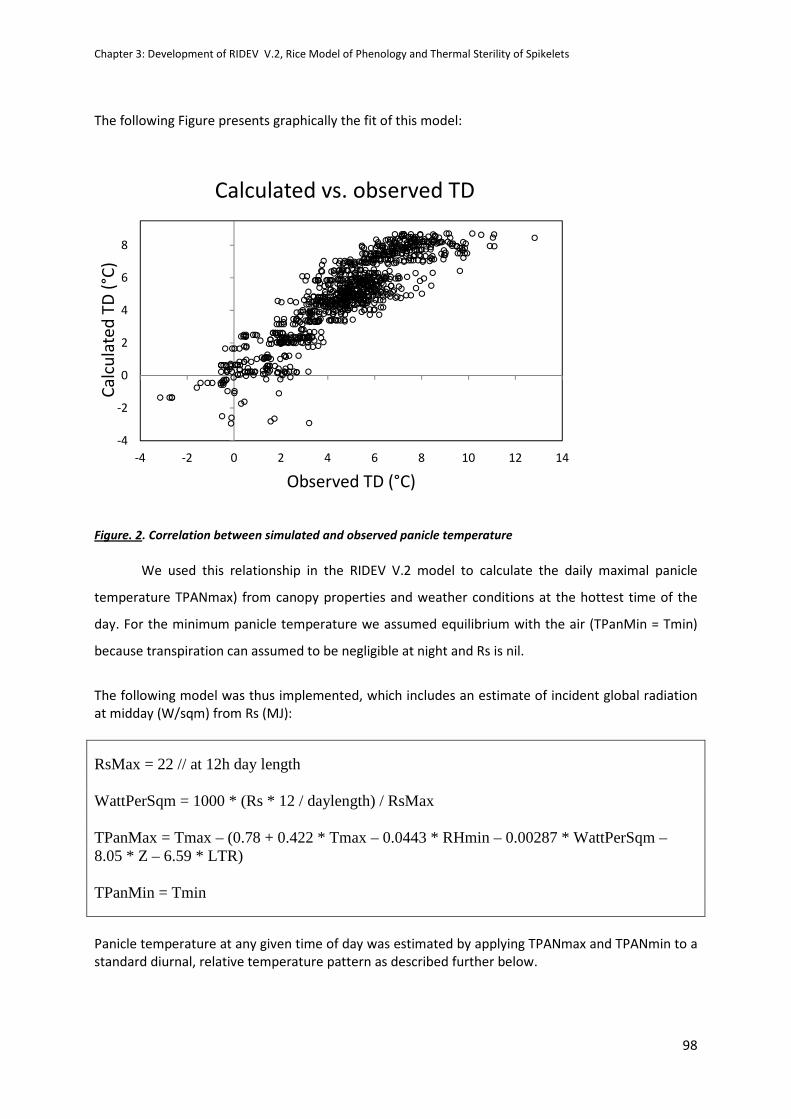
Chapter 3: Development of RIDEV V.2, Rice Model of Phenology and Thermal Sterility of Spikelets
98
The following Figure presents graphically the fit of this model:
Figure. 2. Correlation between simulated and observed panicle temperature
We used this relationship in the RIDEV V.2 model to calculate the daily maximal panicle
temperature TPANmax) from canopy properties and weather conditions at the hottest time of the
day. For the minimum panicle temperature we assumed equilibrium with the air (TPanMin = Tmin)
because transpiration can assumed to be negligible at night and Rs is nil.
The following model was thus implemented, which includes an estimate of incident global radiation
at midday (W/sqm) from Rs (MJ):
RsMax = 22 // at 12h day length WattPerSqm = 1000 * (Rs * 12 / daylength) / RsMax TPanMax = Tmax – (0.78 + 0.422 * Tmax – 0.0443 * RHmin – 0.00287 * WattPerSqm – 8.05 * Z – 6.59 * LTR) TPanMin = Tmin
Panicle temperature at any given time of day was estimated by applying TPANmax and TPANmin to a
standard diurnal, relative temperature pattern as described further below.
-4
-2
0
2
4
6
8
-4 -2 0 2 4 6 8 10 12 14
Ca
lcu
late
d T
D (
°C)
Observed TD (°C)
Calculated vs. observed TD
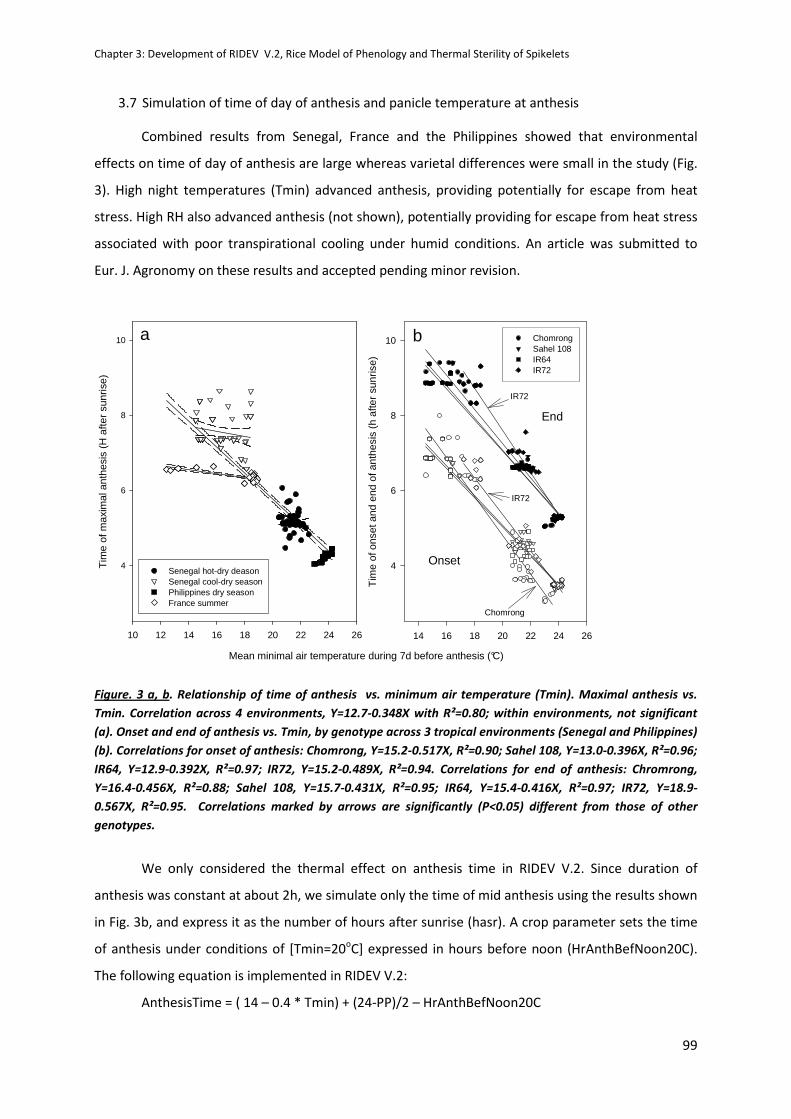
Chapter 3: Development of RIDEV V.2, Rice Model of Phenology and Thermal Sterility of Spikelets
99
3.7 Simulation of time of day of anthesis and panicle temperature at anthesis
Combined results from Senegal, France and the Philippines showed that environmental
effects on time of day of anthesis are large whereas varietal differences were small in the study (Fig.
3). High night temperatures (Tmin) advanced anthesis, providing potentially for escape from heat
stress. High RH also advanced anthesis (not shown), potentially providing for escape from heat stress
associated with poor transpirational cooling under humid conditions. An article was submitted to
Eur. J. Agronomy on these results and accepted pending minor revision.
Mean minimal air temperature during 7d before anthesis (°C)
10 12 14 16 18 20 22 24 26
Tim
e of
max
imal
ant
hesi
s (H
afte
r su
nris
e)
4
6
8
10
Senegal hot-dry deasonSenegal cool-dry seasonPhilippines dry seasonFrance summer
14 16 18 20 22 24 26
Tim
e of
ons
et a
nd e
nd o
f ant
hesi
s (h
afte
r su
nris
e)
4
6
8
10 ChomrongSahel 108 IR64IR72
Onset
End
Chomrong
IR72
IR72
a b
Figure. 3 a, b. Relationship of time of anthesis vs. minimum air temperature (Tmin). Maximal anthesis vs.
Tmin. Correlation across 4 environments, Y=12.7-0.348X with R²=0.80; within environments, not significant
(a). Onset and end of anthesis vs. Tmin, by genotype across 3 tropical environments (Senegal and Philippines)
(b). Correlations for onset of anthesis: Chomrong, Y=15.2-0.517X, R²=0.90; Sahel 108, Y=13.0-0.396X, R²=0.96;
IR64, Y=12.9-0.392X, R²=0.97; IR72, Y=15.2-0.489X, R²=0.94. Correlations for end of anthesis: Chromrong,
Y=16.4-0.456X, R²=0.88; Sahel 108, Y=15.7-0.431X, R²=0.95; IR64, Y=15.4-0.416X, R²=0.97; IR72, Y=18.9-
0.567X, R²=0.95. Correlations marked by arrows are significantly (P<0.05) different from those of other
genotypes.
We only considered the thermal effect on anthesis time in RIDEV V.2. Since duration of
anthesis was constant at about 2h, we simulate only the time of mid anthesis using the results shown
in Fig. 3b, and express it as the number of hours after sunrise (hasr). A crop parameter sets the time
of anthesis under conditions of [Tmin=20oC] expressed in hours before noon (HrAnthBefNoon20C).
The following equation is implemented in RIDEV V.2:
AnthesisTime = ( 14 – 0.4 * Tmin) + (24-PP)/2 – HrAnthBefNoon20C
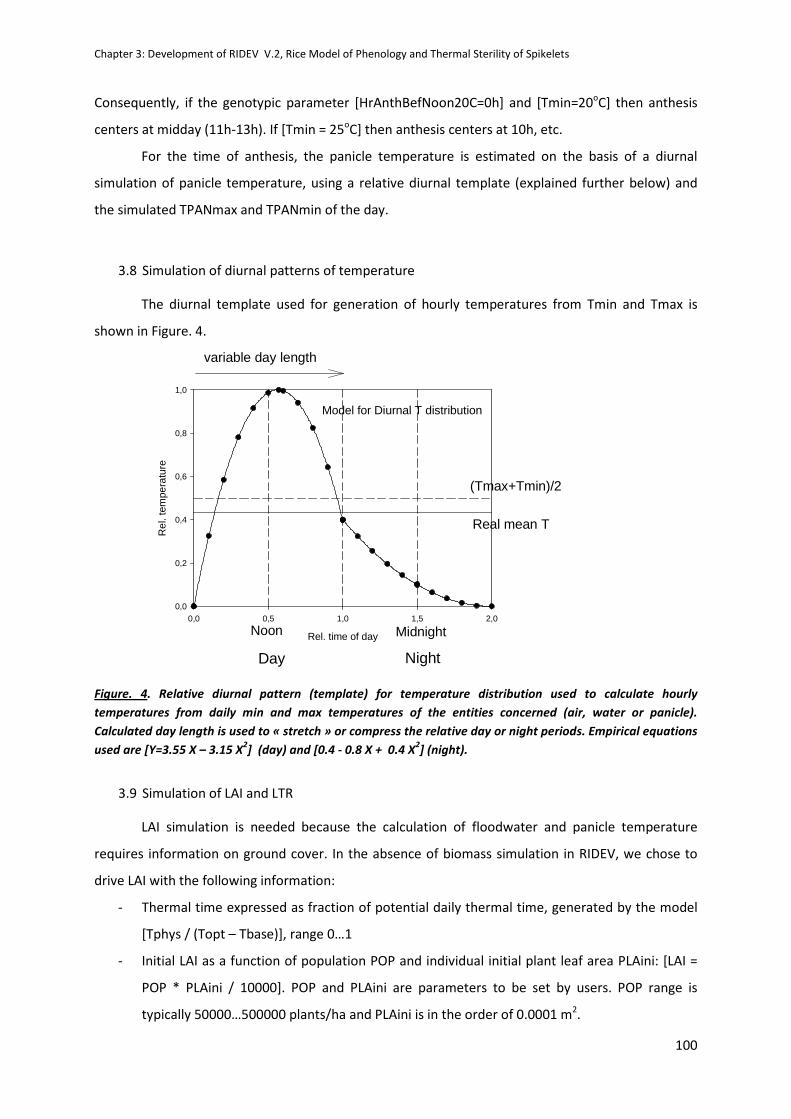
Chapter 3: Development of RIDEV V.2, Rice Model of Phenology and Thermal Sterility of Spikelets
100
Consequently, if the genotypic parameter [HrAnthBefNoon20C=0h] and [Tmin=20oC] then anthesis
centers at midday (11h-13h). If [Tmin = 25oC] then anthesis centers at 10h, etc.
For the time of anthesis, the panicle temperature is estimated on the basis of a diurnal
simulation of panicle temperature, using a relative diurnal template (explained further below) and
the simulated TPANmax and TPANmin of the day.
3.8 Simulation of diurnal patterns of temperature
The diurnal template used for generation of hourly temperatures from Tmin and Tmax is
shown in Figure. 4.
Model for Diurnal T distribution
Rel. time of day
0,0 0,5 1,0 1,5 2,0
Rel
. tem
pera
ture
0,0
0,2
0,4
0,6
0,8
1,0
Day Night
Noon Midnight
(Tmax+Tmin)/2
Real mean T
variable day length
Figure. 4. Relative diurnal pattern (template) for temperature distribution used to calculate hourly
temperatures from daily min and max temperatures of the entities concerned (air, water or panicle).
Calculated day length is used to « stretch » or compress the relative day or night periods. Empirical equations
used are [Y=3.55 X – 3.15 X2] (day) and [0.4 - 0.8 X + 0.4 X
2] (night).
3.9 Simulation of LAI and LTR
LAI simulation is needed because the calculation of floodwater and panicle temperature
requires information on ground cover. In the absence of biomass simulation in RIDEV, we chose to
drive LAI with the following information:
- Thermal time expressed as fraction of potential daily thermal time, generated by the model
[Tphys / (Topt – Tbase)], range 0…1
- Initial LAI as a function of population POP and individual initial plant leaf area PLAini: [LAI =
POP * PLAini / 10000]. POP and PLAini are parameters to be set by users. POP range is
typically 50000…500000 plants/ha and PLAini is in the order of 0.0001 m2.
Chapter 3: Development of RIDEV V.2, Rice Model of Phenology and Thermal Sterility of Spikelets
101
- Maximal leaf relative growth rate (LRGRmax), range 1.1…1.5 (resulting in daily multiplication
of LAI by 1.1 to 1.5 during exponential growth). Thus, [LAI = LAI * LRGRmax * Tphys/(Topt-
Tbase)]. LRGRmax is a crop parameter.
- Once LAI exceeds 1, linear growth is implemented using [LAI = LAI + (LRGRmax – 1) * 1 *
Tphys / (Topt – Tbase)]
- LAI is capped by the parameter LAImax
- If the transplanting option is chosen by user, a transplanting shock can be implemented that
delays both LAI and phenological development. The user chooses the duration of the shock
(parameter DDtransplantingShock, in degree-days, range 0…100), during which development
stops and leaf growth is halved.
This simple model can easily be calibrated to approximate common LAI patterns (post-flowering
dynamic are of no importance to RIDEV). No particular accuracy is needed because LAI simulation
only serves to estimate ground cover for water and panicle temperature calculation.
Light transmission ratio (LTR) is calculated with Lambert-Beer’s law, using the value of 0.6 for the
extinction coefficient:
LTR = exp (-0.6 * LAI)
LTR ranges from 0 (dense crop) to 1 (no crop).
3.10 Simulation of spikelet sterility
Thermal sterility is simulated on a range from 0 (none) to 1 (total). It is simulated for 3 different,
successive sensitive phases, each having a specific sensitivity set by a crop parameter:
1. Microspore stage: From 280 to 140 dd before flowering (sensitivity to cold based on
minimum water temperature; parameter CritSterCold1, range ca. 20 oC…10 oC)
2. Panicle exertion process: From 140 dd before flowering to flowering (sensitivity to cold based
on minimum air temperature; parameter CritSterCold2, range ca. 20 oC…10 oC)
3. Flowering stage: From 50 dd before flowering until 50dd after flowering (sensitivity to heat
based on temperature of the panicle at the hour of mid-anthesis; parameter CritSterHeat,
range ca. 30 oC…40 oC)
The mean thermal conditions during the sensitive phases are used to calculate the sterility fractions.
The 3 crop parameters set the temperature (oC) at which the sterility effect sets on, based on a
Chapter 3: Development of RIDEV V.2, Rice Model of Phenology and Thermal Sterility of Spikelets
102
constant progression of 0.2 per oC (resulting in 100 % sterility as the temperature progresses by 5 oC
beyond the critical value (parameter).
A 4th, constant source of sterility is simulated which stands for a genotypic baseline sterility
(parameter SterBase, range 0…1). Typical values are between 0.1 and 0.2. A value of 1.0 would
indicate genetic sterility as in male-sterile breeding lines.
The calculation of total sterility (base, SterCold1, SterCold2, SterHeat) is not additive because it
cannot exceed the value 1. It is calculated as follows:
SterTot = SterBase + (1 – SterBase) * (1-[(1-SterCold1) * (1-SterCold2) * (1-SterHeat)])
3.11 Model parameters, input variables and output variables
3.11.1 Model parameters
There are 10 model parameters setting the general conditions of the simulation, 8 setting
conditions for crop phenology (of which not all are always required, depending on choice of PP
model), and 4 setting conditions for sterility.
General conditions:
Latitude XX.XX, decimal
SowingDate dd/mm/yyyy
Flooding 0 or 1 binary
Transplanting 0 or 1 binary
DDTransplantingShock 0…100 (dd)
POP 50000…500000 (plants per ha)
PLAini ca. 0.0001 (m2)
LRGRmax 1.1…1.5 (adjusted visually to obtain appropriate LAI dynamics)
LAImax 2…12
Z Fraction of panicle height over canopy height (0.6…1)
Phenology:
BVPsum duration of BVP (200…800 dd) can be optimized
RPRsum duration of RPR (200…500 dd0 never optimize together with BVP; set to 350
MATsum duration of MAT (200…500 dd) can be optimized
PPsens )
PPcrit ) occur in different combinations in the 4 photoperiodism models
PPexp ) to choose from. Value ranges as described further up. Can be optimized
SeuilPP )
Sterility:
SterBase 0…1, typically 0.1 to 0.2 )
SterCold1 20…10 oC ) Can be optimized (rice)
SterCold2 20…10 oC )

Chapter 3: Development of RIDEV V.2, Rice Model of Phenology and Thermal Sterility of Spikelets
103
SterHeat 30…40 oC )
Only phenology and sterility parameters can be optimized and can be selected on the
optimization menu (Annexe 2). The other parameters must then be fixed manually beforehand.
Optimization can be performed as multi-fitting across different environments, cultural practices,
population densities etc., but always for the same genotype (variety). A minimum diversity of sowing
dates and/or latitudes (thus, day length and thermal conditions must be in the sample to allow
meaningful optimizations of phenology.
Optimization scenarios are read from an external spreadsheet.
3.11.2 Input variables from external source file (Annexe 3)
Tmin daily minimum air T (oC)
Tmax daily maximum air T (oC)
RHmin daily minimum relative humidity (%)
Rs daily cumulative solar global radiation (MJ)
(Optimizations also require observed crop data: duration from sowing to flowering (days), duration
from sowing to maturity (days), and sterility (fraction).
3.11.3 Output variables
DSowEndBVP Days from sowing to end of BVP
DSowPi Days from sowing to PI
DSowFlowering Days from sowing to flowering
DSowMaturity Days from sowing to maturity
SterCold1Out Cold sterility phase 1 (microspore)
SterCold2Out Cold sterility phase 2 (panicle exertion process)
SterHeatOut Heat sterility (flowering period)
SterTotOut Total sterility
4. Next steps
The model and software delivered with this end-of-project report is a prototype. It needs
validation on several points, namely the calculation of water and panicle temperature. Given the
diverse applications of the optimization/simulation system, or at least its heartpiece the model itself,
by numerous partners (AfricaRice and its regional partners, users of the Rice Manager, projects of
CCAFS, projects of the GRiSP phenotyping network), initial validation should be through and
durable.
This report will be amended in late 2012 as some validation work and additional publications become
available.
Chapter 3: Development of RIDEV V.2, Rice Model of Phenology and Thermal Sterility of Spikelets
104
REFERENCES
Clerget, B., Dingkuhn, M., Chantereau, J., Hemberger, J., Louarn , G., Vaksmann, M., 2004. Does
panicle initiation in tropical sorghum depend on day-to-day change in photoperiod? Field
Crops Res. 88, 11–27. (Paper received ICRISAT Millenium Award in 2006)
Dingkuhn, M., A. Sow, A. Samb, S. Diack, F. Asch. 1995. Climatic determinants of irrigated rice
performance in the Sahel. I. Photothermal and microclimatic responses of flowering.
Agricultural Systems 48, 385–410.
Dingkuhn, M., K.M. Miezan. 1995. Climatic determinants of irrigated rice performance in the Sahel. II.
Validation of photothermal constants and characterization of genotypes. Agricultural
Systems 48, 411–434.
Dingkuhn, M. 1995. Climatic determinants of irrigated rice performance in the Sahel. III.
Characterizing environments by simulating the crop's photothermal responses. Agricultural
Systems 48, 435–456.
Dingkuhn, M. 1997. Characterizing irrigated rice environments using the rice phenology model
RIDEV. In: K.M. Miezan, M.C.S. Wopereis, M. Dingkuhn, J. Deckers and T.F. Randolph (Eds.).
Irrigated Rice in the Sahel: Prospects for Sustainable Development. West Africa Rice
Development Association, B.P. 2551, Bouake 01, Cote d'Ivoire, ISBN 92 9113 1091. 343–360.
Dingkuhn, M., Kouressy, M., Vaksmann, M., Clerget, B., Chantereau, J. 2008. Applying to sorghum
photoperiodism the concept of threshold-lowering during prolonged appetence. European
Journal of Agronomy 28, 74–89.
Julia C, Dingkuhn M. 2012. Variation in time of day of anthesis in rice in different climatic
environments. Eur.J.Agron. 43, 166–174
Wopereis, MCS; Haefele, SM; Dingkuhn, M.; Sow, A. 2003. Decision support tools for irrgated rice-
based systems in the Sahel. In Eds Struif Bontkes TE, Wopereis MCS. A practical guide to
decision-support tools for agricultural productivity and soil fertility enhancement in sub-
Saharan Africa. IFDC and CTA, Wageningen, The Netherlands, 114–126.

Chapter 4: Preliminary modeling exercises and perspectives for future applications
105
CHAPTER 4:
Preliminary modeling exercises and perspectives for future
applications
INTRODUCTION
This chapter describes some preliminary modeling exercises using data generated by this
thesis on plant organ temperature and spikelet sterility, as follows:
1. Comparison of the empirical regression model of panicle temperature described in chapter 2
(similar to the one used in the RIDEV phenology and sterility model, chapter 3), with the
energy balance model IM2PACT of canopy and panicle temperature recently developed in
Japan (Yoshimoto et al. 2011), using the crop data generated by this thesis research.
2. Optimization of RIDEV parameters on a set of Sahel 108 rice crop data obtained from two
other sources (ORYTAGE project of CIRAD, thesis of Sabine Stuerz of Hohenheim University)
for the Ndiaye site in Senegal, which also figured as an experimental site in this thesis.
The empirical regression model (chapter 2) and RIDEV (chapter 3) were already described in
detail. The model IM2PACT (Integrated Micrometeorology Model for Panicle And Canopy
Temperature) was developed independently by a Japanese team from NIAES (National Institute for
Agro-Environmental Sciences) in Tsukuba, Japan, under the leadership of Dr. Toshi Hasegawa.
IM2PACT (Yoshimoto et al., 2011) is a simple micrometeorology model focusing on canopy and
panicle temperatures, based on classical heat balance equations. It was calibrated with leaf
conductance and panicle temperature measurements made on a temperate japonica rice variety
(‘Akita-Komachi’) grown in the field in Northern Japan in 2000 and in Eastern China in 2003
(Yoshimoto et al., 2005a,b), and validated with independent data from a transpiration suppression
experiment on two japonica rice varieties (‘Akita-Komachi’ and ‘Hatsu-Boshi’) at NIAES in 2005
(Yoshimoto et al., 2011), involving the spraying of a wax-type water dispersible chemical on leaves to
reduce leaf transpiration.
IM2PACT is composed of two sub-models, 1) a canopy micro-meteorology sub-model
estimating the air temperature and humidity at the panicle’s position inside the canopy, and
calculating the heat balance between the whole canopy and the air above the canopy; and 2) a
Chapter 4: Preliminary modeling exercises and perspectives for future applications
106
panicle temperature sub-model which is a heat balance model between panicle and the air in the
vicinity of panicle obtained through 1).
The model comparison (first part of this chapter) is only preliminary because at the time of
this writing, no independent field data with sufficient detail to satisfy the requirements of both
models are available. The model comparison is thus limited to the data generated by this thesis.
Second part B will apply RIDEV in its current form (prototype) to independent field data from third
sources, aiming at calibrating the model with its in-built parameter optimization tool and evaluating
the quality of the calibration.
MODEL COMPARISON ACROSS THE SITE USING THE PHD DATA
In chapter 2, we underlined the necessity to predict sensitive organ temperature, in
particular panicle temperature, to explain and predict the spikelet sterility caused by heat stress. The
objective of this section is to compare the output of two models developed independently
(regression model described in chapter 2 and IM2PACT) in terms of simulated vs. observed panicle
temperature.
Materials and methods
Using the crop and meteorology datasets with available panicle temperature measurements
(Senegal cool and hot dry seasons, Philippines), we calculated the temperature difference between
air (2m) and panicle (TD) with our empirical model (Model 1) and IM2PACT. Model 1 was as follows:
Model 1
TD = 1.578 + 1.093 VPD_2m + 0.189 Ta_2m – 0.0337 Top_P – 0.00339 Rs + 0.0331 H
Where TD =Ta-Tp, difference between air and panicle temperature (in °C)
VPD_2m = Vapour pressure deficit at 2m from the ground (in kPa)
Ta_2m = Air temperature at 2m from the ground (in °C)
Top_P = the position of the highest panicle from the ground (in cm)
Rs = Solar radiation (in W/m²)
H = sun height or solar angle (in degree)
The input and output variables of the two models are summarized in the Table 1. Model 1 is a
statistical model using 5 input variables including three standard meteorological inputs (VPD, Ta, and
Rs), one canopy-dependent input (ground height of panicle layer) and the solar angle which is the
sun position from the horizon (cf. Chapter 2). IM2PACT is more complex because it is calculating the
heat balance within the canopy. Therefore it needs the location of the site (latitude), four standard
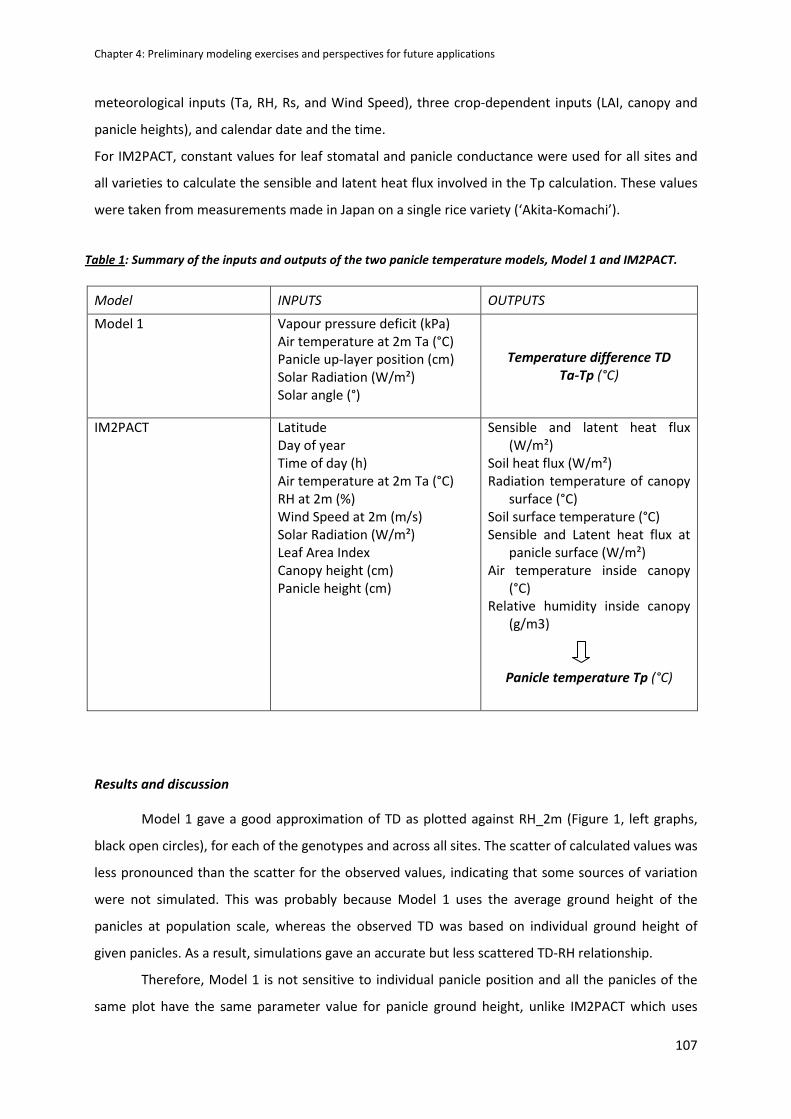
Chapter 4: Preliminary modeling exercises and perspectives for future applications
107
meteorological inputs (Ta, RH, Rs, and Wind Speed), three crop-dependent inputs (LAI, canopy and
panicle heights), and calendar date and the time.
For IM2PACT, constant values for leaf stomatal and panicle conductance were used for all sites and
all varieties to calculate the sensible and latent heat flux involved in the Tp calculation. These values
were taken from measurements made in Japan on a single rice variety (‘Akita-Komachi’).
Table 1: Summary of the inputs and outputs of the two panicle temperature models, Model 1 and IM2PACT.
Model INPUTS OUTPUTS
Model 1
Vapour pressure deficit (kPa)
Air temperature at 2m Ta (°C)
Panicle up-layer position (cm)
Solar Radiation (W/m²)
Solar angle (°)
Temperature difference TD
Ta-Tp (°C)
IM2PACT Latitude
Day of year
Time of day (h)
Air temperature at 2m Ta (°C)
RH at 2m (%)
Wind Speed at 2m (m/s)
Solar Radiation (W/m²)
Leaf Area Index
Canopy height (cm)
Panicle height (cm)
Sensible and latent heat flux
(W/m²)
Soil heat flux (W/m²)
Radiation temperature of canopy
surface (°C)
Soil surface temperature (°C)
Sensible and Latent heat flux at
panicle surface (W/m²)
Air temperature inside canopy
(°C)
Relative humidity inside canopy
(g/m3)
Panicle temperature Tp (°C)
Results and discussion
Model 1 gave a good approximation of TD as plotted against RH_2m (Figure 1, left graphs,
black open circles), for each of the genotypes and across all sites. The scatter of calculated values was
less pronounced than the scatter for the observed values, indicating that some sources of variation
were not simulated. This was probably because Model 1 uses the average ground height of the
panicles at population scale, whereas the observed TD was based on individual ground height of
given panicles. As a result, simulations gave an accurate but less scattered TD-RH relationship.
Therefore, Model 1 is not sensitive to individual panicle position and all the panicles of the
same plot have the same parameter value for panicle ground height, unlike IM2PACT which uses
Chapter 4: Preliminary modeling exercises and perspectives for future applications
108
individual panicle position as input (cf. Table 1). Accordingly, IM2PACT simulations gave a similar
scatter as that observed for the calculated values of TD (Figure 1, right).
Despite the fact that IM2PACT calibration was made on independent datasets that had a
lesser range of TD (-2°C <TD< 3°C) as compared to our data (-12.7°C <TD< 4°C), IM2PACT simulations
predicted the observed TD vs. RH relationship remarkably well over this larger range. IM2PACT
therefore is a robust model. The robustness of Model 1 cannot be evaluated here because no
independent data was available for its validation. However, Model 1 was is based on an extremely
broad range of climatic situations, probably covering much of the variation that is possible in
irrigated rice systems.
While Model 1 simulated TD for the 4 genotypes equally well, this was not the case for
IM2PACT. While simulations for the 3 semidward rice (IR64, IR72 and Sahel 108) were overall
accurate, TD was under-estimated with IM2PACT and the scatter was larger for the tall-traditional
variety Chomrong. Chomrong had greater variation in panicle ground height and position relative to
canopy height than the semidwarfs. It is also possible that panicle conductance differs among
genotypes. Such differences would be absorbed by the statistical model 1 whereas IM2PACT
explicitly factors in panicle conductance, which was then falsely considered as constant in this
exercise.
A very recent study (Fukuoka et al. 2012) confirmed this hypothesis by showing differences in panicle
conductance among 21 rice varieties grown in the field. The conductance measured covered a wide
range of values (between 0.15 and 0.67 cm s-1) leading TD variation between 2.1 and 3.5°C. In order
to consider such varietal differences in panicle conductance, simulations with IM2PACT would
require empirical information of genotypic differences, whereas Model 1 (and thus, the RIDEV
model) would be insensitive to them.
The correlations between calculated and observed TD were better with Model 1 than with
IM2PACT (Figure 2). This is not surprising because Model 1 was calibrated using the same dataset
whereas IM2PACT was calibrated with an independent dataset. Nevertheless, The simulated-
observed fit was remarkably good for IR64 and Sahel 108 (both in terms of R² and slope), and poor
only for Chomrong (inaccurate slope, indicating a systematic error related to unknown genotype
characteristics).
Chapter 4: Preliminary modeling exercises and perspectives for future applications
109
Perspective for further model comparisons and improvements
An immediate next step towards the implementation of Model 1 in RIDEV for extrapolative
purposes (beyond the present scope of environments and/or genotypes) will be its validation with
independent field data, such as those generated by NIAES for IM2PACT calibration and validation. On
this basis a full comparison of model accuracy and robustness between the two models will be
possible. However, at this point we can already conclude that the two models converge remarkably
well, despite the different approaches and experimental bases.
Model development should not stop with this achievement, however. An important new
objective will be the simulation of TD in water limited situations, such as water-saving crop
management where trade-offs between plot-level water consumption and transpiration cooling (to
avoid heat injury) needs to be considered. For such extended objectives, the choice between
statistical approaches (Model 1) or mechanistic heat balance approaches (IM2PACT) needs to be
carefully considered.
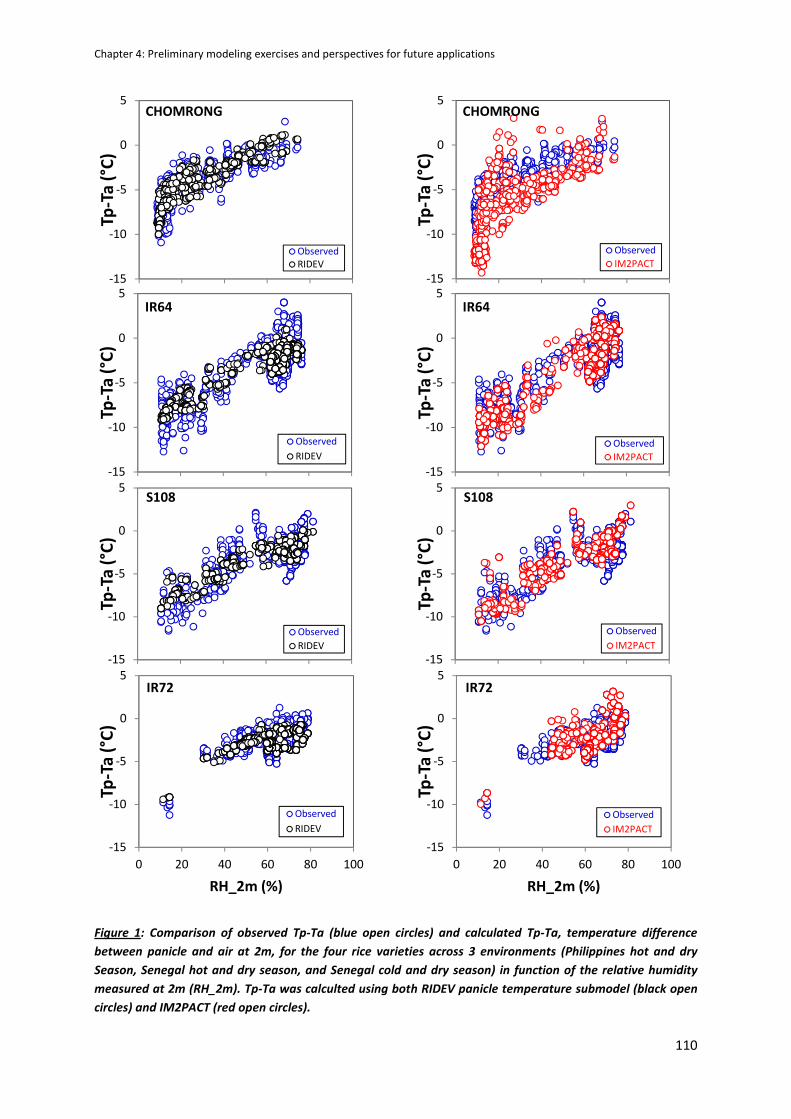
Chapter 4: Preliminary modeling exercises and perspectives for future applications
110
Figure 1: Comparison of observed Tp-Ta (blue open circles) and calculated Tp-Ta, temperature difference
between panicle and air at 2m, for the four rice varieties across 3 environments (Philippines hot and dry
Season, Senegal hot and dry season, and Senegal cold and dry season) in function of the relative humidity
measured at 2m (RH_2m). Tp-Ta was calculted using both RIDEV panicle temperature submodel (black open
circles) and IM2PACT (red open circles).
-15
-10
-5
0
5
0 20 40 60 80 100
Tp-T
a (
°C)
RH_2m (%)
CHOMRONG
Observed
IM2PACT
-15
-10
-5
0
5
0 20 40 60 80 100
Tp-T
a (
°C)
RH_2m (%)
IR64
Observed
IM2PACT
-15
-10
-5
0
5
0 20 40 60 80 100
Tp-T
a (
°C)
RH_2m (%)
CHOMRONG
Observed
RIDEV
-15
-10
-5
0
5
0 20 40 60 80 100
Tp-T
a (
°C)
RH_2m (%)
IR64
Observed
RIDEV
-15
-10
-5
0
5
0 20 40 60 80 100
Tp-T
a (
°C)
RH_2m (%)
S108
Observed
IM2PACT
-15
-10
-5
0
5
0 20 40 60 80 100
Tp-T
a (
°C)
RH_2m (%)
S108
Observed
RIDEV
-15
-10
-5
0
5
0 20 40 60 80 100
Tp-T
a (
°C)
RH_2m (%)
IR72
Observed
IM2PACT
-15
-10
-5
0
5
0 20 40 60 80 100
Tp-T
a (
°C)
RH_2m (%)
IR72
Observed
RIDEV
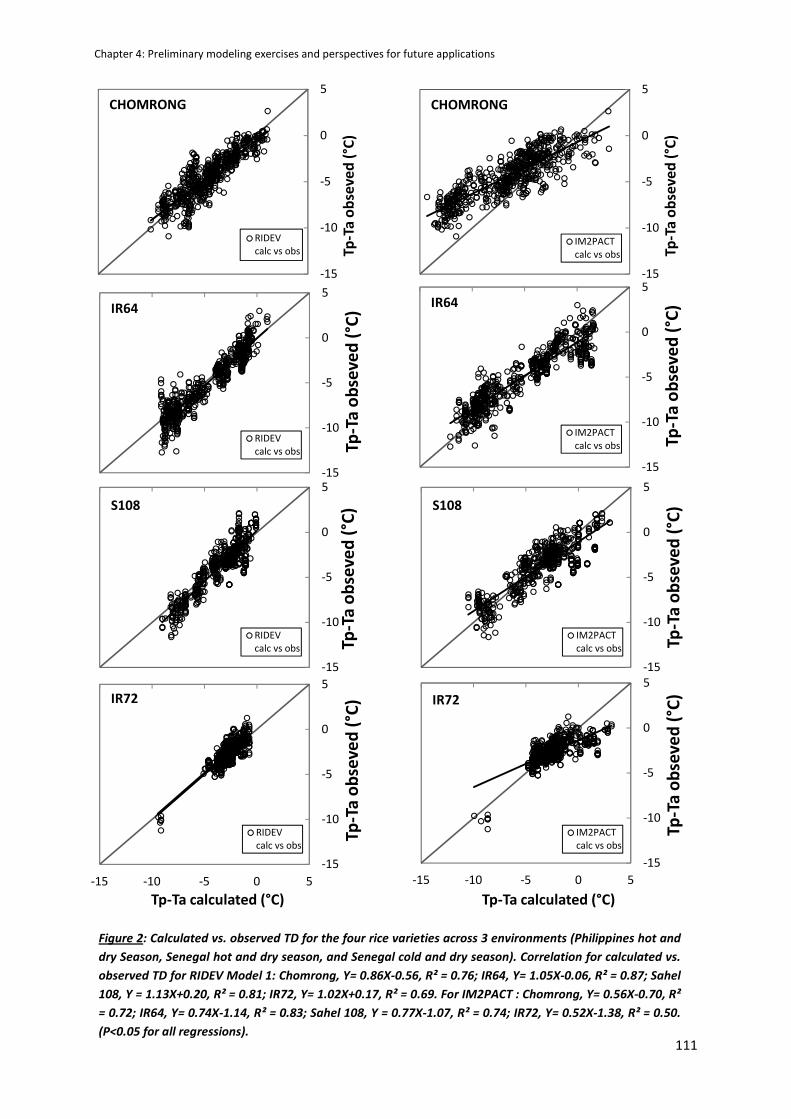
Chapter 4: Preliminary modeling exercises and perspectives for future applications
111
-15
-10
-5
0
5
-15 -10 -5 0 5
Tp-T
a o
bse
ve
d (
°C)
Tp-Ta calculated (°C)
IR64
IM2PACT
calc vs obs
-15
-10
-5
0
5
-15 -10 -5 0 5
Tp-T
a o
bse
ve
d (
°C)
Tp-Ta calculated (°C)
IR64
RIDEV
calc vs obs
-15
-10
-5
0
5
Tp-T
a o
bse
ve
d (
°C)
CHOMRONG
RIDEV
calc vs obs
-15
-10
-5
0
5
Tp-T
a o
bse
ve
d (
°C)
CHOMRONG
IM2PACT
calc vs obs
-15
-10
-5
0
5
-15 -10 -5 0 5Tp
-Ta
ob
sev
ed
(°C
)
Tp-Ta calculated (°C)
S108
IM2PACT
calc vs obs
-15
-10
-5
0
5
-15 -10 -5 0 5
Tp-T
a o
bse
ve
d (
°C)
Tp-Ta calculated (°C)
IR72
IM2PACT
calc vs obs
-15
-10
-5
0
5
-15 -10 -5 0 5
Tp-T
a o
bse
ve
d (
°C)
Tp-Ta calculated (°C)
S108
RIDEV
calc vs obs
-15
-10
-5
0
5
-15 -10 -5 0 5
Tp-T
a o
bse
ve
d (
°C)
Tp-Ta calculated (°C)
IR72
RIDEV
calc vs obs
Figure 2: Calculated vs. observed TD for the four rice varieties across 3 environments (Philippines hot and
dry Season, Senegal hot and dry season, and Senegal cold and dry season). Correlation for calculated vs.
observed TD for RIDEV Model 1: Chomrong, Y= 0.86X-0.56, R² = 0.76; IR64, Y= 1.05X-0.06, R² = 0.87; Sahel
108, Y = 1.13X+0.20, R² = 0.81; IR72, Y= 1.02X+0.17, R² = 0.69. For IM2PACT : Chomrong, Y= 0.56X-0.70, R²
= 0.72; IR64, Y= 0.74X-1.14, R² = 0.83; Sahel 108, Y = 0.77X-1.07, R² = 0.74; IR72, Y= 0.52X-1.38, R² = 0.50.
(P<0.05 for all regressions).
Chapter 4: Preliminary modeling exercises and perspectives for future applications
112
RIDEV APPLICATION : AN EXAMPLE OF SIMULATION
The RIDEV model as described in chapter 3 was applied to an independent data set obtained
from two different sources for the Ndiaye site in Senegal, using the cultivar Sahel 108. This aggregate
data set covered year-round plantings, thus exposing the crop to different thermal regimes at
different developmental stages.
The objective of this modeling exercise was to test the model’s parameter optimization
routine and to evaluate the model’s ability to simulate intra-annual patterns of variation of crop
duration and spikelet sterility.
Materials and Methods
Crop data (days from sowing to flowering and maturity, fraction spikelet sterility) was
obtained from the ORYTAGE project (CIRAD in collaboration with AfricaRice ca. : 200 indica rice
genotypes exposed to 6 sowing dates in 2009 ; Sahel 108 figuring as 4x replicated check) and the
Ph.D. thesis of Ms. Sabine Stuerz (unpublished; University of Hohenheim ; 12 sowing dates in 2008-
2010 ; 4 replications, but only means available). Daily weather data were obtained from AfricaRice.
The RIDEV model was calibrated by parameter optimization using R-Genoud (Mebane et al.
2011) in two steps : (1) optimization of phase durations for SumBvp and SumMatu with SumRepr set
to 400 oC.d , and of the photoperiodic parameters PPexp and PPsens ; and (2) optimization of the
sterility parameters CritSterCold1 (mid-reproductive phase), CritSterCold2 (late reproductive phase),
Crit SterHeat (period of anthesis) and SterBase (baseline sterility fraction). The exponential sub-
model for photoperiod response was chosen.
Each optimization procedure, essentially a sensititivity analysis by genetic algorithm aiming at
minimizing the simulation error (cost function based on least sum of squares), involved several 1000
simulations. The rapidity of the model allowed 10000 simulations to be done in about 30 min.
Simulation outputs from the optimized (parameterized) model were days to flowering, days
to maturity, and sterility fractions attributed to chilling stress at two pre-floral stages and to heat
stress at anthesis stage. Other simulation outputs such as duration of BVP, PSP, RPR and MAT phases,
time of day of anthesis, and panicle T at anthesis were not used in this study.
Chapter 4: Preliminary modeling exercises and perspectives for future applications
113
Results and Discussion
The optimized model parameter values and the simulation results as compared with
observation are shown in Figure 3. The cardinal temperatures were 10.6 oC (Tbase) and 31.7 oC
(Topt), and thus fell into the normal range for rice (Dingkuhn and Miezan, 1995). Sterility was not
sensitive to chilling at mid-ripening (CritSterCold1 = 10.6 oC) but highly sensitive to chilling at late
ripening stage (about last 10d before anthesis ; CritSterCold2 = 18.7 oC). It was also quite sensitive to
heat at anthesis (CritSterHeat = 29.7 oC). Note that the latter is based on panicle temperature, which
mostly corresponded to much higher air temperatures (cf. chapter 2).
Phenology in terms of days to flowering and maturity (Figure 3, top) was well simulated, with
the exception of one out of 18 sowing dates (under-estimation for October 2009 sowing). The
extraordinarily late flowering observed in the field for that date was probably caused by severe
chilling, as indicated by extreme stunting and high leaf senescence levels (visual observations by the
author of the data, Ms. Sabine Stuerz, Hohenheim University). The annual oscillation of crop duration
was caused in larger part by thermal effects and smaller part by photoperiod, to which the genotype
was mildly sensitive.
Total sterility simulations (Figure 3, center) followed the observed seasonal patterns, with
near-total sterility for sowing in late September / early October. But simulated total sterility varied
strongly with sowing date in a very « nervous » manner. This was due to the narrow temporal
windows of sensitivity of sterility of temperature, between 10 and 14 days. Widening these windows
of sensitivity would make the response less « nervous » and thus reduce noise, but would not be
faithful to existing physiological knowledge. A conceptual problem thus arises: How can a sterility
model be calibrated and validated with field data if sterility by nature varies extremely within the
same environment, caused by small differences in sowing date and/or phenology ?
The model explained some of the observed sterility with heat effects (Figure 3, bottom).
Simulated heat effects on sterility behaved even more « nervously » than that caused by chilling, and
showed less clear seasonal peaks.
We also tested model calibrations / optimizations using the Linear and Impatience options
for photoperiod response. The Impatience model gave the best fit for phenology and the linear
model the worst, the exponential model being intermediate. Optimized cardinal temperatures were
similar for the three options but the models differed significantly in the parameterization of the BVP.
The three alternative phenology models also gave quite different parameter values for sterility
simulation, notably the ponderation between effects of CritSterCold1, CritSterCold2, CritSterHeat
and SterBase (data not presented). This constitutes a problem in model parameterization because it
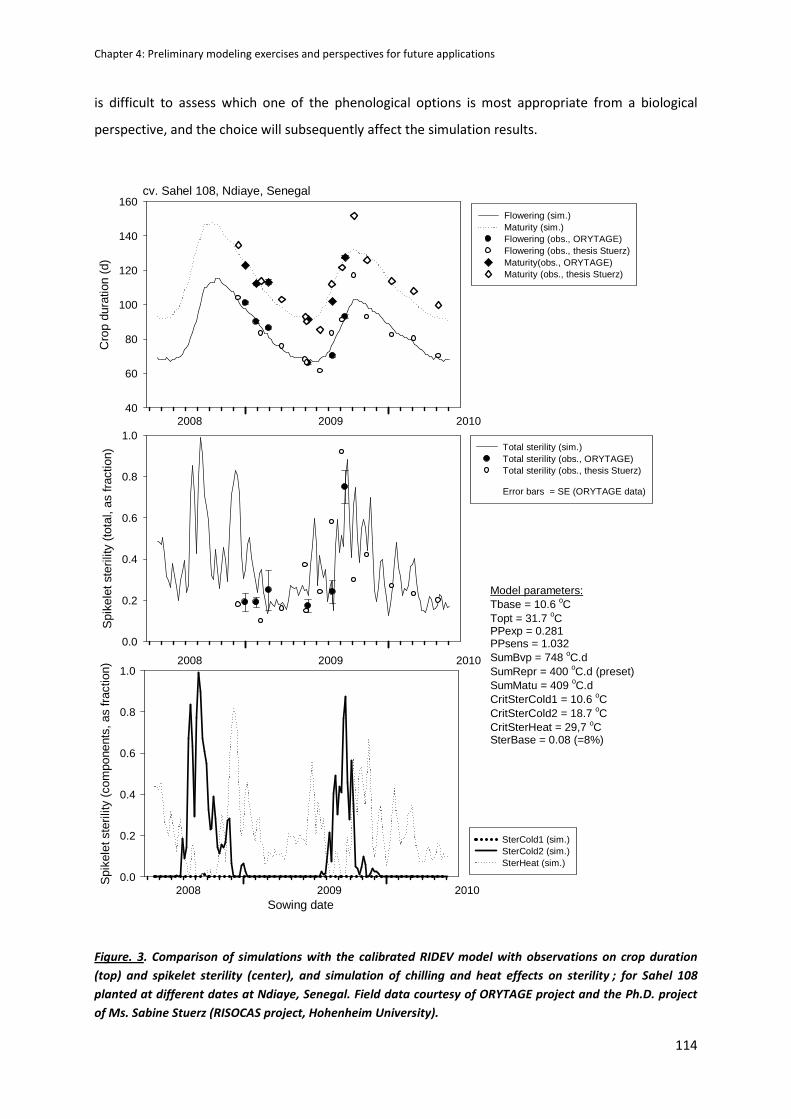
Chapter 4: Preliminary modeling exercises and perspectives for future applications
114
is difficult to assess which one of the phenological options is most appropriate from a biological
perspective, and the choice will subsequently affect the simulation results.
Spi
kele
t ste
rility
(to
tal,
as fr
actio
n)
0.0
0.2
0.4
0.6
0.8
1.0Total sterility (sim.)Total sterility (obs., ORYTAGE)Total sterility (obs., thesis Stuerz)
Error bars = SE (ORYTAGE data)
cv. Sahel 108, Ndiaye, Senegal
Cro
p du
ratio
n (d
)
40
60
80
100
120
140
160Flowering (sim.)Maturity (sim.)Flowering (obs., ORYTAGE)Flowering (obs., thesis Stuerz)Maturity(obs., ORYTAGE)Maturity (obs., thesis Stuerz)
Sowing date
Spi
kele
t ste
rility
(co
mpo
nent
s, a
s fr
actio
n)
0.0
0.2
0.4
0.6
0.8
1.0
SterCold1 (sim.)SterCold2 (sim.)SterHeat (sim.)
2008 2009 2010
2008 2009 2010
2008 2009 2010
Model parameters:Tbase = 10.6 oCTopt = 31.7 oCPPexp = 0.281PPsens = 1.032SumBvp = 748 oC.dSumRepr = 400 oC.d (preset)SumMatu = 409 oC.dCritSterCold1 = 10.6 oCCritSterCold2 = 18.7 oCCritSterHeat = 29,7 oCSterBase = 0.08 (=8%)
Figure. 3. Comparison of simulations with the calibrated RIDEV model with observations on crop duration
(top) and spikelet sterility (center), and simulation of chilling and heat effects on sterility ; for Sahel 108
planted at different dates at Ndiaye, Senegal. Field data courtesy of ORYTAGE project and the Ph.D. project
of Ms. Sabine Stuerz (RISOCAS project, Hohenheim University).
Chapter 4: Preliminary modeling exercises and perspectives for future applications
115
Next steps
We will study more genotypes (from available ORYTAGE project data) in order to make a
better-founded choice of phenological model options within the RIDEV framework for rice. We will
also enlarge the existing datasets on phenology and sterility using supplemental data from different
environments, notably different altitudes in Madagascar (ORYTAGE database). This may also help
further refine the algorithms of RIDEV. AfricaRice is in the process of generating additional data sets
in the field aimed at validating RIDEV.
OUTLOOK FOR MODELING OF CROP RESPONSE TO THERMAL CONTRAINTS
The validated model will be used to parameterize ca. 200 indica rice genotypes studied in
Senegal and Madagascar within ORYTAGE. This model-assisted phenotyping exercise will feed into a
genome-wide association study (GWAS) for the porpose of discovering genes and alleles affecting the
cardinal temperatures, phenological phase duration, photoperiod response and temperature induced
sterility.
The validated model will also be used for predictive purposes such as (1) mapping rice
environments for thermal constraints and genotypic adaptation to them, for past and anticipated
climate scenarios; and (2) decision support in devising locally adapted cropping calendars
(incorporation of RIDEV in the rice manager software under development at AfricaRice and IRRI).
Chapter 4: Preliminary modeling exercises and perspectives for future applications
116
REFERENCES
Fukuoka, M., Yoshimoto, M., and Hasegawa, T., 2012. Varietal Range in Transpiration Conductance of
Flowering Rice Panicle and Its Impact on Panicle Temperature, Plant Prod. Sci. 15, 258―264
Mebane, W.R., Sekhon, J.S., 2011. Genetic Optimization Using Derivatives: “The rgenoud package for
R”? Journal of Statistical Software 42, 1-26.
Yoshimoto, M., Oue, H., Kobayashi, K., 2005a. Energy balance and water use efficiency of rice
canopies under free-air CO2 enrichment. Agricultural and Forest Meteorology 133, 226–246.
Yoshimoto, M., Oue, H., Takahashi, H., Kobayashi, K., 2005b. The effects of FACE (free-air CO2
enrichment) on temperatures and transpiration of rice panicles at flowering stage. Journal of
Agricultural Meteorology 60, 597–600.
Yoshimoto, M., Fukuoka, M., Hasegawa, T., Utsumi, M., Ishigooka, Y., Kuwagata, T., 2011. Integrated
micrometeorology model for panicle and canopy temperature (IM2PACT) for rice heat stress
studies under climate change. Journal of Agricultural Meteorology 67, 597–600.
Synthesis, discussions and perspectives
117
SYNTHESIS, DISCUSSIONS AND PERSPECTIVES
SYNTHESIS
The aim of this thesis was to characterize poorly known traits and mechanisms involved in heat and
cold tolerance of rice during sensitive stages of the reproductive phase, and to lay the basis for their
incorporation into crop models to predict the risk of yield losses due to thermal stresses in a global
climate change context. This work was made on irrigated rice, a high-potential staple crop grown in
highly diverse climatic environments many of which are prone to extreme temperatures. To attain
this goal, the coping mechanisms of rice were divided into
(1) temporal escape through phenology,
(2) temporal escape through time of day of flowering (TOA),
(3) avoidance through transpirational cooling of the canopy,
(4) avoidance through morphology enabling good panicle exertion, and finally
(5) physiological tolerance.
Emphasis was on (2) and (3) because these mechanisms are the least well known at present, but an
effort was made to observe and integrate all five mechanisms to enable an inclusive modeling
approach to thermal stress.
A set of four O. sativa japonica and indica varieties including a traditional one (Chomrong)
and 3 improved ones (IR64, IR72, S108) with different morphologies and thermal tolerances were
studied in four replicated field experiments in contrasting environments (humid-tropical in the
Philippines, temperate summer in France, and semi-arid tropical (Sahelian) climate during the cool-
dry and hot dry seasons in Senegal). For all combinations of genotype and environment, detailed
phenological (Microspore, Flowering, TOA) and morphological (canopy structure) measurements
were coupled with a characterization of the micro-climate along the soil-water-canopy-atmosphere
gradient and IR imagery of leaves and panicles. This enabled estimation of the temperature of the
stress-sensitive organ during its sensitive phases and at its location during those phases (submerged
in the floodwater at microspore stage, near top of canopy at flowering).

Synthesis, discussions and perspectives
118
The analysis of the data brought out two new and agro-ecologically important findings:
(1) TOA was confirmed to last about 2 hours and happened chiefly in the late morning, but it
was found to vary strongly among environments. This plasticity of TOA could be predicted
with environment temperature and humidity and was found to be adaptive (escape from
high midday temperatures). Although no varietal differences were observed, the adaptive
plasticity of TOA is an escape trait of major significance. If not taken into account, model
predictions of heat induced sterility are bound to be flawed.
(2) Panicle temperature was up to 10°C below ambient under dry conditions but slightly higher
than ambient under humid conditions. Consequently, heat injury was not observed in the
hottest but in moderately warm but humid environments. This is necessarily a game-changer
for crop-model based predictions of heat sterility because the risk prone environments are
not the same as predicted with present crop models.
In addition, this thesis also provided quantitative information on chilling induced sterility caused by
cold floodwater at microspore stage and poor panicle exertion due to insufficient peduncle
elongation. No genotypic differences in physiological temperature stress tolerance were found
except for pronounced chilling tolerance of Chomrong, a variety from Nepal.
The escape and avoidance mechanisms were described in chapters 1 and 2. In chapter 3 we
introduced the crop model RIDEV and described its construction and improvement to take into
account the results of chapter 1 and 2 (TOA and panicle temperature). We then compared our
regression model of panicle temperature with another model of panicle temperature developed
independently in Japan (IM2PACT). Finally, we presented some simulations made with the new
RIDEV modeling tool in chapter 4. Despite the different modeling approaches and data used by the
present study and the colleagues in Japan, the two models of panicle temperature agreed very well.
RIDEV calibration and simulations based on independent data were also conclusive.
DISCUSSION
TOA plasticity and temporal escape of thermal stress
Although duration of anthesis varied little, its hour of onset during the day (TOA, corrected
for solar noon and day length) varied by several hours among the different climatic environments.
TOA responded in an adaptive sense (thus avoiding high spikelet temperature during anthesis) as a
function of Tair and VPD experienced before anthesis. Plasticity of TOA is thus an escape mechanism

Synthesis, discussions and perspectives
119
to avoid unfavorable thermal conditions at flowering. Under cold conditions anthesis is delayed and
under hot conditions it is advanced to earlier hours of the morning. The earlier anthesis under humid
conditions provides a complementary protection to heat at flowering, because panicle cooling is less
effective under low VPD. We did not observe a significant variability of TOA among the four rice
varieties we studied in the field. However, previous studied have shown diversity in TOA (Sheehy et
al. 2005, Jagadish et al. 2008) particularly in wild rice varieties (Ishimaru et al. 2010), and this
diversity should be used in breeding as trait for heat escape in the future, particularly in hot and
humid climate where the avoidance mechanism of transpiration cooling is ineffective (cf. next
paragraph). Ishimaru et al. (2010) already demonstrated the effectiveness of introgressing the early
TOA trait to reduce spikelet sterility under hot conditions. Research efforts should continue in this
domain, but should also include our finding of TOA having significant adaptive plasticity. Screening of
genetic materials in only one environment might cause bias by not considering this plasticity, which
may even vary among genotypes.
Transpirational panicle cooling and climatic profiles causing heat stress
Panicle temperature during the precise period of TOA was confirmed to be the best criterion
to explain heat-induced spikelet sterility, better than Tair(max) or Tair(TOA). This phenomenon
necessarily escapes study if a narrow range of climatic environments is considered, but it manifests
itself in multi-climatic studies. This work is the first to investigate such a wide range of transpiration
cooling effects of panicles on the same genetic materials across different environments. The
importance of this heat avoidance mechanism mostly depends on the evaporative demand of the air
above the canopy (VPD), but is also sensitive to canopy architecture. The results emphasize the risk
of heat damage for rice under warm and humid conditions (low VPD), and explains the high and
relatively stable yields frequently observed under very hot but dry conditions (high VPD) in Senegal
(Dingkuhn and Sow, 1997) or Australia (Matsui et al. 2007). Consequently, the notion of absolute
heat is of limited pertinence if not backed up with information on air humidity.
In our study, among the four climatic environments, the hottest environment (Senegal hot
and dry season) was not the most prone to heat stress at flowering but the Philippines climate.
Indeed, in the Philippines, the high relative humidity (RH) does not allow an efficient panicle cooling
leading to higher Tp and a frequent occurrence of Tp>Tair at anthesis compared with the Senegal
environment (Table 1). In Senegal, the low RH counterbalances the high temperature effect by
favoring panicle and canopy transpiration, a heat avoidance mechanism. In France, even though RH
was higher than in Senegal, Tair was always inferior to 30°C during anthesis. But many environments
exist in the monsoonal humid tropics where conditions are even more humid and warmer than
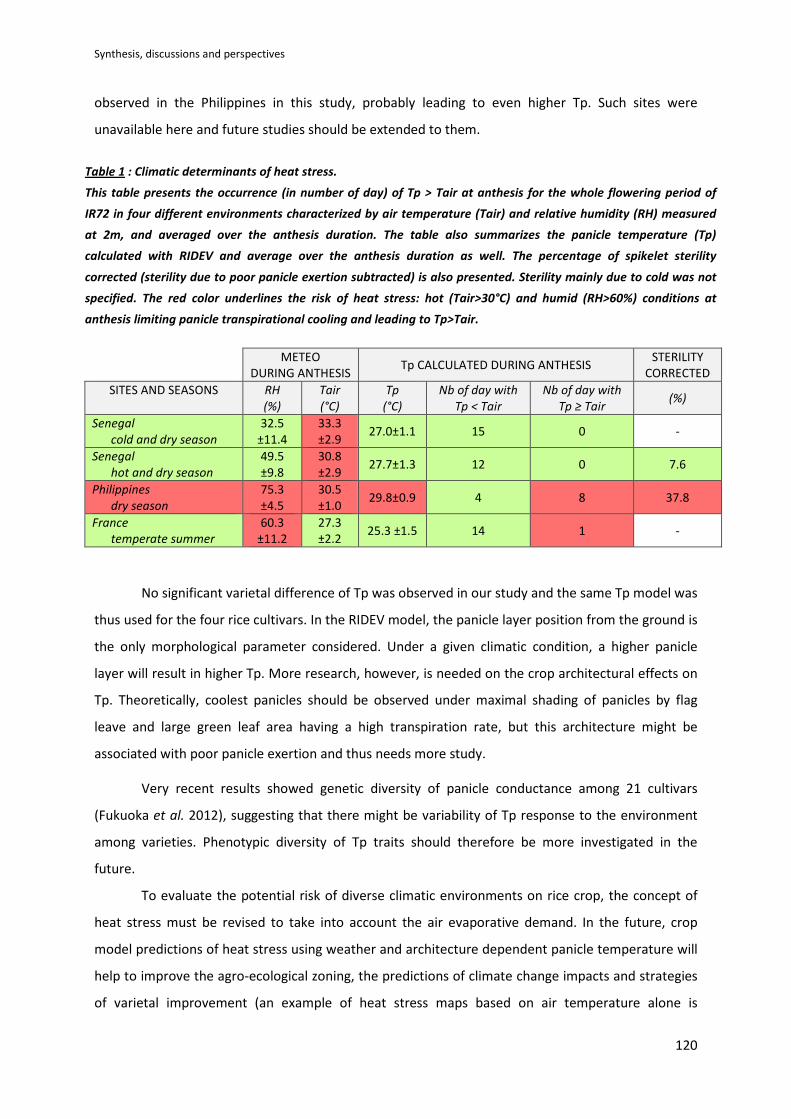
Synthesis, discussions and perspectives
120
observed in the Philippines in this study, probably leading to even higher Tp. Such sites were
unavailable here and future studies should be extended to them.
Table 1 : Climatic determinants of heat stress.
This table presents the occurrence (in number of day) of Tp > Tair at anthesis for the whole flowering period of
IR72 in four different environments characterized by air temperature (Tair) and relative humidity (RH) measured
at 2m, and averaged over the anthesis duration. The table also summarizes the panicle temperature (Tp)
calculated with RIDEV and average over the anthesis duration as well. The percentage of spikelet sterility
corrected (sterility due to poor panicle exertion subtracted) is also presented. Sterility mainly due to cold was not
specified. The red color underlines the risk of heat stress: hot (Tair>30°C) and humid (RH>60%) conditions at
anthesis limiting panicle transpirational cooling and leading to Tp>Tair.
METEO
DURING ANTHESIS Tp CALCULATED DURING ANTHESIS
STERILITY
CORRECTED
SITES AND SEASONS RH
(%)
Tair
(°C)
Tp
(°C)
Nb of day with
Tp < Tair
Nb of day with
Tp ≥ Tair (%)
Senegal
cold and dry season
32.5
±11.4
33.3
±2.9 27.0±1.1 15 0 -
Senegal
hot and dry season
49.5
±9.8
30.8
±2.9 27.7±1.3 12 0 7.6
Philippines
dry season
75.3
±4.5
30.5
±1.0 29.8±0.9 4 8 37.8
France
temperate summer
60.3
±11.2
27.3
±2.2 25.3 ±1.5 14 1 -
No significant varietal difference of Tp was observed in our study and the same Tp model was
thus used for the four rice cultivars. In the RIDEV model, the panicle layer position from the ground is
the only morphological parameter considered. Under a given climatic condition, a higher panicle
layer will result in higher Tp. More research, however, is needed on the crop architectural effects on
Tp. Theoretically, coolest panicles should be observed under maximal shading of panicles by flag
leave and large green leaf area having a high transpiration rate, but this architecture might be
associated with poor panicle exertion and thus needs more study.
Very recent results showed genetic diversity of panicle conductance among 21 cultivars
(Fukuoka et al. 2012), suggesting that there might be variability of Tp response to the environment
among varieties. Phenotypic diversity of Tp traits should therefore be more investigated in the
future.
To evaluate the potential risk of diverse climatic environments on rice crop, the concept of
heat stress must be revised to take into account the air evaporative demand. In the future, crop
model predictions of heat stress using weather and architecture dependent panicle temperature will
help to improve the agro-ecological zoning, the predictions of climate change impacts and strategies
of varietal improvement (an example of heat stress maps based on air temperature alone is
Synthesis, discussions and perspectives
121
presented in Figure 2 of the Introductive chapter of this thesis, cf. p.16). This may change both the
geographic foci and the varietal selection strategies for heat stress research for rice.
General consequences for applied research
So far no crop model simulating rice spikelet sterility takes into account TOA and Tp, except
the recently released IM2PACT heat balance which is currently being extended to achieve full crop
model skills (Yoshimoto et al. 2011), and RIDEV generated with the help of the present study.
Rice crop models accurately simulating thermal stresses are urgently needed to (1) establish
global and regional agro-ecological maps of stress impacts now and in the future, (2) to provide
decision tools allowing producers to better cope with climatic risks, and (3) to guide breeders and
geneticists to adjust breeding criteria, selection environments and phenotyping approaches. So far,
no genetic information is available on the adaptive plasticity of TOA and the heat avoidance achieved
with transpiration cooling, and the available genetic diversity has not yet been characterized.
Integrated approaches are needed to consider the interactions among the numerous plant
traits and responses with regards to thermal stresses, to be implemented in crop models having
agronomic simulation skills (cultural practices and cropping systems). These integrated approaches
should be sensitive to both heat and chilling stresses because they can occur in the same
environments. Furthermore, climate change will likely change the geographic domains of crops
(migration), involving stresses at both ends of the thermal spectrum.
New research dynamics being triggered by the present results
RIDEV will be at the center of a new research dynamics. At IRRI, an initiative was taken to
develop new global maps of thermal constraints for rice (Improvement of Figure 2 in Introduction
chapter). In the context of the Climate Change Agriculture and Food Security (CCAFS) program of the
CGIAR, such maps will also be extended to future climate scenarios. In parallel, AfricaRice and IRRI
are collaborating to develop a new decision tool for farmers called Rice Manager that will make use
of RIDEV.
Collaboration between Tsukuba University (NIAES) and IRRI, involving also CIRAD, is under
discussion to validate and possibly integrate both IM2PACT and RIDEV models, validate them on a
broader basis and extend their skills to variable water resources and CO2 levels.
Lastly, RIDEV is now being used for genomic studies in the context of the GRiSP Global Rice
Phenotyping Network (GRiSP 2011). It serves to extract, in reverse mode application, genotypic
photothermal constants from multi-environment phenomics data. These genotypic photothermal
constants such as cardinal temperatures, photoperiodic parameters, phenological phase durations
Synthesis, discussions and perspectives
122
and critical temperatures for thermal sterility will be defined at traits and mapped genetically by
Genome-Wide Association Studies (GWAS).
New research questions arising from this thesis
The need to characterize the genetic diversity for the escape and avoidance mechanisms
described here was already mentioned.
Our study was conducted under irrigated systems and was focused on thermal stress only.
Other abiotic stresses combined with heat stress and potentially induced by global warming need to
be address as well. In particular, our results suggest that there should be major trade-offs between
water-saving and heat avoidance, because any reduction of transpiration or evaporation from paddy
fields through modified cultural practices (e.g., alternate wetting and drying, AWD 2009) is bound to
increase canopy temperature. The existing recommendations or technology options for water saving
in dry-hot areas must thus be reviewed on the basis of such research because they may be risky.
Furthermore, it is unknown whether rice panicles are able to sustain their transpiration under water
deficit: Although they are not able to regulate their conductance as leaves do through stomata,
water deficit might reduce panicle transpiration through xylem cavitation (Stiller et al. 2003) or other
mechanisms and needs further study.
Another issue requiring new research efforts is the probable trade-offs between CO2
fertilization from rising atmospheric concentrations and the reduction in transpiration cooling of
canopies caused by CO2 (stomatal closure in leaves). Hasegawa research team based at NIAS in
Tsukuba (Japan) demonstrated in Free-Air CO2 Enrichment (FACE) field experiments that this effect
can be substantial (Namakura et al. 2010). This effect needs to be built into future scenarios of heat
stress.
Lastly, rice is probably not the only crop species avoiding heat injury by transpiration cooling
and plasticity of TOA. In wheat, the temperature difference between the air and spikes was reported
to be up to 5 °C (Ayeneh et al. 2002), suggesting that a similar heat avoidance mechanism as in rice is
also present in other crops.
Synthesis, discussions and perspectives
123
REFERENCES
AWD. IRRI, 2009. Saving Water: Alternate Wetting Drying (AWD). In Rice Fact Sheets, Los Baños,
Philippines: International Rice Research Institute (IRRI).
“www.knowledgebank.irri.org/factsheetsPDFs/watermanagement_FSAWD3.pdf”.
Ayeneh, A., van Ginkel, M., Reynolds, M.P., Ammar, K, 2002. Comparison of leaf, spike, peduncle and
canopy temperature depression in wheat under heat stress. Field Crop Research 79, 173–
184.
Dingkuhn, M, Sow, A. 1997. Potential yields of irrigated rice in the Sahel. In: Miezan, K.M., Wopereis,
M.C.S., Dingkuhn, M., Deckers, J., and Randolph, T.F. (Eds.). Irrigated Rice in the Sahel:
Prospects for Sustainable Development. West Africa Rice Development Association, B.P.
2551, Bouake 01, Cote d'Ivoire, ISBN 92 9113 1091, pp. 361–380.
Fukuoka, M., Yoshimoto, M., and Hasegawa, T., 2012. Varietal Range in Transpiration Conductance of
Flowering Rice Panicle and Its Impact on Panicle Temperature, Plant Prod. Sci. 15, 258―264
GRiSP. CIRAD, IRD, IRRI, 2011. Proceedings of a Workshop on Developing a Global Rice Phenotyping
STrategy (GRiSP PL 1.2 and 2.1), workshop report, 28-30 March 2011, CIRAD, Montpellier,
France. “http://grisp.irri.org/theme-1-documents”.
Ishimaru, T, Hirabayashi, H, Ida, M, Takai, T, San-Oh, YA, Yoshinaga, S., Ando, I, Ogawa, T, Kondo, M.,
2010. A genetic resource for early-morning flowering trait of wild rice Oryza officinalis to
mitigate high temperature-induced spikelet sterility at anthesis. Annals of Botany 106, 515–
520.
Jagadish, S.V.K., Craufurd, P.Q., Wheeler, T.R., 2008. Phenotyping parents of mapping populations of
rice for heat tolerance during anthesis. Crop Science 48: 1140–1146.
Matsui, T., Kobayasi, K., Yoshimoto, M., Hasegawa, T., 2007. Stability of rice pollination in the field
under hot and dry conditions in the Riverina region of New South Wales, Australia. Plant
Production Science 10, 57–63.
Nakamura H, Okada M, Sameshima R, Hasegawa T. 2010. Effects of free-air CO2 enrichment (FACE)
and soil warming on CH4 emission from a rice paddy field: Impact assessment and
stoichiometric evaluation. Biogeosciences 7, 2639–2653.
Sheehy, J.E., Elmido A.E., Centeno, H.G.S., Pablico, P.P., 2005. Searching for new plants for climate
change. Journal of Agricultural Meteorology 60, 463–468.

Synthesis, discussions and perspectives
124
Stiller V, Lafitte, HR, Sperry JS. 2003. Hydraulic Properties of Rice and the Response of Gas Exchange
to Water Stress. Plant Physiology 132, 1698-1706
Yoshimoto, M., Fukuoka, M., Hasegawa, T., Utsumi, M., Ishigooka, Y., Kuwagata, T., 2011. Integrated
micrometeorology model for panicle and canopy temperature (IM2PACT) for rice heat stress
studies under climate change. Journal of Agricultural Meteorology 67, 597–600.
General conclusion
125
GENERAL CONCLUSION
This multi-environment, agro-ecological study provided evidence for the adaptive value and
the variability of two poorly understood traits involved in rice thermal stress tolerance during the
reproductive phase: the environment driven plasticity of time of day of anthesis (TOA; an escape
mechanism) and panicle transpiration cooling (avoidance). The environmental controls of the two
traits were characterized mostly by VPD and air temperature. Environmental and phenological
determinants of chilling induced spikelet sterility were also studied and largely confirmed previous
findings. The results were incorporated into RIDEV V.2, a new crop model predicting spikelet sterility
from simulated phenology and microclimate inspired by a simpler model developed in the 1990s.
This study demonstrates the need to distinguish between the general climatic environment
as measured by agro-meteorological stations and the environment the critical physiological
processes are exposed to. The commonly used crop models generally do not make this distinction,
which may be one of their crop parameters’ lack of robustness across different physical
environments. In the case of thermal constraints to rice performance, the resulting errors are very
large: Depending on environment, rice panicles can be by 10 degrees C cooler or 2 degrees C warmer
than the air at 2m, and the heat-sensitive processes of pollination can happen early in the morning or
after noon. Plant and canopy structure further modify exposure of the inflorescence to heat. Given
these variations, air minimum or maximum temperatures alone have no predictive value of the
thermal stress across different climatic environments.
Although the present findings are specific to irrigated rice and the fertility of its
inflorescence, we suggest that the importance of microclimate generated by the crop and its organs
is more general because it affects phenology and metabolism throughout the crop cycle. Crop
models should therefore be equipped with modules calculating organ temperature for all
physiological processes that are critically dependent on temperature, for rice and other crop species.
This is particularly important for predictions of the impact of climate variability and change, including
effects of rising atmospheric CO2 concentrations.
The present study gave rise to the development of a modeling tool that will stand at the
center of numerous applied research projects with agronomic and genetic objectives. Further
research, however, is necessary to extend the present approach to water-limited environments,
rising CO2 concentrations and different plant and canopy architectures. This will probably require a
more mechanistic approach to crop thermodynamics, as well as more explicit simulation of plant and
canopy structure.
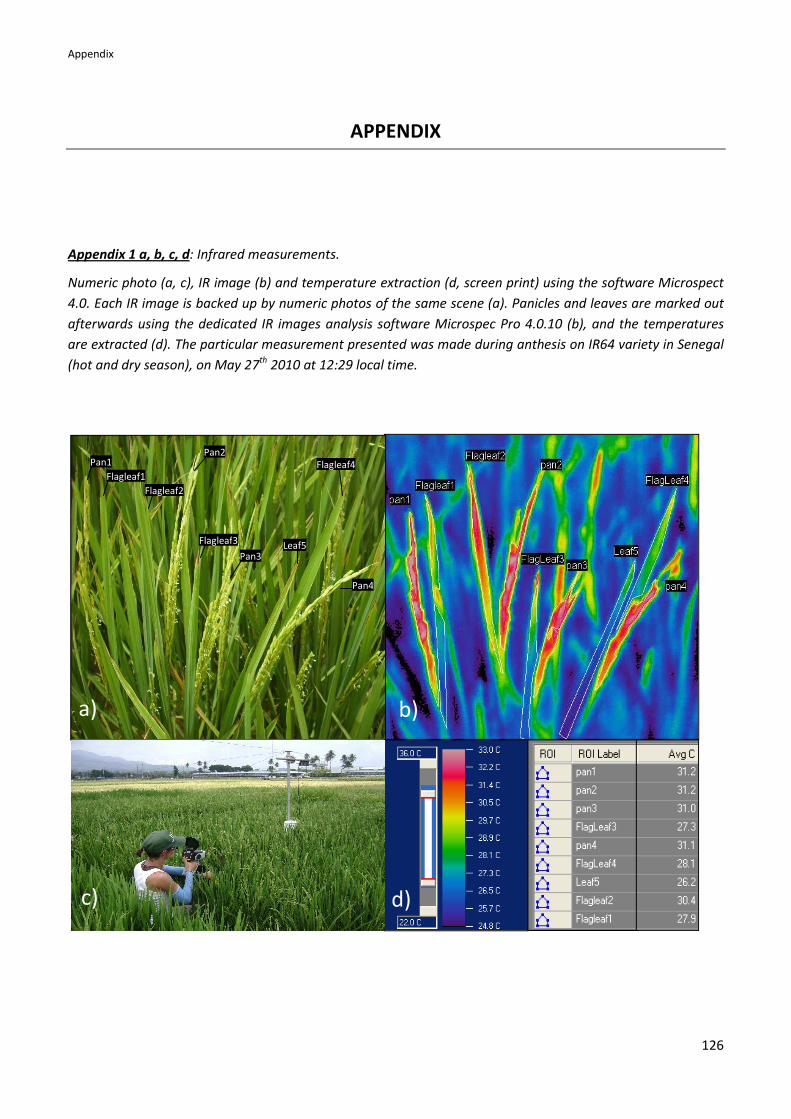
Appendix
126
APPENDIX
Appendix 1 a, b, c, d: Infrared measurements.
Numeric photo (a, c), IR image (b) and temperature extraction (d, screen print) using the software Microspect
4.0. Each IR image is backed up by numeric photos of the same scene (a). Panicles and leaves are marked out
afterwards using the dedicated IR images analysis software Microspec Pro 4.0.10 (b), and the temperatures
are extracted (d). The particular measurement presented was made during anthesis on IR64 variety in Senegal
(hot and dry season), on May 27th
2010 at 12:29 local time.
Pan1 Pan2
Flagleaf1
Flagleaf2
Pan3
Pan4
Flagleaf3
Flagleaf4
Leaf5
a) b)
c) d)
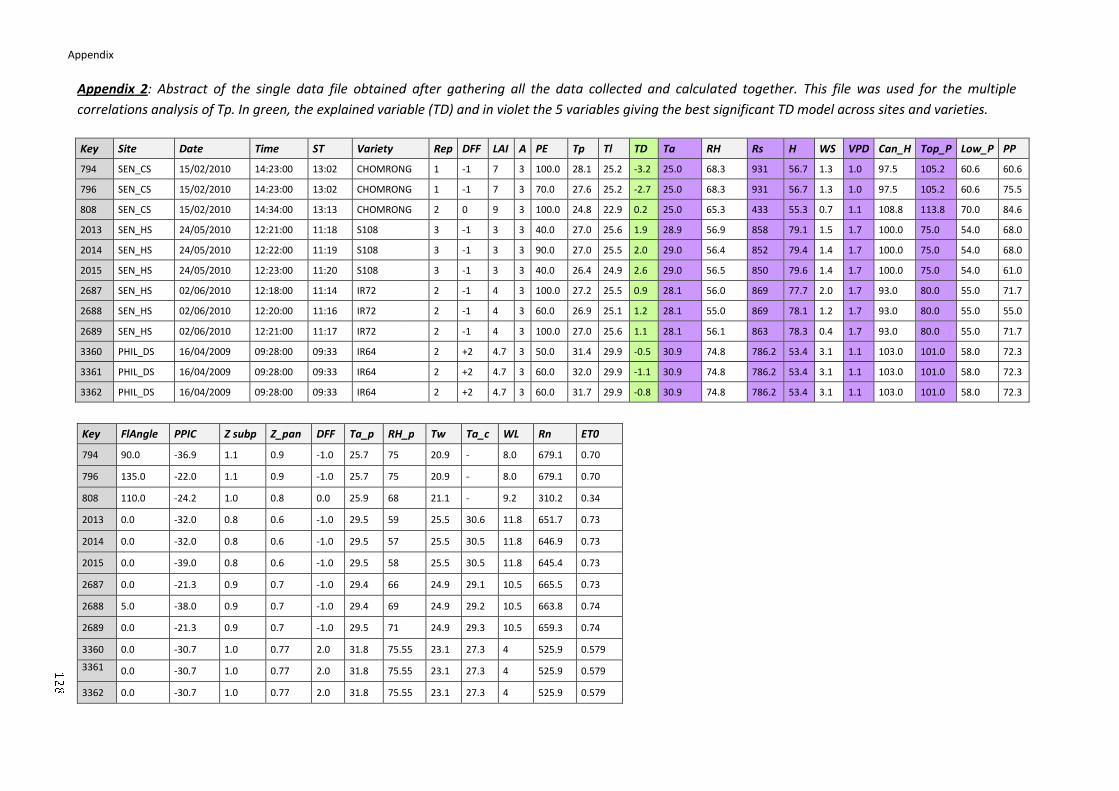
Appendix
Appendix 2: Abstract of the single data file obtained after gathering all the data collected and calculated together. This file was use
correlations analysis of Tp. In green, the explained variable (TD) and in violet the 5 variables giving the best significant TD model across s
Key FlAngle PPIC Z subp Z_pan DFF Ta_p RH_p
794 90.0 -36.9 1.1 0.9 -1.0 25.7 75
796 135.0 -22.0 1.1 0.9 -1.0 25.7 75
808 110.0 -24.2 1.0 0.8 0.0 25.9 68
2013 0.0 -32.0 0.8 0.6 -1.0 29.5 59
2014 0.0 -32.0 0.8 0.6 -1.0 29.5 57
2015 0.0 -39.0 0.8 0.6 -1.0 29.5 58
2687 0.0 -21.3 0.9 0.7 -1.0 29.4 66
2688 5.0 -38.0 0.9 0.7 -1.0 29.4 69
2689 0.0 -21.3 0.9 0.7 -1.0 29.5 71
3360 0.0 -30.7 1.0 0.77 2.0 31.8 75.55
3361 0.0 -30.7 1.0 0.77 2.0 31.8 75.55
3362 0.0 -30.7 1.0 0.77 2.0 31.8 75.55
Key Site Date Time ST Variety
794 SEN_CS 15/02/2010 14:23:00 13:02 CHOMRONG
796 SEN_CS 15/02/2010 14:23:00 13:02 CHOMRONG
808 SEN_CS 15/02/2010 14:34:00 13:13 CHOMRONG
2013 SEN_HS 24/05/2010 12:21:00 11:18 S108
2014 SEN_HS 24/05/2010 12:22:00 11:19 S108
2015 SEN_HS 24/05/2010 12:23:00 11:20 S108
2687 SEN_HS 02/06/2010 12:18:00 11:14 IR72
2688 SEN_HS 02/06/2010 12:20:00 11:16 IR72
2689 SEN_HS 02/06/2010 12:21:00 11:17 IR72
3360 PHIL_DS 16/04/2009 09:28:00 09:33 IR64
3361 PHIL_DS 16/04/2009 09:28:00 09:33 IR64
3362 PHIL_DS 16/04/2009 09:28:00 09:33 IR64
: Abstract of the single data file obtained after gathering all the data collected and calculated together. This file was use
ysis of Tp. In green, the explained variable (TD) and in violet the 5 variables giving the best significant TD model across s
RH_p Tw Ta_c WL Rn ET0
20.9 - 8.0 679.1 0.70
20.9 - 8.0 679.1 0.70
21.1 - 9.2 310.2 0.34
25.5 30.6 11.8 651.7 0.73
25.5 30.5 11.8 646.9 0.73
25.5 30.5 11.8 645.4 0.73
24.9 29.1 10.5 665.5 0.73
24.9 29.2 10.5 663.8 0.74
24.9 29.3 10.5 659.3 0.74
75.55 23.1 27.3 4 525.9 0.579
75.55 23.1 27.3 4 525.9 0.579
75.55 23.1 27.3 4 525.9 0.579
Rep DFF LAI A PE Tp Tl TD Ta RH Rs H
CHOMRONG 1 -1 7 3 100.0 28.1 25.2 -3.2 25.0 68.3 931 56.7
CHOMRONG 1 -1 7 3 70.0 27.6 25.2 -2.7 25.0 68.3 931 56.7
CHOMRONG 2 0 9 3 100.0 24.8 22.9 0.2 25.0 65.3 433 55.3
3 -1 3 3 40.0 27.0 25.6 1.9 28.9 56.9 858 79.1
3 -1 3 3 90.0 27.0 25.5 2.0 29.0 56.4 852 79.4
3 -1 3 3 40.0 26.4 24.9 2.6 29.0 56.5 850 79.6
2 -1 4 3 100.0 27.2 25.5 0.9 28.1 56.0 869 77.7
2 -1 4 3 60.0 26.9 25.1 1.2 28.1 55.0 869 78.1
2 -1 4 3 100.0 27.0 25.6 1.1 28.1 56.1 863 78.3
2 +2 4.7 3 50.0 31.4 29.9 -0.5 30.9 74.8 786.2 53.4
2 +2 4.7 3 60.0 32.0 29.9 -1.1 30.9 74.8 786.2 53.4
2 +2 4.7 3 60.0 31.7 29.9 -0.8 30.9 74.8 786.2 53.4
127
: Abstract of the single data file obtained after gathering all the data collected and calculated together. This file was used for the multiple
ysis of Tp. In green, the explained variable (TD) and in violet the 5 variables giving the best significant TD model across sites and varieties.
WS VPD Can_H Top_P Low_P PP
1.3 1.0 97.5 105.2 60.6 60.6
1.3 1.0 97.5 105.2 60.6 75.5
0.7 1.1 108.8 113.8 70.0 84.6
1.5 1.7 100.0 75.0 54.0 68.0
1.4 1.7 100.0 75.0 54.0 68.0
1.4 1.7 100.0 75.0 54.0 61.0
2.0 1.7 93.0 80.0 55.0 71.7
1.2 1.7 93.0 80.0 55.0 55.0
0.4 1.7 93.0 80.0 55.0 71.7
3.1 1.1 103.0 101.0 58.0 72.3
3.1 1.1 103.0 101.0 58.0 72.3
3.1 1.1 103.0 101.0 58.0 72.3

Appendix
Appendix
2(suite) :
Parameters
description.
ST
Solar Time (hh :mm)
DFF Day from 50% flowering (in day)
LAI Leaf Area Index at 50 Flowering
A Anthesis
0: before, 3: most spikelets opened, post: after
PE Panicle exersion (%)
Tp Avg Panicle temperature (IR measurement) (°C)
Tl Avg Leaf temperature (avg of Tleaf around the panicle) (°C)
TD Ta - Tp
Ta Air temperature at 2m from the ground (°C)
RH Relative Humidity at 2m from the ground
Rs Solar Radiation (W.m²)
H Sun height in the sky (in degree)
WS Wind Speed at 2m from ground (m/s)
VPD Avg Vapour Pressure Deficit (kPa)
Can_H Canopy Height (highest leaf on the subplot) from the ground (cm)
Top_P Position of the highest panicle from the ground on the subplot (cm)
Low_P Position of the lowest panicle from the ground on
PP Panicle Position from the ground (cm)
FlAngle Flag leaf angle (in degree)
PPIC Panicle Position inside the canopy = Relative Panicle Position from
the top of the canopy (cm)
Z Normalized Panicle Position
= PP /Can_H
Zsubp Normalized panicle layer Position
=[Top_P-(Top_P-Low_P)/2]/Can_H
after
Avg Panicle temperature (IR measurement) (°C)
Avg Leaf temperature (avg of Tleaf around the panicle) (°C)
Canopy Height (highest leaf on the subplot) from the ground (cm)
Position of the highest panicle from the ground on the subplot (cm)
Position of the lowest panicle from the ground on the subplot (cm)
Panicle Position inside the canopy = Relative Panicle Position from
128

Appendix
129
Appendix 3: RIDEV V.2 screens of user interface
1. Screen for individual simulation runs
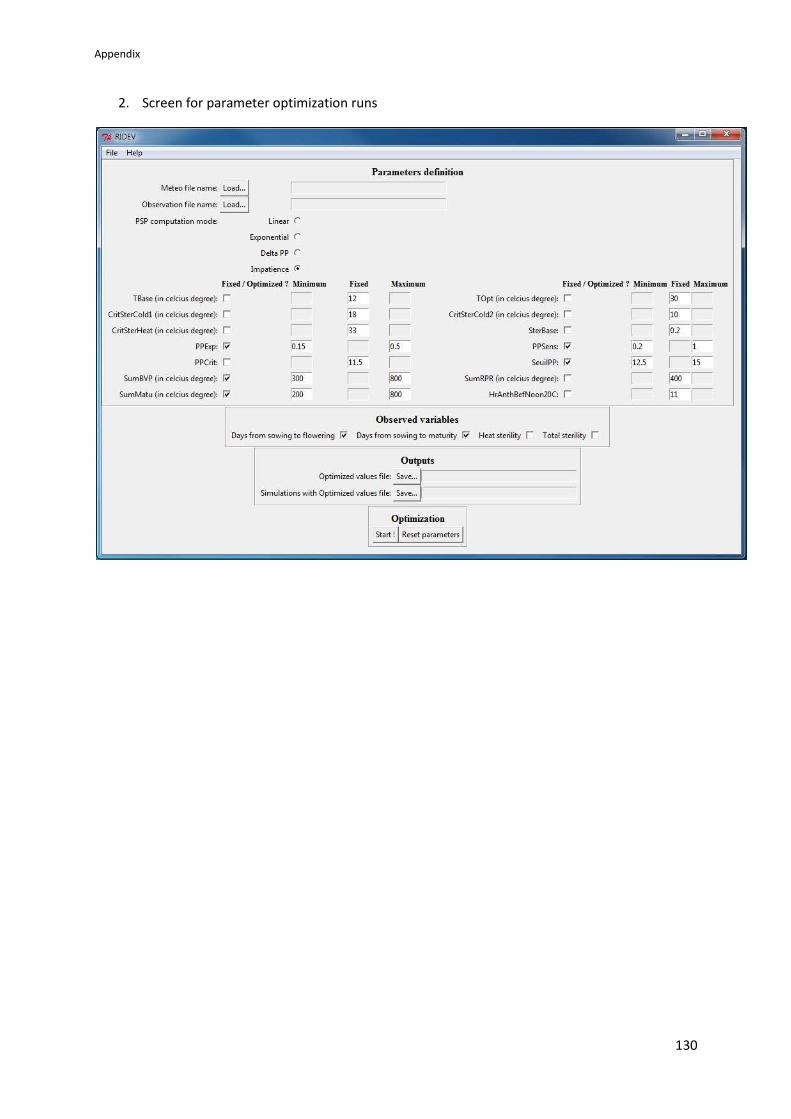
Appendix
130
2. Screen for parameter optimization runs
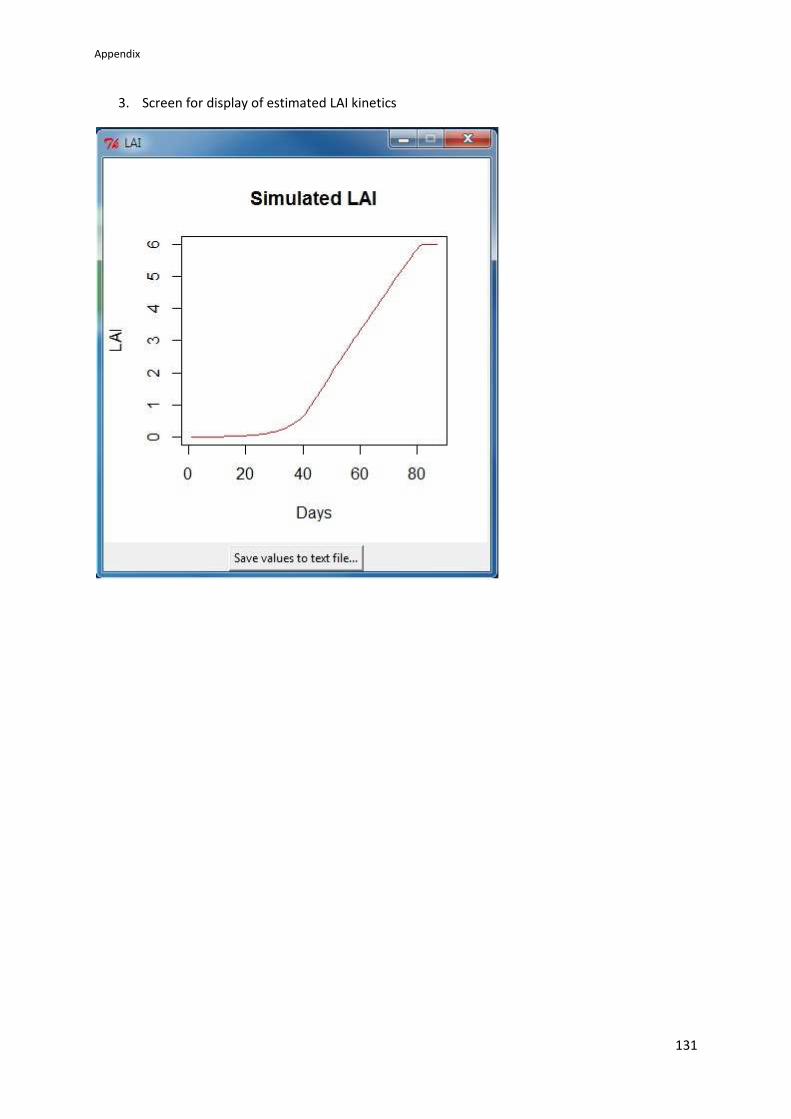
Appendix
131
3. Screen for display of estimated LAI kinetics
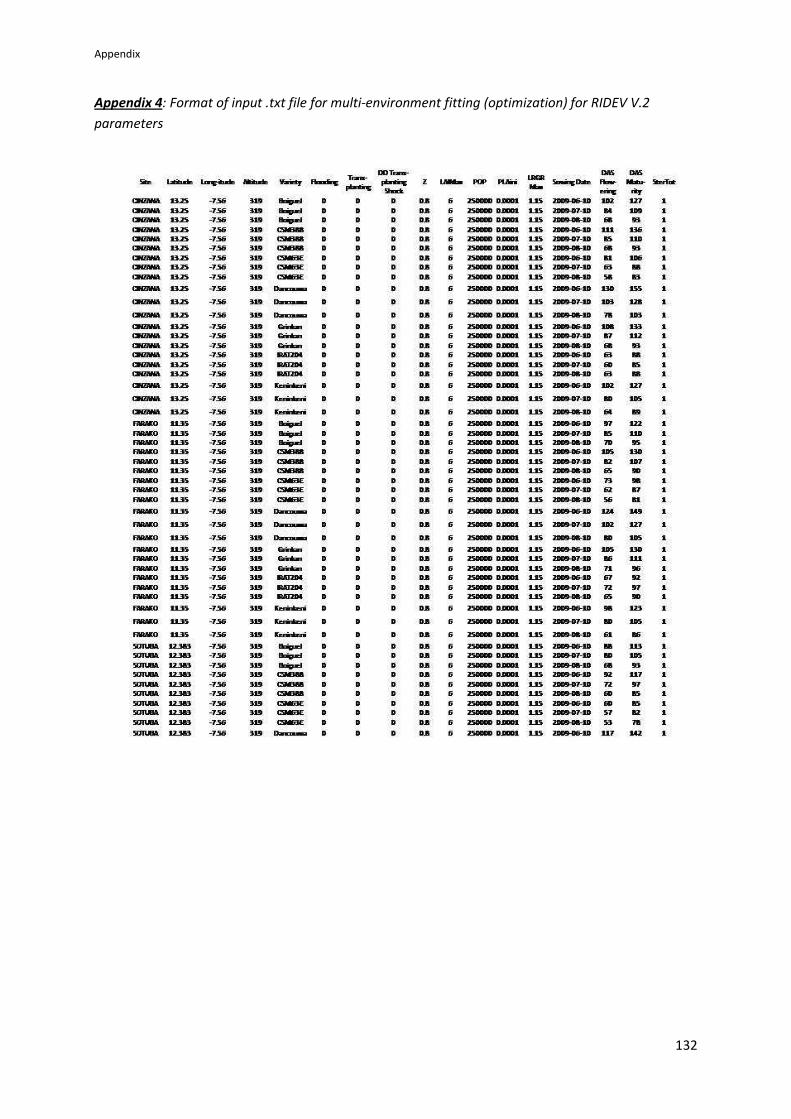
Appendix
132
Appendix 4: Format of input .txt file for multi-environment fitting (optimization) for RIDEV V.2
parameters
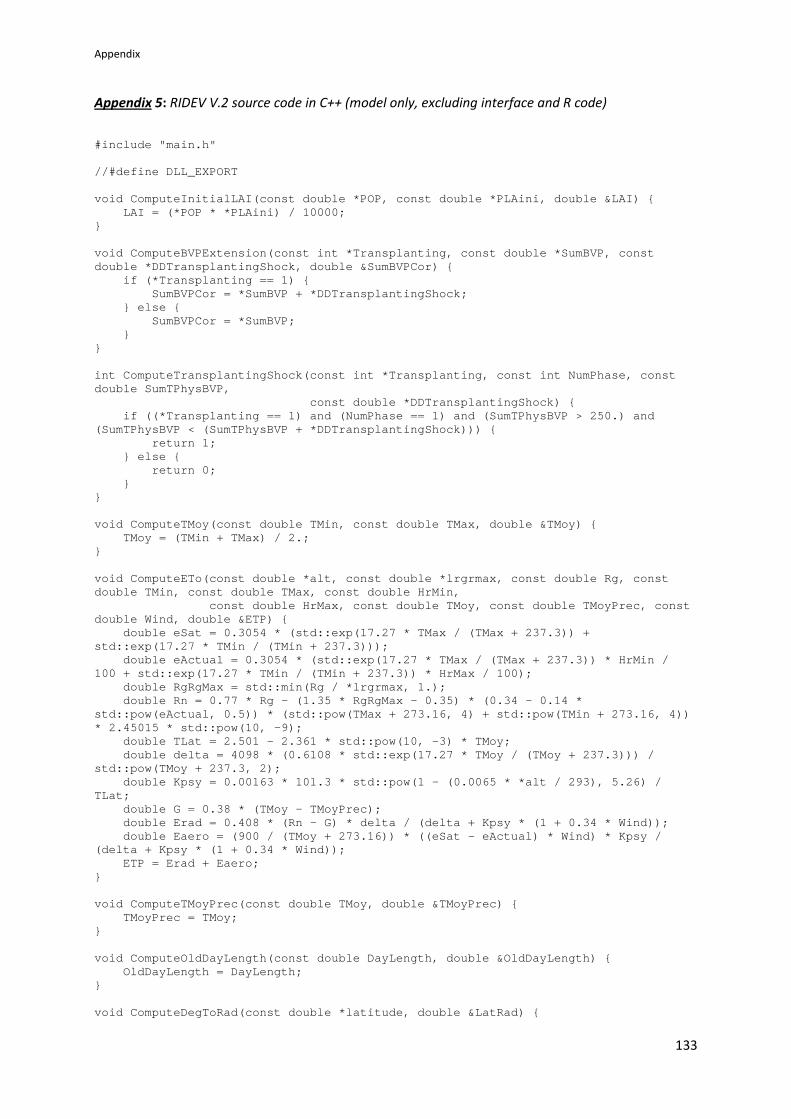
Appendix
133
Appendix 5: RIDEV V.2 source code in C++ (model only, excluding interface and R code)
#include "main.h" //#define DLL_EXPORT void ComputeInitialLAI(const double *POP, const double *PLAini, double &LAI) { LAI = (*POP * *PLAini) / 10000; } void ComputeBVPExtension(const int *Transplanting, const double *SumBVP, const double *DDTransplantingShock, double &SumBVPCor) { if (*Transplanting == 1) { SumBVPCor = *SumBVP + *DDTransplantingShock; } else { SumBVPCor = *SumBVP; } } int ComputeTransplantingShock(const int *Transplanting, const int NumPhase, const double SumTPhysBVP, const double *DDTransplantingShock) { if ((*Transplanting == 1) and (NumPhase == 1) and (SumTPhysBVP > 250.) and (SumTPhysBVP < (SumTPhysBVP + *DDTransplantingShock))) { return 1; } else { return 0; } } void ComputeTMoy(const double TMin, const double TMax, double &TMoy) { TMoy = (TMin + TMax) / 2.; } void ComputeETo(const double *alt, const double *lrgrmax, const double Rg, const double TMin, const double TMax, const double HrMin, const double HrMax, const double TMoy, const double TMoyPrec, const double Wind, double &ETP) { double eSat = 0.3054 * (std::exp(17.27 * TMax / (TMax + 237.3)) + std::exp(17.27 * TMin / (TMin + 237.3))); double eActual = 0.3054 * (std::exp(17.27 * TMax / (TMax + 237.3)) * HrMin / 100 + std::exp(17.27 * TMin / (TMin + 237.3)) * HrMax / 100); double RgRgMax = std::min(Rg / *lrgrmax, 1.); double Rn = 0.77 * Rg - (1.35 * RgRgMax - 0.35) * (0.34 - 0.14 * std::pow(eActual, 0.5)) * (std::pow(TMax + 273.16, 4) + std::pow(TMin + 273.16, 4)) * 2.45015 * std::pow(10, -9); double TLat = 2.501 - 2.361 * std::pow(10, -3) * TMoy; double delta = 4098 * (0.6108 * std::exp(17.27 * TMoy / (TMoy + 237.3))) / std::pow(TMoy + 237.3, 2); double Kpsy = 0.00163 * 101.3 * std::pow(1 - (0.0065 * *alt / 293), 5.26) / TLat; double G = 0.38 * (TMoy - TMoyPrec); double Erad = 0.408 * (Rn - G) * delta / (delta + Kpsy * (1 + 0.34 * Wind)); double Eaero = (900 / (TMoy + 273.16)) * ((eSat - eActual) * Wind) * Kpsy / (delta + Kpsy * (1 + 0.34 * Wind)); ETP = Erad + Eaero; } void ComputeTMoyPrec(const double TMoy, double &TMoyPrec) { TMoyPrec = TMoy; } void ComputeOldDayLength(const double DayLength, double &OldDayLength) { OldDayLength = DayLength; } void ComputeDegToRad(const double *latitude, double &LatRad) {
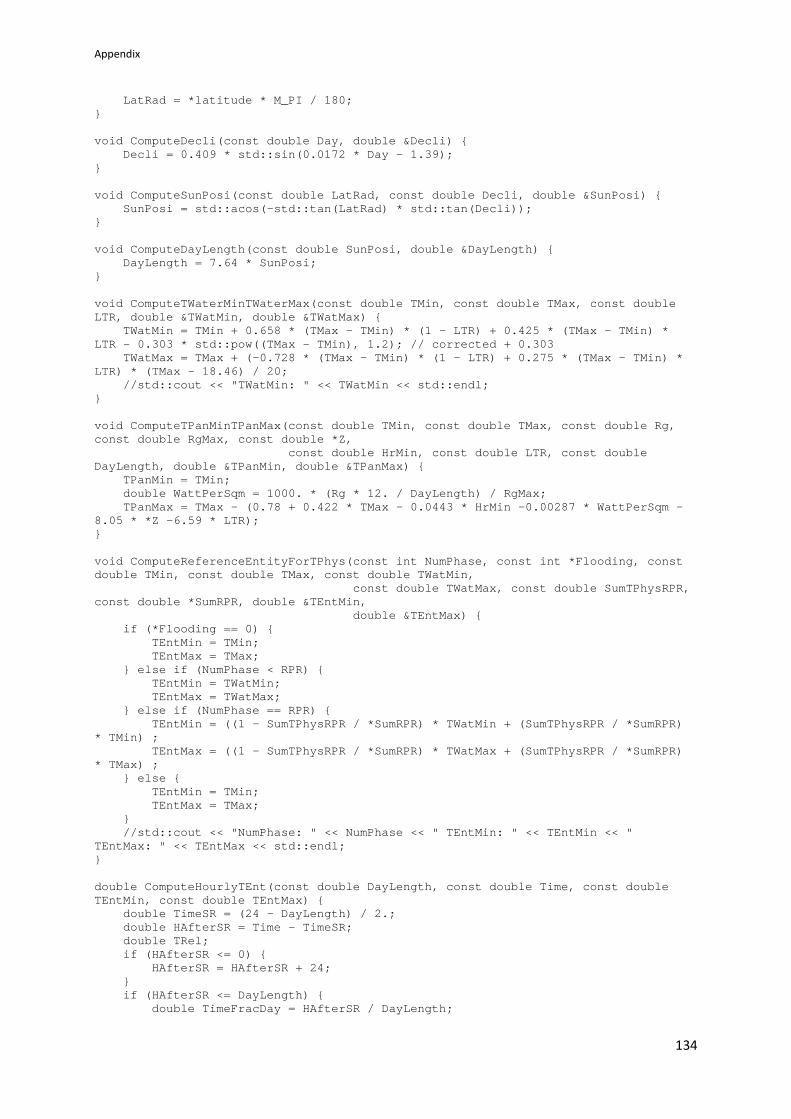
Appendix
134
LatRad = *latitude * M_PI / 180; } void ComputeDecli(const double Day, double &Decli) { Decli = 0.409 * std::sin(0.0172 * Day - 1.39); } void ComputeSunPosi(const double LatRad, const double Decli, double &SunPosi) { SunPosi = std::acos(-std::tan(LatRad) * std::tan(Decli)); } void ComputeDayLength(const double SunPosi, double &DayLength) { DayLength = 7.64 * SunPosi; } void ComputeTWaterMinTWaterMax(const double TMin, const double TMax, const double LTR, double &TWatMin, double &TWatMax) { TWatMin = TMin + 0.658 * (TMax - TMin) * (1 - LTR) + 0.425 * (TMax - TMin) * LTR - 0.303 * std::pow((TMax - TMin), 1.2); // corrected + 0.303 TWatMax = TMax + (-0.728 * (TMax - TMin) * (1 - LTR) + 0.275 * (TMax - TMin) * LTR) * (TMax - 18.46) / 20; //std::cout << "TWatMin: " << TWatMin << std::endl; } void ComputeTPanMinTPanMax(const double TMin, const double TMax, const double Rg, const double RgMax, const double *Z, const double HrMin, const double LTR, const double DayLength, double &TPanMin, double &TPanMax) { TPanMin = TMin; double WattPerSqm = 1000. * (Rg * 12. / DayLength) / RgMax; TPanMax = TMax - (0.78 + 0.422 * TMax - 0.0443 * HrMin -0.00287 * WattPerSqm - 8.05 * *Z -6.59 * LTR); } void ComputeReferenceEntityForTPhys(const int NumPhase, const int *Flooding, const double TMin, const double TMax, const double TWatMin, const double TWatMax, const double SumTPhysRPR, const double *SumRPR, double &TEntMin, double &TEntMax) { if (*Flooding == 0) { TEntMin = TMin; TEntMax = TMax; } else if (NumPhase < RPR) { TEntMin = TWatMin; TEntMax = TWatMax; } else if (NumPhase == RPR) { TEntMin = ((1 - SumTPhysRPR / *SumRPR) * TWatMin + (SumTPhysRPR / *SumRPR) * TMin) ; TEntMax = ((1 - SumTPhysRPR / *SumRPR) * TWatMax + (SumTPhysRPR / *SumRPR) * TMax) ; } else { TEntMin = TMin; TEntMax = TMax; } //std::cout << "NumPhase: " << NumPhase << " TEntMin: " << TEntMin << " TEntMax: " << TEntMax << std::endl; } double ComputeHourlyTEnt(const double DayLength, const double Time, const double TEntMin, const double TEntMax) { double TimeSR = (24 - DayLength) / 2.; double HAfterSR = Time - TimeSR; double TRel; if (HAfterSR <= 0) { HAfterSR = HAfterSR + 24; } if (HAfterSR <= DayLength) { double TimeFracDay = HAfterSR / DayLength;
Appendix
135
TRel = 3.55 * TimeFracDay - 3.15 * std::pow(TimeFracDay, 2); } else { double TimeFracNight = (HAfterSR - DayLength) / (24 - DayLength); TRel = 0.4 - 0.8 * TimeFracNight + 0.4 * std::pow(TimeFracNight, 2); } //std::cout << "TEnt: " << TEntMin + TRel * (TEntMax - TEntMin) << std::endl; return (TEntMin + TRel * (TEntMax - TEntMin)); } void ComputeTPhys(const double DayLength, const double *TOpt, const double *TBase, const double TEntMin, const double TEntMax, double &TPhys) { TPhys = 0; for (int i = 0; i < 24; i++) { double TEnt = ComputeHourlyTEnt(DayLength, i + 1, TEntMin, TEntMax); double TPhysH = std::max(std::min(TEnt, *TOpt) - *TBase, 0.); TPhys += TPhysH; } TPhys = TPhys / 24.; } int ComputeIncDayCounter(const int DayCounter) { return DayCounter + 1; } void ComputePhases(int &NumPhase, const int *PSPComputationMode, const int Counter, double &SumTPhys, double &SumTPhysBVP, const double SumBVPCor, int &DaysToEndBVP, const double TPhys, double &SumTPhysPSP, const double OldDayLength, const double DayLength, int &DaysToPI, double &SumTPhysRPR, const double *SumRPR, int &DaysToFlowering, double &SumTPhysMatu, const double *SumMatu, int &DaysToMaturity, const double *PPExp, const double *PPCrit, const double *SeuilPP, const double *PPSens) { if (NumPhase < PSP) { SumTPhys += TPhys; SumTPhysBVP += TPhys; if (SumTPhysBVP >= SumBVPCor) { NumPhase = PSP; DaysToEndBVP = Counter; } } else if (NumPhase == PSP) { double dPSP; double dDayLength; switch (*PSPComputationMode) { case 1: dPSP = *PPSens * TPhys / std::max(DayLength - *PPCrit, 0.); SumTPhys += TPhys; SumTPhysPSP += dPSP; if (SumTPhysPSP >= 1.) { NumPhase = RPR; DaysToPI = Counter; } break; case 2: dPSP = *PPSens * TPhys / std::pow(std::max(DayLength - *PPCrit, 0.), *PPExp); SumTPhys += TPhys; SumTPhysPSP += dPSP; if (SumTPhysPSP >= 1.) { NumPhase = RPR; DaysToPI = Counter; } break; case 3:
Appendix
136
dDayLength = DayLength - OldDayLength; dPSP = std::max(*PPSens * TPhys * (*PPCrit - dDayLength), 0.); SumTPhys += TPhys; SumTPhysPSP += dPSP; if (SumTPhysPSP >= 1.) { NumPhase = RPR; DaysToPI = Counter; } break; case 4: double SumPP = std::pow((1000. / SumTPhysPSP), *PPExp) * std::max(0., DayLength - *PPCrit) / (*SeuilPP - *PPCrit); SumTPhys += TPhys; SumTPhysPSP += TPhys; if (SumPP <= *PPSens) { NumPhase = RPR; DaysToPI = Counter; } break; } } else if (NumPhase == RPR) { SumTPhys += TPhys; SumTPhysRPR += TPhys; if (SumTPhysRPR >= *SumRPR) { NumPhase = Matu; DaysToFlowering = Counter; } } else if (NumPhase == Matu) { SumTPhys += TPhys; SumTPhysMatu += TPhys; if (SumTPhysMatu >= *SumMatu) { NumPhase = End; DaysToMaturity = Counter; } } } double ComputeLAI(const int NumPhase, const double LAI, const double *LRGRMax, const double *TOpt, const double *TBase, const int TPhys, const int TransplantingShock, const double *LAIMax) { double newLAI; if ((LAI <= 1) and (TransplantingShock == 0) and (NumPhase < 4)) { newLAI = LAI * (1 + (*LRGRMax - 1) * TPhys / (*TOpt - *TBase)); } else if ((LAI <= 1) and (TransplantingShock == 1) and (NumPhase < 4)) { newLAI = LAI * (1 + (*LRGRMax - 1) * 0.5 * TPhys / (*TOpt - *TBase)); } else if ((LAI > 1) and (LAI <= *LAIMax)) { newLAI = LAI + (*LRGRMax - 1) * 1 * TPhys / (*TOpt - *TBase); } else { newLAI = LAI; } return std::min(newLAI, *LAIMax); } void ComputeLTR(const double LAI, double <R) { if (LAI == 0) { LTR = 1.; } else { LTR = std::exp(-0.6 * LAI); } } void ComputeMicrosporeColdSterility(const double TEntMin, const double SumTPhysRPR, const double *SumRPR, const double *CritSterCold1,
Appendix
137
double &TRefSterCold1, double &SterCold1, double &MicroSterMeanCounter) { if ((SumTPhysRPR >= (*SumRPR * 0.3)) and (SumTPhysRPR <= (*SumRPR * 0.7))) { TRefSterCold1 = TEntMin; SterCold1 += std::min(1., std::max(0., (*CritSterCold1 - TRefSterCold1) / 5.)); MicroSterMeanCounter++; } else if ((MicroSterMeanCounter != -1) and (SumTPhysRPR > (*SumRPR * 0.7))) { SterCold1 /= MicroSterMeanCounter; MicroSterMeanCounter = -1; } } void ComputePanicleColdSterility(const double TEntMin, const double SumTPhysRPR, const double *SumRPR, const double *CritSterCold2, double &TRefSterCold2, double &SterCold2, double &PanSterMeanCounter) { if ((SumTPhysRPR > (*SumRPR * 0.7)) and (SumTPhysRPR <= *SumRPR)) { TRefSterCold2 = TEntMin; SterCold2 += std::min(1., std::max(0., (*CritSterCold2 - TRefSterCold2) / 5.)); PanSterMeanCounter++; } else if ((PanSterMeanCounter != -1) and (SumTPhysRPR > *SumRPR )) { SterCold2 /= PanSterMeanCounter; PanSterMeanCounter = -1; } } void ComputeHeatSterility(const double SumTPhysRPR, const double SumTPhysMatu, const double *SumRPR, const double *CritSterHeat, const double DayLength, const double *HrAnthBefNoon20C, const double TMin, const double TPanMin, double const TPanMax, int &HeatSterilityCounter, double &SterHeat, double &AnthesisTimeMean , double &AnthTimeMeanFlag) { if ((SumTPhysRPR >= (*SumRPR - 60)) and (SumTPhysMatu <= 60)) { double AnthesisTime = (14. - 0.4 * TMin) + (24 - DayLength) / 2 - *HrAnthBefNoon20C; csv_out << AnthesisTime << "\t"; AnthesisTimeMean += AnthesisTime; double TPanAnth = ComputeHourlyTEnt(DayLength, AnthesisTime, TPanMin, TPanMax); csv_out << TPanAnth << "\t"; double SterHeatDay = std::min(1., std::max(0., (TPanAnth - *CritSterHeat) / 5.)); SterHeat += SterHeatDay; ++HeatSterilityCounter; if(AnthTimeMeanFlag == 0) AnthTimeMeanFlag = 1; } else { if (AnthTimeMeanFlag == 1 ) { AnthTimeMeanFlag = -1; AnthesisTimeMean /= HeatSterilityCounter; } csv_out << "\t \t"; } } double ComputeTotalSterility(const double *SterBase, const double SterCold1, const double SterCold2, const double SterHeat){ return (*SterBase + (1. - *SterBase) * (1. - ((1. - SterCold1) * (1. - SterCold2) * (1. - SterHeat)))); } // for debugging purposes !! std::string IntToStr(int n){
Appendix
138
std::ostringstream result; result << n; return result.str(); } void DLL_EXPORT ridev(const double *alt, const double *latitude, const double *longitude, const int *days, const double *tmin, const double *tmax, const double *hrmin, const double *hrmax, const double *wind, const double *rg, const int *size, const double *POP, const double *PLAini, const int *Flooding, const int *Transplanting, const double *DDTransplantingShock, const double *SumBVP, const double *SumRPR, const double *SumMatu, const double *lrgrmax, const double *TOpt, const double *TBase, const double *CritSterCold1, const double *CritSterCold2, const double *CritSterHeat, const double *SterBase, const double *HrAnthBefNoon20C, const double *PPExp, const double *PPCrit, const double *SeuilPP, const double *PPSens, const int *PSPComputationMode, const double *Z, const double *LAIMax, double *DSowFlowering, double *DSowMaturity, double *SterHeatOut, double *SterCold1Out, double *SterCold2Out, double *SterTotOut, int *DSowEndBVP, int *DSowPi, double *AnthTimeMean, double *LAIs) { const double RgMax = 22.; double SumBVPCor = 0.; double TMin, TWatMin, TPanMin = 0, TEntMin; double TMax, TWatMax, TPanMax = 0, TEntMax; double Rg; double TMoy; double TMoyPrec = 0.; double TPhys; double HrMin; double HrMax; double Wind; double ETP; int Day; double LatRad; double Decli; double SunPosi; double DayLength; double OldDayLength = 0.; int NumPhase = BVP; int DayCounter = 0; double SumTPhysRPR = 0; double SumTPhysBVP = 0; double SumTPhysPSP = 0; double SumTPhysMatu = 0; double SumTPhys = 0; int DaysToEndBVP = 0; int DaysToPI = 0; int DaysToFlowering = 0; int DaysToMaturity = 0; double TRefSterCold1 = 0; double TRefSterCold2 = 0; double SterCold1 = 0; double SterCold2 = 0; double SterHeat = 0; double SterTot = 0; double LAI = 0; double LTR = 0; double AnthesisTimeMean = 0; double MicroSterMeanCounter = 0; double PanSterMeanCounter = 0; double AnthTimeMeanFlag = 0; int i = 0;
Appendix
139
int HeatSterilityCounter = 0; int TransplantingShock; // logging phase csv_out.open("ridev_trace.txt"); //csv_debug.open("ridev_log.txt", std::ios::app); //std::string debug_string ; time_t ltime; /* calendar time */ ltime=time(NULL); /* get current cal time */ //csv_debug << asctime( localtime(<ime) ) ; //debug_string = "\n\nINPUT PARAMS : \n altitude\tlatitude\tlongitude\tdays\ttmin\ttmax\thrmin\thrmax\twind\trg\tsize\tpop\tplaini\tflooding\ttransplanting\tddtransplantingshock\tsumbvp\tsumrpr\tsummatu\tlrgrmax\ttopt\ttbase\tcritstercold1\tcritstercold2\tcritsterheat\tsterbase\thranthbefnoon20c\tppexp\tppcrit\tseuilpp\tppsens\tpspcomputationmode\tz\tlaimax\tdsowflowering\tdsowmaturity\n" + IntToStr(alt)+ "\t" + IntToStr(latitude)+ "\t" + IntToStr(longitude)+ "\t" + IntToStr(days)+ "\t" + IntToStr(tmin)+ "\t" + IntToStr(tmax)+ "\t" + IntToStr(hrmin)+ "\t" + IntToStr(hrmax)+ "\t" + IntToStr(wind)+ "\t" + IntToStr(rg)+ "\t" + IntToStr(size)+ "\t" + IntToStr(POP)+ "\t" + IntToStr(PLAini)+ "\t" + IntToStr(Flooding)+ "\t" + IntToStr(Transplanting)+ "\t" + IntToStr(DDTransplantingShock)+ "\t" + IntToStr(SumBVP)+ "\t" + IntToStr(SumRPR)+ "\t" + IntToStr(SumMatu)+ "\t" + IntToStr(lrgrmax)+ "\t" + IntToStr(TOpt)+ "\t" + IntToStr(TBase)+ "\t" + IntToStr(CritSterCold1)+ "\t" + IntToStr(CritSterCold2)+ "\t" + IntToStr(CritSterHeat)+ "\t" + IntToStr(SterBase)+ "\t" + IntToStr(HrAnthBefNoon20C)+ "\t" + IntToStr(PPExp)+ "\t" + IntToStr(PPCrit)+ "\t" + IntToStr(SeuilPP)+ "\t" + IntToStr(PPSens)+ "\t" + IntToStr(PSPComputationMode)+ "\t" + IntToStr(Z)+ "\t" + IntToStr(LAIMax)+ "\t" + IntToStr(DSowFlowering)+ "\t" + IntToStr(DSowMaturity )+ "\n\n\n"; //csv_debug << debug_string; //csv_out << debug_string; csv_out << "TMin\tTMax\tTWatMin\tTWatMax\tTPanMin\tTPanMax\tTEntMin\tTEntMax\tTPhys\tAnthesisTime\tTPanAnth\tLAI\tDayLength\n"; ComputeInitialLAI(POP, PLAini, LAI); ComputeBVPExtension(Transplanting, SumBVP, DDTransplantingShock, SumBVPCor); while ((i < *size) and (NumPhase < End)) { TMin = tmin[i]; TMax = tmax[i]; Rg = rg[i]; HrMin = hrmin[i]; HrMax = hrmax[i]; Wind = wind[i]; Day = days[i]; csv_out << TMin << "\t" << TMax << "\t"; DayCounter = ComputeIncDayCounter(DayCounter); ComputeTMoy(TMin, TMax, TMoy); if (*Flooding != 0) { ComputeETo(alt, lrgrmax, Rg, TMin, TMax, HrMin, HrMax, TMoy, TMoyPrec, Wind, ETP); } ComputeTMoyPrec(TMoy, TMoyPrec); ComputeDegToRad(latitude, LatRad); ComputeDecli(Day, Decli); ComputeSunPosi(LatRad, Decli, SunPosi); ComputeDayLength(SunPosi, DayLength);
Appendix
140
ComputeLTR(LAI, LTR); if (*Flooding != 0) { ComputeTWaterMinTWaterMax(TMin, TMax, LTR, TWatMin, TWatMax); csv_out << TWatMin << "\t" << TWatMax << "\t"; ComputeTPanMinTPanMax(TMin, TMax, Rg, RgMax, Z, HrMin, LTR, DayLength, TPanMin, TPanMax); csv_out << TPanMin << "\t" << TPanMax << "\t"; } else { csv_out << " \t \t \t \t"; } ComputeReferenceEntityForTPhys(NumPhase, Flooding, TMin, TMax, TWatMin, TWatMax, SumTPhysRPR, SumRPR, TEntMin, TEntMax); csv_out << TEntMin << "\t" << TEntMax << "\t"; ComputeTPhys(DayLength, TOpt, TBase, TEntMin, TEntMax, TPhys); csv_out << TPhys << "\t"; ComputePhases(NumPhase, PSPComputationMode, DayCounter, SumTPhys, SumTPhysBVP, SumBVPCor, DaysToEndBVP, TPhys, SumTPhysPSP, OldDayLength, DayLength, DaysToPI, SumTPhysRPR, SumRPR, DaysToFlowering, SumTPhysMatu, SumMatu, DaysToMaturity, PPExp, PPCrit, SeuilPP, PPSens); TransplantingShock = ComputeTransplantingShock(Transplanting, NumPhase, SumTPhysBVP, DDTransplantingShock); LAI = ComputeLAI(NumPhase, LAI, lrgrmax, TOpt, TBase, TPhys, TransplantingShock, LAIMax); ComputeMicrosporeColdSterility(TEntMin, SumTPhysRPR, SumRPR, CritSterCold1, TRefSterCold1, SterCold1, MicroSterMeanCounter); ComputePanicleColdSterility(TEntMin, SumTPhysRPR, SumRPR, CritSterCold2, TRefSterCold2, SterCold2, PanSterMeanCounter); if (*Flooding != 0) { ComputeHeatSterility(SumTPhysRPR, SumTPhysMatu, SumRPR, CritSterHeat, DayLength, HrAnthBefNoon20C, TMin, TPanMin, TPanMax, HeatSterilityCounter, SterHeat, AnthesisTimeMean, AnthTimeMeanFlag); } ComputeOldDayLength(DayLength, OldDayLength); LAIs[i] = LAI; csv_out << LAI << "\t" << DayLength ; i++; csv_out << "\n"; } if (HeatSterilityCounter != 0) { SterHeat = SterHeat / HeatSterilityCounter; } //debug_string = "OUTPUT VALUES: \n" + "days to flowering\tdays to maturity\tsterheat\tstercold1\tstercold2\tstertot\tdays to end BVP\tdays to pi\n" + IntToStr( DaysToFlowering) + "\t" + IntToStr(DaysToMaturity) + "\t" + IntToStr( SterHeat) + "\t" + IntToStr( SterCold1) + "\t" // + IntToStr( SterCold2 )+ "\t" + IntToStr( SterTot )+ "\t" + IntToStr( DaysToEndBVP )+ "\t" + IntToStr( DaysToPI )+ "\n"; //csv_debug << debug_string; //csv_out << debug_string; SterTot = ComputeTotalSterility(SterBase, SterCold1, SterCold2, SterHeat); *DSowFlowering = DaysToFlowering;
Appendix
141
*DSowMaturity = DaysToMaturity; if( *Flooding != 0 ) *SterHeatOut = SterHeat; else *SterHeatOut = 999; *SterCold1Out = SterCold1; *SterCold2Out = SterCold2; *SterTotOut = SterTot; *DSowEndBVP = DaysToEndBVP; *DSowPi = DaysToPI; *AnthTimeMean = AnthesisTimeMean; csv_out.close(); //csv_debug.close(); } BOOL WINAPI DllMain(HINSTANCE hinstDLL, DWORD fdwReason, LPVOID lpvReserved) { switch (fdwReason) { case DLL_PROCESS_ATTACH: // attach to process // return FALSE to fail DLL load break; case DLL_PROCESS_DETACH: // detach from process break; case DLL_THREAD_ATTACH: // attach to thread break; case DLL_THREAD_DETACH: // detach from thread break; } return TRUE; // succesful }

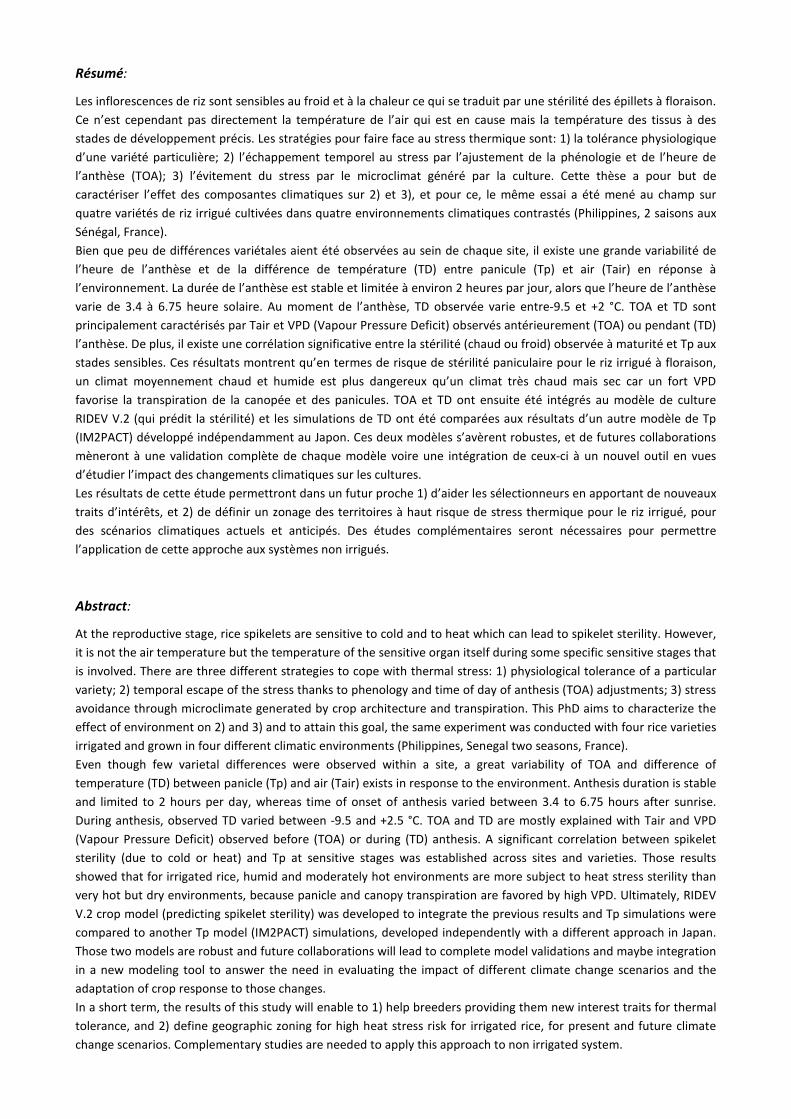
Résumé:
Les inflorescences de riz sont sensibles au froid et à la chaleur ce qui se traduit par une stérilité des épillets à floraison.
Ce n’est cependant pas directement la température de l’air qui est en cause mais la température des tissus à des
stades de développement précis. Les stratégies pour faire face au stress thermique sont: 1) la tolérance physiologique
d’une variété particulière; 2) l’échappement temporel au stress par l’ajustement de la phénologie et de l’heure de
l’anthèse (TOA); 3) l’évitement du stress par le microclimat généré par la culture. Cette thèse a pour but de
caractériser l’effet des composantes climatiques sur 2) et 3), et pour ce, le même essai a été mené au champ sur
quatre variétés de riz irrigué cultivées dans quatre environnements climatiques contrastés (Philippines, 2 saisons aux
Sénégal, France).
Bien que peu de différences variétales aient été observées au sein de chaque site, il existe une grande variabilité de
l’heure de l’anthèse et de la différence de température (TD) entre panicule (Tp) et air (Tair) en réponse à
l’environnement. La durée de l’anthèse est stable et limitée à environ 2 heures par jour, alors que l’heure de l’anthèse
varie de 3.4 à 6.75 heure solaire. Au moment de l’anthèse, TD observée varie entre-9.5 et +2 °C. TOA et TD sont
principalement caractérisés par Tair et VPD (Vapour Pressure Deficit) observés antérieurement (TOA) ou pendant (TD)
l’anthèse. De plus, il existe une corrélation significative entre la stérilité (chaud ou froid) observée à maturité et Tp aux
stades sensibles. Ces résultats montrent qu’en termes de risque de stérilité paniculaire pour le riz irrigué à floraison,
un climat moyennement chaud et humide est plus dangereux qu’un climat très chaud mais sec car un fort VPD
favorise la transpiration de la canopée et des panicules. TOA et TD ont ensuite été intégrés au modèle de culture
RIDEV V.2 (qui prédit la stérilité) et les simulations de TD ont été comparées aux résultats d’un autre modèle de Tp
(IM2PACT) développé indépendamment au Japon. Ces deux modèles s’avèrent robustes, et de futures collaborations
mèneront à une validation complète de chaque modèle voire une intégration de ceux-ci à un nouvel outil en vues
d’étudier l’impact des changements climatiques sur les cultures.
Les résultats de cette étude permettront dans un futur proche 1) d’aider les sélectionneurs en apportant de nouveaux
traits d’intérêts, et 2) de définir un zonage des territoires à haut risque de stress thermique pour le riz irrigué, pour
des scénarios climatiques actuels et anticipés. Des études complémentaires seront nécessaires pour permettre
l’application de cette approche aux systèmes non irrigués.
Abstract:
At the reproductive stage, rice spikelets are sensitive to cold and to heat which can lead to spikelet sterility. However,
it is not the air temperature but the temperature of the sensitive organ itself during some specific sensitive stages that
is involved. There are three different strategies to cope with thermal stress: 1) physiological tolerance of a particular
variety; 2) temporal escape of the stress thanks to phenology and time of day of anthesis (TOA) adjustments; 3) stress
avoidance through microclimate generated by crop architecture and transpiration. This PhD aims to characterize the
effect of environment on 2) and 3) and to attain this goal, the same experiment was conducted with four rice varieties
irrigated and grown in four different climatic environments (Philippines, Senegal two seasons, France).
Even though few varietal differences were observed within a site, a great variability of TOA and difference of
temperature (TD) between panicle (Tp) and air (Tair) exists in response to the environment. Anthesis duration is stable
and limited to 2 hours per day, whereas time of onset of anthesis varied between 3.4 to 6.75 hours after sunrise.
During anthesis, observed TD varied between -9.5 and +2.5 °C. TOA and TD are mostly explained with Tair and VPD
(Vapour Pressure Deficit) observed before (TOA) or during (TD) anthesis. A significant correlation between spikelet
sterility (due to cold or heat) and Tp at sensitive stages was established across sites and varieties. Those results
showed that for irrigated rice, humid and moderately hot environments are more subject to heat stress sterility than
very hot but dry environments, because panicle and canopy transpiration are favored by high VPD. Ultimately, RIDEV
V.2 crop model (predicting spikelet sterility) was developed to integrate the previous results and Tp simulations were
compared to another Tp model (IM2PACT) simulations, developed independently with a different approach in Japan.
Those two models are robust and future collaborations will lead to complete model validations and maybe integration
in a new modeling tool to answer the need in evaluating the impact of different climate change scenarios and the
adaptation of crop response to those changes.
In a short term, the results of this study will enable to 1) help breeders providing them new interest traits for thermal
tolerance, and 2) define geographic zoning for high heat stress risk for irrigated rice, for present and future climate
change scenarios. Complementary studies are needed to apply this approach to non irrigated system.


![[MBF2] API Uber par Sylvain Andrieu](https://img.pdfslide.us/doc/110x75/55a64e0d1a28abef028b4865/mbf2-api-uber-par-sylvain-andrieu.jpg)