Embed Size (px)
Citation preview

Advisors:
Simon George-Adré (Roma Tre - Master HDFS)
Jessica Fanzo (Bioversity International)
UNIVERSITÁ DEGLI STUDI ROMA TRE
Facoltà di Economia
Masters in Human Development and Food Security
2010/2011
Thesis:
Agricultural Biodiversity, Dietary diversity, and child
nutritional status: Linkages; social, economic, and cultural
conditioning factors in the Lokossa district of Benin
In collaboration with Bioversity International
Edgar Wabyona
November 2011

2
Acknowledgement
Completion of this work has depended on the advice, support and encouragement of my
advisors George Simon and Jessica Fanzo to whom special thanks are conveyed. I wish to
equally thank the following people for their technical input during the development of this
work; Federico Mattei (Bioversity – Rome), Robert Fungo and Raymond Vodouhe
(Bioversity - Benin) and Dossou Traore (FAO statistics division – Rome).

3
Table of Contents
Acknowledgement .............................................................................................................................................. 2
Table of Contents ............................................................................................................................................... 3
Preface ................................................................................................................................................................ 5
Abstract .......................................................................................................... Erreur ! Signet non défini.
Introduction ........................................................................................................................................... 8
Significance of the study .................................................................................................................................. 10
Conceptual framework ..................................................................................................................................... 10
Overall objective .............................................................................................................................................. 11
Hypotheses ....................................................................................................................................................... 11
Literature review ................................................................................................................................ 13
Agroecology and Agrobiodiversity .................................................................................................................. 13
Trends in agrobiodiversity ............................................................................................................................... 13
Importance of agrobiodiversity ........................................................................................................................ 14
Agrobiodiversity and nutrition ......................................................................................................................... 15
Dietary diversity and nutritional status............................................................................................................. 15
Challenges to dietary diversification ................................................................................................................ 16
Method ................................................................................................................................................. 17
Study area and design ....................................................................................................................................... 17
Data collection and analysis ............................................................................................................................. 17
Results .................................................................................................................................................. 21
Socioeconomic and demographic characteristics of the study population ....................................................... 21
Agrobiodiversity status in the study area ......................................................................................................... 22
Food diversity in markets ................................................................................................................................. 23
Dietary diversity ............................................................................................................................................... 28
Nutrition status of children 6 – 59 months ....................................................................................................... 29
Socioeconomic and demographic influences on agrobiodiversity and dietary diversity .................................. 30
Discussion ............................................................................................................................................ 33
Agrobiodiversity status .................................................................................................................................... 33
Markets ............................................................................................................................................................. 34

4
Dietary diversity ............................................................................................................................................... 36
Nutrition status ................................................................................................................................................. 37
Building linkages among on-farm agrobiodiversity, dietary diversity and nutritional status ........................... 38
Socioeconomic, cultural, and demographic factors influencing agricultural biodiversity and dietary diversity
.......................................................................................................................................................................... 39
Conclusions and recommendations ................................................................................................... 43
Appendix 1: Plant species identified in the study area ..................................................................................... 45
References ............................................................................................................................................ 46

5
Preface
The world still grapples with persistently high levels of food insecurity commonly manifested
as over- and under nutrition in both the rich and poor countries. Efforts to reverse these trends
were revitalized by the Millennium Development Goals in the year 2000 which justified an
array of projects aimed at combating malnutrition. Mixed results have since been registered,
much to the dissatisfaction of the development community. One criticism to current food and
nutrition interventions has been the use of a ‗treatment‘ rather than ‗development‘ approach
to nutrition problems. Amidst concerns about the programmatic incongruence between the
agriculture and health sectors, scholars, researchers, and development practitioners have
advanced the food system approach as the most appropriate for tackling global malnutrition.
This approach is credited with including such aspects as sustainability, innovativeness, and
multidisciplinary integration to confront malnutrition. In developing countries, agriculture is
a source of livelihood for many and its cohesion with nutrition and other sectors offers an
opportunity to achieve and sustain goals related to poverty reduction and nutrition.
This paper is based on a baseline research study conducted by Bioversity International in the
Mono province of Benin prior to an agrobiodiversity and nutrition intervention. The initial
objective of this study was to provide empirical evidence of how agricultural biodiversity can
be translated into more varied diets and improved nutrition in poor rural and urban
communities. This study proposed to investigate how agricultural biodiversity can be
mobilized to improve local diets and potentially, nutritional outcomes in communities within
African local food systems. It also explored how combined agriculture-nutrition interventions
based on local food, ecosystems and human resources can provide sustainable solutions to
malnutrition. The conceptual framework was based on a starting premise that environment,
health, income generation, and socio-cultural factors are all interconnected and as such offer
several entry points for a durable strategy that employs agricultural biodiversity to improve
livelihoods. The research identified the actual and potential contribution of local biodiversity,
and attempted to identify and mobilize biodiversity resources and stakeholders by working
together with local communities (particularly women), drawing on local and outside expertise
in health, agriculture, environment and development.

6
Together with a team of scientists from Bioversity International and through the
organization‘s thesis research mentorship programme, we undertook to further analyse the
data from the baseline research study in order to discern the linkages between agricultural
biodiversity, dietary diversity, and nutrition status of children under five in the study area.
This will complement efforts to gather evidence on how agricultural biodiversity can improve
diets and livelihoods for sub-Saharan Africa. The findings from this study will be
disseminated through various channels and will be used to guide subsequent research and
interventions by Bioversity, other organizations, and the academia. The current paper has
been submitted to Universita‘degli studi Roma Tre in partial fulfillment of the requirements
for the award of the Masters degree in Human Development and Food Security.

7
Abstract
Introduction: Utilisation of agricultural biodiversity is declining, straining the ease of diet
diversification in households, thus leading to persistent hunger, micronutrient deficiencies,
and seemingly to the coexistence of over nutrition in urban areas. In Benin, under nutrition is
un-acceptably high, with a stunting rate of over 30%. Agricultural based solutions have been
proposed to complement the existing health based approaches.
Objective: The study explores the linkages among households’ agrobiodiversity, dietary
diversity, and nutritional status of children 6 – 59 months, and the socioeconomic mediating
factors in Benin.
Methods: Cluster and random sampling led to selection of 4 villages and 374 households in
Lokossa district. Edible plant species were identified at village and household level. Food
prices and diversity in markets were recorded over 12 months. Food-intake recall and
anthropometric indices were used to establish children’s dietary diversity and nutritional
status respectively. Correlation analyses, consumer price index, T-tests, and ANOVA were
used to explore the linkages.
Results: Agrobiodiversity is higher in rural areas (p<0.001). 88% of children had consumed
food from at least 4 food groups 24-hours prior to the assessment. Food diversity is higher in
urban than rural markets, but prices are volatile (CPI up to 4000). Dietary diversity is
significantly higher in agrobiodiversity rich areas (P<0.001). There were differences in
prevalence of low HFA and WFA (P<0.001) but not WFH (P>0.05). Spouse’s involvement
in income activities affects DDS (R=-0.16) yet their education reinforces DDS (R=0.25)
especially if the household head is educated.
Conclusion: Agricultural biodiversity is a prerequisite for diet diversification in rural and
urban areas. Deliberate efforts targeted at smoothing price volatilities are needed. Synergies
between on-farm and market food diversity suggest potential for agrobiodiversity
interventions to simultaneously improve livelihoods. Mechanisms to promote the utilization of
indigenous foods should be instituted for improved nutrition.

8
Introduction
Normal body functioning requires a balanced intake of various macro- and micro- nutrients.
Supplementation and fortification strategies have been successful for common micronutrient
deficiencies in some contexts but these are unlikely to ensure a sustainable improvement of
diets worldwide (Burchi et al., 2011) as they are expensive and accruing benefits have
sometimes succumbed to receding economies (Underwood, 2000). In the times past, most
rural and urban communities in developing countries enjoyed nutritious diets from an
assortment of local foods, cultivated and wild, that were also crucial for their livelihoods.
However this is often no longer the case. Agricultural biodiversity (agrobiodiversity) has
steadily declined with a corresponding increase in dependence on a small number of food
crops (Moore, 2010). According to Frison et al. (2006) and FAO (1999b), only three plant
species (maize, wheat, and rice) currently supply the bulk of protein and energy needs for
both developing and developed country populations.
In the face of the global nutrition transition (Popkin, 2001), easy-to-prepare and refined,
energy dense foods have gained dominance in diets at the expense of traditional and more
nutritious foods. Consequently, urban and rural communities in developing and developed
countries are experiencing the coexistence of hunger, micronutrient deficiencies, and excess
intake of calories leading to overweight and obesity, also known as the ‗triple burden‘ of
malnutrition (Pinstrup-Andersen, 2011). This change in diets has however been catalysed by
a web of other factors associated with globalization of food production and markets. Broadly,
these include the seemingly harmonized emphasis on staple crop production, the rush for high
yield varieties, an increase in the use of petroleum-based inputs, extension of intellectual
property rights to living organisms, replacement of local varieties with exotic types (FAO,
2004) coupled with a change in farmers‘ and consumers‘ perceptions and preferences that
have seen a drift towards more trendy, fast foods.
Declining on-farm agrobiodiversity has been one of the reasons for the increasing attention to
dietary diversity particularly because the latter is often thought to be a logical result of the
former (Binayak et al., 2010; Toledo and Burlingame, 2006). A similar relationship has been
suggested between food diversity in markets and dietary diversity in urban and peri-urban
centres (FAO, 2011). In effect diversification on-farm and in markets has been a core priority

9
for nutrition interventions seeking to improve nutrition outcomes using a development (vs.
traditional therapeutic) approach. Even though the link between agrobiodiversity and diet
diversity is not automatic (Burchi et al., 2011), it is agreeable that the diminution of
agrobiodiversity, to some extent, places considerable strain on the ease with which
households are able to enjoy diversified, balanced diets. Accordingly, a number of initiatives
have come forth in recognition of the importance of diversified diets notably the International
Conference on Nutrition, ICN (1992), the 2003/2004 joint Food and Agriculture
Organization/World Health Organization (FAO/WHO) consultations and the Scaling Up
Nutrition framework (2010), all of which acknowledged, explicitly or implicitly, the
indispensable role of diet diversification for enhanced food security and nutrition outcomes.
Food system interventions that involve carefully formulated multi-sectoral activities along the
food chain - from food production to consumption and utilization (Burchi et al., 2011) have
been advanced as key to sustaining gains being made by short-term micronutrient control
measures because they simultaneously address multiple nutrient and phytochemical needs for
optimal health (Underwood, 2000). Agrobiodiversity presents a practical entry point for these
interventions because of its potential role in improving dietary diversity (and quality),
enhancing farmers‘ livelihoods (Lockie and Carpenter, 2010; Gari, 2004), and improving
nutritional status (Haddad, 2000). Considerable work has been done to characterize the
relationship between dietary diversity and nutritional health and a positive relationship has
been found between them (Arimond and Ruel, 2004; Torheim et al., 2004). What is still not
clear though is how on-farm agrobiodiversity and food diversity in markets are related to
dietary diversity, and the factors that mediate this relationship in rural and urban settings.
This study will attempt to explore the relationship between households‘ on-farm agro
biodiversity, market food diversity, dietary diversity, and nutritional status of children 6 – 59
months alongside the household socio-cultural, economic, and demographic factors affecting
agrobiodiversity and dietary diversity in rural and urban households using data gathered from
an International Development Research Centre (IDRC) agrobiodiversity intervention in the
Lokossa district of Benin.

10
Significance of the study
Under nutrition persists among a significant proportion of children in Benin like many other
countries in sub-Saharan Africa and south Asia (Grebmer et al., 2011). In the wake of the
food prices crisis in the last trimester of 2007, when prices of traditional foods such as
cereals, tubers, legumes, and vegetables rose by up to 55% (rice) and 135% (maize) (De
Schutter, 2009), about 12% of Beninese households were food insecure by the end of 2008.
Over 30% of children 6 to 59 months suffer from chronic malnutrition that is more
widespread among children in rural areas (40.4%) than urban (29.9%) (AGVSAN, 2009).
Despite the plethora of factors known to perpetuate this situation, the solutions are still
widely seen to lie in the agriculture and health sectors. The results of this study will serve to
implore multidisciplinary cohesion in the development of agricultural and nutrition
interventions against child hunger in Benin and other regions affected by hunger.
Conceptual framework
On-farm agrobiodiversity directly increases access to nutritious foods for farm households
and through markets for both rural and urban households. In fact where markets are
functioning, they provide an avenue through which to channel surplus on-farm production
and, in a virtuous circle, transmit signals of demand for a diverse range of foods to the farm
households (Figure 1).
Figure 1: Socioeconomic and cultural factors mediate the translation of on-farm and market food diversity to dietary diversity (Source: Author).

11
The link between on-farm agrobiodiversity and optimal nutrition status is rather complex and
not yet fully understood. It is mediated by numerous factors some of which may (or may not)
have synergistic associations. Nonetheless there is prospect for a two way relationship
between agrobiodiversity and nutrition status arbitrated by dietary diversity. On the one hand,
good utilization of a diverse diet would inevitably contribute to improved human nutrition
and development thus enabling increased production, and participation in agricultural
biodiversity conservation practices. This relationship is mainly governed by factors such as
the individual‘s health and physiological status beyond the scope of this study. On the other
hand agrobiodiversity and market food diversity are a prerequisite for the selection of a
diverse diet. This relationship is influenced by factors in the social, cultural, environmental,
and economic spheres which may also influence on-farm diversification at household level
(Gittelsohn and Vastine, 2003). In this respect, dietary diversity becomes a determining
factor in the relationship between agrobiodiversity and nutrition status.
Overall objective
To explore the relationship between households‘ on-farm agrobiodiversity, market food
diversity, dietary diversity, nutritional status of children, and household socioeconomic
factors affecting agrobiodiversity and dietary diversity in rural and urban households of
Lokossa district in Benin.
Specific objectives
1. To determine the level of on-farm agro-biodiversity, dietary diversity, and child
nutritional status in urban and rural areas.
2. To establish the relationship between on-farm agrobiodiversity and dietary diversity
3. To determine the socio-economic factors affecting the translation of on-farm and
market food diversity into dietary diversity
Hypotheses
1. Household on-farm agrobiodiversity, market food diversity, dietary diversity, and child
nutrition status vary significantly in rural and urban areas.
Research questions
a. What is the on farm agrobiodiversity level in the study area?
b. What is the variation of market food diversity over a period of one year?

12
c. What is the proportion of malnourished children in the study area?
d. What is the dietary diversity of children 6 – 59 months in the study area?
e. What are the social-economic characteristics of the households in the study area?
2. Households located in areas that are rich in agrobiodiversity are more likely to have
diverse diets than their counterparts in low agrobiodiversity regions
Research questions
a. What is the relationship between on-farm agrobiodiversity and dietary diversity?
b. What are the most important socioeconomic factors influencing the selection and
consumption of a diverse diet from existing on-farm agrobiodiversity?
3. Socioeconomic and cultural factors affect the level of agrobiodiversity and dietary
diversity in the rural and urban contexts
Research questions
a. How is on-farm agrobiodiversity compared to food variety in markets?
b. What is the difference between dietary diversity in rural and urban households?
c. What socioeconomic factors are affecting agrobiodiversity and dietary diversity in
rural and urban areas?

13
Literature review
Agroecology and Agrobiodiversity
Calls for environmentally sustainable and socially just modes of agricultural production have
popularized agroecology - the application of ecological science to the study, design and
management of sustainable agroecosystems. Agroecology includes the set of agricultural
practices that seek to enhance agricultural systems by mimicking natural processes, thereby
creating beneficial biological interactions and synergies among the components of the
agroecosystem (De Schutter, 2010). Thus agrobiodiversity is a technique based on the
agroecological perspective. Specifically, agrobiodiversity refers to the variety and variability
of animals, plants and micro-organisms used directly or indirectly for food and agriculture
(FAO, 1999a). Measures of biodiversity, commonly at genus, species, or ecosystem levels,
may represent variety, quantity and quality, and/or distribution (Millennium Ecosystem
Assessment, MEA, 2005).
Trends in agrobiodiversity
Modern agricultural and development processes have impaired the recognition, conservation,
use, and improvement of agrobiodiversity (Gari, 2004) threatening locally varied food
production systems, including local knowledge, culture, and skills of farmers (FAO, 2011).
Agrobiodiversity continues to be depleted through rapid land use change as biodiverse
farming practices are continually replaced (Lockie and Carpenter, 2010). Local varieties
usually grown in traditional mixed farming systems are being substituted with improved,
genetically uniform, high-yielding, and commercialized varieties and species in monoculture
systems hence accelerating the genetic erosion of crops (FAO, 2011; FAO, 1999b). In effect,
ecosystems have changed more rapidly and extensively over the past 50 years than in any
comparable period of time in history (MEA, 2005). Of the more than 80,000 plant species
available to humans, only three (maize, wheat, and rice) supply the bulk of protein and
energy needs (Frison et al., 2006). With the disappearance of harvested species, varieties, and
breeds, a wide range of un-harvested species also disappear (FAO, 2011). Consequently, the
world is increasingly dependent on a relatively small number of commercially grown crops
for its food security (Moore, 2010).
These changes are in part due to a lack of market acknowledgement of traditional farming
practices. Gari (2004) attributes this to the narrow focus of development policies and projects

14
which promote commercial agriculture, characterized by the extensive use of material inputs,
aimed at increasing the yields of staple crops. Very often macroeconomic policies provide
incentives such as tax concessions, subsidies, and price controls for specific crops (Lockie
and Carpenter, 2010; MEA, 2005) effectively discouraging diversification. The extension of
industrial patenting and other intellectual property systems to living organisms has
aggravated the trend and led to the widespread cultivation and rearing of fewer varieties and
breeds, also contributing to a more uniform, yet more competitive global market.
Consequently there have been changes in farmers‘ and consumers‘ perceptions, preferences
and living conditions; marginalization of small-scale, diverse food production systems;
reduced integration of livestock in arable production, etc. (FAO, 2011). In sum, Lockie and
Carpenter (2010) and other authors seem to agree that the greatest threat to agrobiodiversity
comes not from its exploitation or explicit destruction but from its non-use as farming
systems become more homogenized and specialized. Altieri et al. (2000) trace
homogenization back to the post world war II period when research in response to the scare
of dwindling food resources and a fast growing population brought forth high yielding
varieties, and with them, the green revolution. The new varieties tended to displace
traditional farmers‘ varieties and hence result in erosion of the very genetic resources on
which the green revolution was based (Moore, 2010).
Importance of agrobiodiversity
Farmers in environments where high-yield crop and livestock varieties do not prosper rely on
a wide range of indigenous types to maintain their livelihoods amidst uncertainties such as
pathogen infestation, rainfall and price fluctuations, and socio-political disruption (FAO,
2011). Agrobiodiversity thus plays a pivotal role in the livelihood and wellbeing of
agricultural communities regardless of resource endowment or geographical location. It
provides the basic resources farmers need to adapt to varying conditions in marginal
environments, and to increase productivity in favourable areas (Lockie and Carpenter, 2010).
Even minor or underutilized crops are frequently grown alongside the main food staple or
cash crops and play an important role in local food production and trade systems (FAO,
2011). Agrobiodiversity makes farming systems more stable, robust, and sustainable, and
diversifies products and income opportunities in addition to nutrition and medicinal functions
(FAO, 2011; Kruijssen and Mysore, 2010). Mobilization and improvement of these
agrobiodiversity resources is thus instrumental in expanding the options and means of small

15
farmers to enhance their agricultural and livelihood systems. The advantage is that plant
resources are locally available, affordable, easy to deploy, versatile and remarkably
connected to the ecological and cultural realities of small farmers. They are essential to
devise agroecological practices that can improve natural resource management, household
nutrition and the engagement of farmers in agricultural innovation (Gari, 2004).
Agrobiodiversity and nutrition
A human diet requires at least 51 nutrients in adequate amounts consistently. It has been
argued that changes in agricultural systems from diversified to simple, cereal based cropping
systems have contributed to poor diet diversity, micronutrient deficiencies, and resulting
malnutrition (Burchi et al., 2011). Frison et al. (2006) examined homestead gardening
programs (sometimes combined with nutrition education) that promoted increased production
and consumption of β-carotene–rich fruits and vegetables in Bangladesh, India and Tanzania.
They found corresponding increases in daily consumption of these fruits and vegetables by
the children in the intervention households, occasioned by sale of excess produce. This
seemingly straightforward relationship between diversity in agricultural production and
nutrition outcomes is perhaps responsible for the reluctance to test any related hypotheses. It
is however understood that a complex relationship exists between production, income, and
nutrition. The growing consensus is that the union between agriculture and nutrition requires
cultural-economic and social conditioning factors (Berti et al., 2003). Building on the
premise that some potentially influential factors can be positively altered through nutrition
education, Berti et al. (2003) follow an investigation that assessed differences between
agriculture only and agriculture plus nutrition education and find no basis to substantiate the
widely held assumption that agriculture interventions result in sustainable nutrition benefits,
especially if they strengthen financial capital, but do find that agriculture gives a dietary
benefit when nutrition education is included. Given the enormous diversity within the human
community and that individual food requirements are not homogenous, this calls for the need
to adapt nutrition and health interventions to the diversity of need of individuals and
communities (Toledo and Burlingame, 2006).
Dietary diversity and nutritional status
The role of micronutrients in health and well-being, and the synergies in their physiological
functions have been increasingly recognized, supporting the notion that micronutrient

16
deficiencies rarely occur in isolation (Frison et al., 2006). The World Declaration and Plan of
Action for Nutrition adopted at the ICN (1992) recommended the promotion of dietary
diversity and the use of locally available nutrient-rich indigenous and traditional foods as a
vital strategy against food insecurity, malnutrition, and disease. Empirical evidence suggests
positive links between overall dietary quality and nutritional status, and between dietary
diversity and anthropometric indices (Frison et al., 2006). This is in agreement with Arimond
and Ruel (2004) who found a similar relationship between child dietary diversity and
nutritional status that is independent of socioeconomic factors and concluded that individuals
consuming more diverse diets were more likely to meet their nutrient needs. This
demonstrates the utility of dietary diversity indicators to predict adequate intake of
micronutrients in the diets of young non-breast-feeding children (Moursi et al., 2008; Gina et
al., 2007). Arimond and Ruel (2004) and Berti et al. (2003) however warn that depending on
local diet patterns, high diversity scores may be more or less nutritionally meaningful with
the reason that if many food groups are given but in extremely small quantities, diversity
scores are less nutritionally meaningful.
Challenges to dietary diversification
Most challenges cited lean towards the socio-cultural and economic spheres. According to
Arimond and Ruel (2004), low diet diversity is particularly a problem among poor
populations in the developing world, where diets are based predominantly on starchy staples
and often include few or no animal products and only seasonal fruits and vegetables. This is
ironic given that these areas also double as the hubs of agricultural production. Urbanization
and changing lifestyles have equally been implicated in changing dietary patterns. With
urbanization come changes in employment patterns, particularly for women, which increases
the opportunity cost of women‘s time due to involvement in hired labour or self-employment
away from home. This leads to replacement of traditional foods by ―convenience‖ foods.
Similarly locally available indigenous and traditional foods that require some form of
processing, usually tedious and time consuming, before their final use in food preparation are
replaced in the diet by crops such as maize, wheat, rice, and potatoes that are easier to prepare
(Frison et al., 2006).

17
Method
Study area and design
The study was conducted in the rural and urban areas of Benin‘s Lokossa district in the Mono
province. A combination of cluster sampling in which the population was grouped into
villages (Benin‘s smallest administrative units in the districts) and random sampling led to
selection of 4 study villages in Lokossa district. Two of these (Tozounmè and Agnito) were
rural and another two (Glo-guinkomey and Agnïvèdji) were urban environments. A random
sample of 374 households was involved in the study which used a cross-sectional research
design.
Data collection and analysis
Quantitative methodology involving questionnaire-based surveys were used in the study. The
parameters measured included on-farm and market food diversity, dietary diversity, and
nutrition status of children under five, and household socioeconomic and demographic
characteristics.
Socioeconomic and demographic characteristics
Data on socioeconomic and demographic characteristics (Table 1) was collected as an
integral component to the agrobiodiversity and nutrition components of the study. A focus
group approach was used to identify criteria for household wealth measurement in the rural
and urban areas. Wealth status variables identified were land, transportation vehicle
(motorcycle or car), oil palm plantation ownership, and involvement in income generation
activities such as trade and oil palm extraction in urban areas. In rural areas, involvement in
trade of foodstuffs including oil palm and traditional leafy vegetables, house ownership, and
the capacity to hire labour for farming activities were identified as wealth status indicators.
Based on these criteria, three wealth groups (poor, moderately rich, and rich) were defined.
On-farm agro biodiversity
An inventory of edible plant species, cultivated and wild, was carried out in 2008-2009 to
assess their diversity and availability at village level. Circular plots of 18m radius were
established in the village lands in both cultivated and uncultivated areas for the inventory of
trees with diameter greater than 10 cm. Four squared sub-plots of 2x2m and one circular
subplot of 4m radius were established within each plot respectively for the inventory of herbs

18
and shrubs. In the plot, both local and scientific plant names of every tree, shrub and herb
species present were noted. At household level, edible plant species available on-farm were
identified and recorded during the study. Focus groups were organized with local populations
to investigate the uses of every species and probe for useful species which were not recorded
during the field inventory in the plots. A count of the number of genera and species found
was obtained and these were grouped, by area, according to whether they were cereals, grain
legumes, roots & tubers, traditional leafy vegetables (TLV), other traditional vegetables,
exotic vegetables, local cultivated fruit, wild fruits or exotic fruits.
Food diversity in markets
Two markets were selected, one in an urban area (Lokossa market) and the other in a rural
area (Tozoumè market). Twelve food categories were defined prior to the survey and these
were cereals, grain legumes, roots & tubers, traditional leafy vegetables (TLV), other
traditional vegetables, exotic vegetables, local cultivated fruit, wild fruits, exotic fruits, meat-
fish-poultry and derivatives, fats and oils, and spices and condiments. Trained extension
workers collected information on the species diversity (and when possible the varietal
diversity) in each food category along with their unit prices. Scales were used to weigh the
food in order to have standardized units or give an estimation of the local measurement units.
Prices from many vendors in different stalls of the markets were recorded and average prices
reported for each food product. The data was collected from these markets on a bi-weekly
basis (during the market days) for a period of 12 months (September 2009 to August 2010) to
observe price variations.
Pearson‘s correlation analysis was used to postulate price substitutability among different
species in the same food group. The consumer price index (CPI) was used to depict the
monthly movements in food prices, alongside a food availability calendar showing periods
when certain foods were in short supply during the study period. Monthly average prices
were computed for each commodity except when the commodity was completely out of
supply for the month in question. The CPI was computed using September 2009 average
prices as the base prices. All food items were taken to be equally important thus an un-
weighted index was calculated. The index excludes processed/transformed food items
because they were supposed to have different demand and supply patterns compared to

19
locally grown foods. Single item CPI was calculated as CPIitem = 100*o
t
PP
and the food
group CPI as CPIgroup = n
PoPt
ni
i
100*1
where Pt is the prevailing average price of the item
during the month and Po the base price.
Dietary diversity
A food frequency questionnaire was administered at the household level in all four study
areas. Foods consumed in the 24 hour, 7 day, and 30 day periods preceding the survey were
recorded and subsequently categorized according to the food groups previously defined.
Dietary diversity scores (DDS) obtained as a count of the number of food groups were re-
classified into Low DDS (≤ 3), Medium low DDS (4 – 5), Medium high DDS (6 - 7) and high
DDS (≥ 8) for analysis purposes.
Nutritional status
Age, Weight and height measurements of children 6 – 59 months in the four study areas were
recorded. The data was analysed by the calculation of the weight-for-age (WFA), height-for-
age (HFA), and weight-for-height (WFH) indices that were expressed as Z-scores (WHZ,
HAZ and WAZ respectively). Descriptive statistics for Z-scores and their cut-offs as defined
by WHO (2006) standards were used to describe the nutritional status per village and to
compute the prevalence of severe and moderate under nutrition. Spearman‘s correlation was
used to describe the relationships among agrobiodiversity (at species level), dietary diversity,
and select socioeconomic variables such as ethnicity, education level, wealth status and
cultivated land size. The t-test (independent samples) was used to test for the difference in
dietary diversity between rural and urban households while the one-way ANOVA was used
to determine differences in dietary diversity among the four study villages.
Descriptive statistics were used recurrently to describe the distributions of the variables
measured. Analyses were conducted at village and household levels, as well as rural and
urban areas using a combination of ENA (version 2010), MINITAB (version 15), and SPSS
(version 18) software.

20
Ethical considerations
Each component included an informed consent protocol that was reviewed by an independent
ethical review committee to ensure that privacy, dignity, and integrity of human subjects are
protected.

21
Results
Socioeconomic and demographic characteristics of the study population
Table 1: Some socioeconomic and demographic characteristics of the study population
Rural (%) Urban (%)
Gender Male 55.7 54.2
Female 44.3 45.8
Ethnicity Adja 0.0 19.2
Aizo 1.1 0.0
Bariba 0.0 0.6
Cotafon 73.9 48.8
Dendi 1.1 0.6
Fon 4.5 7.0
Goun 0.0 0.6
Mina 1.1 1.7
Sahoue 18.2 19.8
Wachi 0.0 1.7
Education
level
no education 73.9 47.6
primary 21.6 27.1
secondary 4.5 22.9
tertiary 0.0 2.4
Marital Status married 97.7 95.8
single 0.0 3.0
separated/divorced 2.3 1.2
Main source of
income
farming 40.9 4.8
casual labour 18.2 7.2
business 11.4 9.0
employed 14.8 35.9
students 0.0 2.4
Taxi driver 10.2 14.4
Crafts men 4.5 23.4
Unemployed 0.0 3.0
Water source piped 96.6 98.2
well 3.4 0.0
rain water 0.0 1.8
Roofing
material of HH
straw 67.0 2.4
Metal sheet 33.0 96.4
tile 0.0 0.6
Concrete/slab 0.0 0.6
Type of floor cemented 18.2 95.2
earth floor 81.8 0.0
Type of walls Earth/clay 95.5 29.5
Timber 1.1 69.3
Brinks 3.4 1.2
Access to services1 100.0 100.0
1Services considered were public transport, primary market, supply shop, and health centre
There were differences in the distribution of socioeconomic and demographic characteristics
between rural and peri-urban areas (Table 1). Cotafon, Adja, Sahoue, and Fon were the
largest ethnic groupings. While the latter two groups were fairly distributed between rural and
urban areas, disparities were pronounced among the Cotafon and Adja. Except among the

22
Cotafon, there were always higher proportions of these ethnic groups in the urban areas.
Rural areas had the highest number of uneducated people whose proportions decreased with
increasing levels of education. The reverse was observed in the urban areas where the
proportion of educated persons was always higher than in the rural areas. While not shown, it
was observed that the education level of the household head was almost always higher than
that of the spouse. There were consistently lower proportions of people engaged in skilled
labour in the rural areas vis-à-vis urban areas; farming was the most frequently mentioned
activity in rural areas (40.9%) versus formal employment in urban areas (35.9%). All
respondents had access to services such as public transport and health care, and a remarkably
high percentage (>96%) in both rural and urban areas reported use of piped water with only a
few having used rain water (only urban areas) and the well (only rural areas). There were
however marked differences in asset holdings (type of roof, floor, and wall) between rural
and urban households suggesting income differences.
Agrobiodiversity status in the study area
81 edible plant species belonging to 66 genera were identified in the four study areas. About
73% of these crops were cultivated at household level while the rest were wild or semi-wild.
Although these food plants were also used for medicinal purposes, an extra 59 species were
found to be exclusively used as medicines.
Table 2: Summary of identified species by food category
Rural Urban
Agnito Touzoume Agnivedji Glo - guinkomey
Grain legumes 1 3 2 2
Cereals 1 1 1 1
Roots & tubers 4 5 2 5
Fruits 20 11 12 16
Vegetables 38 27 19 16
Medicinal 57*
46*
25*
34*
Others 3 2 2 2
Total 67 49 38 42
*Figures excluded from calculation of the total because of their overlapping nature with the other groups
These results compare with Dansi et al. (2009) findings in all Benin where 187 plant species
belonging to 141 genera were found of which 25.13% were cultivated. The level of
diversification was higher in some villages such as Agnito and lower in others such as

23
Agnivedji. In general, villages located in urban environments had considerably lower levels
of agrobiodiversity compared to their rural counterparts (Table 2). Species diversity was
lowest in the cereals group where just one species, Zea mays (Maize), was identified in all
four study areas. A similar trend was observed for grain legumes and roots and tubers. There
was however a high level of diversification observed among fruits and vegetables where all
four areas had at least 11 species of fruit and 16 species of vegetables (Appendix 1). The
species were mostly used as food in different ways (staple dishes, sauces, snacks etc.) and as
medicines.
Differences in agrobiodiversity at village level trickled down to the household level. Rural
households were found to have higher levels of on-farm agrobiodiversity compared to urban
households. A t-test (independent samples) was conducted to compare on-farm
agrobiodiversity in rural and urban households. Analysis showed a significant difference in
the number of species available per household between rural areas and urban areas (t = 4.53,
d.f = 46, p<0.001). This suggests that rural households are more likely to grow a wider range
of species compared to urban households.
Food diversity in markets
Level of diversification in markets
CerealsGrain
legumesRoots & Tubers
Vegetables (Total)
TLVOther
vegetablesExotic
vegetablesSpices
Fruits (Total)
Cultivated fruits
Wild fruitsExotic fruits
Lokossa market (Urban) 4 4 7 20 7 3 7 3 9 6 2 1
Touzoume market (Rural) 5 3 1 13 5 3 2 3 5 4 1 0
0
5
10
15
20
25
Nu
mb
er o
f sp
ecie
s
Figure 2: Food diversity in Lokossa and Touzoume markets

24
There were generally low levels of diversity in cereals, grain legumes, and roots and tubers in
both markets but with higher diversity in the urban Lokossa market. Considering that low on-
farm agrobiodiversity was observed for these species at village and household level in rural
and urban areas, findings suggest that low on-farm agro-biodiversity leads to lower levels of
market food diversity. In fact vegetable species, the most abundant in markets for both rural
and urban areas, were consistently more diverse on-farm in all four areas. It was curious to
note that some varieties of Maize (yellow) and Rice (local and improved) were only available
in rural Touzoume market. Whereas the rural market had Traditional Leafy Vegetable (TLV)
species as the most common, the urban market equally showcased exotic vegetable species,
all of which were higher than those in rural markets as shown in Figure 2. Similar
observations were made for fruits in which urban markets were found to have generally more
species of fruits compared to rural areas. In both cases however, cultivated fruits were the
most abundant followed by wild fruits. Only one exotic fruit species (Apple) was found in
urban markets, while none was available in the rural market during the study period.
Species supply in the markets
Food supply in the urban Lokossa market was found to be generally stable with only seven
food crop species of all those traded having registered inconsistent supply during the study
period (Figure 3a). Among these, Taro (Colocasia esculenta), Pasteque (Citrullus lanatus)
and velvet tamarind (Dalium guineense) were the least available during the year. In contrast,
supply of most food items in rural Touzoume market was highly unstable except for some
exotic vegetable species such as tomatoes (Figure 3b). Interestingly, most of the
commodities found to have erratic supply in Touzoume had all year round availability in
Lokossa market. Yet all the food commodities that had inconsistent supply in Lokossa
market were virtually absent from Touzoume market in the study period.
Unit price levels of observed foods
Price statistics for some food commodities are presented in Table 3. Prices were higher for
the majority of foods in urban Lokossa market than in rural Touzoume market. However
Vernonia spp and Corchorus spp were uniquely more expensive in rural areas with a price
difference of about 14 and 11 CFA respectively. Interestingly, the former had constant prices
in Touzoume with CV of zero compared to 36.8% in Lokossa, while the latter had constant
prices in Lokossa but high variation (CV 53.9%) in Touzoume.

25
Figure 3a: Food commodities supply1 in Lokossa market: 1. Sorghum, 2. Cassava, 3. Sweet potato, 4. Taro, 5. Mango, 6.
Pasteque (water melon) and 7. Dalium guineense (Velvet tamarind).
Table 3: A summary of unit prices2 of common food items in Lokossa and Touzoume
markets
Lokossa market (Urban) Touzoume market (Rural)
Mean ± SD CV (%) Mean ± SD CV (%)
Maize-white (F/bowl of 2.5kg) 421.2 ± 40.68 9.66 276.45 ± 26.94 9.75
Cowpea-white (F/bowl of 1.5kg) 530.5 ± 43.28 8.16 478.77 ± 50.57 10.56
Cowpea-dark (F/bowl of 1.5kg) 438.1 ± 40.35 9.21 418.9 ± 65.75 15.7
Soybean (F/bowl of 1.5 kg) 320.4 ± 78.08 24.37 266.7 ± 50 18.75
Sweet potato (F/bowl of 80L) 2420.0 ± 264.1 10.91 1773 ± 428 24.14
Solanum spp. (F/lot of 5) 50.0 ± 0 0 32.84 ± 11.68 35.59
Corchorus o. (F/lot) 10.0 ± 0 0 20.76 ± 11.18 53.87
Vernonia spp. (F/lot) 11.2 ± 4.126 36.77 25 ± 0 0
Okra (×10F/bowl of 1 L) 268.0 ± 128.8 48.05 19.302 ± 5.323 27.58
Onion (×10 F/lot of 40) 1724.0 ± 2086 120.99 70 ± 35.57 50.82
Tomato (×100F/bowl of 80L) 2808.0 ± 5093 181.35 41.44 ± 18.75 45.24
Hot pepper (F/bowl of 1L) 598.3 ± 140.6 23.5 577.3 ± 386.4 66.94
Garlic (F/lot of 0.10-0.15kg) 500.0 ± 0 0 328.8 ± 229.4 69.77
Pepper (F/bowl of 1kg) 5616.3 ± 587.5 10.46 3846 ± 2886 75.03
Oranges (× 10 F/lot of 40) 313.8 ± 389.6 124.18 32.26 ± 18.39 56.99
Banana (× 10 F/bunch) 398.0 ± 433.4 108.9 365.4 ± 234.4 64.16
Palm oil (F/L) 532.8 ± 93.2 17.48 387.03 ± 79.45 20.53
For comparison purposes, only food items common to both markets have been selected for inclusion
1 Only food commodities with differences in supply have been shown. There were less food commodities with
irregular supply in Lokossa market.
2 Prices indicated in West African Franc CFA (XOF). 1US$ = 489 CFA

26
Figure 3b: Food commodities supply in Touzoume market: 1. Maize (yellow); 1.1 Rice (local); 1.2 Rice (improved); 1.3 Rice
(imported); 1.4 Cowpea var. 1 (white); 1.6 Soybean; 1.7 Sweet potato; 1.8 Solanum spp 1.9 Vernonia spp (Bitter leaf); 2.
Moringa oleifera 2.1 Cowpea var. 2 (dark) 2.2 Cowpea var.3 2.3 Egusi; 2.4 Onion; 2.5 Sweet pepper; 2.6 Tomato; 2.7
Oranges; 2.8 Banana; 2.9 Plantain; and 3.1 Vitex doniana
Price variation was high for most commodities in both markets during the study period led by
tomatoes in Lokossa (CV 181%) and pepper in Touzoume (CV 75%). The pattern of
variation was however less consistent between rural and urban areas and within food groups.
Variation was more prominent for some commodities such as tomatoes and plantain than for
others e.g. garlic (urban) and Vernonia spp (rural) which had constant prices throughout the
year.
In Lokossa, most foods had a roughly similar tendency in the single item food price index, as
they all showed fairly stable price changes with exception of plantain and tomatoes whose
indices spiked to over 1000 and 4000 respectively between April and July 2010 (Figure 4a).
This was different in Touzoume market where virtually all food commodities were found to
have erratic price fluctuations throughout the study period (Figure 4b). The consumer price
index (CPI) for food groups showed similar tendencies with the single item food index. In
both Lokossa and Touzoume markets the CPI exotic vegetables, other vegetables, and
cultivated fruits was the most varied clearly influenced by tomatoes, okra, and plantain

27
respectively (Figures 4c and 4d). Correlation analyses on the prices of different food
commodities showed that in Lokossa market, the prices of maize and rice were negatively
correlated with millet (r = -0.42 and -0.5 respectively). Prices of the two varieties of cowpeas
rise simultaneously (r = 0.78) but are negatively correlated with soybean (r = -0.53).
AugJulJunMayAprMarFebJanDecNovOctSep
1400
1200
1000
800
600
400
200
0
50000
40000
30000
20000
10000
0
CP
I
CP
I To
ma
to
(L)
CPI White maize
CPI Cassava
CPI Cowpea-dark
CPI Solanum
CPI Okra
CPI Tomato
CPI Hot pepper
CPI Plantain
CPI Palm oil
Variable
Figure 4a: Single item consumer price index (unweighted) in Lokossa
Market, Benin
AugJulJunMayAprMarFebJanDecNovOctSep
300
250
200
150
100
50
0
Pric
e I
ndex
CPI White maize
CPI Cowpea-dark
CPI Solanum
CPI Okra
CPI Tomato
CPI Hotpepper
Variable
Figure 4c: Single item price index for some foods in Touzoume
market, Benin
AugJulJunMayAprMarFebJanDecNovOctSep
1600
1400
1200
1000
800
600
400
200
0
8000
7000
6000
5000
4000
3000
2000
1000
0
Pric
e i
ndex
CP
I E
xoti
c v
eg
eta
ble
s
CPI cereals
CPI Roots & Tubers
CPI Grain legumes
CPI TLV
CPI Other veges
CPI Exotic vegetables
CPI spices
CPI cultivated fruits
Variable
Figure 4b: Consumer price index for food categories in Lokossa
market Benin
AugJulJunMayAprMarFebJanDecNovOctSep
400
300
200
100
0
Pric
e i
ndex
CPI cereals
CPI grain legumes
CPI TLV
CPI Other veges
CPI Exotic veges
CPI Spices
Variable
Figure 4d: Consumer price index for food categories in Touzoume
market Benin
Among roots and tubers, all three different varieties of yams available and sweet potatoes
were found to be positively correlated (r ≥ 0.8). Majority of vegetables prices were negatively
correlated e.g. carrot vs. okra (r = -0.5). This category was unique because most prices were
fairly constant, rendering correlation analysis unnecessary. In Touzoume, negative
correlations were obtained for yellow and white maize varieties (r = -0.29) and between white
28
maize and improved rice (r = -0.26) but not between yellow maize and improved rice (r =
0.354). Like Lokossa, a similar though weaker relationship was observed between the two
cowpea varieties (r = 0.29) and between the cowpea varieties and soybean (r = -0.33 and –
0.38 respectively).
Dietary diversity
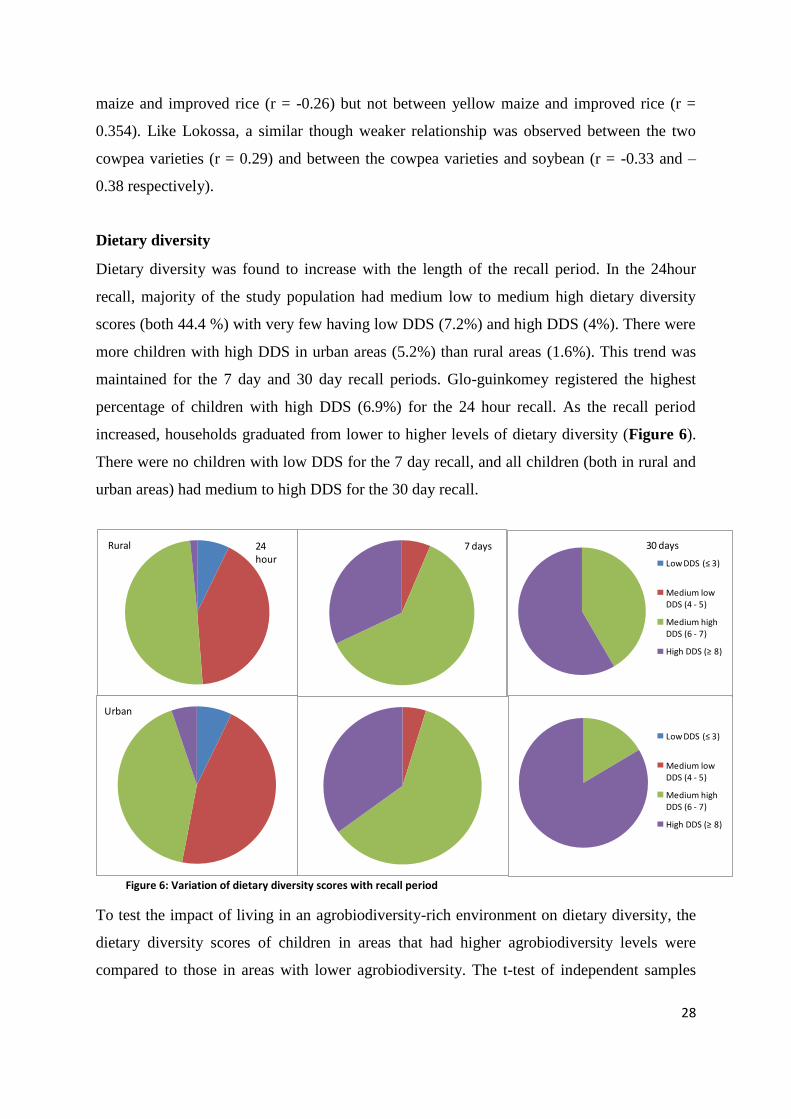
Dietary diversity was found to increase with the length of the recall period. In the 24hour
recall, majority of the study population had medium low to medium high dietary diversity
scores (both 44.4 %) with very few having low DDS (7.2%) and high DDS (4%). There were
more children with high DDS in urban areas (5.2%) than rural areas (1.6%). This trend was
maintained for the 7 day and 30 day recall periods. Glo-guinkomey registered the highest
percentage of children with high DDS (6.9%) for the 24 hour recall. As the recall period
increased, households graduated from lower to higher levels of dietary diversity (Figure 6).
There were no children with low DDS for the 7 day recall, and all children (both in rural and
urban areas) had medium to high DDS for the 30 day recall.
Rural 24 hour
7 days
Low DDS (≤ 3)
Medium low DDS (4 - 5)
Medium high DDS (6 - 7)
High DDS (≥ 8)
30 days
Urban
Low DDS (≤ 3)
Medium low DDS (4 - 5)
Medium high DDS (6 - 7)
High DDS (≥ 8)
Figure 6: Variation of dietary diversity scores with recall period
To test the impact of living in an agrobiodiversity-rich environment on dietary diversity, the
dietary diversity scores of children in areas that had higher agrobiodiversity levels were
compared to those in areas with lower agrobiodiversity. The t-test of independent samples
29
between Agnivedji (urban) and Touzoume (rural), two villages which had smaller absolute
differences in levels of on-farm agrobiodiversity (38 and 49 species respectively) showed no
significant difference in DDS among households for the 24 hour and 7 day recall (p>0.05)
but returned a significant difference (t = 2.01, d.f. = 160, p<0.05) among households when
compared against the 30 day recall. Further comparison of all rural versus all urban
households returned similar results (t = 5.58, d.f = 372 p<0.001). This attaches importance to
apparently small differences in species diversity to child nutrition. Using a one-way ANOVA,
the four areas were also compared against the 30 day dietary diversity scores and results
maintained a significant difference (F3, 370 = 21.38, p < 0.001). Children in Glo-guinkomey
had higher 30 day dietary diversity scores than the other 3 villages. Post hoc comparisons
using Tukey‘s test showed that Glo guinkomey was statistically different from Agnivedji,
Agnito, and Touzoume but the latter were not different with regard to 30 day DDS.
Tentatively, it can be argued that although Glo-guinkomey had relatively lower on-farm
agrobiodiversity, it is located in an urban setting and thus complements on-farm
agrobiodiversity with food diversity in markets.
Nutrition status of children 6 – 59 months
The severity of under nutrition in the study area could be classified as medium (WFH, WFA)
and high (HFA) (WHO, 1997). The proportion of children affected was higher for
underweight and stunting than for the wasting measure (Table 4). Prevalence of stunting was
highest among children 30-41months (47.7%) and so was underweight (26.1%), both
different from wasting which was highest among children 6 – 17 months of age (9.5%).
Prevalence obtained were comparable to those reported by EDSB (2006) which put stunting
at 43% of children under five (22% severely), wasting at 8% (3% severe), and moderate and
severe underweight at 14% and 5% respectively at national level. Mean Z-scores of all the
three indices, especially HFA and WFA, were well below zero, the expected value,
suggesting a generalized condition of poor nutrition. These were especially pronounced for
Agnivedji WFA (-1.44) and HFA (-2.02) but not for WFH (-0.42).

30
Table 4: Under nutrition among children 6 – 59 months in the study area
Area Mean Z-score ± SD
HFA WFA WFH
Agnito -1.18 ± 1.507 -0.66 ± 1.107 -0.05 ± 0.947
Tozoume -1.68 ± 1.146 -1.13 ± 1.1 -0.33 ± 1.014
Agnivedji -2.02 ± 1.188 -1.44 ± 1.176 -0.42 ± 1.282
Glo-guinkomey -0.88 ± 1.667 -0.57 ± 1.1303 -0.13 ± 1.097
Rural -1.47 ± 1.33 -0.93 ± 1.124 -0.21 ± 0.992
Urban -1.29 ± 1.606 -0.88 ± 1.219 -0.24 ± 1.174
Prevalence (%)
-3 ≥ Z < -2 19.0 14.1 5.2
Z ≤ -3 14.7 4.1 1.6
Total 33.7 18.2 6.8
There were marked differences in the prevalence of under nutrition in the four study areas.
Agnivedji and Touzoume showed the highest level of under nutrition in all 3 anthropometric
indices while Glo-guinkomey had the lowest prevalences for the underweight and stunting
indicators. There was no significant difference between rural and urban areas in the HFA,
WFH, and WFA measures (P > 0.05). However one way ANOVA among villages returned
significant differences for the HFA (F3, 367 = 12.52, P < 0.001) and WFA (F3, 369 = 13.01, P <
0.001) but not for WFH (P > 0.05). Tukey‘s post hoc analyses confirmed that Agnivedji had
significantly higher prevalence of low HFA and low WFA while Glo-guinkomey had a
significantly lower prevalence of these measures. While differences were pronounced
between these two urban villages, there were no differences between the two rural villages of
Agnito and Tozoume.
Socioeconomic and demographic influences on agrobiodiversity and dietary diversity
Initial correlation analyses to examine the association between socioeconomic variables and
agrobiodiversity found that the number of species (species) at household was only
significantly related to the ethnicities of the head of household (r = -0.44) and of the wives (r
= -0.46) (Table 5a). However, on controlling for wealth status, results showed stronger
negative relationship between the species and ethnicities of the head of household (r = -0.52)
and spouse (r = -0.49) that increased with the level of wealth. In addition, negative
relationships were obtained with the number of wives (r = - 0.61) and land cultivated by
household head (r = -0.73).

31
Table 5a: Socio-cultural and economic factors influencing agricultural biodiversity
Number of species
All Rural Urban
Number of wives -0.611* (w3) 0.853
* (e0) 0.644
* (w2)
Ethnicity of HOH -0.444**
-0.518* (w2)
Ethnicity of wives -0.456**
-0.493* (w2)
-0.627* (w3)
Household size -0.646* (e2)
Land cultivated by HOH -0.734* (w3) 0.558
* (w2)
*. Correlation is significant at level 0,05 (2-tail). **. Correlation is significant at level 0,01 (2-tail). (N = 330). (e0) Illiterate head of household; (e2) Head of household with at least secondary education; (w2) moderately rich households; (w3) Rich households. Only significant correlation values shown
Table 5b: Socioeconomic and cultural factors influencing dietary diversity
24hr DDS 7day DDS 30day DDS
All Rural All Rural Urban All Rural Urban
HH size 0.289**
(e0)
Age of HOH -0.253*
-0.402**
(e0)
Age of Spouse -0.118* -0.241*
-0.396**
(e0)
Ethnicity of HOH 0.287**
0.393**
0.292**
0.268* (e0) 0.341
** (e0) 0.247
** (e0)
Education HOH 0.13*
0.119*
Education wives 0.16**
0.127*
0.251* (e2)
HOH main
income source 0.229** 0.164*
0.309**
(e0) 0.265* (e1)
0.227**
(e0)
0.238*
(e1)
HOH secondary
income source 0.128** 0.11*
0.196**
(e0) 0.161
**
(e0)
0.247*
(e1)
Spouse income
source -0.161** -0.156**
Land cultivated
by HOH -0.2
** (e0)
-0.161*
(e0)
*. Correlation is significant at level 0,05 (2-tail). **. Correlation is significant at level 0,01 (2-tail). (N = 330). (e0) Illiterate head of household; (e1) Head of household with primary education; (e2) Head of household with at least secondary education; Only significant correlation values shown

32
Interestingly, the species was positively correlated with the number of wives (r = 0.64) and
land cultivated (r = 0.56) only in urban areas, when wealth was a controlling variable. When
analysis was repeated while controlling for education level of the household head, the number
of wives was positively correlated with species in rural households where the head had no
education.
Dietary diversity scores (7 days, 30 days) for children were found to be positively, though
weakly, associated with education level of the head of household (r = 0.13, 0.12) and of the
spouse (r = 0.16, 0.13), main income activity (r = 0.23, 0.16) and secondary activity (r = 0.13,
0.11) of the head of household but negatively with the activities for women (r = -0.16, -0.56)
(Table 5b). Separate analyses between rural and urban areas revealed more influences on
dietary diversity; 24 hour DDS was negatively related to ages of the head of household (r = -
0.25) and of the spouse in rural areas (r = -0.24), and this relationship was stronger (r = -0.4)
where the head of household had no education. Unlike its relationship to agrobiodiversity,
ethnicity was found to have a positive association with dietary diversity for all three recall
periods (r = 0.29, 0.4, and 0.29) but only in rural areas. This relationship was however only
significant among households whose heads were illiterate. Yet another interesting finding
was that in general, education of wives was more strongly positively associated with
children‘s 7 day DDS where the head of household had attained at least secondary level
education. Whereas the head of household‘s main and secondary income sources were always
positively correlated with child dietary diversity, these activities seem to be more important
where the heads of household are uneducated and, specifically for urban areas, where the
head of household had primary education. Among uneducated heads of household, there was
a negative relationship between land cultivated and children‘s dietary diversity.

33
Discussion
Agrobiodiversity status
The agrobiodiversity observed in the study area is within expectations for the study area‘s
agroecological profile described by Achigan-Dako et al. (2011). A readily commercialized
and widely promoted staple elsewhere, Maize was the most common crop
grown/intercropped with others among respondents in all villages. This might be a
manifestation of simplifying agricultural systems in South West Benin or a matter of
‗disadvantage‘ resulting from agro-ecological predisposition. Sodjinou (2006) reports large
variations where more cereals such as millet are grown in North Benin and not in the South.
The picture is different with fruits and vegetables probably because they have less
management and input requirements (Fassil et al., 2000) and cultivated species are easily
complemented by wild species which made up to 38% and 28% of vegetable and fruit species
respectively in some villages. This presence of wild species in the community indicates,
according to Dansi et al. (2009), the dependence on nature for food thus reiterating the need
for environmental conservation. Differences between rural and urban areas could stem from
the negative impact urbanization seems to have on agriculture, perhaps because the urban
populace is often inclined towards other economic activities (Table 1), not to mention the
constraints regarding access to other production factors such as limited land and expensive
labour
In most African societies, it is common for households to share best agricultural practices and
exchange seeds through different fora in the villages. It is no surprise therefore that
households in agrobiodiversity rich villages had higher on-farm agrobiodiversity compared to
their counterparts. Besides, agroecological and socioeconomic conditions among the villages
may vary, favouring additional species in some but not others. For Achigan-Dako et al.
(2011), the diversity of vegetables in Benin and their widespread utilization in rural
communities offers an opportunity for diversification of the rural and urban economy.
This on-farm agrobiodiversity represents an affordable and easily accessible source of
nutrition (Fassil et al., 2000) allowing the urban population to reduce dependence on the
market and diversify the means of access to food (Maxwel et al., 1998). AGVSAN (2009)
reports that Beninese households with livestock, cash crops and food crops meet from 30 to
40% of their food needs through their own production and depend less on markets, thus

34
present lowest levels of expenditure per capita on food. Diversity also presents opportunities
to reduce synthetic input use while maintaining yields through natural pest control and
fertilization, is a fundamental resource for the development of new crop varieties, and an
insurance mechanism against unpredictable environmental and market downturns. Species
diversity is therefore essential for food security and poverty alleviation (Lockie and
Carpenter, 2010; Gari, 2004). It however remains to be determined to what extent
agrobiodiversity can serve as a cushion in this regard.
Markets
Naturally market traders tend to source food commodities from neighbouring villages to
minimize costs. Thus the likelihood that deficits in production of specific food crops are
transmitted to the markets is high. Sure enough, low on-farm agrobiodiversity observed with
cereals, grain legumes, and roots and tubers is prominently expressed by the low species
diversity in the markets. However, it‘s also possible that there is no market demand for other
varieties for a multiplicity of reasons including sociocultural barriers and prohibitive costs
when the foods are available etc. Despite the diversity, many of these traditional food plant
species are viewed as ―low-status‖ and as a result have been and are being displaced from
traditional production systems (Fassil et al., 2000). Urban markets are more likely to have
higher diversity than rural markets because producers and middle men get higher monetary
gain from the transactions. Besides, the traders in urban markets are usually in a better
position to access foods and obtain food commodities from more than one village unlike rural
markets that may not be integrated, sourcing commodities from individual farmers who often
double as traders. This explains the observed species diversity (higher than all villages
combined), and their steady supply in urban Lokossa market.
These findings demonstrate the importance of markets both for on-farm agrobiodiversity and
dietary diversity. Attractive producer prices are a powerful incentive for the conservation of
agrobiodiversity among farmers (Kruijssen and Mysore, 2010) while favourable consumer
prices permit household diet diversification. This is of practical significance for Beninese
households where the aggregate share of expenditure on food is 46.3% spread proportionately
among the different food groups, and households predominantly obtain food consumed from
the markets irrespective of the standard of living, department, area of residence, the
expenditure quintiles or classes of food security (AGVSAN, 2009). Despite marked
differences in diversity between rural and urban markets, certain species (yellow maize, local

35
and improved rice varieties) were found exclusively in the rural market. These are probably
produced in smaller, not easily marketable quantities and/or are thought to be inferior by the
urban populace who prefer exotic varieties, evidenced by the almost year round availability
of imported rice varieties in Lokossa market. Hellin et al. (2010) suggest use of new
scientific evidence related to species‘ intrinsic properties to stimulate their market demand.
Whereas market liberalization is taking root in most African economies, majority of the
agricultural produce, except for a few such as maize, is not internationally traded (Haddad,
2000). It is therefore plausible to say that the price levels and movements of these
commodities on the market are determined by local conditions. The usually greater demand
in urban versus rural areas is easily the reason for the generally higher unit food prices in
Lokossa market, with due regard to seasonal variations, exploitative tendencies, poor market
information, high transaction costs, and weak institutional structures that often characterizes
the marketing of these products ( Kruijssen and Mysore, 2010; Hellin et al., 2010).
If households in similar settings have a consistent aggregate demand pattern over time, thus
accounting for a predictable portion of price variability, erratic price variations (Figure 5) are
then attributable to supply differences also associated with the fore mentioned factors.
Indeed, Lokossa market had a higher level of prices, stable supply, and lower price variation
while Touzoume market had lower price levels, unstable supply, and correspondingly high
price variability. This price volatility compromises markets‘ ability to guarantee dietary
diversity as households are often unable to cope with price changes either due to high food
purchase prices or low producer prices that restrain the household budget. De Schutter (2009)
attributes food insecurity in Benin not to the country‘s inability to produce sufficient
quantities of food, but to the increase in prices during the lean season. Price volatility affects
rural and urban households alike since majority, including agriculturally-based rural
households are linked to markets (Hellin et al., 2010; AGVSAN, 2009) and makes both
smallholder farmers and poor consumers increasingly vulnerable to poverty due to their effect
on real incomes while also negatively impacting development (SOFI, 2011). Needless to say
sustainable diet diversification requires simultaneous improvement of on-farm
agrobiodiversity and of markets‘ ability to assume a complementary role through
mechanisms that, for example, maintain the supply of seasonal or perishable wholesome
foods.

36
Negative price correlations among foods in the same group were interpreted as indication of
substitutability3 and positive correlations to suggest strain on consumers in the acquisition of
these foods in case of rising prices. Positive correlation is not ideal as it could potentially lead
to exclusion or limited consumption of these foods. Substitutability was observed among
cereals (maize, rice, and millet), grain legumes (cowpeas, soybean) and vegetables but not
roots and tubers. Food diversity in markets provides households with alternative foods and
hence insulation against price surges of specific food commodities that could potentially
reduce children‘s consumption of key nutrients during the first 1000 days of life from
conception, leading to a permanent reduction of their future earning capacity (SOFI, 2011).
The lack of substitutability among roots and tubers, a usually important staple energy source,
is therefore a threat to dietary diversity that needs to be addressed.
Dietary diversity
Though resource constrained households may not easily achieve high DDS on a 24 hour
basis, it is important that they do so over time as this is a significant predictor of diet quality
and adequate micronutrient intake (Moursi et al., 2008; Gina et al., 2007), and is more
strongly associated with HAZ among children who are no longer breast-fed (Arimond and
Ruel, 2004). T-test and ANOVA results show that households in agrobiodiversity-rich
villages are more likely to diversify diets, and that on-farm agrobiodiversity is an important
factor influencing dietary diversity. This is in line with Dansi et al. (2009) findings that
people sharing a common geographical space and/or cultural identity or origin seem to
consume almost the same types of TLVs and corroborates the finding that rural and urban
households in areas of rich agrobiodiversity have better nutrition status for children under 5.
While there is no agreed classification of DDS, much less for different recall periods, the
patterns observed in agrobiodiversity, market food diversity and dietary diversity raise the
expectation of lower under nutrition levels than observed, implying limits to the utility of
DDS as a measure of nutrient intake. Remans et al. (2011) propose the nutritional functional
diversity metric which summarizes and compares the diversity of nutrients available based on
plant species composition on-farm and the nutritional composition of these plants. It is not
3 This substitutability is anticipated in terms of prices but not necessarily nutritional value

37
supposed, however, that socioeconomic and cultural factors such as food proscriptions and
prescriptions (Gittelsohn and Vastine, 2003), income, and gender have no bearing on the
translation of observed richness in agrobiodiversity to dietary diversity and child nutritional
status.
Nutrition status
Results depict the nutrition situation in the study area as better compared to Benin‘s
aggregate nutrition status indicators (EDSB, 2006). The high prevalence of wasting among
children 6-17 months is probably due to gaps in the transition from exclusive to
complementary feeding. The remarkably high prevalence of underweight and stunting is
inconsistent with the level of dietary diversity observed and might be indicative of
chronically inadequate diets, suggesting that diet diversity is not necessarily sufficient if the
right quantities are not consumed. Poor hygiene and sanitation conditions also contribute to
nutrition. AGVSAN (2009) reports that only 10.2% of mothers and guardians of children
under five wash their hands with soap at critical times, and that hygiene practices are less
adequate in rural areas than urban areas. Ultimately children are exposed to the hidden
consequences of inadequate nutrition that compromise immune function, cognitive
development, growth, reproductive performance, and work productivity (Underwood, 2000).
This inadequate feeding regime seems to persist as children grow. The highest stunting level
was observed among children 30-41 months, just outside the 0-2 year‘s window of
opportunity to eliminate child chronic under nutrition (SUN, 2010). EDSB (2006) confirms
that the proportion of stunted children increases regularly and rapidly with age. This situation
may also be the result of micronutrient losses from foods consumed between harvesting and
consumption. The most common preparation methods for the diversity of leafy vegetables in
Benin involves shredding of leaves followed by thorough washing and boiling in water
(Dansi et al., 2009), which are known to cause micronutrient losses. Nutrition can be
improved through attention to such traditional storage and food-preparation and cooking
practices, with a view to improving their effectiveness in maintaining levels of nutrients
derived from different plants (Fassil et al., 2000).

38
Building linkages among on-farm agrobiodiversity, dietary diversity and nutritional
status
Differences in agrobiodiversity between rural and urban areas were not clearly expressed in
the nutrition status of the children but were consistent with AGVSAN (2009) findings;
Children in Glo-guinkomey, an urban area with low on-farm agrobiodiversity, had the highest
dietary diversity and lowest prevalence of underweight and stunting compared to Agnito, a
rural area, which had the highest level of on-farm agrobiodiversity (Table 6). Differences
were however evident among villages of the same kind; rural villages that had higher levels
of on-farm agrobiodiversity also had lower prevalence levels in all three nutrition indicators
than those with low levels of on-farm agrobiodiversity. The same trend was observed among
villages in the urban areas.
Table 6: Agricultural biodiversity, dietary diversity and nutritional status linkages
Area
Number of
species (%
of total) Rank
Mean 30
day DDS Rank
Nutritional status
(mean Z scores)
HFA WFA Rank
Agnitor
67 (83) 1 9.12 3 -1.18 -0.66 2
Tozoumer 49 (60.5) 2 9.08 4 -1.68 -1.13 3
Agnivedjiu
38 (47) 4 9.29 2 -2.02 -1.44 4
Glo-guinkomeyu
42 (52) 3 9.32 1 -0.88 -0.57 1
Rural 78 (96.3) A 9.09 B -1.47 -0.93 B
Urban 51 (63) B 9.31 A -1.29 -0.88 A
rRural;
uUrban; A>B
This is evidence of a link between on-farm agrobiodiversity and nutrition status that is
mediated differently between rural and urban areas. Maxwel et al. (1998) attests to this
positive association with findings from urban Uganda where it was noted that the prevalence
of stunting and being underweight was significantly lower among children in farming
households, particularly in the lowest socioeconomic status groups. These findings express
the fact that rural households mostly consume what they produce and suggest that on-farm
agrobiodiversity might be more important for dietary diversity in rural than urban areas

39
where market diversity seemingly plays a greater role. This implies urban households could
potentially obtain just as much or even more nourishment from market and complementary
on-farm sources thus advancing the indispensable complementary role of on-farm
agrobiodiversity and market food diversity in nutrition. Attention is however also drawn to
the fact that the confluence of factors determining translation of on-farm diversity to dietary
diversity and nutritional status in rural and urban areas is significantly different.
Socioeconomic, cultural, and demographic factors influencing agricultural biodiversity
and dietary diversity
Agrobiodiversity and nutrition cannot be divorced from cultural diversity, local knowledge
(Lockie and Carpenter, 2010), and socioeconomic standing as these greatly influence
individual, household, and society decisions. Ethnic groups tend to preserve unique aspects of
their heritage including growing and consuming certain unique varieties of foods, settling in
distinct geographical areas endowed with specific agroecological features (Achigan-Dako et
al., 2011). Such social arrangements lead to variation in the number of species recorded per
ethnic group varies (Dansi et al., 2009) and determine food classification systems commonly
invoked when making decisions about food selection, preparation, serving, and consumption
Gittelsohn and Vastine (2003). It‘s not surprising therefore that on-farm species diversity
was significantly related to the ethnicities of the head of household and of the wives. Wealth
seems to aggravate ethnicity‘s negative influence on on-farm diversity perhaps because of the
possibility that wealthier households resort to the cultivation of a few commercialized crops
such as cotton and maize.
The relationship between number of wives and level of on-farm agro biodiversity is only
visible when attention is given to the area of residence and wealth status. It should
nonetheless be interpreted cautiously because of the possibility that these wives don‘t
necessarily live in the same household, and is subject to other considerations. In general, a
negative relationship exists between number of wives and species available probably because
the aforementioned effect of wealth or because of a likely different role women play in
farming as wealth status changes. In rural areas, the dynamics are different as number of
species increases with the number of wives but only among illiterate heads of household
perhaps because the dominant economic activity for such households is more likely to be
subsistence farming with, with higher dependence on on-farm sources of food which

40
implores diversification. It seems education influences on-farm diversification in rural areas,
while wealth has a similar effect in urban areas. The negative relationship between land
cultivated and number of species among the rich and the specific positive relationship among
the moderately rich in urban areas is equally difficult to fathom. The fact that that 91% of
households engaged in agriculture or gardening in Mono province own the land they cultivate
(AGVSAN, 2009) dispenses of land tenure rights as a possible cause. In general, it seems
that wealthy households tend towards monocropping, focussing on marketable crops. Two
reasons can be advanced for the positive relationship obtained in urban areas. First, the rich
can afford extra land on which to grow more varieties that complement market food
purchases and second, the relationship would probably turn out negative were it not for the
fact that the benchmark levels of agrobiodiversity in the rest of the urban households are
generally lower vis-à-vis the study area combined.
As earlier alluded to, ethnicity is bound to influence children‘s dietary diversity hence the
positive relationship observed. Interestingly this relationship was only found in rural areas.
This might be a suggestion of stronger cultural norms related to food in rural areas whose
application is probably influenced by the on-farm availability of the foods in question (higher
in rural areas) and other demographic factors such as education. Dansi et al. (2009) observe
that some TLVs are known and consumed by all or many ethnic groups while others e.g.
Manihot glaziovii (tree cassava) are ethnospecific. From these ethnic roots stem taboos that
play an important role in diets. In the southwest of Benin (of which Mono province is part),
the fact that a member of a household is a disciple of the divinity ‗‗Sakpata‘‘ means other
members of this household never prepare Launea taraxacifolia (wild lettuce) even if it is their
most preferred leafy vegetable (Dansi et al., 2009), while Cleome gynandra (Cat‘s whiskers)
is prohibited to the followers of Aguessi (Achigan-dako et al., 2009) to mention but a few.
Yet both plants have been found to have good nutritional and medicinal properties (Sakpere
and Aremu, 2008; Chweya and Mnzava, 1997). The DDS cannot, however, tell the
disadvantages arising from an ethnic group‘s choice to grow (or consume) a given species
over another in the same food category. This deserves further investigation using the
functional diversity metric in which the use of one species and not another may cause
differences in the functional diversity score because of the differences in the nutrient
composition of the species (Remans et al., 2011).

41
Results uphold the fact that education and nutrition are positively linked as in fact, dietary
diversity was found to be positively associated with education of both the head of household
and the spouse. Education allows guardians to make informed dietary choices for children
and to overcome detrimental cultural norms. This is probably why the positive relationship
between ethnicity and diet diversity was only significant among households where the head
was illiterate. Similarly, land cultivated was negatively related to diet diversity only among
uneducated heads of household, and the negative correlation between diet diversity and age
of the head of household and of the spouse was stronger where the head of household had no
education. In sum, AGVSAN (2009) reports that the prevalence of food insecurity in Benin is
higher among households headed by people with no education or simply literate, and it
decreases as the level of education of household head increases. In rural Benin, it seems
equally important that the head of household is educated, demonstrated by the stronger
association a mother‘s education has on children‘s dietary diversity when the head of
household has attained at least secondary level education.
In a rather straight forward relationship, the head of household being engaged in some
income generating activity makes diet diversification more likely as this frees up other
household resources and makes purchase of other foods not available on-farm possible, while
also reducing the need to sell on-farm produce. Involvement in income activities turned out to
be more important among uneducated heads of household probably because these activities
are the only sources of cash income compared to their more educated counterparts who have
access to employment and other opportunities on which they depend for food provision. This
is also probably why in urban areas, where the majority of the more educated heads of
household live, the relationship between income activities and dietary diversity was only
noted among heads of household with primary education, now at a comparative disadvantage
compared to those with secondary or higher education.
Surprisingly, involvement of women in come activities negatively affected children‘s dietary
diversity. This is an expression of the exceptional importance of the care role women play in
households and implicates the time burden of rural women‘s domestic unpaid work and the
lack of substitutability of female labour in household work by men which limits women‘s
choices with regards to accessing paid employment. Patriarchal ideologies, steeped in
traditional customs and culture, lead to unequal employment opportunities and gender

42
differentiated welfare (FAO/IFAD/ILO, 2010). In this context therefore, it follows that
engaging women in other economic activities compromises their ability to care for the
children as less time is devoted to child care (Haddad, 2000). While this may spell doom for
the women empowerment movement, it is actually an opportunity to advocate for the
recognition of women‘s care giving role as a productive rather than reproductive role.

43
Conclusions and recommendations
Agricultural biodiversity is a prerequisite for diet diversification in rural and urban areas.
Rural areas (and households) are more likely to have higher levels of on-farm agricultural
biodiversity compared to their counterparts in urban areas. Nonetheless on-farm
agrobiodiversity remains an important source of nutritious foods in urban areas because of
the complementary relationship with market food diversity. Dietary diversity is higher among
households with access to higher food diversity (on-farm and markets). Prevalence of under
nutrition is lower among rural and urban areas where there is greater presence of agricultural
biodiversity. Nutritional status remains generally poor among children in the study area,
attributable to a gap in infant feeding, inadequate food intake, and social, economic, and
cultural conditioning factors. These strongly influence both the level of agricultural
biodiversity and dietary diversity. Dietary diversity is increased by education of women,
whose ability to achieve this effect is in turn dependent on the level of education of the head
of household. Efforts to engage women in productive activities outside the normal caring role
should take care not to disrupt the nutritional well being of the children.
The study unearthed the dependence on one food staple (maize) as the main dietary energy
source. This is a threat to food security because of the heightened vulnerability to
environmental and market related risks. This is more so because maize is an internationally
traded and highly commercialized commodity, thus sole dependence on it suggests exposure
to the misgivings of the national and global food markets. Interventions to diversify cereal
and root crop production, and to promote their consumption, are therefore long overdue.
Findings also suggest the necessity for agricultural biodiversity intervention objectives to
stretch beyond input provision and yield boosts to facilitate the inclusion of a variety of
indigenous, neglected, and underutilized crops in rural and urban food trade systems. The
synergistic relationship between on-farm and market food diversity suggests that these
interventions can also be used to improve the livelihoods of communities in Benin and the
rest of sub-Saharan Africa.
These should not however justify a technocratic rush for solutions. Rather, what is needed is
to craft context specific policies/interventions using participatory methodologies so that the
core problems are addressed and people have the chance at promoting their values, in
accordance with their norms, customs, and beliefs. This is even more important in light of the

44
ethnic diversity observed. Efforts to promote commercialization of specific crops, while
beneficial in regard to augmenting farmer‘s incomes, may actually be detrimental in the long
run. Streamlining a nutrition component that pays equal attention to perishable but nutritious
foods could potentially counter this effect. De Schutter (2009) and AGVSAN (2009)
recognise the importance of storage and conservation of agricultural products, and their
processing into foodstuffs at local, national or regional level as an important factor in
enhancing food security. In addition to linking the agriculture, health, and environment
disciplines, sustainable diet diversification requires deliberate efforts targeted at smoothing
downsides in the market most especially the observed price volatilities for example through
innovations that streamline marketing of perishable produce.
This study however limited agricultural biodiversity to plant diversity thus excluding animal
source foods which are a major source of proteins and micronutrients in the diet and whose
absence from the diet could significantly affect nutrition status. In regard to market food
diversity, it was assumed that consumers actually purchase on the basis of quality rather than
quantity but this was difficult to tell as there was no data collected on actual food purchases
from the markets.
Linkages between agrobiodiversity, dietary diversity, and nutrition status remain to be
investigated further. Future studies seeking to explore this relationship should complement
dietary diversity with the nutritional functional diversity measure to account for nutrient
variation in different varieties of the same species. This calls for concerted efforts to establish
the nutrient composition of indigenous foods in these communities. Future studies should
also explicitly target different ethnic groups as this could unmask other important socio-
cultural factors governing access to food. Similarly, wealth status did not return a significant
association with other variables despite having been demonstrated otherwise in different
areas. There is need to change the measure from an asset based index used in this study to a
holistic approach that incorporates people‘s capabilities in the wealth index.

45
Appendix 1: Plant species identified in the study area
Rural Urban
Agnito Touzoume Agnivedji Glo - guinkomey
Grain
legumes
Vigna unguiculata [1] [1], Cajanus cajan, Phaseolus sp [1], Glycine max [1], Arachis hypogea
Cereals Zea mays [2] [2] [2] [2]
Roots &
tubers
Colocasia esculenta [3], Dioscorea alata, Dioscorea dumetorum [4],
Manihot esculentus [5]
[3], [4], [5], Dioscorea alata,
Dioscorea dumetorum, Ipomoea
batatas,
[3], [5] [3], [4], [5], Dioscorea alata,
Dioscorea praehensilis
Fruits Annanas comosus, Annona muricata, Annona senegalensis, Artocarpus
heterophyllus, Blighia sapida, Carica papaya [11], Citrus aurantium [6],
Cocos nucifera [7], Elaeis guineensis, Mangifera indica [8], Musa
sapientum [9], Passiflora edulis, Passiflora foetida, Persea americana
[12], Psidium guajava [10], Solanum torvum, Spondias monbin, Sterculia
foetida, Uvaria chamae, Vitex doniana
[6], [7], [8], [9], [10], [12],
Annona muricata, Annona
squamosa, Blighia sapida, Citrus
aurantiifolia, Uvaria chamae
[6], [7], [8], [9], [10],
[11], [12], Adansonia
digitata, Annanas
comosus, Chrysophyllum
albidum, Citrus
aurantiifolia, Terminalia
catappa
[6], [7], [8], [9], [10], [11],
Achras sapota, Annona muricata,
Artocarpus heterophyllus,
Borassus aethiopum, Cananga
odorata, Citrus aurantiifolia,
Dialium guineense, Elaeis
guineensis, Spondias mombin,
Terminalia catappa
Vegetables Amaranthus cruentus [13], Amaranthus spinosus [14], Bidens pilosa,
Capsicum annum, Cassia occidentalis, Cassia podocarpa, Celosia
argentea, Cissus populnea, Cleome ciliate, Cleome gynandra [15],
Corchorus olitorius [16], Crateva adansonii, Deinbollia pinnata, Ehretia
cymosa, Fleurya aestuans [17], Heliotropium indicum [18], Hibiscus
sabdarrifa, Hibiscus esculentus [19], Jatropha curcas [20], Launea
taraxacifolia [21], Lycopersicum esculentus [22], Manihot esculentus [23],
Moringa oleifera [24], Ocimum basilicum, Ocimum gratissimum,
Pergularia daemia, Ritchiea erecta, Solanum macrocarpum [25],
Stachytarpheta indica [26], Sterculia tragacantha, Talinum triangulare,
Telfairia occidentalis, Tylophora camerounica, Vernonia adoensis,
Vernonia amygdalina [27], Vernonia colorata [28], Vigna unguiculata
[29], Vitex doniana
[13], [14], [15], [16], [17], [18],
[19], [20], [21], [22], [23], [24],
[25], [26], [27], [28], [29],
Abelmoschus sp, Capsicum
annum, Cassia obtusifolia,
Crassocephalum rubens,
Ocimum basilicum, Ritchiea
erecta, Sida carpinifolia, Solanum
aethiopicum, Talinum
triangulare, Telfairia occidentalis
[13], [14], [15], [16],
[18], [19], [21], [23],
[24], [25], [26], [27],
[29], Amaranthus dubius,
Bidens pilosa, Crateva
adansonii, Ocimum
gratissimum, Ritchiea
erecta, Solanum nigrum,
[14], [15], [16], [17], [18], [19],
[20], [22], [23], [24], [25], [26],
[27], [28], [29], Ocimum
gratissimum
Others Cymbopogon citrates [30], Saccharum officinarum [31], Solanum
tabacum
[31], Solanum tabacum [30], [31] [30], [31]
[Number] indicates species common among 3 or more study areas

46
References
Achigan-Dako, E., Pasquini, M., Assogba-Komlan, F., Sognigbe, N., Dansi, A. and
Ambrose-Oji, B. (2009). Traditional vegetables in Benin: Diversity, distribution,
ecology, agronomy and utilisation. Darwin initiative and IFS.
Achigan-Dako, E.G., Sognigbe, N.D., Assogba-Komlan, F., Ambrose-Oji, B.,
Ahanchede, A. and Pasquini, M.W. (2011). Diversity, geographical, and consumption
patterns of traditional vegetables in sociolinguistic communities in Benin: Implications
for domestication and Utilization. Economic Botany, 65(2), pp.129-145.
Altieri, A. M., Rosset, P. and Thrupp, L. A. (2000). The Potential of Agroecology to
Combat Hunger in the Developing World. Retrieved July 11, 2011 from:
http://www.cnr.berkeley.edu/~agroeco3/the_potential_of_agroecology.html
Analyse Globale de la Vulnérabilité, de la Sécurité Alimentaire et de la Nutrition,
AGVSAN (2009). République du Bénin, Program Alimentaire Mondial (PAM),
UNICEF, FAO. PAM, Rome – Italy.
Arimond, M. and Ruel, T.M. (2004). Dietary Diversity Is Associated with Child Nutritional
Status: Evidence from 11 Demographic and Health Surveys. J. Nutr. 134: 2579–2585,
2004.
Berti, P.R., Krasevec, J. and FitzGerald, S. (2003). A review of the effectiveness of
agriculture interventions in improving nutrition outcomes. Public Health Nutrition:
7(5), 599–609.
Binayak, S., Purnima, M., Akhter, U. A., and Fatema, P. C. (2010). Food Utilization and
Nutrition Security. Bangladesh Food Security Investment Forum, 26–27 May 2010,
Dhaka. Retrieved July 13, 2011 from:
http://www.bids.org.bd/ifpri/food_utilization3.pdf
Burchi, F., Fanzo, J., and Frison, E. (2011). The Role of Food and Nutrition System
Approaches in Tackling Hidden Hunger. Int. J. Environ. Res. Public Health 2011, 8,
358-373
Chweya, A. and Mnzava, N.A. (1997). Cat‘s whiskers Cleome gynandra L. Promoting the
conservation and use of underutilized and neglected crops. 11. IPGRI, IPK
Dansi, A., Adjatin, A., Adoukonou-Sagbadja, H., Falade, V., Yedomonhan, H., Odou,
D., and Dossou, B. (2009). Traditional leafy vegetables and their use in the Benin
Republic. Genet Resour Crop Evol (2008) 55:1239–1256
De Schutter, O. (2010). Promotion and protection of all human rights, civil, political,
economic, social and cultural rights, including the right to development. Report
submitted by the Special Rapporteur on the right to food to the Human Rights Council
Sixteenth session Agenda item 3. Retrieved from July 12, 2011 from
http://www.srfood.org/images/stories/pdf/officialreports/20110308_a-hrc-16
49_agroecology_en.pdf

47
Enquête Démographique et de Sante, EDSB-III ( 2006). Institut National de la Statistique et de
l‘Analyse Économique (INSAE) Avec la collaboration du Programme National de
Lutte contre le Sida (PNLS) Cotonou, Bénin. Macro International Inc. Calverton,
Maryland, USA.
FAO (1999a). Agricultural Biodiversity: Multifunctional Character of Agriculture and Land
Conference, Background Paper 1. Maastricht, Netherlands. September 1999.
FAO (1999b). Women: Users, preservers and managers of agrobiodiversity. (Available at
www.fao.org/FOCUS/E/Women/Biodiv-e.htm).
FAO (2004). What is agrobiodiversity? Retrieved July 16, 2011 from:
ftp://ftp.fao.org/docrep/fao/007/y5609e/y5609e00.pdf
FAO (2011). Biodiversity for Food and Agriculture: Contributing to food security and
sustainability in a changing world. Outcomes of an Expert Workshop held by FAO and
the Platform on Agrobiodiversity Research from 14–16 April 2010 in Rome, Italy
FAO/IFAD/ILO (2010). Gender dimensions of agricultural and rural employment.
Differentiated pathways out of poverty. Status, trends, and gaps. Rome, Italy.
FAO/WHO (2003). Diet, nutrition and the prevention of chronic diseases. Report of a Joint
FAO/WHO Expert Consultation. WHO Technical Report Series No. 916. Geneva.
FAO/WHO (2004). Promoting fruit and vegetable consumption around the world. Fruit and
vegetables for health. Report of a Joint FAO/WHO Workshop, 1–3 September, 2004,
Kobe, Japan.
Fassil, H. L., Guarino, S. S., BhagMal, T. H., and Iwanaga, M. (2000). Diversity for food
security: Improving human nutrition through better evaluation, management, and use of
plant genetic resources Food and Nutrition Bulletin, vol. 21, no. 4 © 2000, The United
Nations University.
Frison, A., Ifeyironwa, F. S., Johns, T., Cherfas, J. and. Eyzaguirre, P.B. (2006).
Agricultural biodiversity, nutrition, and health: Making a difference to hunger and
nutrition in the developing world. Food and Nutrition Bulletin, vol. 27, no. 2 © 2006,
The United Nations University
Gari, J.A. (2004). Plant diversity, sustainable rural livelihoods and the HIV/AIDS crisis.
UNDP/FAO; Bangkok (Thailand)/Rome (Italy). Retrieved July 9, 2011 from:
http://www.undp.org/hiv/docs/alldocs/Asia%20%20Plant%20Diversity,%20Sustainabl
e%20Rural%20Livelihoods%20and%20the%20HIV-AIDS%20Crisis%20(2004).pdf
Gina, L.K., Pedro, M.R., Seghieri, C., Nantel, G. and Brouwer, I. (2007). Dietary
Diversity Score Is a Useful Indicator of Micronutrient Intake in Non-Breast-Feeding
Filipino Children. J. Nutr. 137: 472–477, 2007.
Gittelsohn, J. and Vastine, A. E. (2003). Sociocultural and Household Factors Impacting on
the Selection, Allocation and Consumption of Animal Source Foods: Current
Knowledge and Application. J. Nutr. 133: 4036S–4041S, 2003

48
Giuliani, A.(2007). Developing Markets for Agrobiodiversity. Securing livelihoods in
dryland areas, Earthscan, London.
Grebmer, V., K., Torero, M., Olofinbiyi, T., Fritschel, H., Wiesmann, D., Yohannes, Y.,
Schofield, L., and Von Oppeln, C. (2011). 2011 Global Hunger Index. The Challenge
of Hunger: Taming Price Spikes and Excessive Food Price Volatility. Bonn,
Washington, DC, Dublin: Deutsche Welthungerhilfe, International Food Policy
Research Institute, and Concern.
Haddad, A.L. (2000). Conceptual framework for assessing agriculture–nutrition linkages.
Food and Nutrition Bulletin, vol. 21, no. 4 © 2000, The United Nations University
Hellin, J., Higman, S. and Keleman, A. (2010). Value chain coordination of
agrobiodiversity conservation. In: Lockie, S., and Carpenter, D. (Eds.) (2010).
Agriculture, biodiversity and markets: Livelihoods and agroecology in comparative
perspective. Washington DC, Earthscan.
Ifeyironwa, F.S. (2010). Micronutrient interventions: Options for Africa Food and Nutrition
Bulletin, vol. 21, no. 4 , The United Nations University.
International Conference on Nutrition, ICN (1992). World declaration and plan of action
for nutrition: USAID Food Security and Nutrition Monitoring Project, 1992. Island
Press, Washington, DC.
Kruijssen, F. and Mysore, S. (2010). Integrating biodiversity conservation and livelihood
improvement: The role of markets for mango varieties and Garcinia species in India.
Bioversity International, March 2010. India.
Lockie, S., and Carpenter, D. (Eds.) (2010). Agriculture, biodiversity and markets:
Livelihoods and agroecology in comparative perspective. Washington DC, Earthscan.
Maxwell, D., Levin, C. and Csete, J. (1998). Does urban agriculture help prevent
malnutrition? Evidence from Kampala. Food Policy 1998;23:411–24.
Millennium Ecosystem Assessment ( 2005). Ecosystems and Human Well-being: Synthesis.
Moore, G. (2010). Multilateral and national regulatory regimes for agrobiodiversity. In:
Lockie, S., and Carpenter, D. (Eds.) (2010). Agriculture, biodiversity and markets:
Livelihoods and agroecology in comparative perspective. Washington DC, Earthscan.
Moursi, M.M., Arimond, M., Dewey, K. G., Serge, T., Ruel, M. T. and Delpeuch, F.
(2008). Dietary Diversity Is a Good Predictor of the Micronutrient Density of the Diet
of 6- to 23-Month-Old Children in Madagascar. J. Nutr. 138: 2448–2453, 2008.
Pinstrup-Andersen, P. (2011). The food system and its interaction with human health and
nutrition. Leveraging agriculture for improving nutrition and health. IFPRI 2020
conference brief.
Popkin, B.M. (2001). The nutrition transition and obesity in the developing world. J. Nutr.
131: 871S–873S, 2001.

49
Remans, R., Fanzo, J., Flynn, D.F.B., DeClerck, F., and Diru, W. (2011). Assessing
Nutritional Diversity of Cropping Systems in African Villages. PLoS ONE 6(6):
e21235. doi:10.1371/journal.pone.0021235
Report of the UN Special Rapporteur on the right to food, Olivier De Schutter. Addendum
- Mission to Benin (A/HRC/13/33/Add.3) Human Rights Council, Thirteenth session,
Agenda item 3. Promotion and protection of all human rights, civil, political, economic,
social and cultural rights, including the right to development 22 Dec 2009 Page 24/69
ReliefWeb report — http://reliefweb.int/node/347395
Sakpere, A.M.A. and Aremu, O.A. (2008). The growth of Launea taraxacifolia
(Asteraceae) and its response to shading. Research Journal of Botany 3(2): 90-96, 2008
Siebert, R. (2010). The ‗Green Box‘: Multifunctionality and biodiversity conservation in
Europe. In: Lockie, S., and Carpenter, D. (Eds.) (2010). Agriculture, biodiversity and
markets: Livelihoods and agroecology in comparative perspective. Washington DC,
Earthscan.
Sodjinou, R.S.(2006). Evaluation of food composition tables commonly used in Benin:
Limitations and suggestions for improvements. Journal of Food Composition and
Analysis 19 (2006) 518–523
SUN framework (2010). A road map for Scaling-Up Nutrition. First edition, September
2010.
The state of Food Insecurity in the world, SOFI (2011): How does international price
volatility affect domestic economies and food security? Food and Agriculture
Organization of the United Nations, Rome.
Toledo, A. and Burlingame, B. (2006). Biodiversity and nutrition: A common path toward
global food security and sustainable development. Journal of food composition and
analysis 19: 477-483
Torheim, L.E., Ouattara, F., Diarra, M. M., Thiam, F.D., Barikmo, I., Hatloy, A. and
Oshaug, A. (2004). Nutrient adequacy and dietary diversity in rural Mali: association
and determinants. European Journal of Clinical Nutrition (2004) 58, 594–604
Underwood, B. A. (2000). Overcoming micronutrient deficiencies in developing countries:
Is there a role for agriculture? Food and Nutrition Bulletin, vol. 21, no. 4 © 2000. The
United Nations University
WHO (1997). Global database on Child Growth and Malnutrition. World Health
Organization, Geneva.