Embed Size (px)
Citation preview
UNIVERSITÀ DEGLI STUDI DI MILANO
FACOLTÀ DI AGRARIA
Department of Food Science and Microbiology
Graduate School in Molecular Science and Plant, Food and Environmental Biotechnology
PhD Course in Food Science, Technology and Biotechnology
INNOVATIVE APPROACHES AND INSTRUMENTS IN MODELLING
AND MONITORING THE SHELF LIFE OF PACKAGED PERISHABLE FOODS
PhD Thesis of: Pietro LAMIANI
Tutor: Prof. L. PIERGIOVANNI
Co-tutor: Dr. S. LIMBO
Ciclo XIV 2010-2011


I
Contents Abstract 1
Riassunto 2
1. Introduction 5
1.1 Food products degradation factors 5
1.1.1 Light transmission 6
1.1.2 Gas transmission 6
1.1.3 Heat transmission 6
1.1.4 Moisture transmission 7
1.1.5 Mechanical stress 7
1.2 Relative humidity and adsorption isotherm 7
1.3 Food packaging 10
1.3.1 Protection 10
1.3.2 Convenience 10
1.3.4 Communication 10
1.3.5 Containment 10
1.4 Permeability of food packaging polymers 11
1.4.1 Basic concepts of permeation 11
1.4.2 Mechanism of gas transport through permeation 12
1.4.3 Diffusion of permeant 12
1.4.4 Adsorption and desorption of permeant 14
1.4.5 Permeation rate 14
1.4.6 Water Vapour Transmission Rate 15
1.5 Shelf life 17
1.5.1 Shelf life testing 17
1.5.2 Accelerated shelf life testing 17
1.5.3 Shelf life models 18
1.5.3.1 Temperature depending models 18
1.5.3.2 Moisture depending models 19
1.6 References 21
2 Aim 25
2.1 References 25
3 Materials and methods 27

II
3.1 Materials 27
3.1.1 Apple rings 27
3.1.2 “Fetta biscottata” 28
3.1.3 Packaging materials 34
3.1.4 Acquisition system 34
3.2 Methods 37
3.2.1 Water activity measures 37
3.2.2 Moisture content 37
3.2.3 Water vapour transmission rate of the packages 37
3.2.4 Shelf life testing 38
3.2.5 Sorption isotherms determination 38
3.2.6 Moisture sensor calibration 40
3.3 References 57
4 Results and discussion 59
4.1 Preliminary experiment 59
4.2 Model system and theoretical assumption verification 60
4.3 Shelf life prediction 66
4.4 Conclusions 74
4.5 Shelf life prediction simplification for a category of products 75
4.6 Conclusions 86
4.7 References 87
5 Appendix 89

1
Abstract Shelf life models are mathematical equations that describe the relationship between food, package, and environment. Shelf life models are useful to predict the shelf life of food, to design food packages and to provide useful information. The accuracy by which these relationships are measured influences the reliability of the models. It is also necessary to know the relationships among the variables that play a significant role in defining food quality. Many chemical, biological, and physical changes are dependent on moisture content or water activity in foods, whose changes may be dictated by the protection from the environment given by packaging in the distribution channel. Water activity is ruled by the moisture content in the food, which may change with time through the permeation process of water vapor across the packaging film. The equilibrium relationship between moisture content and water activity is explained by the sorption/desorption isotherm, which is obtained mostly by experiments determining moisture contents of the food samples equilibrated under different relative humidity conditions. Many attempts were conducted to express the equilibrium relationship by mathematical forms. The most widely used are the equations of Smith, Halsey, Henderson, Oswin, Inglesias, and Chirife. These equations are used in forecast models to determine the shelf life of moisture depending products. All these models assume that the relative moisture of the headspace of the packaging (which changes with the entrance of water vapour from the outside) is immediately in equilibrium with the product. This condition has not been verified experimentally and is based on theoretical considerations. The aim of this PhD thesis is the study of innovative approaches and instruments to model and monitor the shelf life of packaged perishable foods. The crucial part of this work is to verify the theoretical assumption of immediate equilibrium assumed by moisture depending prediction models. To achieve this result it has been developed and built an acquisition system based on moisture sensors, a recording unit and specific software to collect data. The system has been tested on different products and packages in order to define the proper materials and working conditions to define the experimental plan and the system settings. A model system based on “Fetta biscottata” (a typical Italian bakery product chosen because of its regular shape, geometry, and uniformity among different batches) packaged in rigid EPS trays of different volumes has been chosen. This model system allowed to study how different quantities of product, different headspace volumes, and different packaging solutions influence the equilibrium between the relative humidity of the headspace and of the product and how this differences influence the shelf life prediction. The model system studied in the present work has demonstrated that, in this case, the theoretical assumption generally used in the shelf life modelling, stating the immediate equilibrium between the headspace and the product relative moistures, is not verified. These relative moistures are not immediately in equilibrium but show an increasing difference correlated to the increase of the headspace volume/product weight ratio. This correlation has been studied and it has been described by a linear equation in the considered range. The application of a shelf life prediction model to the studied system has shown that a correction is needed to avoid an underestimation of the shelf life. The application of this correction will be particularly interesting for the shelf life modelling of moisture depending products characterized by packaging solution with high headspace volumes. In a second part of the work it has been studied the possibility to simplify the shelf life prediction for a category of products applying a unique shelf life model for all the products part of the category. The shelf life prediction is a labor and time intensive work, a simplification might be useful in real case studies, especially if the category includes high quantities of references. The study on 14 different types of “Fetta biscottata” has demonstrated that it is possible to simplify the work only with simplifications based on a good knowledge of statistical indexes and their correct application.

2
Riassunto I modelli di previsione della shelf life sono equazioni matematiche che descrivono il rapporto tra l’alimento, la confezione e l'ambiente. Essi sono utili strumenti per prevedere la shelf life degli alimenti ma anche per progettare gli imballaggi e fornire informazioni utili alla loro gestione. L'affidabilità dei modelli di previsione dipende molto dalla precisione con cui si misurano le relazioni tra alimento, confezione e ambiente, dall’approfondita conoscenza delle relazioni che intercorrono tra le variabili significative nel definire la qualità degli alimenti. Le numerose modificazioni chimiche, fisiche e biologiche che possono avvenire durante la shelf life, dipendono in gran parte dal contenuto umido o di attività dell'acqua degli alimenti, le cui variazioni possono essere influenzate dalla protezione offerta dall’imballaggio durante la distribuzione commerciale. L’attività dell'acqua è governata dal contenuto umido del prodotto, che può modificarsi nel tempo attraverso il processo di permeazione del vapore acqueo attraverso l’imballaggio. Il rapporto di equilibrio tra il contenuto umido e l'attività dell'acqua è definito dall’isoterma di assorbimento/desorbimento, rilevata, per lo più, mediante esperimenti volti a determinare il contenuto umido dei campioni alimentari equilibrati a diverse condizioni di umidità relativa. Diverse equazioni matematiche sono state sviluppate negli anni per esprimere tale rapporto di equilibrio; le più usate sono le equazioni di Smith, Halsey, Henderson, Oswin, Iglesias e Chirife e vengono utilizzate nei modelli di previsione per determinare la shelf life dei prodotti alimentari sensibili agli scambi di umidità. Tutti questi modelli presuppongono che l'umidità relativa dello spazio di testa della confezione (che si modifica con l'ingresso di vapore acqueo dall'esterno) sia immediatamente in equilibrio con l’umidità relativa del prodotto. Questa assunzione non è stata finora verificata sperimentalmente e si basa su considerazioni teoriche. Scopo di questa tesi di dottorato è lo studio di approcci e strumenti innovativi nella modellazione e nel controllo della shelf life di prodotti confezionati la cui deperibilità è prevalentemente umidità dipendente. Parte fondamentale di questo lavoro è stata la verifica dell'assunto teorico di immediato equilibrio alla base dei modelli di previsione della shelf life per prodotti sensibili agli scambi di umidità. Per raggiungere questo obiettivo è stato progettato, costruito e sviluppato un sistema di acquisizione dati basato su sensori di umidità, dotato di una unità di registrazione e di uno specifico software. Il sistema è stato preliminarmente utilizzato con diversi prodotti e differenti soluzioni di confezionamento in modo da selezionare il prodotto e la confezione più appropriati e definire le migliori soluzioni per il piano sperimentale, le condizioni di lavoro e la strumentazione da utilizzare. Il sistema modello scelto è basato su fette biscottate (un tipico prodotto da forno italiano adatto al presente lavoro a causa della sua forma regolare, la geometria e l’uniformità tra lotti diversi) confezionate in vaschette rigide di EPS di due differenti volumi. Il sistema modello ha permesso di studiare come diverse quantità di prodotto, diversi spazi di testa e diverse soluzioni di confezionamento influenzino l'equilibrio tra l'umidità relativa dello spazio di testa del prodotto e quella del prodotto e come questa differenza influenzi la previsione della shelf life. Il presente lavoro ha dimostrato, tramite i dati forniti dal modello studiato, che l'assunto teorico in genere utilizzato nel modello di previsione della shelf life per prodotti umidità dipendenti, non è verificato. Infatti l’umidità relativa dello spazio di testa e l’umidità relativa del prodotto non sono immediatamente in equilibrio, bensì mostrano una differenza che aumenta all’aumentare del rapporto tra volume dello spazio di testa e peso del prodotto. Questa correlazione è stata analizzata ed è stata descritta da un'equazione lineare nell'intervallo considerato. L'applicazione di un modello di previsione della shelf life al sistema modello in esame ha mostrato la necessità di una correzione per evitare una sottostima della shelf life del prodotto. L'applicazione di tale correzione può essere particolarmente interessante per la previsione della shelf life di prodotti sensibili agli scambi di umidità caratterizzati da soluzioni di imballaggio con elevato volume di spazio di testa.

3
Una seconda parte del lavoro ha studiato la possibilità di semplificare la previsione della shelf life per una intera categoria di prodotti, applicando un unico modello di previsione a tutti i prodotti appartenenti alla categoria. Questo tipo di previsione richiederebbe dispendio di lavoro e di tempo e una semplificazione potrebbe essere utile in applicazioni reali, in particolare per categorie di prodotti caratterizzate da elevate quantità di referenze. Lo studio applicato a 14 diverse tipologie di fette biscottate ha dimostrato che è possibile semplificare il lavoro solo applicando formule basate su una valida conoscenza degli indici statistici tipici di questi modelli e sulla loro corretta applicazione.

4

5
1. Introduction In the food products the expiration of shelf life is frequently caused by some deterioration leading to unacceptable quality and safety issues. The three main categories of food spoilage that can occur are physical spoilage, chemical spoilage, and microbiological spoilage. There are some overlaps among the three categories, and often spoilage in one category can help to promote spoilage in another one. There are several main factors that influence most types of spoilage. These factors include temperature, pH, water activity, exposure to oxygen and light, and nutrients or chemicals available in the food product (Singh & Anderson, 2004). A food product, especially if it contains multiple ingredients, may have many deterioration modes, but it is not necessary to deal with all possible deterioration modes. Instead, efforts should be made to identify one or two major deterioration modes which occur most rapidly, because the product shelf life is limited by those fast deterioration modes, not by the slow ones. In some situations, two different deterioration modes may be related. The deterioration modes of a food product may be identified using a sensory panel or based on prior knowledge of the food product. Food deterioration modes can be product dependent or package dependent. Product dependent deteriorations are food deteriorations driven by intrinsic stability of the food product, given by food formulation and processing conditions, not by environmental factors or packaging. Package dependent deteriorations are food deteriorations driven by environmental factors that are controllable by the packaging technologies. Those environment factors include oxygen, moisture, microbes and light from the ambient environment, against which the food product may be protected by using the package as a barrier to separate the product from the external environment. When the major deteriorations modes are known, it is necessary to identify quality indexes to quantify and describe the deterioration. These quality indexes need to be measurable, reproducible, and relevant. Quality indexes may be subjective or objective. Subjective indexes have the advantage of being most relevant to the consumer acceptability, but they have the disadvantage that measurements have relatively low degree of reproducibility and are labor intensive to obtain. Objective quality indexes, instead, have the advantage that measurements have good reproducibility, but also have the disadvantage that the acquired data may not correlate well to consumer acceptability. In most cases, a combination of subjective and objective quality indexes is the best for describing the quality of a food product. To define shelf life properly, it is also necessary to define a critical limit for each quality index, below which the food product is no longer acceptable (Lee et al., 2008). 1.1 Food products degradation factors
All food products are subjected to a deterioration of quality due to a series of chemical phenomena, physical and biological processes involved in their conservation. These negative quality changes are induced by a primary event. The effects of the primary event deterioration induce a measurable change of a quality attribute of the product (Piergiovanni, 2002). The primary events of the degradation can be divided into intrinsic and extrinsic events. In the first category all the components that participate to the degradative reactions are present in the formulation of the product. Therefore the degradation phenomena can be influenced directly only by modifying the composition of the food or by changing the production technology. The category of extrinsic events is composed by degradation phenomena that are not caused by the surrounding environment. They are (Spiegel, 1992):
light transmission; gas transmission; heat transmission; moisture transmission;
6
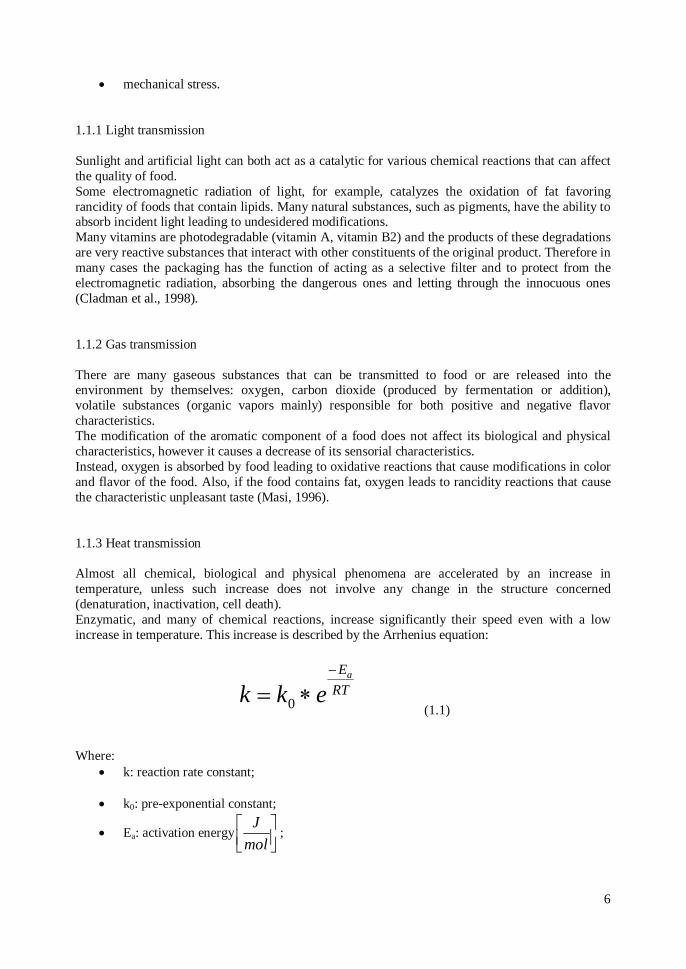
mechanical stress. 1.1.1 Light transmission Sunlight and artificial light can both act as a catalytic for various chemical reactions that can affect the quality of food. Some electromagnetic radiation of light, for example, catalyzes the oxidation of fat favoring rancidity of foods that contain lipids. Many natural substances, such as pigments, have the ability to absorb incident light leading to undesidered modifications. Many vitamins are photodegradable (vitamin A, vitamin B2) and the products of these degradations are very reactive substances that interact with other constituents of the original product. Therefore in many cases the packaging has the function of acting as a selective filter and to protect from the electromagnetic radiation, absorbing the dangerous ones and letting through the innocuous ones (Cladman et al., 1998). 1.1.2 Gas transmission There are many gaseous substances that can be transmitted to food or are released into the environment by themselves: oxygen, carbon dioxide (produced by fermentation or addition), volatile substances (organic vapors mainly) responsible for both positive and negative flavor characteristics. The modification of the aromatic component of a food does not affect its biological and physical characteristics, however it causes a decrease of its sensorial characteristics. Instead, oxygen is absorbed by food leading to oxidative reactions that cause modifications in color and flavor of the food. Also, if the food contains fat, oxygen leads to rancidity reactions that cause the characteristic unpleasant taste (Masi, 1996). 1.1.3 Heat transmission Almost all chemical, biological and physical phenomena are accelerated by an increase in temperature, unless such increase does not involve any change in the structure concerned (denaturation, inactivation, cell death). Enzymatic, and many of chemical reactions, increase significantly their speed even with a low increase in temperature. This increase is described by the Arrhenius equation:
RTEa
ekk
0 (1.1)
Where:
k: reaction rate constant;
k0: pre-exponential constant;
Ea: activation energy
mol
J;

7
R: universal gas constant
molKJ314.8 ;
T: absolute temperature K .
The value of activation energy Ea measures the sensitivity of the degradation reaction to temperature. It is a value that depends on factors such as water activity, moisture content, solids concentration and pH. When the heat content changes often there is also an associated physical change that can be very important for quality, such as crystallization, solutions of solutes and phase changes. 1.1.4 Moisture transmission The moisture content and water availability in food play a fundamental role in the stability and shelf-life of the product. Many different phenomena depend on the moisture content of a food. They can be accelerated by the transfer of water between product and environment. They can be (Saguy & Karel, 1980):
microbiological events: every organism has a threshold of minimum relative humidity to grow;
physical events that affect mainly the structure and consistency of the product: the crystallization of sugar, swelling of colloidal systems, modifications of crystallizable materials;
chemical events: most of the chemical and enzymatic reactions are influenced by water through different mechanisms, sometimes very complex. In fact water is a solvent in the hydrolytic reactions; it is a product of condensation reactions and can lead to an agent that modifies the catalytic activity and other inhibitory substances.
It has also to be considered that the relative humidity is not constant but changes as a function of temperature. 1.1.5 Mechanical stress From the production to the consumption a food product may be subjected to different mechanical stresses intentionally or accidentally. This can happen during packaging, warehouse storage, and transportation, placement on the shelves, the purchase phase, and the arrangement in the house. Shock and vibration can cause the loss of the food integrity. As in the case of loss of flavor, even the loss of integrity does not always affect the intrinsic quality of a food, not interfering with the sensory aspects, nutritional and toxicological. However, it can be extremely negative from a commercial point of view for the image of the product. 1.2 Relative humidity and adsorption isotherm All chemical, physical and biological processes that involve the exchange of moisture between the food and the environment depend on the water availability not on the overall moisture content. The water availability can be expressed as partial vapor pressure, which is the ratio between the vapor

8
pressure of water contained in the product (p) and the vapor pressure of pure water at the same temperature (p0). This ratio is defined water activity (aw) or equilibrium relative humidity, when expressed as a percentage:
0ppaw
(1.2)
100%0
ppRH
(1.3)
The vapor pressure, which is the pressure exerted by water molecules of the product that are released in the vapor phase, is a parameter strictly dependent on temperature. This parameter informs about the affinity of water molecules with the constituents of the product. The higher the affinity is and the lower the vapor pressure is, because a low amount of water molecules are released (Peri, 1996). In the heterogeneous systems, as food can be considered, the reactivity of each molecular species is strongly correlated to the affinity with water molecules and to the competitiveness with the hydrophilic and hydrophobic sites. Small temperature changes or other factors that indirectly affect the water activity (light, additives, pH, and pressure) can induce changes in the molecular arrangement of water, which are reflected in the food quality and stability (Rockland & Nishi, 1980). For this reason it is important to know what the water availability of a product is. The relationship between relative humidity at the equilibrium and the total moisture content (expressed as the amount of water for mass unit of dry product) is expressed in a graph called adsorption or desorption isotherm according to whether it is experimentally built by gradually hydrating or dehydrating the food. The isotherm describes the behavior of the product during the equilibrium process with the environment humidity, adsorbing or desorbing water, according to its initial state. Each food has a typical and specific isotherm. It is interesting to note that all the isotherms can be divided into three characteristic areas (figure1.1) according to the water bonds.

9
Figure 1.1: adsorption isotherm.
The first area includes the lower equilibrium relative humidity values (0-25%). At these values the water is strongly linked to the preferential adsorption sites through hydrogen bonding and ionic interactions. The vapor pressure is low and the water has a high energy of adsorption. The second area includes intermediate equilibrium relative humidity values, between 20 and 65%. The water is linked to the different components mainly with covalent bonds and the individual molecules are oriented in layers. The third area includes the highest relative humidity values, from 75 to 100%. Water molecules are not chemically or physically linked to the product but are free and arranged disorderly. In this area the water is free to condense and the decrease of the vapor pressure is due to the capillary forces that are generated in the microstructure of the food (Peri, 1996; Rockland & Nishi, 1980). In Figure 1.1, besides the adsorption isotherm of the product, are reported some other curves. They represent the main degradation reactions that can occur in food as a function of relative humidity equilibrium that can affect the food quality and stability.

10
1.3 Food packaging Food packaging is a coordinated system designed for the efficient delivery of high quality, safe food products throughout every phase of the supply chain, from raw material production to food manufacture, packaging, retail, wholesale, consumer use, disposal, and recycling or other means of resource recovery. A food package must serve one or more functions to justify its existence. Food packaging has four basic functions: protection, convenience, communication, and containment. A package design may be evaluated based on how well the package performs the required functions in a cost effective manner (Lee et al., 2008). 1.3.1 Protection Protecting the food from physical damage, physiochemical deterioration, microbial spoilage, and product tampering is probably the most important function of packaging. Without proper protection, the food may become unappetizing, less nutritious, and unsafe to consume. The required packaging protection depends on the stability and fragility of the food, the desired shelf life of the food package, and the distribution environment. Good package integrity is also required to protect against loss of hermetic condition and microbial penetration. Generally, the protection function of packaging is limited to foods whose shelf lives are controlled by environmental factors relating to physical damage, humidity, oxygen, light, and, to some extent, temperature. Packaging is usually not effective for protecting foods whose shelf lives are controlled by internal factors (Lee et al., 2008). 1.3.2 Convenience Convenience is an important function to satisfy the busy consumer lifestyle. Examples of convenient food packages are ready-to-eat meals, heat-and-eat meals, and self-heating packages. Examples of convenient features are easy opening, resealability, and microwavability. Innovations are constantly sought to provide more convenience without sacrificing quality or increasing costs (Lee et al., 2008). 1.3.4 Communication The function of communicating is important to create brand identity and influence consumer buying decisions. The package communicates with the consumer through written texts, brand logo, and graphics. In many countries, nutritional facts such as calories, fat, cholesterol, and carbohydrate are required on all food packages. The communication function is also important for facilitating distribution and retail checkouts. The barcode has virtually become an integral part of every commercial food package. Besides the barcode, there are other package devices, such as time-temperature indicator and radio frequency identification (RFID), which enable the package to communicate more effectively for the purpose of ensuring food quality and safety (Lee et al., 2008). 1.3.5 Containment Containing the food product is the most basic function of packaging. The requirement for containment depends on the size, weight, form, and shape of the enclosed food; for example, a solid
11
food has different requirements from a liquid food. The containment function is also closely related to the rigidity of the package (Lee et al., 2008). It is evident that there is not an ideal packaging solution for everything, for each product the most appropriate materials and the most appropriate construction techniques must be selected. In particular, for products with low moisture content, almost all the structural changes that have been described previously depend on the water content of the product. Its quantity, its availability and mobility in the product matrix influence the speed and the direction of moisture exchange between the product and the surrounding environment. In these conditions the moisture exchange between the product and the surrounding environment has to be limited by a vapour barrier. 1.4 Permeability of food packaging polymers The transport of gas or vapor through a food package can greatly influence the keeping quality of the packed food. Water vapor infiltrating the package can cause moisture gain leading to sogginess or microbial growth in food, while water vapor escaping from the package can cause moisture loss leading to undesirable textual changes in food. On the contrary, there are occasions when the transport of gases and vapors is desirable. In modified atmosphere packaging of fresh produce, the exchange of oxygen, carbon dioxide, and water vapor through the package is necessary to accommodate the respiration and transpiration of the still bioactive product and to maintain an optimum gas composition in the package. There is a subtle difference between gas and vapor, although these two terms are frequently used interchangeably. A gas refers to low-boiling-point molecules that are non condensable and exist only in the gaseous state at ambient temperature and atmospheric pressure. 'Permanent gases' describe oxygen, nitrogen, hydrogen, carbon dioxide, and odder gases that follow the ideal behavior; for example, they obey Henry's Law and their permeabilities and diffusivities are constant, not concentration dependent. On the other hand, a vapor is condensable at ambient temperature. Condensation of water vapor may cause the problems of fogging on package surface and microbial growth on food surface. Water vapor and organic vapors often deviate from the ideal behavior, and their permeabilities and diffusivities are concentration dependent. There are two major mechanisms by which gas or vapor may be transported through the package: permeation and leak. Permeation involves the exchange of a gas or vapor (also known as permeant) through a plastic film or package wall. Leak involves the exchange of gas or vapor through pinholes or channel leaks. Leaks from defective packages are often more influential than permeation in determining the overall transmission rate (Chung et al., 2003). In the following paragraphs the three major steps (adsorption, diffusion, desorption) involved in the permeation process are described and a permeation equation based on this understanding is derived. To characterize the barrier properties of polymeric packaging materials, we introduce the term permeability (also known as permeability coefficient), defined as a product of diffusion coefficient and solubility coefficient (Lee et al., 2008). 1.4.1 Basic concepts of permeation Permeation and gas barrier are closely related terms. Permeation is inversely proportional to gas barrier. A package which allows gas to permeate quickly is a package of low gas barrier. To protect foods that are oxygen or moisture sensitive, high gas barrier packages should be used to retard the rate of permeation. All packaging polymers are permeable to gas and vapor to various degrees. These polymers provide a wide range of permeability for different applications. Hence the study of permeation is important

12
to ensure that adequate gas barrier protection is provided for plastic pouches, plastic containers, and other plastic packages (Lee et al., 2008). 1.4.2 Mechanism of gas transport through permeation Figure 1.2 shows that permeation of a permeant through a polymer film (or a package wall) is driven by concentration gradient in the direction from high to low concentration. The mechanism of permeation consists of three sequential steps: adsorption of the permeant onto the high concentration side of the film surface, diffusion of the permeant across the film, and desorption of the permeant from the low concentration side of the film surface.
Figure 1.2: permeation through a polymer film.
When measuring permeation rates, experiments are usually set up such that both sides of the film are exposed to the gas phase. In this case, the permeation process involves only the gas and solid phases, where the permeant in one gas phase (left side) enters the solid phase of the polymer film (middle) and exits to another gas phase (right side) (Lee et al., 2008). 1.4.3 Diffusion of permeant Diffusion is the movement of molecules from a region of high concentration to a region of low concentration as a result of intermingling of the molecules due to random thermal agitation. While individual molecules move randomly with no sense of direction, the intermingling of the molecules
13
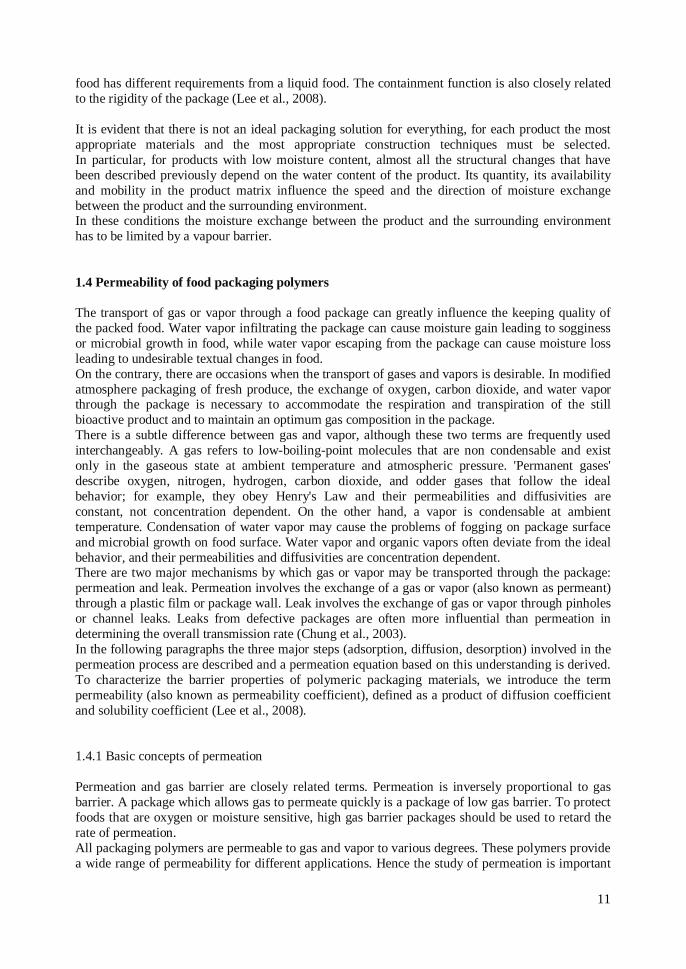
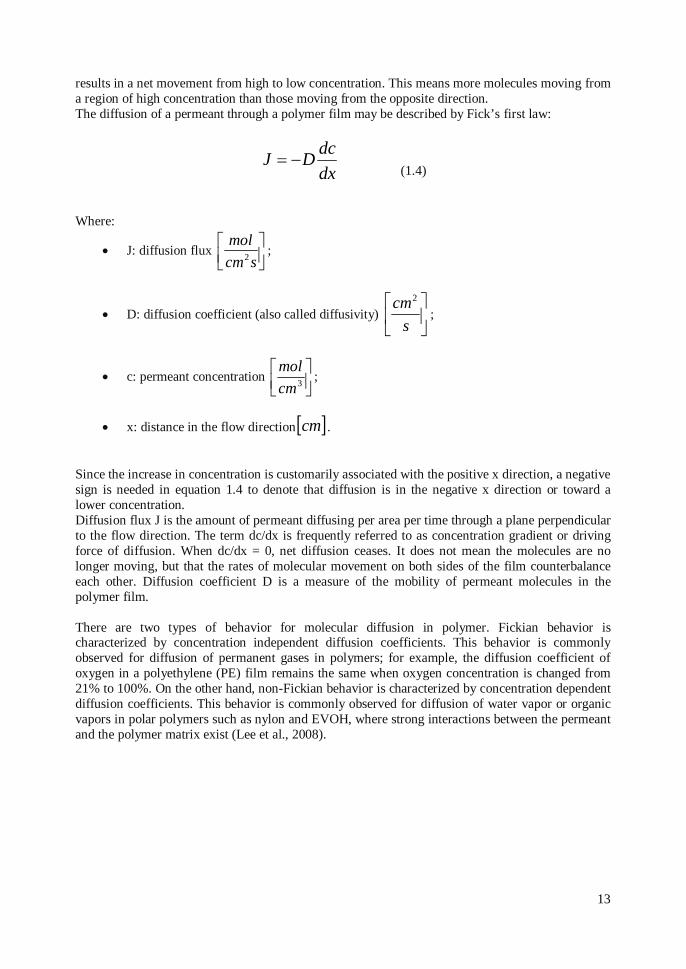
results in a net movement from high to low concentration. This means more molecules moving from a region of high concentration than those moving from the opposite direction. The diffusion of a permeant through a polymer film may be described by Fick’s first law:
dxdcDJ
(1.4)
Where:
J: diffusion flux
scmmol
2 ;
D: diffusion coefficient (also called diffusivity)
s
cm2
;
c: permeant concentration
3cmmol
;
x: distance in the flow direction cm .
Since the increase in concentration is customarily associated with the positive x direction, a negative sign is needed in equation 1.4 to denote that diffusion is in the negative x direction or toward a lower concentration. Diffusion flux J is the amount of permeant diffusing per area per time through a plane perpendicular to the flow direction. The term dc/dx is frequently referred to as concentration gradient or driving force of diffusion. When dc/dx = 0, net diffusion ceases. It does not mean the molecules are no longer moving, but that the rates of molecular movement on both sides of the film counterbalance each other. Diffusion coefficient D is a measure of the mobility of permeant molecules in the polymer film. There are two types of behavior for molecular diffusion in polymer. Fickian behavior is characterized by concentration independent diffusion coefficients. This behavior is commonly observed for diffusion of permanent gases in polymers; for example, the diffusion coefficient of oxygen in a polyethylene (PE) film remains the same when oxygen concentration is changed from 21% to 100%. On the other hand, non-Fickian behavior is characterized by concentration dependent diffusion coefficients. This behavior is commonly observed for diffusion of water vapor or organic vapors in polar polymers such as nylon and EVOH, where strong interactions between the permeant and the polymer matrix exist (Lee et al., 2008).

14
1.4.4 Adsorption and desorption of permeant Adsorption and desorption are related to the solution or sorption behavior of the permeant molecules in the polymer film, which is governed by the relative strengths of interactions between permeant/permeant, permeant/polymer, polymer/polymer. The simplest or 'ideal' sorption isotherm is expressed by Henry's law:
Spcs (1.5)
Where:
cs: permeant concentration at the solid phase film surface
3cmmol
;
p: partial pressure of permeant atm ;
S: solubility coefficient
atmcmmol
3 .
If the solubility coefficient S is concentration independent, then equation 1.5 expresses a linear relationship. This ideal behavior is applicable to the adsorption and desorption of permanent gases at atmospheric pressure, where the permeant/permeant and permeant/polymer interactions are weak compared to the polymer/polymer interactions. Henry's Law provides a convenient means for estimating cs once p and S are known. It is difficult to measure the permeant concentration at the film surface (cs), but it is relatively easy to measure the permeant partial pressure (p) using a gas chromatograph or a portable gas analyzer (Lee et al., 2008). 1.4.5 Permeation rate The individual steps of adsorption, diffusion, and desorption in the permeation mechanism may be integrated using the principle of mass balance because permeation involves the transport of mass (i.e., permeant molecules) from one place to another. By applying the mass balance, along with Fick's First Law and Henry's Law, useful equations may be obtained to guide the design of food packages. A useful equation to describe the permeation rate at steady state (no permeant accumulation in the film) is:
pL
AKPQ
(1.6)
Where: Q: permeation rate at steady state;
KP: permeability, defined as the product of diffusion coefficient and solubility coefficient;
A: surface area of the film;

15
L: thickness of the film;
p: partial pressure difference on the sides of the film.
The permeation rate equation describes the permeation rate as a function of package and environmental variables. The package variables include permeability KP and packaging dimensions (A and L). The environmental variables include p. Temperature and relative humidity are implicitly included in permeability. KP is also function of temperature (Lee et al., 2008). 1.4.6 Water Vapour Transmission Rate The primary quality deterioration factor of moisture depending products is the absorption of moisture. The essential packaging function required for these products is to slow down significantly the transfer of water vapor from the outside to the inside of the packaging. To reduce the weight loss, to maintain optimal structure of foods and to limit the increase of water activity that may lead to undesirables reactions the moisture exchanges have to be minimized (Labuza, 1968). The protection of the package against the moisture transfer depends, besides the barrier properties of the materials used, also on the integrity of the package and on the seal strength and sealing systems. There are several factors that can influence the permeation of gases or vapors. Some are intrinsic, such as the chemical nature of the material, other extrinsic, such as environmental conditions. Among these temperature is the factor that, maintaining constant the thickness, the surface area available to diffusion and the driving force, has the most influence on the permeation phenomena. The permeability (KP) dependence towards temperature (Paine & Paine, 1992) is of exponential type, as described by the Arrhenius equation:
RTEa
eKPKP
0 (1.7)
Where:
KP: permeability constant. Defined as quantity of gas permeating through a unit thickness of a unit surface area in the unit of time for the effect of a unit difference of pressure
kPahmmg
242
;
KP0: pre-exponential constant. Represents KP at infinite temperature
kPahmmg
242
;
Ea: permeation activation energy. Given by the sum of the diffusion activation energy and
the heat of dissolution for the coefficient of solubility
mol
J;

16
R: universal gas constant
molKJ314.8 ;
T: absolute temperature K . The temperature influence in a water vapor permeability measure is more complex than the permeability measure to permanent gases such as atmospheric O2, N2, and CO2. In the case of water vapor a temperature increase changes the diffusivity and solubility of the permeated matrix but also increases the driving force of the permeation (Fava, 1996). This temperature dependence is significant and it is an exponential type relation, described by the Clausius Clapeyron equation:
*11exp*
TTRH
pWVP evap
(1.8)
Where:
WVP: water vapour permeation
kPahmmg
242
;
p *: vapour pressure of water at the triple point Pa ;
T *: temperature of water at the triple point K ;
ΔHevap: molar enthalpy of vaporization;
R: universal gas constant
molKJ314.8 ;
T: absolute temperature K . In literature it is more common to find tables that show the values of vapour pressure at different temperatures rather than the integrated form of this equation. A further complication that occurs in packaging materials is that the inverse proportionality between the permeability and thickness is not always verified. Therefore the difference in vapour pressure and the thickness are not considered in the calculation of the permeability but are referred as measurement conditions. This leads to the definition of a new property defined, in the case of water vapor transmission, as Water Vapor Transmission Rate (WVTR). This new property defines the quantity of water vapour permeating through a unit surface area of given thickness at specific conditions of temperature and relative humidity on both sides of the material, in unit time. Its units are therefore (ASTM, 1994):
hmg
242

17
In literature WVTR values measured in tropical conditions are available, determined at 38°C and 90% RH. In these conditions the driving force of the phenomena is 5.96 kPa (44.7 mHg). The knowledge of the water vapour transmission rate of flexible packaging materials is essential to predict the shelf life of moisture sensitive products (Labuza,1982; De Leiris, 1986). 1.5 Shelf life Shelf life is defined as the period of time during which a food retains acceptable characteristics of flavor, color, aroma, texture, nutritional value, and safety under defined environmental conditions. It is also encompasses the time during which a product may reasonably be expected to meet its label claims for specific attributes (Lee et al., 2008). Establishing the shelf life of many food products can be expensive and time-consuming. It is essentially a process of informed trial and error, and the only really effective way to establish shelf life is to keep the product under typical storage conditions until spoilage occurs. In most real life situations of new product introductions or existing product changes, time limitations in research and development preclude from conducting shelf life testing. In practice, different approaches can be utilized for shelf life estimation but real shelf life tests and accelerated shelf life testing are the common way to define the expiration date of a food product. However there are models that can be used to save a significant amount of time and expenses helping to predict what the shelf life will be. Used correctly, these models allow to reduced product development times and costs, with a lower time to market. 1.5.1 Shelf life testing Shelf life testing is classic technique of prediction. It consists in monitoring the changes in quality during the supply chain, real or simulated, in order to identify the attributes of interest, to identify the primary events of degradation and the measures to be taken to counter them. In the case of products in which the primary degradation event is the exchange of moisture with the environment, this technique requires the storage of the product packages in different temperature and moisture situations for long periods of time to simulate the real conditions of storage. This method has the advantage that it reproduces faithfully the conditions of storage obtaining reliable results, but it has two drawbacks: long execution times (for some products it may take up to ten or twelve months), and the immobilization of a large amount of references. To determine the value at which corresponds the end of the shelf life of a product it is important to perform product sensory tests at different conservation times during the storage. These tests have to be done by a panel of expert and trained tasters. A comparison of the overall evaluation of these tests with the analytical parameters measured will allow defining the shelf life. This approach is known as the "Profile Attribute Analysis". It consists in giving votes to the different attributes based on numerical scales and to report them into a column to form a path defined as the "profile". The evaluation of the same attributes over time allows the panel to define the degradation of the various attributes considered that are influenced by the combined effect of the environmental and natural aging. The reach of limit values for the attributes defines the shelf life standards and the recommended maximum consumption limit (Robertson, 1993). 1.5.2 Accelerated shelf life testing During the development a new product one of the aspects that most delay the process is the need to wait the results of shelf life test carried out on the samples.

18
One technique that can improve this part of the development is based on the laws of chemical kinetics that correlate the rate of a reaction with the temperature at which it takes place. Storage at more severe conditions that the real ones can be used, such as higher temperatures, higher relative humidity or exposure to light (Labuza & Schmidl, 1985). This method is useful only if the accelerating factor introduced by the conditions of accelerated aging is known exactly. The shelf life is extrapolated through a mathematical model, provided that the factor responsible for decay acceleration, introduced with the critical conditions, is well known. Results obtained with these approaches refer only to the particular product studied in its package, so the tests are not much flexible. 1.5.3 Shelf life models As an alternative to these methods, the optimal packaging solution can be determined by means of mathematical models of prediction, in which all the variables associated to the product, the package and the ambient conditions are considered. This approach allows more flexibility, since different packaging solutions can be tested in short times (Fava et al., 2000). Shelf life models are mathematical equations which describe the relationship between food, package, and environment. The first study dealing with prediction models dates back to the fifties (Heiss, 1958), Shelf life models are useful to predict the shelf life of food, to design food packages, and to provide useful insights. The accuracy with which these relationships are measured influences the reliability of the models. It is also necessary to know the relationships among the variables that play a significant role in defining food quality. 1.5.3.1 Temperature depending models The most diffuse shelf life predictive models are based on the knowledge of food temperature exposure. Temperature is the characteristic of the distribution environment that has the greatest impact on the storage life and safety of fresh perishables. Effective temperature management is in fact, the most important and simplest procedure for delaying product deterioration (Nunes et al., 2006). One very common approach is to describe the quality decay according to the law of Arrhenius for reaction kinetics. The change in shelf life or loss per day is calculated as a function of temperature (Jedermann et al., 2006). For many food products, a chain of chemical or enzymatic processes contribute to a loss of quality. The approximation by one or two Arrhenius functions does not always deliver the required accuracy. For a precise prediction the time function of several quality factors like color, firmness, mould and C vitamin content, have to be estimated. Because it is not possible to know in advance which of the curves will be the most critical one, all of them have to be continuously calculated and monitored. Descriptions of the underlying chemical reactions by a set of differential equations are only known for a minority of products. In many cases only tables for different constant temperatures are available, listing the change of physical properties over time. To extract a set of differential equations from these measurements requires expert chemical knowledge that is in general not available. The suggested table-shift approach provides a prediction for dynamic temperature condition based on curves recorded at constant temperatures. The value of each physical property for the next step is read out from the pre-measured table. If the temperature changes, the focus in the table is shifted to the row that matches the current quality inside the column for the new temperature. In the mathematical description the change of a physical property is calculated as a two dimensional interpolation over the parameters temperature and current property state. The table-shift approach provides a method for a direct calculation of the shelf life based on a set of measured

19
reference curves. The accuracy of this approach has to be validated for new product types by comparison of simulated curves for dynamic temperature conditions with measured data (Jedermann et al., 2007). 1.5.3.2 Moisture depending models Many chemical, biological, and physical changes are dependent on moisture content or water activity in foods, whose changes may be dictated by the packaging protection from the environment in the distribution channel. Many authors proposed different mathematical models in which the moisture sensitivity of the food and the package performances were combined differently (Iglesias et al., 1979; Labuza & Contreras-Medellin, 1981; Tubert & Iglesias, 1985; Del Nobile et al., 2003). The simulation models are theoretically based on the relationship between moisture uptake of food product, storage environment and barrier property of packaging material (Hernandez & Giacin 1997; Azanha & Faria 2005). Water activity is ruled by the moisture content in the food, which may change with time through the permeation process of water vapor across the packaging film. The equilibrium relationship between moisture content and water activity is explained by the sorption/desorption isotherm, which is obtained mostly by the experiments determining moisture contents of the food samples equilibrated under different relative humidity conditions. Moisture sorption isotherms of food products are useful to determine their storage stability as well as to predict their shelf-life since they give information about the equilibrium relationship between product moisture content and water activity, at a given temperature and relative humidity (Palou et al., 1997; Vijayalakshmi, 2005; Togrul & Arslan, 2007). Since foods are complex in nature, mostly multicomponent and multiphase systems with internal intricate structure, the equilibrium moisture sorption isotherms are an intrinsic property of the material. In Figure 1.3 is shown the isotherm classification of Brunauer et al. (1945).

20
Figure 1.3: isotherm classification.
Classification of moisture sorption isotherm (Brunauer et al., 1945).
A: type I, anticaking agents; B: type II, most foods; C: type III, crystalline substances.
Foods show essentially two different types of isotherms, the sigmoid type typical of most foods, including low moisture foods, and the gradually increasing type, less frequently seen (Lewicki, 1998). These are type II and III isotherms according to the classification of Brunauer et al. (1940). Determination of the optimal equation to fit the experimental isotherm data is crucial for representing the relationship between the equilibrium and water activity of food products. The major considerations in equation selection are food characteristics, simplicity and suitability for application over the range of water activity of interest (Hayoglu & Gamli, 2007). The most widely used equations used to express the equilibrium relationship by mathematical forms are the ones developed by Smith, Halsey, Henderson, Oswin, Inglesias, and Chirife (Lee et al., 2008). These equations are used in forecast models to determine the shelf life of moisture depending products. Moisture depending shelf life models are based on two main hypotheses: the water vapour present in the headspace of the packaging (which changes with the entrance of water vapour from the outside) is always immediately in equilibrium with the product and the water vapour present in the package headspace behaves as an ideal gas (Quast & Karel, 1972; Bell & Labuza, 2000). The first condition that states the immediate equilibrium of the water vapour has not been verified experimentally and is based on theoretical considerations (Fava et al., 2000).

21
1.6 References ASTM, E398-88, Water Vapour Transmission Rate of Sheet Materials using a Rapid Technique for Dynamic Measurements. American Society for Testing and Materials, 1994. Azanha AB, Faria, JAF, 2005, Use of mathematical models for estimating the shelf life of cornflakes in flexible packaging. Packag Technol Sci 18:171-178. Bell LN, Labuza TP. Moisture sorption: practical aspects of sorption isotherm measurements and use. AACC Egan Press, 2nd Edition, 2000. Branauer S. The adsorption of gases and Vapors. Vol. I. Physical Adsorption. Princeton University Press, 1945. Chung DH et al., 2003, A model to evaluate transport of gas and vapors throungh leaks. Pakaging Packag Technol Sci 16:77-86. Cladman W et al., 1998, Shelf-life of milk packaged in plastic containers with and without treatment to reduce light transmission. Int Dairy J 8:629-636. De Leiris JP. Water activity and permeability. In Food Packaging and Preservation: Theory and Practice, Mathlouthi M, eds., Applied Science Publishers LTD, 1986, pp.213-233. Del Nobile MA et al., 2003, Shelf life prediction of cereal based dry foods pace in moisture sensitive films. J Food Sci 68:1292-1300. Fava P et al., 2000, Shelf-life modelling of moisture sensitive food products. Ind Aliment-Italy 32:121-128. Fava P, 1996. Permeabilità dei materiali e qualità degli alimenti confezionati. Rassegna dell’imballaggio, 3:10. Hayoglu I, Gamli OF, 2007. Water sorption isotherm of pistachio nut paste. Int J Food Sci Tech 42:224-227. Heiss R, 1958, Shelf life determination. Mod Pack 31:119-124. Hernandez RJ, Giacin JR. Factor affecting permeation, sorption and migration processes in packaged-product systems. In Food Storage Stability, Taub IA, Singh RP, eds., CRC Press, 1997, pp. 269-330. Iglesias HA et al., 1979, Technical note: a technique for predicting moisture transfer in mixtures of packaged dehydrated foods. J Food Sci 14:89-93. Jedermann R. Linking keeping quality models and sensor systems to an autonomous transport supervision system to an autonomous transport supervision system. In Cold Chain Management, Proceedings of the 2nd international Workshop, Kreyenschmidt J, Petersen B, eds., Bonn Germany, 2006, pp. 3-18. Jedermann R et al. Shelf life prediction by intelligent RFiD. Technical limits of model accuracy. In: Dynamics in Logistics, Kreowski HG, Scholz-Reiter B, Haasis HD, eds., Springer 2007, pp. 231-238.

22
Labuza TP, Contreras-Medellin R, 1981, Prediction of moisture protection requirements for foods. Cereal Food World 26:335-343. Labuza TP, 1968, Sorption phenomena in foods. Food Technol-Chicago 22:263-272. Labuza TP. Shelf-life Dating of Foods. Food & Nutrition Press, 1982. Labuza TP, Schmidl MK, 1985, Accelerated shelf life testing of foods. Food Technol-Chicago 39:57-62. Lee DD et al. Food Packaging, Science and Technology. CRC Press, 2008. Lewicki PP, 1998, A three parameter equation for food moisture sorption isotherms. J Food Process Eng 21:127-144. Masi P, 1996, Packaging e shelf life degli alimenti. Rassegna dell’imballaggio 19:20. Nunes MCN et al. 2006, Effects of in-store conditions on the quality of fresh fruits and vegetables. Research report to Publix Super Markets Inc. Food Science and Human Nutrition, University of Florida, USA. Paine FA, Paine HY. A Handbook of Food Packaging. Blackie Academic & Professional, 1992. Palou E et al., 1997, Effect of temperature on the moisture sorption isotherms of some cookies and corn snacks. J Food Eng 31:85-93. Peri C. Le operazioni fondamentali della tecnologia alimentare. Vol.II. Operazioni di conservazione, C.U.S.L. Milano, 1996. Piergiovanni L, Tecnologia del condizionamento dei prodotti agroalimentari. DiSTAM, Università degli Studi di Milano 2002. Quast DG, Karel M, 1972, Computer simulation of storage life of foods undergoing spoilage by two interacting mechanisms. J Food Sci 37:679-83. Robertson GL. Food Packaging. Principles and Practice. Marcel Dekker Inc, 1993. Rockland LB, Nishi SK, 1980, Influence of water activity on food product quality and stability. Food Technol-Chicago 34:42-59. Saguy I, Karel M, 1980, Modelling quality deterioration during food processing and storage. Food Technol-Chicago 34:78-85. Singh RP, Anderson BA. The major types of food spoilage. In Understanding and Measuring the Shelf Life of Food, Steele R, eds., Woodhead Publishing, 2004, pp. 3-23. Spiegel A. Shelf Life Testing. In Plastics in Food Packaging. Properties, Design and Fabrication, Brown WE, eds. Marcel Dekker inc., 1992, pp. 362-378. Togrul H, Arslan N, 2007, Moisture sorption isotherms and thermodynamic proprieties of walnut kernels. J Stored Prod Res 43:252-264.

23
Tubert AH, Iglesias HA, 1985, Water sorption isotherms and prediction of moisture gain during storage of packaged cereal crackers. Lebensm Wiss Technol 19:365-368. Vijayalakshmi NS et al., 2005, Extension of the shelf life of Brufi by packaging. J Food Quality 28:121-136.

24

25
2 Aim of the research The aim of this PhD thesis is the study of innovative approaches and instruments to model and monitor the shelf life of packaged perishable foods. The crucial part of this work is to verify the theoretical assumption of immediate equilibrium assumed by moisture depending prediction models. This assumption states that the relative moisture of the headspace of the packaging (which changes with the entrance of water vapour from the outside) is immediately in equilibrium with the product (Quast & Karel, 1972; Bell & Labuza, 2000; Fava et al., 2000). To achieve this result it is necessary to develop and build an acquisition system based on sensors, a recording unit and specific software to collect data on physical indexes of food quality for defined products, and to measure them. This system has to be tested on different products and packages in order to define the proper materials and working conditions to define the experimental plan and the system settings. Furthermore, the model system has to be used to study how different quantities of product, different headspace volumes, and different packaging solutions influence the equilibrium between the relative humidity of the headspace and of the product and how these differences influences the shelf life prediction. On the basis of the collected data, existing shelf life prediction models must be verified and, if needed, modified in order to predict the shelf life of products. A subsequent part of the work will consider the possibility to simplify the shelf life prediction for a category of products applying a unique shelf life model for all the products that are part of the category. 2.1 References Bell LN, Labuza TP. Moisture sorption: practical aspects of sorption isotherm measurements and use. AACC Egan Press, 2nd Edition, 2000. Fava P et al., 2000, Shelf-life modelling of moisture sensitive food products. Ind Aliment-Italy 32:121-128. Quast DG, Karel M, 1972, Computer simulation of storage life of foods undergoing spoilage by two interacting mechanisms. J Food Sci 37:679-683.

26

27
3 Materials and methods 3.1 Materials 3.1.1 Apple rings Organic apples cv ‘Golden Delicious’ grown at the Research Centre for Agriculture and Forestry (Laimburg, BZ, Italy) were used for the shelf life study. Apples were washed, wiped dry and cored by a spoon soil auger (25.0 mm diameter) and they were mechanically cut into 5.0 mm thick rings (LT INOX, Kronen, Germany). Immediately after cutting the apple rings were air dried. Air drying was performed at 82°C, up to constant weight, using an alternate upward-downward air circulated drier (ThermoLab, Lodi, Italy), operating at an air speed of 1.5 ms-1, with a load of 2.7 kgm-2. The equilibrium weight (i.e. the constant weight) was achieved when the difference in weight was less than 1 mg/g solids after 30 additional minutes of drying.
Figure 3.1: dried apple rings.
The apples had a starting moisture content expressed as grams of water content in the product for grams of dry basis of 84.47 g H2O/g db and a water activity of 0.99. At the end of the air drying process the moisture content was of 2.78 g H2O/g db and the water activity of 0.125 (Gobbi, 2009). In Table 3.1 are reported the air drying time and the percentage weight loss of the apple rings during the air drying.

28
Table 3.1: apple rings weight loss during air drying.
Time [min] Weight [%]
0.01 100
60 22.568
90 17.096
120 16.106
150 15.832
180 15.743
210 15.687
240 15.658
270 15.626
300 15.626
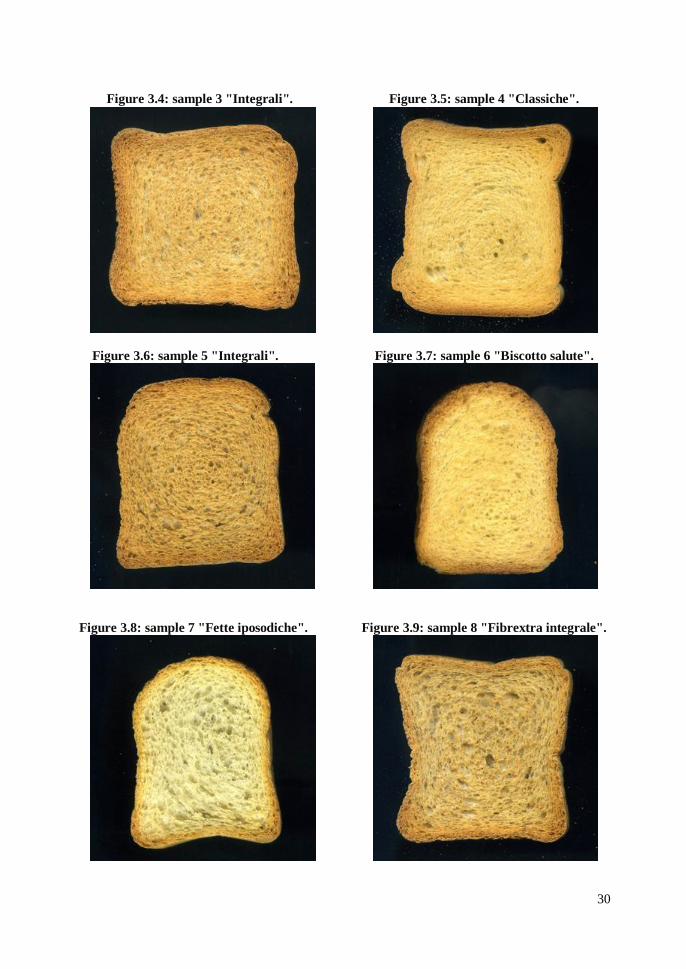
3.1.2 “Fetta biscottata” “Fetta biscottata”, a typical Italian bakery product, has been chosen for the present work because of its regular shape and geometry, and the uniformity among different packages. The acceptable maximum moisture content for the consumption has been set at a relative humidity (RH) of 40%. 14 different types and brands of “Fetta biscottata” have been bought in different supermarkets in the city of Milano. In Table 3.2 are reported the codes assigned to each of the 14 types of “Fetta biscottata” (Figure 3.2 to Figure 3.15) and the commercial descriptions. In Table 3.3 and Figure 3.16 are reported the nutritional values of the samples declared by the producer.

29
Table 3.2: codes and commercial descriptions of “Fetta biscottata”.
Sample number Commercial description
1 Dorate
2 Cereali
3 Integrali
4 Classiche
5 Integrali
6 Biscotto salute
7 Fette iposodiche
8 Fibrextra integrale
9 Malto d'orzo
10 Grano saraceno
11 0,02% sodio
12 Classiche
13 Integrali
14 Integrali
Figure 3.2: sample 1 "Dorate". Figure 3.3: sample 2 "Cereali".
30
Figure 3.4: sample 3 "Integrali". Figure 3.5: sample 4 "Classiche".
Figure 3.6: sample 5 "Integrali". Figure 3.7: sample 6 "Biscotto salute".
Figure 3.8: sample 7 "Fette iposodiche". Figure 3.9: sample 8 "Fibrextra integrale".

31
Figure 3.10: sample 9 "Malto d'orzo". Figure 3.11: sample 10 "Grano saraceno".
Figure 3.12: sample 11 "0,02% sodio". Figure 3.13: sample 12 "Classiche".
Figure 3.14: sample 13 "Integrali". Figure 3.15: sample 14 "Integrali".

32
Table 3.3: nutritional values of the samples declared by the producer for “Fetta biscottata”.
Sample Protein [g/100g]
Sugar [g/100g]
Total fat [g/100g]
Saturated fat [g/100g]
Dietary fiber
[g/100g]
Sodium [g/100g]
Energetic value
[kJ/100g]
Carbohydrate [g/100g]
Sample 1 "Dorate" 11.5 6.8 5 2.3 4.5 0.65 1675 74
Sample 2 "Cereali" 11.5 6 5.5 2.8 4.5 0.7 1679 73.2
Sample 3 "Integrali" 12 5 6 2.7 7 0.55 1667 69.7
Sample 4 "Classiche" 11.1 5 5.3 2.6 3 0.6 1713 76.7
Sample 5 "Integrali" 13 4.5 5.8 2.4 7.5 0.6 1587 67.7
Sample 6 "Biscotto salute" 7.8 18 11.7 5 2.8 0.15 1854 74.5
Sample 7 "Fette iposodiche" 17 2.8 5.5 0.95 6 0.02 1635 67.2
Sample 8 "Fibrextra integrale" 13 7 4.6 1.7 10 0.5 1602 66.5
Sample 9 "Malto d'orzo" 11 11 6.2 3.3 4.5 0.45 1717 74.4
Sample 10 "Grano saraceno" 12 3 5 2.3 11 0.6 1611 66.7
Sample 11 "0,02% sodio" 11 5 5.5 2.5 5.5 0.02 1676 73
Sample 12 "Classiche" 11 8 6 2.8 6 0.3 1642 72.5
Sample 13 "Integrali" 12 7 6 2.8 8.5 0.5 1582 68
Sample 14 "Integrali" 12.3 6 5.7 2 7.2 0.4 1602 69.5

33
0
2
4
6
8
10
12
14
16
18
20
Protein [g/100g] Sugar [g/100g] Total fat [g/100g] Saturated fat [g/100g]
Dietary fiber [g/100g]
Sodium [g/100g]
[g]
Figure 3.16: nutritional values of the samples declared by the producer for fetta biscottata.
Sample 1 "Dorate"
Sample 2 "Cereali"
Sample 3 "Integrali"
Sample 4 "Classiche"
Sample 5 "Integrali"
Sample 6 "Biscotto Salute"
Sample 7 "Fette Iposodiche"
Sample 8 "Fibrextra integrale"
Sample 9 "Malto d'orzo"
Sample 10 "Grano saraceno"
Sample 11 "0,02% sodio"
Sample 12 "Classiche"
Sample 13 "Integrali"
Sample 14 "Integrali"

34
3.1.3 Packaging materials OPP film produced by Moplefan, the thickness was 20 µm with a water vapour transmission rate of 2.505 ± 0.035 g m-2 24h-1 at 25°C and 90%RH. Rigid EPS trays produced by Sirap Gema (Italy). 2 different volumes were selected: 1400 and 1030 cm3. Rigid EPS trays sealed with an OPP film have been used as a model package system. 3.1.4 Acquisition system To monitor and record the relative humidity values an acquisition system has been developed and built in collaboration RDE Company srl (Novate Milanese, Milano). The system was composed by:
personal computer (ASUS, Taiwan); specific software application based on National Instruments LabVIEW 8 (Austin, TX,
USA) to collect and record measured values; data acquisition module by National Instruments NI USB-6211, with USB power
supply and data connection and 16 analogical acquisition channels (16-bit, 250 kS/s); 15 sensors model HIH 4000-001 Series Integrated Circuity Humidity Sensor by
Honeywell (Morristown, NJ, USA); plastic boxes (Piazza, Crusinallo, VB, Italy) with a capacity of 8 liters with an
hermetic lid. Each box was equipped with a terminal to connect the sensors and a fan (Multicomp, Montfoort, Benelux) with a power supply of 5V e 0.07A to stir the air inside the box.
The sensors model HIH 4000-001 Series Integrated Circuity Humidity Sensor by Honeywell had the following characteristics:
precision: ± 3.5% RH; temperature range relative: from -40°C to 85°C; relative humidity range: from 0% to 100%; linearity: ± 5% RH from 0 to 60% RH and ±8% RH from 60% to 100% RH; stability: ± 0.2% RH in 12 months at 50% RH; hysteresis: maximum ± 3% RH.

35
Figure 3.17: acquisition system layout.
Figure 3.18: box equipped with sensors and fan.

36
Figure 3.19: Acquisition system in working conditions.
Data acquisition module by National Instruments
Boxes equipped with sensors
Wires
Personal computer
Thermostatic cell 25±0.5°C
37
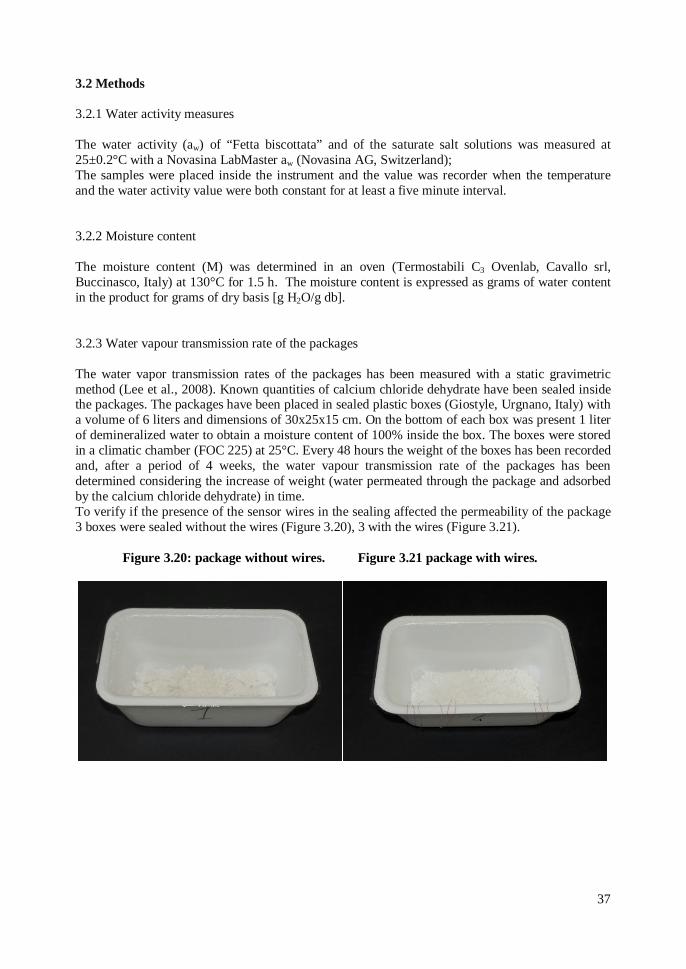
3.2 Methods 3.2.1 Water activity measures The water activity (aw) of “Fetta biscottata” and of the saturate salt solutions was measured at 25±0.2°C with a Novasina LabMaster aw (Novasina AG, Switzerland); The samples were placed inside the instrument and the value was recorder when the temperature and the water activity value were both constant for at least a five minute interval. 3.2.2 Moisture content The moisture content (M) was determined in an oven (Termostabili C3 Ovenlab, Cavallo srl, Buccinasco, Italy) at 130°C for 1.5 h. The moisture content is expressed as grams of water content in the product for grams of dry basis [g H2O/g db]. 3.2.3 Water vapour transmission rate of the packages The water vapor transmission rates of the packages has been measured with a static gravimetric method (Lee et al., 2008). Known quantities of calcium chloride dehydrate have been sealed inside the packages. The packages have been placed in sealed plastic boxes (Giostyle, Urgnano, Italy) with a volume of 6 liters and dimensions of 30x25x15 cm. On the bottom of each box was present 1 liter of demineralized water to obtain a moisture content of 100% inside the box. The boxes were stored in a climatic chamber (FOC 225) at 25°C. Every 48 hours the weight of the boxes has been recorded and, after a period of 4 weeks, the water vapour transmission rate of the packages has been determined considering the increase of weight (water permeated through the package and adsorbed by the calcium chloride dehydrate) in time. To verify if the presence of the sensor wires in the sealing affected the permeability of the package 3 boxes were sealed without the wires (Figure 3.20), 3 with the wires (Figure 3.21).
Figure 3.20: package without wires. Figure 3.21 package with wires.

38
3.2.4 Shelf life testing Shelf life tests have been carried out at the PackLab at DISTAM (Università degli Studi di Milano, Via Celoria 2, Milano, Italy). The packages have been placed in sealed plastic boxes (Giostyle, Urgnano, Italy) with a volume of 6 liters and dimensions of 30x25x15 cm. On the bottom of each box was present 1 liter of demineralized water to obtain a moisture content of 100% inside the box. The boxes were stored in a climatic chamber (FOC 225) at 25°C. 3.2.5 Sorption isotherms determination Water vapour sorption isotherms were determined according to the static, gravimetric method developed by COST-90 Project, and reported by Wolf et al. (1985). The principles were described by Bell and Labuza (2000). “Fetta biscottata” were placed in sealed plastic boxes (Giostyle, Urgnano, Italy) with a volume of 6 liters and dimensions of 30x25x15cm. 3 “Fetta biscottata” were placed in each box containing saturated salt solutions and stored in a climatic chamber (FOC 225) at 25°C. The water activity (aw) of these solutions was in the range of 0.114-0.841. Salt used and their water activity value at saturation are shown in Table 3.4.
Table 3.4: inorganic salts used to prepare the saturated solutions and corresponding water activity at 25°C.
Salt aw
Lithium chloride anhydrous 0.114
Potassium acetate 0.241
Magnesium chloride hexahydrate 0.331
Potassium carbonate anhydrous 0.438
Magnesium nitrate hexahydrate 0.529
Lithium acetate dihydrate 0.691
Sodium chloride 0.753
Potassium chloride 0.841
Samples were weighed every five days and the equilibrium was considered to be reached when the change in weight did not exceed 0.1% in 2 consecutive weightings at no less than five-day intervals (Biquet & Labuza, 1988). The equilibrium for “Fetta biscottata” was reached in twenty-five days.

39
The final moisture content of each sample was calculated with the formula:
100%100100
%
21
12
12
OHw
wOHwwM
gdb
OgH 2 (2.1)
Where: w1: initial product weight [g]; w2: final product weight [g]; %H2O: initial moisture content [g/100g] of the product on a wet basis; M: product moisture content, expressed as grams of water content in the product for grams
of dry basis [g H2O/g db]. The M values obtained experimentally were fitted with the following mathematical equations expressed as moisture content (M) as a function of water activity (aw). Table Curve 2D software was used.
bww aaaM
1)1( Oswin, 1946
)1ln( wabaM Smith, 1947
ba
aaMw
w
1
Iglesias-Chirife, 1978
bw
aaM
11ln
Henderson, 1952
b
waaM
1
ln
Halsey, 1948

40
3.2.6 Moisture sensor calibration The saturated salt solutions reported in table 3.5 have been selected to calibrate the moisture sensors. The relative humidity values at 25°C were found in literature (Bell and Labuza, 2000).
Table 3.5: inorganic salts solutions used to calibrate the moisture sensors.
°C % RH Salt solution
25 11.3±0.3 Lithium chloride anhydrous
25 22.5±0.3 Potassium acetate
25 32.8±0.2 Magnesium chloride hexahydrate
25 43.2±0.4 Potassium carbonate anhydrous
25 52.9±0.2 Magnesium nitrate hexahydrate
25 81±0.3 Ammonium sulfate
25 93.6±0.6 Potassium nitrate
25 97.3±0.5 Potassium sulphate
Calcium chloride dehydrate has also been used to obtain a relative humidity close to zero and demineralized water to obtain a relative humidity of 100%. The saturate salt solutions have been prepared according to references (Bell and Labuza, 2000) inside glass jars (Bormioli, Fidenza, PR, Italy) with a volume capacity of 0.25 liters. The jars have been closed hermetically with a sealed cap. The saturate salt solutions have been prepared at 25±0.5°C and maintained at the same temperature in thermostatic cells FOC 225.

41
Once obtained stable saturated salt solutions and verified the stability of the solutions in time, the water activity of the solutions has been measured with a Novasina LabMaster aw at 25±0.2°C. Obtained values are reported in table 3.6.
Table 3.6: water activity values of the saturated salt solutions.
aw Salt solution
0.018±0.001 Calcium chloride dehydrate
0.11±0 Lithium chloride anhydrous
0.219±0.0006 Potassium acetate
0.322±0 Magnesium chloride hexahydrate
0.434±0.0006 Potassium carbonate anhydrous
0.523±0 Magnesium nitrate hexahydrate
0.802±0.0006 Ammonium sulfate
0.931±0 Potassium nitrate
0.974±0.0006 Potassium sulphate
0.992±0.0006 Demineralized water
Obtained values have been multiplied by 100 to obtain the corresponding values of relative humidity.

42
For simplicity the RH values reported in table 3.7 have been used in the following discussion.
Table 3.7: values used for the discussion.
%RH Salt solution
0 Calcium chloride dehydrate
11 Lithium chloride anhydrous
23 Potassium acetate
32 Magnesium chloride hexahydrate
44 Potassium carbonate anhydrous
52 Magnesium nitrate hexahydrate
79 Ammonium sulfate
92 Potassium nitrate
97 Potassium sulphate
100 Demineralized water
Two calibrations have been done. One for the sensors designated to be placed inside the package to record humidity values from 5 to 60 %, and the second for the sensors designated to be placed inside the boxes to record humidity values from 95 to 100%. For the sensors designated to the packages have been used the following solutions: 0-11-23-32-44-52-79%. The sensors have been placed inside the headspace of the jar, using a specific and modified cap built especially for this reason (Figure 3.22 and 3.23).

43
Figure 3.22: cap with sensors for calibration.
Figure 3.23: jar with sensors in the headspace.

44
With specific software 16 sensors have been calibrated. The signal of each sensor (Volt output) has been recorded (Figure 3.24).
Figure 3.24: sensor calibration software.
For each sensor the values of voltage and time have been plotted (only the plot of the first sensor is reported for each salt solution).

45
Figure 3.25: signal of sensor # 1 (RH: 0%) – sampling: 15 minutes.
Figure 3.26: signal of sensor # 1 (RH: 11%) – sampling 1 minute.
0
0,5
1
1,5
2
2,5
3
0 200 400 600 800
Volta
ge [V
olt]
Time [min]
Sensor #1 - RH 0%
1,03
1,04
1,05
1,06
1,07
1,08
1,09
1,1
1,11
0 10 20 30 40 50 60 70 80
Volta
ge [V
olt]
Time [min]
Sensor #1 - RH 11%

46
Figure 3.27: signal of sensor # 1 (RH: 23 %) – sampling: 15 seconds.
Figure 3.28: signal of sensors # 1 (RH: 32%) – sampling: 1 minute.
1
1,05
1,1
1,15
1,2
1,25
1,3
1,35
1,4
1,45
1,5
0 20 40 60 80
Volta
ge [V
olt]
Time [min]
Sensor #1 - RH 23%
0,4
0,6
0,8
1
1,2
1,4
1,6
0 100 200 300 400 500 600 700 800
Volta
ge [V
olt]
Time [min]
Sensor #1 - RH 32%

47
Figure 3.29: signal of sensor # 1 (RH: 44%) – sampling 1 minute.
Figure 3.30: signal of sensor # 1 (RH: 52%) – sampling 1 minute.
0
0,2
0,4
0,6
0,8
1
1,2
1,4
1,6
1,8
2
0 20 40 60 80 100 120 140
Volta
ge [V
olt]
Time [min]
Sensor #1 - RH 44%
1,5
1,7
1,9
2,1
2,3
2,5
2,7
0 20 40 60 80
Volta
ge [V
olt]
Time [min]
Sensor #1 - RH 52%
48
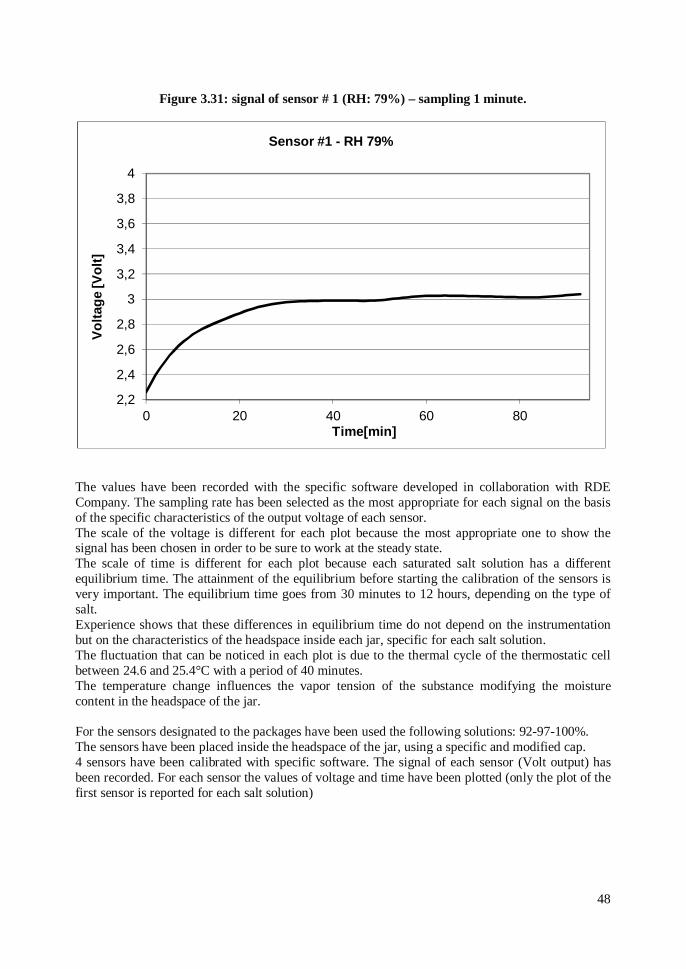
Figure 3.31: signal of sensor # 1 (RH: 79%) – sampling 1 minute.
The values have been recorded with the specific software developed in collaboration with RDE Company. The sampling rate has been selected as the most appropriate for each signal on the basis of the specific characteristics of the output voltage of each sensor. The scale of the voltage is different for each plot because the most appropriate one to show the signal has been chosen in order to be sure to work at the steady state. The scale of time is different for each plot because each saturated salt solution has a different equilibrium time. The attainment of the equilibrium before starting the calibration of the sensors is very important. The equilibrium time goes from 30 minutes to 12 hours, depending on the type of salt. Experience shows that these differences in equilibrium time do not depend on the instrumentation but on the characteristics of the headspace inside each jar, specific for each salt solution. The fluctuation that can be noticed in each plot is due to the thermal cycle of the thermostatic cell between 24.6 and 25.4°C with a period of 40 minutes. The temperature change influences the vapor tension of the substance modifying the moisture content in the headspace of the jar. For the sensors designated to the packages have been used the following solutions: 92-97-100%. The sensors have been placed inside the headspace of the jar, using a specific and modified cap. 4 sensors have been calibrated with specific software. The signal of each sensor (Volt output) has been recorded. For each sensor the values of voltage and time have been plotted (only the plot of the first sensor is reported for each salt solution)
2,2
2,4
2,6
2,8
3
3,2
3,4
3,6
3,8
4
0 20 40 60 80
Volta
ge [V
olt]
Time[min]
Sensor #1 - RH 79%

49
Figure 3.32: signal of sensor # 1 (RH: 92%) – sampling 30 seconds.
Figure 3.33: signal of sensor # 1 (RH: 97%) – sampling 30 seconds.
3,5
3,55
3,6
3,65
3,7
3,75
3,8
3,85
3,9
0 50 100 150
Volta
ge [V
olt]
Time [min]
Sensor #1 - RH 92%
3,8
3,82
3,84
3,86
3,88
3,9
0 10 20 30 40 50 60
Volta
ge [V
olt]
Time [min]
Sensor #1 - RH 97%
50
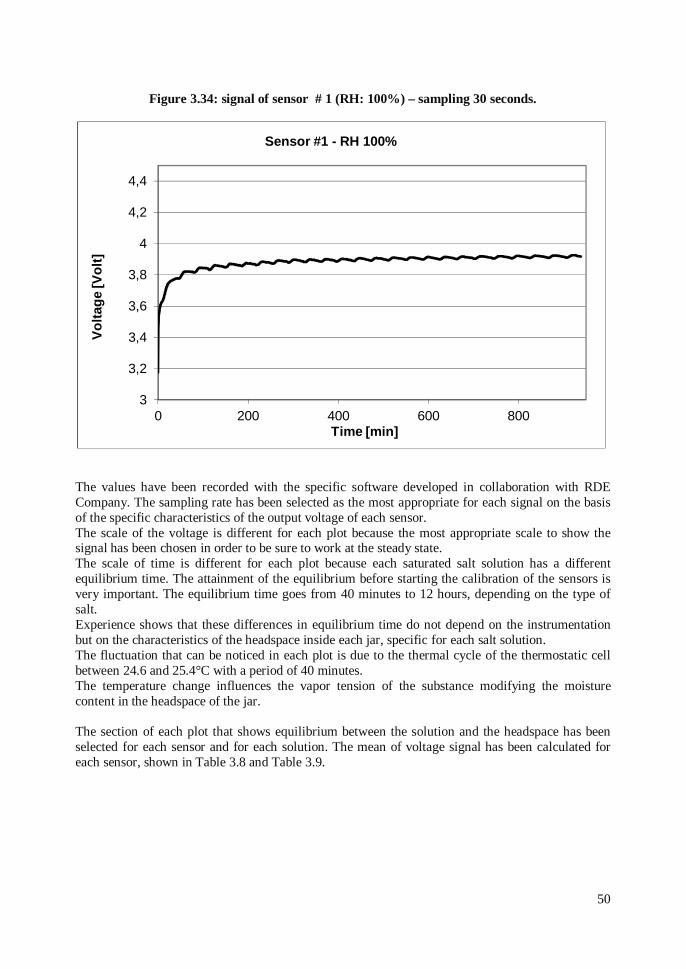
Figure 3.34: signal of sensor # 1 (RH: 100%) – sampling 30 seconds.
The values have been recorded with the specific software developed in collaboration with RDE Company. The sampling rate has been selected as the most appropriate for each signal on the basis of the specific characteristics of the output voltage of each sensor. The scale of the voltage is different for each plot because the most appropriate scale to show the signal has been chosen in order to be sure to work at the steady state. The scale of time is different for each plot because each saturated salt solution has a different equilibrium time. The attainment of the equilibrium before starting the calibration of the sensors is very important. The equilibrium time goes from 40 minutes to 12 hours, depending on the type of salt. Experience shows that these differences in equilibrium time do not depend on the instrumentation but on the characteristics of the headspace inside each jar, specific for each salt solution. The fluctuation that can be noticed in each plot is due to the thermal cycle of the thermostatic cell between 24.6 and 25.4°C with a period of 40 minutes. The temperature change influences the vapor tension of the substance modifying the moisture content in the headspace of the jar. The section of each plot that shows equilibrium between the solution and the headspace has been selected for each sensor and for each solution. The mean of voltage signal has been calculated for each sensor, shown in Table 3.8 and Table 3.9.
3
3,2
3,4
3,6
3,8
4
4,2
4,4
0 200 400 600 800
Volta
ge [V
olt]
Time [min]
Sensor #1 - RH 100%

51
Table 3.8: mean output voltage for package sensors.
RH [%] S1 [Volt] S2 [Volt] S3 [Volt] S4 [Volt] S5 [Volt] S6 [Volt] S7 [Volt] S8 [Volt]
1.8 0.718816 0.719017368 0.719013158 0.719008316 0.718997632 0.718978263 0.718853737 0.718851
11 1.045402594 1.045404783 1.045404783 1.045404957 1.045408203 1.045410377 1.045405058 1.045397725
21.9 1.345308191 1.345311476 1.345312065 1.345313992 1.345318012 1.345321248 1.345315776 1.34530872
32.2 1.623418102 1.623418525 1.623418751 1.623419138 1.623419886 1.623420358 1.623419276 1.623417945
43.4 1.92932931 1.929329881 1.929330071 1.929330369 1.929331107 1.929331488 1.92933025 1.929328952
52.3 2.1845532 2.184555509 2.1845558 2.1845562 2.184556509 2.184557 2.184555782 2.1845544
80.2 3.022590179 3.022592692 3.022593256 3.022593692 3.022594385 3.022594564 3.022593462 3.022591231
RH [%] S9 [Volt] S10 [Volt] S11 [Volt] S12 [Volt] S13 [Volt] S14 [Volt] S15 [Volt] S16 [Volt]
1.8 0.718858579 0.718863474 0.718870737 0.718878474 0.718881895 0.718864684 0.718823526 0.718864421
11 1.045398 1.045399072 1.04539642 1.045397725 1.045399551 1.045400623 1.045402406 1.045402623
21.9 1.345309602 1.345308191 1.345304821 1.345305931 1.345307927 1.345308199 1.345308569 1.345308846
32.2 1.623417983 1.62341765 1.623416966 1.623417332 1.62341795 1.623418118 1.62341811 1.623418311
43.4 1.929329107 1.929328726 1.929328012 1.929328631 1.929329738 1.929329845 1.929329381 1.929329357
52.3 2.184554255 2.184553764 2.184552455 2.1845526 2.184553636 2.184553764 2.184553727 2.184553273
80.2 3.02259041 3.022589462 3.022588795 3.02258941 3.022590308 3.022591154 3.022590282 3.022589231

52
Table 3.9: mean output voltage for box sensors.
RH [%] S1 [Volt] S2 [Volt] S3 [Volt] S4 [Volt]
80.2 3.318915944 3.318916796 3.318933111 3.318932481
93.1 3.724968272 3.72497021 3.724985287 3.724983754
97.4 3.874623947 3.874625115 3.874640637 3.874637195
99.2 3.934676173 3.93468168 3.934697157 3.934693292
For each sensor all the points Voltage/Humidity have been considered, as reported in Figure 2.35 and 2.36 (only the plot of the first sensor of the package and the first of the boxes is reported).
Figure 3.35: signal of sensor # 1 – package.
00,5
11,5
22,5
33,5
0 20 40 60 80 100
Volta
ge [V
olt]
Relative humidity [%]
Sensor #1 - Package

53
Figure 3.36: signal of sensor # 1 – boxes.
Experimental points have been interpolated. Coefficients m and q have been reported in Table 3.10 and 3.11.
3,23,33,43,53,63,73,83,9
4
75 80 85 90 95 100
Volta
ge [V
olt]
Relative humidity [%]
Sensor #1 - Box

54
Table 3.10: package sensors m and q coefficients.
Coefficient S1 S2 S3 S4 S5 S6 S7 S8
m1 28.17017037 28.1873614 28.18699778 28.1865646 28.18536165 28.18350161 28.17321323 28.1736098
q1 -18.44916919 -18.46720242 -18.46682228 -18.46637434 -18.46520827 -18.46332504 -18.45241961 -18.45262758
m2 36.3447702 36.34463736 36.34456593 36.3443535 36.34425971 36.34413103 36.34414954 36.34411604
q2 -26.99491706 -26.99485772 -26.99478305 -26.9945673 -26.99458723 -26.99453172 -26.99435776 -26.99405621
m3 37.03571711 37.03609824 37.03614668 37.03635172 37.03678751 37.03715553 37.03657103 37.03580845
q3 -27.92445359 -27.92508797 -27.92517497 -27.92552218 -27.92625735 -27.92687229 -27.92588331 -27.92459605
m4 36.61193097 36.61191316 36.61191737 36.61192809 36.61192928 36.61194023 36.61195883 36.61195487
q4 -27.2364715 -27.23645805 -27.23647316 -27.23650473 -27.23653405 -27.23656912 -27.23655968 -27.23650453
m5 34.87134368 34.87110626 34.87109254 34.87107855 34.87113717 34.87112214 34.87111942 34.87113093
q5 -23.87830542 -23.8778673 -23.87784746 -23.87783085 -23.87796968 -23.87795398 -23.87790556 -23.8778825
m6 33.29208696 33.29207887 33.29206802 33.29206659 33.29205137 33.29206374 33.29205915 33.29209287
q6 -20.42833511 -20.42839431 -20.42838028 -20.42839048 -20.42836752 -20.42841089 -20.4283603 -20.42838797

55
Coefficient S9 S10 S11 S12 S13 S14 S15 S16
m1 28.17423994 28.17456974 28.17542529 28.17598035 28.17611799 28.17454039 28.17083583 28.17434511
q1 -18.45329409 -18.45366907 -18.45448874 -18.45510575 -18.45530108 -18.45368208 -18.44985955 -18.45353429
m2 36.34404251 36.34434342 36.3444304 36.34445398 36.3444334 36.34453036 36.34470156 36.3446944
q2 -26.99398936 -26.9943429 -26.99433743 -26.99440949 -26.99445434 -26.99459468 -26.99483844 -26.99483887
m3 37.03592086 37.0357774 37.03541969 37.03551871 37.03570219 37.03571609 37.0357664 37.03577648
q3 -27.92477993 -27.9245347 -27.92392866 -27.92410297 -27.92442374 -27.92445252 -27.92453391 -27.92455769
m4 36.6119409 36.6119466 36.61195026 36.61191999 36.61186146 36.61186874 36.61192337 36.61195025
q4 -27.23648325 -27.2364803 -27.2364612 -27.23642547 -27.23635308 -27.23637105 -27.23645944 -27.23651043
m5 34.87117195 34.87118697 34.87126824 34.87133294 34.87134261 34.87133986 34.8712814 34.87134025
q5 -23.87796704 -23.87798274 -23.87811462 -23.87826105 -23.87831831 -23.87831674 -23.87818775 -23.87830047
m6 33.29211969 33.29213788 33.29211236 33.29209369 33.29209921 33.29207065 33.29210384 33.29212754
q6 -20.42844171 -20.4284651 -20.42836576 -20.42832982 -20.42837638 -20.42831823 -20.42838952 -20.42842618

56
Table 3.11: m and q coefficients.
Coefficient S1 S2 S3 S4
m7 31.7693044 31.76921946 31.76931629 31.76938698
q7 -25.23965093 -25.23939608 -25.24023576 -25.24045036
m8 28.73262243 28.73277014 28.73268472 28.73305131
q8 -13.92810693 -13.92871282 -13.92882784 -13.93014934
m9 29.97390965 29.97174398 29.97176673 29.97197765
q9 -18.73762812 -18.72927198 -18.72982535 -18.7305394
Once the equations have been obtained for each interval for each sensor and for each solution they have been used in the software developed by RDE Company to obtain a calibration for each sensor in the considered relative humidity range.

57
3.3 References Bell LN, Labuza TP. Moisture sorption: practical aspects of sorption isotherm measurements and use. AACC Egan Press, 2nd Edition, 2000. Biquet B, Labuza TP, 1988, Evaluation of the moisture permeability characteristics of chocolate films as an edible moisture barrier. J Food Sci 53:989-998. Chirife J, Iglesias HA, 1978, Equations for fitting water sorption isotherms of foods: Part 1 – A review. J Food Technol 13:159-174. Gobbi S, 2009, Osmo-air-drying to obtain dried crispy fruits: optimization and modeling of processing and product shelf life. PhD Thesis in Food Science, Technology and Biotechnology. Università degli Studi di Milano, Milano, Italy. Halsey G, 1948, Physical adsorption on non-uniform surfaces. J Chem Phys 16:931-937. Henderson SM, 1952, A basic concept of equilibrium moisture. Agr Eng 33:29-32. Lee DD et al. Food Packaging, Science and Technology. CRC Press 2008. Oswin CR, 1946, The kinetics of package life. III. The isotherm. J Soc Chem Ind-L 65:419-421. Smith SE, 1947, The sorption of water vapour by high polymers. J Am Chem Soc 69:646-651. Wolf W et al. Standardization of isotherm measurement (cost project 90 and 90 bis). In Properties of Water in Foods in relation to quality and stability, Simatos D, Multon JL, eds., Martinus Nijhoff Publishers, 1985, pp. 661-669.

58

59
4. Results and discussion An acquisition system has been developed and built in collaboration with RDE Company to study the phenomena of moisture diffusion in a packaged perishable food. The acquisition system allowed us to place moisture sensors inside packages to collect and record moisture values to analyze the moisture diffusion inside the headspace of the package and inside the product. 4.1. Preliminary experiment In a preliminary experiment 6 sliced air dried apple rings were sealed in packages of OPP 20 µm film. A moisture sensor was placed between the apple rings, another moisture sensor was placed in the headspace of the package (Figure 4.1).
Figure 4.1: apple rings package.
The packages have been placed in sealed plastic boxes. On the bottom of each box was present demineralized water to obtain a moisture content of 100% inside the box. The boxes were stored in a climatic chamber at 25°C and the system started to record moisture values. The moisture values collected are shown in Figure 4.2.

60
Figure 4.2: moisture change in an apple rings package.
The “Headspace” curve represents the moisture diffusion in the headspace, while the “Product” curve represents the moisture adsorption by the apple rings. The initial decrease of the two curves is due to the adsorption by the dried apple rings of the moisture present in the environmental air. This preliminary experiment shows that there is not an immediate equilibrium between the relative humidity in the headspace of the packaging (which changes with the entrance of water vapour from the outside) and the relative humidity of the product. 4.2. Model system and theoretical assumption verification To investigate and analyze the preliminary results obtained with the dried apple rings a model system has been developed in order to repeat the experiments in the same conditions and to control the volume of the packages. Rigid EPS trays with two different volumes were selected as packages: 1400 and 1030 cm3. They have been sealed with OPP 20 µm film. As food product “Fetta biscottata”, a typical Italian bakery product has been chosen for the present work because of its regular shape and geometry and the uniformity among different packages. All the experiments have been performed using “Fetta biscottata” Sample 1 “Dorate” described in Materials and Methods. The acceptable maximum moisture content for the consumption has been set at a relative humidity of 40%. The moisture content and the water activity have been determined for “Fetta biscottata”. The water activity was equal to 0.251±0.003 and the moisture content to 3.71±0.27 g/100g.
26
28
30
32
34
36
38
0 50 100 150 200 250 300 350 400 450
RH
[%]
Time [h]
Product
Headspace

61
Two moisture sensors were placed inside “Fetta biscottata” (Figure 4.3) and two moisture sensor were placed in the headspace of the package (Figure 4.4).
Figure 4.3: sensors placed inside “Fetta biscottata”.
Figure 4.4: sensor placed in the headspace of the package.

62
Different quantities of the dry product (“Fetta biscottata”) have been packaged in the two types of trays, obtaining the combinations summarized in table 4.1.
Table 4.1: packaging combinations.
Sample number
Number of “Fetta biscottata”
Product weight [g]
Product volume [cm3]
Tray volume [cm3]
Headspace volume [cm3]
1 4 32.48 182.8 1030 847.2
2 4 32.48 182.8 1400 1217.2
3 6 48.72 274.2 1030 755.8
4 6 48.72 274.2 1400 1125.8
5 8 64.96 365.6 1030 664.4
6 12 97.44 548.4 1400 851.6
The packages have been placed in sealed plastic boxes. On the bottom of each box demineralized water was present to obtain a moisture content of 100% inside the box. The boxes were stored in a climatic chamber at 25°C and the system started to record moisture values.
During the storage the moisture adsorption by “Fetta biscottata” and the moisture increase in the headspace of the packages have been measured and recorded every 30 minutes for each combination. In Figure 4.5 and 4.6 the moisture changes for sample 2 and 6 are shown. The experiments were repeated at least two times for each sample.

63
Figure 4.5: moisture change in sample 2.
Figure 4.6: moisture change in sample 6.
The “Headspace” curve represents the moisture diffusion in the headspace, while the “Product” curve represents the moisture adsorption by “Fetta biscottata”.

64
In table 4.2 are reported the average RH differences between the “Headspace” curve and the “Product” curve for each sample.
Table 4.2: RH differences between the curves.
Sample number Δ% RH
1 4.5±0.6
2 5.6±1.5
3 2.9±0.5
4 3.6±0.6
5 2.5±0.3
6 2.2±0.3
For all the samples the difference between the curves can be considered constant in the considered RH range and it shows the delay of the products in adsorbing the moisture. Experiments conducted until 95% RH demonstrated that the two curves joint after a quite long time (data not shown). To analyze the differences among the samples, the ratio between the headspace volume and the product weight was related to the difference between the headspace and the product RH values. The results are reported in table 4.3.
Table 4.3: Δ% RH and Headspace volume/Product weight relation
Sample number Headspace volume/Product weight [cm3 g-1] Δ% RH
1 26.1 4.5±0.6
2 37.5 5.6±1.5
3 15.5 2.9±0.5
4 23.1 3.6±0.6
5 10.2 2.5±0.3
6 8.7 2.2±0.3

65
The data obtained show that the higher the ratios, the bigger the differences. This phenomenon is explained by the resistance of the stagnant air layer (Gennadios et al., 1994) inside the package, which is an obstacle to moisture diffusion. In figure 4.7 the differences in RH values are plotted versus the volume/weight ratio.
Figure 4.7: RH differences.
The plot shows a linear relationship (in the considered range) between the ratio headspace volume/product weight and the headspace and product Δ% RH:
1669.1118.0 product
Headspace
WV
RH (4.1)
From our data, obtained combining different weights of “Fetta biscottata” and different headspace volumes, we can conclude that the relative humidity of the headspace of the packaging (which changes for the water vapour permeability) is not immediately in equilibrium with the product. The theoretical assumption generally used in the shelf life modeling (Quast & Karel, 1972; Bell & Labuza, 2000; Fava et al, 2000) has not been verified for this product.
y = 0.118x + 1.1669
R² = 0.9791
0
1
2
3
4
5
6
7
8
5 10 15 20 25 30 35 40
Δ% R
H
Headspace volume/Product weight [cm3 g-1]

66
4.3 Shelf life prediction A shelf life prediction model has been applied to the product and the considered package to evaluate how the difference between the headspace and the product RH values influences the shelf life prediction. For this type of moisture sensitive products the prediction models are based on the water amount that permeates through the packaging film in a time unit. The water amount that permeates through the packaging film in a time unit is a function of the package characteristics (permeability coefficient of the material, KP; thickness, L; and area exposed to the mass flux, A) and of the driving force (p), according to the expression:
dtpAL
KPdQ OH 2
(4.2)
The driving force is represented by the product of the water vapour pressure (p0) and the difference between the relative humidity inside and outside the package (aw out - aw in). Temperature and water activity outside the package are considered to be constant, while aw in is subjected to continuous variation as a consequence of water absorption from the low-moisture product used in the model system. The modification of aw in is described by the adsorption isotherm of the considered product, so the driving force can be expressed as:
Mfinaoutapp ww 0 (4.3)
In case of hygroscopic products, such as the “Fetta biscottata” used in the present work, the water amount Q that permeates through the package film is absorbed by the product. The moisture content M can be expressed as:
sWQM
(4.4)
Where Ws is the total solids weight of the packaged product. Hence, the general model that describes moisture content changes during time in this kind of products can be written as follows:
dtW
inafoutapAL
KPdM
swwo
OH 12
(4.5)
In order to solve this differential equation, the following variables have to be known:
absorption isotherm expressed as aw = f(M);
initial moisture content M0, and the corresponding aw0;
ratio A/Ws, related to the package geometric characteristics;
water-barrier properties of the package film;
storage conditions in terms of temperature and relative humidity.

67
Figure 4.8 is a schematic representation of the main variables to be introduced in the model for a shelf life study.
Figure 4.8: Flow-sheet of the main steps of a shelf life study.
Product’s characteristics: Mc M0 Ws aw
Sorption isotherm determination
Modelling of sorption isotherm: Oswin Smith Iglesias-Chirife Henderson Halsey
Statistical analysis of the fitted models
Selection of the model with the best fitting precision
Experimental conditions: Temperature Relative humidity
Package conditions: Surface area Thickness WVTR
Shelf life modelling:
dtW
inafoutapAL
KPdM
swwo
OH 12
Shelf life prediction and problem
solving

68
The water vapour sorption/desorption isotherm for “Fetta biscottata” was determined according to the static, gravimetric method developed by COST-90 Project (Wolf et al., 1985) and described by Bell and Labuza (2000). Based on the equilibrium moisture content at a given water activity, the sorption/desorption experimental points were obtained at 25°C (Table 4.4 and Figure 4.9).
Table 4.4: sorption/desorption experimental points at 25°C.
RH% aw M (g H2O/g db)
11 0.114 0.0381
23 0.241 0.051
32 0.331 0.0603
44 0.438 0.0751
52 0.529 0.0879
66 0.691 0.1281
75 0.753 0.1499
86 0.841 0.2076
Figure 4.9: sorption/desorption experimental points at 25°C.

69
The sorption/desorption curve at 25°C for “Fetta biscottata” was obtained fitting experimental data by the equations of Oswin (1946), Smith (1947), Iglesias-Chirife (1978), Henderson (1952) and Halsey (1948) using the Table Curve 2D software (Software output example for Oswin equation in Figure 4.10) obtaining the equation coefficients reported in table 4.5.
Figure 4.10: Table Curve 2D software output.
Table 4.5: equation coefficients.
Equation a b
Oswin 4.77544 1.95121
Smith 0.02134 0.09591
Iglesias-Chirife 0.03233 0.04552
Henderson 2.67036 1.26086
Halsey 0.14696 3.56937

70
In order to identify the equation that better fitted the experimental data, the correlation coefficient (r2) and the mean relative percentage deviation modulus (Ē%) were considered, calculated with the formula:
N
i e
pe
MMM
NE
1
100% (4.6)
Where:
N: number of experimental data;
Me: moisture content experimental value;
Mp: moisture content predicted value.
The statistical parameters obtained for the different equations are listed in table 4.6.
Table 4.6: statistical parameters for the fitted equations.
Equation r2 Ē%
Oswin 0.995 4.826
Smith 0.992 5.258
Iglesias-Chirife 0.984 8.846
Henderson 0.978 11.163
Halsey 0.845 27.827
A Ē% value below 10% indicates a reasonably good fit and values below 5% represent an extremely good fitting for practical purposes (Lomauro et al., 1985). According to r2 and Ē% values, the best fitting was obtained for the Oswin equation, as evidenced in table 4.6. The statistical parameters calculated for the other equations showed that these equations did not provide a good fitting of the experimental data. Oswin equation was selected to interpolate the experimental points of the sorption/desorption isotherm. In order to solve the differential equation, the model was implemented in a spreadsheet (Microsoft Office Excel 2007), in which all the variables related to the product (M, aw, Weight), the package (KP, A, L) and the storage conditions (temperature, aw), were included. The Oswin equation was used in the spreadsheet to turn the moisture content value of the product into the corresponding water activity value. The water activity value is necessary to calculate the driving force as difference between the outside water activity and the product water activity. The constant a and b values, obtained from the Oswin equation describing the isotherm and expressed in

71
this section as aw=f(M), were also indicated. Figure 4.11 shows, as an example, the spreadsheet used for one of the samples.
Figure 4.11: spreadsheet used to predict the shelf life of one sample.
A time interval of one hour was assumed for the calculations, being considered appropriate for this kind of products. Within each time interval, the amount of water permeated into the package has been calculated as a function of the driving force (aw) and the package characteristics. Water activity modification inside the package was calculated by means of the Oswin equation used for the isotherm, and a new driving force value was obtained for each time interval. The shelf life, expressed in hours, was determined at the reach of the critical moisture value set for “Fetta biscottata”.

72
The values listed in table 4.7 report the shelf life predicted for each sample by the prediction model.
Table 4.7: shelf life prediction values.
Sample number Predicted SL [h]
1 85
2 63
3 129
4 94
5 170
6 188
To evaluate the influence of the difference between the relative humidity of the headspace and the relative humidity of the product on the shelf life prediction the Microsoft Excel spreadsheet model has been modified applying the linear correlation previously described (Equation 4.1):
1669.1118.0 product
Headspace
WV
RH (4.1)
This correction allowed to consider the lower value of relative humidity described by equation 4.1 and the consequent delay of time to reach the critical moisture content, leading to a longer shelf life prediction for all the samples considered. The corrected values of shelf life are reported in table 4.8 in terms of hours and percentage error.

73
Table 4.8: shelf life prediction values.
Sample number
Predicted SL [h]
Headspace volume/Product weight [cm3 g-1]
Corrected SL [h]
SL Error [h]
SL Error [%]
1 85 26.1 106 21 19.8
2 63 37.5 83 20 24.1
3 129 15.5 149 20 13.4
4 94 23.1 112 18 16.1
5 170 10.2 192 22 11.5
6 188 8.7 211 23 10.9
The application of equation 4.1 to the spreadsheet model allowed to correct the shelf life for every value of headspace volume/product weight ratio in the range considered during this trial, between 8.7 and 37.5 cm3 g-1. Figure 4.12 shows how, in the considered range, to the increase of the ratio headspace volume/product weight corresponds an increase of the percentage error on the shelf life prediction, following a linear relationship. The increase of the percentage error underlines the importance of the correction to the prediction model.
Figure 4.12: % error increase.
R² = 0.9963
5
10
15
20
25
5 10 15 20 25 30 35 40
Err
or [%
]
Headspace volume/Product weight [cm3 g-1]

74
4.4 Conclusions The model system studied in the present work has demonstrated that, in this case, the theoretical assumption generally used in the shelf life modelling, stating the immediate equilibrium between the headspace moisture and the product moisture, is not verified. These relative moistures are not immediately in equilibrium but show an increasing difference correlated to the increase of the headspace volume/product weight ratio. This correlation has been studied and it has been described by a linear equation in the studied range. The application of a shelf life prediction model to the studied system has shown that a correction is needed to avoid an underestimation of the shelf life. Further studies on other types of moisture sensitive products will be necessary to confirm the obtained results. The application of this correction will be particularly interesting for the shelf life modelling of moisture depending products characterized by packaging solutions with high headspace volumes.

75
4.5 Shelf life prediction simplification for a category of products In a second part of the work the possibility to simplify the shelf life prediction for a category of products has been studied, applying a unique shelf life model for all the products part of the category. 14 different types and brands of “Fetta biscottata” have been bought in different supermarkets in the city of Milano without any specific criteria, just on the base of the availability. For all of them the water activity and the moisture content have been determined, as reported in Table 4.9.
Table 4.9: water activity and moisture content for “Fetta biscottata”.
Sample aw Moisture content [g/100g]
1 0.251±0.003 3.71±0.27
2 0.307±0.003 4.86±0.04
3 0.198±0.003 3.28±0.07
4 0.183±0.005 3.25±0.13
5 0.185±0.005 3.41±0.04
6 0.232±0.003 3.08±0.11
7 0.292±0.006 5.63±0.22
8 0.307±0.003 5.08±0.14
9 0.282±0.009 3.69±0.08
10 0.206±0.013 3.15±0.14
11 0.185±0.007 2.85±0.04
12 0.163±0.006 2.9±0.1
13 0.149±0.004 2.82±0.07
14 0.187±0.002 3.44±0.08
The water vapour sorption/desorption isotherm for “Fetta biscottata” was determined according to the static, gravimetric method developed by COST-90 Project (Wolf et al., 1985) and described by Bell and Labuza (2000). Based on the equilibrium moisture content at a given water activity, the sorption/desorption experimental points were obtained at 25°C (Table 4.10 and Figure 4.13).

76
Table 4.10: sorption/desorption experimental points at 25°C.
RH% aw M (g H2O/g db)
Sample 1 M (g H2O/g db)
Sample 2 M (g H2O/g db)
Sample 3 M (g H2O/g db)
Sample 4 M (g H2O/g db)
Sample 5 M (g H2O/g db)
Sample 6 M (g H2O/g db)
Sample 7
11 0.114 0.0381 0.0441 0.0154 0.0302 0.0313 0.0273 0.0472
23 0.241 0.0510 0.0583 0.0317 0.0484 0.0485 0.0447 0.0639
32 0.331 0.0603 0.0639 0.0356 0.0517 0.0526 0.0484 0.0679
44 0.438 0.0751 0.0773 0.0464 0.0658 0.0653 0.0652 0.0775
52 0.529 0.0879 0.0964 0.0662 0.0854 0.0835 0.0882 0.0904
66 0.691 0.1281 0.1265 0.0955 0.1196 0.1161 0.1298 0.1111
75 0.753 0.1499 0.1477 0.1208 0.1436 0.1378 0.1569 0.1252
86 0.841 0.2076 0.2039 0.1773 0.2050 0.1945 0.2208 0.1584
RH% aw
M (g H2O/g db) Sample 8
M (g H2O/g db) Sample 9
M (g H2O/g db) Sample 10
M (g H2O/g db) Sample 11
M (g H2O/g db) Sample 12
M (g H2O/g db) Sample 13
M (g H2O/g db) Sample 14
11 0.116 0.0422 0.0312 0.0292 0.0282 0.0279 0.0293 0.0324
23 0.205 0.0565 0.0458 0.0495 0.0466 0.0463 0.0470 0.0494
32 0.326 0.0589 0.0492 0.0517 0.0490 0.0471 0.0493 0.0513
44 0.443 0.0718 0.0639 0.0655 0.0603 0.0617 0.0635 0.0645
52 0.497 0.0918 0.0824 0.0840 0.0758 0.0811 0.0802 0.0805
66 0.65 0.1282 0.1202 0.1185 0.1031 0.1170 0.1167 0.1144
75 0.748 0.1549 0.1473 0.1421 0.1223 0.1398 0.1399 0.1354
86 0.816 0.2098 0.2078 0.2064 0.1665 0.2013 0.1970 0.1816

77
Figure 4.13: sorption/desorption experimental points at 25°C.
11%
23%32%
44%
52%
66%
75%
86%
0,00
0,02
0,04
0,06
0,08
0,10
0,12
0,14
0,16
0,18
0,20
0,22
0,24
0,00 0,10 0,20 0,30 0,40 0,50 0,60 0,70 0,80 0,90
M (g
H2O
/g d
b)
aw
Sample 1
Sample 2
Sample 3
Sample 4
Sample 5
Sample 5
Sample 7
Sample 8
Sample 9
Sample 10
Sample 11
Sample 12
Sample 13
Sample 14

78
The sorption/desorption curve at 25°C for each sample of “Fetta biscottata” was obtained fitting experimental data by the equation of Oswin (1946), using the Table Curve 2D software, obtaining the equation coefficients reported in Table 4.11.
Table 4.11: equation coefficients.
Sample a b
1 4.77545 1.95121
2 5.16770 2.15641
3 4.28550 1.50597
4 4.54424 1.79117
5 4.78319 1.87670
6 4.17041 1.65331
7 7.20962 2.96054
8 4.79163 1.97556
9 4.39556 1.72048
10 4.51068 1.77215
11 5.31687 2.01470
12 4.46408 1.72491
13 4.60038 1.78719
14 5.06558 1.97900
In order to analyze for each type of “Fetta biscottata” the fitting properties of the Oswin equation for the experimental data, the correlation coefficient (r2) and the mean relative percentage deviation modulus (Ē%) were considered, calculated with the Equation 4.6. The statistical parameters obtained for each type of “Fetta biscottata” are listed in table 4.12.
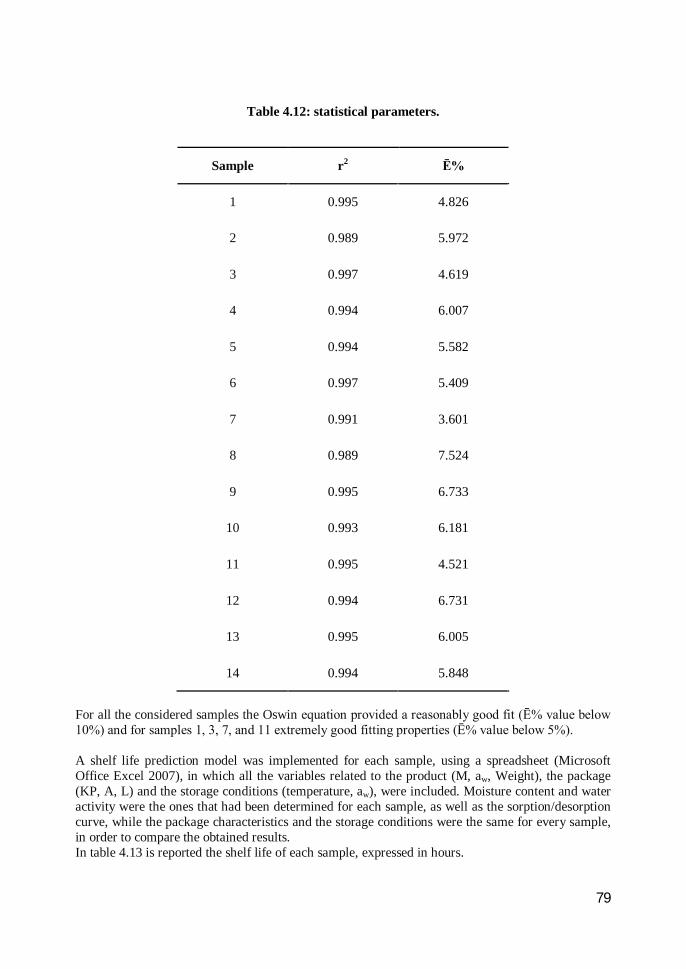
79
Table 4.12: statistical parameters.
Sample r2 Ē%
1 0.995 4.826
2 0.989 5.972
3 0.997 4.619
4 0.994 6.007
5 0.994 5.582
6 0.997 5.409
7 0.991 3.601
8 0.989 7.524
9 0.995 6.733
10 0.993 6.181
11 0.995 4.521
12 0.994 6.731
13 0.995 6.005
14 0.994 5.848
For all the considered samples the Oswin equation provided a reasonably good fit (Ē% value below 10%) and for samples 1, 3, 7, and 11 extremely good fitting properties (Ē% value below 5%). A shelf life prediction model was implemented for each sample, using a spreadsheet (Microsoft Office Excel 2007), in which all the variables related to the product (M, aw, Weight), the package (KP, A, L) and the storage conditions (temperature, aw), were included. Moisture content and water activity were the ones that had been determined for each sample, as well as the sorption/desorption curve, while the package characteristics and the storage conditions were the same for every sample, in order to compare the obtained results. In table 4.13 is reported the shelf life of each sample, expressed in hours.

80
Table 4.13: shelf life prediction.
Sample SL [h]
1 71
2 45
3 27
4 67
5 64
6 69
7 38
8 41
9 55
10 69
11 64
12 68
13 71
14 61
This approach for predicting the shelf life of the samples required the application of 14 different prediction models, one for each sample. In order to simplify the prediction and to reduce the necessary work, the possibility to apply a single sorption/desorption curve at 25°C for all the experimental points determined for the 14 samples and then apply a single prediction model has been considered. The interpolation of the experimental points was obtained fitting experimental data by the equation of Oswin (1946), using the Table Curve 2D software (Figure 4.14) obtaining the equation coefficients reported in Table 4.14.

81
Figure 4.14: Table Curve 2D software output.
Table 4.14: equation coefficients
a B
4.77865 1.88348
The correlation coefficient (r2) and the mean relative percentage deviation modulus (Ē%), calculated with the Equation 4.6 show that this approach does not give good fitting properties. The statistical parameters obtained are listed in table 4.15.
Table 4.15: statistical parameters.
r2 Ē%
0.959 11.331
The application of a unique shelf life prediction model was implemented using a single sorption/desorption curve for each of the samples, the same storage conditions and the same

82
package characteristics. Only the moisture content and water activity were the ones that had been determined for each sample. In table 4.16 is reported the shelf life of each sample, expressed in hours. The predicted shelf life obtained with this unique prediction model has been compared with the ones obtained with a specific prediction model and the errors have been calculated.
Table 4.16: shelf life prediction and error.
Sample SL [h] Predicted SL [h] Error [h] Error [%]
1 71 58 -13 18%
2 45 32 -13 29%
3 27 67 40 148%
4 67 68 1 1%
5 64 65 1 2%
6 69 71 2 3%
7 38 11 -27 71%
8 41 26 -15 37%
9 55 59 4 7%
10 69 70 1 1%
11 64 78 14 22%
12 68 75 7 10%
13 71 77 6 8%
14 61 64 3 5%
The results confirmed the indications obtained by the correlation coefficient and the mean relative percentage deviation modulus of Table 4.15. The errors in the shelf life prediction are unacceptable, especially for samples 3, 7, and 8. The same approach has been applied excluding the sample number 3 with the highest error value.

83
The experimental points of the 13 samples were interpolated with the equation of Oswin (1946), using the Table Curve 2D software (Figure 4.15) obtaining the equation coefficients reported in Table 4.17 and the statistical parameters listed in table 4.18.
Figure 4.15: Table Curve 2D software output.
Table 4.17: equation coefficients
a b
4.81448 1.91273
Table 4.18: statistical parameters.
r2 Ē%
0.966 10.119
The correlation coefficient and the mean relative percentage deviation modulus show better fitting characteristics than before, but still over 10%. These results are confirmed by the application of the

84
shelf life model, the errors are lower than before but still too high, especially for sample 7, as reported in table 4.19.
Table 4.19: shelf life prediction and error.
Sample SL [h] Predicted SL [h] Error [h] Error [%]
1 71 61 -10 14%
2 45 35 -10 22%
3 27 - - -
4 67 70 3 4%
5 64 68 4 6%
6 69 74 5 7%
7 38 15 -23 61%
8 41 30 -11 27%
9 55 64 9 16%
10 69 73 4 6%
11 64 79 15 23%
12 68 78 10 15%
13 71 79 8 11%
14 61 67 6 10%
With the exclusion of sample 7 the interpolation of the experimental points of the 12 samples with the equation of Oswin (1946), using the Table Curve 2D software (Figure 4.16) returned the equation coefficients reported in Table 4.20 and the statistical parameters listed in Table 4.21.

85
Figure 4.16: Table Curve 2D software output.
Table 4.20: equation coefficients.
a b
4.69010 1.85707
Table 4.21: statistical parameters.
r2 Ē%
0.975 8.667
The correlation coefficient and the mean relative percentage deviation modulus show good fitting characteristics. These results are confirmed by the application of the shelf life model as shown in Table 4.22. The errors are lower that 20% for each sample, a value than can be considered acceptable in this type of shelf life prediction.

86
Table 4.22: shelf life prediction and error.
Sample SL [h] Predicted SL [h] Error [h] Error [%]
1 71 59 -12 17%
2 45 37 -8 18%
3 27 - - -
4 67 69 2 3%
5 64 66 2 3%
6 69 72 3 4%
7 38 - - -
8 41 34 -7 17%
9 55 60 5 9%
10 69 71 2 3%
11 64 76 12 19%
12 68 76 8 12%
13 71 78 7 10%
14 61 65 4 7%
4.6 Conclusions To predict the shelf life of moisture sensitive products it is necessary to determine the water activity and the moisture content of the considered products. It is also important to determine the sorption/desorption isotherm at the storage temperature to obtain a reliable shelf life prediction. This type of work is labor and time intensive. It is possible to simplify the work only with simplifications based on a good knowledge of statistical indexes and their correct application.

87
4.7 References Bell LN, Labuza TP. Moisture sorption: practical aspects of sorption isotherm measurements and use. AACC Egan Press, 2nd Edition, 2000. Chirife J, Iglesias HA, 1978, Equations for fitting water sorption isotherms of foods: Part 1 - A review. J Food Technol 13:159-174. Fava P et al., 2000, Shelf-life modelling of moisture sensitive food products. Ind Aliment-Italy 32:121-128. Gennadios A et al., 1994, Measurement errors in water vapor permeability of highly permeable, hydrophilic edible films. J Food Eng 21:395-409. Halsey G, 1948, Physical adsorption on non-uniform surfaces. J Chem Phys 16:931-937. Henderson SM, 1952, A basic concept of equilibrium moisture. Agr Eng 33:29-32. Lomauro CJ et al., 1985, Evaluation of food moisture sorption equations; Part II: Milk, coffee, tea, nuts, oilseeds, spices and starchy foods. Lebensm Wiss Technol 18:118-124. Oswin CR 1946, The kinetics of package life. III. The isotherm. J Soc Chem Ind-L 65:419-421. Quast DG, Karel M, 1972, Computer simulation of storage life of foods undergoing spoilage by two interacting mechanisms. J Food Sci 37:679-683. Smith SE, 1947, The sorption of water vapour by high polymers. J Am Chem Soc 69:646-651. Wolf W et al. Standardization of isotherm measurement (cost project 90 and 90 bis). In Properties of Water in Foods in relation to quality and stability, Simatos D, Multon JL, eds., Martinus Nijhoff Publishers, 1985, pp. 661-669.

88

89
5 Appendix

90

9° Congresso CISETACongresso Italiano di Scienza e Tecnologia degli Alimenti
Fiera Milano, 11 e 12 giugno 2009
Verifica di modelli per la previsione dellashelf life di prodotti secchi confezionati
attraverso l’utilizzo di sensori di umiditàrelativa
Pietro Lamiani1, Sara Limbo1, Luciano Piergiovanni1
1 Distam, Università degli Studi di Milano,Via Celoria, 2, 20133 Milano
IntroduzioneL’affidabilità di un modello di previsione della shelf life di prodotti alimentarisecchi confezionati, in cui si considerano congiuntamente le variabili delsistema “prodotto/confezione/ambiente”, si fonda sull’accuratezza con cuiqueste variabili sono misurate e sulla conoscenza delle relazioni che tra esseintercorrono (1). In particolare, deve essere attentamente valutato il ruolosvolto nel sistema dal prodotto alimentare. Diventa essenziale conoscerel’entità dell’interazione alimento/fattore di degradazione ed anche la relazionematematica che la descrive. Nel caso di prodotti che, per il ridotto tenore diumidità ed il basso valore di aw, tendono ad assorbire velocemente vapord’acqua dall’ambiente circostante, la relazione che descrive l’interazionealimento/fattore di degradazione è l’isoterma di adsorbimento del vapord’acqua. Per giungere alla previsione della shelf life, questa relazione viene, dinorma, inserita in un modello più generale che tiene conto della permeabilità alvapor d’acqua della confezione e dei valori di umidità del prodotto, iniziali efinali, cioè critici per l’accettabilità (2).Sebbene, in molte applicazioni, tali modelli si siano mostrati attendibili, spessosi basano su assunzioni teoriche che non sono state ancora verificatesperimentalmente e che potrebbero indurre errori nella stima previsionale. Unadi queste assunzioni si basa sull’ipotesi che l’umidità relativa delmicroambiente interno alla confezione (che si modifica per l’ingresso di vaporeacqueo dall’esterno) sia immediatamente e sempre in equilibrio con quella delprodotto (3).
ScopoScopo del presente lavoro è quello di verificare le assunzioni toriche alla basedei modelli previsionali mediante l’utilizzo di sensori di umidità relativa che,posti all’interno di confezioni contenenti rondelle di mele disidratate e fettebiscottate, sono in grado di monitorare in continuo ed in modo puntuale levariazioni di umidità all’interno del prodotto e nello spazio di testa delleconfezioni.

9° Congresso CISETACongresso Italiano di Scienza e Tecnologia degli Alimenti
Fiera Milano, 11 e 12 giugno 2009
Materiali e metodiRondelle di mela: sono state utilizzate mele biologiche (cv ‘Golden delicious’)private del torsolo tramite un detorsolatore del diametro di 25 mm, tagliatemeccanicamente in rondelle dello spessore di 5,0 ± 0,2 mm e quindi disidratatein corrente d’aria a 80°C in un essiccatore ad armadio.Fette biscottate: sono state utilizzate fette biscottate dorate, prodotte da MulinoBianco (Barilla), acquistate presso la GDO.Sistema di acquisizione: (Figura1) per l’acquisizione dei valori di umiditàrelativa e per la taratura dei sensori è stato utilizzato un sistema di acquisizionedati fornito dalla società RDE Company srl (Novate Milanese, Milano).Film plastico: film trasparente di OPP 20 (polipropilene orientato, spessore 20m) prodotto dalla Moplefan.Vaschette: vaschette in polistirene rivestite con un film a barriera totale,prodotte da Sirap Gema.Prove di conservazione simulata: Le prove di conservazione simulata sonostate effettuate in celle termostatate FOC 225 a 25±0,5°C per le rondelle dimela e a 38±0,5°C per le fette biscottate. Sul fondo delle vaschette dipolipropilene è stata posizionata acqua demineralizzata, in quantità di circa 1litro, in modo da ottenere una umidità relativa interna del 98%.
Risultati e discussionePer verificarle le ipotesi teoriche alla base dei modelli previsionali sono statepreliminarmente confezionate delle buste in OPP 20, contenenti 6 rondelle dimela disidratate ciascuna, in cui è stata inserita una coppia di sensori diumidità, uno dei quali direttamente a contatto con il prodotto e l’altroall’interno del microambiente non a diretto contatto.In figura 2 è possibile osservare l’andamento dell’umidità in funzione deltempo. Vi è una iniziale riduzione del valore di umidità dovutoall’assorbimento, da parte del prodotto, dell’umidità presente nell’ambiente almomento della saldatura della confezione. Tale ritardo non è dovuto al tempodi permeazione dell’umidità attraverso il film, perché un’apposita prova,eseguita alle stesse condizioni sperimentali ma con confezioni vuote, haevidenziato un immediato aumento di umidità all’interno delle confezioni sottoeffetto della forza motrice.Queste prove preliminari hanno mostrato una differenza di circa 0,5% diumidità relativa tra l’interno del prodotto e lo spazio di testa della confezione.Hanno però anche limiti dovuti al tipo di prodotto utilizzato: le rondelle di melaessiccate non sono mai perfettamente piane impedendo così di posizionare isensori in maniera corretta; inoltre, essendo materiale vegetale, nongarantiscono l’omogeneità, la riproducibilità e la ripetibilità necessaria adeffettuare un numero congruo di repliche.

9° Congresso CISETACongresso Italiano di Scienza e Tecnologia degli Alimenti
Fiera Milano, 11 e 12 giugno 2009
Per ovviare a queste problematiche si è deciso di utilizzare un prodotto piùomogeneo e costante, quali le fette biscottate. Inoltre, al fine di poter conoscerecon esattezza il volume dello spazio libero della confezione, sono stateutilizzate vaschette rigide a barriera totale chiuse con un film OPP 20.Per ciascuna confezione sono stati posizionati due sensori tra 4 fette biscottatee due sensori nello spazio libero.In figura 3 è possibile osservare le media (con le relative incertezze)dell’andamento dell’umidità relativa umidità all’interno del prodotto e nellospazio libero di testa delle repliche effettuate .La differenza tra le umidità relative è, in media, pari al 5,55±1,33%.
ConclusioniDai preliminari dati sperimentali si è notata una differenza di umiditàall’interno delle confezioni: per le fette biscottate il valore di umidità relativadello spazio libero della confezione è, in media, superiore dello 5,55±1,33%rispetto al valore di umidità relativa misurato nell’ambiente a stretto contattocon l’alimento; pertanto l’ipotesi che l’umidità relativa del microambienteinterno alla confezione sia immediatamente in equilibrio con quella delprodotto si è rivelata non corretta.I risultati preliminari ottenuti mediante la sperimentazione hanno evidenziatoche è necessario migliorare la catena di misura ed effettuare nuove prove inmodo da avere un numero congruo di dati per una miglior comprensione deifenomeni oggetto della sperimentazione e confrontarli con i modelliprevisionali.Prospettive future:• utilizzare i dati rilevati dai sensori per ottimizzare e affinare i modelli
previsionali;• trasferire le conoscenze fin qui acquisite sulla parte sensoristica a
tecnologie di trasmissione in radio frequenza, al fine di poter avere unsemplice e valido ausilio per una stima corretta della conservabilità delprodotto e dei suoi reali livelli di qualità, aprendo interessanti prospettivedi impiego e ulteriori campi di indagine e di approfondimento.
Bibliografia1) Hernandez, R.J. e Giacin, J.R. “Factors affecting permeation, sorption and migration inpackage-product systems”. In “Food Storage Stability”, I.A.Taub and R.P.Singh (Ed.). CRCPress, Washington D.C. USA: 269.1998.2) Labuza, T.P. e Schmidl, M.K. “Accelerated Shelf Life Testing of Foods”. Food Technology.39(9):57. 1985.3) Fava, P., Limbo, S. e Piergiovanni, L. “La previsione della shelf life di prodotti alimentarisensibili agli scambi di umidità”. Industrie Alimentari, 39(2):121. 2000.

9° Congresso CISETACongresso Italiano di Scienza e Tecnologia degli Alimenti
Fiera Milano, 11 e 12 giugno 2009
Figura 1: schema del sistema di acquisizione
Figura 2: andamento dell’umidità relativa nelle confezioni di rondelle
Figura 3: : andamento dell’umidità relativa nelle confezioni di fette biscottate

9° Congresso CISETACongresso Italiano di Scienza e Tecnologia degli Alimenti
Fiera Milano, 11 e 12 giugno 2009
Riassunti
Verifica di modelli per la previsione della shelf life di prodotti secchiconfezionati attraverso l’utilizzo di sensori di umidità relativaL’affidabilità di un modello di previsione della shelf life di prodotti alimentarisecchi confezionati, in cui si considerano congiuntamente le variabili delsistema “prodotto/confezione/ambiente”, si fonda sull’accuratezza con cuiqueste variabili sono misurate e sulla conoscenza delle relazioni che tra esseintercorrono. Sebbene, in molte applicazioni, tali modelli si siano mostratiattendibili, spesso si basano su assunzioni teoriche che non sono state ancoraverificate sperimentalmente e che potrebbero indurre errori nella stimaprevisionale. Una di queste assunzioni, ad esempio, si basa sull’ipotesi chel’umidità relativa del microambiente interno alla confezione (che si modificaper l’ingresso di vapore acqueo dall’esterno) sia immediatamente e sempre inequilibrio con quella del prodotto.Scopo di tale lavoro è quello di verificare tale assunzione mediante l’utilizzo disensori di umidità relativa che, posti all’interno di confezioni flessibilicontenenti rondelle di mele disidratate e fette biscottate, sono in grado dimonitorare in continuo ed in modo puntuale le variazioni di umidità all’internodel prodotto e nello spazio di testa delle confezioni.Risultati preliminari ottenuti hanno negato l’ipotesi che l’umidità relativa delmicroambiente interno alla confezione sia immediatamente in equilibrio conquella del prodotto
Verification of shelf life predicting models for dried packaged productsusing relative moisture sensorsA shelf life model of packaged food product considers the variables product,packaging and environment. The reliability of the model is based on both theaccuracy of the measures of the variables and the knowledge of theirinteractions. In many applications these models have shown to be reliable.However they are based on theoretical assumptions that have not yet beenverified experimentally and that could induce errors. One of these assumptions,for example, assumes that the relative moisture of the packaging headspace(which changes with the entrance of water vapour from the outside) isimmediately in equilibrium with the product.Aim of this work is to verify this assumption by using relative moisture sensorsplaced inside packages of dehydrated apples and fette biscottate. The sensorsare able to monitor continuously and in real time the moisture changes in theproduct and in the headspace of the packaging.Preliminary results have denied the assumption that the relative moisture of thepackaging headspace is immediately in equilibrium with the product.


14th Workshop on the Developments in the Italian PhD Research on Food Science and TechnologyUniversity of Sassari, Oristano, 16-18 September, 2009
Innovative approaches and instruments in modelling and monitoring theshelf life of packaged perishable foods
Pietro Lamiani ([email protected])Dept. Scienze e Tecnologie Alimentari e Microbiologiche, Università degli Studi di Milano, Milano - Italy
Tutor: Prof. Luciano Piergiovanni
In this PhD thesis research chemical or physical indexes of food quality will be identified for defined products,
in order to measure them with sensors. Sensors will be insert in food packages to collect data. On the basis of the
collected data, existing shelf life prediction models will be incorporated and verified with mathematical software
packages that can reproduce and predict the shelf life of products. New models will also be developed.
In a first phase relative moisture sensors will be used to verify and develop moisture depending models. In a
second step RFID tags will be equipped with sensor. The use of RFID transmission technology will allow to take
advantage of the non contact, non line of sigh and real time communication mode.
Approcci e strumenti innovativi nella modellazione e nel controllo della shelf life diprodotti deperibili confezionati
In questo progetto di dottorato verranno identificati indicatori chimici o fisici di qualità di prodotti alimentariallo scopo di misurarli mediante sensori. I sensori verranno inseriti all’interno di confezioni alimentari e i datiraccolti verranno utilizzati per verificare e migliorare i modelli di previsioni della shelf life esistenti, mediantel’ausilio di software matematici capaci di riprodurre e predire tale shelf life. Saranno anche sviluppati nuovimodelli di previsione.In una prima fase sensori di umidità relativa saranno usati per verificare e sviluppare modelli di previsioneumidità dipendenti; successivamente tag RFID saranno equipaggiati con tali sensori. L’uso della tecnologia ditrasmissione RFID consentirà una modalità di comunicazione in tempo reale, senza contatto e in assenza dicampo visivo.
1. State-of-the-Art
Shelf life models are mathematical equations which describe the relationship between food, package, and
environment. Shelf life models are useful to predict the shelf life of food, to design food packages, and to
provide useful insights. The accuracy with which these relationships are measured influences the reliability of
the models. It is also necessary to know the relationships among the variables that play a significant role in
defining food quality.
Moisture depending models
Many chemical, biological, and physical changes are dependent on moisture content or water activity in the
foods, whose changes may be dictated by the packaging protection from the environment in the distribution
channel. Water activity is ruled by the moisture content in the food, which may change with time through the
permeation process of water vapor across the packaging film. The equilibrium relationship between moisture
content and water activity is explained by the sorption/desorption isotherm, which is obtained mostly by the
experiments determining moisture contents of the food samples equilibrated under different relative humidity
conditions. Many attempts were conducted to express the equilibrium relationship by mathematical forms. The
most widely used are the equations of BET, GAB, Halsey, Henderson, Oswin, Khun, Inglesias, and Chirife (Lee
et al., 2008). These equations are used in forecast models to determinate the shelf life of moisture depending
products. All these models assume that the relative moisture of the headspace of the packaging (which changes
with the entrance of water vapour from the outside) is immediately in equilibrium with the product. They also
assume that the transmission of vapour water through the packaging is directly proportional to the difference in
relative humidity between the outside and the inside of the packaging and then gradually reduces, according to a
linear relationship. Both these conditions have not yet been verified experimentally and are based on theoretical
considerations (Piergiovanni, 2002).

14th Workshop on the Developments in the Italian PhD Research on Food Science and TechnologyUniversity of Sassari, Oristano, 16-18 September, 2009
Intelligent RFID
Intelligent RFID (Radio Frequency Identification) is the most promising concept to capture temperature and
forward quality information without trapping into communication bottlenecks. This approach will probably not
provide multi-factor quality parameters details like a main frame system but can still provide rapid information
for immediate response at any step of the distribution chain. Although no hardware solution is currently
available, the measurements of the required resources demonstrate that it would be possible to integrate the
calculation of a shelf life model into an RFID logger (Jedermann et al., 2007).
2. PhD Thesis Objectives and Milestones
A1) Identification and selection of the product (A1.1) based on previous experimental experiences andconsidering the existing literature. Identification of the acceptability limits of the product (A1.2) andselection of the proper packaging solution for the chosen product (A1.3).
A2) Measurement system assembly and calibration. The design and the implementation (A2.1) of themeasuring system will be done with the collaboration of engineering companies. Sensors will be calibrated(A2.2) by appropriate procedures, defined by standard methods if available.
A3) Characterization of the product by the determination of moisture content (A3.1), water activity (A3.2)and the construction of sorption/desorption isotherm (A3.3).
A4) Verification and validation of the existing models and development of new models. On the basis of thecollected data (A4.1), existing models will be verified (A4.2) and new models will be developed (A4.3).
A5) Reliability of the new model will be checked comparing its prediction with the real shelf life of the product(A5.1) in order to determine its reliability and to implement appropriate corrections (A5.2).
A6) RFID tags will be equipped with sensors (A6.1) and used in a real application to monitor shelf life (A6.2).A7) Writing and Editing of the PhD thesis, scientific papers, oral and/or poster communications.
Table 1 Gantt diagram for this PhD thesis project.
Activity Months 1 2 3 4 5 6 7 8 9 10 11 12 13 14 15 16 17 18 19 20 21 22 23 24
A1) Identification and selection
1) Product
2) Limits
3) Package
A2) Measurement system
1) Design and implementation
2) Calibration
A3) Characterization of the product
1) Moisture content
2) Water activity
3) Sorption/desorption isotherm
A4) Verification and validation
1) Data collection
2) Model verification
3) Develop of new model
A5) Reliability of the new model
1) Comparing prediction
2) Corrections
A6) RFID tags
1) Sensors application on RFID tags
2) Real application
A7) Thesis and Paper Preparation
3. Selected References
Jedermann R, Emond JP and Lang W (2007) Shelf life prediction by intelligent RFiD. Technical limits of model
accuracy. International Conference on Dynamics in Logistics. August 2007. Bremen, Germany.
Lee DD, Yam KL, and Piergiovanni L (2008) Food Packaging, Science and Technology. CRC Press. Boca
Raton, Florida, USA.
Piergiovanni L (2002) Appunti del corso: “Tecnologia del condizionamento dei prodotti agroalimentari”.
DiSTAM. Università degli Studi di Milano.

SLIM 2010 - 4th Shelf life International Meeting - Centro Politécnico Superior deIngenieros, University of Zaragoza (Spain), June, 23-25, 2010
INNOVATIVE APPROACHES AND INSTRUMENTS IN MODELING AND
MONITORING THE MOISTURE DIFFUSION IN PACKAGES AND MOISTURE
ADSORPTION BY DRIED PRODUCTS
P. Lamiani, S. Limbo, L. Piergiovanni1
ABSTRACT
Shelf life forecast models for moisture depending products assume that the relative
humidity of the package headspace (which changes with the entrance of water vapour
from the outside) is immediately in equilibrium with the product.
In the present research fetta biscottata (a typical Italian bakery product) has been used
as a model system to evaluate how different quantities of product, different headspace
volumes, and different packaging solutions influence the equilibrium between the
relative humidity of the headspace and the relative humidity of the product.
From the data obtained it can be concluded that the relative humidity of the headspace
of the packaging is not immediately in equilibrium with the product. The theoretical
assumption generally used in the shelf life modeling has not been verified for this type
of product.
KEY WORDS: humidity sensors, bakery products, shelf life modelling.
INTRODUCTION
Shelf life models are mathematical equations which describe the relationship between
food, package, and environment. These models are based on different degradation
factors and are useful to predict the shelf life of food, to design food packages, and to
provide useful insights.
Many chemical, biological, and physical changes depend on moisture content or water
activity in the foods, whose changes may be dictated by the packaging protection from
the environment in the distribution channel. Water activity is ruled by the moisture
content in the food, which may change with time through the permeation process of
1 Università degli studi di Milano, Dipartimento di Scienze e Tecnologie Alimentari e
Microbiologiche – Packlab - Via Celoria 2, 20133 Milano - Italia

SLIM 2010 - 4th Shelf life International Meeting - Centro Politécnico Superior deIngenieros, University of Zaragoza (Spain), June, 23-25, 2010
water vapor across the packaging film. The equilibrium relationship between moisture
content and water activity is explained by the adsorption/desorption isotherm and
several mathematical equations have been developed to express this equilibrium
relationship (1). These equations are used in forecast models to determinate the shelf
life of moisture depending products (2). All these models assume that the relative
humidity of the package headspace (which change with the entrance of water vapour
from the outside) is immediately in equilibrium with the product (3). This assumption
has not yet been verified experimentally and cannot be valid for all the products and the
packages.
The aim of the present work was to study if different quantities of product, different
headspace volumes, and different packaging solutions may influence the equilibrium
between the relative humidity of the headspace and of the product.
MATERIALS AND METHODS: An acquisition system composed by humidity sensors
and a specific acquisition software to record simultaneously different moisture and
temperatures values has been built in collaboration with RDE Company srl. Rigid trays
(Sirap Gema) with capacity of 1400 and 1030 cm3 sealed with a OPP 20 mm film
(Moplefan) have been used as a model package system. The water vapor transmission
rate (WVTR) of the complete package has been determined, by means of a gravimetric
method, as equal to 1.52±0.02 g pack-1 24h-1 (38°C and 98% ΔRH).
Fetta biscottata (a typical Italian bakery product, with a water activity of 0.22 and a
moisture content of 3.71±0.27 g/100g) has been packed inside the trays in different
quantities, at room air. The experiments were repeated at least two times for each
sample.
Humidity sensors have been placed inside the product and in the headspace, in order to
record the relative humidity in different points of the package.
The packages were submitted to an accelerated storage test in a thermostatic cell at
38±0.5°C and 98% RH.
Different quantities of the dry product (fetta biscottata) have been packaged in the two
type of trays, obtaining the combinations summarized in table 1.
RESULTS AND CONCLUSIONS

SLIM 2010 - 4th Shelf life International Meeting - Centro Politécnico Superior deIngenieros, University of Zaragoza (Spain), June, 23-25, 2010
During the accelerated storage the moisture adsorption by fetta biscottata and the
moisture increase in the headspace of the packages have been measured and recorded
every 30 minutes for each combination. In figure 1 the relative humidity change for
sample 1 is shown. The “Headspace” curve represents the moisture diffusion in the
headspace, while the “Product” curve represents the moisture adsorption by fetta
biscottata. For all the samples the difference between the curves can be considered
constant in the RH range from 0 to 65% and shows the delay of the product in absorbing
the moisture. Experiments conducted until 95% RH demonstrated that the two curves
joint after a quite long time (data not shown).
To analyze the effect of the different packaging combinations, the ratio between the
headspace volume and the product weight was related to the difference (in average)
between the headspace and the product RH values. Data in table 1 show that the higher
the ratios, the bigger the differences.
In figure 2 the differences in RH values are plotted versus the volume/weight ratio,
showing a clear trend and an increasing uncertainty in the measures.
From our data, obtained combining different weights of fetta biscottata and different
headspace volumes, it can be concluded that the relative humidity of the headspace of
the packaging (which changes for the water vapour permeability) is not immediately in
equilibrium with the product. The theoretical assumption generally used in the shelf life
modeling has not been verified for this product and, in future works, it will be studied
how these differences influence the shelf life prediction for fetta biscottata and for other
moisture depending products and different packages.
ACKNOWLEDGMENTS
To RDE Company srl (Cormano, Milano, Italy) for the support and the hardware and
software knowledge.
REFERENCES
1. Lee D.S., Yam K.L. and Piergiovanni L. 2008. Shelf life of packaged food products,
Chp. 16 In “Food Packaging, Science and Technology”. CRC Press. Boca Raton,
Florida, USA.
2. Labuza T.P. and Schmidl M.K. 1985. Accelerated Shelf Life Testing of Foods. Food
Technology. 39(9):57.

SLIM 2010 - 4th Shelf life International Meeting - Centro Politécnico Superior deIngenieros, University of Zaragoza (Spain), June, 23-25, 2010
3. Fava P., Limbo S. and Piergiovanni L. 2000. La previsione della shelf life di
prodotti alimentari sensibili agli scambi di umidità. Industrie Alimentari. 39(2):121.
Figure 1: moisture change in sample 1
Figure 2: relationship between headspace volume and Δ% RH
Table 1: packaging combinations and RH differences among packaging solutions.
Sample
number
Number of fetta
biscottata
Product
weight [g]
Product volume
[cm3]
Tray volume
[cm3]
Headspace
volume [cm3]
Headspace
volume/Product
weight [cm3 g-1]
Δ% RH
1 4 32.48 182.8 1030 847.2 26.1 4.5±0.7
2 4 32.48 182.8 1400 1217.2 37.5 5.6±0.8
3 6 48.72 274.2 1030 755.8 15.5 2.7±0.7
4 6 48.72 274.2 1400 1125.8 23.1 4.2±0.9
5 8 64.96 365.6 1030 664.4 10.2 1.4±0.4
6 8 64.96 365.6 1400 1034.4 15.9 2.7±0.4
7 12 97.44 548.4 1400 851.6 8.7 1.2±0.2
15th Workshop on the Developments in the Italian PhD Research on Food Science Technology andBiotechnology, University of Naples – Federico II, Portici, 15-17 September, 2010
Innovative approaches and instruments in modelling and monitoring theshelf life of packaged perishable foods
Pietro Lamiani ([email protected])Dept. Food Science and Technology, Università degli Studi di Milano, Via Celoria 2- 20133 Milano, Italy
Tutor: Prof. Luciano Piergiovanni
The activities planned for the second year of the PhD thesis project are described. 1) The product was chosen,and its package was characterized. 2) The measurement and acquisition system has been designed, set up, andcalibrated. 3) The chosen product (Fetta biscottata, a typical Italian bakery product) has been characterized interms of water activity (aw), moisture content, and sorption/desorption isotherm. 4) The measurement system hasbeen used to record the moisture changes inside the package and the product. The data obtained have been usedto verify the assumption on which the main moisture depending shelf life prediction models are based.
Approcci e strumenti innovativi nella modellazione e nel controllo della shelf life diprodotti deperibili confezionati
Le attività previste per il secondo anno di dottorato sono di seguito descritte. E’ stato scelto il prodotto e sonostate determinate le caratteristiche dell’imballaggio. Il sistema di misura è stato progettato, costruito e calibrato.Il prodotto selezionato (Fetta biscottata) è stato caratterizzato in termini di attività dell’acqua (aw), contenutoumido e isoterma di assorbimento/desorbimento. In ultimo il sistema di misura è stato usato per rilevare ladiffusione di umidità all’interno della confezione e del prodotto. I dati raccolti sono stati utilizzati per verificarel’assunzione teorica su cui sono basati i modelli di previsione della shelf life per prodotti umidità dipendenti.
Key words: humidity sensors, bakery products , shelf life modelling.
1. Introduction
According to the project previously described (Lamiani, 2009) the following activities were developed:A1) Identification and selection of the product to be used for the experiments.A2) Measurement system assembly and calibration.A3) Characterization of the product by moisture content, aw, and sorption/desorption isotherm construction.A4) Verification and validation of the existing models and development of new models.The fourth activity was previewed overlapped on the second and third year; only the first part with the datacollection was done and reported in the present work.
2. Materials and Methods
The aw of fetta biscottata was measured instrumentally at 38°C; the moisture content determined in a oven at130°C for 1.5 h. Rigid EPS trays with capacity of 1400 and 1030 cm3 sealed with a OPP 20 µm film have beenused as model package systems. The water vapor transmission rate (WVTR) of the package has beendetermined, by a gravimetric method, as equal to 1.52±0.02 g pack-1 24h-1 (38°C and 98% ΔRH).Fetta biscottata have been packed inside the trays in different quantities, using room air. Humidity sensors havebeen placed inside the product and in the headspace, in order to record the relative humidity in different points ofthe package and of the product. The packages were stored in a cell at 38±0.5°C and 98% RH.
3. Results and discussion
Fetta biscottata has been chosen for the regular shape and geometry, and for the uniformity among differentpackages. The acceptable maximum moisture content will be determined with a sensorial test in a following step.The acquisition system composed by humidity sensors and a specific acquisition software to record moisturevalues has been built in collaboration with RDE Company srl. It has been calibrated using saturated saltsolutions at different relative humidity values: 0-11-23-32-44-52-79-92-97-100% (Bell and Labuza, 2000a).The moisture content, water activity, and the sorption/desorption isotherm have been determined for fettabiscottata. The water activity was equal to 0.249±0.003 and the moisture content to 3.71±0.27 g/100g. Thesorption/desorption isotherm was constructed at relative humidity values of 11-23-32-44-52-66-75-86-92%(Wolf et al, 1985). Different quantities of the dry product (fetta biscottata) have been packaged in the two typeof trays, obtaining the combinations summarized in table 1.During the accelerated storage the moisture adsorption by fetta biscottata and the moisture increase in the

15th Workshop on the Developments in the Italian PhD Research on Food Science Technology andBiotechnology, University of Naples – Federico II, Portici, 15-17 September, 2010
headspace of the packages have been measured and recorded every 30 minutes for each combination. In figure 1the moisture change for sample 1 is shown. The experiments were repeated at least two times for each sample.The “Headspace” curve represents the moisture diffusion in the headspace, while the “Product” curve represents
the moisture adsorption by fetta biscottata. For all the samples the difference between the curves can beconsidered constant in the RH range considered and shows the delay of the products in adsorbing the moisture.Experiments conducted until 95% RH demonstrated that the two curves joint after a quite long time.To analyze the differences among the samples, the ratio between the headspace volume and the product weightwas related to the difference (in average) between the headspace and the product RH values. The data in the lastcolumn of table 1 show that the higher the ratios, the bigger the differences.In figure 2 the differences in RH values are plotted versus the volume/weight ratio, showing a clear trend and anincreasing uncertainty in the measures. This trend is very likely correlated to the composition and to the textureof the product used and must be checked with other moisture sensitive products.From our data, obtained combining different weights of fetta biscottata and different headspace volumes, it canbe concluded that the relative humidity of the headspace of the packaging (which changes for the water vapourpermeability) is not immediately in equilibrium with the product. The theoretical assumption generally used inthe shelf life modeling (Fava et al, 2000) has not been verified for this product and in the third year it will bestudied how these differences influence the shelf life prediction for fetta biscottata and for other moisturedepending products and different packages.
Table 1: packaging combinations and RH differences among packaging solutions.
Samplenumber
Number of fettabiscottata
Productweight [g]
Product volume[cm3]
Tray volume[cm3]
Headspacevolume [cm3]
Headspacevolume/Productweight [cm3 g-1]
Δ% RH
1 4 32.48 182.8 1030 847.2 26.1 4.5±0.7
2 4 32.48 182.8 1400 1217.2 37.5 5.6±0.8
3 6 48.72 274.2 1030 755.8 15.5 2.7±0.7
4 6 48.72 274.2 1400 1125.8 23.1 4.2±0.9
5 8 64.96 365.6 1030 664.4 10.2 1.4±0.4
6 8 64.96 365.6 1400 1034.4 15.9 2.7±0.4
7 12 97.44 548.4 1400 851.6 8.7 1.2±0.2
4. References
Bell LN, Labuza TP (2000) Moisture sorption: practical aspects of sorption isotherm measurement and use. 2nded. St. Paul (USA): American Association of Cereal Chemists, pp. 33-39.
Fava P, Limbo S, Piergiovanni L (2000) La previsione della shelf life di prodotti alimentari sensibili agli scambidi umidità. Industrie Alimentari 39:121-126.
Lamiani P (2009) Innovative approaches and instruments in modeling and monitoring the shelf life of packagedperishable foods. In Proc.s of the 14th Workshop on the Developments in the Italian PhD Research on FoodScience and Technology, Oristano (Italy), 16-18 September, 2009, pp. 411-412.
Wolf W, Speiss WEL, Jung G (1985) Standardization of isotherm measurements (COST-PROJECT 90 and90bis). In Properties of Water in Foods. D. Simatos and J.L. Multon (Eds.) Martinus Nijhoff Publishers;NATO ASI Series E: Applied Science N. 90, Amsterdam (Netherlands): Marins Nijhoff Publ, p. 661.
Figure 1: moisture change in sample 1 Figure 2: relationship between headspace volume and Δ% RH

10° Congresso CISETACongresso Italiano di Scienza e Tecnologia degli Alimenti
Fiera Milano, 9 e 10 maggio 2011
Approcci e strumenti innovativi nellamodellazione e nel controllo della shelf life di
prodotti deperibili confezionati
Pietro Lamiani1, Sara Limbo1, Luciano Piergiovanni1
1 Distam, Università degli Studi di Milano,Via Celoria, 2, 20133 Milano
INTRODUZIONEI modelli di previsione della shelf life sono equazioni matematiche chedescrivono le relazioni che intercorrono tra il prodotto alimentare, laconfezione e l’ambiente esterno. Tali modelli si basano su differenti fattori didegradazione e sono utili per predire la shelf life di un prodotto alimentare, perprogettare gli imballaggi ma anche per fornire utili indicazioni sulle interazioniprodotto-imballaggio. Numerosi fenomeni chimici, biologici e fisici dipendonodal contenuto umido e dall’attività dell’acqua (aw) dei prodotti alimentari. Talifenomeni, durante la distribuzione commerciale, possono essere controllatidalla protezione offerta dall’imballaggio. L’attività dell’acqua è regolata dalcontenuto umido del prodotto, che può aumentare nel tempo per via dellapermeabilità al vapor acqueo della confezione. La relazione di equilibrio tra ilcontenuto umido e l’attività dell’acqua (umidità relativa all’equilibrio) èespressa dall’isoterma di adsorbimento/desorbimento e diverse equazionimatematiche sono state elaborate per descriverla opportunamente (1). Taliequazioni sono utilizzate nei modelli di previsione della shelf life per prodottiumidità-dipendenti (2). Tutti i suddetti modelli si basano sull’assunzioneteorica che l’umidità relativa (UR) dello spazio di testa della confezione, cheaumenta per l’ingresso di vapor d’acqua dall’ambiente circostante, siaimmediatamente in equilibrio con l’umidità relativa del prodotto (3). Questaassunzione non è mai stata verificata sperimentalmente e potrebbe non esserevalida per tutti i prodotti e tutte le soluzioni di confezionamento.
SCOPOScopo del presente lavoro è quello di studiare come differenti quantità diprodotto, differenti spazi di testa e differenti soluzioni di confezionamentopossano influenzare l’equilibrio tra l’umidità relativa del prodotto e quella dellospazio di testa.
MATERIALI E METODIFette biscottate: sono state utilizzate fette biscottate dorate acquistate presso laGDO. Le fette biscottate sono state caratterizzate determinandone l’umiditàrelativa (UR=0.249±0.003), il contenuto umido (M=3.71±0.27g/100g) e

10° Congresso CISETACongresso Italiano di Scienza e Tecnologia degli Alimenti
Fiera Milano, 9 e 10 maggio 2011
l’isoterma di adsorbimento /desorbimento, costruita condizionando il prodottoai seguenti valori di umidità relativa mediante soluzioni saline sature: 11-23-32-44-52-66-75-86-92% (4).Sistema di acquisizione: (Figura 1) il sistema di acquisizione dell’umiditàrelativa è stato ideato e costruito in collaborazione con RDE Company srl ed ècomposto da sensori di umidità collegati ad uno specifico software in grado diregistrare i segnali acquisiti. Il sistema è stato calibrato a diversi valori diumidità relativa: 0-11-23-32-44-52-79-92-97-100% (5).Film plastico: film trasparente di OPP 20 (polipropilene orientato, spessore 20m) prodotto dalla Moplefan.Vaschette: vaschette in polistirene espanso di capacità 1400 e 1030 cm3
rivestite con un film a barriera totale, prodotte da Sirap Gema.Prove di conservazione simulata: Le prove di conservazione simulata sonostate effettuate in celle termostatate FOC 225 a 38±0.5°C. Sul fondo dellevaschette di polipropilene è stata posizionata acqua demineralizzata, in quantitàdi circa 1 L, in modo da ottenere una umidità relativa interna del 98%.
RISULTATI E DISCUSSIONELe fette biscottate sono state scelte per la forma e la geometria regolare ecostante tra i vari lotti.Differenti quantità di prodotto sono state confezionate nelle due diversetipologie di vaschette, ottenendo le combinazioni riportate in tabella 1.Durante la conservazione in condizioni accelerate, per ciascuna combinazione,è stato misurato e registrato ogni 30 minuti l’assorbimento di umidità da partedelle fette biscottate e l’incremento di umidità nello spazio di testa. In figura 2è visibile l’andamento dell’umidità nel tempo per il campione 1. Le prove sonostate ripetute almeno due volte per ciascun campione.La curva “Spazio di testa” rappresenta la diffusione dell’umidità nello spaziodi testa, mente la curva “Prodotto” rappresenta l’assorbimento da parte dellefette biscottate. Per tutti i campioni la differenza tra le due curve può essereritenuta costante nell’intervallo di umidità considerato e mostra il ritardo concui il prodotto assorbe l’umidità rispetto allo spazio di testa. Prove condottefino a valori di UR pari al 95% dimostrano che le due curve tendono acoincidere solo dopo un considerevole lasso di tempo.Per analizzare le differenze tra i campioni è stato calcolato il rapporto tra ilvolume dello spazio di testa ed il peso del campione. Tale rapporto è poi statomesso in relazione alla differenza (in media) tra i valori di umidità relativadello spazio di testa e del prodotto. La tabella 1 mostra come all’aumentare delrapporto aumenta anche la differenza di umidità relativa.Questo fenomeno è spiegato dalla resistenza dello “stagnant air layer“ (6)all’interno della confezione, che ostacola la diffusione dell’umidità.

10° Congresso CISETACongresso Italiano di Scienza e Tecnologia degli Alimenti
Fiera Milano, 9 e 10 maggio 2011
In figura 3 sono rappresentate le differenze di umidità relativa correlate alrapporto volume/peso. Il grafico mostra un andamento crescente ed unincremento dell’incertezza nelle misure. Ciò è verosimilmente correlato allacomposizione ed alla struttura del prodotto utilizzato e dovrà essere verificatoutilizzando altri prodotti sensibili all’umidità.Dai dati ottenuti combinando differenti quantità di fette biscottate e differentivolumi di spazio di testa, è possibile concludere che l’umidità relativa dellospazio di testa (che aumenta per via della permeabilità della confezione) non èimmediatamente in equilibrio con quella del prodotto. L’assunzione teoricautilizzata nei modelli di previsione della shelf life umidità-dipendenti non èverificata per questo tipo di prodotti. In lavori successivi verrà studiato comequeste differenze influiscano sulla previsione di shelf life per le fette biscottatee per altri prodotti sensibili agli scambi di umidità.
RINGRAZIAMENTIA RDE Company srl (Cormano, Milano, Italy) per il supporto e per lo sviluppodell’hardware e del software.
BIBLIOGRAFIA1. Lee DS, Yam KL, Piergiovanni L (2008) Shelf life of packaged food products, Chp.
16 in “Food Packaging, Science and Technology”. CRC Press. Boca Raton, Florida,USA
2. Labuza TP, Schmidl MK (1985) Accelerated Shelf Life Testing of Foods. FoodTechnology. 39(9):57
3. Fava P, Limbo S, Piergiovanni L (2000) La previsione della shelf life di prodottialimentari sensibili agli scambi di umidità. Industrie Alimentari. 39(2):121
4. Wolf W, Speiss WEL, Jung G (1985) Standardization of isotherm measurements(COST-PROJECT 90 and 90bis). In Properties of Water in Foods. D. Simatos and J.L.Multon (Eds.) Martinus Nijhoff Publishers; NATO ASI Series E: Applied Science N.90, Amsterdam (Netherlands): Marins Nijhoff Publ. pp.661
5. Bell LN, Labuza TP (2000) Moisture sorption: practical aspects of sorption isothermmeasurement and use. 2nd ed. St. Paul (USA): American Association of CerealChemists. pp.33-39
6. Gennadios A, Weller CL, Gooding CH (1994) Measurement Errors in Water VaporPermeability of Highly Permeable, Hydrophilic Edible Films. Journal of FoodEngineering 21(4):395

10° Congresso CISETACongresso Italiano di Scienza e Tecnologia degli Alimenti
Fiera Milano, 9 e 10 maggio 2011
Figura 1: schema del sistema di acquisizione
Figura 2: assorbimento umidità nel campione 1
Figura 3: correlazione tra lo spazio di testa e ΔUR%

10° Congresso CISETACongresso Italiano di Scienza e Tecnologia degli Alimenti
Fiera Milano, 9 e 10 maggio 2011
Numerocampione
Numero difette
biscottate
Pesoprodotto
[g]
Volumeprodotto
[cm3]
Volumevaschetta
[cm3]
Volumespazio di testa
[cm3]
Volume prodotto /Pesoprodotto [cm3 g-1]
Δ% RU
1 4 32.48 182.8 1030 847.2 26.1 4.5±0.7
2 4 32.48 182.8 1400 1217.2 37.5 5.6±0.8
3 6 48.72 274.2 1030 755.8 15.5 2.7±0.7
4 6 48.72 274.2 1400 1125.8 23.1 4.2±0.9
5 8 64.96 365.6 1030 664.,4 10.2 1.4±0.4
6 8 64.96 365.,6 1400 1034.4 15.9 2.7±0.4
7 12 97.44 548.4 1400 851.6 8.7 1.2±0.2
Tabella 1: combinazioni di confezionamento
Approcci e strumenti innovativi nella modellazione e nel controllo dellashelf life di prodotti deperibili confezionati.
I modelli di previsione della shelf life sono equazioni matematiche chedescrivono le relazioni che intercorrono tra il prodotto alimentare,l’imballaggio e l’ambiente. Numerosi fenomeni chimici, biologici e fisicidipendono dall’umidità relativa dei prodotti alimentari. L’umidità relativa è asua volta strettamente correlata al contenuto umido del prodotto e può variarenel tempo per via della permeabilità della confezione.I modelli di previsione umidità-dipendenti si basano sull’assunzione teorica chel’umidità relativa dello spazio di testa sia immediatamente in equilibrio conquella del prodotto.Scopo del presente lavoro è verificare le assunzione teoriche alla base deimodelli di previsione della shelf life umidità-dipendenti, studiando comedifferenti quantità di prodotto, differenti spazi di testa e differenti soluzioni diimballaggio possano influire sull’equilibrio tra l’umidità relativa dello spazio ditesta e quella del prodotto.I risultati ottenuti mostrano come, nel caso del sistema modello, l’umiditàrelativa dello spazio di testa non sia immediatamente in equilibrio con quelladel prodotto, negando quindi l’assunzione teorica.
Innovative approaches and instruments in modelling and monitoring theshelf life of packaged perishable foods
Shelf life forecast models for moisture depending products assume that therelative humidity of the package headspace (which changes with the entranceof water vapour from the outside) is immediately in equilibrium with theproduct.In the present research fetta biscottata (a typical Italian bakery product) hasbeen used as a model system to evaluate how different quantities of product,different headspace volumes, and different packaging solutions influence the

10° Congresso CISETACongresso Italiano di Scienza e Tecnologia degli Alimenti
Fiera Milano, 9 e 10 maggio 2011
equilibrium between the relative humidity of the headspace and the relativehumidity of the product.From the data obtained it can be concluded that the relative humidity of theheadspace of the packaging is not immediately in equilibrium with the product.The theoretical assumption generally used in the shelf life modeling has notbeen verified for this type of product.

10° Congresso CISETACongresso Italiano di Scienza e Tecnologia degli Alimenti
Fiera Milano, 9 e 10 maggio 2011
Applicazione di un modello di previsionedella shelf life umidità-dipendende su un
prodotto da forno
Pietro Lamiani1, Hector Suarez Mahecha2, Sara Limbo1, Luciano Piergiovanni1
1 Distam, Università degli Studi di Milano,Via Celoria, 2, 20133 Milano2Universidad Nacional De Colombia, ICTA, Calle 45 #30-03
INTRODUZIONEI modelli di previsione della shelf life sono equazioni matematiche chedescrivono le relazioni che intercorrono tra il prodotto alimentare, laconfezione e l’ambiente esterno. Tali modelli si basano su differenti fattori didegradazione e sono utili per predire la shelf life di un prodotto alimentare, perprogettare gli imballaggi ma anche per fornire utili indicazioni sulle interazioniprodotto-imballaggio. Numerosi fenomeni chimici, biologici e fisici dipendonodal contenuto umido e dall’attività dell’acqua (aw) dei prodotti alimentari. Talifenomeni, durante la distribuzione commerciale, possono essere controllatidalla protezione offerta dall’imballaggio. L’attività dell’acqua è regolata dalcontenuto umido del prodotto, che può aumentare nel tempo per via dellapermeabilità al vapor acqueo della confezione. La relazione di equilibrio tra ilcontenuto umido e l’attività dell’acqua è espressa dall’isoterma diadsorbimento/desorbimento e diverse equazioni matematiche sono stateelaborate per descriverla opportunamente (1). Tali equazioni sono utilizzate neimodelli di previsione della shelf life per prodotti umidità-dipendenti (2).
SCOPOScopo del presente lavoro è applicare un modello di previsione della shelf lifeumidità-dipendente ad una specifica categoria di prodotti da forno caratterizzatidallo stesso processo tecnologico ma da diversa formulazione e verificare comela composizione influisca sulla shelf life del prodotto stesso a parità diconfezione.
MATERIALI E METODIFette biscottate: sono state utilizzate tre diverse tipologie di fette biscottate(Dorate, Cereali, Integrali), tutte prodotte da Mulino Bianco (Barilla),acquistate presso la GDO. Le tre tipologie di fette sono state caratterizzatedeterminandone l’attività dell’acqua, il contenuto umido e le dimensioni, datiriportati in Tabella 1. Per ciascuna tipologia è stata costruita l’isoterma diadsorbimento/desorbimento (3), condizionando il prodotto a differenti valori di

10° Congresso CISETACongresso Italiano di Scienza e Tecnologia degli Alimenti
Fiera Milano, 9 e 10 maggio 2011
umidità relativa mediante soluzioni saline sature ed ottenendo i rispettivi valoridi contenuto umido M (g H2O/g SS) come riportato in Tabella 2 (4).Confezione fette biscottate: le fette biscottate sono venute all’interno di dueparallelepipedi di cartoncino ondulato ricoperti da uno strato di carta. I dueparallelepipedi a loro volta sono contenuti in un film di PP saldato che liavvolge. La permeabilità, o WVTR (Water Vapour Transmission Rate),dell’intero imballaggio è stata determinata mediante metodo gravimetrico ed èrisultata essere pari a 0.2±0.02 g pack-1 24h-1 (25°C e 90% UR).Software interpolazione: i punti sperimentali ottenuti sono stati interpolati conil software TableCurve 2D v4 della Jandel Scientific Software.Attività dell’acqua: l’attività dell’acqua delle fette biscottate è stata misuratamediante lo strumento Novasina LabMaster aw (Novasina AG, Svizzera)termostatato a 25±0,2°C, posizionando il prodotto nell’apposito alloggiamentoe leggendo il valore all’equilibrio (Tabella 1).Contenuto umido: il contenuto umido delle fette biscottate è stato determinatomisurando la perdita di peso dei campioni dopo 90 minuti di permanenza instufa a 130°C (Tabella 1).Modello previsione della shelf life: il modello di previsione della shelf life èstato implementato mediante un foglio di calcolo di Microsoft Excel.
RISULTATI E DISCUSSIONEI punti sperimentali ottenuti condizionando le fette biscottate (Tabella 2 eFigura 1) sono stati interpolati con le equazioni di Oswin, Smith, Iglesias-Chirife, Henderson e Halsey (1) utilizzando il software Table Curve. Lamiglior equazione interpolante per tutte e tre le tipologie di fette biscottate èrisultata essere l’equazione di Oswin, mostrando per le fette Dorate unR2=0.994 ed un errore percentuale medio E%=4.825, per le Cereali unR2=0.989 ed un E%=5.972 e per le Integrali un R2=0.997 ed un E%=4.618(Tabella 3).L’equazione di Oswin è stata quindi selezionata per descrivere la relazione chelega il contenuto umido e l’attività dell’acqua per le tre tipologie di fettebiscottate ed è stata quindi implementata nel modello di previsione della shelflife. Nel modello di previsione sono stati inoltre inseriti tutti i parametri relativial prodotto (peso, contenuto umido, attività dell’acqua), alla confezione(WVTR) e all’ambiente (Temperatura di 25°C e UR del 90%).Ipotizzando un’umidità relativa limite per le fette biscottate pari al 40%, lashelf life stimata per le fette biscottate Dorate è risultata essere di 71 giorni, perle Cereali di 56 giorni e per le Integrali di 27 giorni.Per ottenere questo risultato si sono dovute costruire tre isoterme e valutare lacapacità interpolante di cinque equazioni. Per provare ad ottimizzare il

10° Congresso CISETACongresso Italiano di Scienza e Tecnologia degli Alimenti
Fiera Milano, 9 e 10 maggio 2011
procedimento si è quindi provato a costruire una sola isoterma diadsorbimento/desorbimento per le tre tipologie di fette biscottate interpolandotutti insieme i punti sperimentali ottenuti mediante le stesse cinque equazioni.La miglior equazione interpolante è risultata essere, anche in questo caso,quella di Oswin mostrando un R2=0.935 ed un E%=19.589 (Tabella 3), valoriche indicano una scarsa capacità interpolante, che infatti è stata evidenziatadalla relativa previsione della shelf life mostrando un errore pari al 18% per lefette Dorate rispetto all’uso di una isoterma singola dedicata, del 44% per leCereali e del 148% per le Integrali, sconsigliandone quindi l’applicazione.Si è quindi provato ad interpolare, mediante l’equazione di Oswin, i puntisperimentali abbbinando le tipologie di fette biscottate a due a due: Dorate-Cereali, Cereali-Integrali, Dorate-Integrali. In Tabella 4 sono visibili gli indicistatistici ottenuti, evidenziando come per le fette Dorate e Cereali sia possibileusare una isoterma unica avendo l’eq. equazione interpolante un R2=0.990 edun E%=5.819 mentre ciò non è possibile per le altre due coppie, poiché gliindici statistici evidenziano una scarsa capacità interpolante.La previsione di shelf life per le fette Dorate e Cereali, utilizzando un’isotermadi adsorbimento unica e comune alle due tipologie, è risultata essererispettivamente di 76 e 51 giorni, mostrando un errore rispetto alla previsioneottenuta con l’isoterma singola dedicata del 7 e 9%, valori ritenuti accettabili.Tale lavoro ha evidenziato come negli studi di modellazione della shelf life sianecessario caratterizzare al meglio i prodotti oggetti di studio ed i relativiimballaggi, la necessità di costruire in maniera accurata l’isoterma diadsorbimento dei prodotti e l’importanza degli indici statistici e della lorocorretta interpretazione. Un tal approccio può consentire di valutare lapossibilità di semplificare il lavoro utilizzando isoterme comuni per tipologie diprodotto simili tra loro e appartenenti alla stessa categoria ma caratterizzati dadiversa formulazione.
BIBLIOGRAFIA1. Lee DS, Yam KL, Piergiovanni L (2008) Shelf life of packaged food products, Chp.
16 in “Food Packaging, Science and Technology”. CRC Press. Boca Raton, Florida,USA
2. Labuza TP, Schmidl MK (1985) Accelerated Shelf Life Testing of Foods. FoodTechnology. 39(9):57
3. Wolf W, Speiss WEL, Jung G (1985) Standardization of isotherm measurements(COST-PROJECT 90 and 90bis). In Properties of Water in Foods. D. Simatos and J.L.Multon (Eds.) Martinus Nijhoff Publishers; NATO ASI Series E: Applied Science N.90, Amsterdam (Netherlands): Marins Nijhoff Publ. pp.661
4. Bell LN, Labuza TP (2000) Moisture sorption: practical aspects of sorption isothermmeasurement and use. 2nd ed. St. Paul (USA): American Association of CerealChemists. pp.33-39

10° Congresso CISETACongresso Italiano di Scienza e Tecnologia degli Alimenti
Fiera Milano, 9 e 10 maggio 2011
Dorate Cereali Integrali
Peso totale[g]
365 345 336
Peso singola fetta[g]
8.12±0.17 10.24±0.39 7.67±0.34
Quantità 40 32 40
Altezza singola fetta[mm]
70.7±0.1 70.9±0.1 70.7±0.1
Larghezza singola fetta[mm]
67.7±0.6 69.8±0.3 68.0±0.1
Spessore singola fetta[mm]
0.9±0.1 11.3±0.3 0.9±0.1
Attività dell’acqua 0.250±0.003 0.307±0.003 0.198 ±0.003
Contenuto umido[g/100g]
3.712±0.271 4.864±0.037 3.2828±0.066
Tabella 1: caratterizzazione fette biscottate.
awM (g H2O/g SS)
DorateM (g H2O/g SS)
CerealiM (g H2O/g SS)
Integrali
0,114 0.0381 0.0441 0.0154
0,241 0.0510 0.0583 0.0317
0,331 0.0603 0.0639 0.0356
0,438 0.0751 0.0773 0.0464
0,529 0.0879 0.0964 0.0662
0,691 0.1281 0.1265 0.0955
0,753 0.1499 0.1477 0.1208
0,841 0.2076 0.2039 0.1773
Tabella 2: valori sperimentali per costruzione isoterma di adsorbimento/desorbimento.

10° Congresso CISETACongresso Italiano di Scienza e Tecnologia degli Alimenti
Fiera Milano, 9 e 10 maggio 2011
Figura 1: punti sperimentali isoterma di adsorbimento/desorbimento.
Dorate Cereali IntegraliDorateCereali
Integrali
OswinR2=0.994E%=4.825
R2=0.989E%=5.972
R2=0.997E%=4.618
R2=0.935E%=19.589
SmithR2=0.989E%=5.248
R2=0.987E%=6.867
R2=0.982E%=11.085
R2=0.927E%=21.606
Igl-ChirifeR2=0.981E%=8.842
R2=0.981E%=7.668
R2=0.985E%=13.160
R2=0.924E%=23.416
HendersonR2=0.971
E%=11.157R2=0.960
E%=10.873R2=0.984
E%=12.931R2=0.914
E%=21.058
HalseyR2=0.838
E%=27.815R2=0.738
E%=31.089R2=0.971
E%=12.276R2=0.821
E%=25.278
Tabella 3: indici statistici interpolazione punti sperimentali.
DorateCereali
CerealiIntegrali
DorateIntegrali
OswinR2=0.990E%=5.819
R2=0.921E%=23.807
R2=0.937E%=18.919
Tabella 4: indici statistici interpolazione punti sperimentali.

10° Congresso CISETACongresso Italiano di Scienza e Tecnologia degli Alimenti
Fiera Milano, 9 e 10 maggio 2011
Applicazione di un modello di previsione della shelf life umidità-dipendente su un prodotto da forno
I modelli di previsione della shelf life sono equazioni matematiche chedescrivono le relazioni che intercorrono tra il prodotto alimentare,l’imballaggio e l’ambiente. Tali modelli si basano su diversi fattori didegradazione e sono utili per predire la shelf life degli alimenti e perottimizzare la progettazione degli imballaggi.Scopo del presente lavoro è applicare un modello di previsione della shelf lifeumidità-dipendente ad una specifica categoria di prodotti da forno caratterizzatidallo stesso processo tecnologico ma da diversa formulazione e verificare comela composizione influisca sulla shelf life del prodotto stesso a parità diconfezione.I dati ottenuti hanno mostrato la necessità di caratterizzare al meglio i prodottioggetti di studio ed i relativi imballaggi, dell’accuratezza nella costruzionedell’isoterma di adsorbimento e l’importanza degli indici statistici e della lorocorretta interpretazione per la valutazione e la semplificazione del lavoro diprevisione della shelf life.
Application of a shelf life moisture depending model to a bakery productShelf life models are mathematical equations which describe the relationshipbetween food, package, and environment. These models are based on differentdegradation factors and are useful to predict the shelf life of food, to designfood packages, and to provide useful insights.Aim of the present work is to apply a shelf life moisture depending model to aspecific category of bakery product to analyze how different formulation mayinfluence the shelf like prediction. The chosen products are characterized bythe same technological process and package, but have a different ingredientformulation.The data obtained showed the importance of the correct characterizationof the products and its packaging, the importance of the accuracy in theconstruction of the adsorption isotherm and the importance of statisticalindexes and their correct use for the shelf life prediction.

16th Workshop on the Developments in the Italian PhD Research on Food Science Technology andBiotechnology, University of Milano e Piacenza, Lodi, 21-23 September, 2011
Innovative approaches and instruments in modelling and monitoring theshelf life of packaged perishable foods
Pietro Lamiani ([email protected])Dept. Food Science and Technology, Università degli Studi di Milano, Via Celoria 2- 20133 Milano, Italy
Tutor: Prof. Luciano Piergiovanni
The aim of this PhD thesis is to verify the theoretical assumption assumed by moisture depending predictionmodels. This assumption states that the relative moisture of the headspace of the packaging (which changes withthe entrance of water vapour from the outside) is immediately in equilibrium with the product.In the present work a model system is used to study how different quantities of product, different headspacevolumes, and different packaging solutions influence the equilibrium between the relative humidity of theheadspace and of the product and how this difference influences the shelf life prediction.
Approcci e strumenti innovativi nella modellazione e nel controllo della shelf life diprodotti deperibili confezionati
Scopo di questa tesi di dottorato è la verifica dell’assunzione teorica alla base dei modelli di previsione dellashelf life per prodotti umidità dipendenti. Tale assunzione afferma che l’umidità relativa dello spazio di testadella confezione (che aumenta con l’ingresso dell’umidità dall’esterno) è immediatamente in equilibrio conl’umidità relativa del prodotto.Nel presente lavoro un sistema modello è stato utilizzato per studiare come differenti quantità di prodotto,differenti spazi di testa e differenti soluzioni di confezionamento possano influenzare l’equilibrio tra l’umiditàrelativa del prodotto e quella dello spazio di testa e come queste differenze incidano sulla previsione della shelflife.
Key words: humidity sensors, bakery products, shelf life modelling.
1. Introduction
According to the PhD thesis project previously described (Lamiani, 2009) this communication reports the mainresults of the following activities that were developed:A3) Characterization of the packaging system and product characteristics determination: dimensions, moisturecontent, water activity and sorption/desorption isotherm construction.A4) Data collection, application of a shelf life moisture depending prediction model and, on the basis of theobtained data, correction of the shelf life prediction model.
2. State of the Art
Shelf life models are mathematical equations which describe the relationship between food, package, andenvironment. Shelf life models are useful to predict the shelf life of food, to design food packages, and toprovide useful insights. The accuracy by which these relationships are measured influences the reliability of themodels. It is also necessary to know the relationships among the variables that play a significant role in definingfood quality.
Moisture depending modelsMany chemical, biological, and physical changes are dependent on moisture content or water activity in foods,whose changes may be dictated by the packaging protection from the environment in the distribution channel.Water activity is ruled by the moisture content in the food, which may change with time through the permeationprocess of water vapor across the packaging film. The equilibrium relationship between moisture content andwater activity is explained by the sorption/desorption isotherm, which is obtained mostly by the experimentsdetermining moisture contents of the food samples equilibrated under different relative humidity conditions.Many attempts were conducted to express the equilibrium relationship by mathematical forms. The most widelyused are the equations of Smith, Halsey, Henderson, Oswin, Inglesias, and Chirife (Lee et al., 2008). Theseequations are used in forecast models to determine the shelf life of moisture depending products. All thesemodels assume that the relative moisture of the headspace of the packaging (which changes with the entrance ofwater vapour from the outside) is immediately in equilibrium with the product. This condition has not yet beenverified experimentally and is based on theoretical considerations (Fava et al, 2000).

16th Workshop on the Developments in the Italian PhD Research on Food Science Technology andBiotechnology, University of Milano e Piacenza, Lodi, 21-23 September, 2011
2. Materials and Methods
Fetta biscottata, a typical italian bakery product, has been chosen because its regular shape and geometry, andthe uniformity among different packages. The acceptable maximum moisture content has been set at a relativehumidity (RH) of 40%.The water activity (aw) of fetta biscottata was measured at 25°C with a Novasina LabMaster aw (Novasina AG,Switzerland); the moisture content (M) determined in an oven at 130°C for 1.5 h.Rigid EPS trays of 1400 and 1030 cm3 capacity, sealed with a OPP 20 µm film, have been used as modelpackage systems. The water vapor transmission rate (WVTR) of the package has been determined, by agravimetric method (25°C and 98% ΔRH), as equal to 0.54±0.03 g pack-1 24h-1 for the 1400 cm3 tray and to0.41±0.02 g pack-1 24h-1 for the 1030 cm3 tray.An acquisition system composed by humidity sensors and a specific acquisition software to record moisturevalues has been assessed in collaboration with RDE Company srl (Lamiani, 2010).Fetta biscottata have been packed inside the trays in different quantities, using room air. Humidity sensors havebeen placed inside the product and in the headspace, in order to record the relative humidity in different points ofthe package and of the product. The packages were stored in a thermostatic cell at 25±0.5°C and 98±0.5% RH.
3. Results and discussion
The moisture content and the water activity have been determined for fetta biscottata. The water activity wasequal to 0.251±0.003 and the moisture content to 3.71±0.27 g/100g.Different quantities of the dry product (fetta biscottata) have been packaged in the two type of trays, obtainingthe combinations summarized in table 1. During the accelerated storage the moisture adsorption by fettabiscottata and the moisture increase in the headspace of the packages have been measured and recorded every 30minutes for each combination. In figure 1 and 2 the moisture changes for sample 2 and 6 is shown. Theexperiments were repeated at least two times for each sample.The “Headspace” curve represents the moisture diffusion in the headspace, while the “Product” curve representsthe moisture adsorption by fetta biscottata. For all the samples the difference between the curves can beconsidered constant in the considered RH range and it shows the delay of the products in adsorbing the moisture.Experiments conducted until 95% RH demonstrated that the two curves joint after a quite long time.To analyze the differences among the samples, the ratio between the headspace volume and the product weightwas related to the difference (in average) between the headspace and the product RH values. Previousexperiments conducted at 38°C demonstrated that the higher the ratios, the bigger the differences (Lamiani,2010). The data showed an increasing trend and an increasing uncertainty in the measures, not allowing todetermine exactly the relationships between the variables considered.New experiments conducted at 25°C gave the results reported in table 1. In figure 3 the differences in RH valuesare plotted versus the volume/weight ratio, showing a linear relationship (in the range considered) between theratio headspace volume/product weight and the headspace and product Δ% RH:
1669.1118.0 product
Headspace
W
VRH (1)
From our data, obtained combining different weights of fetta biscottata and different headspace volumes, it canbe concluded that the relative humidity of the headspace of the packaging (which changes for the water vapourpermeability) is not immediately in equilibrium with the product. The theoretical assumption generally used inthe shelf life modeling (Fava et al, 2000) has not been verified for this product.
Table 1: packaging combinations and RH differences among packaging solutions.
Samplenumber
Number offetta
biscottata
Productweight [g]
Productvolume[cm3]
Tray volume[cm3]
Headspacevolume[cm3]
Headspacevolume/Productweight [cm3 g-1]
Δ% RH
1 4 32.48 182.8 1030 847.2 26.1 4.5±0.6
2 4 32.48 182.8 1400 1217.2 37.5 5.6±1.5
3 6 48.72 274.2 1030 755.8 15.5 2.9±0.5
4 6 48.72 274.2 1400 1125.8 23.1 3.6±0.6
5 8 64.96 365.6 1030 664.4 10.2 2.5±0.3
6 12 97.44 548.4 1400 851.6 8.7 2.2±0.3

16th Workshop on the Developments in the Italian PhD Research on Food Science Technology andBiotechnology, University of Milano e Piacenza, Lodi, 21-23 September, 2011
Figure 1: moisture change in sample 2. Figure 2: moisture change in sample 6
Figure 3: relationship between headspace volume and Δ% RH
The water vapour sorption/desorption isotherm for fetta biscottata was determined according to the static,gravimetric method developed by COST-90 Project (Wolf et al., 1985) and described by Bell and Labuza(2000). Based on the equilibrium moisture content at a given water activity, the sorption/desorption curve at25°C for fetta biscottata was obtained fitting experimental data by the equations (Lee et al., 2008) of Oswin (2),Smith (3), Iglesias-Chirife (4), Henderson (5) and Halsey (6) using the Table Curve 2D software:
b
ww aaaM1
)1( (2)
)1ln( wabaM (3)
ba
aaM
w
w
1(4)
b
w
a
aM
1
1ln
(5)
b
wa
aM
1
ln
(6)
In order to identify the equation that better fitted the experimental data, the correlation coefficient (r2) and themean relative percentage deviation modulus (Ē%), calculated with the formula (7), were considered.
N
i e
pe
M
MM
NE
1
100% (7)
where:

16th Workshop on the Developments in the Italian PhD Research on Food Science Technology andBiotechnology, University of Milano e Piacenza, Lodi, 21-23 September, 2011
N = number of experimental dataMe = moisture content experimental valueMp = moisture content predicted value
The statistical parameters obtained for the different equations are listed in table 2:
Table 2: statistical parameters for the fitted equations.
Equation r2 Ē%
Oswin 0.99 4.83
Smith 0.99 5.25
Iglesias-Chirife 0.98 8.84
Helderson 0.97 11.16
Halsey 0.84 27.82
A Ē% value below 10% indicates a reasonably good fit and values below 5% represent an extremely good fittingfor practical purposes (Lomauro et al., 1985). According to r2 and Ē% values, the best fittings was obtained forthe Oswin equation, as evidenced in table 2. The statistical parameters calculated for the other equations showedthat these equations did not provide a good fitting of the experimental data. Oswin equation was selected tointerpolate the experimental points of the sorption/desorption isotherm.
To evaluate how the difference between the headspace and the product RH values influences the shelf lifeprediction, a shelf life prediction model has been applied to the product and package considered. For these typeof moisture sensitive products the prediction models are based on the the water amount that permeates throughthe packaging film in a time unit. This value is a function of the package characteristics (permeability coefficientof the material KP, thickness l, and area exposed to the mass flux A) and of the driving force (p), according tothe expression:
pAl
KP
dt
dQ OH 2 (8)
In order to solve the differential equation (8), the model was implemented in a spreadsheet (Microsoft OfficeExcel 2007), in which all the variables related to the product (M, aw, weight), the package (Kp, A, l) and thestorage conditions (temperature, aw), were included. The Oswin equation was used in the spreadsheet to turn themoisture content value of the product into the corresponding water activity value. The water activity value isnecessary to calculate the driving force as difference between the outside water activity and the product wateractivity.The values listed in the second column of table 2 report the shelf life predicted for each sample by the predictionmodel.To evaluate the influence of the difference between the relative humidity of the headspace and the relativehumidity of the product on the shelf life prediction the Microsoft Excel spreadsheet model has been modifiedapplying the linear correlation previously described (Equation 1). This correction allowed to consider the lowervalue of relative humidity described by equation 1 and the consequent delay of time to reach the critical moisturecontent, leading to a longer shelf life prediction for all the samples considered. The corrected values of shelf lifeare reported in table 3 in terms of hours and percentage error.The application of equation 1 to the spreadsheet model allowed to correct the shelf life for every value ofheadspace volume/product weight ratio in the range considered during this trial, between 8.7 and 37.5 cm3 g-1.Figure 4 shows how, in the considered range, to the increase of the ratio headspace volume/product weightcorresponds an increase of the percentage error on the shelf life prediction, following a linear relationship. Theincrease of the errors underlines the importance of the correction to the prediction model.
Table 3: shelf life prediction values.
Samplenumber
PredictedSL [h]
Headspacevolume/Productweight [cm3 g-1]
CorrectedSL [h]
SL Error[h]
SL Error[%]
1 85 26.1 106 21 19.8
2 63 37.5 83 20 24.1
3 129 15.5 149 20 13.4
4 94 23.1 112 18 16.1
5 170 10.2 192 22 11.5
6 188 8.7 211 23 10.9

16th Workshop on the Developments in the Italian PhD Research on Food Science Technology andBiotechnology, University of Milano e Piacenza, Lodi, 21-23 September, 2011
Figure 4: relationship between headspace volume and Δ% RH
4. Conclusions and future perspectives
The model system studied in the present work has demonstrated that, in this case, the theoretical assumptiongenerally used in the shelf life modelling, stating the immediate equilibrium between the headspace and theproduct relative moistures, is not verified. These relative moistures are not immediately in equilibrium but showan increasing difference correlated to the increase of the headspace volume/product weight ratio. This correlationhas been studied and it has been described by a linear equation in the considered range.The application of a shelf life prediction model to the studied system has shown that a correction is needed toavoid a underestimation of the shelf life.Further studies on other types of moisture sensitive products will be necessary to confirm the results obtained.The application of this correction will be particularly interesting for the shelf life modelling of moisturedepending products characterized by packaging solution with high headspace volumes.
5. References
Bell LN, Labuza TP (2000) Moisture sorption: practical aspects of sorption isotherm measurement and use. 2nded. St. Paul (USA): American Association of Cereal Chemists, pp. 33-39.
Fava P, Limbo S, Piergiovanni L (2000) La previsione della shelf life di prodotti alimentari sensibili agli scambidi umidità. Industrie Alimentari 39:121-126.
Lamiani P (2009) Innovative approaches and instruments in modeling and monitoring the shelf life of packagedperishable foods. In Proc.s of the 14th Workshop on the Developments in the Italian PhD Research on FoodScience and Technology, Oristano (Italy), 16-18 September, 2009, pp. 411-412.
Lamiani P (2010) Innovative approaches and instruments in modeling and monitoring the shelf life of packagedperishable foods. In Proc.s of the 15th Workshop on the Developments in the Italian PhD Research on FoodScience and Technology, Napoli (Italy), 15-17 September, 2010, pp. 257-258.
Lee DD, Yam KL, and Piergiovanni L (2008) Food Packaging, Science and Technology. CRC Press. BocaRaton, Florida, USA.
Lomauro CJ, Bakshi AS, Labuza TP (1985) Evaluation of food moisture sorption equations; Part II: Milk,coffee, tea, nuts, oilseeds, spices and starchy foods. Lebensm.-Wiss.u.-Technol. 18:118-124.
Wolf W, Speiss WEL, Jung G (1985) Standardization of isotherm measurements (COST-PROJECT 90 and90bis). In Properties of Water in Foods. D. Simatos and J.L. Multon (Eds.) Martinus Nijhoff Publishers;NATO ASI Series E: Applied Science N. 90, Amsterdam (Netherlands): Marins Nijhoff Publ, p. 661.